naval postgraduate school6. author(s) aurel cobianu and konrad madej 5. funding numbers 7....
TRANSCRIPT

NAVAL POSTGRADUATE
SCHOOL
MONTEREY, CALIFORNIA
MBA PROFESSIONAL REPORT
Analysis and Forecasting of Operating and Support costs
for F-16 C/D
By: Aurel Cobianu, and Konrad Madej
June 2006
Advisors: Raymond E. Franck, Marshall R. Engelbeck
Approved for public release; distribution is unlimited.

THIS PAGE INTENTIONALLY LEFT BLANK
i
REPORT DOCUMENTATION PAGE Form Approved OMB No. 0704-0188 Public reporting burden for this collection of information is estimated to average 1 hour per response, including the time for reviewing instruction, searching existing data sources, gathering and maintaining the data needed, and completing and reviewing the collection of information. Send comments regarding this burden estimate or any other aspect of this collection of information, including suggestions for reducing this burden, to Washington headquarters Services, Directorate for Information Operations and Reports, 1215 Jefferson Davis Highway, Suite 1204, Arlington, VA 22202-4302, and to the Office of Management and Budget, Paperwork Reduction Project (0704-0188) Washington DC 20503. 1. AGENCY USE ONLY (Leave blank)
2. REPORT DATE June 2006
3. REPORT TYPE AND DATES COVERED MBA Professional Report
4. TITLE AND SUBTITLE: Analysis and Forecasting of Operating and Support Costs for F-16 C/D 6. AUTHOR(S) Aurel Cobianu and Konrad Madej
5. FUNDING NUMBERS
7. PERFORMING ORGANIZATION NAME(S) AND ADDRESS(ES) Naval Postgraduate School Monterey, CA 93943-5000
8. PERFORMING ORGANIZATION REPORT NUMBER
9. SPONSORING / MONITORING AGENCY NAME(S) AND ADDRESS(ES) N/A
10. SPONSORING / MONITORING AGENCY REPORT NUMBER
11. SUPPLEMENTARY NOTES The views expressed in this report are those of the author(s) and do not reflect the official policy or position of the Department of Defense or the U.S. Government. 12a. DISTRIBUTION / AVAILABILITY STATEMENT Approved for public released; distribution is unlimited
12b. DISTRIBUTION CODE
13. ABSTRACT (maximum 200 words)
The purpose of this MBA professional report is to examine and present an extended overview of the Total Life Cycle System Management (TLCSM) from the standpoint of USAF and other DoD organizations, and to make available a guide for implementing this concept. The report infers that TLCSM should be the foundation for effective management of complex weapon system such as a multi-role fighter aircraft.
The primary objective was to understand the methodological specifics of estimating Operating and Support (O&S) costs for the F-16 fighter aircraft. To facilitate this, the report identifies and analyzes the top cost drivers over the F-16C/D lifecycle. The cost drivers are a major consideration in identifying Reduction of Total Ownership Costs (R-TOC) opportunities. This research also explores forecasting techniques to estimate the Cost per Flying Hour (CPFH). Holt’s method appears to have promise as an estimator of future CPFHs.
Finally, this report concludes that TOC should be a priority consideration when acquiring a multi-role fighter aircraft such as F-16 and recommends that the Polish Air Force (recent F-16 user) and the Romanian Air Force (potential future user) should establish databases to record O&S costs and should implement R-TOC best practices.
15. NUMBER OF PAGES
169
14. SUBJECT TERMS Total Life Cycle System Management (TLCSM), Operating and Support (O&S) Costs, Reduction of Total Ownership Costs (R-TOC), Cost per Flying Hour (CPFH)
16. PRICE CODE
17. SECURITY CLASSIFICATION OF REPORT
Unclassified
18. SECURITY CLASSIFICATION OF THIS PAGE
Unclassified
19. SECURITY CLASSIFICATION OF ABSTRACT
Unclassified
20. LIMITATION OF ABSTRACT
UL

ii
THIS PAGE INTENTIONALLY LEFT BLANK

iii
Approved for public release; distribution is unlimited
ANALYSIS AND FORECASTING OF OPERATING AND SUPPORT COSTS FOR F-16 C/D
Aurel Cobianu, Major, Romanian Air Force
Konrad Madej, Captain, Polish Air Force
Submitted in partial fulfillment of the requirements for the degree of
MASTER OF BUSINESS ADMINISTRATION
from the
NAVAL POSTGRADUATE SCHOOL June 2006
Authors: _____________________________________
Aurel Cobianu _____________________________________
Konrad Madej Approved by: _____________________________________
Raymond E. Franck, Lead Advisor _____________________________________ Marshall R. Engelbeck, Support Advisor _____________________________________ Robert N. Beck, Dean
Graduate School of Business and Public Policy

iv
THIS PAGE INTENTIONALLY LEFT BLANK

v
ANALYSIS AND FORECASTING OF OPERATING AND SUPPORT COSTS FOR F-16 C/D
ABSTRACT
The purpose of this MBA professional report is to examine and present an
extended overview of the Total Life Cycle System Management (TLCSM) from the
standpoint of USAF and other DoD organizations, and to make available a guide for
implementing this concept. The report infers that TLCSM should be the foundation for
effective management of complex weapon systems such as a multi-role fighter aircraft.
The primary objective was to understand the methodological specifics of
estimating Operating and Support (O&S) costs for the F-16 fighter aircraft. To facilitate
this, the report identifies and analyzes the top cost drivers over the F-16C/D lifecycle.
The cost drivers are a major consideration in identifying Reduction of Total Ownership
Costs (R-TOC) opportunities. This research also explores forecasting techniques to
estimate the Cost Per Flying Hour (CPFH). Holt’s method appears to have promise as an
estimator of future CPFHs.
Finally, this report concludes that TOC should be a priority consideration when
acquiring a multi-role fighter aircraft such as F-16, and recommends that the Polish Air
Force (recent F-16 user) and the Romanian Air Force (potential future user) should
establish databases to record O&S costs and should implement R-TOC best practices.

vi
THIS PAGE INTENTIONALLY LEFT BLANK

vii
TABLE OF CONTENTS
I. INTRODUCTION........................................................................................................1 A. PROBLEM DESCRIPTION...........................................................................1 B. SCOPE ..............................................................................................................2 C. RESEARCH QUESTIONS.............................................................................2 D. REPORT ORGANIZATION..........................................................................3 E. METHODOLOGY ..........................................................................................3
II. LOCKHEED MARTIN F-16 MULTI-ROLE AIRCRAFT.....................................5 A. F-16 FIGHTING FALCON - BRIEF HISTORY AND MAIN
CHARACTERISTICS.....................................................................................5 1. History...................................................................................................5 2. Design....................................................................................................6 3. F-16 Versions and Customers .............................................................8 4. Specifications ........................................................................................9
a. Structure ....................................................................................9 b. Power Plant .............................................................................11 c. Avionics ...................................................................................12 d. Armament ................................................................................15
5. Summary.............................................................................................17 B. ACQUISITION OF F-16 C/D BLOCK 50/52+ BY POLISH AIR
FORCE............................................................................................................18 1. Polish Decision....................................................................................18 2. Evaluation Standards and Requirements for the Multi-Role
Aircraft Proposals..............................................................................19 3. Offset Program...................................................................................21
C. ROMANIA – POTENTIAL F-16 CUSTOMER .........................................27
III. DOD’S APPROACH TO WEAPON SYSTEM MANAGEMENT.......................33 A. PROCESS OF ACQUISITION BASED ON THE DOD SYSTEM
LIFE-CYCLE PHASES ................................................................................34 1. Pre-Acquisition...................................................................................37
a. Concept Refinement Phase and Milestone A.........................37 b. Technology Development Phase.............................................38
2. Systems Acquisition ...........................................................................39 a. Milestone B and System Development and Demonstration
Phase........................................................................................39 b. Milestone C and Production and Deployment Phase ............42
3. Operation and Support (O&S): Sustainment and Disposal...........44 a. Sustainment.............................................................................44 b. Disposal ...................................................................................45
B. TOTAL LIFE CYCLE SYSTEM MANAGEMENT (TLCSM)................45 1. System Engineering (SE)...................................................................46

viii
a. Supportability Analysis ...........................................................48 b. Reliability, Maintainability, and Availability (R,M&A) ........50 c. Achieving Affordable System Operational Effectiveness
(SOE) .......................................................................................52 2. Performance Based Logistics (PBL).................................................53
C. CONCLUSION ..............................................................................................56
IV. OPERATING AND SUPPORT (O&S) COSTS......................................................57 A. LIFE-CYCLE COST / TOTAL OWNERSHIP COST ..............................57
1. Life Cycle Cost Analysis (LCCA).....................................................60 a. Cost Breakdown Structure......................................................60
2. Estimating Methods of Costs ............................................................63 a. Parametric Method .................................................................64 b. Engineering Build-Up Approach ...........................................64 c. Analogy Method ......................................................................65
3. Developing Cost Estimating Relationships (CER’s).......................66 B. OPERATING & SUPPORT (O&S) COSTS...............................................69
1. O&S Cost Breakdown Structure......................................................70 2. O&S Cost Drivers ..............................................................................72
a. System Technical Characteristics...........................................73 b. Operating Concept ..................................................................73 c. Maintenance Concept .............................................................74 d. Relevant Cost Elements ..........................................................75
3. O&S Cost Estimating ........................................................................76 C. APPROACHES TO REDUCTION OF TOC: CAIV AND R-TOC .........77
1. Cost as an Independent Variable (CAIV)........................................78 2. Reduction of Total Ownership Cost (R-TOC) ................................79
D. CONCLUSION ..............................................................................................81
V. ANALYSIS AND FORECASTING OF OPERATING AND SUPPORT COST FOR F-16 C/D.................................................................................................83 A. AFTOC DATABASE.....................................................................................83 B. O&S COSTS ANALYSIS .............................................................................84
1. Level 1 CAIG Data - Empirical O&S Breakout .............................88 2. Cost per Flying Hour (CPFH) ..........................................................91
a. CPFH Recorded in AFTOC ...................................................91 b. Forecasting CPFH..................................................................93 c. Time-Series Forecasting Methods of CPFH..........................94
C. R-TOC PRACTICES FOR F-16 PROGRAM ............................................97
VI. CONCLUSIONS AND RECOMMENDATIONS.................................................101
APPENDIX A. OFFSET MULTIPLIERS FOR DIRECT OFFSET COMMITMENTS IN THE REPUBLIC OF POLAND.......................................103
APPENDIX B. OFFSET MULTIPLIERS FOR INDIRECT OFFSET COMMITMENTS IN THE REPUBLIC OF POLAND.......................................105

ix
APPENDIX C. OFFSET MULTIPLIERS USED IN CASES SPECIALLY JUSTIFIED BY THE ECONOMY OR DUE TO THE SECURITY AND DEFENSE OF THE STATE IN THE REPUBLIC OF POLAND......................107
APPENDIX D. OFFSET COMMITMENTS LIST INCLUDED IN MASTER OFFSET AGREEMENT.........................................................................................109
APPENDIX E. THE LIST OF LOCKHEED MARTIN’S OFFSET ....................113
APPENDIX F. LIST OF OFFSET AGREEMENTS IN POLAND AS OF 1 MARCH 2006...........................................................................................................115
APPENDIX G. AOA PLAN...............................................................................................117
APPENDIX H. SUPPORTABILITY ANALYSIS...........................................................119
APPENDIX I. AIRCRAFT OPERATING AND SUPPORT COST ELEMENT STRUCTURE...........................................................................................................121
APPENDIX J. TIME-SERIES FORECASTING TECHNIQUES AND MEASURES OF ERROR...............................................................................................................131 A. TIME-SERIES FORECASTING TECHNIQUES ...................................131
1. The Three-Year Moving Average (MA3) ......................................131 2. Single Exponential Smoothing (SES) .............................................131 3. Holt’s Method...................................................................................132
B. MEASURES OF ERROR ...........................................................................132
APPENDIX K. RESULTS OF FORECASTING METHODS .......................................135 A. THREE YEAR MOVING AVERAGE (NOMINAL DOLLARS) ..........135 B. SES METHOD F-16C/D (NOMINAL DOLLARS)..................................136 C. HOLT’S METHOD F-16C/D (NOMINAL DOLLARS)..........................137 D. THREE YEAR MOVING AVERAGE (FY05 DOLLARS) ....................138
LIST OF REFERENCES....................................................................................................139
INITIAL DISTRIBUTION LIST .......................................................................................145

x
THIS PAGE INTENTIONALLY LEFT BLANK

xi
LIST OF FIGURES Figure 1. An F-16 Fighting Falcon Flies a Mission in the Skies near Iraq (From: .Air
Force Link, U.S. Air Force photo by Staff Sgt. Cherie A. Thurlby, http://www.af.mil/library/raptor/photos.asp?galleryID=3&page=2).................6
Figure 2. Comparison of Annual O&S Costs of One USAF Squadron (From: Douglas Richardson, Modern Fighting Aircraft - F-16). ................................10
Figure 3. F-16C/D Block 50/52+ Cockpit (From: Defense Update International Online Defense Magazine, “Advanced F-16 Block 50/52/60,” http://www.defense-update.com/features/du-1-04/feature-advanced-f-16.htm). ............................................................................................................13
Figure 4. Evaluation Standards and Requirements Structure (From: Zdzislaw Wydra, “Zwyciężyl F-16,” [in Polish] Wiraże, no. 2, (2003)).........................20
Figure 5. Offset Procedure in the Republic of Poland ....................................................22 Figure 6. Total Offset Value Depends on Applied Multipliers. In the two cases (U.S.
and U.K.-Sweden) total offset value was larger than contract value. (From: Zdzislaw Wydra,” F-16 Oferta Offsetowa,” [in Polish] Wiraże, no. 3 (2003))...........................................................................................................24
Figure 7. Offset Commitment in Poland as of March 1, 2006 (From: Republic of Poland, Ministry of Economy, “List of Offset Agreements in Poland (as of January 1, 2005)” [in Polish])..........................................................................26
Figure 8. The New 5000 Model of the DoD Systems Acquisition Process (From: DoD Template for Application of TLCSM and PBL in the Weapon System Life Cycle, http://www.acq.osd.mil/log/lpp/tlcm/TLCSMGuidanceTemplate.pdf)...........36
Figure 9. Integration of Acquisition, T&E and Requirements Events Prior to Milestone A (From: USAF, “Air Force Instruction 63-101,” (2005)) ............37
Figure 10. Integration of Acquisition, T&E, and Requirement Events Prior to Milestone B (From: USAF, “Air Force Instruction 63-101,” (2005)) ............39
Figure 11. Integration of Acquisition, T&E, and Requirements Events Prior to Milestone C (From: USAF, “Air Force Instruction 63-101,” (2005)) ............40
Figure 12. Elements of the System Development and Demonstration Phase (SDD)........42 Figure 13. Conceptual Framework for the Total Life Cycle System Management
(From: Defense Acquisition University, “Defense Acquisition Guidebook” (2004) para. 5.5.1.)...........................................................................................47
Figure 14. The System Engineering Process (From: Defense Systems Management College, “Acquisition Logistic Guide,” 3rd ed., 1997).....................................48
Figure 15. Affordable System Operational Effectiveness (From: DAU, “Defense Acquisition Guidebook” (2004) paragraph 5.2.2). ..........................................53
Figure 16. Spectrum of PBL Strategies. (From: Acquisition Community Connection, PBL Toolkit – Allocate Work, https://acc.dau.mil/simplify/ev_en.php?ID=29846_201&ID2=DO_TOPIC)....55

xii
Figure 17. Program Life Cycle (Illustrative) (From: Office of the Secretary of Defense, Cost Analysis Improvement Group, “Operating and Support Cost-Estimating Guide” (May 1992))..............................................................58
Figure 18. Total Visibility Cost (From: Blanchard, Logistic Engineering and Management, 81). ............................................................................................60
Figure 19. Nominal Life-Cycle Cost of Typical 1980 DoD Acquisition Program (From: United States General Accounting Office, “Air Force Operating and Support Cost Reductions Need Higher Priority,” (August 2000))............71
Figure 20. O&S Cost Breakdown Structure......................................................................72 Figure 21. Maintenance Concept (After: Blanchard, Logistic Engineering and
Management, 145). ..........................................................................................75 Figure 22. FY04 Obligations: F-16C/D ............................................................................85 Figure 23. F-16C/D FY04 O&M Costs.............................................................................86 Figure 24. F-16C/D DLR Cost Curve ...............................................................................87 Figure 25. F-16C/D Top Twenty-Five DLR Cost Drivers................................................88 Figure 26. FY04, F-16C/D Level 1 CAIG Data................................................................89 Figure 27. F-16 C/D O&S Costs. ......................................................................................90 Figure 28. Actual/Budgeted Cost Per Flying Hour: F-16C/D...........................................92 Figure 29. Actual/Budgeted and Forecasted Cost Per Flying Hour: F-16C/D (in 2005
dollars) .............................................................................................................96

xiii
LIST OF TABLES Table 1. Percentage of Life-Cycle Costs Incurred in Various Program Phases ............59 Table 2. FY04 Obligations: F-16C/D ............................................................................85 Table 3. F-16C/D FY04 O&M Costs.............................................................................86 Table 4. FY04, F-16C/D Level 1 CAIG Data................................................................88 Table 5. F-16C Evaluation Measures (Nominal Data) ..................................................94 Table 6. F-16D Evaluation Measures (Nominal Data) ..................................................95 Table 7. Inflation Conversion Factors............................................................................96 Table 8. F-16C Evaluation Measures (Adjusted Data for Inflation)..............................97 Table 9. F-16D Evaluation Measures (Adjusted Data for Inflation) .............................97

xiv
THIS PAGE INTENTIONALLY LEFT BLANK

xv
LIST OF ACRONYMS AFROCC - Air Force Requirements for Operational Capabilities Council
AFTOC - Air Force Total Ownership Cost
AG - Aerodynamic Center
AMRAAM - Advanced Medium Range Air to Air Missile
ANG - Air National Guard
AoA - Analysis of Alternatives
BVR - Beyond Visual Range
CAIV - Cost As an Independent Variable
CBS - Cost Breakdown Structure
CCE/ECP - Contract and Engineering Change Proposals
CCIP - Common Configuration Implementation Program
CDD - Capability Development Document
CER - Cost Estimating Relationship
CG - Center of Gravity
CLTS - Combined Life Time Support
COA - Course of Action
COARS - Command On-line Accounting & Reporting System
CPD - Capability Production Document
CPFH - Cost Per Flight Hour
CRIPT - Cost Reduction Integrated Product Team
DAB - Defense Acquisition Board

xvi
DAU - Defense Acquisition University
DLR - Depot Level Reparable
DMS - Diminishing Manufacturing Sources
DoD - Department of Defense
DoDD 5000.1 - Department of Defense Directive 5000.1
DoDI 5000.2 - Department of Defense Instruction 5000.2
DRR - Design Readiness Review
DSMC - Defense Systems Management College
DTC - Design-To-Cost
EA - Evolutionary Acquisition
FAA - Federal Aviation Administration
FOC - Full Operational Capability
FOT&E - Follow-on Operational Test and Evaluation
FRP - Full Rate Production
GAFS - General Accounting & Finance System
GAO - United States General Accounting Office
GPS - Global Positioning System
HIS - Human System Integration
HMCS - Helmet-Mounted Cueing System
HQ - Headquarter
HSD - Horizontal Situation Display
HUD - Head-Up Display
ICD - Initial Capabilities Document

xvii
IFF - Identification Friend or Foe
IOC - Initial Operational Capability
IOT&E - Initial Operational Test and Evaluation
IPT - Integrated Process Teams
ISP - Information Support Plan
ITT - Integrated Test Team
JCIDS - Joint Capabilities Integration and Development Systems
JDAM - Joint Direct Attack Munition
JORC - Join Requirements Oversight Council
KPP - Key Performance Parameter
LCCA - Life-Cycle Cost Analysis
LCL - Life-Cycle Logistics
LCMP - Life Cycle Management Plan
LMI - Logistic Management Institute
LRIP - Low Rate Initial Production
LSBF - Least Squares Best Fit
MA - Maintenance Action
MA - Moving Average
MAE - Mean Absolute Error
MAPE - Mean Absolute Percentage Error
MC&ER - Main Characteristics and Engineering Specifications
MDA - Milestone Decision Authority
MDAP - Major Defense Acquisition Program

xviii
ME - Mean Error
MLDT - Mean Logistics Down Time
MLU - Mid Life Upgrade
MMT - Mean Maintenance Time
MPE - Mean Percentage Error
MTBF - Mean Time Between Failure
MTTR - Mean-Time-to-Recovery
NATO - North Atlantic Treaty Organization
O&M - Operation and Maintenance
O&S - Operating and Support
OA - Operational Assessment
OBOGS - On-Board Oxygen Generating System
OH - Operating Hour
OO-ALC - Ogden Air Logistics Center
OSD - Office of Secretary of Defense
OSMIS - Operating and Support Management Information System
OT&E - Operational Test and Evaluation
P&D - Production and Deployment
PBL - Performance Base Logistics
PEISC - Parametric Estimating Initiative Steering Committee
PGM - Precision Guided Munition
PM - Program Manager
PMD - Program Management Directive

xix
PoAF - Polish Air Forces
PPBE - Planning, Programming, Budgeting and Execution
PRF - Pulse Repetition Frequency
PSP - Programmable Single Processor
REMIS - Reliability and Maintainability Information System
RLGINS - Ring Laser Gyro Inertial Navigation System
RoAF - Romanian Air Forces
RSR - Requirement Strategy Review
R-TOC - Reduction of Total Ownership Cost
RWR - Radar Warning Receiver
SAR - Synthetic Aperture Radar
SCEA - Society of Cost Estimating and Analysis
SCM - Supply Chain Manager
SDD - System Demonstration and Development
SE - System Engineering
SES - Single Exponential Smoothing
SOE - System Operational Effectiveness
SPO - System Program Office
TDS - Technology Development Strategy
TLCSM - Total Life Cycle System Management
TOC - Total Ownership Cost
USAF - United States Air Force
USD - United States Dollars

xx
VAMOSC - Visibility and Management of Support Costs
WBS - Work Breakdown Structure

xxi
ACKNOWLEDGMENTS
First and foremost, we would like to express our gratitude to our lead advisor,
Professor Raymond Franck for his guidance, patience, and time that he gave us during the
preparation of this MBA Professional Report. We would also like to thank Professor
Marshall Engelbeck for his valuable assistance and helpful recommendations. Their
experience was an invaluable asset which allowed us to accomplish this research.
We would like to acknowledge the faculty and staff of NPS who provided their
support throughout the research for this report and ensured that we received the best
possible education.
We are also profoundly indebted to the United States Federal Government and to
our national authorities for granting us the opportunity to study at the Naval Postgraduate
School.
Major Aurel Cobianu Romanian Air Force
Captain Konrad Madej Polish Air Forces
I would like to thank my beloved and understanding wife, Agnieszka, who fully
supported me and sacrificed so much that this report is as much hers as it is mine. I would
like to express my love and appreciation to my greatest son in the world Adam, who was
born during our residence in Monterey. They are inspiration for me to work hard to make
the world better place.
Finally I would like to thank my family for their great support and understanding
during the course of this project.
Captain Konrad Madej Polish Air Forces

xxii
I would like to acknowledge the substantial contribution of colleagues and friends
from here and from home. My deep appreciation goes to Colonel (ret.) Ungureanu for his
honesty and confidence.
I am grateful to my family for their love, encouragement and continuous support.
Finally, I want to say thanks from the bottom of my heart to my fiancée. Ramona,
thank you very much for who you are and for standing by me!
Major Cobianu Romanian Air Forces

1
I. INTRODUCTION
A. PROBLEM DESCRIPTION
The F-16 is the first American fighter to be concurrently deployed domestically
and abroad. United States Air Force introduced F-16 into service in 1979. The total
number of employed aircraft in the United States Air Force (USAF) as well as in the
allied forces is currently 4,426.1 Superior aerodynamic characteristics, variety of carried
weapon systems, modern electronic equipment and huge potential for modernization
make the F-16 one of the most popular and desired multi-role aircraft.
Rapidly aging post-Soviet air fleets of many Eastern European countries forced
them to look for a new, modern solution for their air forces – multi-role aircraft. Because
the F-16 has proven its effectiveness and reliability during many conflicts, and the fact
that the F-16 is used in most NATO Air Forces, means that the aircraft is still a preferred
option for potential users to modernize their air fleet. Recently, the Polish Air Force
(PoAF) acquired 48 F-16s C/D Block 50/52+ (2004). It provides the PoAF with great
operational capability and strengthens air power of the NATO in Europe. At the same
time, the Romanian Air Force (RoAF) is facing an aging air fleet problem and is looking
to acquire a new multi-role aircraft. Current military requirements and political situations
point out that the F-16 aircraft may be the right choice for Romania.
But a new and modern weapon system is very often accompanied by significant
costs. Acquisition of a weapon system is only the beginning of a long life cycle. The
Operating and Support (O&S) costs, associated with servicing a weapon system, increase
the Total Ownership Costs (TOC). O&S costs are responsible for 78 percent of TOC of
the modern weapon system.2 Therefore, this report provides an analysis of the O&S costs
of the F-16 C/D Block 50/52+. The report will examine O&S costs of F-16 in the USAF.
Based on information gathered from analysis of the United States Air Force (USAF) F-16
1 Global Security, “F-16 Fighting Falcon,” http://www.globalsecurity.org/military/systems/aircraft/f-16-history.htm/
(accessed April 27, 2006).
2 Office of the Secretary of Defense, “Operating and Support Cost-Estimating Guide,” (Washington, DC: Cost Analysis Improvement Group, May 1992), 2-3, http://www.dtic.mil/pae/ (accessed March 27, 2006).

2
Life Cycle Management (LCM) and Department of Defense Acquisition System, we will
provide recommendations for the PoAF to reduce O&S of the F-16 C/D Block 50/52+.
Our project will try to capture the best experience in managing O&S costs in the USAF,
and to formulate recommendations for the PoAF F-16 and RoAF.
To create recommendations for the PoAF and the RoAF, the theoretical basis of
O&S costs will be explained, and the basic cost drivers will be identified. Furthermore,
the O&S costs of the F-16 C/D data from the Air Force Total Ownership Cost (AFTOC)
database will be examined and used to build forecasting models of O&S costs.
Poland and Romania have not had any influence on the initial phases of the LCM
of the F-16 (Program Initiation, Concept Exploration and Definition, Concept
Demonstration and Validation, Engineering and Manufacturing Development).
Therefore, this report will emphasize the O&S phase of the LCM.
B. SCOPE
The intention of this report is to provide a general guideline for air forces which
have acquired or are in the ongoing acquisition process of the F-16C/D. The report
focuses on O&S costs and Total Life Cycle System Management (TLCSM) of a fighter
aircraft in general and the F-16C/D in particular.
C. RESEARCH QUESTIONS
This report raises the questions:
• How can O&S costs of the modern multi-role aircraft be approached to minimize their impact on the TOC?
• What are the objectives and elements of the USAF F-16 C/D Life Cycle Management and Acquisition Process?
• What are the structure and estimating methods of the O&S costs in the USAF?
• What are best practices of reducing O&S costs in the USAF?
• What is the AFTOC database?
• What recommendations can be drawn for foreign users of the F-16 C/D by analyzing O&S costs incurred by the USAF?
• How have O&S cost of the F-16C/D been forecasted in the USAF?
• What recommendations may be formulated for the PoAF and RoAF?

3
D. REPORT ORGANIZATION
First, this MBA professional report presents background information on the F-16
weapon system. It first considers the development of the F-16 weapon system followed
by the main characteristics and description of the F-16. Chapter II describes the PoAF
acquisition process and the governmental Offset Agreement signed between the Polish
and US Governments. The last part of Chapter II presents the F-16 as a possible solution
for the RoAF.
Chapter III describes the acquisition process of the weapon system according to
DoD best practices and doctrines. It also examines the TLCSM.
Chapter IV deals with the O&S costs. It presents cost structure and the theoretical
foundation for the O&S costs. It provides background information about R-TOC
practices as well.
Chapter V examines data from the AFTOC database. In the first section, the
AFTOC database is presented, then the O&S cost of the F-16C/D are examined in
context. The last part of Chapter V presents approaches to forecasting future O&S costs
based on data from the AFTOC.
Finally, this report will provide recommendations and conclusions for future
operators of the F-16 weapon system.
E. METHODOLOGY
The methodology used in this MBA report consists of the following steps:
• A summary of the DoD acquisition rules and regulations regarding TLCSM and O&S costs.
• A review of the theoretical foundations of the O&S costs based DoD instructions and publications, governmental and Congressional reports and scholarly articles.
• A review of the literature available in the Dudley Knox Library, USAF magazines, and Internet resources regarding the evolution of the F-16.
• An analysis of the F-16 C/D O&S costs data from the AFTOC database and development forecasting method for O&S costs.
• A development of recommendations based upon findings and data analysis.

4
THIS PAGE INTENTIONALLY LEFT BLANK

5
II. LOCKHEED MARTIN F-16 MULTI-ROLE AIRCRAFT
The purpose of this chapter is to provide a brief history of F-16 Fighting Falcon
development with primary focus on the F-16C/D version. In addition, the main
characteristics of the aircraft are presented in the context of its development. Republic of
Poland has been involved in the F-16 acquisition process since 2002, when the F-16C/D
won the fighter competition organized by PoAF. The second part of this chapter presents
the acquisition process for the PoAF. The RoAF will withdraw its MiG-21 Lancer
fighters from 2008 to 2010, and is seeking the best replacement for them with a multi-
role aircraft. The F-16C/D represents a possible solution. Some implications of the future
multi-role fighter acquisition process for RoAF are presented in the last part of the
chapter.
A. F-16 FIGHTING FALCON - BRIEF HISTORY AND MAIN CHARACTERISTICS
1. History
The F-16 program traces its beginnings to the Vietnam War. During that conflict,
American combat aircraft suffered a lack of maneuverability at transonic speeds in close
contact with enemy aircraft. This was the stimulus for the Lightweight Fighter Program.
The main point of that program was to combine maximum maneuverability with great
load qualities. Lightweight Fighter candidates were provided by several American
manufacturers in 1972. Two of them, General Dynamics and Northrop, built prototypes:
Northrop’s twin engine YF-17, and the single engine YF-16 from General Dynamics.
The competition was completed in 1975. Both planes proved their
maneuverability and high performance at both transonic and slow speeds. The YF-16 was
selected by the Air Force on January 13, 1975. The General Dynamics’ YF-16 showed
superior performance over its Northrop rival in several aspects, such as:
• Lower production cost (initial procurement cost and life cycle cost)
• Lower O&S cost
• Great results with a new fly-by-wire technology application
• New concept of reclined seat backs

6
• Transparent Heads-up Display (HUD) and panels as a design to face high-g maneuvers
• High profile canopy with expanded visibility from the cockpit3
2. Design
A number of subsystems were adapted from other aircraft already in service (F-
15, F-111). Parts and detail assemblies were designed for simplifying the manufacturing
process and for using low cost materials. The main purpose was to minimize purchase
price and life cycle cost. Structural simplicity and weight reduction were taken into
consideration as well. The light weight of the airframe was achieved without reduction of
high-g performance capability; the F-16 Fighting Falcon can withstand up to nine g’s.
Figure 1. An F-16 Fighting Falcon Flies a Mission in the Skies near Iraq (From: .Air
Force Link, U.S. Air Force photo by Staff Sgt. Cherie A. Thurlby, http://www.af.mil/library/raptor/photos.asp?galleryID=3&page=2).
3 Global Security, “F-16 Fighting Falcon.”

7
The aerodynamic configuration is a synthesis of the high overall performance
achieved by the configuration of the airframe: cropped delta wings, single vertical tail
supported by a small fixed ventral fin located under the bottom of the fuselage, moving
horizontal tail, and the fixed geometry inlet which supplies air to the single Pratt &
Whitney F100-PW-200 turbofan engine. Good performance of the engine during the
flight with a huge range of angle of attack is achieved by inlet location at the bottom of
the fuselage.
Cropped delta wings are supported by the strakes, which extend from the wings’
edges. That allows generation of vortexes which prevent wing stall at high angles of
attack. The trailing edge of the wing is equipped with flaperons, which serves two
purposes: flaps for high lift and ailerons for lateral control. The leading edge of the wing
is equipped with automatically deployed maneuvering flaps to improve aerodynamic
performance.
The F-16 utilizes an advanced fly-by-wire system for its aerodynamic control
surfaces. The pilot’s intentions are transmitted to the control surfaces by electrical signals
that activate hydraulic systems to move aerodynamic control surfaces. That system,
compared to the older mechanical control systems, is lighter, more precise, and simpler.
Another novel element in the F-16 design is “relaxed static stability.” The
traditional longitudinal stability, which is necessary for the airframe to be stable, was
reduced to a level unacceptable for traditional airframes. It was achieved by moving the
center of gravity (CG) to a point very near to the aerodynamic center (AC) of the plane.
As a result the tail load and trim drag was reduced. That “uncomfortable environment”
for the pilot is compensated for by the electronic-hydraulic augmentation system, which
injects correction signals into the flight control system during flight.4
The cockpit is bubble-shaped, giving the pilot a high degree of unobstructed
forward and upward vision. Additionally, the seat-back angle of 30 degrees increases G-
force tolerance and comfort for the pilot. The traditional stick was replaced by the side
arm controller, located on the right arm console of the cockpit.
4 Global Security, “F-16 Fighting Falcon.”

8
The avionic system is built of highly accurate inertial navigation system. The
computer provides the pilot with all necessary information during the flight. It also
enables the F-16 to carry a variety of weapons.
3. F-16 Versions and Customers
The F-16 is one of the most popular fighters worldwide. As the largest weapon
systems program in the contemporary Western world, 4,426 aircraft have been built with
production still continuing.5 F-16s, in different versions, serve in the air forces of 24
countries: Royal Bahraini Air Force, Belgian Air Force, Chilean Air Force, Royal Danish
Air Force, Egyptian Air Force, Indonesian Air Force, Israeli Air Force, Italian Air Force,
Royal Jordanian Air Force, Royal Norwegian Air Force, Royal Air Force of Oman,
Pakistani Air Force, Polish Air Force, Portuguese Air Force, Republic of China Air Force
(Taiwan), Republic of Singapore Air Force, Republic of Korea Air Force, Royal Thai Air
Force, Royal Netherlands Air Force, Turkish Air Force, United Arab Emirates Air Force,
United States Armed Forces (Air Combat Command, United States Air Force in Europe,
Pacific Air Forces, United States Navy, NASA, Air Force Reserve Command, Air
National Guard), and Venezuelan Air Force.
Because of the variety of customers and upgrades of the F-16 weapon system,
many versions of the airplane entered operational service:
• F-16 A/B Block 1/5/10/15/10OCU/20
• F-16 C/D Block 25
• F-16 C/D Block 30/32
• F-16 C/D Block 40/42
• F-16 C/D Block 50/52
• F-16 E/F Block 60
• F-16 MLU
5 Global Security, “F-16 Fighting Falcon.”

9
Another three versions F-16/101, F-16/79, and F-16XL were built as prototypes.
4. Specifications
a. Structure
The aircraft structure consists of 80 percent aluminum alloy. Less than
eight percent of the structure is made from steel. Composites account for three percent,
while titanium alloy is used in only 1.5 percent. 60 percent of the structural parts are
manufactured from sheet metal, less than two percent require chemical milling.
Advanced technology enabled significant weight reduction. During the design phase,
General Dynamics assumed the cost of the airframe would be USD 60 per pound. That
reduction therefore reduced airframe cost by USD 80,000.6
The F-16 fuselage is manufactured in three major sections: nose/cockpit,
center, and aft. The forward section break point is aft of the cockpit. The second section
is located forward of the vertical fin. The advanced aerodynamics and airframe gives the
F-16 great range performance. For the F-16, 31 percent of the weight of loaded aircraft is
fuel (for comparison, the equivalent figure for the F-14 is 28 percent).
Wing/body blending was carried out in three dimensions. Viewed from
both front and rear, it is almost impossible to define where the wings end and the fuselage
begins. The wings’ leading edges also blend with the fuselage tanks. Gradually increase
of wing thickness at its root results in the very stiff wing. The leading edge maneuvering
flaps and trailing edge flaperons can be moved up to 35 degrees per second to fit Mach
number and angle of attack.
The vertical stabilizer has a multi-spar and multi-rip structure, made from
aluminum alloy. The two ventral fins beneath the fuselage section are made from
fiberglass.
The intake location is unconventional. The ventral location means minimal
airflow disturbance during the different conditions in flight. For example, at angle of
attack 25 degrees, the airflow into the intake is at an angle of only 10 degrees.
6 Douglas Richardson, Modern Fighting Aircraft - F-16, (New York, NY: Arco Publishing Inc., 1983), 18.

10
To reduce the number of spare parts, some components are designed to be
interchangeable between port and starboard. Reduction of number of spare parts and
modular construction of the plane reduced O&S cost compared to older fighter planes in
the USAF (Figure 2). Total O&S costs for the F-4 squadron equal USD 21,400,000 in
1976 USD. For the F-16 squadron the O&S costs equal USD 14,600,000 in 1976 USD.
Applications of new technology and new procedures decreased annual O&S costs by
USD 6,500,000 in USD 1976.
Annual O&S Cost of One USAF Squadron (24 Aircraft)
4,3
1,1 1,1
1,8 1,7
2,9
0,4
7,5
0,3
2,1
0,30,9
1,2 1,3
2,3
0,6
5,4
0,5
0
1
2
3
4
5
6
7
8
9
Fuel
Training
Ammo, Miss
ile Traini
ng
Spares
Base O
&S
Dep. Main
t.
Safety/
Log.
Military
Pay
Medica
l
Cost Elements
1976
$ x
1,00
0,00
0
F-4 PhantomF-16 Fighting Falcon
Figure 2. Comparison of Annual O&S Costs of One USAF Squadron (From: Douglas
Richardson, Modern Fighting Aircraft - F-16).
The F-16 is equipped with the McDonnell Douglas ACES II ejection seat.
That ejection seat was also used on the F-15 Eagle. It is rocket powered with a vectored
thrust pitch control system. ACES II offers zero-zero performance; from an aircraft,
which does not move, the ejection seat will move the pilot up to 100 feet (30 meters)

11
forward and rearwards up to 50 feet (15 meters). ACES II also has built-in survival
equipment: emergency oxygen, URT-33C radio beacon, life raft, and rucksack.7
The F-16C/D Block 50/52+, offered to Poland, is one of the latest versions
of the plane. It has special provisions for adverse weather delivery of the McDonnell
Douglas JDAM (Joint Direct Attack Munitions). In addition, the 50/52+ version has an
add-on tail unit containing a synthetic aperture radar, providing guidance to 1,000 pounds
Mk.83, 2,000 pounds Mk.84 and the 2,000 pounds BLU-109 warhead. Other features
include passive missile warning, terrain-referenced navigation and on-board oxygen
generating system (OBOGS). The airframe is modified to incorporate 600 US gallons
(2,271 liters) external fuel tanks and conformal fuel tanks.8
b. Power Plant
Pratt & Whitney started to develop the F100 turbofan engine in 1968,
designed originally to power the F-15. Because of the new concept of fighter aircraft with
high thrust-to-weight ratios, the engine had to meet high stringent requirements. It pushed
the technology of that time to the limits.
The F-100 is an axial flow turbo fan engine with a bypass ratio 0.7:1. The
engine has two shafts. One of them carries a three-stage fan driven by the two-stage
turbine. The second one carries a ten-stage compressor and a two-stage turbine. Normal
dry (without afterburner) rating is 12,420 pounds (5,634 kilograms); maximum rating is
14,670 pounds (6,654 kilograms). Specific fuel consumption is 0.69 at normal rating and
0.71 at maximum rating. At afterburner deployment, the engine has thrust equal to 23,830
pounds (10,809 kilograms) with specific fuel consumption of 2.17. At that rating the
engine burns 860 pounds (390 kilograms) of fuel per minute.9
The General Electric F110 is similar in size to the Pratt & Whitney F100.
The F110 has a three-stage fan leading to a nine-stage compressor, the first three stages
of which are variable. The bypass ratio is 0.87 to 1. The annular combustion chamber is
7 Richardson, Modern Fighting Aircraft - F-16, 21.
8 Carl Krittenden, “F-16C/D Block 50/52,” F-16.net, http://www.f-16.net/f-16_versions_article9.html (accessed April 29, 2006).
9 Richardson, Modern Fighting Aircraft - F-16, 24.

12
designed for smokeless operation, and has 20 dual-cone fuel injectors and swirling-cup
vaporizers. The single-stage HP turbine is designed to cope with inlet temperatures as
high as 2500 degrees F (1370 C). Blades are individually replaceable without rotor
disassembly. An uncooled two-stage turbine leads to a fully-modulated afterburner.
When afterburning is demanded, fuel is injected into both the fan and core flows, which
mix prior to combustion.10
Pratt & Whitney developed the F100-PW-229 in the 1990s to compete
with the GE F110 engine. It has about 22 percent more thrust than the previous F100
model. It is also the power plant for the F-16C/D Block 50/52+. The F100-PW-229
engine has following main characteristics:
• Maximum Thrust (Full Augmentation) - 29,100 pound-force (129.4 kilo Newton)
• Intermediate Thrust (Non-augmented) - 17,800 pound-force (79.2 kilo Newton)
• Weight (Specification Maximum) - 3,740 pounds (1,681 kilograms)
• Length - 191 inch (4.85 meters)
• Inlet Diameter - 34.8 inch (0.88 meters)
• Maximum Diameter - 46.5 inch (1.18 meters)
• Bypass Ratio - 0.36
• Overall Pressure Ratio - 32 to 1.11
c. Avionics
The F-16C/D Block 50/52 version carries a comprehensive suite of
avionics:
• Honeywell H-423 Ring Laser Gyro Inertial Navigation System (RLG INS) for rapid in-flight alignment
• Global Positioning System (GPS) receiver
• Data Transfer Cartridge with a large capacity (128 KB) to accommodate planned avionic upgrades
10 Joseph Baugher, “Engines for the General Dynamics F-16 Fighting Falcon,” AirToAirCombat.com, March 19,
2000, http://www.airtoaircombat.com/background.asp?id=8&bg=40 (accessed April 29, 2006).
11 Aeronautics Learning Laboratory for Science, Technology, and Research, “Pratt & Whitney Engines: F100-PW-229 Turbofan Engine,” http://www.allstar.fiu.edu/AERO/P&WEngines03.html (accessed April 29, 2006).
13
• Improved Data Modem for faster data transmission
• AN/ALR-56M advanced Radar Warning Receiver (RWR)
• AN/ALE-47 threat adaptive countermeasure system
• Digital terrain system data transfer cartridge
• Night vision system compatibility
• IFF interrogator
• MIL-STD-1760 data bus for programming new-generation Precision Guided Munitions (PGMs)
• Upgraded Programmable Display Generator
• Horizontal Situation Display (HSD) for increased situational awareness and tactical flexibility on all missions.12
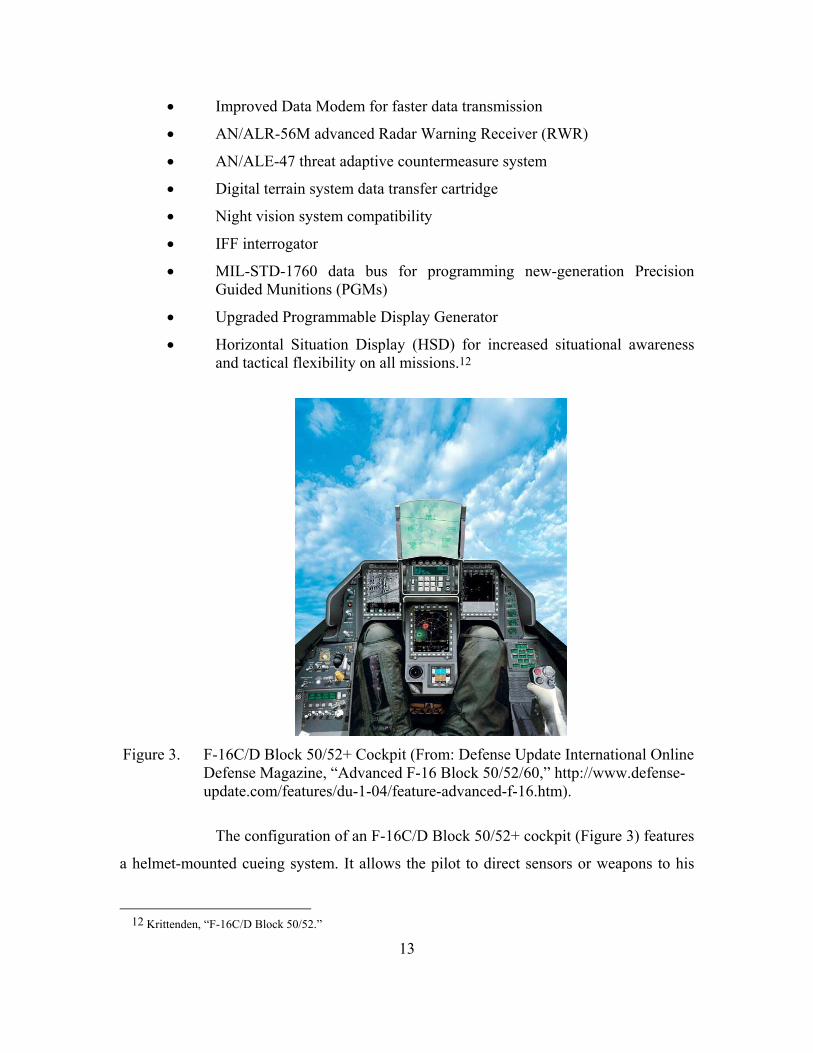
Figure 3. F-16C/D Block 50/52+ Cockpit (From: Defense Update International Online
Defense Magazine, “Advanced F-16 Block 50/52/60,” http://www.defense-update.com/features/du-1-04/feature-advanced-f-16.htm).
The configuration of an F-16C/D Block 50/52+ cockpit (Figure 3) features
a helmet-mounted cueing system. It allows the pilot to direct sensors or weapons to his
12 Krittenden, “F-16C/D Block 50/52.”

14
line of sight or to help him find a designated target. Heads-Up Display, several color
multifunction displays, and advanced recording and data-transfer equipment is used to
reduce pilot workload in every phase of the mission. The cockpit is also compatible with
a night vision system.
One of the key elements of the modern fighter plane is the radar system.
The development of the F-16 as a weapon system was always related to its ability to find
and engage targets from a distance and to detect targets even during their low altitude
profile flights. In the 1970s and early 1980s, the primary detection sensor of the F-16A/B
version was the Westinghouse AN/APG-66 radar, medium-PRF (Pulse Repetition
Frequency) radar (10 to 15 Megahertz). It operates in I/J band and features a flat-plate
array antenna. It provides the pilot with 16 operating frequencies. The pilot can chose
among any four. Total weight of the APG-66 is 296 pounds (134 kilograms). Mean Time
between Failure (MTBF) is 97 hours.13
Primary air-combat mode is look-down. In that mode, the AN/APG-66 can
detect a fighter-size plane at a range of 34.5 Nautical miles (55.6 kilometers). Four modes
are available in air-to-air combat. In dogfight mode, the radar scans a 20 degrees x 20
degrees field. In high-g maneuvers, it scans a 40 degrees x10 degrees pattern.14
The version of the F-16C/D offered to Poland, Block 50/52+, has several
additional modifications of the avionics. The IFF system was upgraded to the AN/APX-
113 advanced electronic interrogator/transponder IFF system. Also the Helmet-Mounted
Cueing System (HMCS) was added. The new, upgraded radar system significantly
improves performance of the F-16C/D Block 50/52+. Modifications to the AN/APG-68
radar system and to the Northrop Grumman AN/APG-68(V)9 improved detection range
and resolution. Application of advanced electronics enhances the radar’s ability to
operate in a dense electronic environment and to better resist jamming.
13 Richardson, Modern Fighting Aircraft - F-16, 31.
14 Ibid., 32.

15
The AN/APG-68(V)9 radar system improves air-to-air capabilities as well
as air-to-ground capabilities by:
• 30 percent increase in detecting range
• Improvement in false alarm rate and mutual interference
• Increase in maximum tracked targets to four
• Improved track performance in the Track While Scan mode
• Improved track performance in Single-Target-Track mode
• Two-foot resolution in the new Synthetic Aperture Radar (SAR) mode for autonomous and precision weapon delivery
• Improvement in target detection and map quality in Ground Moving Target Indication mode.15
This new radar is five times faster in processing in information mode and
it offers ten times more memory than that of the AN/APG-68 radar system.
d. Armament
Ordnance carried by F-16 ranges from simple unguided rockets to PGMs,
JDAM and nuclear weapons. This section will present the main ordnance of the F-16
with short descriptions.
20 mm Gatling Gun System M61A1 Vulcan, a six-barrel 20 mm cannon. It
can fire standard M50 ammunition at 6,000 rounds per minute. In some F-16 versions,
the rate of firing is selectable. The gun is fed through linked belts of ammunition and
driven by a hydraulic system. The ammo drum of the F-16 has a 511-round capacity. The
M61A1 Vulcan may use the following types of ammo:
• M55A1/A2 Target Practice Round (M220 TP Tracer Round)
• M53 Armor-Piercing Incendiary Round
• M56 High Explosive Incendiary Round (XM242 HEI Tracer)
• PGU-28 ammo available in the Block50/52 version and higher.16
AIM-9 Sidewinder, a supersonic, heat-seeking, air-to-air missile, with a
high-explosive warhead. Sidewinder is guided by a passive infrared guidance system.
15 Krittenden, “F-16C/D Block 50/52.”
16 Ibid.
16
Unit cost ranges from USD 56,000 to USD 84,000. The missile is built of an infrared
homing guidance section, an active optical target detector, a high explosive warhead and
a rocket motor. It can accelerate from 0 to 2.5 Mach in 2.2 seconds. Early models of the
Sidewinder were considered to have 70 percent single shot kill probability in ideal
conditions. The following Sidewinder versions are available for F-16: AIM-9, AIM-9A,
AIM-9B, AIM-9C, AIM-9D, AIM-9E, AIM-9E2, AIM-9G/H, AIM-9J, AIM-9J-1, AIM-
9J-3, AIM-9N, Rb 24, AIM-9L/M, AIM-9M-7, Rb 74, AIM-9P, AIM-9P-1, AIM-9P-2,
AIM-9P-3, AIM-9P-4, AIM-9Q, AIM-9R, AIM-9S, AIM-9X.17
AIM-120 AMRAAM. The Advanced Medium Range Air to Air Missile is a
high-supersonic, day/night/all weather Beyond Visual Range (BVR) weapon. It has fire-
and-forget air-to-air capability. It consists of a high-explosive warhead, an active radar
homing sensor for the final stages of flight, and a rocket motor. It is launched with
inertial mid-course guidance without the need for the fighter to keep the target
illuminated. Its capabilities include look-down, shoot-down, multiple launches against
multiple targets, and intercepts at very short range in dogfight situations. The unit cost of
the AIM-120 is USD 386,000. There are four versions of the AMRAAM: AIM-120A,
AIM-120B, Rb-99, AIM-120C. It is capable to of flying with speeds up to 4 Mach, and it
can engage targets 30+ Nautical miles (48+kilometers).18
AGM-65 Maverick, a tactical, air-to-surface, infra-red or electro-optically
guided missile. The Maverick is primarily employed in Close Air Support missions, but it
is equally effective in anti-armor, SEAD and interdiction roles. Unit costs vary due to the
many versions of the AGM-65 (e.g., USD 48,000 for the A-model and USD 269,000 for
the G-model).19 During the history of conflicts, Maverick has demonstrated an 86 percent
hit rate in combat. Average miss distance during tests was 3 feet (0.91 meters).20 The
AIM-65 is available in 7 variants: A, B, C, D, E, F, G.
17 Krittenden, “F-16C/D Block 50/52.”
18 Ibid.
19 Ibid.
20 Richardson, Modern Fighting Aircraft - F-16, 42.

17
Other Armament. The F-16 can also carry the JDAM, guided by a GPS
system, and dropped up to 15 NM standoff distance. To ensure high performance in flight
and attack, the F-16 can carry navigation and targeting pods: AN/AAQ-13 and AN/AAQ-
14 LANTIRN. The LANTIRN system consists of two pods, which allows the plane to fly
in all weather conditions, day and night. It provides the crew with a Terrain-Following
Radar (TFR), a Forward-Looking Infra-Red (FLIR), targeting information for the on-
board fire control system, and target laser illumination. The following armament may be
also carried by the F-16:
• Durandal anti-runway weapon
• Cluster munitions
• Penguin MK-3 anti-ship missile
• Nuclear bombs
• ALQ-131 pod
• LAU rocket launcher
• Paveway laser guided bombs
• Mk82 500 pounds (227 kilograms)
• Mk83 1000 pounds (454 kilograms)
• Mk84 2000 pounds (907 kilograms)
• Mk117 750 pounds (340 kilograms)
• Mk82 Snakeye
• AGM-78 anti-radar missile
• AGM-88 HARM
• AGM-45 Shrike21
5. Summary
The F-16 is one of the most widely deployed fighter planes. There are currently
4,426 F-16s in service throughout the world. Despite its 1970s origins, there are still
opportunities to modernize it. Since the 1970s, the only common part of the many
versions is its famous name – “Viper.” Engines, avionics, control systems and ordnance
have been developed and modified to meet the demands of its many users. International
21 Richardson, Modern Fighting Aircraft - F-16, 46.

18
air forces still want to acquire F-16s and put them in service as a major combat weapon
system. Even though there are available airframes ranked as 4.5th and 5th generation
fighters on the military market, the F-16 – a 4th generation fighter - still meets the
requirement of the contemporary battlefield.
In the next part of this chapter, we will discuss the F-16 acquisition process in
Poland. We will point out main turning points in that process, and we will show how a
modern weapon system may affect the country’s economy. We will also discuss the F-16
as a possible solution for the Romanian Air Force – which has yet to decide about its
future combat aircraft.
B. ACQUISITION OF F-16 C/D BLOCK 50/52+ BY POLISH AIR FORCE
1. Polish Decision
The contract for the acquisition of 48 F-16C/D Block50/52+ traces its beginning
to 1992. Then, the Commander of the Polish Air Force Gen. Jerzy Gotowala suggested
during an official visit in the United States of America that the Polish Air Force consider
leasing 12 fighter planes from the USAF (F-16C or F-18). The F-18 option was declined
in later considerations due to the high cost of acquisition. That idea was the beginning of
the acquisition process of a new multi-role fighter aircraft. On June 22, 2001, the Polish
Government approved the modernization plan for the Polish armed forces. One of the
main points of that plan was to acquire 48 new fighter planes. The offset program,
explained in greater detail below, was considered to be one of the most important
elements of the acquisition process. As it turned out, the size of the offset offered was the
decisive element in the Polish decision.
On July 8, 2001, the specific requirements of the new fighter planes for the Polish
Air Forces were sent to the French, American, British, and Swedish Embassies. With this
decision, the Polish government confirmed its possible future options: F-16, Mirage, and
Gripen.

19
Requirements were specified in 266 pages, and they defined Polish expectations
regarding:
• Characteristics of the plane
• Possible financial options
• Offset program.22
On November 12, 2002, the proposed offers from the contractors were submitted.
Evaluation of propositions was then carried out by Polish authorities and the Acquisition
and Offset Committee. The whole process took 657 days with 93 specialists engaged.23
2. Evaluation Standards and Requirements for the Multi-Role Aircraft Proposals
The evaluation standards consisted of four elements: price of aircraft, combat and
operational capabilities of the aircraft, main characteristics and engineering specifications
of the airplane (MC&ER), and the offset program.
Evaluation Standards and Requirements Structure used by Polish Ministry of
Economy and Offset Program Committee during multi-role aircraft selection process for
the Polish Air Force are presented in Figure 4. The structure consisted of: Price
(maximum 45 points), Combat Requirements (maximum 20 points), Main Characteristics
and Engineering Requirements (maximum 15 points) and Offset Program (maximum 15
points).
Combat and operational capabilities had to meet Polish Air Force and Defense
Policy needs. The PoAF had an aging fleet problem since the 1980s. Soviet aircraft
delivery ended just after 1989, when Polish society overthrew the communist regime. The
existing aircraft fleet did not allow the PoAF to accomplish defense tasks at modern
warfare levels.
22 Zdzislaw Wydra, ”Zwyciężyl F-16,” [in Polish] Wiraże, no. 2 (2003),
http://www.czasopismawlop.mil.pl/wiraze/w_numerzew/archiwumw/2-2003/zwyc.htm (accessed March 28, 2006).
23 Ibid.

20
Evaluation Standards and Requirements (100 Points Scale)
45
2015
15
PriceCombat RequirementsMC&EROffset Program
Figure 4. Evaluation Standards and Requirements Structure (From: Zdzislaw Wydra,
“Zwyciężyl F-16,” [in Polish] Wiraże, no. 2, (2003)).
There were 53 Combat and operational requirements. The new planes for Poland
had to have air refueling capability, and carry a large amount of various armaments. One
requirement considered armament compatibility with NATO standards and be able to
operate with NATO partners.
In addition, the engineering and technical specifications of the plane played a
major role during the selection process. Polish authorities evaluated 430 elements,
including the following aspects: speed, maneuverability, take-off and landing distance,
case of maintenance, durability, and O&S cost profile. In addition, the Polish specialists
evaluated the airframe, hydraulic system, electrical system, fuel system, and engine
system. The armament configuration, weapons carriages, cockpit configuration, avionics
systems, and life support systems were also evaluated. Survivability of the aircraft on the
modern battlefield, training, flying and maintenance personnel, possibility of acquiring
simulators to train personnel, spare parts procurement, and technical support from the
contractor also constituted important elements in the selection process.24
24 Wydra, ”Zwyciężyl F-16.”

21
3. Offset Program
Every country pays special attention to the development of its national defense
sector, including research activity, because of the great importance of defense for each
country. However, national industry is not always able to meet requirements of national
defense policy. Similarly to other countries, the Polish defense industry must support its
efforts from foreign resources, and must import armaments. In this case an offset is a
kind of obligatory cooperation between national contractors and foreign suppliers.
Offsets are compensation instruments required when a contract for supplying armaments
is awarded to a foreign contractor.
Offsets mean compensation for the country spending money on purchases in the
public sector. This is one method for promoting economic growth.25
All offset agreements between the Polish government and foreign companies are
based on Polish law (see offset process structure in Figure 5). The main law concerning
offset is the Act on Offset Agreements of September 10, 1999, for compensation
agreements concluded to cover defense and security contracts.
The Act sets forth the rules as well as the rights and liabilities for parties making
an offset agreement related to armament and weapon system delivery into the Republic of
Poland for the purposes of defense and security of State.26 The Act also establishes
general provisions, rules of execution of the offset agreement, the composition and tasks
for the Committee for the Offset Agreements as well as the supervision of the
performance of the offset agreements.
25 Republic of Poland, Ministry of Economy, “Offset in Poland,”
http://www.mgip.gov.pl/English/ECONOMY/Offset+Programmes/Basic+information/ (accessed April 28, 2006).
26 Republic of Poland, Ministry of Economy, “Act of 10 September 1999, on certain compensation agreements concluded in connection with contracts for deliveries for the needs of defense and security,” http://www.mgip.gov.pl/English/ECONOMY/Offset+Programmes/Basic+information/ (accessed April 28, 2006).

22
Figure 5. Offset Procedure in the Republic of Poland.

23
The main objectives of the offset programs in Poland are:
• Development of Polish industry
• Access to the new exports market
• Increasing current export potential
• Transfer of new technologies
• Development of research work
• Development of Polish universities and R&D centers
• Creation of new jobs in the Republic of Poland.27
Because of the factors listed above, the Polish Government paid great attention to
the offset program incorporated in the new multi-role aircraft contractors’ offers. The size
of the possible contract (USD 3.5 billion) also underlined the significance of the Offset
Program. Additionally, one of the main principles of the offset agreement in Polish Law
states: “The total value shall not be lower than the equivalent of the supply contract.”28
That means that the offset could be as high as USD 7 billion.
The combat, operational and engineering specifications of all the offers were
closed to one another. That is why the points (maximum 15) for the offset program had
been considered to be crucial. Two of the three offset offers exceeded 100 percent of the
contract value (Lockheed Martin and Saab-BAE Systems). The French proposal did not
reach 100 percent; after verification and offset multipliers application it turned out the
French proposal was equal to 60 percent of the total contract value.29
According the Polish Offset Law, offset multipliers were used to evaluate the
attractiveness of the offset program proposals. It helps to draw foreign contractors’
attention to Poland’s offset needs and to state which of them are of special significance
for the economy:
Multiplier Value Nominal ValueOffset ×=
27 Republic of Poland, Ministry of Economy, “Offset in Poland.”
28 Ibid.
29 Zdzislaw Wydra, ”F-16 Oferta Offsetowa,” [in Polish] Wiraże, no. 3 (2003), http://www.czasopismawlop.mil.pl/wiraze/w_numerzew/archiwumw/3-2003/f16o.htm (accessed March 28, 2006).

24
There are different types of the multipliers and they depend on the nature of the
offset. Polish offset law distinguishes two offsets: direct and indirect. A direct offset is an
offset commitment performed by defense industry companies (listed in the relevant
regulation), whose objectives are production, repairs, servicing, research and
development and trading in armaments. Indirect offsets concern other companies
registered in Poland.30 Multipliers for direct and indirect offset are presented in Appendix
A, Appendix B, and Appendix C.
The amount of money transferred to the Polish economy, as an effect of proposed
offset programs for the Multi-Role Aircraft Acquisition before and after offset multiplier
application, is presented in Figure 6.
Total offset value (% of aircraft value)
270%
170%
105%
170%146%
60%
344%
0%
50%
100%
150%
200%
250%
300%
350%
F-16C/D Block 50/52+ JAS-39 Grippen Mirage 2000-5aircraft
% o
f airc
raft
tota
l val
ue
w/o Verificationwith Verificationwith Offset Multipliers
Figure 6. Total Offset Value Depends on Applied Multipliers. In the two cases (U.S.
and U.K.-Sweden) total offset value was larger than contract value. (From: Zdzislaw Wydra,” F-16 Oferta Offsetowa,” [in Polish] Wiraże, no. 3 (2003)).
30 Republic of Poland, Ministry of Economy, “Offset in Poland.”

25
The United States’ offer was originally estimated to be USD 9.8 billion. After the
verification process, the American offer was still the biggest and equal to USD 6.3
billion. The offset proposal consisted of 104 commitments. The United States’ offer
claimed to meet the offset commitments by investing in 55 programs in the defense sector
(direct offset) and in 49 programs in the other branches of Polish economy (indirect
offset).31 The complete list of the United States offset commitments is attached in the
Appendix D and Appendix E.
The total offset value, after an offset multiplier application, is equal today to USD
12,547 million with its nominal value of USD 7,751 million.32 This contributes
significantly to the Polish economy. As models, offset programs were boosters for the
economy in Brazil (Embraer airline transport), for the Finnish economy (the electronic
and wood industries), for Spain (military forces and airline industry), and for Israel
(electronics sector). The Polish offset program has following structure:
• Export and purchase – 70%
• Investment in economy – 20%
• Technology transfer – 10%.33
There is one more very important issue about the “Contract of the Century” (as
referenced in Polish and European newspapers). The United States government decided
to give Poland a loan for that purchase. Poland will pay the USD 3.5 billion after 2010.
Until that time the only financial obligation to the United States will be interest. Poland
will pay approximately a total amount of USD 4.7 billion to the US corporations for the
48 planes.34
31 Wydra, ”F-16 Oferta Offsetowa.”
32 Republic of Poland, Ministry of Economy, “The List of Lockheed Martin’s Offset Commitments,” http://www.mgip.gov.pl/NR/rdonlyres/D388B4F0-F028-4D79-A15F-B5EFD29BDC8F/0/zestawienie_zbiorcze.doc/ (accessed March 30, 2006).
33 wprost Online, “Miliardy Dolarów na Skrzydlach F-16,” [in Polish] (2003), http://www.wprost.pl/ar/?O=43338/ (accessed March 30, 2006).
34 Ibid.

26
To stress the significance and size of the offset commitments of the United States,
it should be compared with the rest of the major offset programs in Poland (Figure 7 and
Appendix F). The rest of the total offset programs in Poland equal USD 1.718 billion (1
March 2006).35 The US offset commitment is equal to USD 6.028 billion nominal
value.36
Offset commitments in Poland (in million USD)
EUROTORP (France), 32.22
EADS (Germany, France, Spain), 212.04
PATRIA (Finland), 575.4
THALES (Holland), 91.062
OTO MALERA (Italy), 367.687
RAFAEL (Israel), 440
Lockheed Martin (US), 6028
Figure 7. Offset Commitment in Poland as of March 1, 2006 (From: Republic of
Poland, Ministry of Economy, “List of Offset Agreements in Poland (as of January 1, 2005)” [in Polish]).
The Polish F-16C/D Block50/52+ will be in service in October 2006 (the first 5
planes). Delivery is scheduled to end in 2008. After that time, three squadrons of F-16s
from the Polish Air Force should achieve combat readiness for world wide deployment in
35 Republic of Poland, Ministry of Economy, “List of offset agreements in Poland (as of 1 January 2005)” [in
Polish], http://www.mgip.gov.pl/NR/rdonlyres/3627A141-DBD7-4010-950A-6A8C08AA5ABA/17858/offset_umowy_060302.pdf/ (accessed March 30, 2006).
36 The amount of offset commitment was transferred from the EURO to US Dollars using the rate of exchange €1 = $1.1935. Rate of exchange from March 1, 2006 from the National Bank of Poland, http://www.nbp.pl/ (accessed March 30, 2006).

27
NATO missions. Polish F-16C/D Block50/52+ will be the most advanced version among
F-16 aircraft in NATO forces. This is important, because Polish F-16s are meant to stay
in service for up to 30 years. In addition, they have huge potential to be modernized.
Selection of the F-16 by the Polish government is also a selection of a course of policy.
Given the key ally role for the United States, Poland will also have the opportunity to be
one of the first countries for consideration for the new generation fighter F-35. There is a
good chance that Romania will follow a similar strategy.
C. ROMANIA – POTENTIAL F-16 CUSTOMER
Poland and Romania share common values and have similar characteristics
regarding their positions in Central Europe and South East Europe (respectively) and
their relations with the United States. First, Poland is the largest and most important
country in Central Europe, while Romania benefits from a key geo-strategic position in
the South-Eastern part of the continent. Second, both countries are part of the “New
Europe” as State Secretary Rumsfeld called them, and enjoy special partnerships with the
United States.
Regarding its security, Romania has largely followed Poland’s path. Admittedly,
Romania was the first country to sign the Partnership for Peace Program which, in the
beginning, was thought to be the anteroom for NATO accession. Poland became a NATO
member in 1999 after the Washington summit. Five years later, in 2004, Romania joined
the North-Atlantic club. A similar pattern was followed by Poland and Romania for
European Union membership.
NATO membership was not only a culmination, but also a milestone along the
way toward military restructuring. Given the security guarantees gained once Romania
became a full member of the NATO Alliance, the number of fighting squadrons of the
Romanian Air Force was diminished by two squadrons. Despite programs for upgrading
the MiG-29, Romania decided to withdraw the MiG-29 from service and focus on the
MiG-21 Lancer (the modernized version of the MiG-21M/MF) as its prime combat
aircraft. This decision has been explained by Mr. Matache, a former State Secretary for

28
the Department of Armament, who stated that ”after a deep analysis, the air force
considered that the financial investment in the overhaul and upgrading [of the MiG-29]
too big an effort for a small number of aircraft.”37
The MiG-21 upgrading program has been a major element in the regeneration of
the RoAF and the Romanian aerospace industry following the dissolution of the Soviet
Union and Warsaw Pact. It has allowed the RoAF to jump a generation of combat
aircraft. Despite an over-30 year-old airframe, the MiG-21 Lancer is a fighter equipped
with current sensors, avionics technology and modern weaponry. It has been modernized
in two versions: the Lancer-A ground-attack version and the Lancer-C air-superiority
version.38 In addition, 14 MiG-21 UM two-seaters were modernized to the Lancer-B
standard for training purposes.
The MiG-21 Lancer was accepted as an interoperable aircraft that may participate
in missions alongside the NATO Air Forces. Starting in 2004, MiG-21 Lancer pilots are
in fact executing air sovereignty missions over Romanian airspace. Based on this
experience, NATO has accepted Romania’s proposal to take on responsibility of the air
policing over the Baltic States as a part of regular NATO rotations in the region.
In current circumstances, the RoAF has to execute high-complexity and high-risk
missions which require, as a necessity, a modern, multi-role fighting aircraft, belonging
to the fourth or fifth generation. Among requirements, the following have priority:
maximum efficacy in the battlespace environment, flexibility in executing missions with
the capability to change assignment during mission, larger number of take-offs per time
period, reduced times of flight recovery capacity, low operations and maintenance costs,
higher flight autonomy, open system design to allow further upgrading, and excellent
flight and maneuvering capabilities.
The MiG-21 will be in service until they run out of technical resources. Until
2010, 50 percent of them will be unsupportable, while the rest of them will remain in
37 Michael J. Gething, “Lancer upgrade leads Romania’s leap into the 21st Century,” Jane’s International Defence
Review 036, no. 006 (2003).
38 For full details, see Jane's Defence Systems Modernisation IX, no.7, (1996).

29
service for another four years. Overall, the MiG-21 Lancer program has not been
tremendously successful. The MiG-21 remains a useful aircraft for some missions, and its
low-radar cross section and agility potentially make it a difficult opponent even for front-
line fighters. However, its small, aging airframe and limited radar and avionics upgrade
options have been a drag on modernization efforts. Consequently, Romania is interested
in replacing the MiG-21 Lancer fleet with new aircraft. Therefore, an evaluation of
available alternatives is being carried out.
During 2005, the following companies briefed the Romanian Air Force HQ about
their offers of multi-role aircraft: Boeing with the F/A-18, a joint venture with Elbit
Systems, Lockheed Martin with the F-16, and Gripen International with the JAS 39
Gripen. Given Romania’s future membership in the European Union, the Eurofighter
might also become a potential competitor.
According to Jane’s, in February 2006, the National Supreme Defense Council
approved the “conception on major procurement programs for Romanian Armed Forces
2006-2025” document. Romania's NATO status requires a fourth-generation, multi-role
fighter aircraft. To carry out domestic missions and meet NATO commitments, the RoAF
needs 48 multi-role fighters to be operational by 2010.39
At the end of October 2005, the Israeli media announced that Romania signed a
new contract with Elbit Systems, worth 150 million dollars, to buy F-16A and F-16B jet-
fighters. Other sources reported an even higher price, some 400 million dollars. This
would also include additional costs such as Mid Life Upgrade (MLU), also known as
Falcon Up (which is about 3 million dollars per aircraft), operating and maintenance
costs, the cost for training pilots and technicians, and the new armament systems.
However, Romanian authorities denied that a decision has been made. As Defense
Minister Atanasiu emphasized, for the time being Romania is evaluating and researching
39 Radu Tudor, “Romania opens talks on fighter procurement,” Jane’s International Defence Review 39, no. 003
(2006).
30
the offers, but no firm decision has been made regarding the type of the aircraft to be
purchased.40 In addition, he mentioned that purchasing new aircraft are preferable to used
ones:
“Our aspiration, which coincides with the desire of the Romanian Armed Forces,
is to purchase new multi-role aircraft. We do not know if the budget, the Finance
Minister and the government would agree with our request, or we would get much
limited funding and we would be forced to purchase second-hand aircraft.”41
A decision regarding the acquisition of a multi-role aircraft is scheduled to be
made by the end of 2006, meaning that in 2007 negotiations would start with aircraft
entering the RoAF service in 2010, and all units equipped and fully operational by 2014.
The final decision about the purchase of fighter aircraft will influence the
structure and effectiveness of the RoAF for the next 20 years. Irrespective of the aircraft
chosen, the RoAF would pay not only for the acquisition price, but also for operating and
support costs.
In the wake of the Cold War, defense budgets have continually decreased. This
results in a general decrease of numbers of military aircraft purchased since early 1990s,
associated with dramatic increase in aircraft acquisition cost. Taking into account the
above-mentioned, financial aspects have outweighed military reasoning in choosing
among alternatives. Also, cost is clearly a significant driver when choosing an acquisition
strategy.
Financial acquisition strategy includes four categories: budget financing, fund
financing, debt financing, and leasing. During the Cold War, budget financing was the
preferred method. However, “the Navy has a long history of leasing ships to augment
military capability in times of war.”42 An extended debate was generated by the USAF
40 Arieh Egozi, “Israel, Romania seal F-16 sale deal,” Jane’s International Defence Review 38, no. 010 (2005).
41 Teodor Atanasiu, cited by Mihai Diac, “Bucharest would like to spend millions of dollars on fighter aircraft,” [in Romanian] (Bucharest: Gandul, March 10, 2006).
42 Joseph G. San Miguel, John K. Shank and Donald E. Summers, “Navy Acquisition via Leasing: Policy, Politics, and Polemics with the Maritime Prepositioned Ships,” NPS Acquisition Research, April 2005, 3.

31
proposal to lease new refueling tankers from Boeing. The Hungarian experience, which
includes a 12-year lease of 14 JAS-39 Gripen multi-role fighters, has been more
successful.
In the Hungarian case43 as well as in the Polish case, the offset agreement was a
key element in the acquisition process. A major part of the offset agreement is the
participation of the aeronautical industry along with the contractor the modernization
process.
Romania has a long history of producing high quality aircraft and helicopters.
Numerous links with Western Europe’s industries have been established since 1970s.
During the 1990s, Romanian aeronautical industries started an extended collaboration
with the Israeli defense industry. The modernization process of MiG-21 is only one of
numerous examples. However, the current defense trade sector is still struggling with its
legacy of state control, which includes inefficient production methods and obsolete
management practices. Therefore, the involvement of Romanian industry in the
procurement and ownership of the multi-role aircraft will be an essential element in the
decision-making.
In conclusion, the acquisition process of the multi-role aircraft for RoAF must
begin soon. As part of that process, the experience of Poland, as well as the Hungarian
case will be analyzed by the decision-makers, and lessons learned will be applied.
Undoubtedly some aspects of the acquisition process, as accomplished by DoD, would
constitute a model for Romania’s approach. Particularly important in this respect is the
estimation of operatings and support costs. In the following chapters, the acquisition
process in DoD will be addressed, and based on the above, it is expected that Romania
will decide on the most appropriate and affordable path to be followed.
43 Neil Barnett, “Hungary requests enhanced Gripen deal,” Jane’s Defence Weekly, September 11, 2002.

32
THIS PAGE INTENTIONALLY LEFT BLANK
33
III. DOD’S APPROACH TO WEAPON SYSTEM MANAGEMENT
The last fifteen years have brought significant changes to the structure and task of
the U.S. Military Forces. Those changes were caused by shifting political and military
requirements in the post Cold War Era. In addition, the development of modern
technology has created a new battlefield environment. Modern technology is enormously
expensive and needs large appropriations allocated from shrinking budgets. Almost every
country has problems with fulfilling the needs of its military forces. In order to meet the
requirements of the U.S. Military Forces in the 21st Century, the DoD fundamentally
reengineered the way it does business, and a new Defense Acquisition System was
established. “The Defense Acquisition System is the management process by which the
DoD provides effective, affordable, and timely systems to the users.”44
The effectiveness of modern weapon systems, such as the F-16 Multi-Role
Aircraft, and their affordability, as well as the time needed to field them are determined
by the way they are acquired. Moreover, the Total Ownership Cost (TOC) will also be
affected by decisions during the acquisitions phases. In order to better understand the
basics of the acquisition process and its effect on ownership costs, we present the new
Defense Acquisition System developed by the DoD in this chapter. We also elaborate
each phase of the acquisition process of the modern weapon system. Next, we
concentrate on the Total Life Cycle Management System (TLCMS). TLCMS and
acquisition system have direct impacts on TOC, particularly on operating and support
costs.
The Defense Acquisition System was established to manage investment in
modern technologies, programs and product support necessary to meet the requirements
of the National Security Strategy and to support the U.S. Armed Forces. The national
investment in technologies, conducted within the Defense Acquisition System, must
44 Department of Defense, “DoD Directive no. 5000.1 – The Defense Acquisition System,” (Washington, D.C.:
Office of the Under Secretary of Defense for Acquisition Technology, and Logistics, 2003), para. 3.1, http://hfetag.dtic.mil/docs/DoD_5000-1.doc (accessed April 27, 2006).

34
support not only today’s armed forces but also future armed forces. This provides U.S.
military forces with a unique opportunity to be the leading armed forces all over the
world.
The primary objective of the Defense Acquisition System is to provide users with
quality products plus measurable improvements to mission capability and operational
support. According to the DoDD 5000.1, the following policies should govern the
Defense Acquisition System:
• Flexibility – there is no one way to satisfy users and accomplish objectives of the Defense Acquisition System. Milestone Decision Authorities (MDAs) and Program Managers (PMs) should tailor the program strategies and oversight to meet the particular condition of the program.
• Responsiveness – advanced technologies should be integrated with production and they should enter service in the shortest possible time. Evolutionary acquisition strategy is the preferred approach to satisfy operational needs.
• Innovation – acquisition professionals should continuously develop and implement strategies to improve the Defense Acquisition System. The main objective of the innovation capabilities of the acquisition system should be to reduce cycle time, cost and encourage teamwork.
• Discipline – every PM should establish program objectives with optimum cost, schedule and performance parameters that describe the program over its life cycle.
• Streamlined and Effective Management – responsibility for system acquisition should be decentralized to the maximum extent possible. Responsible individuals should be provided45 by the MDA with sufficient authority to accomplish the Defense Acquisition System’s objectives.
A. PROCESS OF ACQUISITION BASED ON THE DOD SYSTEM LIFE-CYCLE PHASES
The DoD acquisition process is extremely complex, involving hundreds of
thousands of people and many years of engagement. The process also involves
assimilation of information and management within many areas, often overlapping one
another, which are difficult to predict and measure. The main objective of that structure
is, however, to ensure the best possible expenditure of public funds. To accomplish that
45 DoD, “DoD Directive 5000.1,” para. 3 – “Policy.”

35
task, DoD has developed its acquisition system over many years of experience,. The
system has also evolved within boundaries where many potentially competing interests
are balanced with many resource constraints.
The management framework for the Defense System Acquisition is commonly
referred to as the acquisition life cycle. The new DoDI 5000.2 presents the acquisition
system and its elements. The new framework for the acquisition system is called the
“New 5000 Model” (Figure 8).46 The main objective of the “New 5000 Model” is to
improve performance and lower costs. To meet that objective, the model considers
following key focus areas:
• Delivery of advanced technology to warfighters faster by
• Rapid acquisition with demonstrated technology
• Full system demonstration before commitment to production
• Reducing Total Ownership Cost and improving affordability
• Costs as requirement that drives design, procurement, and support
• Increased competition
• Deploying interoperable and supportable systems
• Interoperability presented before production phase
• Integration of logistic and acquisition
• Improvement of software management
46 Charles B. Cochrane, “Introduction to Defense Acquisition Management,” 6th ed., (Fort Belvoir, VA: Defense
Acquisition University Press, 2003), 49, http://www.dau.mil/pubs/gdbks/idam.asp (accessed April 10, 2006).

36
Figure 8. The New 5000 Model of the DoD Systems Acquisition Process (From: DoD
Template for Application of TLCSM and PBL in the Weapon System Life Cycle, http://www.acq.osd.mil/log/lpp/tlcm/TLCSMGuidanceTemplate.pdf).
According to the New 5000 Model, technology opportunities and missions must
be presented before entering the acquisition process. In the new model multiple systems
acquisition strategies are possible, which the model encourages. The preferred approach
is called evolutionary acquisition, based on the assumption that time-phased requirements
will improve acquisition system performance. The success of this strategy depends on a
consistent definition of operational capability requirements coupled with maturation of
technologies. Evolutionary acquisition strategy also demands a robust system engineering
approach focused on adding capabilities in future increments.47
Development of technology is separated from systems integration. As a result,
technology is proved before beginning system-level work at Milestone B. The next
important element of the new model is the requirement of meeting “entrance criteria”
before moving to the next phase. It ensures the readiness of the system to be moved to the
next phase of development without any delay. Moreover, it reduces the costs. In the New
5000 Model, the operation, support, and disposal phases have become integrated parts of
the acquisition process. Thus, the process encompasses the entire system life cycle.
47 United States Air Force, “Air Force Instruction 63-101 - Operations of Capabilities Based Acquisition System,”
(Washington DC: Secretary of Air Force, 2005), para. 1.4, http://www.e-publishing.af.mil/pubfiles/af/63/afi63-101/afi63-101.pdf (accessed April 14, 2006).

37
1. Pre-Acquisition
a. Concept Refinement Phase and Milestone A
The pre-acquisition phase is composed of two elements: concept
refinements and technology development.
The Concept Refinement Phase begins when the Concept Decision is
approved by the Milestone A Decision Authority (MDA) (Figure 9 presents the
framework of the Concept Refinements Phase prior to Milestone A). During that phase,
the Technology Development Strategy (TDS) is developed. The main objective of the
TDS is to set the foundations for the next phase – Technology Development. The MDA
determines who will prepare the TDS.
Figure 9. Integration of Acquisition, T&E and Requirements Events Prior to
Milestone A (From: USAF, “Air Force Instruction 63-101,” (2005)).

38
To support the Concept Refinement Phase, an Analysis of the Alternatives
(AoA) is conducted. An AoA is an analytical comparison of the operational effectiveness
and costs of proposed material solutions to shortfalls in operational capabilities, also
called mission needs (Appendix G). The AoA presents the rationale for the preferred
solutions to the mission needs.48
In order to achieve the best possible solutions, the Concept Refinement
Phase emphasizes innovations and competitions. It also emphasizes existing commercial
solutions. They are drawn from diverse specialties and from large and small businesses
alike. The Concept Refinement Phase ends when the MDA approves the solution
supported by the AoA and TBS, which form the guidelines for the next Phase –
Technology Development.
b. Technology Development Phase
The Technology Development Phase should reduce technology risk
(Figure 10 presents the Framework of the Technology Development Phase). It is also
designed to determine suitable technologies which may be incorporated into the new
weapon system. During that phase close cooperation of the following elements is
required: operators, testers, and system development stakeholders. Elements which were
developed in the Concept Refinement Phase, require updates during that phase as well.49
The Technology Development Phase begins after the Milestone A
decision point, when the Milestone Decision Authority approves the TDS. The TDS,
which was created in the prior phase, is the map for technology development during this
phase. However, the favorable decision regarding TDS does not necessary mean that a
new acquisition program has been initiated. During that phase a series of demonstrations
of the new system may also be conducted to help the users and developers agree on
appropriate technology to accomplish the acquisition program goals.
48 USAF, “AFI 63-101,” para. 4.3.3.
49 USAF, “AFI 63-101,” para. 5.2.

39
Figure 10. Integration of Acquisition, T&E, and Requirement Events Prior to Milestone B (From: USAF, “Air Force Instruction 63-101,” (2005)).
“The project is ready to leave that phase when the technology for an affordable
increment of a militarily useful capability has been demonstrated in a relevant
environment.”50
2. Systems Acquisition
a. Milestone B and System Development and Demonstration Phase
The objectives of the System and Development Demonstration phase are:
• Develop a system or increment of capability
• Reduce integration and manufacturing risk
• Ensure operational capability
• Implement human system integration
50 Cochrane, ”Introduction to Defense Acquisition Management,” 53.

40
• Ensure affordability and protection of critical program information using appropriate techniques (anti-tamper measures)
• Demonstrate system integration, interoperability, safety and utility.51
The decision point for the System Development and Demonstration phase
is Milestone B, which is the acquisition program initiation. The decision is made by the
Milestone Decision Authority (MDA) – a designated individual with overall
responsibility for the program. The MDA has authority to approve entry into the next
phase of the acquisition process. The MDA is also responsible for costs, scheduling and
performance reporting to the higher authority (including Congressional reporting).
Figure 11. Integration of Acquisition, T&E, and Requirements Events Prior to
Milestone C (From: USAF, “Air Force Instruction 63-101,” (2005)).
51 Department of Defense, “Department of Defense Instruction 5000.2 - Operation of the Defense Acquisition
System,” (Washington, D.C.: Office of the Under Secretary of Defense for Acquisition Technology, and Logistics, 2003), para. 3.7.1.1., http://www.dtic.mil/whs/directives/corres/pdf2/i50002p.pdf (accessed April 14, 2006).

41
Before making any decision in the Milestone B decision point, the MDA
confirms that technology is sufficiently mature for system-level development. The MDA
also has responsibility to confirm that appropriate documents from the Joint Capabilities
Integration and Development Systems (JCIDS) have been approved.52 Additionally, the
MDA ensures that funds are in the budget.
Taking into consideration these problems, the Milestone Decision
Authority approves the acquisition strategy and program baseline. Entry into the System
Demonstration and Development Phase is then approved (Figure 11).
Entrance criteria for the System Demonstration and Development phase
are technology maturity, available funds and approved JCIDC document – Capability
Development Document (CDD). Technical maturity determines the path to be taken by
the program. A program entering that phase must have developed a systems and
operational architecture (this is a condition to be met at the Milestone B Decision Point).
That phase is driven by the Key Performance Parameters (KPP) found in the CDD. This
Phase contains two main elements (Figure 12):
• System Integration – the main objective is to integrate subsystems, reduce system-level risk and complete detailed design. The acquisition program enters that part of the SDD when the PM has the technical solution for the program (technology maturity), but the program is not yet integrated into a complete and coherent system.53
• System Demonstration – the main objective is to prove that system can operate in a useful way consistent with the KPPs. This element of the SDD should be accomplished when the system proves that it can operate under requirements set by the future environment, using the selected prototype. The system should then meet (or exceed) exit criteria and entrance requirements for the Milestone C. Accomplishment of that phase requires a decision made by the MDA to continue the program in Milestone C or drop the program and search for another alternative.54
52 JCIDS deals with the analysis of doctrines, organizations, training, materials, personnel, and facilities in an
integrated process to define gaps in warfighting capabilities. JCIDC also proposes solutions to those problems.
53 DoD, DoDI 5000.2, para. 3.7.3.
54 Ibid., para. 3.7.5.

42
Figure 12. Elements of the System Development and Demonstration Phase (SDD).
The System Integration Phase is followed by the Design Readiness
Review (DRR), which is an opportunity for mid-phase assessment. Successful
completion of the DRR ends the System Integration Phase and begins the System
Demonstration Phase.
b. Milestone C and Production and Deployment Phase
The decision regarding commitment to production of a new system is
made by the MDA at the Milestone C Decision Point. A new system receives
authorization to be produced at the Low Rate Initial Production (LRIP) level. The MDA
will approve entry to the LRIP when a reasonable degree of confidence of system
operational effectiveness is attained.
In some cases, Milestone C authorizes entry into full-scale production,
bypassing the LRIP. Milestone C also authorizes a limited operational testing for the
elements with no production components such as automated information systems or
software systems.55
55 Cochrane, “Introduction to Defense Acquisition Management,” 55.
System Integration
System Demonstration
C
PM: not integrated solution
Design Readiness
Review
MDA Decision
SDD

43
The main objective of the Production and Deployment phase (P&D) is to
achieve the operational capability which meets the mission needs requirements. Entrance
to P&D depends on the following factors:
• Acceptable performance in development, test and evaluation, operational assessment
• No significant manufacturing risk
• Mature software capability
• Manufacturing process under control
• Approved Initial Capabilities Document (ICD)
• Approved Capability Production Document (CPD)
• Acceptable interoperability
• Acceptable operational supportability
• Demonstration that the system is affordable through whole lifecycle.56
The P&D Phase consists of Low Rate Initial Production and Full Rate
Production and Deployment. It also includes the Full Rate Production Decision Review.
The LRIP must result in completion of manufacturing development.
Manufacturing development should be sufficient to produce a quantity necessary to
provide production articles for Initial Operational Test and Evaluation (IOT&E).
Manufacturing development should also establish an initial production base for the
system and permit an increase to full rate production.57
LRIP quantities should be minimized and any production must be
approved by the Milestone Decision Authority. Further, the MDA is responsible for
assessment of the cost and benefits of a break in production versus annual buys, when the
LRIP quantities are expected to be larger than predicted.
The MDA considers the initial operational tests, evaluation, and live fire
test in the Full Rate Production Decision Review. A favorable review authorizes the
program to be transferred into Full Rate Production and Deployment.
56 Cochrane, “Introduction to Defense Acquisition Management,” 55.
57 DoD, DoDI 5000.2, para. 3.8.3.1.

44
During the Full Rate Production and Deployment phase, the system is
produced and delivered to units for operational use. The PM must ensure that the system
is produced and deployed at an economical rate in accordance with the user’s needs.
Operation and Support begins as soon as the first systems are deployed. The Production
and Deployment phase therefore overlaps the Operation and Support phase.
3. Operation and Support (O&S): Sustainment and Disposal
The most important goal of a successful strategy is to ensure that fielded systems
are supportable. There are two main approaches to the O&S Phase: System Engineering
(SE) (which includes all technical activity), and Performance Based Logistics (PBL) –
(purchase of support as an integrated, affordable performance package).58
Weapon system costs and performance in the O&S phase is the ultimate measure
of the success of the acquisition program. Measurement of outcomes is possible within
the Total Life Cycle Systems Management (TLCSM). To meet that objective, TLCSM
utilizes single point accountability tools and Performance Based Logistic.
During the O&S phase, full operational capability of the weapon system is
achieved. Each element of logistics support is assessed, and operational readiness is also
evaluated. These two concerns, logistics and readiness, dominate the O&S Phase. This
phase is also divided in two main elements: Sustainment and Disposal.
a. Sustainment
Effective Sustainment begins with the design and development of a
maintainable and reliable system, made possible by application of the system engineering
methodology. Sustainment includes:
• Supply
• Maintenance
• Transportation
• Sustaining engineering
• Data management
• Configuration management
58 USAF, “AFI 63-101,” para. 6.5.

45
• Manpower and personnel
• Training
• Habitability and survivability
• Environmental concerns
• Safety
• Occupational health
• Protection of critical program information and information technology.
During this phase, weapon systems modifications are possible. They are
done on a requirements basis, to improve systems performance and reduce ownership
costs. System improvement programs are therefore initiated as a result of experience with
the fielded system and may lead to life extension.
b. Disposal
Disposal of the fielded weapon system takes place at the end of useful life.
The PM plans the disposal activities during the operational life. The PM is also
accountable for minimizing the DoD’s exposure to environmental safety, security, and
health issues. The environmental safety is very important due to two reasons. First, most
modern weapon systems may pose harm to the environment and influence it for many
years. Second, the disposal very often must meet the requirements of international treaties
or other legal considerations which would require intensive management of the system
disposal.
B. TOTAL LIFE CYCLE SYSTEM MANAGEMENT (TLCSM)
“Total Life Cycle System Management is the implementation, management, and
oversight by the Program Manager, of all activities associated with the acquisition,
development, production, fielding, sustainment and disposal of a DoD weapon or
material systems across its life cycle.”59 The PM is responsible and accountable for the
accomplishment of program objectives throughout the life cycle. TLCSM mandates
major system development decisions regarding operational effectiveness and logistic
affordability. TLCSM includes the following elements:
59 Defense Acquisition University, “Defense Acquisition Guidebook” (2004), para. 5.1.1.
http://akss.dau.mil/dag/DoD5000.asp?view=document (accessed April 17, 2006).

46
• Single point of accountability (Program Manager)
• Evolutionary acquisition strategies
• Life Cycle Logistics (LCL) in the system engineering process
• Supportability as a major element of performance
• Reducing logistic footprint through increased reliability
• Performance based logistic strategies
• Sustainment strategy reviews.60
Under the TLCSM, Life-Cycle Logistics (LCL) is a major consideration during
acquisition of the weapon system and its operational life cycle. LCL should ensure that
supportability requirements are understood and consistent with costs, performance, and
schedule through the entire life cycle of the weapon system.
Within LCL, Performance Based Logistics is the DoD’s preferred approach to
system support. The second dimension of the LCL is System Engineering (SE). SE must
ensure that supportability requirements are met during the design, development, and
sustainment of the weapon system (Figure 13).
1. System Engineering (SE)
The SE processes are system solutions. A major objective is to balance
performance, risk, costs, and schedule outcomes.
SE plays an important role in the DoD’s Acquisition Process. It is applied
throughout the process from capability needs to an operational system. Accordingly, SE
is applied very early in the concept definition and it is present through the entire life
cycle.
60 Defense Acquisition University, “Defense Acquisition Guidebook” (2004), para. 4.1.3.

47
Figure 13. Conceptual Framework for the Total Life Cycle System Management
(From: Defense Acquisition University, “Defense Acquisition Guidebook” (2004) para. 5.5.1.).
System Engineering provides a menu of processes which help coordinate and
integrate activities throughout the life cycle. The main SE tool is the technical
framework, which facilitates decision making by achieving balance between
performance, cost, schedule, and risk. Successful implementation of SE will result in a
total system solution which has the following characteristics:
• Responsive to changing technical, production, operating environment
• Adaptive to needs of the users
• Balanced among requirements, design consideration, constraints, and program budgets.61
61 DAU, “Defense Acquisition Guidebook,” para. 4.1.1.
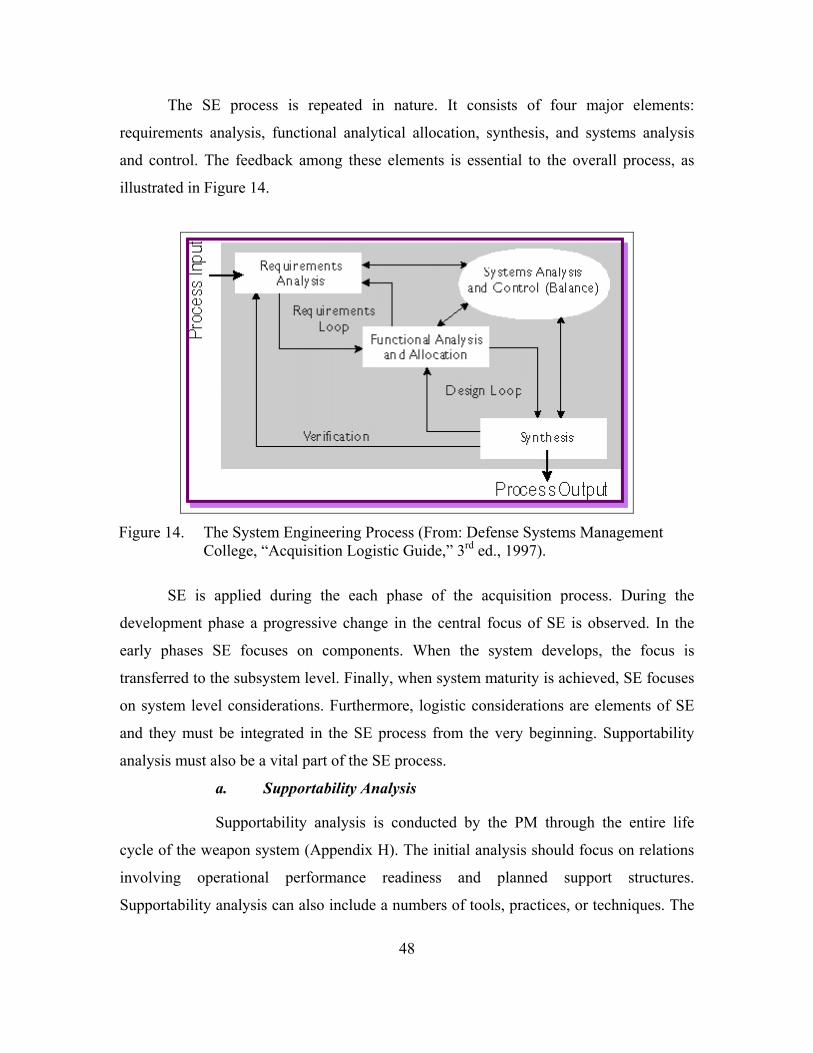
48
The SE process is repeated in nature. It consists of four major elements:
requirements analysis, functional analytical allocation, synthesis, and systems analysis
and control. The feedback among these elements is essential to the overall process, as
illustrated in Figure 14.
Figure 14. The System Engineering Process (From: Defense Systems Management
College, “Acquisition Logistic Guide,” 3rd ed., 1997).
SE is applied during the each phase of the acquisition process. During the
development phase a progressive change in the central focus of SE is observed. In the
early phases SE focuses on components. When the system develops, the focus is
transferred to the subsystem level. Finally, when system maturity is achieved, SE focuses
on system level considerations. Furthermore, logistic considerations are elements of SE
and they must be integrated in the SE process from the very beginning. Supportability
analysis must also be a vital part of the SE process.
a. Supportability Analysis
Supportability analysis is conducted by the PM through the entire life
cycle of the weapon system (Appendix H). The initial analysis should focus on relations
involving operational performance readiness and planned support structures.
Supportability analysis can also include a numbers of tools, practices, or techniques. The

49
results constitute the framework for design requirements regarding performance and
logistics. The PM is responsible for the decisions either to continue a program or modify
it based on supportability analysis. The Total Ownership Cost (TOC) plays a major role
in the overall selection process. Support concepts for all systems provide cost effective,
total lifecycle logistic support.62 When considering alternative systems, the PM may use
the following criteria:
• Life-cycle cost
• Diagnostic characteristics
• Energy characteristics
• Battle damage repair characteristics
• Transportability characteristics
• Facilities requirements.63
Supportability factors are also important elements of supportability
analysis, and are integral to the program performance specification. The following items
may be used when considering supportability issues:
• Operation and maintenance personnel constraints
• Personnel skill level constraints
• Life-cycle and O&S cost constraints
• Target percentages of systems failures correctable at each maintenance level
• Mean down time in the operational environment
• Turn-around time in the operational environment
• Standardization and interoperability requirements
• Built-infault isolation capability
• Transportability requirements.64
62 DAU, “Defense Acquisition Guidebook,” 2004, para. 4.4.9.2.
63 Defense Systems Management College, “Acquisition Logistic Guide,” 3rd ed., 1997, para. 8.5.1. http://www.dau.mil/pubs/pdf/alg1.pdf (accessed May 4, 2006).
64 DSMC, ”Acquisition Logistic Guide,” para. 8.5.1.1.

50
b. Reliability, Maintainability, and Availability (R,M&A)
R,M&A issues must be considered from the very beginning of the
lifecycle of the weapon system. They must meet operational requirements and contribute
to the reduction of TOC.
(1) Reliability. It is the probability that weapon system will
perform its functions in a satisfactory manner for a specific period of time, or during the
duration of a mission under stated conditions. Reliability function may be expressed by
the quotation:
( ) ( )tFtR −=1 ,
where F(t) is the probability that system will fail by time t.65
The failure rate is defined as a number of failures per measure of
unit life.
MTBFrateFailure 1_ = ,
where MTBF is Mean Time Between Failures.
Additionally we can distinguish two components of reliability:
• Mission Reliability is the probability that the weapon system will perform functions essential to accomplish a mission, under a certain period of time and under stated conditions.
• Logistic Reliability is the probability that no corrective maintenance will be performed until completing the scheduled mission profile.
(2) Maintainability. Maintainability is the probability that the
weapon system will be retained in, or restored to an operational condition in a certain
period of time if the prescribed procedures and resources are used. Maintainability is the
characteristic of a weapon system which has been already fielded. It also indicates the
maintenance required to keep that system in operational status. This characteristic is
measured by Mean Time to Repair. A mathematic statement of that characteristic is
expressed by the Mean Corrective Maintenance Time equation:
65 Benjamin S. Blanchard, Logistic Engineering and Management, 6th ed. (Upper Saddle River, NJ: Pearson
Prentice Hall, 2004), 47.

51
n
MctctM
n
ii∑
== 1
where Mcti is total active corrective maintenance cycle time for each maintenance action,
and n is the sample size.
Maintainability is one of the factors which determine life cycle
costs. Maintenance costs are affected by the decisions made during the early stages of the
weapon system life cycle. Considering maintenance cost, the following criteria may be
applied when developing a weapon system:
• Cost per maintenance action ($/MA)
• Maintenance cost per system operating hour ($/OH)
• Maintenance cost per month ($/month)
• Maintenance cost per mission or mission segment ($/mission)
• The ratio of maintenance cost to total life cycle cost.66
(3) Availability. Availability is defined as a probability that a
weapon system is in operable state at a beginning of the mission when the mission is
called at a random point in time. That parameter reflects the readiness of the system. 67 It
is expressed by quotation:
Down timeUp timeUp timetyAvailabili+
=
Availability should be measured accordingly to the specific
mission. The Operational Availability (Ao) is a very important indicator of system
readiness. Ao is expressed by the following mathematical relationship:
MLDTMMTMTBMMTBMAo ++
=
where
66 Blanchard, Logistic Engineering and Management, 72.
67 DSMC, ”Acquisition Logistic Guide,” para. 10.3.2.5.

52
• MTBM – Mean Time Between Maintenance – mean operating time plus mean standby time in operational conditions
• MMT – Mean Maintenance Time – includes mean time for corrective and preventive actions
• MLDT – Mean Logistics Down Time – combination of the logistics delays plus administrative delays
c. Achieving Affordable System Operational Effectiveness (SOE)
The SOE concept explores relationships between system performance,
availability, process efficiency, and life cycle cost. That matrix provides the context for
the PM to make “trades”. The SOE requires involvement of every organization and
individual engaged in the management of the weapon system. The SOE approach may be
applied during the development of the new system as well as to modernization of a
fielded system. The SOE concept is composed of the following elements (Figure 15):
• System Performance – designed system capabilities and functions
• Technical Effectiveness – a balance between system performance and system availability.
• System Availability – includes reliability, maintainability, supportability (discussed above), and productivity. Productivity is the degree to which the design of the weapon system facilitates timely, affordable, and high quality manufacture, assembly and delivery of the weapon system.
• Process Efficiency – reflects how well the system may be produced, operated, and maintained.68 It also reflects the degree to which the logistic infrastructure and footprint have been reduced to ensure an agile, deployable, and operationally effective system.
68 DAU, “Defense Acquisition Guidebook,” para. 5.2.2.

53
Figure 15. Affordable System Operational Effectiveness (From: DAU, “Defense
Acquisition Guidebook” (2004) paragraph 5.2.2).
2. Performance Based Logistics (PBL)
Performance Based Logistics is the DoD’s approach to product support
implementation.
[The] PM shall develop and implement performance based logistics strategies that optimize total system availability while minimizing cost and logistic footprint. Sustainment strategies shall include the best use of public and private sector capabilities through government/industry partnering initiative, in accordance with statutory requirements.69
PBL uses performance based acquisition strategies which are developed, refined
and implemented during the acquisition program or as a result of assessment support
alternatives in a fielded system. The essence of PBL is to buy performance, unlike the
traditional approach of buying individual parts and repair actions. PBL does not favor
either commercial or governmental providers. The decision is based upon best value
69 DoD, DoDI 5000.1, Enclosure 1.17.

54
determinations, the best mix of public and private capabilities and strategies,
infrastructures, skills, and performance to meet weapon system requirements. This is the
main objective of PBL and changes the approach to logistics: the PM does not tell
provider how to do it but the PM will tell what he/she wants.70 That approach allows the
best private business practices to enter the public sector.
Buying performance outcomes is common to every PBL practice, in theory.
However, to meet specific requirements, PBL must be tailored to the final product which
is ready to be fielded. Application of PBL to, for example, Fighter Aircraft and Armed
Fighting Vehicles may look similar in concept, but will be completely different in
application. That is why the application of PBL to fielded systems may have a variety of
shapes and forms.
Because PBL is defined as a strategy for buying performance, it is important to
set metrics to measure that performance. These allow the PM to select the component to
buy with the highest value for the weapon system. In order to establish metrics, the PM
must work with the users, who have potential capability to define requirements of the
weapon system. By establishing accurate requirements, PBL has a higher probability to
be implemented in the most efficient way.
70 Defense Acquisition University, “Performance Based Logistics: Program Managers Product Support Guide,”
(Fort Belvoir, VA: Defense Acquisition University Press, 2005), para. 2.2., http://handle.dtic.mil/100.2/ADA435149 (accessed March 26, 2006).

55
Figure 16. Spectrum of PBL Strategies. (From: Acquisition Community Connection,
PBL Toolkit – Allocate Work, https://acc.dau.mil/simplify/ev_en.php?ID=29846_201&ID2=DO_TOPIC).
The top five PBL top-level metric objectives are defined in the Under Secretary of
Defense Memorandum:71
• Operational Availability – the percent of time a weapon system is available for a mission
• Operational Reliability – a weapon system reliability measurement to meet mission’s needs and objectives (objectives may by sortie, launch, destination, et cetera. Cost Per Unit Usage – total operating cost divided by unit performance measurement for a given weapon system
• Logistic Footprint – government or contractor presence while deploying the weapon system. It includes inventory, equipment, facilities, personnel, real estate, transportation, and others Logistic Response Time – elapsed time for the logistics system after demand signal has been received.
Recent examples of PBL implementation in already fielded systems show that
PBL is an effective technique to optimize total system supportability (see Appendix I).
71 DAU, “Performance Based Logistics,” para 2.2.

56
C. CONCLUSION
The decision to acquire and field a modern weapon system is multidimensional. It
will determine military capability; it is always connected with the problems of resource
allocation and making trade-off decisions while the system is developed. That is why
Total Life Cycle System Management is essential – from the decision to create
requirements to removal from service. TLCSM begins when the requirements are
approved. It continues through the Concept & Technology Development phase, System
Development & Demonstration phase, Production & Deployment phase, and Operation &
Support phase. During these phases, the appropriate management of the costs of the
weapon system will result in the most affordable Total Ownership Cost. Failure in
TLCSM will result in TOC increase (and decrease in affordability). To better understand
that concept, our next chapter will focus on TOC - emphasizing the O&S cost which
consists of 78 percent of overall TOC.

57
IV. OPERATING AND SUPPORT (O&S) COSTS
Typically, the primary concern for countries acquiring a new weapon system from
arms exporters is the initial acquisition cost. Not enough attention is given to all Life
Cycle Costs (LCC) in general, and to Operating and Support (O&S) costs in particular.
The United States handled its own defense acquisition process in this way before the
1980s. The subject of estimating O&S costs gained the attention of government officials
and lawmakers during the 1980’s when they realized that “roughly half of the budget for
the DoD pays for annual O&S costs.”72
As mentioned in the preceding chapter, the most important element of a
successful strategy to contain O&S costs is ensuring that fielded systems are supportable.
Reducing O&S costs is as important as reducing acquisition costs. This chapter provides
a brief overview of how to assess O&S costs by means of Life-Cycle Cost Analysis
(LCCA). It also summarizes the foundational literature used in this research to establish a
Cost Estimating Relationship (CER) for LCC and O&S. In addition, methods and
outcomes from previous research regarding O&S are presented.
A. LIFE-CYCLE COST / TOTAL OWNERSHIP COST
Life-Cycle Costs (LCC) and Total Ownership Cost (TOC) constitute the main
concepts used by DoD for reliability and maintenance for complex weapon systems in
defense. DoD Directive 5000.1, The Defense Acquisition System and DoD Instruction
5000.2, Operation of the Defense Acquisition System (further referred as DoD 5000.2),
make reference to these concepts. A basic attribute of a fighter aircraft is the ability to
provide high performance over a long service life but with significant periods of
downtime and high costs maintenance.
The Defense Acquisition Guide defines LCC and TOC; it mentions that they “are
similar in concept, but significantly different in scope and intent.”73 The LCC of a
72 Congress of the United States, “Operation and Support Costs for the Department of Defense” (Washington D.C.:
Congressional Budget Office, July 1988), http://ftp.cbo.gov/ftpdoc.cfm?index=5542&type=1 (accessed March 20, 2006).
73 DAU, “Defense Acquisition Guide,” para. 3.1.1.

58
defense program includes Research and Development (R&D) costs, Investment costs,
Operating and Support (O&S) costs and Disposal costs over the entire life-cycle. In
addition to cost elements included in LCC, TOC consists of other costs associated with,
for example, infrastructure and business processes that are not necessarily attributable to
the weapon system program. Thus, LCC and TOC concepts are similar, but TOC is more
comprehensive than LCC.
Figure 17. Program Life Cycle (Illustrative) (From: Office of the Secretary of Defense,
Cost Analysis Improvement Group, “Operating and Support Cost-Estimating Guide” (May 1992)).
In condensed form, LCC includes the acquisition and ownership costs. Seldom
affirms that “ownership costs – those of operation and support or maintenance - have
frequently far exceeded procurement costs.”74 This fact has been proven by much
empirical data. For instance, Table 1 provides a breakout of the costs incurred during the
key program phases for two different weapon systems: a fighter aircraft (F-16) and a
fighting vehicle (M-2).
74 Robert M. Seldon, Life Cycle Costing: A Better Method of Government Procurement, (Boulder, CO: Westview
Press, 1979), 1.
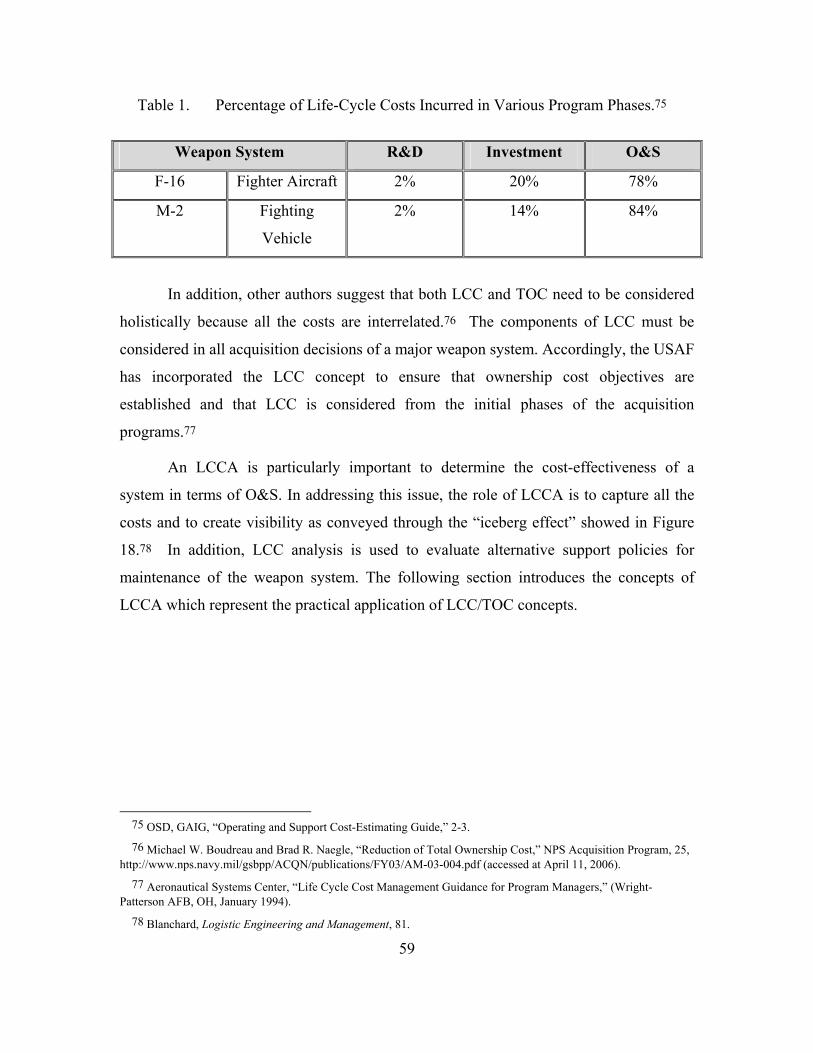
59
Table 1. Percentage of Life-Cycle Costs Incurred in Various Program Phases.75
Weapon System R&D Investment O&S
F-16 Fighter Aircraft 2% 20% 78%
M-2 Fighting
Vehicle
2% 14% 84%
In addition, other authors suggest that both LCC and TOC need to be considered
holistically because all the costs are interrelated.76 The components of LCC must be
considered in all acquisition decisions of a major weapon system. Accordingly, the USAF
has incorporated the LCC concept to ensure that ownership cost objectives are
established and that LCC is considered from the initial phases of the acquisition
programs.77
An LCCA is particularly important to determine the cost-effectiveness of a
system in terms of O&S. In addressing this issue, the role of LCCA is to capture all the
costs and to create visibility as conveyed through the “iceberg effect” showed in Figure
18.78 In addition, LCC analysis is used to evaluate alternative support policies for
maintenance of the weapon system. The following section introduces the concepts of
LCCA which represent the practical application of LCC/TOC concepts.
75 OSD, GAIG, “Operating and Support Cost-Estimating Guide,” 2-3.
76 Michael W. Boudreau and Brad R. Naegle, “Reduction of Total Ownership Cost,” NPS Acquisition Program, 25, http://www.nps.navy.mil/gsbpp/ACQN/publications/FY03/AM-03-004.pdf (accessed at April 11, 2006).
77 Aeronautical Systems Center, “Life Cycle Cost Management Guidance for Program Managers,” (Wright-Patterson AFB, OH, January 1994).
78 Blanchard, Logistic Engineering and Management, 81.

60
Figure 18. Total Visibility Cost (From: Blanchard, Logistic Engineering and
Management, 81).
1. Life Cycle Cost Analysis (LCCA)
The LCCA is a sequence of analytical steps for evaluating alternative designs in
terms of life-cycle costs. Blanchard presents an extended life-cycle cost analysis.79 Based
on his model, an LCC cost estimate generally involves the use of a three-step procedure.
In the first phase, the relevant categories of costs are identified. During the second step, a
Cost Estimating Relationship (CER) is derived. Finally, the necessary data are collected
from reliable databases and adjusted for inflation and other factors. The same steps
should be followed in assessing the O&S costs, a component of LCC.
a. Cost Breakdown Structure
In the first step, the cost analyst should develop a Cost Breakdown
Structure (CBS). In other words, costs may be broken down into logical, definite
79 Blanchard, Logistic Engineering and Management, 465.

61
subdivisions, considering the functional activity area or the major elements of the system.
According to Blanchard,80 the CBS ought to exhibit the following basic characteristics:
• all costs should be considered and identified in the Cost Breakdown Structure
• all cost categories should be well defined; there should not be any doubling or omissions
• the cost structure and categories should be coded in such a manner to allow for in-depth analysis of certain areas of interest while covering other areas with gross estimates
• the CBS should be directly compatible with the Work Breakdown Structure (WBS)81 and with management accounting procedures used in collecting costs
• the cost structure should allow for the identification of specific work packages that require close monitoring
In developing a CBS one could follow two approaches: top-down or
bottom-up. The top-down approach is employed with the purpose of determining the
initial allocation of cost as a Design-to-Cost (DTC) requirement. The second technique,
bottom-up, which will be used in our project, implies successive collection and
summarizing of costs.
As previously mentioned, LCC is typically divided into four phases:
research and development, procurement, O&S, and disposal phase. This division is used
mainly for cost estimating purposes. The following descriptions provide a brief summary
of the costs associated with each life-cycle phase:
• Research and Development costs start with program initiation at the conceptual phase through the end of engineering and manufacturing development. R&D includes costs for feasibility studies, modeling, tradeoff analyses, engineering design, development, fabrication, assembly and test of prototype hardware and software, system test and evaluation, developing support equipment, and documentation
• Production or Procurement includes costs associated with producing or procuring the physical parts of the system, and costs associated with initial logistic support requirements (i.e., support equipment, training, data, initial spares, and facilities)
80 Blanchard, Logistic Engineering and Management, 467.
81 The concept of Work Breakdown Structure (WBS) will be developed later.

62
• Operation and support costs are incurred when systems are deployed and fielded. They include costs of sustaining operation, personnel and maintenance, consumable and reparable parts, and system modification
• Retirement and Phase-out costs are associated with deactivating or disposing of a materiel system at the end of its useful life. Disposing of a materiel system can result in additional costs or a salvage value. These costs are normally insignificant compared to the total LCC. In some cases, disposal cost may be avoided by making the system available for sale
Program phases overlap considerably; in particular, R&D may not be
completed before procurement begins. Cost is a major consideration of system
management and must be addressed in making decisions during all life-cycle phases.
Having generated a CBS, the next step is to estimate the costs of each category. The
paragraphs below summarize the key features of the three estimating techniques used in
LCC assessments.
Undoubtedly, several aspects of TOC are not controlled or even
influenced by acquisition managers. For that reason, program cost estimates are normally
focused on life-cycle cost or its elements. Situations where cost estimates support the
acquisition system include affordability assessments, analyses of alternatives, cost-
performance trades, and establishment of program cost goals. In addition, more refined
and discrete life-cycle cost estimates are used within the program office to support
internal decision-making such as evaluations of engineering changes or competitive
source selections. The following section presents relevant definitions of costs and
summarizes the key features of the estimating techniques used in LCC assessments.
The taxonomy of costs comprises different categories of costs. The
definitions of costs provided below will serve to illustrate the concept of LCC and may
help in LCCA. During LCCA, the analyst’s objective is to capture all costs and to create
desired visibility.
• First or Investment Cost - cost elements that do not recur after the system is acquired. They may include design and development costs, test and evaluation costs, unit purchase price, and installation and training costs. In some instances, these first costs are very high, exceeding the capabilities of the buyer.

63
• Fixed Cost - cost elements that are independent of variations in the level of operational activity; that is, are not related to the amount of system usage. Depreciation, maintenance, insurance, interest on invested capital, research, and part of administrative expenses are good examples of such costs. Fixed costs are usually difficult to change in the short run.
• Variable Cost – a group of costs which are related in some way to the level of operational activity. These costs are normally associated with direct labor and material, fuel, energy, and so on; they may include direct and indirect costs.
• Direct Cost - the cost elements most easily perceived. They are a direct result of system utilization. Taking an airplane as an example, the costs of fuel and the salary of mission personnel would be direct costs of the flying activity.
• Indirect Cost - generally, these costs are difficult to evaluate, because they are not directly related to the operation of the system. Looking at the previous example, expenses with tires and maintenance personnel would be indirect costs.
• Sunk or Past Cost – a group of costs that were already incurred in the past and cannot be altered by any future action. Although they may be significant in some circumstances, they should influence the decision making process only to the extent that they may serve as a basis for predictions.
Given the categories of cost, it is appropriate to estimate all applicable
costs for each of the categories in the CBS and for each year of the life-cycle.82
2. Estimating Methods of Costs
The Society of Cost Estimating and Analysis (SCEA) provides the following
definition of cost estimating: “The art of approximating the probable cost or value of
something based on information available at the time.”83
As summarized in the “AoA Handbook”,84 there are both formal and informal
methodologies available to the analyst to estimate cost. There are three primary formal
82 Blanchard, Logistic Engineering and Management, 81.
83 Society of Cost Estimating and Analysis, “Glossary,” http://www.sceaonline.org/prof_dev/glossary-c.cfm (accessed April 13, 2006).
84 Air Force Materiel Command, Analysis Handbook, A Guide for Performing an Analysis of Alternatives (AoA) (Kirtland AFB, NM: Office of Aerospace Studies, February 2002), http://www.oas.kirtland.af.mil/AoAHandbook/index.html (accessed April 14, 2006).

64
approaches as follows: (a) the parametric estimating technique, (b) engineering build-up
(bottom-up or grass roots), and (c) the analogy technique. The description and limitations
of each technique is discussed below.
a. Parametric Method
The parametric method consists of one or more Cost Estimating Relationships
(CERs) to develop projections of weapons costs using simple mathematical equations and
logic. Developing CERS will be discussed in detail in a separate section of this chapter.
A CER is an equation that relates one or more characteristics of a system to some element
of its cost, where cost is related to one or more variables (i.e. volume, weight, or power).
Since CERs are based on actual program cost history, they reflect the impacts of system
growth, schedule changes, and engineering changes.
The technique is used to measure and/or to estimate the cost associated
with the development, manufacture, or modification of a specified end item and the
measurement is based on the technical, physical, or other end item characteristics. This
method is often used for training, data, peculiar support equipment, and systems
engineering and program management. Factors and ratios allow the estimator to capture a
large part of an estimate with limited descriptions of both: the historical database used to
develop the factor and the program to be estimated. The use of a factor or ratio relating
the cost of one entity to another is considered a form of parametric estimating (i.e.
training and development costs might be estimated as 20% of production costs).
Given the nature of the method, it appears appropriate at the early stages
of a program, when there is limited program information and technical definition. Less
visibility might be seen as main limitation, especially when costs are captured at a very
high level.
b. Engineering Build-Up Approach
The engineering build-up approach is performed at a detailed level of the WBS.
According to this technique, cost can be estimated for basic tasks (such as engineering
design, tooling, fabrication of parts, manufacturing engineering, and quality control), but
also for materials.

65
Engineering estimation produces detailed “bottom-up” estimates. The
objective is to determine as accurately as possible all of the actions that occur in the “real
world,” which usually involves breaking the system into sub-components, each cost
being estimated separately.85
Among disadvantages of this approach, the following are the most
important: it is time-consuming, as the modeled processes must be well understood, and
it requires detailed, accurate data.
c. Analogy Method
The analogy method uses actual costs from a similar program and adjusts
for the new program's complexity and technical or physical differences to derive the
estimate.
This method is normally used early in a program cycle when there is
insufficient actual cost data to use as a basis for a detailed approach. Engineering
assessments are at the core of the approach, as they are necessary to ensure the best
analogy has been selected and proper adjustments are made. On the other hand, they can
also be a limiting factor.
Thus, the analogy estimation is widely used as it avoids the weaknesses of
the CERs. Historical databases available through the Visibility and Management of
Support Costs (VAMOSC) system may be used to identify the operating costs of weapon
systems. It also relies heavily on informal approaches that can be used when formal
techniques are not practical, such as experts’ opinions.86
A fourth technique, extrapolation from actual costs, is described by the
DoD 5000.2. The actual cost method uses cost experience or trends (from prototypes,
engineering development models, and/or early production items) to project estimates of
85 OSD, “Operating and Support Cost-Estimating Guide,” 3-11.
86 Ibid.

66
future costs for the same system. A key possible mistake to be avoided is using contract
prices, which are associated with profitable ventures, as a substitute for actual cost
experience.87
3. Developing Cost Estimating Relationships (CER’s)
A short but comprehensive definition of Cost Estimating Relationships (CERs) is
offered by “Parametric Cost Estimating Handbook”. Thus, CERs are “mathematical
expressions relating cost as the dependent variable to one or more independent cost
driving variables.”88
CERs are the key tool used in all phases involved by estimating program costs.
Thus, CERs can be used as the primary basis for an estimate during the validation phase
(because there is insufficient system definition to use anything else), or in later phases of
estimating as a cross check of another estimating procedure. Once valid CERs have been
developed, then parametric cost modeling can proceed.
Given the above, proper CER development and application rely heavily upon
mastering certain mathematical and statistical techniques. They also rely on estimating,
meaning that probability plays a crucial role in predicting the actual cost of the project.
Sound statistical concepts and techniques constitute the basis of the development of any
valid CER.
DoDI 5000.2 mentions that system definition typically includes Work Breakdown
Structure (WBS) defined as a “hierarchy of product-oriented elements – hardware,
software, data and services – that collectively comprise the system to be developed or
produced.”89 The WBS provides the framework for a series of activities that cover all the
steps involved by the program – from program planning to status reporting, including
cost estimating, resource allocation, performance measurement, and technical assessment.
87 DoD, DoDI 5000.2, art. 3.7.3.
88 Parametric Estimating Initiative Steering Committee, “Parametric Cost Estimating Handbook,” Bill Brundick eds., 38, http://www1.jsc.nasa.gov/bu2/PCEHHTML/pceh.htm (accessed February 20, 2006).
89 DoD, DoDI 5000,2, art. 3.7.1.

67
As observed in the “Parametric Cost Estimating Handbook,” consistency in
system engineering and project management is directly correlated with the accuracy of
each of the WBS elements and cost estimating capability on the one hand, and (even
more important), with the resulting cost model on the other hand.
The usefulness of a CER is dependent upon the soundness of the database from
which it is developed and the appropriateness of the CER to what is to be estimated.
While assembling the database is especially important, it is a difficult and time-
consuming activity. The lack of appropriate databases is a primary cause for there being
only a small number of valid CERs. There is no agreement among specialists regarding
the primacy of either the development of a good database or hypothesizing what the CER
should be. In either case, the analyst must accomplish a series of activities.
First, the analyst hypothesizes a series of logical estimating relationships, which
may be linear or curvilinear. The second activity consists of assembling a database: as
noted, the data problem is fundamental. Considerable time and effort is dedicated to
collecting data, adjusting that data to ensure consistency and comparability, and
providing for proper storage of information so that it can be rapidly retrieved when
needed.
In any case, developing an estimating relationship involves discussions with
engineers to identify potential cost driving variables, scrutiny of the technical and cost
proposals, and identification of key cost relationships.
Once the database is developed and hypothesis is determined and tested, the next
activity to be accomplished by the analyst is to mathematically model the CER using
linear and curvilinear forms, such as the graphical method and the Least Squares Best Fit
(LSBF) or the linear regression model method, all of which are provided by many
statistical PC packages.
In addition, application of the CER is necessary to forecast future costs or to cross
check an estimate done with another technique. In this respect, it is important to observe
the difference between using either generic CERs or CERs which have been built for a

68
specific forecast. Obviously, the second category may be used with far more confidence
than the first one. However, each type has both strengths and weaknesses.
The following strengths of the CERs are the most cited in the literature: a) they
are quick and easy to use, being based on an equation and the required input data; b)
CERs can be used with limited system information, and thus are especially useful in the
R&D phase; c) a CER is a statistically sound predictor, if derived from a sound database,
so that it is a reliable indicator of further estimates.
The following are among the major weaknesses of the CERs. First, they are
sometimes too simplistic to forecast costs; if available, another estimating approach
should be selected. Second, database-related problems may impact negatively on the
applicability of a particular CER. In this respect, the user has the responsibility to validate
the purpose of the CER estimates, the quality of data used, and how they were
normalized.
The modeling uncertainties translate into “risk” of producing an unrealistic cost
estimate within a given percentage of the actual project cost. Such uncertainties can be
grouped into two major categories, which are described below.
The first category of risk refers to the uncertainty of any organization to perform
as planned due to unexpected resource or scheduling delays in the scope of effort to
produce the design, prototype, or product. Given the causes attached, this sort of
uncertainty can be controlled through specifications in the scope of work agreed between
the customer and contractor, which would result in a decrease in the amount of contract
and engineering change proposals (CCE/ECPs) and unnecessary rework.
The second category refers to uncertainty associated with the development and
thus usefulness of any cost model, which includes: a) uncertainty associated with
omission of a key cost driver; b) misspecification of the form of the model equation; c)
modeling limitations associated with a lack of data to validate the cost model, and, d)
lack of data consistency across multiple project databases.
In order to reduce the risks above, appropriate measures can be used to keep
uncertainty within reasonable limits. For instance, uncertainty associated with omission

69
of key cost drivers is addressed through development of historical cost data by product
line, defined as WBS, and systematic understanding of the types of costs associated with
development, prototype, and production programs. The avoidance of the misspecification
of the model equation requires careful review of in-house and available industry data, in
order to establish the basis of the model. The use of additional relevant data would reduce
the uncertainties attached to the third modeling limitations. In this respect, as the
literature emphasizes, cost modeling of a new technological or programmatic area usually
involves lack of data. Fourthly, risks associated to data consistency can be diminished by
using WBS cost elements which are standardized across projects.90
In conclusion, knowledgeable use of Life-Cycle Cost can be crucial in assuring
affordability of fielded systems. The challenge to the acquisition logistician is to
implement these concepts actively and aggressively through participation in the various
Integrated Process Teams (IPTs). One task for the lead acquisition logistics manager is to
provide support for the O&S cost estimate, the largest component of LCC.
B. OPERATING & SUPPORT (O&S) COSTS
O&S costs have a double role in conducting the life cycle management of a
weapon system. First, O&S costs represent a major part of the LCC, and are therefore
important in assessing affordability. Second, as a RAND study explicitly mentions,
“O&S costs reflect the commitment of a military establishment to readiness.”91 O&S cost
information could support a design-to-cost program and management reviews during the
first two phases of life cycle, assist in choosing between alternate systems, and support
budget estimates. Therefore, O&S cost estimates have taken on greater importance in
acquisition decisions and in resource planning.
O&S costs have a number of distinctive characteristics that single them out from
other factors of LCC. O&S costs occur annually, over a long time-span. Therefore, cost
analysts have to predict trends for different types of costs such as personnel or material
costs. This endeavor is particularly difficult in today’s context and it makes the O&S
90 PEISCP, “Parametric Cost Estimating Handbook,” 35-37.
91 Gregory G. Hildebrandt and Man-bing Sze, An Estimation of USAF Aircraft Operating and Support Cost Relations, (Santa Monica, CA: The RAND Corporation, May 1990), 1.

70
estimates more sensitive to assumptions than other types. The next sections will present
some of the complexities of O&S estimating, O&S cost breakdown structure, and O&S
cost drivers.
1. O&S Cost Breakdown Structure
Stewart points out that because weapon systems must often serve a long lifetime
and because the maintenance, operation, and repair of many weapon systems exceed their
initial acquisition costs, the DoD put a considerable emphasis on analysis and exposure of
LCC.92
O&S costs are those incurred for peacetime operations and maintenance of a
system throughout its life cycle. O&S costs comprise expenses with fuel, lubricants, and
repair parts and their related maintenance, plus the costs associated with modifications.
For a typical weapon system O&S costs represent 70% or more of the system LCC.93
Figure 19 illustrates a typical distribution of LCC.
92 Rodney D. Stewart, Cost Estimating, 2nd ed. (New York: John Wiley and Sons, 1991), 201-202.
93 United States General Accounting Office, “Air Force Operating and Support Costs Reductions Need Higher Priority,” (Washington D.C.: National Security and International Affairs Division, August 2000), http://www.gao.gov/archive/2000/ns00165.pdf (accessed March 26, 2006).

71
Figure 19. Nominal Life-Cycle Cost of Typical 1980 DoD Acquisition Program (From:
United States General Accounting Office, “Air Force Operating and Support Cost Reductions Need Higher Priority,” (August 2000)).
While DoD Handbook 881 provides a common framework for procurement cost
estimates, the Operating and Support Cost-Estimating Guide provides a standardized cost
element structure for O&S cost estimates. Regarding O&S costs, the 1992 version of the
Guide has seven major cost elements: mission personnel, unit-level consumption,
intermediate maintenance (external to unit), depot maintenance, contractor support,
sustaining support, and indirect support. A schematic representation of O&S cost
breakdown structure is presented in Figure 20.

72
Figure 20. O&S Cost Breakdown Structure.
A detailed Cost Breakdown Structure for an aircraft, as offered in the 1992
Operating and Support Cost-Estimating Guide, is presented in Appendix I. The new
version of the Operating and Support Cost-Estimating Guide (2002 draft) proposes a
generic O&S cost-estimating structure with six cost elements. The CBS is designed to
capture as many relevant costs as practical within the O&S phase and is essential to LCC
analysis.
2. O&S Cost Drivers
Since O&S costs typically exceed both development and investment costs over
the functional life of a system, the O&S costs are a primary concern in assessing the
TOC.
O&S cost estimating may be a difficult endeavor because the costs in this
category are affected by various considerations. In general, there are four major types of
factors which have to be considered: the systems technical characteristics, operating
OPERATION AND SUPPORT COSTS
MISSION PERSONNEL
UNIT-LEVEL CONSUMPTION
INTERMEDIATE
DEPOT MAINTENANCE
CONTRACTOR SUPPORT
SUSTAINING SUPPORT
INDIRECT SUPPORT

73
concept, maintenance concept, and relevant cost elements (cost drivers).94 The analyst
should determine the quantitative and qualitative influence of these factors on the system
being analyzed.
a. System Technical Characteristics
The analyst has to determine the system characteristics that impact O&S
costs, such as:
• design and physical parameters such as weight, size, design approach, and degree of modularity
• required performance characteristics such as reliability and maintainability, availability, redundancy levels, etc
• required interfaces with other systems, equipment, and support equipment
• required level of technology.
Since performance characteristics (reliability, maintainability) and
physical characteristics (size, weight, etc.) are strongly related to O&S costs, they are
generally used in the O&S cost estimation. For example, to forecast the frequency of
maintenance actions that will take place and to predict the duration of repair actions, the
cost analyst uses Mean-Time-between-Failure (MTBF) and Mean-Time-to-Recovery
(MTTR) measures of system reliability and maintainability, respectively.
b. Operating Concept
The operating concept is closely related to the system usage rate. An
increase or decrease in usage has a corresponding in O&S costs. The majority of O&S
cost elements vary linearly with usage. In the case of an aircraft, fuel, spare parts, and
maintenance and repair costs are directly related to the “op tempo” (operational tempo,
generally hours per aircraft per month). Knowing the op tempo, the analyst can properly
adjust historical data from analogous systems, or plan for irregular supplementary usage.
In addition, deployment concepts may affect everything from the replacement rate of
support equipment that needs to be replenished to numbers of unit personnel.
94 Federal Aviation Administration, Life Cycle Cost Estimating Handbook, para. 13.4.2, http://www.faa.gov/asd/ia-
or/lccehb.htm (accessed April 12, 2006).

74
c. Maintenance Concept
In the past, system technical requirements related to the accomplishment
of the mission. Items such as principal equipment and mission personnel were the
elements which got analysts’ attention. In newer practices, system maintenance has
gained more consideration because resources are diminishing, and there is a requirement
to extend the life cycle of operational systems. Therefore, as Blanchard points out, the
prime mission-oriented segments and support capability have to be considered on an
integrated basis. As a result, a maintenance concept must be developed to state how the
system is to be supported and what the effects are on design.95
The maintenance concept describes how the system will be maintained
and is documented in the maintenance plan, which details procedures and resources for
support of the system. In Blanchard’s view, the maintenance concept includes:
maintenance levels to be used with major functions accomplished at each level, repair
policies, organizational responsibilities, maintenance support elements, effectiveness
requirements, and environment.96
A major component of the maintenance concept definition is the structure
of maintenance levels to be used in support of the system. Maintenance, both corrective
and preventive, may be accomplished at the site where the system is used (organizational
maintenance), at specialized organizations (intermediate maintenance) and/or at a depot
or contractor’s facilities (depot level). For example, a hypothetical maintenance concept
is presented in Figure 21. The figure depicts the levels of maintenance and other
effectiveness factors such as MTBF and logistics flow times.
The number of levels of maintenance affects the O&S cost estimate. Moreover,
the type of maintenance resources required is important. In summary, the maintenance
concept has to be considered in both the design and costs estimating processes.
95 Blanchard, Logistic Engineering and Management, 139.
96 Ibid., 140 – 144.

75
Figure 21. Maintenance Concept (After: Blanchard, Logistic Engineering and
Management, 145).
d. Relevant Cost Elements
When developing an estimate, the greatest amount of effort should be
expended on those cost elements that account for a significant portion of total O&S costs,
can be affected by program decisions or assist in distinguishing among alternatives.
These are the cost drivers. In some cases, the term “cost driver” means a parameter or
characteristics that drive cost; but in the majority of cases, the “cost driver” represents the
parameter or characteristic with a large impact on cost. A cost driver is defined as “a
program, system characteristic, or parameter that has a direct or indirect effect of
changing cost.”97
97 DSMC, “Acquisition Logistics Guide,” art. 15.3.
60 days (Avg.)
TAT: 8 hr
TAT: 4 hr
1 hr (Avg.)
45 days (Avg.)
Intermediate maintenance
Performance of the mission
Organizational maintenance
Operational site MTBF: 2000 hr
min15:Mct
Operational profile
Operational profile
Operational profile
Operational site MTBF: 2500 hr
min20:Mct
Operational site MTBF: 2300 hr
min15:Mct
Intermediate Shop
Intermediate Shop
Depot/Contractor maintenance
Component supplier
(N suppliers)
Depot (1 facility)
90 days (Avg.)
Logistics pipeline (items requiring maintenance)
Replenishment Supply (spare/repair parts)
MTBF mean time between failures TAT: turnaround time
ctM : mean corrective maintenance time

76
O&S costs may be better managed by identifying their cost drivers. This is
because it facilitates finding avenues for cost reduction. Therefore it is essential to
identify and continuously monitor the cost drivers. The analyst can then lay out a CBS by
outlining the expected O&S cost elements. The next step is to estimate these cost
elements. The following section presents some of the particulars of the O&S cost
estimating process.
3. O&S Cost Estimating
O&S cost estimating is realized by applying one of the cost estimating methods
previously presented (analogy, parametric, engineering, or extrapolation from actual
costs). Most O&S analyses are accomplished using a combination of these estimating
techniques; secondary methods serve to cross-check the primary method employed.
Choosing which method(s) to use is the cost analyst’s decision, based on the requirement
for the cost analysis and what data are available.
Even though the same cost estimating methods are employed for the other
components of the LCC, O&S cost estimating has some unique aspects.98 In O&S
estimating, the analyst may well find the following:
• An O&S Cost Estimating Structure (CES) which differs substantially from the acquisition product oriented WBS
• Heavy reliance on predictive models which tie personnel and maintenance considerations together for long range estimates of costs
• Requirements for up to 40 years of projected operational use data to employ most models effectively99
• A necessity to consider system constraints extending beyond system hardware (i.e., maintenance personnel, spares pipeline time frame, etc.).
In general, O&S cost estimates are based on historical cost experience. A key
factor is therefore a reliable database to track O&S costs. Increased visibility of these
costs has become a requirement for DoD major systems since 1974 when the VAMOSC
system was established. To facilitate a better visibility of O&S costs, the Air Force
established the Air Force Total Ownership Cost (AFTOC) data system. AFTOC became
98 FAA, art. 13.4.
99 The O&S costs estimate period is typically based on the nominal service life of the system.
77
the primary tool to assist analysts in the management and control of LCC. The historical
data are also a major consideration in identifying the cost drivers, the topic of the
previous section.
In the last decades, cost analysts have deepened understanding of LCC/TOC.
Summarizing these studies, two senior DoD officials, involved in the acquisition process,
point out that “as modernization is deferred, weapons systems age and costs for
operations and support (O&S) increase.”100 In the new economic context, with relatively
flat budgets for defense, the higher O&S costs reduce the budgets for new, more reliable
systems based on new technologies. This will lead to increasing costs and decreasing
readiness, creating a vicious circle. For that reason, defense acquisitions policies have
recently focused on controlling and reducing TOC. DoD approaches toward this goal are
presented in the last part of this chapter.
C. APPROACHES TO REDUCTION OF TOC: CAIV AND R-TOC
The Cold War finished in the early 1990s and the Cold War arms race wound
down. As a result, there was a dramatic fall in defense acquisition budgets. DoD has
therefore implemented new strategies and rethought its acquisition processes.
Recognizing that the majority of costs are determined early in the program, DoD put into
practice Cost As an Independent Variable (CAIV). However, this initiative should not
imply that cost could not be influenced later on. In a memorandum from 1999 Dr.
Gansler urged services “to reduce the O&S of fielded systems (excluding manpower and
fuel) by 20 percents.”101 In accomplishing this goal, DoD has implemented several pilot
programs to minimize the cost of ownership in the context of a total system approach,
i.e., Reduction of Total Ownership Cost (R-TOC). These two new initiatives, CAIV and
R-TOC will be presented in the following sections.
100 Jay Mandelbaum and Spiros Pallas, “Reducing Total Ownership Cost in DoD. Increasing Affordability of DoD
Systems,” PM (July, 2001), 76.
101 Jacques S. Gansler, “Memorandum: Future Readiness,” (Washington D.C.: Office of the Secretary of Defense, May 10, 1999), http://ve.ida.org/rtoc/open/gansler051099.pdf (accessed April 26, 2006).

78
1. Cost as an Independent Variable (CAIV)
The budgetary constraints forced the acquisition system to perceive cost as an
independent variable; as a result cost has become as important as performance and has a
major influence in weapon system decisions. Previously collected data proved that the
best time to reduce costs is during initial acquisition or modification of the system.
CAIV is defined as “an acquisition strategy focusing on cost-performance trade-offs in
setting program goals.”102 Cost is first treated as a formal military requirement. The
tradeoff denotes an Analysis of Alternatives (AoA) which takes place in the pre-
acquisition phase to compare the estimates of costs, suitability, effectiveness, advantages,
and disadvantages of the various alternative systems.103
The CAIV concept is presented in detail by Dr. Benjamin Rush in an article in
Acquisition Review Quarterly. Dr. Rush defines CAIV as a “new DoD strategy that
makes total life-cycle cost as projected within the new acquisition environment a key
driver of system requirements, performance characteristics, and schedules.”104
Mentioning that the “life-cycle cost-performance/requirements tradeoff process is the
heart of CAIV,”105 the author gives attention to requirements/cost-performance trades.
Previously, available technology drove the performance goals. Currently, the system user
has to consider lesser but acceptable performance; therefore, the user became a critical
player in the CAIV process. In addition, when performance is stated as an overall system,
performance goals or the number of system performance parameters is minimized.
The CAIV process focuses on all four phases of the LCC of a program: R&D,
production, O&S, and disposal. Notwithstanding, the main emphasis is given to
production and O&S cost objectives. As Dr. Rush mentions, there are significant
problems estimating production and O&S costs during the development phase. For
instance, in the case of O&S, cost objectives typically would be an annual cost per
102 Defense Acquisition University, Defense Acquisition Deskbook, Version 3.1, 30 September 1999,
http://akss.dau.mil/docs/ord0d.doc (accessed April 20, 2006).
103 Boudreau and Naegle, “Reduction of Total Ownership Cost,” 25.
104 Benjamin C. Rush, “Cost As an Independent Variable,” Acquisition Review Quarterly (Spring 1997), 162.
105 Ibid., 162.

79
deployable unit (e.g. squadron) or individual system (e.g. aircraft). Most difficult to
predict are O&S costs, primarily because they occur over many years. Supportability-
related cost-performance parameters, such as Cost-Per-Operating-Hour (for aircraft),
should influence CAIV principles; as the flagship program proved, the CAIV process can
reduce O&S costs by establishing aggressive goals for key performance parameters such
as MTBF and MTTR.106
The Defense Acquisition Guidebook describes how a CAIV strategy should be
implemented. The CAIV plan has to be adjusted to each type of system. In general, it
would consist of the following elements: cost goals for unit production cost and O&S
costs, timing and content of trade-off studies, a cost performance integrated product team,
incentives for supporting the CAIV plan, and metrics to assess progress and achievement
of production and O&S cost goals.107
In brief, the CAIV process involves developing, setting, and refining forceful
production and O&S cost targets while meeting system requirements and affordability.
Once system performance and objective costs are decided, through cost-performance
trade-offs, cost becomes more of a constraint and less of a variable in meeting the
mission need. CAIV is an initiative to reduce life-cycle costs and is particularly effective
during system development. During the O&S phase CAIV is not effective. Therefore,
another methodology has to be employed for reducing Total Ownership Cost later in the
system life cycle.
2. Reduction of Total Ownership Cost (R-TOC)
Another approach to TOC is the Reduction of Total Ownership Cost (R-TOC); its
focal point is the reduction of the O&S costs of a weapon system. R-TOC programs are
mainly employed after the system is fielded. The purpose of the R-TOC program is to
achieve readiness improvements in weapon systems by improving the reliability of the
systems or the efficiency of the processes used to support them.108
106 Rush, “Cost As an Independent Variable,” 168-169.
107 DAU, “Defense Acquisition Guide,” para. 3.2.4.
108 Institute for Defense Analysis, “Reduction of Total Ownership Costs,” http://rtoc.ida.org/rtoc/rtoc.html (accessed April 29, 2006).

80
In implementing R-TOC, the DoD adopted a Business Process Reengineering
(BPR) perspective using elements such as: increasing the visibility and priority of the
problem, changing the behavior of organizations and individuals regarding R-TOC, and
institutionalizing R-TOC processes. The DoD has combined three strategies for
approaching the R-TOC issue: setting strategic goals and objectives, starting to build
momentum early, and developing and implementing a refined tactical plan.109
Implementing the strategies previously mentioned through several pilot programs,
the DoD achieved positive results. These were obtained by adopting private sector
improvements in logistics and supply chain management. A memorandum from the
Under Secretary of Defense for Acquisition, Technology and Logistics summarizes these
facts:
Current R-TOC Pilot Programs are demonstrating that cost avoidance can be achieved by a variety of best practices. They include replacing high cost and low reliability components; enhancing supply chain efficiency; using smart decision support tools with cost visibility; establishing performance logistics support arrangements; leveraging commercial-off-the-shell components; and initiating public-private partnerships.”110
The 30 R-TOC Pilot programs, 10 for each service, have contributed significantly
to reducing TOC, mainly because they were implemented for high–demand weapon
systems. Therefore, even small O&S cost reduction resulted in drastic improvements in
readiness and contributed to reducing Department of Defense ownership costs.
Both strategies, CAIV and R-TOC, focus on cost reduction and are designed to
reduce the total ownership cost of weapons systems. CAIV is a continuous, user-oriented,
overarching acquisition strategy. Through this strategy, performance requirements are
assessed against costs to maximize the value of a weapon system. The costs, however, are
109 Mandelbaum and Pallas, “Reducing Total Ownership Cost in DoD,” 77.
110 Michael W. Wynne, Memorandum: Transformation through Reduction of Total Ownership Cost (R-TOC), (Washington D.C.: Office of the Secretary of Defense, December 16, 2003), http://rtoc.ida.org/rtoc/open/SignedVersion-RTOC-Wynne%20Ltr-16Dec03.pdf (accessed April 26, 2006).

81
still too high for current budgets. While continuing to attack acquisition costs, there is
need to reduce O&S costs as well. Initiatives such as CAIV and R-TOC reduce costs and
improve readiness.
D. CONCLUSION
Understanding and identifying TOC is crucial to determining the operational
success and cost-effectiveness of any weapon system. Recognizing this, current DoD
policies require that program management ensure LCC considerations influence system
design, systems engineering, and logistics engineering processes during the weapon
system life cycle. In realizing this objective, the LCC estimate supports each management
decision where cost is significant. The decisions with the highest probability of affecting
LCC are those impacting O&S costs. Therefore, program managers must focus on the
major factors that influence O&S costs, such as design characteristics, reliability,
maintainability, and mission requirements.

82
THIS PAGE INTENTIONALLY LEFT BLANK
83
V. ANALYSIS AND FORECASTING OF OPERATING AND SUPPORT COST FOR F-16 C/D
This chapter provides an analysis of O&S costs for the F-16C/D. It begins with a
brief description of the AFTOC database and how data was collected for the empirical
portion of this research. Then the chapter focuses on the details of O&S data from the
FY04 Cost Analysis Improvement Group (CAIG) format for O&S data. The percentage
breakout for each fiscal year will be compared to one another to identify any trends that
might be present. Actual CPFH expenditures of F-16C are then analyzed, exploring
different forecasting options to determine which option best fits each data series. After
the best forecasting option is selected, the forecast figures are analyzed by comparing
them with the actual expenditures for FY04. The results of this comparison are then
analyzed by comparing them to the results of the actual expenditures versus budgeted
values. The last section presents several results of implementation of the R-TOC program
in the case of the F-16 Fighting Falcon.
A. AFTOC DATABASE
Each service keeps records of operation and support costs – spending on
Operation and Maintenance (O&M) plus spending on military personnel. As mentioned
in Chapter IV, the Navy (1974) was the first service to implement a database for
presenting all O&S cost information for weapon systems, called the Visibility and
Management of Operating and Support Costs (VAMOSC). However, Logistic
Management Institute (LMI) study concluded in 1995 that “no service was capturing
actual cost by weapon system.”111 After this study, the Army and Air Force created their
own systems for reporting O&S cost information. The Army’s version of the VAMOSC
is the Operating and Support Management Information System (OSMIS). The Air Force
named their system the Air Force Total Ownership Costs (AFTOC) database.
111 Jerry Schmidt and Ellis Hitt, “Air Force Total Ownership Costs and Reduction in Total Ownership Costs – Twin
Pillars of the Air Force Affordability Initiatives,” IEEE (1999), SS.2-1, http://ieeexplore.ieee.org/iel5/ 6600/17621/00863675.pdf?arnumber=863675 (accessed April 13, 2006).

84
The purpose of these databases is to provide visibility of O&S costs for use in
cost analysis of Major Defense Acquisition Programs (MDAPs) and force structure
alternatives in support of the Planning, Programming, Budgeting and Execution (PPBE)
process, and satisfy the congressional requirement that DoD capture and report O&S cost
for MDAPs.112 These databases make possible the management of O&S costs; the LCC
of a weapon system can therefore be controlled and reduced.
The AFTOC database is compiled from hundreds of other databases that collect
cost data as well as data on operations (hours flown) or equipment in inventory. For
instance, it contains actual expenditures from the Command On-line Accounting &
Reporting System (COARS), and flying hour data and aircraft inventory data is extracted
from the Reliability and Maintainability Information System (REMIS).
B. O&S COSTS ANALYSIS
As noted in Chapter IV, the AFTOC database contains the necessary data for the
empirical O&S cost breakout analysis. AFTOC includes all costs associated with the
USAF total obligation authority, including costs associated with personnel, infrastructure,
operation and maintenance (O&M), research, development, test and evaluation, and
acquisition of new systems.
Schmidt and Hitt illustrate the link between AFTOC and R-TOC analyzing the
O&S costs of the F-16 weapon system.113 To a large extent, our analysis draws upon
their paper.
Table 2 and Figure 22 show the FY04 total costs and FY04 O&M costs of the F-
16C/D weapon system. The data were obtained by adding up the costs for F-16C and F-
16D found in AFTOC. More than half are O&M costs. The second largest expenditure
category is Military Personnel.
112 Department of Defense, “DoDR 5000.4-M – Cost Analysis Guidance and Procedures,” (Washington DC:
Assistant Secretary of Defense for Program Analysis and Evaluation, May 2002), 53, http://www.dtic.mil/whs/directives/corres/pdf2/p50004m.pdf (accessed April 14, 2006).
113 Schmidt and Hitt, “AFTOC and R-TOC,” SS.2-4.

85
Table 2. FY04 Obligations: F-16C/D.
F-16C/D FY04114
RDT&E $139,223,580Procurement $436,615,552O&M $ ,377,851,821Milpers $1,614,171,291Total $4,567,862,244
Milpers35%
RDT&E3%
Procurement10%
O&M52%
Figure 22. FY04 Obligations: F-16C/D.
Figure 23 shows the FY04 O&M cost of the F-16C/D weapon system. The total
costs are USD 2,378 million. Note that the major cost driver of O&M costs is Depot
Level Reparables (DLRs). They constitute USD 885,800,885, or 38 percent of the
expenditures. Therefore these costs are principally targeted for cost reduction.
114 All data are Then-Year dollars.

86
Other O&M8%
Contract Services5%
Software Engineering
1%Sustaining
Engineering1%
Depot Maintenance10%
AV Fuel10%
Consumables8%
DLRs38%
Civilian Personnel19%
Figure 23. F-16C/D FY04 O&M Costs.
Table 3. F-16C/D FY04 O&M Costs.
F-16C/D FY04Civilian Personnel $449,632,870 DLRs $885,800,885 Consumables $197,946,097 AV Fuel $242,967,000
Depot Maintenance $236,283,078 Sustaining Engineering $27,738,383 Software Engineering $26,820,104 Contract Services $116,709,154 Other O&M $193,954,249 Total $2,377,851,820
After an empirical study, a GAO report concluded that about 25 parts, especially
parts associated with engines and electronic subsystems dominate the maintenance and
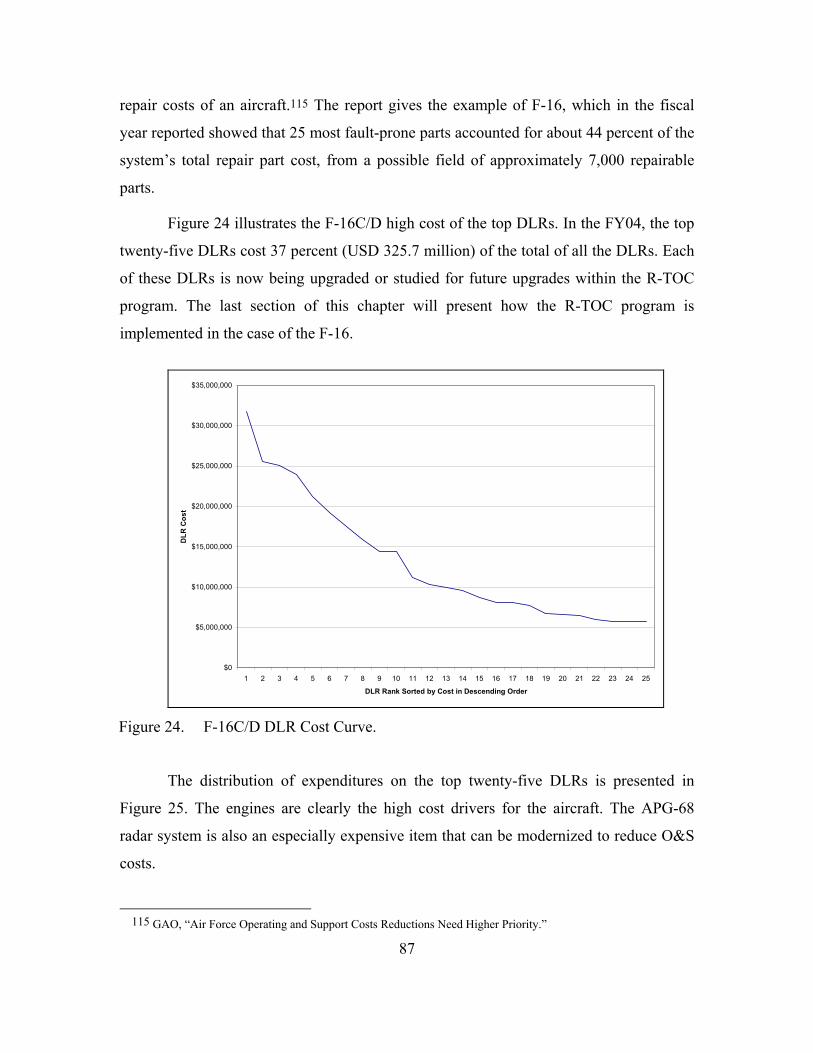
87
repair costs of an aircraft.115 The report gives the example of F-16, which in the fiscal
year reported showed that 25 most fault-prone parts accounted for about 44 percent of the
system’s total repair part cost, from a possible field of approximately 7,000 repairable
parts.
Figure 24 illustrates the F-16C/D high cost of the top DLRs. In the FY04, the top
twenty-five DLRs cost 37 percent (USD 325.7 million) of the total of all the DLRs. Each
of these DLRs is now being upgraded or studied for future upgrades within the R-TOC
program. The last section of this chapter will present how the R-TOC program is
implemented in the case of the F-16.
$0
$5,000,000
$10,000,000
$15,000,000
$20,000,000
$25,000,000
$30,000,000
$35,000,000
1 2 3 4 5 6 7 8 9 10 11 12 13 14 15 16 17 18 19 20 21 22 23 24 25
DLR Rank Sorted by Cost in Descending Order
DLR
Cos
t
Figure 24. F-16C/D DLR Cost Curve.
The distribution of expenditures on the top twenty-five DLRs is presented in
Figure 25. The engines are clearly the high cost drivers for the aircraft. The APG-68
radar system is also an especially expensive item that can be modernized to reduce O&S
costs.
115 GAO, “Air Force Operating and Support Costs Reductions Need Higher Priority.”

88
APG-6817%
AVIONICS11%
Sum all other16%
F110-GE22%
F100-PW34%
Figure 25. F-16C/D Top Twenty-Five DLR Cost Drivers.
1. Level 1 CAIG Data - Empirical O&S Breakout
Another data format available from AFTOC is the Level 1 CAIG Data, used for
our empirical O&S breakout. The Level 1 CAIG Data (FY04, F-16C/D) is presented in
Table 4. In this case, the data for FY 2005 were available; however, the FY04 data are
presented to offer a complete image of cost for one year. There are seven 1st level cost
elements, which each of these being a summation of lower levels (2nd and, in some cases
3rd) of indenture.
Table 4. FY04, F-16C/D Level 1 CAIG Data.
CAIG CAIG Description Total 1.0 Mission Personnel $1,743,230,041 2.0 Unit-Level Consumption $1,501,968,295 3.0 Intermediate Maintenance $313,000 4.0 Depot Maintenance (not DLRs) $215,992,330 5.0 Contractor Support $43,313,391 6.0 Sustaining Support $ 88,012,063 7.0 Indirect Support $ 472,177,913 Total Total Expenditures $ 4,065,007,033
Note: in Then-Year Dollars.

89
A graphic depiction of Table 4 is presented in Figure 26. As can be observed, the
major cost drivers are Mission Personnel and Unit-Level Consumption. These two
elements determined at the operating unit level are the major cost drivers for total cost,
Cost per Flight Hour (CPFH), and cost per aircraft.
Mission Personnel
Unit-Level Consumption
Intermediate Maintenance
Depot Maintenance (not DLRs)
Contractor Support
Sustaining Support
Indirect Support
$0
$500,000,000
$1,000,000,000
$1,500,000,000
$2,000,000,000
Figure 26. FY04, F-16C/D Level 1 CAIG Data.
The Level 1 CAIG data is also used in a trend analysis. The F-16 weapon system
is evaluated from FY98- FY04. The costs incurred by both models, F-16C and F-16D are
presented. Line charts are created showing the percentage that each of the seven CAIG
O&S cost categories contributes to the entire cost for each fiscal year. The percentage
that each of the seven categories contributes to O&S costs provides a means to compare
the costs from year to year without the outside influence of inflation, because increases
due to inflation will apply to all of the categories.
From FY96 through FY04, the largest portions of overall cost consistently came
from costs associated with mission personnel and unit-level consumption. These two

90
categories constitute 80 percent of total cost in each year. One can observe a decline of
these cost percentages between FY98 to FY02 for mission personnel and between FY99
to FY05 for unit-level consumption. However, these costs were not lower than in
previous years: very much the contrary. With the exception of FY03 (when the unit-level
consumption costs were lower than in the previous year), costs increased. These
decreases are attributable to the dramatic rise of costs associated with contractor support
(almost doubled in FY02) and depot maintenance. The causes of these increases are
probably related to upgrades installed in 1999 and 2000, such as Active Flutter
Suppression System and electric brakes (e-brakes), as well as modifications within the
Common Configuration Implementation Program (CCIP), which started in 2002.116
0%
5%
10%
15%
20%
25%
30%
35%
40%
45%
50%
1996 1997 1998 1999 2000 2001 2002 2003 2004 2005
Year
perc
ent o
f tot
al c
ost
Mission PersonnelUnit-Level ConsumptionIntermediate MaintenanceDepot Maintenance (not DLRs)Contractor SupportSustaining SupportIndirect Support
Figure 27. F-16 C/D O&S Costs.
116 See Lockheed Martin, “Latest Lockheed Martin F-16 Upgrade Version Completed on Schedule,”
http://www.lockheedmartin.com/wms/findPage.do?dsp=fec&ci=12553&rsbci=1&fti=133&ti=0&sc=400 (accessed April 13, 2006).

91
As can be observed, during recent years, the unit-level consumption costs
percentage stabilized at around 37 percent. Three of the 3rd level cost elements in this
category are the factors estimated within the Cost per Flying Hour (CPFH) Program. The
next section discusses the CPFH, a subset of the O&S portion of the budget.
2. Cost per Flying Hour (CPFH)
CPFH drives a large fraction of O&S and directly addresses actual aircraft
operation and maintenance costs. The USAF uses the CPFH metric to estimate budget
needs. CPHF factors allocate dollars against flying hours included in Air Force’s
program. This program encompasses the number of hours needed to attain and maintain
combat readiness for aircrews, to test the weapon system and tactics, and to fulfill
collateral requirements such as air shows and ferrying aircraft.117
There is no standard understanding of the CPFH concept. An Air Force weapon
system cost analyst defines CPFH as “a metric used to estimate the costs of fuel,
consumables, and DLRs necessary to operate a particular weapon system (aircraft) for a
one hour period.”118
a. CPFH Recorded in AFTOC
In the AFTOC database, however, the CPFH are calculated by dividing
the O&S costs by the flying hours. (O&S costs are the sum of mission personnel and
O&M costs) Figure 28 displays actual and budgeted Cost per Flying Hour for F-16C/D,
as extracted from the AFTOC.
One useful set of steps to calculate annual budget costs for an active duty
unit is mentioned by Edwards in his thesis.119
• (Primary Authorized Aircraft per Sqdn) x (Crew Seat Ratio) = Allowed Crews per Squadron
• (Allowed Crews) x (Aircrew Manning Factors) = Budgeted Crews per Squadron
117 GAO, “Air Force Operating and Support Costs Reductions Need Higher Priority,” 1.
118 Pat A. Rose, “Cost Per Flying Hour Factors: A background and Perspective of How They Are Developed and What They Do,” Air Force Comptroller 31, no. 3 (July 1, 1997), 4.
119 Michael V. Edwards, “Flight Hour Costing at the Type Commander and Navy Staff Levels: An Analytical Assessment,” (master thesis, Naval Postgraduate School, 1992), 17-18.

92
• (Budgeted Crews) x (Req. Hrs/Crew/Month) x (12 mos.) = Annual Flying Hours Required per Sqdn
• (Ann. Flying Hrs Req. per Sqdn) x (Number of Sqdns) = Total Annual Flying Hours Required
• (Total Ann. Flying Hrs Req.) x (Primary Mission Readiness percentage) = Annual Budgeted Flying Hours
• (Ann. Budgeted Flying Hours) x (CPFH) = Annual Budgeted Cost, Active Duty forces (converted to “then-year” dollars)
$6,000.00
$8,000.00
$10,000.00
$12,000.00
$14,000.00
1998 1999 2000 2001 2002 2003 2004 2005
Fiscal period
$TY F-16C
F-16D
Budgeted
Figure 28. Actual/Budgeted Cost Per Flying Hour: F-16C/D.
Because the Flying Hour Program is an important part of the budget
proposal, forecasting CPFH has become a critical task for cost analysts. An underestimate
would lead to an additional funding, typically taken from modernization programs.120
120 GAO, “Air Force Operating and Support Costs Reductions Need Higher Priority,” 3.
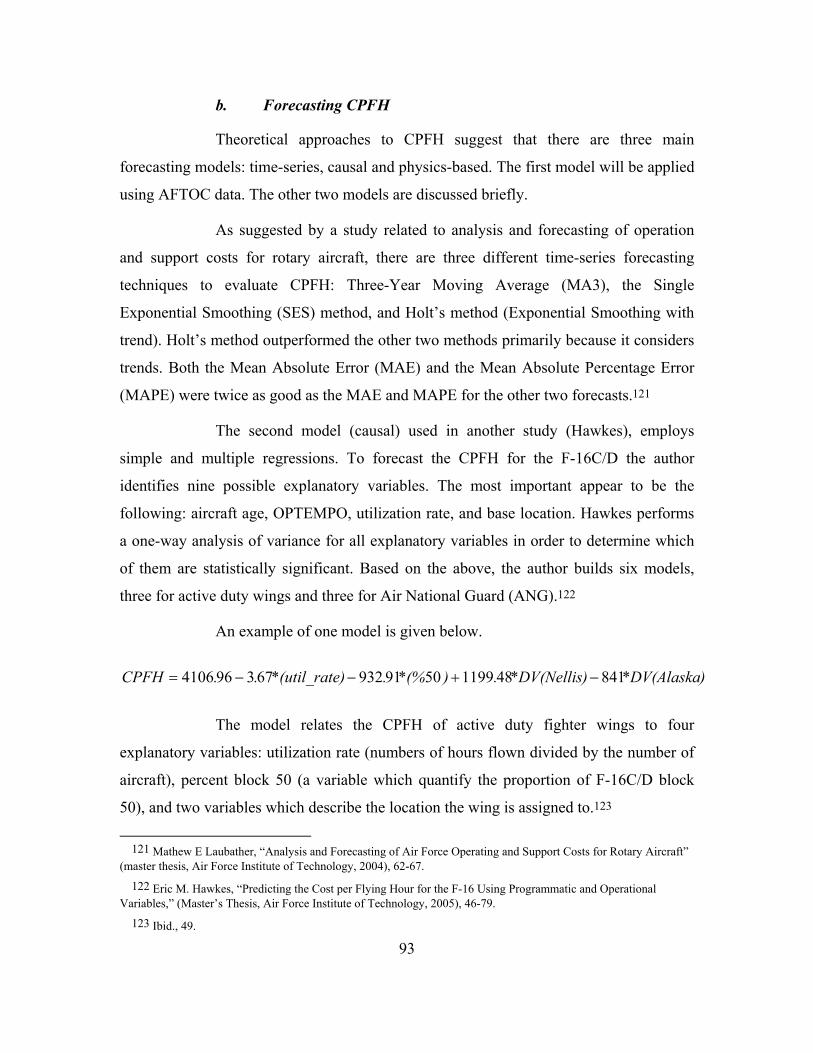
93
b. Forecasting CPFH
Theoretical approaches to CPFH suggest that there are three main
forecasting models: time-series, causal and physics-based. The first model will be applied
using AFTOC data. The other two models are discussed briefly.
As suggested by a study related to analysis and forecasting of operation
and support costs for rotary aircraft, there are three different time-series forecasting
techniques to evaluate CPFH: Three-Year Moving Average (MA3), the Single
Exponential Smoothing (SES) method, and Holt’s method (Exponential Smoothing with
trend). Holt’s method outperformed the other two methods primarily because it considers
trends. Both the Mean Absolute Error (MAE) and the Mean Absolute Percentage Error
(MAPE) were twice as good as the MAE and MAPE for the other two forecasts.121
The second model (causal) used in another study (Hawkes), employs
simple and multiple regressions. To forecast the CPFH for the F-16C/D the author
identifies nine possible explanatory variables. The most important appear to be the
following: aircraft age, OPTEMPO, utilization rate, and base location. Hawkes performs
a one-way analysis of variance for all explanatory variables in order to determine which
of them are statistically significant. Based on the above, the author builds six models,
three for active duty wings and three for Air National Guard (ANG).122
An example of one model is given below.
)*DV(Alaska)*DV(Nellis.)*(%.e)*(util_rat..CPFH 8414811995091932673964106 −+−−=
The model relates the CPFH of active duty fighter wings to four
explanatory variables: utilization rate (numbers of hours flown divided by the number of
aircraft), percent block 50 (a variable which quantify the proportion of F-16C/D block
50), and two variables which describe the location the wing is assigned to.123
121 Mathew E Laubather, “Analysis and Forecasting of Air Force Operating and Support Costs for Rotary Aircraft”
(master thesis, Air Force Institute of Technology, 2004), 62-67.
122 Eric M. Hawkes, “Predicting the Cost per Flying Hour for the F-16 Using Programmatic and Operational Variables,” (Master’s Thesis, Air Force Institute of Technology, 2005), 46-79.
123 Ibid., 49.

94
The third model (physics-based) used other parameters besides hours to
predict consumption costs. It was developed by the Logistics Management Institute
(LMI) as an alternative to CPFH, and is relevant during contingencies.124 The analysis of
LMI experts demonstrates that during contingency operations the number of flying hours
increases dramatically, but the consumption of parts does not.
The model was verified using the F-16C fighters deployed at Aviano Air
Base (Italy). Initially, the model considered four critical factors: ground cycles or ground
days (ground hours divided by 24), flying hours, warm take-off/landing cycle (warm
cycles), and cold take-off/landing cycle. The last parameter was subsequently eliminated.
The total F-16C fleet model predicts 20.1 percent ground-induced removals, 6.4 percent
warm cycle-induced removals, and 73.4 percent flying hour-induced removals.125
c. Time-Series Forecasting Methods of CPFH
Time-series forecasting methods are applied to F-16C/D data extracted
from AFTOC. Appendix J describes in detail these three forecasting techniques. In
addition, the evaluation measures (Mean Error [ME], Mean Absolute Error [MAE], Mean
Percentage Error [MPE] and Mean Absolute Percentage Error [MAPE]) are also
presented. Appendix K displays the entire data set used for employing the time-series
forecasting methods. The Solver function within Excel was used to find the optimal value
of coefficients used for SES and Holt’s forecast. Tables 5 and 6 below show the
evaluation measures that were calculated for F-16C and F-16D.
Table 5. F-16C Evaluation Measures (Nominal Data).
F-16C MA SES Holt ME 1,520.03 811.49 180.13 MAE 1,520.03 841.59 574.96 MPE 13.46% 7.79% 1.92% MAPE 13.46% 8.08% 5.68%
124 John M. Wallace, Scout A. Houser and David A. Lee, “A Physics-Based Alternative to Modeling Aircraft Consumption Costs” (report, Logistics Management Institute, McLean, Virginia, August 2000), http://www.dodcas.osd.mil/ DoDCAS2003%20presentations/Advanced/Lee.pdf (accessed May 12, 2006).
125 Wallace, Houser and Lee, “A Physics-Based Alternative to Modeling Aircraft Consumption Costs,” 4-21.

95
Table 6. F-16D Evaluation Measures (Nominal Data).
F-16D MA SES Holt ME 1,662.70 764.80 73.97 MAE 1,662.70 764.80 490.20 MPE 16.00% 8.11% 1.24% MAPE 16.00% 8.11% 5.50%
Of the three forecasting techniques evaluated, Holt’s method definitely
achieves the lowest errors. The explanation for this fact is that Holt’s method, unlike the
other two techniques employed, can exploit trends within the data. The graphs in Figure 7
illustrate a positive trend of CPFH experienced by the USAF in the case of the F-16C/D.
Consequently, Holt’s method proved to be an appropriate technique to forecast CPFH.
Another advantage of Holt’s method is that it can forecast more than one
period ahead if needed. However, this method has a few negative aspects. One is that it
can take a long time to overcome the influence of a one-period shift in the opposite
direction of the overall trend. The shift in an opposite direction is evident in the case of
the F-16C for the year 2002. The data observed was USD 10484.21, USD 90.30 lower
than the previous year. Therefore, for 2002 the percentage error given by the variation
between the observed value and the forecasted value was 11.3 percent. However, for
FY04 the CPFH forecasted for the F-16C with Holt’s method is the exact value recorded
in AFTOC.
Another important observation regarding the evaluation measures is that
none of the ME or MPE is negative. This indicates that the forecasted values are, on
average, lower than observed values. Therefore, one disadvantage of these forecasting
methods is the risk of underfunding.
A source of the positive trend observed is inflation. To eliminate this
factor, actual data from AFTOC are adjusted to 2005 dollars. In Figure 29 the observed
data (in FY05 dollars) are graphed and the budgeted values for FY05 and forecast values
obtained using Holt’s method again offered the lowest errors.

96
$6,000.00
$8,000.00
$10,000.00
$12,000.00
$14,000.00
1998 1999 2000 2001 2002 2003 2004 2005
Fiscal period
$FY0
5 F-16CF-16DF-16C HoltF-16D Holt
Budgeted
Figure 29. Actual/Budgeted and Forecasted Cost Per Flying Hour: F-16C/D (in 2005
dollars).
The inflation conversion factors have been extracted from the Conversion
Factor Table offered by Oregon State University.126 They are shown below in Table 7.
Table 7. Inflation Conversion Factors.
Year CF 1998 0.835 1999 0.853 2000 0.882 2001 0.907 2002 0.921 2003 0.942 2004 0.967 2005 1.000
126 Robert Sahr, Inflation Conversion Factors for Dollars 1665 to Estimated 2016, Oregon State University,
http://oregonstate.edu/Dept/pol_sci/fac/sahr/sahr.htm (accessed June 3, 2006).
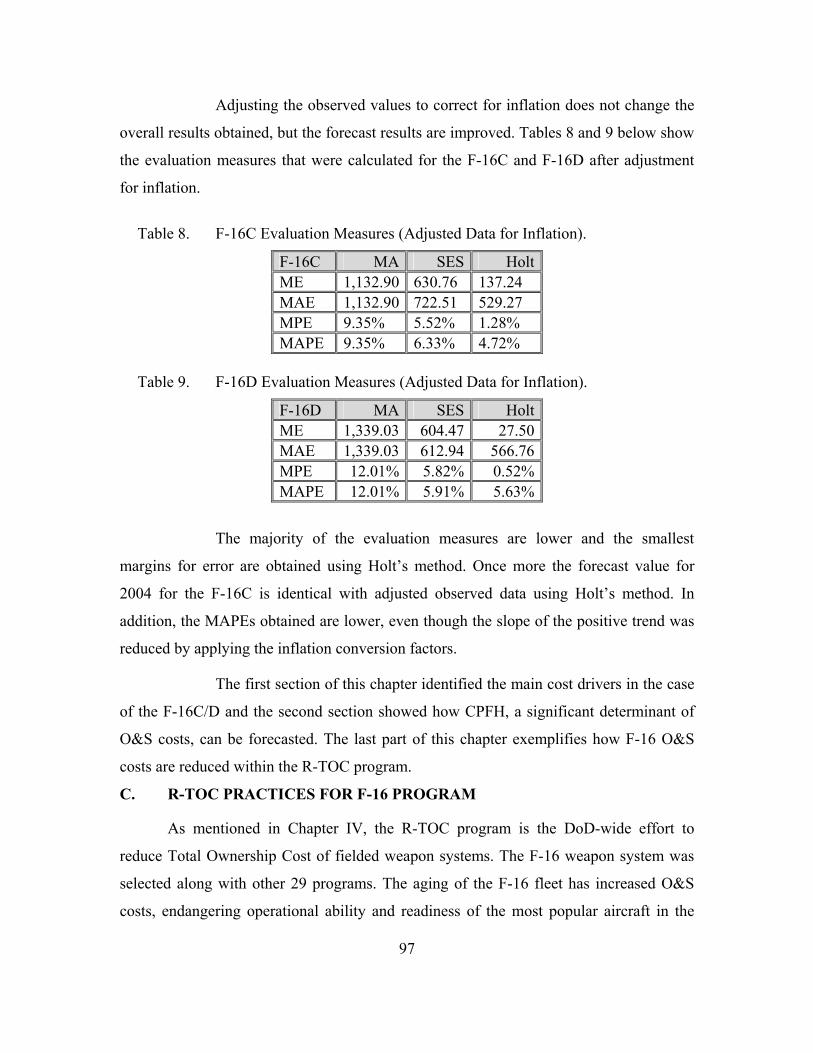
97
Adjusting the observed values to correct for inflation does not change the
overall results obtained, but the forecast results are improved. Tables 8 and 9 below show
the evaluation measures that were calculated for the F-16C and F-16D after adjustment
for inflation.
Table 8. F-16C Evaluation Measures (Adjusted Data for Inflation).
F-16C MA SES HoltME 1,132.90 630.76 137.24 MAE 1,132.90 722.51 529.27 MPE 9.35% 5.52% 1.28% MAPE 9.35% 6.33% 4.72%
Table 9. F-16D Evaluation Measures (Adjusted Data for Inflation).
F-16D MA SES HoltME 1,339.03 604.47 27.50MAE 1,339.03 612.94 566.76MPE 12.01% 5.82% 0.52%MAPE 12.01% 5.91% 5.63%
The majority of the evaluation measures are lower and the smallest
margins for error are obtained using Holt’s method. Once more the forecast value for
2004 for the F-16C is identical with adjusted observed data using Holt’s method. In
addition, the MAPEs obtained are lower, even though the slope of the positive trend was
reduced by applying the inflation conversion factors.
The first section of this chapter identified the main cost drivers in the case
of the F-16C/D and the second section showed how CPFH, a significant determinant of
O&S costs, can be forecasted. The last part of this chapter exemplifies how F-16 O&S
costs are reduced within the R-TOC program.
C. R-TOC PRACTICES FOR F-16 PROGRAM
As mentioned in Chapter IV, the R-TOC program is the DoD-wide effort to
reduce Total Ownership Cost of fielded weapon systems. The F-16 weapon system was
selected along with other 29 programs. The aging of the F-16 fleet has increased O&S
costs, endangering operational ability and readiness of the most popular aircraft in the

98
USAF inventory. The F-16 System Program Office (SPO) has sought to introduce R-
TOC practices throughout the F-16 community. To achieve this objective, a Cost
Reduction Integrated Product Team (CRIPT) was established to identify O&S cost
drivers. For the international F-16 community (including Poland), one of the SPO’s
objectives is to explore possible international cooperation to support TOC reduction
efforts. The F-16 SPO has also implemented two R-TOC initiatives: a system of Service-
Level Agreements and Government Performance Reports for improving supply support
and the Combined Life-Time Support Program.127
The F-16 R-TOC program is one of the best examples of R-TOC practices as a
process of continuous development. However, F-16 R-TOC efforts are complex and
difficult because the inventory of F-16s consists of more than 4,000 units worldwide in
variety of versions. Additionally, because of continuing international sales, the F-16 is
unique in the sense that many of the opportunities for TOC reduction initiatives come
about as a result of international sales opportunities.128
R-TOC practices for the F-16 program consist of following elements: R-TOC
Management, Reliability and Maintainability (R&M) Improvement Initiatives, Supply
Chain Response Times/Footprint Reduction, and Combined Life Time Support (CLTS).
In R-TOC Management, reduction of TOC for the F-16 was not expected to meet
20 percent savings for FY2005. However, even the forecast 3.6 percent for the FY 2005
was a significant amount of money saved.129 Results of R-TOC implementation showed
that R-TOC savings practices are worth doing: “The program office’s persistence has
resulted in development approval and funding of new R-TOC initiatives. In August 2000,
projected FY05 savings totaled only USD 20.1 Million; this estimate has grown to USD
65.5 Million, and life cycle savings exceed USD 1.5 Billion.”130
127 DoD Reduction of Total Ownership Costs official Web site, “Pilots Programs to Reduce Total Ownership Costs
(R-TOC) – F-16 Fighting Program,” http://ve.ida.org/rtoc/open/pilots/f16.html (accessed May 12, 2006).
128 Department of Defense, “Reduction of Total Ownership Costs (R-TOC) Best Practices Guide” (Washington D.C.: Office of Defense Systems, Under Secretary of Defense for Acquisition, Technology and Logistics, September 2003), 10, http://www.dmsms.org/file.jsp?storename=OSD_version.doc (accessed May 12, 2006).
129 DoD, “Reduction of Total Ownership Costs (R-TOC) Best Practices Guide,” 10.
130 Ibid., 10.

99
R&M Improvements Initiatives for the F-16 encountered the following problems:
diminishing manufacturing capacity, aging fleet issues, and decreasing reliability. The
Program Manager (PM) and Supply Chain Manager (SCM) developed the Falcon Flex
program. The main objective was reduction of O&S costs and improvement of reliability.
Falcon Flex has 17 initiatives. The principal focus is to identify cost drivers in order to
proactively forecast solutions among them. After cost driver identification, costs are
ranked, causes are also identified, and solutions are formulated.
Results of the Falcon Flex program are also impressive. Two initiatives for
redesigns of two of the top three O&S cost drivers of the APG-68 radar system
programmable single processor (PSP) were considered. The PSP memory card
replacement project replaced a USD 14,000 component which had a 500 hour MTBF and
a USD 3,000 repair cost with a USD 6,000 throw-away component with a 40,000 hour
MTBF. Similarly, the power supply replacement for the same unit replaced a USD
70,000 component with a 500 hour MTBF and USD 6,000 repair cost with USD 8,000
throw-away unit with 10,000 hour MTBF.131
The Supply Chain Response Times/Footprint Reduction initiative was meant to
improve fill rates and reduce cycle times for the F-16 maintenance line and landing gear
shop at Ogden Air Logistics Center (OO-ALC). As a result of the ongoing initiative,
Total Ownership Costs have declined due to improved fill rates for low cost consumable
bench stock items such as fasteners, gaskets, seals, o-rings, etc. Also, cycle times have
been reduced and government owned inventory for bench stock items were reduced or
eliminated.132
Combined Life Time Support (CLTS) is a program which takes a new approach
to system sustainment. The contractor is held responsible for Diminishing Manufacturing
Sources (DMS) management and determines timing and approach to DMS prevention
and resolution. This proactive solution to DMS problems is carried out before DMS
131 DoD, “Reduction of Total Ownership Costs (R-TOC) Best Practices Guide,” 21.
132 DoD, “Reduction of Total Ownership Costs (R-TOC) Best Practices Guide,” 22.

100
impacts sustainment. Material management responsibilities are shared by government and
contractor equally. Shared responsibility motivates contractors to improve reliability.
The CLTS practices have brought benefits for the government and contractors as
well. Government keeps the core of workload while reducing TOC: contractors partner
with government. Contractors have an opportunity to promote design changes as well as
having support of their product lines.133
The R-TOC initiatives implemented in the F-16 program has brought
improvement in TOC reduction and readiness. They allow sustaining readiness of an
aging weapon system such as the F-16 with reduction of logistic footprint. However, the
Polish and Romanian cases indicate that age of the aircraft will not be a factor (Poland
purchased new planes and Romania is considering that option), because new user of the
F-16 weapon system may need to implement best practices of the R-TOC program in the
near future. Additionally, R-TOC initiatives may be implemented in the early phases of
weapon system development.
133 DoD, “Reduction of Total Ownership Costs (R-TOC) Best Practices Guide,” 32.

101
VI. CONCLUSIONS AND RECOMMENDATIONS
Total Life Cycle System Management (TLCSM) could be an affective tool to
identify, track, and manage the Total Ownership Cost, if implemented properly. The
difficulties in implementation come from the complexity, multidimensionality, and
different avenues of approach. Also, the TLCSM concept is not yet mature in Poland and
Romania. However, TLCSM should be a main priority when acquiring new weapon
systems such as the F-16. Therefore, concepts such as TLCSM and TOC/LCC should
become standard practices because they constitute a foundation for the effective
management of complex weapon systems. Moreover, these concepts have been
demonstrated in practice by the U.S. DoD.
Costs after initial investment are significant and require serious consideration.
O&S costs represent the majority of the TOC for USAF weapon systems. That fact is
widely recognized, and in recent years the focus has shifted from reducing acquisition
costs to reducing total ownership costs. The analysis included in this report confirmed
that the F-16 C/D is not an exception. For instance, the O&S costs of the F-16C/D were
87 percent of total costs in 2004 (35 percent Military Personnel, 52 percent Operating and
Maintenance).
The analysis also identified DLRs as the main cost drivers of O&M. They must be
addressed when considering reduction of TOC in general, with careful attention to the top
25 DLR items, which include components of engines (F100-PW and F110-GE), APG-68
radar and avionics. Management of these cost drivers will be particularly difficult since
the PoAF and RoAF fly a relatively small number of aircraft. As suggested by Professor
Engelbeck, this would create unique spares for the PoAF and RoAF.134 The search for
appropriate solutions among alternatives such as establishing a Reliability Centered
Maintenance (RCM) or consolidation of DLR maintenance capabilities within the
European Union F-16 users may constitute a topic for further study.
134 While the RoAF has not yet selected its multi-role combat aircraft, the recommendations made here for F-16
would apply to any such aircraft.
102
Holt’s model (exponential smoothing with trend) applied in this study using 1998-
2004 AFTOC data provided a useful method for forecasting CPFH. In another study
(Laubacher) Holt’s model proved to be valuable in predicting the CPFH of rotary aircraft
as well. Therefore, this model can be viewed as an effective decision-making tool to
obtain realistic estimates of CPFH, and consequently of O&S costs. However, because
the forecast values are, on average, lower than observed values this method should be
used with caution in budgeting O&S costs to avoid underfunding.
The chief recommendation of this study is that the Polish and Romanian Air
Forces should establish databases to record O&S costs. The compilation of several data
bases into one integrated database is an essential step for efficient forecasting and
managing TOC in general and O&S costs in particular. Efforts to reduce O&S costs of
multi-role aircraft in the PoAF and RoAF should be preceded by establishment of a
reliable and consistent O&S cost database. Moreover, as an F-16 user, Poland should take
advantage of U.S. and other user countries’ experience with this fighter aircraft to obtain
access to common digitized data.135 Romania should include acquiring of the cost
database of its future multi-role fighter aircraft in the acquisition process.
Simultaneous with the acquisition process, the PoAF and RoAF should adopt the
best practices of managing and reducing TOC. Furthermore, they should become actively
engaged in exploring new possible R-TOC initiatives.
135 This new database is mentioned in a report of the Air Force Logistics Management Agency. Timothy Smith,
“USAF Condition-Based Maintenance Plus (CBM+) Initiative” (Maxwell-Gunter AFB Montgomery, AL: Air Force Logistics Management Agency, September 2003), 35. http://www.acq.osd.mil/log/logistics_materiel_readiness/organizations/mppr/assetts/cbm+/Air_Force/AFLMA%20CBM%20final%20Sep%2003.pdf (accessed June 7, 2006).

103
APPENDIX A. OFFSET MULTIPLIERS FOR DIRECT OFFSET COMMITMENTS IN THE REPUBLIC OF POLAND136
Subject of the commitment Multipliers1. Capital and tangible equity investments: 0.7 – 1.9 1) purchase of stock or shares from the State Treasury, 1.1 – 1.6 2) cash contribution to the share capital of a company, 1.1 – 1.9 3) in-kind contribution to the share capital of a company. 0.7 – 1.3 2. Intangible investments: 0.9 – 2.0 1) transfer of a technology and know-how connected with the production of: 1.2 – 2.0 a) rifles and ammunition, 1.7 – 2.0 b) armored and mechanized weapon, 1.2 – 1.5 c) aviation equipment, 1.8 – 2.0 d) electronic and optoelectronic equipment, 1.9 – 2.0 e) vessels, 1.4 – 1.8 f) logistical security equipment. 1.2 – 1.4 2) transfer of a license connected with production of: 0.9 – 1.7 a) rifles and ammunition, 1.5 – 1.7 b) armored and mechanized weapon, 0.9 – 1.3 c) aviation equipment, 1.5 – 1.7 d) electronic and optoelectronic equipment, 1.6 – 1.7 e) vessels, 1.1 – 1.3 f) logistical security equipment. 0.9 – 1.1 3) participation in the program of modernization of delivery’s subjects (purchased armament or military equipment).
1.5 – 2.0
3. Direct purchase of goods and services manufactured on the territory of Republic of Poland:
0.5 – 2.0
1) connected with the subject of delivery of the armament or military equipment,
1.0 – 2.0
2) although not connected with the subject of delivery of the armament or military equipment, but
0.5 – 2.0
a) connected with production of rifles and ammunition, 1.6 – 2.0 b) connected with production of armored and mechanized weapon, 1.5 – 1.9 c) connected with production of aviation equipment, 1.7 – 2.0 d) connected with production of electronic and optoelectronic equipment, 1.8 – 2.0
136 Republic of Poland. Ministry of Economy, “Ordinance of the Counsel of Ministers of 2 July 2002 concerning
the detailed principles for crediting offset commitments of a foreign supplier of armament or military equipment against the offset agreement value,” http://www.mgip.gov.pl/NR/rdonlyres/44734642-D9A7-4BFB-82F1FB48A5443547/12516/offset_mult_ordin_eng.pdf (accessed April 29, 2006).
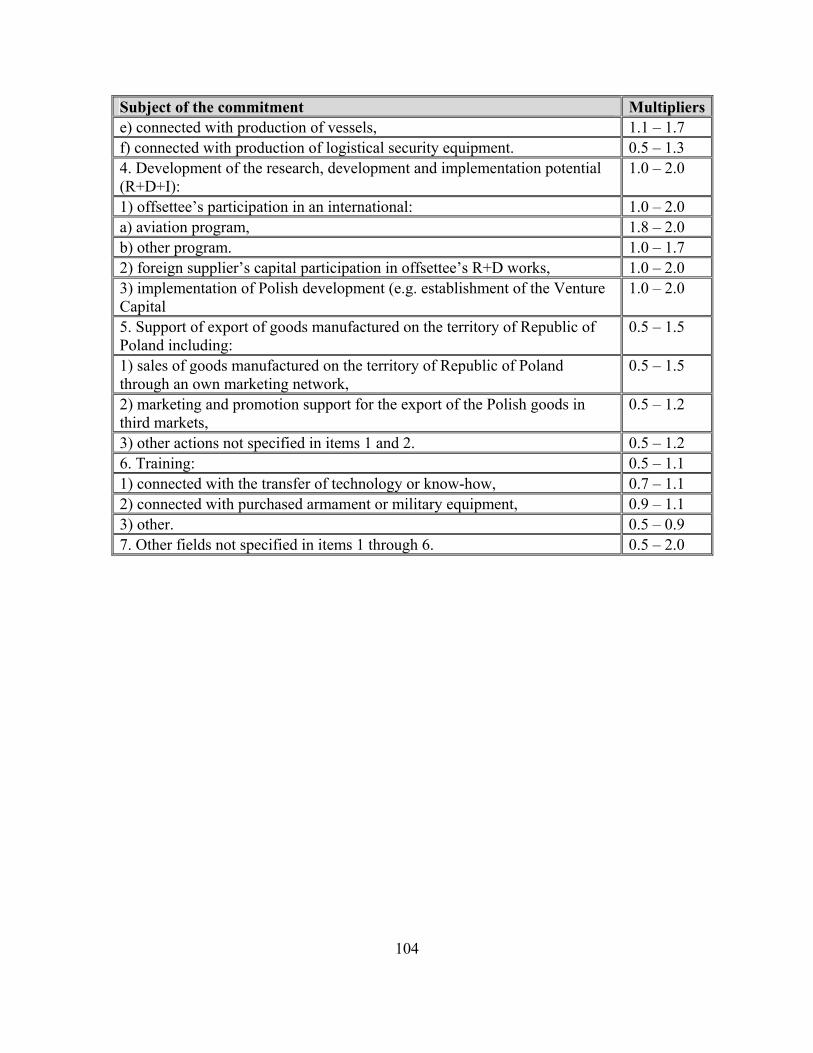
104
Subject of the commitment Multiplierse) connected with production of vessels, 1.1 – 1.7 f) connected with production of logistical security equipment. 0.5 – 1.3 4. Development of the research, development and implementation potential (R+D+I):
1.0 – 2.0
1) offsettee’s participation in an international: 1.0 – 2.0 a) aviation program, 1.8 – 2.0 b) other program. 1.0 – 1.7 2) foreign supplier’s capital participation in offsettee’s R+D works, 1.0 – 2.0 3) implementation of Polish development (e.g. establishment of the Venture Capital
1.0 – 2.0
5. Support of export of goods manufactured on the territory of Republic of Poland including:
0.5 – 1.5
1) sales of goods manufactured on the territory of Republic of Poland through an own marketing network,
0.5 – 1.5
2) marketing and promotion support for the export of the Polish goods in third markets,
0.5 – 1.2
3) other actions not specified in items 1 and 2. 0.5 – 1.2 6. Training: 0.5 – 1.1 1) connected with the transfer of technology or know-how, 0.7 – 1.1 2) connected with purchased armament or military equipment, 0.9 – 1.1 3) other. 0.5 – 0.9 7. Other fields not specified in items 1 through 6. 0.5 – 2.0

105
APPENDIX B. OFFSET MULTIPLIERS FOR INDIRECT OFFSET COMMITMENTS IN THE REPUBLIC OF POLAND137
Subject of the commitment Multipliers1. Capital and tangible equity investments: 0.7 – 1.9 1) purchase of stock or shares from the State Treasury, 1.1 – 1.6 2) cash contribution to the share capital of a company, 1.4 – 1.9 3) in-kind contribution to the share capital of a company. 0.7 – 1.3 2. Intangible investments: 0.9 – 2.0 1) transfer of modern technology and know-how in: 0.9 – 2.0 a) metallurgic, iron, and steel industry, 1.5 – 1.8 b) electro-machinery industry, 1.4 – 1.7 c) automotive industry, 1.2 – 1.5 d) chemical industry, 1.9 – 2.0 e) rail-train industry, 0.9 – 1.2 f) pharmaceutical industry, 1.9 – 2.0 g) light industry, 0.9 – 1.1 h) electronic industry, 1.5 – 2.0 i) shipyard industry, 1.5 – 2.0 j) IT field, 1.9 – 2.0 k) other sectors, 0.9 – 1.1 2) transfer of modern licenses in: 0.9 – 1.7 a) metallurgic, iron and steel industry, 1.4 – 1.7 b) electro-machinery industry, 1.2 – 1.5 c) electronic industry, 1.2 – 1.5 d) automotive industry, 1.1 – 1.3 e) shipyard industry, 1.1 – 1.3 f) chemical industry, 1.5 – 1.7 g) rail trains industry, 0.9 – 1.1 h) pharmaceutical industry, 1.4 – 1.7 i) light industry, 0.9 – 1.1 j) IT field, 1.5 – 1.7 k) other sectors, 0.9 – 1.1 3) direct purchase of goods and services manufactured on the territory of Republic of Poland in:
0.5 – 1.8
137 Republic of Poland, Ministry of Economy, “Ordinance of the Counsel of Ministers of 2 July 2002 concerning
the detailed principles for crediting offset commitments of a foreign supplier of armament or military equipment against the offset agreement value,” http://www.mgip.gov.pl/NR/rdonlyres/44734642-D9A7-4BFB-82F1FB48A5443547/12516/offset_mult_ordin_eng.pdf (accessed April 29, 2006).

106
Subject of the commitment Multipliersa) metallurgic, iron and steel industry, 1.5 – 1.8 b) electro-machinery industry, 1.6 – 1.8 c) electronic industry, 1.6 – 1.8 d) automotive industry, 1.2 – 1.4 e) shipyard industry, 1.2 – 1.4 f) chemical industry, 1.2 – 1.4 g) rail-train industry, 1.1 – 1.3 h) pharmaceutical industry, 1.3 – 1.6 i) light industry, 0.9 – 1.1 j) IT field, 1.5 – 1.8 k) other sectors. 0.5 – 1.1 3. Development of R+D+I potential: 1.0 – 2.0 1) offsettee’s participation in an international program, 1.0 – 2.0 2) foreign supplier’s capital participation in offsettee’s R+D works, 1.0 – 2.0 3) implementation of the Polish development (e.g. establishment of the Venture
1.0 – 2.0
4. Support of export of goods manufactured on the territory of Republic of Poland:
0.5 – 1.5
1) sales of goods manufactured on the territory of Republic of Poland through an own
0.5 – 1.5
marketing network, 0.5 – 1.2 2) marketing and promotion support for the export of the Polish goods in third
0.5 – 1.2
5. Training: 0.5 – 1.1 1) connected with the transfer of technology or know-how, 0.7 – 1.1 2) other. 0.5 – 0.9 6. Other fields not specified in items 1 through 5. 0.5 – 2.0

107
APPENDIX C. OFFSET MULTIPLIERS USED IN CASES SPECIALLY JUSTIFIED BY THE ECONOMY OR DUE TO THE
SECURITY AND DEFENSE OF THE STATE IN THE REPUBLIC OF POLAND138
Cases in which offset multipliers ranging from 2.0 to 5.0 may be applied Multipliers1. Transfer of modern technology, substantiated by prospective orders, which will result, within the implementation of the same offset agreement, in initiation of production basing on that technology.
3 – 5
2. Participation in modernization and restructuring of defense industry sector through capital equity investments, which will result in significant increase of export production and number of work places.
2 - 4
3. Transfer of technology with exclusivity for prospective production and sales on foreign market.
2 – 5
4. Free-of-charge and non-returnable transfer to a budgetary entity, for which the armament or military equipment was bought and delivery of which was subject to offset, of equipment for operation of that armament or military equipment and its technical documentation, enabling usage in accordance with the purpose of the purchased armament or military equipment and its maintenance in technical operation.
2 – 4
5. Transfer to the research and development entity or Polish higher education entity, of software or other modern IT tool which will support that entity’s operation within the scope of design, production, or marketing.
2 – 3
6. Commissioning to a research and development entity or Polish higher education entity, within a joint R+D+I program, of package of works leading to rapid development of science sectors weakly recognized in Poland, which will result in significant increase research and production potential.
2 – 5
7. Commissioning to a research entity, within a joint R+D+I program, guarantee the undertaking of production Polish entrepreneurs.
2 – 4
138 Republic of Poland, Ministry of Economy, “Ordinance of the Counsel of Ministers of 2 July 2002 concerning
the detailed principles for crediting offset commitments of a foreign supplier of armament or military equipment against the offset agreement value,” http://www.mgip.gov.pl/NR/rdonlyres/44734642-D9A7-4BFB-82F1FB48A5443547/12516/offset_mult_ordin_eng.pdf (accessed April 29, 2006).

108
THIS PAGE INTENTIONALLY LEFT BLANK

109
APPENDIX D. OFFSET COMMITMENTS LIST INCLUDED IN MASTER OFFSET AGREEMENT139
No ID no Offset commitment Offsetor Offsetee 1 1-100 Creation of the professional
nation mobile communication system according to the Tetra standard.
Motorola Inc. ZR Radmor S.A., Gdynia, Computerland S.A., Procom S.A.
2 1-105 Support for the FAA certification and export to South and North America of the M-28 and M-18 aircraft. Upgrade of this aircraft models. Cooperation with PZM Mielec for assembly other types of aircraft.
Addison Equipment Company; AvCraft Aviation
Polskie Zakłady Lotnicze Sp. z o.o., Mielec
3 1-107 Transfer of technology for manufacturing wind power stations and the rights to sell them to the European Union’s market.
Winvid, Belgium CNPEP Radwar S.A., Warszawa PZL-Świdnik S.A., Świdnik
4 1-110 Capital contribution to the modernization of WSK PZL-Rzeszów S.A.
United Technologies Corporation / Pratt&Whitney, East Hartford, Ct. U.S.
WSK PZL-Rzeszów S.A. , Rzeszów
5 1-112 Creation of the Materiel Analysis Center at the Aeronautics Institute.
United Technologies Corporation/ Pratt&Whitney, East Hartford, Ct. U.S.
Instytut Lotnictwa, Warszawa
6 1-114 Purchase of aircraft parts from Polskie Zakłady Lotnicze Sp. z o.o.
United Technologies Corporation/ Pratt&Whitney, East Hartford, Ct. U.S.
Polskie Zakłady Lotnicze Sp. z o.o., Mielec
7 1-115 Accommodation of the Wojskowe Zakłady Lotnicze (Military Aeronautics Plant) # 4
United Technologies Corporation /
Wojskowe Zakłady Lotnicze Nr 4, Warszawa
139 Republic of Poland, Ministry of Economy, “List of Offset Commitments Included in the Master Offset
Agreement,”http://www.mgip.gov.pl/NR/rdonlyres/565CC648-937F-4F03-99B2-C256C67BD475/0/lista_zobowiazan.doc (accessed April 29, 2006).
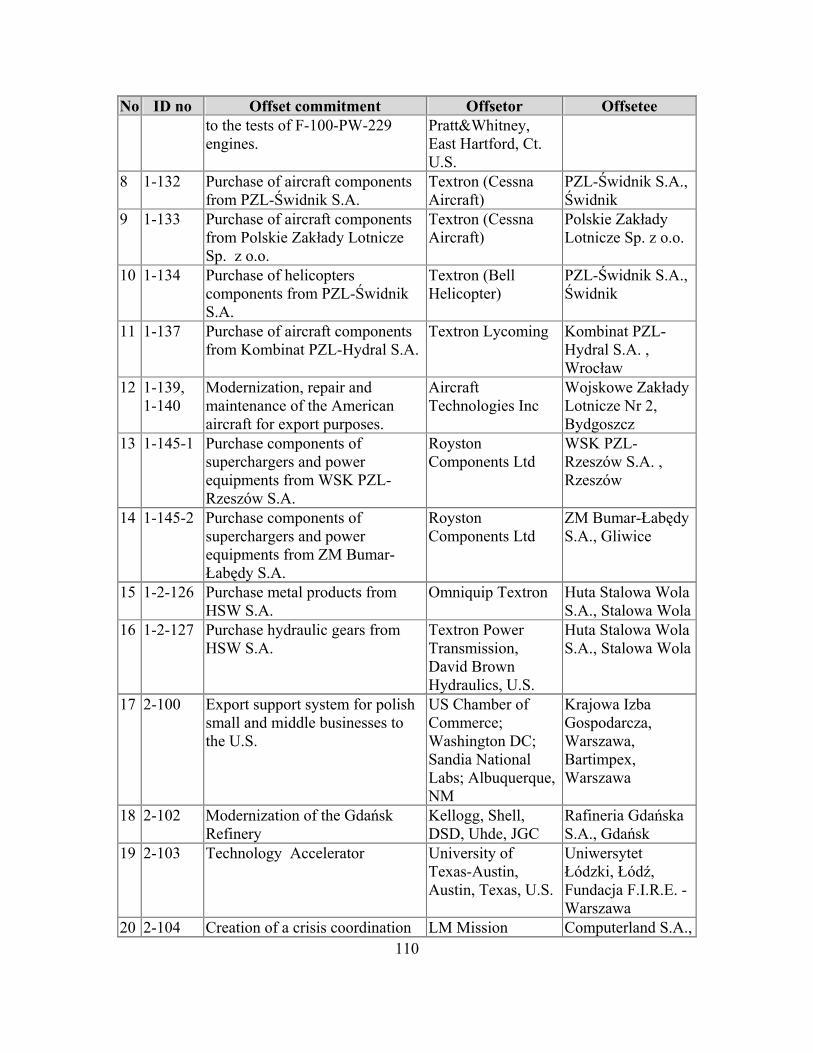
110
No ID no Offset commitment Offsetor Offsetee to the tests of F-100-PW-229 engines.
Pratt&Whitney, East Hartford, Ct. U.S.
8 1-132 Purchase of aircraft components from PZL-Świdnik S.A.
Textron (Cessna Aircraft)
PZL-Świdnik S.A., Świdnik
9 1-133 Purchase of aircraft components from Polskie Zakłady Lotnicze Sp. z o.o.
Textron (Cessna Aircraft)
Polskie Zakłady Lotnicze Sp. z o.o.
10 1-134 Purchase of helicopters components from PZL-Świdnik S.A.
Textron (Bell Helicopter)
PZL-Świdnik S.A., Świdnik
11 1-137 Purchase of aircraft components from Kombinat PZL-Hydral S.A.
Textron Lycoming Kombinat PZL-Hydral S.A. , Wrocław
12 1-139, 1-140
Modernization, repair and maintenance of the American aircraft for export purposes.
Aircraft Technologies Inc
Wojskowe Zakłady Lotnicze Nr 2, Bydgoszcz
13 1-145-1 Purchase components of superchargers and power equipments from WSK PZL-Rzeszów S.A.
Royston Components Ltd
WSK PZL-Rzeszów S.A. , Rzeszów
14 1-145-2 Purchase components of superchargers and power equipments from ZM Bumar-Łabędy S.A.
Royston Components Ltd
ZM Bumar-Łabędy S.A., Gliwice
15 1-2-126 Purchase metal products from HSW S.A.
Omniquip Textron Huta Stalowa Wola S.A., Stalowa Wola
16 1-2-127 Purchase hydraulic gears from HSW S.A.
Textron Power Transmission, David Brown Hydraulics, U.S.
Huta Stalowa Wola S.A., Stalowa Wola
17 2-100 Export support system for polish small and middle businesses to the U.S.
US Chamber of Commerce; Washington DC; Sandia National Labs; Albuquerque, NM
Krajowa Izba Gospodarcza, Warszawa, Bartimpex, Warszawa
18 2-102 Modernization of the Gdańsk Refinery
Kellogg, Shell, DSD, Uhde, JGC
Rafineria Gdańska S.A., Gdańsk
19 2-103 Technology Accelerator University of Texas-Austin, Austin, Texas, U.S.
Uniwersytet Łódzki, Łódź, Fundacja F.I.R.E. - Warszawa
20 2-104 Creation of a crisis coordination LM Mission Computerland S.A.,
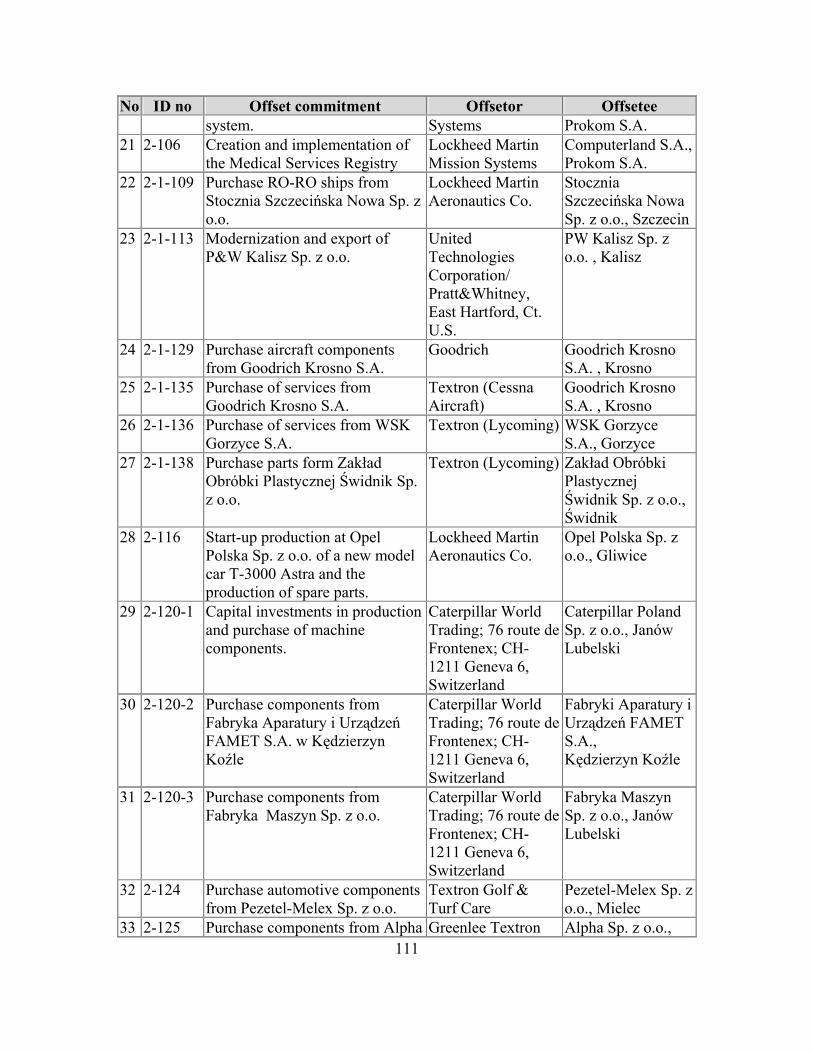
111
No ID no Offset commitment Offsetor Offsetee system. Systems Prokom S.A.
21 2-106 Creation and implementation of the Medical Services Registry
Lockheed Martin Mission Systems
Computerland S.A., Prokom S.A.
22 2-1-109 Purchase RO-RO ships from Stocznia Szczecińska Nowa Sp. z o.o.
Lockheed Martin Aeronautics Co.
Stocznia Szczecińska Nowa Sp. z o.o., Szczecin
23 2-1-113 Modernization and export of P&W Kalisz Sp. z o.o.
United Technologies Corporation/ Pratt&Whitney, East Hartford, Ct. U.S.
PW Kalisz Sp. z o.o. , Kalisz
24 2-1-129 Purchase aircraft components from Goodrich Krosno S.A.
Goodrich Goodrich Krosno S.A. , Krosno
25 2-1-135 Purchase of services from Goodrich Krosno S.A.
Textron (Cessna Aircraft)
Goodrich Krosno S.A. , Krosno
26 2-1-136 Purchase of services from WSK Gorzyce S.A.
Textron (Lycoming) WSK Gorzyce S.A., Gorzyce
27 2-1-138 Purchase parts form Zakład Obróbki Plastycznej Świdnik Sp. z o.o.
Textron (Lycoming) Zakład Obróbki Plastycznej Świdnik Sp. z o.o., Świdnik
28 2-116 Start-up production at Opel Polska Sp. z o.o. of a new model car T-3000 Astra and the production of spare parts.
Lockheed Martin Aeronautics Co.
Opel Polska Sp. z o.o., Gliwice
29 2-120-1 Capital investments in production and purchase of machine components.
Caterpillar World Trading; 76 route de Frontenex; CH-1211 Geneva 6, Switzerland
Caterpillar Poland Sp. z o.o., Janów Lubelski
30 2-120-2 Purchase components from Fabryka Aparatury i Urządzeń FAMET S.A. w Kędzierzyn Koźle
Caterpillar World Trading; 76 route de Frontenex; CH-1211 Geneva 6, Switzerland
Fabryki Aparatury i Urządzeń FAMET S.A., Kędzierzyn Koźle
31 2-120-3 Purchase components from Fabryka Maszyn Sp. z o.o.
Caterpillar World Trading; 76 route de Frontenex; CH-1211 Geneva 6, Switzerland
Fabryka Maszyn Sp. z o.o., Janów Lubelski
32 2-124 Purchase automotive components from Pezetel-Melex Sp. z o.o.
Textron Golf & Turf Care
Pezetel-Melex Sp. z o.o., Mielec
33 2-125 Purchase components from Alpha Greenlee Textron Alpha Sp. z o.o.,

112
No ID no Offset commitment Offsetor Offsetee Sp. z o.o. Kraków
34 2-128 Capital investment and purchase electronic car components from Kimball Electronics Polska Sp. z o.o.
Kimball Electronics Group, Jasper, Indiana, U.S.
Kimball Electronic Polska Sp. z o.o., Poznań
35 2-131 Building of a simulators and training systems by ETC-PZL
Environmental Tectonics Corp.
ETC-PZL Sp. z o.o., Warszawa
36 2-133 Production of F-16 aircraft simulators
L-3 Communications; Link Simulation & Training; 2200 Arlington Downs; Arlington, Texas 76011 U.S.
ETC-PZL Sp. z o.o., Warszawa
37 2-134-1 Purchase aircraft components from Wytwórnia Aparatury Wtryskowej Mielec Sp. z o.o.
Royston Components Ltd
Wytwórnia Aparatury Wtryskowej Mielec Sp. z o.o., Mielec
38 2-134-2 Purchase supercharger components from Przedsiębiorstwo Automatyki Przemysłowej in Rzeszów
Royston Components Ltd
Przedsiębiorstwo Automatyki Przemysłowej, Rzeszów
39 2-134-3 Purchase supercharger components from Kuźni Glinik Sp. z o.o.
Royston Components Ltd
Kuźnia Glinik Sp. z o.o., Gorlice
40 2-134-4 Purchase automotive components from Teksid Aluminium Poland Sp. z o.o.
Royston Components Ltd
Teksid Aluminium Poland Sp. z o.o., Bielsko-Biała
41 2-134-5 Purchase automotive components from Andoria-MOT Sp. z o.o.
Royston Components Ltd
Andoria-MOT Sp. z o.o., Andrychów
42 2-134-6 Purchase machine components from Sipma S.A.
Royston Components Ltd
Sipma S.A., Lublin
43 2-137 Investment to restructuring of the Polish pharmaceutical industry and start-up of drug production.
Lockheed Martin Aeronautics Co.
Instytut Biotechnologii Antybiotyków, Warszawa, Bioton Sp. z o.o., Ożarów Mazowiecki
44 2-138 Production and export of blue laser
LM Areo TopGaN Sp. z o.o., Warszawa Instytut Wysokich Ciśnień PAN, Warszawa

113
APPENDIX E. THE LIST OF LOCKHEED MARTIN’S OFFSET140
No
Number of
commit-ments
Nominal value
(without multi-plier)
Offset value (with
applied offset multi-plier)
Type of
commitment
Number of
commit-ments
Nominal value
(without multiplier)
Offset value (with
applied offset
multiplier)
% of
total value
Direct Offset Commitments Purchase of goods and services
16 1,701 2861 22.7
Transfer of technology and training
5 740 1510 12
Financial/materiel contribution
5 199 481 3.7
1 16 (27)
2,665 4,902
Other 1 25 50 0.7 Indirect Offset Commitments
Purchase of goods and services
26 3,450 4785 38.1
Transfer of technology and training
10 537 1268 10,1
Financial/materiel contribution
7 291 627 5.0
2 28 (47)
5,086 7,645
Other 4 808 965 7.7 44 7,751 12,547 Total 74 7,751 12547 100
140 Republic of Poland, Ministry of Economy, “The Juxtaposition of Lockheed Martin’s Offset Commitments,”
http://www.mgip.gov.pl/NR/rdonlyres/D388B4F0-F028-4D79-A15F-B5EFD29BDC8F/0/zestawienie_zbiorcze.doc (accessed April 29, 2006).

114
THIS PAGE INTENTIONALLY LEFT BLANK
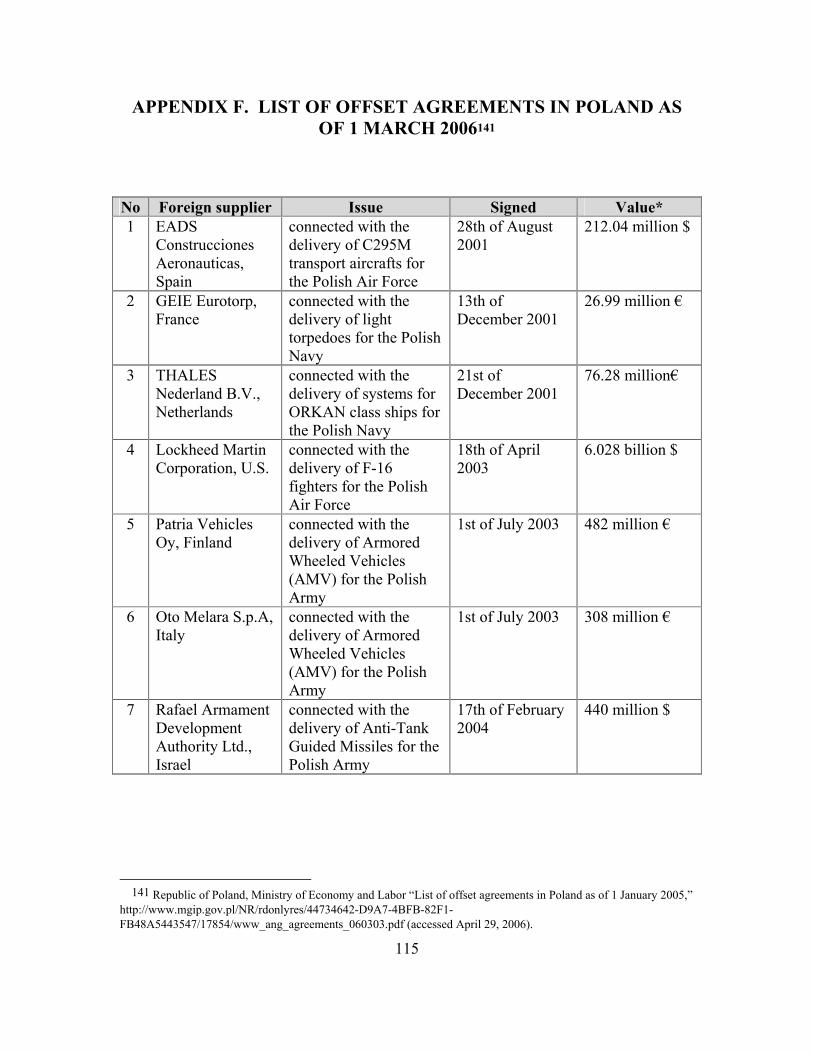
115
APPENDIX F. LIST OF OFFSET AGREEMENTS IN POLAND AS OF 1 MARCH 2006141
No Foreign supplier Issue Signed Value* 1 EADS
Construcciones Aeronauticas, Spain
connected with the delivery of C295M transport aircrafts for the Polish Air Force
28th of August 2001
212.04 million $
2 GEIE Eurotorp, France
connected with the delivery of light torpedoes for the Polish Navy
13th of December 2001
26.99 million €
3 THALES Nederland B.V., Netherlands
connected with the delivery of systems for ORKAN class ships for the Polish Navy
21st of December 2001
76.28 million€
4 Lockheed Martin Corporation, U.S.
connected with the delivery of F-16 fighters for the Polish Air Force
18th of April 2003
6.028 billion $
5 Patria Vehicles Oy, Finland
connected with the delivery of Armored Wheeled Vehicles (AMV) for the Polish Army
1st of July 2003 482 million €
6 Oto Melara S.p.A, Italy
connected with the delivery of Armored Wheeled Vehicles (AMV) for the Polish Army
1st of July 2003 308 million €
7 Rafael Armament Development Authority Ltd., Israel
connected with the delivery of Anti-Tank Guided Missiles for the Polish Army
17th of February 2004
440 million $
141 Republic of Poland, Ministry of Economy and Labor “List of offset agreements in Poland as of 1 January 2005,”
http://www.mgip.gov.pl/NR/rdonlyres/44734642-D9A7-4BFB-82F1-FB48A5443547/17854/www_ang_agreements_060303.pdf (accessed April 29, 2006).

116
THIS PAGE INTENTIONALLY LEFT BLANK

117
APPENDIX G. AOA PLAN142
The first major step for successful AoA plan is construction and coordination
of the analysis plan. A recommended outline of the AoA plan may incorporate following
points:
• Introduction
• Background
• Purpose
• Scope
• Ground Rules
• Scenarios
• Threats
• Environment
• Constraints and Assumptions
• Alternatives
• Description of Alternatives
• Nonviable Alternatives
• Operation Concepts
• Support Concepts
• Determination of Effectiveness Measures
• Mission Task
• Measures of Effectiveness
• Measures of Performance
• Effectiveness Analysis
• Effectiveness Methodology
• Model, Simulations and Data
• Effectiveness Sensitivity Analysis
• Cost Analysis
• Lifecycle Cost Methodology
142 DAU, “Defense Acquisition Guidebook,” para. 3.3.1.

118
• Models and Data
• Cost Sensitivity or/and Risk Analysis
• Cost Effectiveness Comparison
• Cost Effectiveness Methodology
• Displays or Presentation Formats
• Criteria for Screening Alternatives
• Organization and Management
• Study Team/Organization
• AoA Review Process
• Schedule
It must be pointed that every AoA is unique and may be adjusted to the
particular situation. The proposal of AoA plan above may be used as a framework to
tailor AoA to support given situation.

119
APPENDIX H. SUPPORTABILITY ANALYSIS143
143 From: Blanchard, Logistic Engineering and Management, 199.
SUPPORTABILITY ANALYSIS
(SA)
EFFECTIVE MAINTENANCE AND
SUPPORT INFRASTRUCTURE
SYSTEM REQUIREMENTS
LIFE-CYCLE COST
ANALYSIS
MAINTENANCE TASK
ANALYSIS
RELIABILITY-CENTERED MAINTE-
NANCE ANALYSIS
PERSONNEL TRAINNING
REQUIREMENTS
SYSTEM OPERATIONAL
REQUIREMENTS
FAILURE, MODE, EFFECTS AND CRITI-CALITY ANALYSIS
RELIABILITY AND MAINTAINABILITY
PREDICTIONS
OPERATOR TASK
ANALYSIS
FACILITY/UTILITY ANALYSIS
LEVEL OF REPAIR ANALYSIS
TEST AND SUPPORT EQUIPMENT ANALYSIS
SPARES/REPAIR PARTS AND INVEN-
TORY ANALYSIS
TRANSPORTAITON AND DISTRIBUTION
ANALYSIS
DATA REQUIREMENTS AND INF. SYST.

120
THIS PAGE INTENTIONALLY LEFT BLANK

121
APPENDIX I. AIRCRAFT OPERATING AND SUPPORT COST ELEMENT STRUCTURE144
1.0 MISSION PERSONNEL 1.1 OPERATIONS 1.2 MAINTENANCE 1.3 OTHER MISSION PERSONNEL 2.0 UNIT-LEVEL CONSUMPTION 2.1 POL/ENERGY CONSUMPTION 2.2 CONSUMABLE MATERIAL/REPAIR PARTS 2.3 DEPOT-LEVEL REPARABLES 2.4 TRAINING MUNITIONS/EXPENDABLE STORES 2.5 OTHER 3.0 INTERMEDIATE MAINTENANCE (EXTERNAL TO UNIT) 3.1 MAINTENANCE 3.2 CONSUMABLE MATERIAL/REPAIR PARTS 3.3 OTHER 4.0 DEPOT MAINTENANCE 4.1 OVERHAUL/REWORK 4.2 OTHER 5.0 CONTRACTOR SUPPORT 5.1 INTERIM CONTRACTOR SUPPORT 5.2 CONTRACTOR LOGISTICS SUPPORT 5.3 OTHER 6.0 SUSTAINING SUPPORT 6.1 SUPPORT EQUIPMENT REPLACEMENT 6.2 MODIFICATION KIT PROCUREMENT/INSTALLATION 6.3 OTHER RECURRING INVESTMENT 6.4 SUSTAINING ENGINEERING SUPPORT 6.5 SOFTWARE MAINTENANCE SUPPORT 6.6 SIMULATOR OPERATIONS 6.7 OTHER 7.0 INDIRECT SUPPORT 7.1 PERSONNEL SUPPORT 7.2 INSTALLATION SUPPORT
144 From: OSD, “Operating and Support Cost-Estimating Guide,” Appendix C.

122
AIRCRAFT OPERATING AND SUPPORT COST ELEMENT STRUCTURE DEFINITIONS
1.0 MISSION PERSONNEL
The mission personnel element includes the cost of pay and allowances of officer, enlisted, and civilian personnel required to operate, maintain, and support a discrete operational system or deployable unit. This includes the personnel necessary to meet combat readiness, unit training, and administrative requirements. For units that operate more than one type of aircraft system, personnel requirements will be allocated on a relative workload basis. The personnel costs will be based on manning levels and skill categories. Note: Pay and allowances for officer and enlisted personnel should be based on the
standard composite rate, which includes the following elements: basic pay, retired pay accrual, incentive pay, special pay, basic allowance for quarters, variable housing allowance, basic allowance for subsistence, hazardous duty pay, reenlistment bonuses, clothing allowances, overseas station allowances, uniform allowances, family separation allowances, separation payments, and social security contributions.
Pay and allowances for civilian personnel should be based on the standard
composite rate, which includes the following elements: basic pay, additional variable payments for overtime, holiday pay, night differentials, cost-of-living allowances, and the government contribution to employee benefits, insurance, retirement, and the Federal Insurance Contribution Act.
1.1 OPERATIONS. The pay and allowances for the full complement of aircrew personnel required to operate a system. Aircrew composition includes the officers and enlisted personnel (pilot, non-pilot, and crew technicians) required to operate the aircraft of a deployable unit. 1.2 MAINTENANCE. The pay and allowances of military and civilian personnel who perform maintenance on and provide ordnance support to assigned aircraft, associated support equipment, and unit-level training devices. Depending on the maintenance concept and organizational structure, this element will include maintenance personnel at the organizational level and possibly the intermediate level145. A brief description of these maintenance categories is shown below:
• Organizational Maintenance. Personnel who perform on-equipment maintenance for unit aircraft.
• Intermediate Maintenance. Personnel who perform off-equipment
145 For example, in a typical deployable Air Force unit, intermediate-level maintenance personnel are normally assigned to the same wing as the organizational maintenance personnel. Depending upon the weapon system, the other DoD components may integrate required intermediate-level maintenance personnel into a composite deployable unit according to the number of systems to be deployed.

123
maintenance for unit aircraft. If intermediate-level maintenance is provided by a separate support organization (e.g., a centralized intermediate maintenance support activity) the costs should be reported in element 3.0, Intermediate Maintenance (External to Unit).
• Ordnance Maintenance. Personnel performing maintenance and service functions for aircraft munitions, missiles, and related systems. Also includes personnel needed for loading, unloading, arming, and rearming of unit munitions; inspecting, testing, and maintaining of aircraft weapons and release systems; activation and deactivation of aircraft gun systems; and maintenance and handling of the munitions stockpile authorized by the war reserve material plan.
• Other Maintenance Personnel. Personnel not covered above. Includes those personnel that support equipment maintenance, simulator maintenance, and Chief of Maintenance functions related to the system whose costs are being estimated.
1.3 OTHER MISSION PERSONNEL. The pay and allowances of military and civilian personnel, who perform unit staff, security, and other mission support activities. The number and type of personnel in this category will vary depending on the requirements of the particular system. These billets exist only to support the system whose costs are being estimated. Some examples are:
• Unit Staff. Personnel required for unit command, administration, flying supervision, operations control, planning, scheduling, flight safety, aircrew quality control, etc.
• Security. Personnel required for system security. Duties may include entry control, close and distant boundary support, and security alert operations.
• Other Support. Personnel required for staff information, logistics, ground safety, fuel and munitions handling, and simulator operations as well as for special mission support functions such as intelligence, photo interpretation, etc.
2.0 UNIT-LEVEL CONSUMPTION Unit-level consumption includes the cost of fuel and energy resources; operations, maintenance, and support materials consumed at the unit level; stock fund reimbursements for depot-level reparables; operational munitions expended in training; transportation in support of deployed unit training; temporary additional duty/temporary duty (TAD/TDY) pay; and other unit-level consumption costs, such as purchased services for equipment leases and service contracts.

124
2.1 POL/ENERGY CONSUMPTION. The unit-level cost of petroleum, oil, and lubricants (POL), propulsion fuel, and fuel additives required for peacetime flight operations. Includes in-flight and ground consumption, and an allowance for POL distribution, storage, evaporation, and spillage. May also include field-generated electricity and commercial electricity if necessary to support the operation of the system. 2.2 CONSUMABLE MATERIAL/REPAIR PARTS. The costs of material consumed in the operation, maintenance, and support of an aircraft system and associated support equipment at the unit level. Depending on the maintenance concept or organizational structure, consumption at the intermediate level should be reported either in this element or in element 3.0, Intermediate Maintenance (External to Unit). Costs need not be identified at the level of detail shown below; the descriptions are intended merely to illustrate the various types of materials encompassed in this element:
• Maintenance Material. The cost of material expended during maintenance. Examples include consumables and repair parts such as transistors, capacitors, gaskets, fuses, and other bit-and-piece material.
• Operational Material. The cost of non-maintenance material consumed in operating a system and support equipment. Examples include coolants, deicing fluids, tires, filters, batteries, paper, diskettes, ribbons, charts, and maps.
• Mission Support Supplies. The cost of supplies and equipment expended in support of mission personnel. Examples include items relating to administration, housekeeping, health, and safety.
2.3 DEPOT-LEVEL REPARABLES. The unit-level cost of reimbursing the stock fund for purchases of depot-level reparable (DLR) spares (also referred to as exchangeables) used to replace initial stocks. DLRs may include repairable individual parts, assemblies, or subassemblies that are required on a recurring basis for the repair of major end items of equipment. Note: Defense Management Report Decisions (DMRDs) 901 and 904 of November
1989 proposed the establishment of a Defense Business Operations Fund (DBOF) under which DLRs would be consolidated under stock fund management. The cost of DLRs, previously a free issue to the consumer, must now be funded and budgeted by the resource user. A surcharge is added to the price of DBOF items to recover the cost of stock fund operations.
2.4 TRAINING MUNITIONS/EXPENDABLE STORES. The cost of expendable stores consumed in unit-level training. Includes the cost of live and inert ammunition, bombs, rockets, training missiles, sonobuoys, and pyrotechnics expended in noncombat operations (such as firepower demonstrations) and training exercises.

125
2.5 OTHER. Include in this element any significant unit-level consumption costs not otherwise accounted for. The costs identified must be related to the system whose operating and support requirements are being assessed. Possible examples are:
• Purchased Services. The cost of special support equipment, communication circuits, and vehicles, including service contracts for custodial services, computers, and administrative equipment.
• Transportation. The deployed unit transportation cost of moving primary mission and support equipment, repair parts, secondary items, POL, and ammunition to and from training areas. May also include transportation costs for items procured or shipped by the unit. Excluded are transportation costs for reparables acquired through DBOF.
• TAD/TDY. Temporary additional duty or temporary duty (TAD/ TDY) pay. The cost of unit personnel travel for training, administrative, or other purposes such as crew rotations, deployments, or follow-on tests and evaluation. Includes commercial transportation charges, rental costs for passenger vehicles, mileage allowances, and subsistence expenses (e.g., per diem allowances and incidental travel expenses).
3.0 INTERMEDIATE MAINTENANCE (EXTERNAL TO UNIT)
Intermediate maintenance performed external to a unit includes the cost of labor and material and other costs expended by designated activities/units (third and fourth echelon) in support of an aircraft system and associated support equipment. Intermediate maintenance activities include calibration, repair, and replacement of parts, components, or assemblies, and technical assistance. 3.1 MAINTENANCE. The pay and allowances of military and civilian personnel who perform intermediate maintenance on an aircraft system, associated support equipment, and unit-level training devices. 3.2 CONSUMABLE MATERIAL/REPAIR PARTS. The costs of repair parts, assemblies, subassemblies, and material consumed in the maintenance and repair of aircraft, associated support equipment, and unit-level training devices. 3.3 OTHER. Include in this element any significant intermediate maintenance costs not otherwise accounted for. For example, this could include the cost of transporting subsystems or major end items to a base or depot facility.
4.0 DEPOT MAINTENANCE Depot maintenance includes the cost of labor, material, and overhead incurred in performing major overhauls or maintenance on aircraft, their components, and associated

126
support equipment at centralized repair depots, contractor repair facilities, or on site by depot teams. Some depot maintenance activities occur at intervals ranging from several months to several years. As a result, the most useful method of portraying these costs is on an annual basis (e.g., cost per aircraft system per year) or an operating-hour basis. Note: The cost of depot-level reparables (DLRs) or exchangeables acquired through
DBOF should be reported in element 2.0, Unit-Level Consumption. 4.1 OVERHAUL/REWORK. The labor, material, and overhead costs for overhaul or rework of aircraft returned to a centralized depot facility. Includes programmed depot maintenance, analytic condition inspections, and unscheduled depot maintenance. Costs of major aircraft subsystems that have different overhaul cycles (i.e., airframe, engine, avionics, armament, support equipment) should be identified separately within this element. 4.2 OTHER. Include in this element any significant depot maintenance activities not otherwise accounted for. For example, this could include component repair costs for reparables not managed by the DBOF, second-destination transportation costs for weapons systems or subsystems requiring major overhaul or rework, or contracted unit-level support. Note: Not all reparable items are acquired through DBOF. Centrally funded
accounts may continue to finance items such as classified program DLRs, conventional and nuclear munitions items, and certain cryptologic electronics and telecommunication items.
5.0 CONTRACTOR SUPPORT
Contractor support includes the cost of contractor labor, materials, and overhead incurred in providing all or part of the logistics support required by an aircraft system, subsystem, or associated support equipment. Contract maintenance is performed by commercial organizations using contractor personnel, material, equipment, and facilities or government-furnished material, equipment, and facilities. Contractor support may be dedicated to one or multiple levels of maintenance and may take the form of interim contractor support (ICS) if the services are provided on a temporary basis or contractor logistics support (CLS) if the support extends over the operational life of a system. Other contractor support may be purchased for engineering and technical services. 5.1 INTERIM CONTRACTOR SUPPORT. Interim contractor support (ICS) includes the burdened cost of contract labor, material, and assets used in providing temporary logistics support to a weapon system, subsystem, and associated support equipment. The purpose of ICS is to provide total or partial logistics support until a government maintenance capability is developed. 5.2 CONTRACTOR LOGISTICS SUPPORT. Contractor logistics support (CLS) includes the burdened cost of contract labor, material, and assets used in providing support to an aircraft system, subsystem, and associated support equipment. CLS funding covers depot maintenance and, as negotiated with the operating command, necessary organizational

127
and intermediate maintenance activities. If CLS is selected as the primary means of support, all functional areas included in the CLS cost should be identified. 5.3 OTHER. Include in this element any contractor support costs not otherwise accounted for. For example, if significant, the burdened cost of contract labor for contractor engineering and technical services should be reported here. Note: Contractor support during the pre-operational phase of a system is typically
funded as a system development or investment cost. However, post-operational contractor support is an O&S cost and should be addressed in this element.
After the ICS period, the government assumes responsibility for supporting a
weapon system. However, contractor support may still be employed in specific functional areas, such as sustaining engineering, software maintenance, simulator operations, and selected depot maintenance functions. Applicable contractor costs should be reported against these elements in the CES. To avoid double counting, the contractor support element should be annotated to identify any contractor costs that are reported in other elements.
6.0 SUSTAINING SUPPORT
Sustaining support includes the cost of replacement support equipment, modification kits, sustaining engineering, software maintenance support, and simulator operations provided for an aircraft system. War readiness material is specifically excluded. 6.1 SUPPORT EQUIPMENT REPLACEMENT. The costs incurred to replace equipment that is needed to operate or support an aircraft, aircraft subsystems, training systems, and other associated support equipment. The support equipment being replaced (e.g., tools and test sets) may be unique to the aircraft or it may be common to a number of aircraft systems, in which case the costs must be allocated among the respective systems. Note: This element addresses replacement equipment only. The costs of initial
support equipment are specifically excluded. 6.2 MODIFICATION KIT PROCUREMENT/INSTALLATION. The costs of procuring and installing modification kits and modification kit initial spares (after production and deployment) required for an aircraft and associated support and training equipment. Includes only those modification kits needed to achieve acceptable safety levels, overcome mission capability deficiencies, improve reliability, or reduce maintenance costs. Excludes modifications undertaken to provide additional operational capability not called for in the original design or performance specifications. 6.3 OTHER RECURRING INVESTMENT. Include in this element any significant recurring investment costs not otherwise accounted for.

128
6.4 SUSTAINING ENGINEERING SUPPORT. The labor, material, and overhead costs incurred in providing continued systems engineering and program management oversight to determine the integrity of a system, to maintain operational reliability, to approve design changes, and to ensure system conformance with established specifications and standards. Costs in this category may include (but are not limited to) government and/or contract engineering services, technical advice, and training for component or system installation, operation, maintenance, and support. 6.5 SOFTWARE MAINTENANCE SUPPORT. The labor, material, and overhead costs incurred after deployment by depot-level maintenance activities, government software centers, laboratories, or contractors for supporting the update, maintenance and modification, integration, and configuration management of software. Includes operational, maintenance, and diagnostic software programs for the primary system, support equipment, and training equipment. The respective costs of operating and maintaining the associated computer and peripheral equipment in the software maintenance activity should also be included. Not included are the costs of major redesigns, new development of large interfacing software, and modifications that change functionality. 6.6 SIMULATOR OPERATIONS. The costs incurred to provide, operate, and maintain on-site or centralized simulator training devices for an aircraft system, subsystem, or related equipment. This may include the labor, material, and overhead costs of simulator operations by military and/or civilian personnel, or by private contractors. Note: On-site simulator operations and maintenance that are an integral part of unit
manning and unit consumption should be reported as unit-level mission costs for the system in question. However, the costs of all contract-funded simulator operations and all centralized government simulator operations should be reported in this element.
6.7 OTHER. Include in this element any significant sustaining support costs not otherwise accounted for. Examples might include the costs of follow-on operational tests and evaluation, such as range costs, test support, data reduction, and test reporting.
7.0 INDIRECT SUPPORT Indirect support includes the costs of personnel support for specialty training, permanent changes of station, and medical care. Indirect support also includes the costs of relevant host installation services, such as base operating support and real property maintenance. 7.1 PERSONNEL SUPPORT. Personnel support includes the cost of system-specific and related specialty training for military personnel who are replacing individuals lost through attrition. Also included in this element are permanent change of station costs, and the cost of medical care. Each of these elements should be addressed separately. Descriptions are provided below:

129
• Specialty Training. The cost of system-specific training (non-investment funded) and specialty training for military personnel who are replacing individuals lost through attrition. For example, specialty training costs may include undergraduate pilot training, non-pilot aircrew training, non-aircrew officer training, and enlisted specialty training. Replacement specialty training costs should be calculated for those personnel associated with the system being investigated. Training costs should include government non-pay-related training costs (course support costs, materials, per diem, travel, etc.) as well as the cost of pay and allowances for trainees, instructors, and training support personnel. Excluded are recruiting, accession, basic military training, and separation costs.
Note: The cost of initial course development and training of Service instructors at contractor facilities is normally categorized as a system investment cost. However, the follow-on training costs of military and civilian personnel attending factory schools, as well as the cost of attending Service conducted school-house specialty training, are O&S costs and should be reported in this element.
Normally, the costs of acquisition for recruiting, accession, and basic military
training will not be included. However, if a significant change in Service recruiting and training objectives is required in order to support the system being assessed, then these costs should be addressed.
• Permanent Change of Station (PCS). The cost of moving replacement
personnel to and from overseas theaters and within the continental US.
• Medical Support. The cost of personnel pay and allowances and material needed to provide medical support to system-specific mission and related military support personnel.
7.2. INSTALLATION SUPPORT. Consists of personnel normally assigned to the host installation who are required for the unit to perform its mission in peacetime. Include only those personnel and costs that are directly affected by a change in the number of aircraft and associated mission personnel. Functions performed by installation support personnel include:
• Base Operating Support. The cost of personnel pay and allowances and material necessary to provide support to system-specific mission- related personnel. Base operating support activities may include functions such as communications, supply operations, personnel services, installation security, base transportation, etc.
• Real Property Maintenance. The cost of personnel pay and allowances, material, and utilities needed for the maintenance and operation of system-specific mission-related real property and for civil engineering support and services.

130
THIS PAGE INTENTIONALLY LEFT BLANK

131
APPENDIX J. TIME-SERIES FORECASTING TECHNIQUES AND MEASURES OF ERROR146
A. TIME-SERIES FORECASTING TECHNIQUES
1. The Three-Year Moving Average (MA3)
The MA3 uses the average of the past three observations to forecast for the
current period. The number of data points in each average remains constant and includes
the most recent observations.
The formula for an MA3 is:
∑−=
+ =t
tiit YF
21 3
1 (1)
Where 1+tF is the current forecast, iY is the ith observation, and t is the sequence
order number of the observation before the current forecast. The reason the order of the
MA is three and not a higher order, such as five, which could possibly result in better
forecasting, is due to the fact that the data series are small and having a larger order
would greatly restrict the number of figures forecasted. Applying the method of moving
averages to a set of data containing a trend gives forecasts that continually underestimate
the actual values. (The same problem of lagging behind actual values exists when
randomness is present).147
2. Single Exponential Smoothing (SES)
The SES method uses the following formula to forecast for the next period:
( )tttt FYFF −+=+ αα1 (2)
where, tF is the most recent forecast, 1+tF is the current forecast, tY is the most recent
observation, and alpha is a weight value between 0 and 1. The level of alpha dictates how
much the previous forecast error is weighted, the weight of the previous error increases as
146 Adapted from Spyros Makridakis and Steven C. Wheelwright, Forecasting: Methods and Applications, (New
York: John Wiley & Sons, Inc., 1978) and Jeffrey M. Moore and Larry R. Weatherford, Decision Modeling within Microsoft® Excel, 6th ed. (Upper Saddle River, NJ: Prentice Hall, 2001).
147 Ibid., 55.
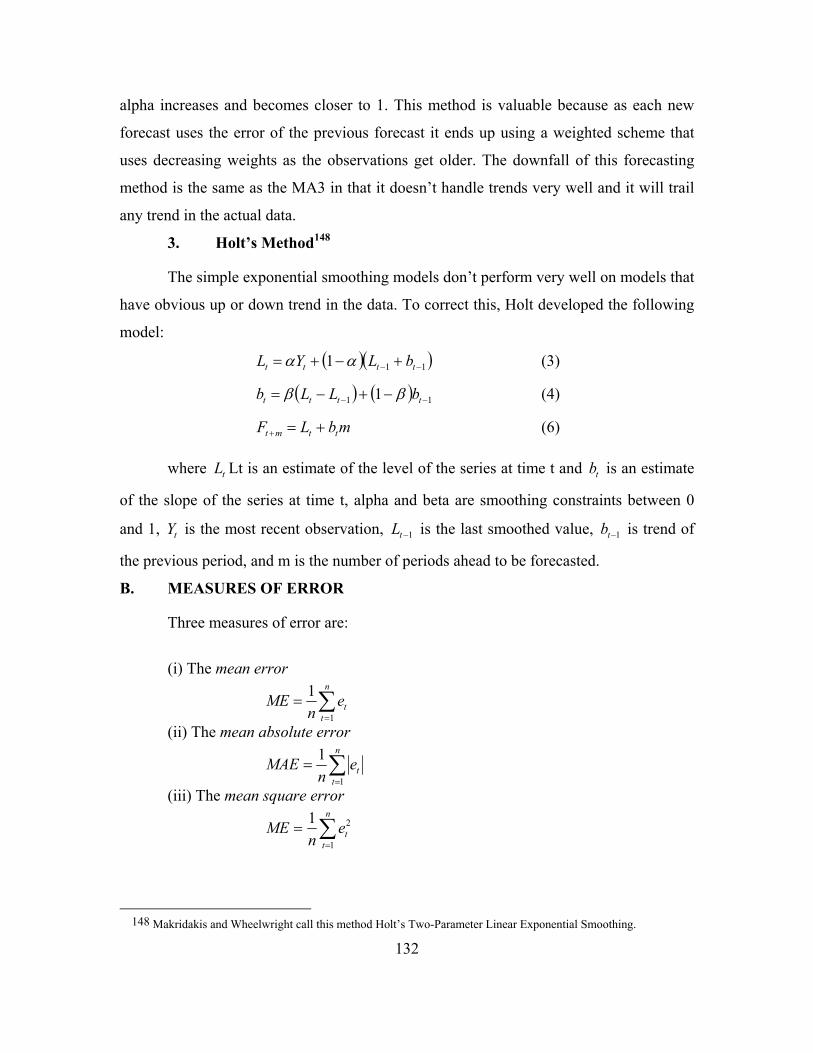
132
alpha increases and becomes closer to 1. This method is valuable because as each new
forecast uses the error of the previous forecast it ends up using a weighted scheme that
uses decreasing weights as the observations get older. The downfall of this forecasting
method is the same as the MA3 in that it doesn’t handle trends very well and it will trail
any trend in the actual data.
3. Holt’s Method148
The simple exponential smoothing models don’t perform very well on models that
have obvious up or down trend in the data. To correct this, Holt developed the following
model:
( )( )111 −− +−+= tttt bLYL αα (3)
( ) ( ) 11 1 −− −+−= tttt bLLb ββ (4)
mbLF ttmt +=+ (6)
where tL Lt is an estimate of the level of the series at time t and tb is an estimate
of the slope of the series at time t, alpha and beta are smoothing constraints between 0
and 1, tY is the most recent observation, 1−tL is the last smoothed value, 1−tb is trend of
the previous period, and m is the number of periods ahead to be forecasted.
B. MEASURES OF ERROR
Three measures of error are:
(i) The mean error
∑=
=n
tte
nME
1
1
(ii) The mean absolute error
∑=
=n
tte
nMAE
1
1
(iii) The mean square error
∑=
=n
tte
nME
1
21
148 Makridakis and Wheelwright call this method Holt’s Two-Parameter Linear Exponential Smoothing.

133
The mean error is not very useful. It tends to be near zero as positive and negative
errors tend to cancel. It is only of use in detecting systematic under or over forecasting.
The mean square error is a squared quantity so be careful and do not directly
compare it with the MAE. Its square root is usually similar to the MAE.
The relative or percentage error is defined as
100×
−=
t
ttt Y
FYPE
The mean percentage error is
∑=
=n
ttPE
nMPE
1
1
and the mean absolute percentage error is
∑=
=n
ttPE
nMPE
1
1

134
THIS PAGE INTENTIONALLY LEFT BLANK

135
APPENDIX K. RESULTS OF FORECASTING METHODS
A. THREE YEAR MOVING AVERAGE (NOMINAL DOLLARS) Year F-16C MA Error Abs Error % Error Abs % Error 1998 $ 7,649.80 1999 $ 8,569.10 2000 $ 9,475.27 2001 $ 10,574.51 $ 8564.72 2,009.78 2,009.78 19.01% 19.01% 2002 $ 10,484.21 $ 9539.62 944.58 944.58 9.01% 9.01% 2003 $ 11,706.86 $ 10177.99 1,528.87 1,528.87 13.06% 13.06% 2004 $ 12,518.75 $ 10921.86 1,596.90 1,596.90 12.76% 12.76% 2005 $ 13,146.61 $ 11569.94 1,576.67 1,576.67 11.99% 11.99% Year F-16D MA Error Abs Error % Error Abs % Error 1998 $ 6,842.45 1999 $ 7,837.12 2000 $ 8,081.13 2001 $ 9,280.20 $ 7586.90 1,693.30 1,693.30 18.25% 18.25% 2002 $ 10,176.31 $ 8399.48 1,776.82 1,776.82 17.46% 17.46% 2003 $ 11,121.22 $ 9179.21 1,942.00 1,942.00 17.46% 17.46% 2004 $ 11,431.25 $ 10192.58 1,238.67 1,238.67 10.84% 10.84% 2005 $ 13,277.08 $ 10909.59 2,367.49 2,367.49 17.83% 17.83%

136
B. SES METHOD F-16C/D (NOMINAL DOLLARS) Year F-16C SES Error Abs Error % Error Abs % Error 1998 $ 7,649.80 #N/A 1999 8,569.10 $ 7,649.80 919.29 919.29 10.73% 10.73% 2000 9,475.27 8,293.31 1,181.96 1,181.96 12.47% 12.47% 2001 10,574.51 9,120.68 1,453.83 1,453.83 13.75% 13.75% 2002 10,484.21 10,138.36 345.85 345.85 3.30% 3.30% 2003 11,706.86 10,380.45 1,326.41 1,326.41 11.33% 11.33% 2004 12,518.75 11,308.94 1,209.81 1,209.81 9.66% 9.66% 2005 13,146.61 12,155.81 990.80 990.80 7.54% 7.54% Year F-16D SES Error Abs Error % Error Abs % Error 1998 $ 6,842.45 #N/A 1999 7,837.12 $ 6,842.45 994.66 994.66 12.69% 12.69% 2000 8,081.13 7,538.72 542.42 542.42 6.71% 6.71% 2001 9,280.20 7,918.41 1,361.79 1,361.79 14.67% 14.67% 2002 10,176.31 8,871.66 1,304.64 1,304.64 12.82% 12.82% 2003 11,121.22 9,784.91 1,336.30 1,336.30 12.02% 12.02% 2004 11,431.25 10,720.33 710.92 710.92 6.22% 6.22% 2005 13,277.08 11,217.97 2,059.11 2,059.11 15.51% 15.51%
alpha = 0.89 Year CPFH/F-16C Fcst EPS Abs. Error Abs. % Error
1998 7,649.80 NA NA 1999 8,569.10 $ 7,649.80 919.29 10.7% 2000 9,475.27 $ 8,569.10 906.17 9.6% 2001 10,574.51 $ 9,475.27 1099.24 10.4% 2002 10,484.21 $ 10,574.51 90.30 0.9% 2003 11,706.86 $ 10,484.21 1222.66 10.4% 2004 12,518.75 $ 11,706.86 811.89 6.5%
$ 12,518.75 $ 841.59 8.1% = MAPE alpha = 0.91 Year CPFH/F-16D Fcst EPS Abs. Error Abs. % Error
1998 6,842.45 NA NA 1999 7,837.12 $ 6,842.45 994.66 12.7% 2000 8,081.13 $ 7,837.12 244.02 3.0% 2001 9,280.20 $ 8,081.13 1199.07 12.9% 2002 10,176.31 $ 9,280.20 896.11 8.8% 2003 11,121.22 $ 10,176.31 944.91 8.5% 2004 11,431.25 $ 11,121.22 310.03 2.7%
$ 11,431.25 $ 764.80 8.1% = MAPE

137
C. HOLT’S METHOD F-16C/D (NOMINAL DOLLARS) Year F-16C Holt Error Abs Error % Error Abs % Error 1998 $ 7,649.80 1999 8,569.10 $ 7,649.80 919.29 919.29 10.73% 10.73% 2000 9,475.27 $ 9,249.41 225.86 225.86 2.38% 2.38% 2001 10,574.51 $ 10,442.21 132.29 132.29 1.25% 1.25% 2002 10,484.21 $ 11,668.71 -1,184.50 1,184.50 -11.30% 11.30% 2003 11,706.86 $ 10,719.03 987.83 987.83 8.44% 8.44% 2004 12,518.75 $ 12,518.75 0.00 0.00 0.00% 0.00% 2005 13,146.61 $ 13,459.05 -312.43 312.43 -2.38% 2.38% Year F-16D Holt Error Abs Error % Error Abs % Error 1998 $ 6,842.45 1999 7,837.12 $ 6,842.45 994.66 994.66 12.69% 12.69% 2000 8,081.13 $ 8,573.20 -492.07 492.07 -6.09% 6.09% 2001 9,280.20 $ 8,582.36 697.84 697.84 7.52% 7.52% 2002 10,176.31 $ 10,233.89 -57.59 57.59 -0.57% 0.57% 2003 11,121.22 $ 11,178.09 -56.88 56.88 -0.51% 0.51% 2004 11,431.25 $ 12,073.42 -642.18 642.18 -5.62% 5.62% 2005 13,277.08 $ 11,900.83 1,376.25 1,376.25 10.37% 10.37%
alpha = 0.87 beta = 1.00 Year CPFH/F-16C Level Term Trend Term Fcst EPS Abs. Error Abs. % Error
1998 $ 7,649.80 $ 7,649.80 0 NA NA 1999 $ 8,569.10 $ 8,449.61 799.803 $ 7,649.80 919.29 10.7% 2000 $ 9,475.27 $ 9,445.91 996.303 $ 9,249.41 225.86 2.4% 2001 $ 10,574.51 $ 10,557.31 1111.401 $ 10,442.21 132.29 1.3% 2002 $ 10,484.21 $ 10,638.17 80.861 $ 11,668.71 1184.50 11.3% 2003 $ 11,706.86 $ 11,578.46 940.291 $ 10,719.03 987.83 8.4% 2004 $ 12,518.75 $ 12,518.75 940.292 $ 12,518.75 0.00 0.0%
$ 13,459.05 $ 574.96 5.7% = MAPE alpha = 0.87 beta = 1.00 Year CPFH/F-16C Level Term Trend Term Fcst EPS Abs. Error Abs. % Error
1998 $ 6,842.45 $ 6,842.45 0 NA NA 1999 $ 7,837.12 $ 7,707.83 865.374 $ 6,842.45 994.66 12.7% 2000 $ 8,081.13 $ 8,145.09 437.268 $ 8,573.20 492.07 6.1% 2001 $ 9,280.20 $ 9,189.49 1044.400 $ 8,582.36 697.84 7.5% 2002 $ 10,176.31 $ 10,183.79 994.298 $ 10,233.89 57.59 0.6% 2003 $ 11,121.22 $ 11,128.61 944.816 $ 11,178.09 56.88 0.5% 2004 $ 11,431.25 $ 11,514.72 386.111 $ 12,073.42 642.18 5.6%
$ 11,900.83 $ 490.20 5.5% = MAPE

138
D. THREE YEAR MOVING AVERAGE (FY05 DOLLARS) Year F-16C/$TY F-16C/ $05 MA ($FY05) Error Abs Error % Error Abs % Error 1998 7,649.80 9,161.44 1999 8,569.10 10,045.84 2000 9,475.27 10,742.93 2001 10,574.51 11,658.77 9,983.40 1,675.37 1,675.37 14.37% 14.37% 2002 10,484.21 11,383.50 10,815.85 567.66 567.66 4.99% 4.99% 2003 11,706.86 12,427.67 11,261.74 1,165.93 1,165.93 9.38% 9.38% 2004 12,518.75 12,945.97 11,823.31 1,122.66 1,122.66 8.67% 8.67% 2005 13,146.61 13,146.61 12,252.38 894.23 894.23 6.80% 6.80% Year F-16D/$TY F-16D/ $05 MA ($FY05) Error Abs Error % Error Abs % Error 1998 6,842.45 8,194.55 1999 7,837.12 9,187.71 2000 8,081.13 9,162.28 2001 9,280.20 10,231.75 8,848.18 1,383.57 1,383.57 13.52% 13.52% 2002 10,176.31 11,049.19 9,527.25 1,521.95 1,521.95 13.77% 13.77% 2003 11,121.22 11,805.96 10,147.74 1,658.22 1,658.22 14.05% 14.05% 2004 11,431.25 11,821.35 11,028.97 792.38 792.38 6.70% 6.70% 2005 13,277.08 13,277.08 11,558.84 1,718.24 1,718.24 12.94% 12.94%

139
LIST OF REFERENCES
Aeronautical Systems Center, “Life Cycle Cost Management Guidance for Program Managers.” Wright-Patterson AFB, OH, January 1994.
Aeronautics Learning Laboratory for Science, Technology, and Research. “Pratt & Whitney Engines: F100-PW-229 Turbofan Engine.” http://www.allstar.fiu.edu/AERO/P&WEngines03.html.
Air Force Materiel Command. “Analysis Handbook, A Guide for Performing an Analysis of Alternatives (AoA).” Office of Aerospace Studies - February 2002, http://www.oas.kirtland.af.mil/AoAHandbook/index.html.
Air Force Materiel Command. Analysis Handbook, A Guide for Performing an Analysis of Alternatives (AoA), Office of Aerospace Studies. February 2002. http://www.oas.kirtland.af.mil/AoAHandbook/index.html (accessed April 20, 2006).
Atanasiu, Teodor, cited by Mihai Diac, “Bucharest would like to spend millions of dollars on fighter aircraft,” [in Romanian] (Bucharest: Gandul, March 10, 2006).
Barnett, Neil. “Hungary Requests Enhanced Gripen Deal.” Jane’s Defence Weekly, (September 2002).
Baugher, Joseph.“Engines for the General Dynamics F-16 Fighting Falcon.” AirToAirCombat.com, March 19, 2000, http://www.airtoaircombat.com/background.asp?id=8&bg=40.
Benjamin S. Blanchard, Logistic Engineering and Management, 6th ed. Upper Saddle River, NJ: Pearson Prentice Hall, 2004.
Boudreau, Michael W., and Brad R. Naegle. “Reduction of Total Ownership Cost.” NPS Acquisition Program. http://www.nps.navy.mil/gsbpp/ACQN/publications/FY03/AM-03-004.pdf .
Cochrane, Charles B. ”Introduction to Defense Acquisition Management.” 6th ed. Fort Belvoir, VA: Defense Acquisition University Press, 2003. http://www.dau.mil/pubs/gdbks/idam.asp.
Congress of the United States. “Operation and Support Costs for the Department of Defense.” Congressional Budget Office, July 1988. http://ftp.cbo.gov/ftpdoc.cfm?index=5542&type=1.

140
Defense Acquisition University. Defense Acquisition Deskbook, Version 3.1. Fort Belvoir, VA: Defense Acquisition University, 1999. http://akss.dau.mil/docs/ord0d.doc.
−−−. Defense Acquisition Guide. Fort Belvoir, VA: Defense Acquisition University, 2004. http://akss.dau.mil/dag/DoD5000.asp?view=document.
−−−. “Performance Based Logistics: Program Managers Product Support Guide.” Fort Belvoir, VA: Defense Acquisition University Press, 2005. http://handle.dtic.mil/100.2/ADA435149.
Defense Systems Management College, “Acquisition Logistic Guide,” 3rd ed. Fort Belvoir, VA: Defense Systems Management College, December 1997. http://www.dau.mil/pubs/pdf/alg1.pdf.
Department of Defense, “DoD Directive no. 5000.1 – The Defense Acquisition System,” (Washington, D.C.: Office of the Under Secretary of Defense for Acquisition Technology, and Logistics, 2003), para. 3.1, http://hfetag.dtic.mil/docs/DoD_5000-1.doc (accessed April 27, 2006).
−−−. “Department of Defense Instruction 5000.2 - Operation of the Defense Acquisition System.” Washington, D.C.: Office of the Under Secretary of Defense for Acquisition Technology, and Logistics, 2003. http://www.dtic.mil/whs/directives/corres/pdf2/i50002p.pdf.
−−−. “DoDR 5000.4-M – Cost Analysis Guidance and Procedures.” Washington DC: Assistant Secretary of Defense for Program Analysis and Evaluation, May 2002. http://www.dtic.mil/whs/directives/corres/pdf2/p50004m.pdf
−−−. “Reduction of Total Ownership Costs (R-TOC) Best Practices Guide.” Washington D.C.: Office of Defense Systems, Under Secretary of Defense for Acquisition, Technology and Logistics, September 2003. http://www.dmsms.org/file.jsp?storename=OSD_version.doc.
DoD Reduction of Total Ownership Costs Web Site. “Pilots Programs to Reduce Total Ownership Costs (R-TOC) – F-16 Fighting Program.” Institute for Defense Analyses. http://ve.ida.org/rtoc/open/pilots/f16.html.
Edwards, Michael V. “Flight Hour Costing at the Type Commander and Navy Staff Levels: An Analytical Assessment.” Master’s Thesis, Naval Postgraduate School, Monterey, CA, 1992.

141
Egozi, Arieh “Israel, Romania seal F-16 sale deal,” Jane’s International Defence Review 38, no. 010 (2005).
Federal Aviation Administration, Life Cycle Cost Estimating Handbook, para. 13.4.2, http://www.faa.gov/asd/ia-or/lccehb.htm (accessed April 12, 2006)
Gansler, Jacques S. Memorandum: Future Readiness. Washington D.C.: Office of the Secretary of Defense, May 1999. http://ve.ida.org/rtoc/open/gansler051099.pdf.
Gething, Michael J. “Lancer Upgrade Leads Romania’s Leap into the 21st Century,” Jane’s International Defence Review 036, no. 006 (2003).
Global Security. “F-16 Fighting Falcon.” http://www.globalsecurity.org/military/systems/aircraft/f-16-history.htm/.
Hawkes, Eric M. “Predicting the Cost per Flying Hour for the F-16 Using Programmatic and Operational Variables.” Master’s Thesis, Air Force Institute of Technology, 2005.
Hildebrandt, Gregory G. and Man-bing Sze. An Estimation of USAF Aircraft Operating and Support Cost Relations. Santa Monica, CA: The RAND Corporation, May 1990.
Jane's Defence Systems Modernisation IX, no. 7, (1996).
Krittenden, Carl. “F-16C/D Block 50/52.” F-16.net, http://www.f-16.net/f-16_versions_article9.html.
Laubather, Mathew E. “Analysis and forecasting of Air Force Operating and Support Costs for Rotary Aircraft.” Master thesis, Air Force Institute of Technology, 2004.
Lockheed Martin. “Latest Lockheed Martin F-16 Upgrade Version Completed on Schedule.” http://www.lockheedmartin.com/wms/findPage.do?dsp=fec&ci=12553&rsbci=1&fti=133&ti=0&sc=400.
Makridakis, Spyros and Steven C. Wheelwright, Forecasting: Methods and Applications. New York, NY: John Wiley & Sons, Inc., 1978.
Mandelbaum, Jay and Spiros Pallas. “Reducing Total Ownership Cost in DoD. Increasing Affordability of DoD Systems.” PM: July – August, 2001: 76– 82. http://ve.ida.org/rtoc/open/briefings_articles/mand-ja.pdf.

142
Moore, Jeffrey M. and Larry R. Weatherford, Decision Modeling within Microsoft® Excel, 6th ed. Upper Saddle River, NJ: Prentice Hall, 2001.
National Bank of Poland, http://www.nbp.pl/.
Office of the Secretary of Defense. “Operating and Support Cost-Estimating Guide.” Washington, DC: Cost Analysis Improvement Group, May 1992. http://www.dtic.mil/pae/.
Parametric Estimating Initiative Steering Committee. “Parametric Cost Estimating Handbook.” Edited by Bill Brundick eds. NASA, Cost Estimating Web Site. http://www1.jsc.nasa.gov/bu2/PCEHHTML/pceh.htm.
Republic of Poland. Ministry of Economy. “Act of 10 September 1999, on certain compensation agreements concluded in connection with contracts for deliveries for the needs of defense and security.” http://www.mgip.gov.pl/English/ECONOMY/Offset+Programmes/Basic+information/
−−−. “List of offset agreements in Poland (as of 1 January 2005).” [in Polish] http://www.mgip.gov.pl/NR/rdonlyres/44734642-D9A7-4BFB-82F1-FB48A5443547/17854/www_ang_agreements_060303.pdf.
−−−. “List of Offset Commitments Included in the Master Offset Agreement,”http://www.mgip.gov.pl/NR/rdonlyres/565CC648-937F-4F03-99B2-C256C67BD475/0/lista_zobowiazan.doc.
−−−. “Offset in Poland.” http://www.mgip.gov.pl/English/ECONOMY/Offset+Programmes/Basic+information/.
−−−. “Ordinance of the Counsel of Ministers of 2 July 2002 concerning the detailed principles for crediting offset commitments of a foreign supplier of armament or military equipment against the offset agreement value.” http://www.mgip.gov.pl/NR/rdonlyres/44734642-D9A7-4BFB-82F1FB48A5443547/12516/offset_mult_ordin_eng.pdf.
−−−. “The Juxtaposition of Lockheed Martin’s Offset Commitments,” http://www.mgip.gov.pl/NR/rdonlyres/D388B4F0-F028-4D79-A15F-B5EFD29BDC8F/0/zestawienie_zbiorcze.doc.
−−−. “The List of Lockheed Martin’s Offset Commitments,” http://www.mgip.gov.pl/NR/rdonlyres/D388B4F0-F028-4D79-A15F-B5EFD29BDC8F/0/zestawienie_zbiorcze.doc/ (accessed March 30, 2006).

143
Richardson, Douglas. Modern Fighting Aircraft - F-16, New York, NY: Arco Publishing Inc., 1983.
Rose, Pat A. “Cost Per Flying Hour Factors: A Background and Perspective of How They Are Developed and What They Do.” Air Force Comptroller 31, no. 3 (July 1997): 4–9.
Rush, Benjamin C. “Cost As an Independent Variable Concepts and Risks.” Acquisition Review Quarterly (Spring 1997): 161–172 . http://www.dau.mil/pubs/arq/97arq/rus.pdf.
Sahr, Robert. Inflation Conversion Factors for Dollars 1665 to Estimated 2016. Oregon State University. http://oregonstate.edu/Dept/pol_sci/fac/sahr/sahr.htm.
San Miguel, Joseph G., John K. Shank and Donald E. Summers, “Navy Acquisition via Leasing: Policy, Politics, and Polemics with the Maritime Prepositioned Ships,” NPS Acquisition Research, April 2005.
Schmidt, Jerry and Ellis Hitt, “Air Force Total Ownership Costs and Reduction in Total Ownership Costs – Twin Pillars of the Air Force Affordability Initiatives,” IEEE (1999), SS.2-1. ieeexplore.ieee.org/iel5/ 6600/17621/00863675.pdf?arnumber=863675.
Seldon, Robert M. Life Cycle Costing: A Better Method of Government Procurement. Boulder, CO: Westview Press, 1979.
Smith, Timothy. “USAF Condition-Based Maintenance Plus (CBM+) Initiative” Maxwell-Gunter AFB Montgomery, AL: Air Force Logistics Management Agency, September 2003. http://www.acq.osd.mil/log/logistics_materiel_readiness/organizations/mppr/assetts/cbm+/Air_Force/AFLMA%20CBM%20final%20Sep%2003.pdf.
Society of Cost Estimating and Analysis. “Glossary”. Society of Cost Estimating and Analysis. http://www.sceaonline.org/prof_dev/glossary-c.cfm.
Stewart, Rodney D. Cost Estimating, 2nd ed. New York: John Wiley and Sons, 1991.
Tudor, Radu. “Romania opens talks on fighter procurement,” Jane’s International Defence Review 39, no. 003 (2006).
United States Air Force. “Air Force Instruction 63-101 - Operations of Capabilities Based Acquisition System.” (Washington DC: Secretary of Air Force, 2005. http://www.e-publishing.af.mil/pubfiles/af/63/afi63-101/afi63-101.pdf.

144
United States General Accounting Office, “Air Force Operating and Support Cost Reductions Need Higher Priority.” Washington D.C.: National Security and International Affairs Division, August 2000. http://www.gao.gov/cgi-bin/getrpt?GAO/NSIAD-00-165.
Wallace, Houser and Lee, “A Physics-Based Alternative to Modeling Aircraft Consumption Costs,” 4-21.
Wallace, John M., Scout A. Houser and David A. Lee, “A Physics-Based Alternative to Modeling Aircraft Consumption Costs.” McLean, VA: Logistics Management Institute, August 2000. http://www.dodcas.osd.mil/DoDCAS2003%20presentations/Advanced/Lee.pdf.
wprost Online, “Miliardy Dolarów na Skrzydlach F-16,” [in Polish] (2003), http://www.wprost.pl/ar/?O=43338/ (accessed March 30, 2006).
Wydra, Zdzislaw. ”F-16 Oferta Offsetowa.”[in Polish] Wiraże, no. 3 (2003): 6-7. http://www.czasopismawlop.mil.pl/wiraze/w_numerzew/archiwumw/3-2003/f16o.htm.
−−−. ”Zwyciężyl F-16.” [in Polish] Wiraże, no. 2 (2003): 9-12. http://www.czasopismawlop.mil.pl/wiraze/w_numerzew/archiwumw/2-2003/zwyc.htm.
Wynne, Michael W. “Memorandum: Transformation through Reduction of Total Ownership Cost (R-TOC).” Washington D.C.: Office of the Secretary of Defense, December 16, 2003. http://rtoc.ida.org/rtoc/open/SignedVersion-RTOC-Wynne%20Ltr-16Dec03.pdf.

145
INITIAL DISTRIBUTION LIST
1. Defense Technical Information Center Ft. Belvoir, Virginia
2. Dudley Knox Library Naval Postgraduate School Monterey, California
3. Professor Raymond E. Franck School of Business and Public Policy Naval Postgraduate School Monterey, California
4. Professor Marshall R. Engelbeck School of Business and Public Policy Naval Postgraduate School Monterey, California
5. Major Aurel Cobianu Department of Euro-Atlantic Integration and Defense Policy Ministry of National Defense Bucharest, Romania
6. Captain Konrad Madej 24-100 Puławy, Poland