nature neuroscience: doi:10.1038/nn extracellular blank regions (n=138) from every image) from the...
TRANSCRIPT

Nature Neuroscience: doi:10.1038/nn.3892
Supplementary Figure 1
Nanoscale localization precision and relative quantification of CB1 receptors by 3D-STORM imaging
(a) Schematic representation of the experimental paradigm for combined confocal/STORM imaging in HEK cells. Intrinsic fluorescence intensity of EGFP linked to the extracellular N-terminus of CB1 receptors was measured by confocal microscopy. The same CB1
proteins were immunolabeled by an antibody raised against the intracellular C-terminus, and subsequently by a secondary antibody tagged with an activator-reporter dye pair Cy3-A647, which was detected by STORM microscopy. (b) Confocal image of a representative HEK cell reveals CB1 receptor accumulation within the plasma membrane. (c) At lower magnification, STORM superresolution image of the same HEK cell depicts a similar subcellular CB1 localization pattern as confocal imaging. (d) To study whether the Number of Localization Points (NLP) obtained by STORM imaging and measured in a given anatomical profile reliably predicts relative protein quantity, randomly selected HEK cells (n = 46) expressing an EGFP-CB1 fusion construct at various expression levels were imaged by both confocal and STORM microscopy. Intrinsic EGFP fluorescence intensity (FI) values were measured by confocal microscopy and determined by subtracting mean background level (assessed from 3-3 Regions of Interest (ROIs), located in the extracellular blank regions (n=138) from every image) from the mean pixel intensity. These values are plotted against the number of localization points (NLP) obtained by STORM microscopy in each imaged cell. The strong positive linear correlation between the two imaging readouts confirms that NLP values reliably predict relative protein quantity (n = 46 cells, Spearman’s rank order correlation, p < 0.001). (e) The high magnification confocal image of the boxed plasma membrane segment in b illustrates the diffraction-limited blurred nature of the EGFP fluorescence signal. (f) In contrast, at higher magnification, the nanoscale localization precision of fluorophores representing CB1 receptors by STORM imaging results in crisp visualization of the same boxed plasma membrane segment compared to the confocal image shown in e. As determined from the same images, the high resolution of the STORM image was the consequence of a fluorophore localization precision of 5 nm in the lateral (x-y), and 32 nm in the axial (z) dimensions (measured as the standard deviation of localization distribution).

Nature Neuroscience: doi:10.1038/nn.3892
Supplementary Figure 2
Quantitative evaluation of the quality of STORM imaging in brain sections
(a-c) Localization precision displayed only a modest variation (1 nm or 5 nm at x-y or z directions, respectively) as a function of axial position ie. at different z distances from the focal plane. Clusters resulting from the multiple blinking of isolated fluorophores in the STORM images of CB1-immunostaining were identified, and the distribution of the distances of individual localization points from the center of mass of the clusters was plotted. (d) Histogram shows the distribution of the number of detected photons per localization point (n = 1341 LP) above the peak detection threshold in STORM images of 40000 cycles taken from CB1-immunostaining in hippocampal sections at 5 µm depth.

Nature Neuroscience: doi:10.1038/nn.3892
Supplementary Figure 3
Comparative analysis of the passive and active electrophysiological properties of regular-spiking CB1-positive perisomatic and dendritic interneurons in the CA1 subfield of the mouse hippocampus
(a-e) Whole-cell patch-clamp recordings from multipolar interneurons which were post-hoc classified as either perisomatic or dendritic interneurons based on their axonal distribution and their corresponding BDI value. Electrophysiological characterization reveals that these GABAergic interneuron types do not differ in their resting membrane potential (p = 0.19, t(30) = –1.34 summarized in a), input resistance (p = 0.17, t(30) = –1.4) (b), relative sag amplitude (p = 0.24, U = 94.5) (c), rebound potential (p = 0.25, U = 89) (d), and action potential amplitude (p = 0.15, t(30) = –1.47) (e). (f-h) However, dendritic interneurons fire faster action potentials (p = 0.0024, U = 48.5) (f), show a more marked afterhyperpolarization (p = 0.037, t(30) = –2.18) (g), and exhibit more adaptation of firing upon current injection (p = 0.013, t(30) = –2.63)) (h). Statistical comparisons of 14 perisomatic and 18 dendritic cells were performed by unpaired two-sided t-test (a,b,e,g,h) or by Mann-Whitney U test (c,d,f). Graphs show raw data and median±IQR. The measured data for each cell and for each parameter are presented in Supplementary Table.

Nature Neuroscience: doi:10.1038/nn.3892
Supplementary Figure 4
The quantitative power of CB1-immunostaining and subsequent STORM imaging is robust to various experimental conditions
(a) Electrophysiological recordings from acute hippocampal slices, tissue processing and immunostaining were carried out in parallel in two different laboratories in Irvine, CA, USA and in Budapest, Hungary. Undertaking all STORM imaging on the same setup in the latter laboratory resulted in similar normalized distribution of the number of CB1 localization points per boutons, as demonstrated in the cumulative probability plot showing the NLP values per bouton, normalized for the cell mean. Statistical analysis was done by Kolmogorov-Smirnov test, p > 0.05, n = 150 and n = 279 boutons from n = 7 and n = 6 basket cells filled and processed in Irvine and Budapest, respectively, were used in the experiment. (b) Immunostaining with two independent primary antibodies raised either in a guinea-pig
52, or a transgenic (Tg) rabbit that overexpress the neonatal Fc receptor (FcRn) and have improved humoral immune
responses58
, and with the two corresponding secondary antibodies custom-labeled with fluorophore pairs for STORM imaging, resulted in similar normalized distribution of the number of CB1 localization points per bouton (n = 279 and n = 302 boutons from n = 6–6 basket cells stained with anti-CB1 antibody produced in guinea-pig and rabbit, respectively, Kolmogorov-Smirnov test, p > 0.1). (c-d) Whole-cell patch-clamp recordings and biocytin-filling did not affect bouton size or CB1 NLP. Biocytin-filled boutons, and an equal number of neighboring biocytin-negative, randomly chosen boutons were selected from the same images for analysis. The size of the boutons was determined by using the CB1 STORM signal outlining the terminals. No significant differences were found in the number of CB1
localization points, or in the size of boutons with or without biocytin-labeling (n = 202–202 axon terminals, Mann-Whitney U test, p = 0.20, U = 4563.5 and p = 0.31, U = 29232, respectively). Graphs show raw data and median±IQR.

Nature Neuroscience: doi:10.1038/nn.3892
Supplementary Figure 5
Comparative morphological analysis of the axon terminals of CB1-positive perisomatic and dendritic interneurons
(a-c) Deconvolved confocal images of n = 279 and n = 334 biocytin-filled boutons from n = 6 perisomatic and n = 6 dendritic cells, respectively, were analyzed for their shape descriptors. (a) Circularity describes how close the relation between the area and perimeter of the bouton shape is to that of a perfect circle. (b) Aspect ratio reflects the degree of elongation. (c) Solidity measures the area of the shape divided by its convex area, thereby describing convexity and smoothness of edges of the bouton shape. No significant differences are detected between cell types in either the circularity (p = 0.82, U = 16), aspect ratio (p = 0.70, U = 15), or solidity (p = 0.94, U = 17) of their boutons (Mann-Whitney U test). Graphs show raw data and median±IQR.
Nature Neuroscience: doi:10.1038/nn.3892
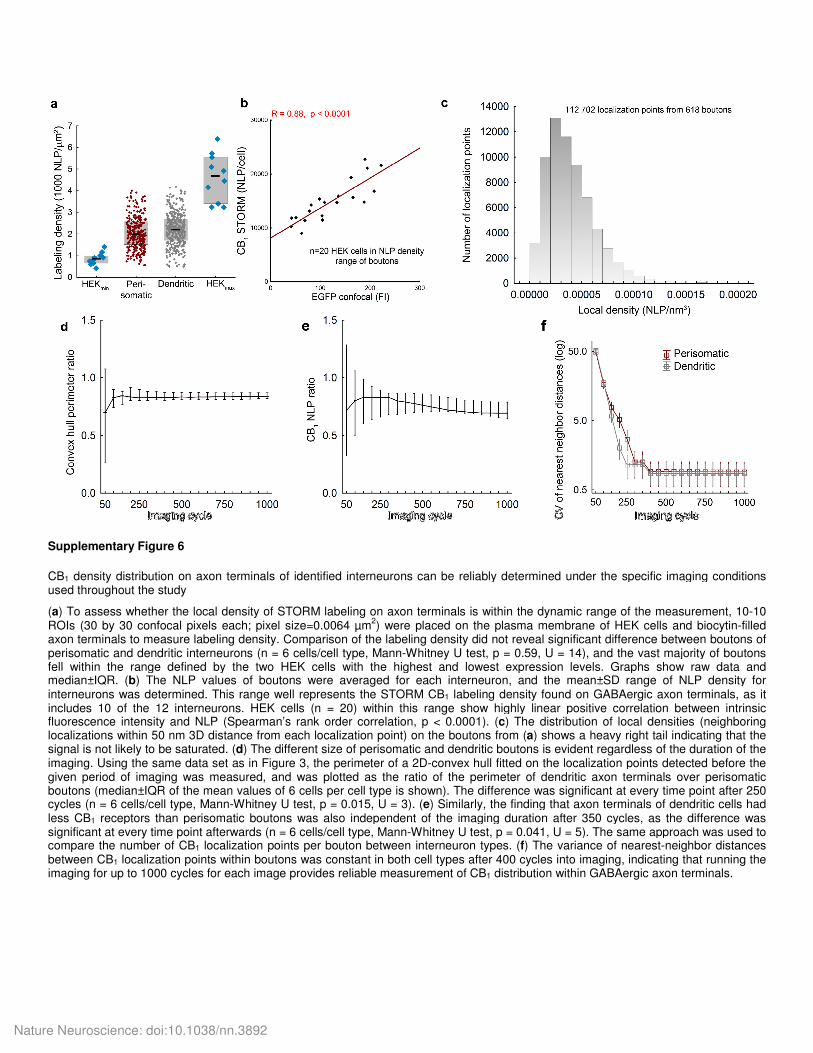
Supplementary Figure 6
CB1 density distribution on axon terminals of identified interneurons can be reliably determined under the specific imaging conditions used throughout the study
(a) To assess whether the local density of STORM labeling on axon terminals is within the dynamic range of the measurement, 10-10 ROIs (30 by 30 confocal pixels each; pixel size=0.0064 µm
2) were placed on the plasma membrane of HEK cells and biocytin-filled
axon terminals to measure labeling density. Comparison of the labeling density did not reveal significant difference between boutons of perisomatic and dendritic interneurons (n = 6 cells/cell type, Mann-Whitney U test, p = 0.59, U = 14), and the vast majority of boutons fell within the range defined by the two HEK cells with the highest and lowest expression levels. Graphs show raw data and median±IQR. (b) The NLP values of boutons were averaged for each interneuron, and the mean±SD range of NLP density for interneurons was determined. This range well represents the STORM CB1 labeling density found on GABAergic axon terminals, as it includes 10 of the 12 interneurons. HEK cells (n = 20) within this range show highly linear positive correlation between intrinsic fluorescence intensity and NLP (Spearman’s rank order correlation, p < 0.0001). (c) The distribution of local densities (neighboring localizations within 50 nm 3D distance from each localization point) on the boutons from (a) shows a heavy right tail indicating that the signal is not likely to be saturated. (d) The different size of perisomatic and dendritic boutons is evident regardless of the duration of the imaging. Using the same data set as in Figure 3, the perimeter of a 2D-convex hull fitted on the localization points detected before the given period of imaging was measured, and was plotted as the ratio of the perimeter of dendritic axon terminals over perisomatic boutons (median±IQR of the mean values of 6 cells per cell type is shown). The difference was significant at every time point after 250 cycles (n = 6 cells/cell type, Mann-Whitney U test, p = 0.015, U = 3). (e) Similarly, the finding that axon terminals of dendritic cells had less CB1 receptors than perisomatic boutons was also independent of the imaging duration after 350 cycles, as the difference was significant at every time point afterwards (n = 6 cells/cell type, Mann-Whitney U test, p = 0.041, U = 5). The same approach was used to compare the number of CB1 localization points per bouton between interneuron types. (f) The variance of nearest-neighbor distances between CB1 localization points within boutons was constant in both cell types after 400 cycles into imaging, indicating that running the imaging for up to 1000 cycles for each image provides reliable measurement of CB1 distribution within GABAergic axon terminals.

Nature Neuroscience: doi:10.1038/nn.3892
Supplementary Figure 7
Layer-specific electron microscopic analysis of CB1-containing GABAergic axon terminals
(a,b) To test whether quantitative information collected by 3D-STORM microscopy is comparable with data acquired by other well-established quantitative anatomical approaches, hippocampal sections were processed for immunogold labeling of CB1 receptors and analyzed by transmission electron microscopy (TEM). Random cross-sections of CB1-positive GABAergic boutons were selected from the stratum pyramidale and stratum radiatum of the CA1 subfield. The presumed GABAergic nature of an axon terminal was established by the presence of symmetrical synapses (arrowheads). Note that the vast majority of silver-intensified gold particles representing CB1 receptors are attached to the intracellular surface of the plasma membrane of axon terminals. (c,d) CB1-positive boutons found in the pyramidal layer are significantly larger (n = 3 animals, 100 boutons per layer per animal, paired two-sided t-test, p = 0.025, t(2) = 6.26 and p = 0.033, t(2) = 5.33 for area and perimeter, respectively). (g) In addition, the number of gold particles (NGP) on the plasma membrane of these perisomatic axon terminals is considerably higher than on boutons observed in the stratum radiatum(paired two-sided t-test, p = 0.036, t(2) = 5.13). (h) In contrast, the density of gold particles was not significantly different on boutons located in the two hippocampal layers (paired two-sided t-test, p = 0.064, t(2) = 3.76). These observations obtained at the synaptic population level are in general agreement with the cell-type-specific findings obtained by STORM imaging (see Figure 4). Graphs showraw data and median±IQR.

Nature Neuroscience: doi:10.1038/nn.3892
Supplementary Figure 8
Visualization of the localization coordinates of the STORM signal by 3D rendering and calculation of membrane surface distances
(a) Analysis of nanoscale distribution of STORM data was carried out using the x, y and z coordinates of each individual localization point. Their 3D positions are illustrated as atoms in Visual Molecular Dynamics. (b) First, a convex hull was fitted on the localization points, giving an approximation of the structure surface. Note that single-molecule localization-microscopy gives a more precise estimate of structural dimensions than electron microscopy
22, which underestimates these parameters due to anisotropic shrinkage
during tissue dehydration, as well as compared to confocal microscopy, which overestimates size due to light diffraction25
. Indeed, the average bouton size based on the cross-sectional area of the polyhedrons of perisomatic and dendritic terminals are 1.33±0.04 µm
2
and 0.97±0.03 µm2, respectively (mean±SEM), when measured by 3D-STORM microscopy. These values fall in between the range of
electron microscopic (0.29±0.01 µm2 and 0.22±0.01 µm
2); and confocal measurements (1.65±0.04 µm
2 and 1.20±0.03 µm
2). These
data independently indicate that the convex hull approach resulted in a realistic representation of the imaged part of the bouton. Thisfeature has previously been an exclusive advantage of the laborious serial reconstruction of electron micrographs. (c) Secondly, the distance of each localization point from the convex hull was measured, and only localizations within 80 nm from the surface were included in further analysis. This approach could also be utilized to measure the proportion of membrane-attached localization points and those which are likely intracellular receptors. These subcellularly segregated receptor populations presumably represent functionally different receptor pools, hence it is important to distinguish between them, when quantifying receptor distribution or pathological redistribution in a cell-type-specific manner. (d) Finally, the distance of each localization point from the active zone was measured as the shortest route on the polyhedron surface.

Nature Neuroscience: doi:10.1038/nn.3892
Supplementary Figure 9
Validation of the hull surface distance calculations and density measurements on model boutons
(a) To measure the sensitivity of the local density analysis on the polyhedron surface, a simulation of homogeneous and artificially enriched receptor distribution was conducted. “CB1 localization points” were randomly placed on model “bouton” comprising a sphere of 1000 nm radius, excluding a 230 nm radius area of the surface as the “active zone”. A convex hull was fitted onto these points. (b-c) To model different levels of potential perisynaptic enrichment, an increasing number of localization points were placed in random positions of the surface within a 250 nm radius of the active zone. (d) To measure localization point density on the surface, reference points were also placed at 40 nm spacing over the entire sphere, excluding the active zone. CB1 density, defined as the number of localization points within 200 nm distance of each reference point, was determined along with the distance from the edge of the active zone measured on the hull surface. The entire process was repeated 50 times for each enrichment condition. Finally, reference points per individual boutons were binned based on the distance from the synapse and averaged by bin. Altogether 50 mean values per bin per condition were used for generating graphs (median±IQR) and calculating p values using unpaired two-sided t-tests to compare perisynaptic and extrasynaptic regions. The difference between the 0–250 nm and the 1000–1250 nm bins is already significant at 20% (p < 0.0001), but not at 10% enrichment (p = 0.84). The graph for 1000% is not shown for sake of clarity, but was also highly significant (p < 0.0001).

Nature Neuroscience: doi:10.1038/nn.3892
Supplementary Figure 10
Combination of in vivo single neuron recording in a behaving mouse with post-hoc anatomical characterization and molecular imaging at the nanoscale
(a) Example traces from juxtacellular recording of a CA1 interneuron in an anesthesia-free mouse running on a spherical treadmill. A 1 sec-long recording, filtered for local field potential, and, spikes, and the raw trace are shown below each other, respectively. (b) After the recording, the cell was filled with neurobiotin. Morphological analysis of the labeled neuron was performed by confocal microscopy. Part of the axonal arbor (red), as well as its soma and some dendrites (blue), were reconstructed from four consecutive 20 µm thick sections by Neurolucida. (c) Laminar distribution analysis of more than 3000 axonal varicosities recovered from 14 serial sections classifies this cell as a dendritic interneuron (BDI < 0.5). (d) Maximum intensity projection of a deconvolved confocal image stack of individual axon terminals from the same in vivo recorded interneuron. (e) CB1-immunolabeling on these identified axon terminals is visualized by overlaying the corresponding confocal and STORM images. (f) Magnification of the boxed region of the STORM image in e illustrates the intraterminal distribution of CB1 localization points at the nanoscale level and reveals a qualitatively similar pattern as that observed in the case of in vitro-labeled interneurons in Figure 3. (g) Cumulative probability plots of normalized CB1 NLP found on individual terminals of in vivo- or in vitro-filled dendritic interneurons. The distribution of data obtained from the two experimental preparations were identical (Kolmogorov-Smirnov test, p > 0.1). Data were collected from single CB1 STORM imaging of 129 boutons from one in vivo, and of 141 boutons from 5 in vitro-filled cells and were normalized to the mean NLP value of the respective cell. (h) The variance of CB1 nearest neighbor distances is also comparable under the different experimental conditions indicating similar CB1
distribution at the nanoscale level in boutons of in vivo- or in vitro-filled dendritic interneurons (Kolmogorov-Smirnov test, p > 0.1). (i) In line with the in vitro findings, at the single bouton level, the number of CB1 localization points correlates linearly with bouton size (n = 129 axon terminals, Spearman’s rank order correlation, p < 0.001). The experiment was performed on a single in vivo neurobiotin-filled

Nature Neuroscience: doi:10.1038/nn.3892
neuron.