natural resource projects and farm …ageconsearch.umn.edu/bitstream/20328/1/sp04co03.pdf · 1 farm...
TRANSCRIPT

FARM BENEFITS AND NATURAL RESOURCE PROJECTS IN
HONDURAS AND EL SALVADOR
Horacio Cocchi, Boris Bravo-Ureta and Ricardo Quiroga (*)
Paper Presented at the 2004 Annual Meeting
Denver, Colorado August 1-4
(*) Horacio Cocchi is Post Doctoral Fellow at the Office of International Affairs (OIA), at the University of Connecticut (UConn); Boris E. Bravo-Ureta is Executive Director, Office of International Affairs (OIA), and Professor of Agricultural and Resource Economics, UConn; Ricardo Quiroga is a Senior Economist at the Inter American Development Bank. Address: Office of International Affairs, University of Connecticut, 843 Bolton Road, U-182, Storrs, Connecticut 06269-1182 Phone: 860-486-3152, Fax: 860-486-2963, Email: [email protected]
Copyright 2004 by H. Cocchi, B. Bravo-Ureta and R. Quiroga. All rights reserved. Readers may make verbatim copies of this document for non-commercial purposes by any means, provided that this
copyright notice appears on all such copies.

1
FARM BENEFITS AND NATURAL RESOURCE PROJECTS IN HONDURAS AND EL SALVADOR
1. Introduction
Peasant farmers in Central America typically grow subsistence crops -mainly corn
and beans- in sloping and marginal uplands. These farmers often use production
practices that are highly erosive and as a result the region contains large areas with
significantly degraded land (Oldeman et al., 1990; Barbier, 2000). The development path
on the Central American agriculture has usually involved the migration of poor or
landless farmers to public or open-access lands, who then clear forest areas, and cultivate
staple crops for a few years, before moving on to clear new plots. As migration increases
and the pool of available land declines, farmers use land more intensively. Those unable
to purchase agrochemicals face declines in soil fertility and productivity, and farming
becomes unsustainable (Neill and Lee, 2001). For many resource-poor farmers, soil
degradation exacerbates the continuous struggle for food security.
To respond to this deteriorating situation, local governments and international
organizations have undertaken a series of public investments focusing on poverty
reduction and the promotion of conservation technologies. A major thrust of these
projects has been to foster long-term environmental sustainability by enhancing
management capabilities and decreasing vulnerability of communities to natural disasters.
Two of these natural resource management projects that deserve special attention
due to their magnitude and scope are: (i) the Environmental Program for El Salvador
(PAES); and (ii) the Natural Resource Management Program in the CAJON-Basin,

2
Honduras. PAES is treated as three separate projects, PAES1, PAES2 and PAES3, since
each one has been implemented in a different area by a different international consortium.
These projects seek to generate both on-site and off-site benefits. The on-site benefits
consist of increased household income through improved soil productivity, the adoption
of conservation technologies, and product diversification. Off-site benefits are reflected
on improved environmental conditions and positive externalities associated with water,
soil and forestry resources. The CAJON project has concluded recently, while the PAES
project will finish by the end of 2004. Most of the analyses done to examine the
performance of these projects have focused on assessing physical targets and institutional
aspects (for example, Barbier and Flores, 2003; PNUD, 1999; PAES/IICA2003;
PAES/CARE, 2003; PAES/ABT–Winrock, 2001). So far, no attempt has been made to
evaluate the off-site impacts of the projects. In turn, Bravo-Ureta et al. (2003) have
performed an assessment of the on-site benefits, using farm-level data collected among
beneficiaries.
The objective of this paper is to measure the success of the poverty reduction
strategies promoted by the projects, by studying the relationships among technology
adoption, product diversification and household income among participant farmers.
The rest of the paper is organized as follows. The second section presents the
data set and the methodological framework. The third section discusses the econometric
results and the fourth section summarizes and presents the main conclusions.

3
2. Data and Methodology
The data used consist of detailed farm-level information obtained from surveys
applied to representative samples of project beneficiaries in El Salvador and Honduras.
These data were collected and analyzed by Bravo-Ureta et al., (2003), as part of
Technical Cooperation # 01-08-01-1-RS between the University of Connecticut and the
Inter-American Development Bank. The sampling procedure in Honduras started with a
grouping of the 240 communities participating in the CAJON project into three agro-
ecological zones according to elevation: High, Medium, and Low. From these
communities, 48 (20%) were randomly selected and distributed evenly by agroecological
zone. Within each community, four farm households were randomly chosen. Overall,
210 beneficiary campesinos were interviewed, of which 35 are also contact farmers or
extensionists. In El Salvador, data were gathered by surveying a sample of 530 farm
households belonging to 102 communities within the regions of Resbaladero and
Texistepeque (PAES1), San Juan Opico and Nueva Concepción (PAES2), and
Tenancingo and Guazapa (PAES3). 175 respondents belong to PAES1, 177 to PAES2
and 178 to PAES3. The sample was stratified by region to reflect the geographical
distribution of the three projects.
Table 1 includes descriptive statistics of the dependent variables used in the
econometric model. The data are presented by project and aggregated for the whole
sample. The last column of the table presents the results of an ANOVA test performed to
verify whether the observed mean differences among projects are statistically significant.
The bold figures indicate statistically significant mean differences at least at the 1% level.

4
The study of the relationships among technology adoption, product diversification
and poverty reduction requires an understanding of the main sources of rural income,
including farm and off-farm sources. These relationships can be stylized as a set of
functional links, as illustrated in Figure 1, which is based on a framework presented by
Minten and Zeller (2000)1. In this framework, the household is taken as a single
decision-making body; therefore, decisions that affect the way resources are allocated
among household members, the so-called intra-household resource allocation, are not
taken into account (Ellis, 1998).
The household’s set of resources (assets) consists of natural capital (land,
livestock, durables and environmental quality), human capital (education, experience,
demographic attributes) and social capital (access to social networks and institutions). In
addition, the household’s decision-making process is also affected by a set of external
factors, including the socio-economic and agro-ecological environment, input, output and
financial markets, prices, wages and infrastructure. The household’s set of resources
determines the allocation of labor and effort between farm and off farm activities.
The mapping of assets to household income through both off and on farm
activities can conceptually be considered as a production process, with assets
corresponding to factors of production and income as the output (Barrett and Reardon,
2000). The allocation of assets to each activity is assumed to maximize household
income subject to a set of constrains. Households will allocate assets in a manner that
equates the marginal value product across activities or will allocate assets entirely to one
1 A similar framework can be found in Mbaga-Semgalawe and Fomer (2000).

5
activity with higher returns. A key feature of this approach is that households
simultaneously determine the allocation of assets to different activities (Winters et al.,
2002).
Moreover, the natural resource management projects under study motivate
farmers to adopt soil conservation technologies and to diversify their product mix. These
technological changes should improve farm production and productivity and,
consequently, should be reflected in a greater household income, which is the sum of
farm and off-farm income. Finally, income improvement is considered a necessary
condition for sustainability of the changes introduced by the projects. The relationships
depicted in Figure 1 are modeled considering that, for a given agricultural year, the
household decisions that affect the allocation of labor between farm and off-farm
activities, as well as the adoption of conservation practices and output mix, also
determine total farm income.
A growing body of research speculates that farmers’ land allocation decisions may
have a significant influence on the pattern of technology adoption (Moreno and Sunding,
2003; Winters et al., 1998; Barbier, 1990; Hopkins et al, 1999; Kruseman, 2000). For
instance, Murray (1994) argues that farmers are more open to soil conservation measures
when they are presented not as the principal component of rural extension, but rather as
secondary items in a menu featuring innovations with good short-term income-generating
potential.
Accordingly, if technology choice is influenced by the same factors explaining land
allocation, then there is a simultaneity problem that must be addressed (Moreno and
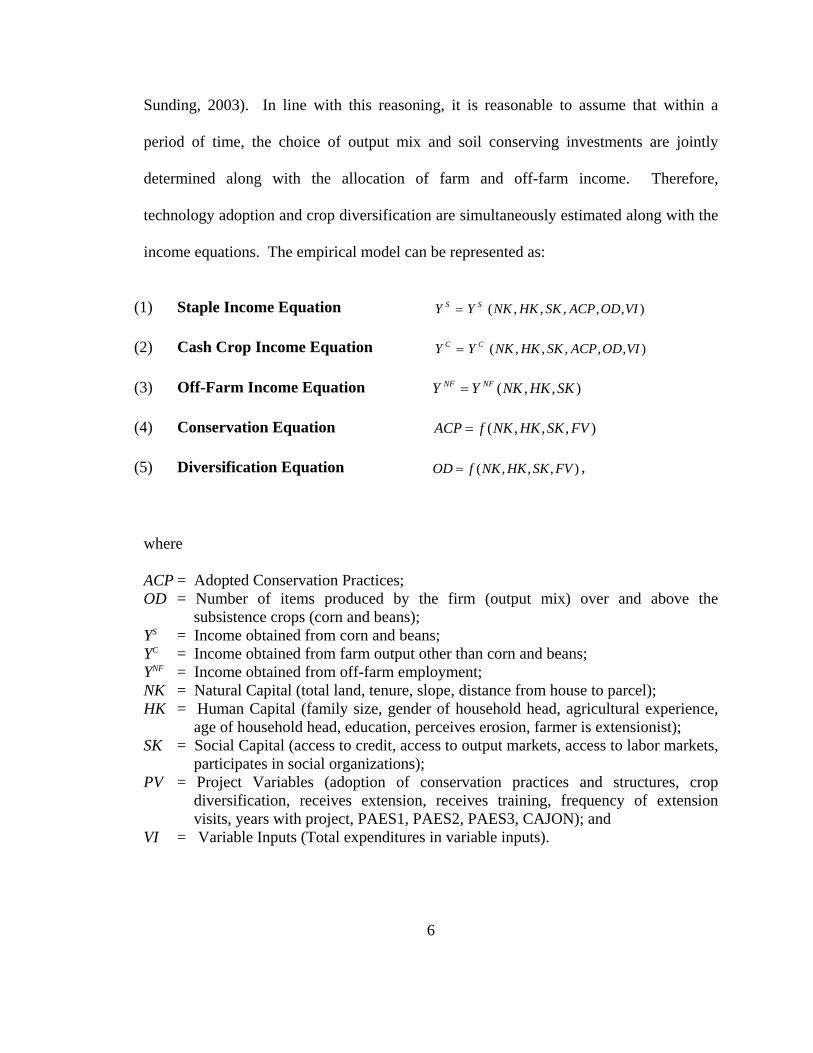
Sunding, 2003). In line with this reasoning, it is reasonable to assume that within a
period of time, the choice of output mix and soil conserving investments are jointly
determined along with the allocation of farm and off-farm income. Therefore,
technology adoption and crop diversification are simultaneously estimated along with the
income equations. The empirical model can be represented as:
(1) Staple Income Equation ),,,,,( VIODACPSKHKNKYY SS =
(2) Cash Crop Income Equation ),,,,,( VIODACPSKHKNKYY CC =
(3) Off-Farm Income Equation ),,( SKHKNKYY NFNF =
(4) Conservation Equation ),,,( FVSKHKNKfACP =
(5) Diversification Equation ),,,( FVSKHKNKfOD = ,
where
ACP = Adopted Conservation Practices; OD = Number of items produced by the firm (output mix) over and above the
subsistence crops (corn and beans); YS = Income obtained from corn and beans; YC = Income obtained from farm output other than corn and beans; YNF = Income obtained from off-farm employment; NK = Natural Capital (total land, tenure, slope, distance from house to parcel); HK = Human Capital (family size, gender of household head, agricultural experience,
age of household head, education, perceives erosion, farmer is extensionist); SK = Social Capital (access to credit, access to output markets, access to labor markets,
participates in social organizations); PV = Project Variables (adoption of conservation practices and structures, crop
diversification, receives extension, receives training, frequency of extension visits, years with project, PAES1, PAES2, PAES3, CAJON); and
VI = Variable Inputs (Total expenditures in variable inputs).
6

7
Equation (1) and (2) include the variable ACP as an explanatory variable, i.e., soil
conservation practices are inputs in the production of staples and cash crops, as proposed
by Thampapillai and Anderson (1994)2.
Consideration must be given to the fact that the dependent variables staples, cash
crops and off-farm income are observed only for a restricted, non-random sample of
those farmers who decide to participate in those activities. Therefore, sample selection
bias is likely to arise and Heckman’s two-stage approach for the estimation of selectivity
bias will be employed to address this issue (Heckman, 1976).
A key feature of the framework presented above is that households
simultaneously determine the allocation of assets to different income-generating
activities. In this context of simultaneity, the possible dependency between regressors
and residuals implies that ordinary least squares (OLS) estimates are biased and
inconsistent. The standard prescription for correcting such cases is the instrumental
variable (IV) technique. If instrumental variables that are correlated with the explanatory
variables but uncorrelated with the error terms are available, then IV regression yields
consistent estimates (Deaton, 1997). An additional problem that needs to be addressed,
given the cross-section nature of the household surveys under study, is the likely
existence of heteroskedasticity (Deaton, 1997; Judge et al., 1988). Heteroskedasticity
affects not the consistency but the efficiency of the IV coefficient estimates. Moreover,
2 in a cross-sectional sample of households, even without market imperfections, prices can be safely assumed to be constant across sections of farmers and therefore can be ignored (Holden et al., 2001; Van Dusen and Taylor, 2003).
the IV estimates of the standard errors are inconsistent, preventing valid inference, since
the usual forms of the diagnostic tests for endogeneity and overidentification are invalid.
Using heteroskedasticity-consistent or “robust” standard errors can solve these problems
and, since the seminal work by Hansen (1982), the Generalized Method of Moments
(GMM) has become the standard remedy for heteroskedasticity in virtually every field of
applied economics (Baum et al. (2003). GMM provides an inference procedure that is
robust in the presence of heteroskedasticity (Kieffer and Vogelsang, 2002).
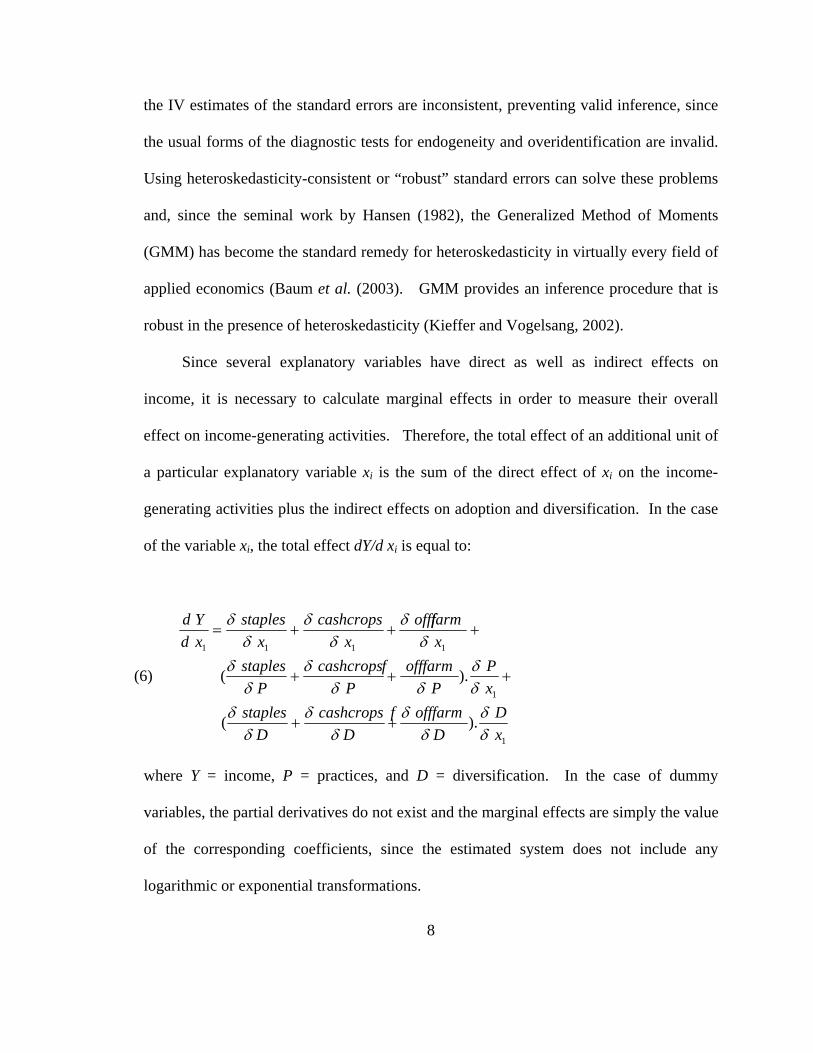
Since several explanatory variables have direct as well as indirect effects on
income, it is necessary to calculate marginal effects in order to measure their overall
effect on income-generating activities. Therefore, the total effect of an additional unit of
a particular explanatory variable xi is the sum of the direct effect of xi on the income-
generating activities plus the indirect effects on adoption and diversification. In the case
of the variable xi, the total effect dY/d xi is equal to:
(6)
1
1
1111
).(
).(
xD
Dfarmf off
Dcashcrops
Dstaples
xP
Pfarmf off
Pcashcrops
Pstaples
xfarmofff
xcashcrops
xstaples
xdYd
δδ
δδ
δδ
δδ
δδ
δδδ
δδ
δδ
δδ
δδ
++
+++
+++=
where Y = income, P = practices, and D = diversification. In the case of dummy
variables, the partial derivatives do not exist and the marginal effects are simply the value
of the corresponding coefficients, since the estimated system does not include any
logarithmic or exponential transformations.
8

9
We chose a linear functional form because of the presence of zero values in the
dependent variables. Widely used alternatives are logarithmic or semi-logarithmic
specifications, wherein to avoid the calculation of the logarithm of zero, each observation
is transformed by adding a small positive constant. However, this technique precludes
the possibility of some households being at a corner solution (Carson and Cameron,
2000). Moreover, there is evidence that the change of zero-values to facilitate the
logarithmic transformation is extremely sensitive to the value of the constant chosen
(Soloaga, 2000). Recent studies using linear specifications include Wilkins et al., 2001;
Finan et al., 2004; Winters et al., 2002; Taylor and Yúñez-Naude, 2000; de Janvry and
Sadoulet, 2001; Dutilly-Diane et al., 2003.
3. Results
This section reports the estimation results of the selectivity-corrected five-
equation system of conservation practices, farm-output diversification, staple crop
income, cash crop income and off-farm income. The results are displayed in Table 3,
while Table 4 shows the marginal effects computed using the coefficients from Table 3
and equation (6). Before proceeding with the parametric analysis, we explore the
robustness of the results, considering the possibility of endogeneity (Hausman's
specification test), heteroskedasticity (White and Breusch-Pagan tests), and the validity of
the instruments used in the IV estimation (J-statistic or OID).
The Hausman test of endogeneity was performed comparing the coefficients
estimated with OLS and 3SLS specifications. The Hausman statistic is significantly

10
different from zero (p-value= <.0001), indicating that a system estimation (IV) is
preferred over OLS.
The Breusch-Pagan and White tests of heteroskedasticity show that the hypothesis
of homoskedasticity cannot be rejected in the diversification and cash crops equations.
Conversely, both tests indicate that the estimation of the conservation practices; staples
and off-farm income equations exhibit heteroskedastic residuals. Given the presence of
heteroskedastic residuals in three of the five equations, the system is estimated using the
GMM procedure.
The test of overidentification (OID) makes it possible to determine if the null
hypothesis that the over-identifying instruments are valid. This test is performed using
the value of the objective function minimized by the GMM procedure multiplied by the
number of observations (J-statistic), which is distributed as a chi-squared with r-p
degrees of freedom. The value r is the product of the number of instruments (65) times
the number of equations (5) and p is the number of parameters in the system (144). The
OID test fails to reject the null that the instruments are statistically valid (p-value=0.486).
Entries in Table 3 are the estimated absolute effects of one-unit changes in the
corresponding explanatory variables on income-generating activities. Coefficients with a
level of significance greater than 90% are indicated in bold. Overall, 68 out of 114
coefficients (60%) are statistically significant. The following discussion will focus
mainly on the results regarding the income-generating equations for staples, cash crops
and off-farm activities.

11
Table 3 shows that in all equations the Inverse Mills Ratios are significant except
in staples, indicating that self-selection is an important factor in considering the income-
generated from a particular activity and failure to control for it would lead to biased
results. All significant Mills have negative signs, and a similar pattern can be found in
Winters et al. (2000).
The coefficients for expenditures on farm inputs, labor and land allocated to the
production of staples and cash crops are all significant and, as expected, positive,
indicating the presence of well-behaved production functions for both staples and cash
crops. Farm size (a proxy for wealth) is positively associated with off-farm income.
White (1991) found land-rich households receiving the largest returns from non-farm
enterprises in Java. Similar results are reported for Ecuador (Lanjouw and Lanjouw,
2001), El Salvador (Lanjouw, 2000), Mexico (de Janvry and Sadoulet, 2001; Winters et
al. 2000) and Brazil (Ferreira and Lanjouw, 2001). As Lanjouw and Lanjouw (2001)
point out, the relatively disadvantaged appear to face barriers to employment in the most
attractive non-agricultural occupations.
Table 4 reports the corresponding marginal effects, wherein the entries are the
returns of an extra unit of each explanatory variable on income from staples, cash crops
and off-farm. The total income column is the sum of the marginal effects by activity,
while the last column shows the marginal effect on total income as percentage of the
predicted household income displayed in the last row.
The marginal income effects displayed in Table 4 reveal that, besides the large
effect of gender, the greatest gains in household income are associated with activities

12
directly related with the allocation of land. The marginal income value of gender
indicates that when the household head is a man, household income is expected to be
80.0% higher than when the household head is a woman. The large income effect of
gender is consistent with the findings by Finan et al., (2004) among Mexican farmers.
The second greatest marginal income effect is land allocated to cash crops (14.8%),
followed by diversification (14.0%), conservation practices (13.9%), and land allocated
to staples (10.6%).
Output diversification significantly decreases income from staple crops and
greatly increases cash crop income. The overall effect on household income of adding
one extra production activity to the farm plan is $307.4, or equivalently, a total income
gain of 14% (Table 4). These results highlight the strategic role of diversification in
fighting rural poverty and are consistent with those reported by Nerlove et al. (1996),
Delgado and Siamwalla (1997), and Ruben and Clemens (2000). However, the income
gain due to a more diversified income portfolio does not occur without cost, since an
extra item added to the farm plan implies a reduction in the production of corn and beans
(staples) of $135.4. This trade-off between diversification and subsistence food
production suggests that switching to a more market-oriented production pattern may
increase household food insecurity, especially in environments where institutional or
market failures are prevalent (Immink and Alarcón, 2003; Von Braun, 1995; Quiroz and
Valdés, 1995).
The marginal income value of conservation practices is $304.9, which amounts to
a 13.9% increase over average total income. The practices included in this variable
13
comprise ground-cover technologies such as crop-mulch/residue management, green
manure and conservation tillage. Ground cover is increasingly recognized not only as a
crucial soil conservation component but also in terms of its potential effects on land
productivity. Therefore, technologies emphasizing ground cover are more likely to be
profitable (Erenstein, 1999; López-Pereira et al., 1994). As in the case of output
diversification, conservation practices have a positive association with cash crops but
negative with staples. In sum, the adoption of conservation practices and output
diversification are positive correlated and denote a switching away from more traditional
staple production.
The positive association between conservation practices and income contrasts
sharply with the effects of conservation structures. The marginal income effect of an
additional conservation structure is -$184.3, or equivalently, an 8.4% drop in household
income. A substantial body of literature contains empirical evidence of poor private
economic returns associated with conservation structures (Erenstein, 1999; Wiggins,
1981; Blaikie and Brookfield, 1987). It is increasingly recognized that structures are
expensive to build and maintain whereas they add little to the productivity of the land in
the short run (Shaxson et al., 1989; Douglas, 1993). Lutz et al., 1994 reports several case
studies in Central America and the Caribbean where physical structures seemingly lessen
the available area for cultivation. Examples include construction of cutoff drains in Costa
Rica and terraces in Guatemala that reduced the effective cultivation area by 14%, and
15%, respectively. Such drawbacks may clearly affect the profitability of these
conservation technologies. Further, terracing often entails movements of earth that

14
brings unproductive soil to the surface (Erenstein, 1999; de Graaff, 1996). McIntire
(1994) reviewed 20 conservation techniques in Mexico and found that cultivation and
cropping practices, including vegetative barriers, were superior to structures in terms of
profitability. On the other hand, a combination of diversion ditches and live barriers in
Guatemala appears to be substantially more profitable than terraces, even if much less
effective to control erosion (Lutz et al., 1994).
Surprisingly, farmer experience exhibits a negative association with household
income. However, as shown in Table 3, most of the coefficients measuring experience
are not significantly different from zero. Similar results regarding farmer experience can
be found in Taylor and Yúñez-Naude (2000).
Education plays a significant and positive role in all income-generating activities.
Other things being equal, an extra year of average household schooling is associated with
a gain of $107.7 or 4.9% in total household income. This result is in line with the
apparent robustness of the evidence on the returns to education at the micro-economic
level. Estimates for developing countries find that each additional year of schooling is
associated with a 6-10% increase in earnings and similar patterns are found in developed
countries (Besley and Burgess, 2003; Krueger and Lindhal, 2001). In Latin America, a
one-year increase in the average education of the adult population can lead to increases of
3-5% in real GDP (Lau et al., 1990; Glewwe, 1996).
The returns from schooling are the highest in cash crop production ($45.5)
followed by off-farm activities ($40.4), and the lowest in food staple production ($21.8).
These returns to education by source of income are consistent with other findings in the

15
rural development literature (Finan et al., 2004; Winters et al., 2000; López and Romano,
2000; López and Thomas, 2000; Ellis, 1998). As Taylor and Yúñez-Naude (2000) affirm
“farm households may reap rewards from schooling by abandoning one activity (e.g.,
traditional agriculture, in which returns from schooling may be limited), in favor of a new
activity (e.g., modern agriculture or non-crop production, in which the returns are high”
(p. 288). Our results are fully compatible with this observation.
In addition to schooling, several variables representing human capital have a
significant and positive association with household income. These variables are erosion
perception, training, years with extension, and frequency of extension visits.
4. Summary and Conclusions
A model of conservation adoption, diversification and household income,
including farm and off-farm sources was formalized, wherein households simultaneously
allocate assets to different activities. The mapping of assets to household income through
both off and on farm activities can conceptually be considered as a production process,
with assets corresponding to factors of production and income as the output. Either
adoption of conservation technologies and farm output diversification are influenced by
participation in natural resource management programs. Therefore, these technological
improvements should foster farm production and productivity and, consequently, should
be reflected in a greater household income,. Finally, household income improvement is
considered a necessary condition for sustainability of the changes introduced by the
projects.
16
Overall, the results indicate that the variables more directly reflecting land
allocation, such as area with staples and cash crops, output diversification and
conservation practices are associated with the greatest gains in household income.
Output diversification significantly decreases income from staple crops and greatly
increases cash crop income. These results reaffirm the strategic role of diversification in
fighting rural poverty. However, gains stemming from a more diversified income
portfolio do not occur without cost, since an extra item added to the farm plan implies a
reduction in the production of corn and beans (staples). This trade-off between
diversification and subsistence food production suggests that switching to a more market-
oriented production pattern may increase household food insecurity.
The marginal income value of conservation practices is $304.9, which amounts to
a 13.9% increase over average total income. The practices included in this variable
comprise ground-cover technologies such as crop-mulch/residue management, green
manure and conservation tillage. Ground cover is increasingly recognized not only as a
crucial soil conservation component but also in terms of its potential effects on land
productivity. Therefore, technologies emphasizing ground cover are more likely to be
profitable. As in the case of output diversification, conservation practices have a positive
association with cash crops but negative with staples. Seemingly, the diffusion of
conservation practices and cash crops mark a switching away from more traditional staple
production.
Contrasting with the positive association between conservation practices and
income we found evidence of poor economic performance of conservation structures

17
such as terraces, stonewalls and drainage ditches. The income effect of an additional
conservation structure is equivalent to an 8.4% drop in household income. This finding is
consistent with a substantial body of literature that recognizes that structures are
expensive to build and maintain, they add little to land productivity in the short run and
reduce the available area for cultivation. Such drawbacks may clearly affect the
profitability of these conservation technologies.
Human capital, measured by erosion awareness, average education level, training,
years of participation with rural extension, and frequency of extension visits, have a
significant and positive association with household income. Education plays a significant
and positive role in all income-generating activities. An extra year of average household
schooling is associated with a 4.9% gain in total household income. The returns from
schooling are the highest in cash crop production and off-farm activities and the lowest in
food staple production. These returns to education by economic activity suggest that
farm households may reap rewards from schooling by abandoning traditional agriculture,
where returns from schooling are limited, in favor of modern agriculture or non-crop
production, in which the returns are higher.
Off-farm income is positively associated with farm size. Seemingly, the
relatively disadvantaged appear to face barriers to employment in the most attractive non-
agricultural occupations.

18
Table 1. Descriptive Statistics of Household Income, Output Diversification and Soil Conservation Technologies.
ALL PROJECTS PAES1 PAES2 PAES3 CAJON
Test of Mean
DifferencesHousehold Income Annual Farm Income (US $) 1646.0 1502.5 1781.0 1357.1 1878.6 0.395Staples (US $) 807.3 814.2 1040.8 847.2 576.0 0.000Cash Crops (US $) 838.7 688.3 740.1 509.9 1302.6 0.028Off-Farm Income (US $) 592.3 525.6 639.0 559.9 631.9 0.763Off-Farm Income: 1 if member receives off-farm 57.0 53.0 51.0 51.0 70.0 0.000Crop Diversification Diversification (#) 1.17 0.92 0.96 1.12 3.28 0.000Entropy 0.13 0.10 0.09 0.11 0.21 0.008Adoption of Conservation Technologies Number of Structures (#) 2.10 2.34 2.15 2.83 1.29 0.000Number of Practices (#) 1.78 1.50 1.69 1.68 2.17 0.000Adoption of Conservation Practices (%) Live Barriers 70.0 62.0 69.0 70.0 76.0 0.034Crop Residue Mulching 84.0 90.0 89.0 75.0 82.0 0.001Green Manure 3.0 0.0 2.0 1.0 9.0 0.000Minimum Tillage 15.0 0.0 0.0 0.0 50.0 0.000Adoption of Conservation Structures (%) Live Fences 71.0 59.0 76.0 86.0 64.0 0.000Forest Plantations 82.5 79.6 82.8 91.6 77.1 0.002Stone Walls 8.0 2.0 2.0 1.0 24.0 0.000Terraces 34.0 42.0 37.0 60.0 3.0 0.000Ditches 27.0 48.0 10.0 27.0 23.0 0.000
Number of Observations 719 167 175 167 210

19
Table 2. Descriptive Statistics of Farm, Farmer and Project Characteristics.
ALL PROJECTS PAES1 PAES2 PAES3 CAJON
Test of Mean
DifferencesFarm Characteristics Land: (Manzanas) 5.88 5.67 4.83 3.85 8.54 0.003Tenure: 1 if owner (%) 74.0 79.0 75.0 80.0 65.0 0.002Slope: 1 if average slope is greater than 15% (%) 61.0 54.0 59.0 50.0 77.0 0.000Credit: 1 if farm uses credit (%) 18.0 5.0 11.0 15.0 38.0 0.000Distance: Distance from house to parcel (Kms) 1.18 1.25 1.22 0.77 1.41 0.004Farmer Characteristics Family Size: (#) 5.52 5.20 5.06 5.41 6.23 0.000Education: Average household education (Years) 3.52 3.23 3.38 4.06 3.44 0.005Gender: 1 if household head is a man (%) 86.0 87.0 78.0 83.0 96.0 0.000Age: age of household head (Years) 47.80 48.78 48.83 48.34 45.74 0.107Contact Farm: 1 if also an extension agent (%) 12.0 5.0 11.0 15.0 17.0 0.006Erosion: 1 if perceives erosion as a problem (%) 88.0 84.0 86.0 87.0 93.0 0.056Communal: 1 if member of a communal organization 64.0 47.0 54.0 56.0 94.0 0.000Project Characteristics Years w/project 3.16 2.50 2.91 2.91 4.08 0.000Extension: 1 if received extension visits (%) 88.0 80.0 82.0 88.0 98.0 0.000Frequency of extension visits (#) 1.98 1.88 1.86 1.92 2.17 0.018PAES1: 1 if belongs to PAES1 (%) 0.23 PAES2: 1 if belongs to PAES2 (%) 0.24 PAES3: 1 if belongs to PAES3 (%) 0.23 CAJON: 1 if belongs to CAJON (%) 0.29
Number of Observations 719 167 175 167 2101 Manzana=0.7 Hectare

Figure 1. Relationship among Resource Management Projects, Household Income
and Sustainability
Resource Management
Project
Diversificationand
Conservation
Off-Farm Income
Farm Production and Productivity
Improved Household
Income
Improved Farm Income
Natural Capital Human Capital Social Capital
External Factors
Natural CapitalHuman CapitalSocial Capital
External FactorsSustainability
20

21
Table 3. Selectivity-Corrected System Estimates of Conservation, Diversification and Income-Generating Equations
Practices Diversification Staples Cash Crops Off-Farm Estimate P-value Estimate P-value Estimate P-value Estimate P-value Estimate P-value
Practices -94.11 0.00 399.05 0.00 Structures 9.86 0.30 -194.12 0.00 Diversification -135.36 0.00 442.77 0.00 Expenditures Staples 0.69 0.00 Expenditures Cash Crops 0.93 0.00 Labor Staples 3.43 0.00 Labor Cash Crops 1.08 0.00 Land w/Staples 232.03 0.00 Land w/Cash Crops 325.68 0.00 Farm size 0.00 0.00 0.01 0.00 16.24 0.00Tenure 0.02 0.55 0.24 0.00 25.10 0.38 -153.95 0.01 -76.53 0.17Education -0.04 0.18 0.04 0.31 52.95 0.00 0.21 1.00 29.66 0.29Education2 0.00 0.55 -0.01 0.55 -9.18 0.00 15.24 0.06 3.05 0.64Experience -0.04 0.00 -0.01 0.47 8.86 0.15 23.71 0.11 -20.17 0.12Experience2 0.00 0.16 0.00 0.43 -0.09 0.27 -1.06 0.00 -0.14 0.42Family size 0.01 0.43 0.02 0.16 -5.68 0.28 -32.15 0.01 2.54 0.79Age 0.03 0.00 0.01 0.54 -5.81 0.38 16.27 0.30 30.72 0.01Gender -0.74 0.00 0.79 0.00 -58.95 0.49 1628.88 0.00 167.24 0.16Hire Labor -0.08 0.03 0.14 0.07 109.17 0.03Market access -0.10 0.00 -0.01 0.82 -122.75 0.00Perception 0.13 0.05 -84.32 0.03 202.23 0.03 18.26 0.81Credit 0.00 0.36 0.00 0.00 0.02 0.00 0.06 0.00 Distance -0.01 0.62 0.01 0.71 5.93 0.59Slope -0.04 0.29 0.03 0.62 121.78 0.00Social -0.02 0.64 0.00 0.96 -48.65 0.32Contact Farm 0.15 0.00 0.08 0.47 -89.42 0.07Training 0.18 0.00 0.05 0.56 Years w/extension -0.23 0.01 0.19 0.02 Years w/extension2 0.09 0.00 -0.06 0.06 Visit frequency 0.04 0.01 -0.02 0.38 PAES1 -0.71 0.00 -1.12 0.00 -516.35 0.00 3060.77 0.00 144.64 0.04PAES2 -0.04 0.53 -1.87 0.00 -85.02 0.13 2047.25 0.00 369.48 0.00PAES3 -0.27 0.00 -1.23 0.00 -206.08 0.00 2157.55 0.00 153.76 0.03Mills -1.48 0.00 -1.56 0.00 102.72 0.24 -477.03 0.00 -978.90 0.00Constant 2.68 0.00 1.74 0.00 487.24 0.00 -4483.15 0.00 218.40 0.39White Test for Heteroskedasticity 0.020 0.035 <.0001 0.263 0.000Breusch-Pagan Test for Heteroskedasticity 0.020 0.035 <.0001 0.263 0.000 J-Statistics (OID): 209.6265 (p-value= 0.48623); Hausman’s Test of Endogeneity: 226.6 (p-value= <.0001)
Number of Observations = 695; Coefficients with a level of significance greater than 90% are indicated in bold.

22
Table 4. Marginal Effects on Income-Generating Activities (US $)
Staples
Cash Crops
Off-Farm
Total Income
% of Total Income
Gender -96.8 1685.2 167.2 1755.7 80.0Land with Cash Crops 325.7 325.7 14.8Divers -135.4 442.8 307.4 14.0Practices -94.1 399.0 304.9 13.9Land with Staples 232.0 232.0 10.6Perception -96.1 252.2 18.3 174.4 7.9Hire Labor -11.3 29.4 109.2 127.3 5.8Slope -0.9 -0.9 121.8 120.0 5.5Education 21.8 45.5 40.4 107.7 4.9Training -23.4 93.3 69.8 3.2Age -10.2 33.4 30.7 53.9 2.5Years w/extension -6.3 26.6 0.0 20.2 0.9Farm size 16.2 16.2 0.7Distance -0.4 0.9 5.9 6.4 0.3Visit frequency -0.7 6.2 0.0 5.4 0.2Labor Staples 3.4 3.4 0.2Labor Cash Crops 1.1 1.1 0.0Expenditures Cash Crops 0.9 0.9 0.0Expenditures Staples 0.7 0.7 0.0Credit 0.0 0.0 0.0 0.1 0.0Contact Farm -24.5 93.8 -89.4 -20.2 -0.9Family size -8.8 -21.3 2.5 -27.6 -1.3Experience 8.6 -32.6 -25.7 -49.6 -2.3Social 1.4 -6.3 -48.6 -53.6 -2.4Tenure -9.7 -37.8 -76.5 -124.1 -5.7Market access 11.4 -46.2 -122.7 -157.6 -7.2Structures 9.9 -194.1 -184.3 -8.4PAES1 -298.8 2284.6 144.6 2130.5 97.1PAES2 172.0 1202.4 369.5 1743.9 79.5PAES3 -13.6 1502.9 153.8 1643.1 74.9
Predicted Household Income 807.1 811.7 576.0 2194.7

23
5. References
Abt-Winrock, 2000. “Tipo de Incentivos que Aplican para Desembolsos de la Partida 02.02.05 y Aspectos Estratégicos de la Partida 02.02.04”. Proyecto PAES-Abt-Winrock, Ministerio de Agricultura, El Salvador.
Anderson, J.R. and J. Thampapillai. “Soil Conservation In Developing Countries: Project and Policy Intervention”. Washington, D.C.: World Bank, 1990.
Arellanes P. and D.R. Lee. “The Determinants of Adoption of Sustainable Agriculture Technologies: Evidence From The Hillsides Of Honduras”. Proceedings of the 25th International Conference of Agricultural Economists, Durban, South Africa. August, 2003.
Barbier E.B. “Farm Level Economics of Soil Conservation: the Uplands of Java”. Land Economics 66 2 (1990): 199-211.
Barbier, B and J. C. Flores. Evaluación de las Actividades del Programa El CAJON. CIAT, 2001.
Barbier, E. “Rural Poverty and Natural Resource Degradation.” López, R. and A. Valdés (ed.) Rural Poverty in Latin America. Baltimore: The Johns Hopkins University Press, 2000.
Baum, C., M. Schaffer and S. Stillman. “Instrumental Variables and GMM: Estimation and Testing”. in Boston College Working Papers No 545, Boston College, Department of Economics, 2003.
Besley, T. and R. Burgess. “Halving Global Poverty.” Journal of Economic Perspectives 17 (2003): 3-22.
Blaikie, P. and H. Brookfield. Land Degradation and Society. Methuen, London, 1987.
Bravo-Ureta, B.E., H. Cocchi, D. Solís and T.E. Rivas. “Análisis del Impacto Económico de Tres Proyectos de Manejo de Recursos Naturales en América Central.” Technical Cooperation 01-08-01-1-RS University of Connecticut – Inter-American Development Bank, August, 2003.
CARE(a). Metodología y Estrategia de Extensión, Subcomponente de Conservación de Suelo y Agroforestería, Proyecto PAES-CARE, Ministerio de Agricultura, El Salvador.
CARE(b) Metodología de Manejo de Incentivos PAES/CARE, Proyecto PAES-CARE, Ministerio de Agricultura, El Salvador.

24
Carson, R.T. and R. Cameron. “Public Preferences Towards Environmental Risks: The Case of Trihalomethanes”. Department of Economics, University of California, San Diego. Discussion Paper No. 21, August 2000.
Conroy, M. E., D.L. Murray and P. Rosset. A Cautionary Tale: Failed U.S. Development Policy in Central America. Boulder, Colorado: Lynne Rienner Publishers, 1996.
de Graaff, J. “The Price Soil Erosion: An Economic Evaluation Of Soil Conservation And Watershed Development”. Mansholt studies No. 3, Wageningen University, 1996.
de Janvry, A. and E. Sadoulet (a). “Concepts for an Approach to Rural Development in Mexico and Central America: Regional Development and Economics Inclusion”. Paper prepared for the IDB regional workshop: “Desarrollando la economia rural de Puebla a Panamá”, Guatemala City, March 5-7, 2001.
de Janvry, A. and E. Sadoulet (b). “Income Strategies Among Rural Households in Mexico: The Role of Off-farm Activities”. World Development 29 (3) (2001): 467-480.
de Janvry, A. and E. Sadoulet. “Geography of Poverty, Territorial Growth, and Rural Development“. Paper presented at the 14th Annual Bank Conference on Development Economics (ABCDE). Washington, D.C., 29 - 30 April 2002.
de Janvry, A., M. Fafchamps and E. Sadoulet. "Peasant Household Behavior with Missing Markets: Some Paradox Explained". Economic Journal 101(1991):1400-1417.
Deaton, A. The Analysis Of Household Surveys. Baltimore: Johns Hopkins University Press, 1997.
Delgado, C. and A. Siamwalla. “Rural Economy and Farm Income Diversification in Developing Countries.” Market and Structural Studies Division, IFPRI Discussion Paper No. 20, October 1997.
Douglas, M.G. “Making Conservation Farmer-Friendly”. In N. Hundson and R.J. Ceatle (eds.), Working With Farmers for Better Land Husbandry. Ankeny, Iowa, Soil And Water Conservation Society 4-15 (1993).
Dutilly-Diane, C., E. Sadoulet and A. de Janvry. “Household Behaviour under Market Failures: How Natural Resource Management in Agriculture Promotes Livestock Production in the Sahel”. Journal of African Economies 12 3 (2003): 343-370.
El Cajon. Evaluación Técnica del Proyecto (PNUD-HON/97/003/A/01/99). Program de Manejo de los Recursos Naturales Renovables de la Cuenca del Embalse El CAJON, Gobierno de Honduras, Diciembre, 1999.

25
El Cajon. Informe de Avance Proyecto El CAJON (1996-2000). Program de Manejo de los Recursos Naturales Renovables de la Cuenca del Embalse El CAJON, Administración Forestal del Estado (AFE/COHDEFOR), Diciembre, 2001.
Ellis, F. “Household Strategies and Rural Livelihood Diversification”. Journal of Development Studies 35 1 (1998): 1-38.
Erenstein, O.C. “The Economics of Soil Conservation in Developing Countries: The Case of Crop Residue Mulching”. Mansholt Studies 14. Wageningen University, 1999.
FAO(a). The State of the World's Forests. Rome, 2003.
FAO(b). “Workshop on Tropical Secondary Forest Management in Africa: Reality and Perspectives”. Nairobi, Kenya, Proceedings: Rome, Italy, 2003.
FAO. “Fact sheet: Women, Agriculture and Rural Development in El Salvador”. www.fao.org/waicent/faoinfo/sustdev/WPdirect/WPre0037.htm 1999.
Ferreira, F.H.G. and P. Lanjouw. “Rural Nonfarm Activities and Poverty in the Brazilian Northeast” World Development 29 (3) (2001): 509-528.
Finan, F., E. Sadoulet, and A. de Janvry. "Measuring the Poverty Reduction Potential of Land in Mexico". Journal of Development Economics (2004).
Glewwe, P. “The Relevance of Standard Estimates of Rates of Return To Schooling for Education Policy: A Critical Assessment”. Journal of Development Economics 51 2 (1996): 267-290.
Greene, W. Econometric Analysis. Prentice Hall. New Jersey, 1997.
Hansen, B.E. Econometrics. Madison, WI: ssc.wisc.edu/~bhansen/notes/notes.htm, 2003.
Hansen, L. P. "Large Sample Properties of Generalized Method of Moments Estimators." Econometrica 50 (1982): 1029-1054.
Heckman, J. “Sample Selection Bias as a Specification Error”. Econometrica 47 (1976) 153-161.
Holden, S., B. Shiferaw and J. Pender. “Market Imperfections and Land Productivity in the Ethiopian Highlands”. EFTD Discussion Paper No. 76, IFPRI, Washington D.C., 2001.
Hopkins, J., D. Southgate, and C. González-Vega. “Rural Poverty and Land Degradation in El Salvador.” Selected paper for Presentation at the American Agricultural Economics Association. Annual Meeting, August 8-11, 1999. Nashville, Tennessee.
IDB. El Salvador Environmental Protection Program. Loan Proposal (ES-0024), 1995.

26
IDB. Program for Management of the Renewable Natural Resources in the Watershed of the El CAJON Reservoir. Loan Proposal (HO-0035), November, 1993.
Immink, M. D.C. and J. A. Alarcon. “Household Income, Food Availability, and Commercial Crop Production by Smallholder Farmers in the Western Highlands of Guatemala”. Economic Development and Cultural Change 41 2 (1993): 319-42.
Judge, G. G., R. Carter Hill, W. E. Griffiths, H. Lütkepohl, and T-C. Lee. Introduction to the Theory and Practice of Econometrics, Hardcover, 1988.
Kieffer, N.M., and Vogelsang T.J. “A New Asymptiotic Theory for Heteroskedasticy-Autocorrelation Robust Test”. Department of Economics and Statistical Science, Cornell University, 2002.
Krueger, A. B. and M. Lindahl. "Education for Growth: Why and for Whom?" Journal of Economic Perspectives 39 (2001): 1101-1136.
Kruseman, G. "Bio-economic Household Modelling for Agricultural Intensification" Ph.D Dissertation, Wageningen University, 2000.
Lanjouw J. O. and P. Lanjouw. “The Rural Non-Farm Sector: Issues and Evidence From Developing Countries”. Agricultural Economics 26 (2001): 1-23.
Lanjouw, P. “Rural Nonfarm Employment and Poverty in Latin America: Evidence from Ecuador and El Salvador” In Rural Poverty in Latin America, R. López and A. Valdés, (eds.). St. Martin Press, LLC, New York, 2000.
Lau, L., D. Jamison and F. Louat. “Education and Productivity in Developing Countries: An Aggregate Production Function Approach”. World Bank, Washington, D.C., 1990.
López, R. “Agricultural Intensification, Common Property Resources and the Farm-Household”. Environmental And Resource Economics, 11(3-4) (1998): 443-458.
López, R. “Structural Models of the Farm Household that Allow for Interdependent Utility and Profit-Maximization Decisions”. In Agricultural Household Models: Extensions, Applications and Policy. Singh, I., L. Squire and J. Strauss (eds.). Baltimore: Johns Hopkins University Press, 1986.
López, R. and A. Valdés. Rural Poverty in Latin America. Baltimore: The Johns Hopkins University Press, 2000.
López, R. and C. Romano. “Rural Poverty in Honduras: Asset Distribution and Liquidity Constraints” en Rural Poverty in Latin America, R. López and A. Valdés, eds., St. Martin Press, LLC, New York, 2000.
27
López, R., and T. Thomas. “Rural Poverty in Paraguay: The Determinants of Farm Household Income.” In López, R. and A. Valdés (ed.) Rural Poverty in Latin America. Baltimore: The Johns Hopkins University Press, 2000.
López-Pereira, M., J. Sanders, T. Baker y P. Preckel. “Economics of Erosion-Control and Seed-Fertilizer Technologies for Hillside Farming in Honduras.” Agricultural Economics 11(1994): 271-288.
Lutz, E., S. Pagiola, y C. Reiche. “The Costs and Benefits of Soil Conservation: The Farmer's Viewpoint." The World Bank Research Observer 9(1994): 273-295.
Mbaga-Semgalawe, Z. and H. Fomer. Household Adoption Behaviour of Improved Soil Conservation: The Case of the North Pare and West Usambara Mountains Of Tanzania”. Land Use Policy 17(2000): 321-336.
McIntire, J. ‘A Review of the Soil Conservation Sector in Mexico”. In Lutz, E., S. Pagiola and C. Reiche, eds., Economic and Institutional Analyses of Soil Conservation Projects in Central America and the Caribbean. World Bank Environment Paper N. 8. Washington, D.C., 1994.
Minten, B. and M. Zeller. Beyond Market Liberalization. Welfare, Income Generation And Environmental Sustainability In Rural Madagascar. Ashgate, Aldershot, 2000.
Moreno, G. and D. L. Sunding. “Simultaneous Estimation of Technology Adoption and Land Allocation”. Paper presented at the American Agricultural Economics Association Annual Meeting, Montreal, Canada, July 27-30, 2003.
Murray, G. Technoeconomic, Organizational, and Ideational Factors as Determinants of Soil Conservation In The Dominican Republic”. In Economic and Institutional Analyses of Soil Conservation Projects in Central America and the Caribbean, E. Lutz, S. Pagiola, and C. Reiche, eds. World Bank Environment Paper Number 8. Washington, D.C.: World Bank, 1994.
Neill, S. P. and D. R. Lee. “Explaining the Adoption and Disadoption of Sustainable Agriculture: The Case of Cover Crops in Northern Honduras.” Economic Development and Cultural Change 49 (2001): 793-820.
Nerlove, M., S. Vosti and W. Basel. “Role of Farm-Level Diversification in the Adoption of Modern Technology in Brazil.” International Food Policy Research Institute, Research Report No. 104, 1996.
ODI. “Options for Rural Poverty Reduction in Central America”. Overseas Development Institute Briefing Paper. odi.org.uk/publications/briefing/bp_jan03.pdf. January 2003
Oldeman, L. R., V. W. P. van Engelen and J. H. M. Pulles. “The Extent of Human-Induced Soil Degradation.” Anexo 5 en World Map of the Status of Human-Induced Soil Erosion: An Explanatory Note, 2da edición, L. R. Oldeman, R. T. A. Hakkeling

28
and W. G. Sombroek, eds. Wageningen, Holanda: International Soil Reference and Information Centre, 1990.
PAES/ IICA. Informe Técnico Final. 2003
PAES/ABT–Winrock. “Informe Annual de Labores, 2001.
PAES/CARE. Informe Financiero Final. 2003.
PAESa. Informe Anual 2000-2001. IICA-CATIE-CRS-UCA, PAES, Ministerio de Agricultura y Ganadería, San Martín, El Salvador, Noviembre, 2001.
PAESb. Informe Anual de Labores, 2000-2001. Abt-Winrock, PAES, Ministerio de Agricultura y Ganadería, El Salvador, Noviembre, 2001.
PAESc. Informe Anual 2000-2001. CARE, PAES, Ministerio de Agricultura y Ganadería, El Salvador, Noviembre, 2001.
PNUD. “Evaluación Técnica del Proyecto. Programa Manejo de los Recursos Naturales Renovables de la Cuenca del Embalse de Cajón.” PNUD-HON/97/A/01/99. Government of Honduras/PNUD, December 1999.
Quiroz, J. A. and A. Valdés. “Agricultural Diversification and Policy Reform”. Food Policy 20 3(1995):245-255.
Ruben, R. and H. Clemens. ‘Rural Off-Farm Employment and Food Security in Honduras”, In Agrarian Policies in Central America, W. T. Pelupessy and R. Ruben, eds., MacMillan, Houndsmills, 2000.
Shaxson, T.F., N.W. Hudson, D.W. Sanders, E. Roose, and W.C. Moldenhauer. Land Husbandry: A Framework for Soil and Water Conservation. Ankeny, Iowa, Soil And Water Conservation Society, 1989.
Skoufias, E. “Using Shadow Wages to Estimate Labor Supply of Agricultural Households," American Journal of Agricultural Economics 76 (1994): 215-227.
Soloaga, I. “The Treatment of Non-Essential Inputs in a Cobb-Douglas Technology: An Application to Mexican Rural Household-Level Data”. Working Paper No. 2499, World Bank, Washington D.C., 2000.
Taylor, J.E. and I. Adelman. "Agricultural Household Models: Genesis, Evolution and Extensions." Review of Economics of the Household 1 (2003):35-38.
Taylor, J.E., and A. Yúñez-Naude. “The Returns from Schooling in a Diversified Rural Economy" American Journal of Agricultural Economics 82(2000): 287-297.
Thampapillai, D.J. and Anderson, J.R. “A Review of the Socio-Economic Analysis of Soil Degradation Problems for Developed and Developing Countries”. Review of Marketing and Agricultural Economics 62 2 (1994): 291-315.

29
UNDP-European Commission (EC)-World Bank. “Linking Poverty Reduction and Environmental Management. Policy Challenges and Opportunities.”, 2002.
Van Dusen, M. E. and J. E. Taylor. “Missing Markets and Crop Diversity: Evidence from Mexico.” Center on Rural Economies of the Americas and Pacific Rim Working Papers, University of California Davis. Available at iga.ucdavis.edu/working.html. February 2003.
von Braun, J. “Agricultural Commercialization: Impacts On Income And Nutrition And Implications For Policy”. Food Policy 20 3 (1995): 187-202.
White, B. ”Economic Diversification and Agrarian Change in Rural Java”. Alexander, P.; Boomgaard, P; White, B., [Eds.] (1991): In the Shadow of Agriculture: Non-Farm Activities in the Javanese Economy, Past and Present Royal Tropical Institute, Amsterdam, 1991.
Wiggins, S.L. “The Economics of Soil Conservation in the Acelhuate River Basin, EL Salvador”. In Morgan, R.P.C. (ed.), Soil Conservation: Problems and Prospects. John Wiley & Sons, 1981.
Wilkins, N. A. Yurekli, and T. Hu. “Economic Analysis of Tobacco Demand”. World Bank, Washington, D.C., 2001.
Winters, P., B. Davis and L. Corral. “Assets, Activities and Income Generation in Rural Mexico: Factoring in Social And Public Capital. Agricultural Economics 27 (2002): 139-156.
Winters, P., P. Espinosa, P. and C.C. Crissman, C.C. “Resource Management in the Ecuadorian Andes: An Evaluation of CARE's PROMUSTA Program. International Potato Center (CIP), 1998.