natural recovery of contaminated...
TRANSCRIPT
Natural Recovery of Contaminated Sediments
Victor MagarVictor MagarBattelle, Columbus, OhioBattelle, Columbus, Ohio

MNR DefinitionMonitored Natural Recovery (MNR) involves leaving contaminated sediments in place and allowing ongoing aquatic, sedimentary, and biological processes to reduce the bioavailability of the contaminants in order to protect receptors
It must be the result of a deliberate, thoughtful decision-making process following careful site assessment and characterization NRC, 1997. Contaminated Sediments in Ports and Waterways
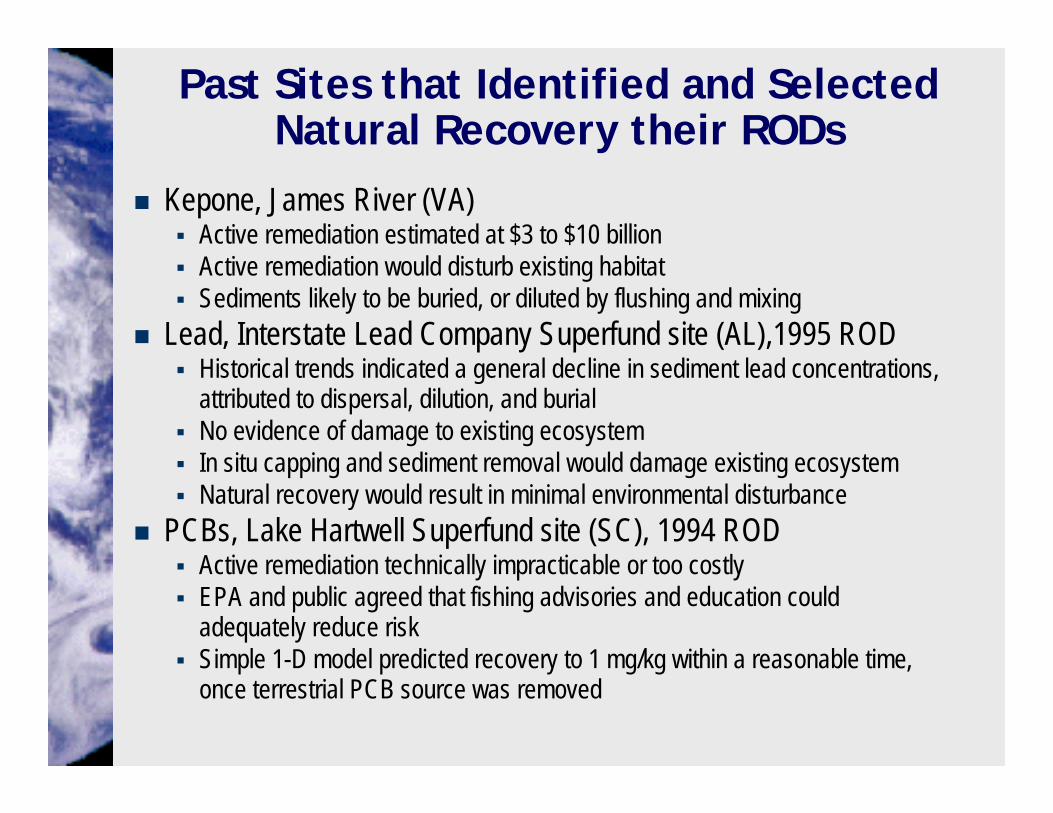
Past Sites that Identified and Selected Natural Recovery their RODs
Kepone, James River (VA)Active remediation estimated at $3 to $10 billionActive remediation would disturb existing habitat Sediments likely to be buried, or diluted by flushing and mixing
Lead, Interstate Lead Company Superfund site (AL),1995 RODHistorical trends indicated a general decline in sediment lead concentrations, attributed to dispersal, dilution, and burial No evidence of damage to existing ecosystem In situ capping and sediment removal would damage existing ecosystemNatural recovery would result in minimal environmental disturbance
PCBs, Lake Hartwell Superfund site (SC), 1994 RODActive remediation technically impracticable or too costly EPA and public agreed that fishing advisories and education could adequately reduce riskSimple 1-D model predicted recovery to 1 mg/kg within a reasonable time, once terrestrial PCB source was removed

Current Direction of MNR:Develop a more rigorous approach to
evaluate and demonstrate MNR efficacyAdvances in environmental science & engineering
Computers and modeling capability Analytical chemistry Understanding of sediment transport and contaminant mass transport processes
Time: Decades since original releases EPA acceptance of MNR Efforts to establish principles to evaluate MNR
RTDFSMWGEPA & DoD
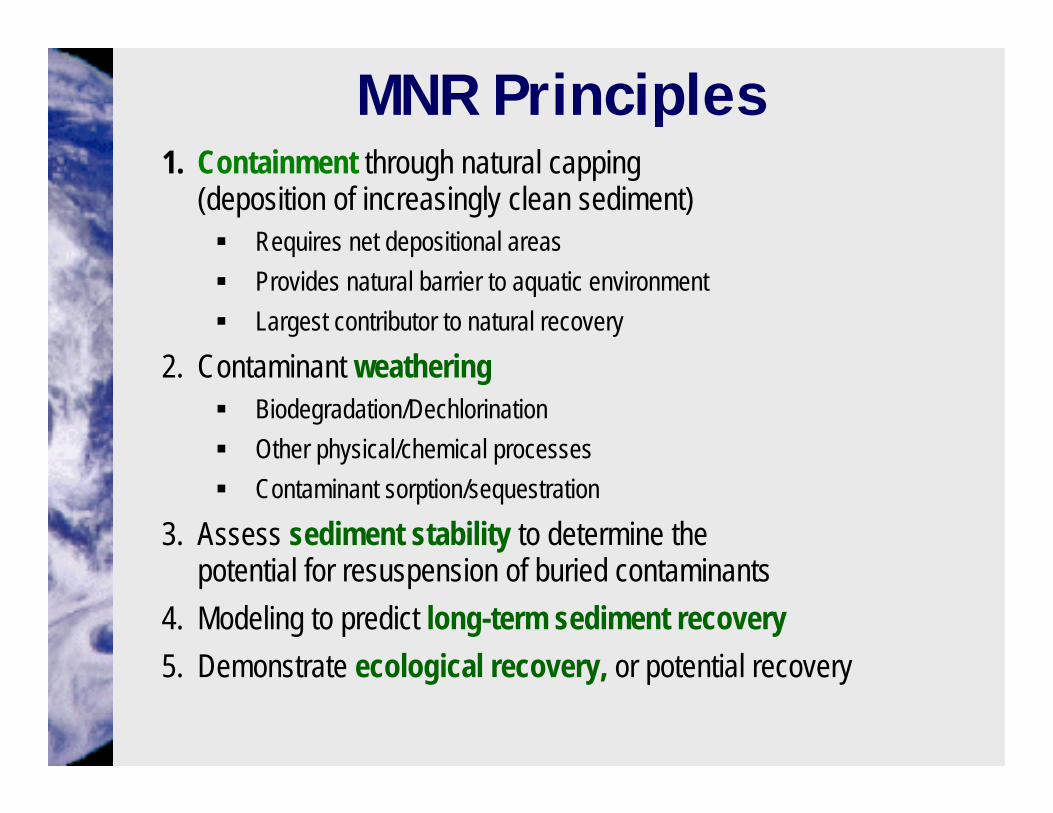
MNR Principles 1. Containment through natural capping
(deposition of increasingly clean sediment)Requires net depositional areasProvides natural barrier to aquatic environment Largest contributor to natural recovery
2. Contaminant weathering Biodegradation/Dechlorination Other physical/chemical processesContaminant sorption/sequestration
3. Assess sediment stability to determine the potential for resuspension of buried contaminants
4. Modeling to predict long-term sediment recovery5. Demonstrate ecological recovery, or potential recovery

Lake Hartwell SiteFresh water lake
Sangamo-Weston Capacitor Manufacturing (1955 – 1978)
Aroclors 1016, 1242, 1254
Terrestrial PCB sources removed in mid-90s
MNR selected by Region 4 (EPA/ROD/R04-94/178)
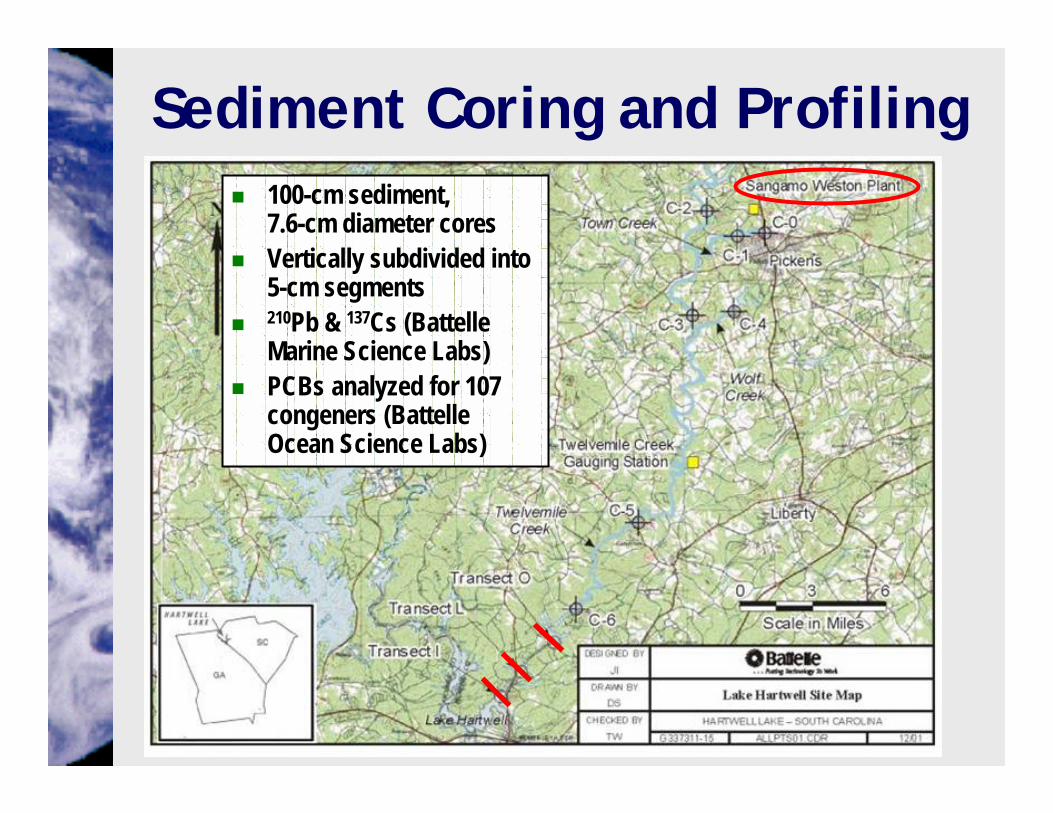
Sediment Coring and Profiling100-cm sediment, 7.6-cm diameter cores Vertically subdivided into 5-cm segments210Pb & 137Cs (Battelle Marine Science Labs)PCBs analyzed for 107 congeners (Battelle Ocean Science Labs)
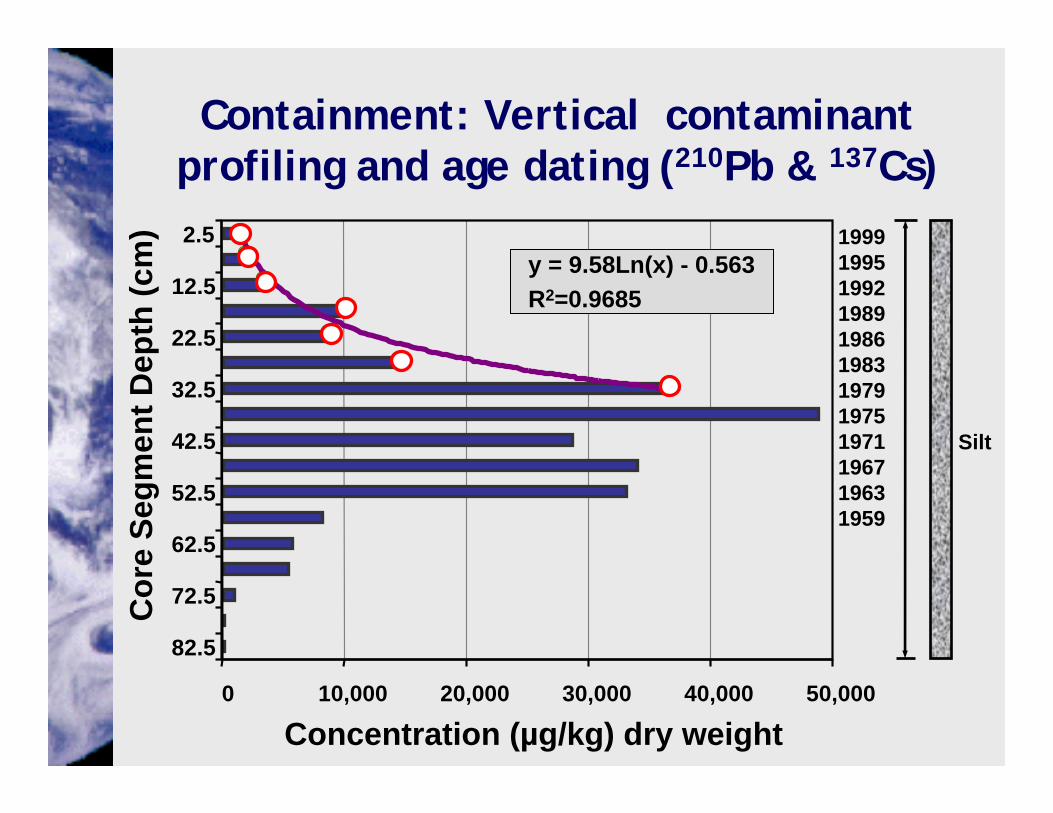
Containment: Vertical contaminant profiling and age dating (210Pb & 137Cs)
Silt
199919951992198919861983197919751971196719631959
0 10,000 20,000 30,000 40,000 50,000
82.5
72.5
62.5
52.5
42.5
32.5
22.5
12.5
2.5
Cor
e Se
gmen
t Dep
th (c
m)
Concentration (µg/kg) dry weight
y = 9.58Ln(x) - 0.563R2=0.9685
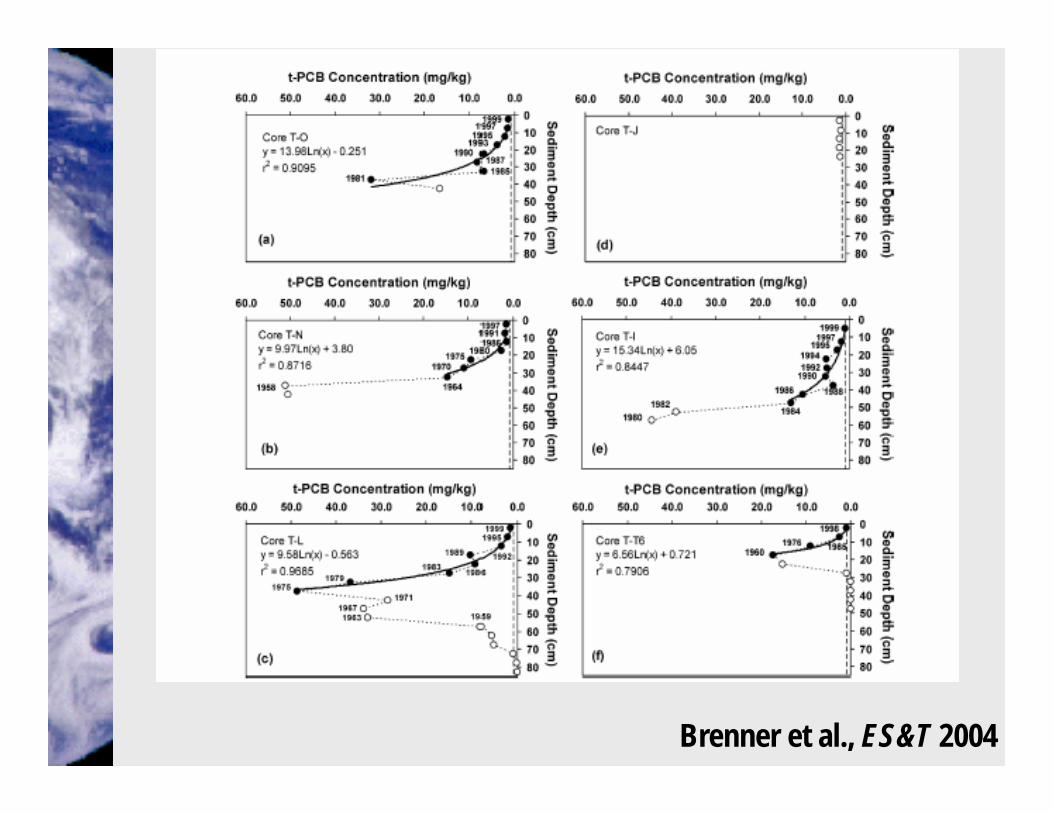
Brenner et al., ES&T 2004

Time to Achieve ROD (U.S. EPA 1994) Cleanup Goals
ROD surface sediment cleanup goal (1 mg/kg)Mean site-specific sediment quality criteria (0.4 mg/kg)NOAA effects range-low (0.05 mg/kg)
Time to Achieve Cleanup Goals 1 mg/kg t-PCB
0.4 mg/kg t-PCB
0.05 mg/kg t-PCB
1 – 5 yrs 2 – 10 yrs 10 – 30 yrs
95% confidence levels increased the time frame up to 95 yrs

Relative meta and paraDechlorination Rates
0.0
0.5
1.0
1.5
2.0
2.5
1935194519551965197519851995Depth (cm)
Ave
rage
No.
of C
hlor
ines
orthometapara
meta rate = 0.048 mol Cl yr-1
para rate = 0.034 mol Cl yr-1
0.0
0.5
1.0
1.5
2.0
2.5
0 20 40 60 80 100Depth (cm)
Ave
rage
No.
of C
hlor
ines
orthometapara
Average Rates (n = 11)
meta = 0.053 ± 0.04para = 0.037 ± 0.03
18 yr per meta Cl27 yr per para Cl
para
ortho meta
para
ortho
metaorthoorthometa
meta
para
ortho meta
para
ortho
metaorthoorthometa
meta

PCB Dechlorination
More Cl-Higher dioxin equivalents
Less Cl-Lower dioxin equivalents
0369
12Core L, Section 10, 35-40 cm depth interval
Total PCB = 48.7 mg/kg32.2%
0369
12Core L, Section 1, 0-5 cm depth interval
Total PCB = 1.58 mg/kg
-6-30369
12
PCB1
PCB3
PCB4
/10
PCB6
PCB7
/9PC
B8/5
PCB1
2/13
PCB1
6/32
PCB1
7PC
B18
PCB1
9PC
B22
PCB2
4/27
PCB2
5PC
B26
PCB2
8PC
B31
PCB3
3/20
PCB4
0PC
B41/
64/7
PCB4
2PC
B43
PCB4
4PC
B45
PCB4
6PC
B47/
75PC
B48
PCB4
9PC
B51
PCB5
2PC
B53
PCB5
6/60
PCB5
9PC
B63
PCB6
6PC
B70/
76PC
B74
PCB8
2PC
B83
PCB8
4PC
B85
PCB8
7/11
5PC
B91
PCB9
2PC
B95
PCB9
7PC
B99
PCB1
00PC
B101
/90
PCB1
05PC
B107
PCB1
10PC
B114
PCB1
18PC
B119
PCB1
24PC
B128
PCB1
29PC
B130
PCB1
31PC
B132
PCB1
34PC
B135
/144
PCB1
36PC
B137
PCB1
38/1
60PC
B141
PCB1
46PC
B149
PCB1
51PC
B153
PCB1
56PC
B158
Core L: Relative Change Section 8 (35-40 cm) minus Section 1 (0-5 cm)
28.7%
PCB Congener
Per
cent
t-P
CB
(%)
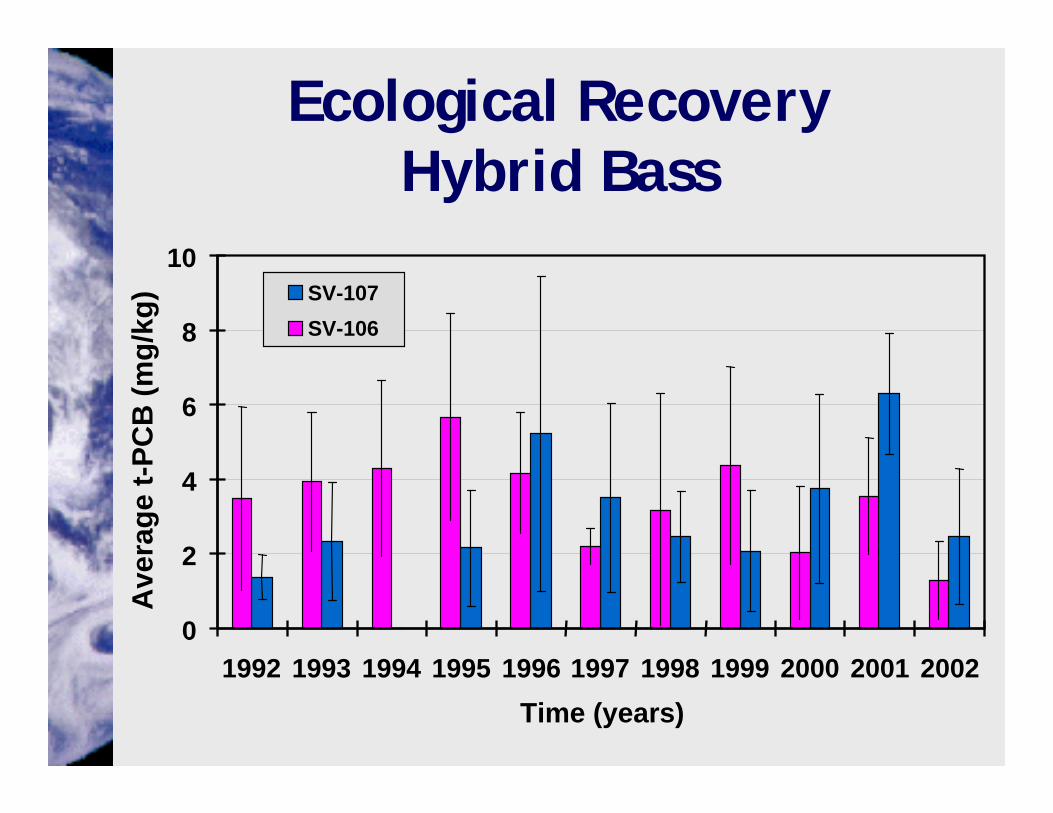
Ecological RecoveryHybrid Bass
0
2
4
6
8
10
20022001200019991998199719961995199419931992Time (years)
Ave
rage
t-PC
B (m
g/kg
) SV-107SV-106

Largemouth Bass
0
4
8
12
16
20
20022001200019991998199719961995199419931992
Time (years)
Ave
rage
t-PC
B (m
g/kg
) SV-106SV-107

Do fish PCB concentrations over time reflect reduced surface sediment concentrations?
199919951992198919861983197919751971196719631959
0 10,000 20,000 30,000 40,000 50,000
82.5
72.5
62.5
52.5
42.5
32.5
22.5
12.5
2.5
Cor
e Se
gmen
t Dep
th (c
m)
Concentration (µg/kg) dry weight

Sediment StabilityLake Hartwell Site
Historical storms Drought conditions
Hunters Point Shipyard
Sedflume Hydrodynamic studies