natural gas purification - weebly
TRANSCRIPT

Natural Gas Purification
Water Absorption Specialist: Ralph “Peaches” Eachus
MDEA Absorption Specialist: Jonathan “The Torpedo” Ekstrom
Gas Membrane Specialist: Addison “Lady Killer” Frank
Cryogenic Distillation Specialist: Alexander “The Great” Kazior
4/25/2014
The Franchise: “Making Grandma proud since 1992”

Executive Summary
After cost analysis in the water absorption column, it was found that this system is not the best option
for purification under the given conditions. Although achieving high purity was possible, the costs for
constructing the column and water outweighed the gross income for selling the methane. It was
discovered that operation at lower temperatures, while still remaining above the freezing point of
water, yielded lower minimum flow rates and column sizes. Despite these improvements, it would have
been more profitable to sell the low energy gas as is instead of running it through a water absorption
column. This is due to the large amount of water needed to absorb the carbon dioxide. With a better
absorbent, the column could potentially make more money.
MDEA is a much better absorbent than water, and when used in an absorption column, yields a good
profit. Compared to the water absorption column, the cost of the column is very similar. However, the
cost for the MDEA and water are much less in this method than the cost of water in the previous
method. Although MDEA is much more expensive than water, its ability to absorb carbon dioxide
proved to save a lot of money. The most profitable process for this method was purifying the stream to
medium energy gas with an MDEA stream of 175 mol/s, which made a total profit of $5.615 million per
year. However, this was not the most profitable purification method.
Purification by gas separation membrane proved to be one of the most profitable methods under the
given conditions. The biggest expense in any variation of this method was the cost of the membrane.
When electricity was needed for compression, it was a fraction of the cost of the membrane. It was
discovered that feeding a higher pressure gas into the system and therefore increasing the pressure of
the retentate reduced the area of membrane needed, which significantly reduced the expenses.
Surprisingly, most of the profit was made from selling off the high purity carbon dioxide. The most
profitable process for this method was purifying the stream to medium energy gas with a pressurized
feed, which made a total profit of $13.21 million per year. However, this process is very unrealistic due
to the large area of membrane needed to accomplish this. The area for the most profitable process was
close to 500,000 ft2, which is about 11 acres. The GSM is unable to stack like a column which would
make the cost of real estate much larger than any column.
Purification by cryogenic distillation proved to be the most profitable and realistic method. The biggest
expense for this method was the cost of refrigeration. Due to the use of flash distillation, not many
plates were needed, making this cost very insignificant compared to refrigeration. Like the gas
separation membrane, most of the income was from selling the high pressure carbon dioxide. Unlike all
the other processes, the distillation column made the highest profit by selling the high quality methane
gas and carbon dioxide, which was $13.5 million per year. This value is very close to the profit from
GSM. However, the total area that the column occupies is significantly smaller, since the stages can be
stacked. Therefore, the cryogenic distillation column is the most effective purification method.

Introduction
This scientific analysis was conducted to discern the most profitable course of action to purify our feed
stream from enhanced oil recovery (87% CO2) using distillation, absorption using water, absorption
using MDEA, or gas membranes. Under the parameters of each methane purification system a variety
of conditions were measured to determine the optimal conditions for each respective system. Capital,
materials, and operational costs were weighed against the value of the product created in each
calculation. For each method only the most profitable method was considered in comparison to the
other configurations. The operational specifics are as follows.
Absorption Column with Water:
Diagrams Figure 1 below shows a diagram of an absorption column. The inlet gas in this case is our mixture of 13% methane with 87% carbon dioxide. The inlet liquid is our absorbent, pure water while the outlet liquid is water with dissolved carbon dioxide. This leaves our gas outlet to contain whatever purity of methane is desired with carbon dioxide making up the remainder. The column is to be packed with 1” Raschig rings. This diagram would include a heater or refrigeration unit prior to the column to cool or heat the stream. A compressor would be needed to compress the outlet gas for pipeline quality gas and liquefied natural gas production.
Figure 1: Absorption Column Diagram1
Operation Assumptions: The water used in the absorption process can be recycled each day, therefore only enough water is needed for 24 hours rather than 6000 hours per year. The Henry’s law constant for carbon dioxide in

water was assumed to be constant at each of the temperatures tested 25˚C, 5˚C and 45˚C. The mass transfer coefficients Kx and Ky used to calculate the volume of the column needed were assumed to be the same as those values given in Problem Set 4 because that problem had the same geometry and the MDEA solution used was mostly water.3
Kx = 8.6 mol/(m2*s) Ky = 0.56 mol /(m2*s)
When the profit was calculated, the carbon dioxide that was dissolved in the water was neglected due to complexity. Carbon dioxide would somehow have to be extracted out of the water and sold. The resources were not given for this analysis and thus we assumed that the water containing CO2 yields no profit. Figure 2 below displays the Henry’s law constant in water at various temperatures. This model is said to be relatively accurate for the solubility of carbon dioxide in water at pressures up to 100MPa or roughly 14,500 psi. The pressure of our feed is well below this threshold at 334.7psi.
Figure 2: Henry’s Law Constant for CO2 in Water2

Based upon Figure 2 and dividing by our running temperature of 334.7psi or 2307.7kPa the henry’s law constants used for calculation were:
At 25˚C H=65.00 At 5˚C H=34.66
At 45˚C H=104.00 Calculation The minimum water flow Lmin for each purity, was calculated using:
Lmin = V H(yCO2,in-yCO2,out)/YCO2,in
In order to find the best Liquid flow rate, Lmin was multiplied by 1.2, 1.3, and 1.1 for each desired purity
gas and was used as Lin in all following calculations.
These two equations are used to account for the variable nature of the vapor and liquid flow rates as the
respective streams travel through the absorption column. The Vprime and Lprime values are constant
throughout the column.
In order to evaluate the volume of the column needed based solely on changing the Yin and YCO2,out,X
must be converted into a function of Y.
This equation is derived by performing a mass balance on the entire system with respect to CO2. The
equation was then solved for the XCO2 variable to simplify the calculations.
Henry’s Law constants were obtained from Figure 2 and then used to calculate the overall mass transfer
coefficient, K0.
Using the mass transfer coefficient along with the Henry’s constants, the volume required to produce
the various YCO2,out fractions needed was calculated in Wolfram Mathematica by evaluating the following
integral:
∫

This equation is traditionally expressed as Height of column = (Height of a transfer unit)*(Number of
transfer units). It was reformatted so that the equation could be used to solve for the overall volume of
the column instead of just the height of the column by removing the cross sectional area from the
integral and multiplying it to the LHS of the equation or the height of the column.
All of these equations were utilized in conjunction with each other to deduce the volume of the column
at varying values of YCO2,out and Lin. The degrees of freedom involved in the calculation allowed for these
two variables to be altered maximizing results. The remaining calculations are relating to costs and will
be covered in the cost analysis section.
Cost Analysis The column volumes needed for purification from the integral above as well as a summary of all costs of the column and materials needed can be found in Tables 1-3 for each respective temperature of the feed. All costs and profits are given in $/yr. The capital cost of the column is proportional to the Raschig ring price given as $1800/ft3 which is equivalent to $63520/m3. Therefore the total cost of the column was simply the volume needed for each given Liquid flow rate and purity multiplied by this price. Column Cost ($) = Volume needed (m3)* Raschig ring price($/m3) The cost of the water was determined by the liquid flow rate needed. The price of process water given was $0.15/1000gal which is equivalent to $0.000659/mol. Cost of water ($/yr) = price of water ($/mol)*flow rate (mol/hr)*running time (24 hr/yr) The equipment cost accounts for any equipment required to change the pressure or the temperature. For all pipeline quality gas and liquefied natural gas, the exiting gas stream needs to be compressed to 600psi in order to be sold. A compressor uses electric power at a price of $0.12/kilowatt-hr. All streams 45°C must be heated before entering the absorption column and all streams at 5°C must be cooled. The price of heating as given in the project specs is $3/MMBtu and the price of refrigeration (cooling) to 5°C is $12/MMBtu. Cost of Compressor ($/yr) = Price of Electric ($/kw-hr)*Vout(mol/hr)*running time (6000 hr/yr)*energy needed (kw-h/mol) Cost of Heating ($/yr) = Price of heating ($/MMBtu)*Vin (mol/hr)*heating job(Btu/mol)*running time(6000 hr/yr) Cost of Cooling ($/yr) = Price of refrigeration ($/MMBtu)*Vapor flow rate (mol/hr)*cooling job (Btu/mol)*running time (6000 hr/yr) The gross income generated in absorption with water comes from selling the gas product at the various purities (eg. High Energy Gas, Medium Energy Gas, etc…). In order to sell the carbon dioxide it would

have to be extracted from the water which is outside the scope of this project. The price of each product grade is given in $/MMBtu of methane. Gross Income ($/yr) = price of methane ($/Btu)*XCH4,out*Energy of Combustion for Methane (782.6 Btu/mol)*Vout (mol/hr)*running time (6000 hr/yr) Tables 1-3 below display all calculated values used in the absorption with water analysis.

Table 1: Cost Analysis at original feed temperature (25˚C)

Table 2: Cost Analysis when the feed is cooled to 5˚C

Table 3: Cost Analysis when feed is Heated to 45˚C

Analysis Upon review of the profit for each gas product in tables 1-3 it can be seen that none of the combinations make any more money than just selling the feed as a Low Energy Gas. In fact, many of the outlet purity and flow rate combinations listed actually lose money overall. This result is due to the fact that carbon dioxide is not very soluble in water and therefore the Henry’s Law constants are large. Our feed stream is very high in carbon dioxide and low in methane therefore, it takes very, very large amounts of water to dissolve enough carbon dioxide. So much water costs a lot of money. Based upon the data, the most significant costs to consider in building an absorption column to purify natural gas at our feed concentration are the building costs of the column and the water used. In general, the better quality gas stream desired, the more the column and the water costs. This yields a smaller profit as gas purity is increased. The results suggest that as temperature decreases, the absorption of carbon dioxide in water improves and profits are slightly better. Although this yields higher profits, cooling to 5°C still does produce more profit than just selling the feed as is. Based upon this analysis cooling the feed further would not outweigh the profit obtained from selling the feed as is by a significant enough amount to be worth building a water-absorption column. The initial price of building the column is only a one-time cost every 30 years, therefore the profits for the years where it is not required to replace the Raschig rings would be higher. Still this profit would not be enough to ultimately be worth building and maintaining the column using water because of the obnoxious amount of water needed. Appendix
a = 206.7 m2/m3
Section References
1. "Packed Bed." - Encyclopedia Article. MediaWiki, n.d. Web. 23 Apr. 2014. 2. John J. Carroll and Alan E. Mather, "The System Carbon Dioxide-Water and the Krichevsky-
Kasarnovsky Equation," Journal of Solution Chemistry, vol. 21, pp. 607-621, 1992. 3. Zydney, Andrew “CHE 410 Problem Set 4”. Problem 2. 2014
4. "Energy from Fossil Fuels." Energy from Fossil Fuels. Western Oregon University, n.d. Web. 22
Apr. 2014.
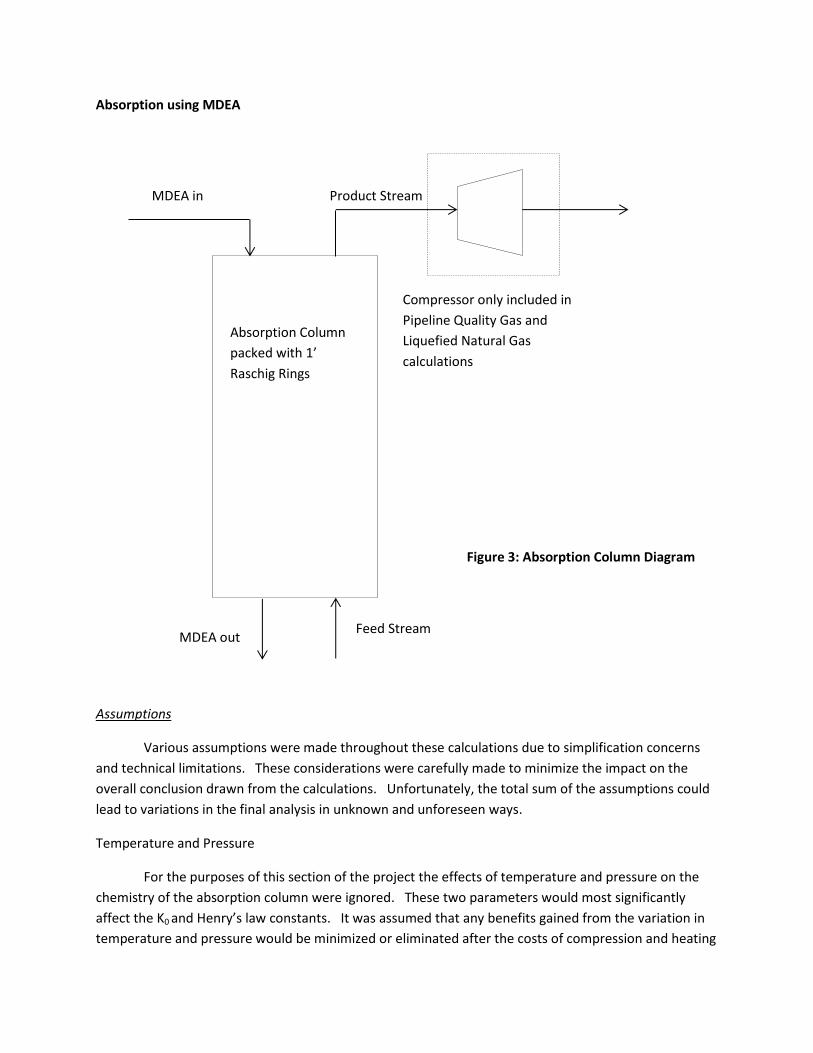
Absorption using MDEA
Assumptions
Various assumptions were made throughout these calculations due to simplification concerns
and technical limitations. These considerations were carefully made to minimize the impact on the
overall conclusion drawn from the calculations. Unfortunately, the total sum of the assumptions could
lead to variations in the final analysis in unknown and unforeseen ways.
Temperature and Pressure
For the purposes of this section of the project the effects of temperature and pressure on the
chemistry of the absorption column were ignored. These two parameters would most significantly
affect the K0 and Henry’s law constants. It was assumed that any benefits gained from the variation in
temperature and pressure would be minimized or eliminated after the costs of compression and heating
Compressor only included in
Pipeline Quality Gas and
Liquefied Natural Gas
calculations
Product Stream MDEA in
MDEA out Feed Stream
Absorption Column
packed with 1’
Raschig Rings
Figure 3: Absorption Column Diagram

were taken into account. This claim is partially substantiated in the calculations for absorption using
water where data for multiple temperatures is tabulated.
Recycle of MDEA
The biggest assumption made is involved with the recycle of MDEA through the column. The issue
arises in that as the MDEA runs through the column CO2 would build up in the liquid. The MDEA would
need to be scrubbed of CO2 before it was allowed to run through the column again. The costs of this
process are ignored and the CO2 stripped from the MDEA is neglected. The costs of the stripping
process, most likely distillation, would be extensive. In addition due to the high CO2 fraction of the
initial feed if the stripping process could be run to produce high purity CO2 the profits from that sale
could be significant. These assumptions were made due to the instruction of the product supervisor Dr.
Zydney.
Calculations
Unless otherwise stated, constants and values taken from problem set 4 by Dr. Zydney.
These two equations are used to account for the variable nature of the vapor and liquid flow rates as the
respective streams travel through the absorption column. The Vprime and Lprime values are constant
throughout the column.
The equation for the Henry’s law constant yields a value with respect to the XCO2 value at any point in
the column. This was obtained using figure 4 to create a line of best fit for the data in Figure 4.
This equation is derived by performing a mass balance on the entire system with respect to CO2. The
equation was then solved for the Xco2 variable to simplify the calculations.
The K0 expression is a thermodynamic law used to express the overall mass transfer coefficient. Ky is the
mass transfer coefficient for the gas phase while the Kx value caractarizes the mass transfer coefficient
for the liquid phase.
∫

This equation is traditionally expressed as Height = (Height of a transfer unit)*(Number of transfer units)
. It was reformatted so that the equation could be used to solve for the overall volume of the column
instead of just the height of the column. The variable “a” is defined as the interfacial area between the
gaseous and liquid phases in the column with the units of m2/m3.
a = 206.7 m2/m3
All of these equations were utilized in conjunction with each other to deduce the volume of the column
at varying values of Yco2,out and Lin. The degrees of freedom involved in the calculation allowed for these
two variables to be altered maximizing results. The remaining calculations are relating to costs and will
be covered in the cost analysis section.
Figure 4: Graph of Henry’s Law constants and Accompanying Data
Cost Analysis
The profit analysis is broken down into the costs and the gross from the sale of the product.
Costs
The costs are attributed to material costs, capital costs, and operational costs. The material costs come
from the purchase and upkeep of MDEA and water used in the liquid stream running through the
column. The cost of the feed stream of CO2 and methane are assumed to be non-existent due to
information in the problem statement. Capital costs are encapsulated in the cost of the column itself.
This cost is characterized in a cost per volume due to the physical column and the Raschig rings. Finally,
the operational costs are largely not taken into account. The only time they are included is in the
calculations for pipeline quality gas and for liquefied natural gas. This is due to the inclusion of a
compressor in both of those calculations to achieve the necessary specification for their product
streams.
y = 0.0009e12.839x
0
0.2
0.4
0.6
0.8
1
1.2
0 0.1 0.2 0.3 0.4 0.5 0.6He
nry
's L
aw C
on
stan
ts
X CO2
Henry's Law Calculation

Gross
The gross was calculated using the prescribed sales figures in dollars per MMBTU. A BTU per kilogram
methane measurement was derived using information found in engineering toolbox. This was used to
obtain the overall gross for the entire process.
Profit
The profit was then calculated from combining the gross with the costs. 30 years, 60 years, and per
year calculations were computed to give an overview of profits given from a single column (replaced
every 30 years) and to give a more immediate yearly profit analysis.
The full cost analysis can be found in table 4. The most profitable parameters for the column to be run
at were found based of these calculations. This point occurs when medium energy gas is produced with
an Lin=175 and a column size of 146.84 ft3.
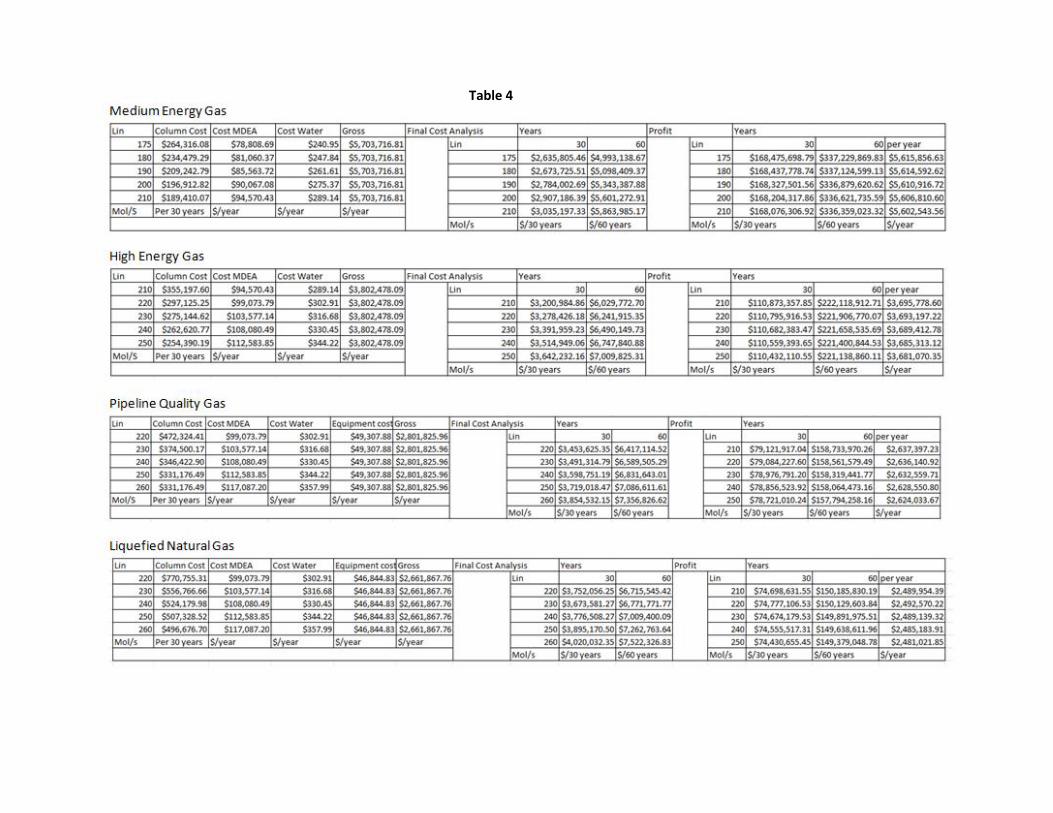
Table 4

Possible Improvements
The assumptions made during the computation of this process are the limiting factors on accuracy. Any
assumption that was made could be further researched and calculated to create a model that more
closely reflected real world application.
The best way to ensure accuracy would be to construct a scale model of this process. After scaling down all the requirements of the column a smaller cheaper facsimile could be tested for its accuracy and plausibility. Carefully recording the requirements and operating parameters of the scaled column would give the most exact specifications of what the larger full scale column would work at. Section References:
1. Zydney, Andrew “CHE 410 Problem Set 4”. Problem 2. 2014
2. "Energy from Fossil Fuels." Energy from Fossil Fuels. Western Oregon University, n.d. Web. 22
Apr. 2014.
Gas Membrane Separation
Assumptions
For gas separation membrane, several assumptions were made due to nature of the process. The
temperature of the system does not affect the purity or the flow rates of the streams. This is evident
from the lack of a temperature variable in the balance and mass transfer equations. The temperature
will inevitably change as the pressure changes, but this is not important in calculating the costs of the
system. The pressure of the feed was given at 320 psig, and was assumed to stay constant throughout
the entire project. Realistically, there will be a pressure drop as the gas travels through the system.
However, for the purposes of the project, namely, to estimate which process will make the most profit,
this can be neglected. In addition, it is assumed that the performance of the membrane is just as good
at the 600th hour as it is the first hour. Realistically, this is likely not the case; however, this can be
neglected based on the assumption that the membrane will perform up to the standard needed for one
year. If this was not the case, the parameter for the lifetime of the membranes would be shorter.
Equations
There is no set of equations that are distinct for a gas separation membrane. There is nothing needed
except for mass balances and mole fractions. The one necessary factor is a basic one; the number of
unknowns must equal the number of equations. Below is a list of generic equations that are used to
satisfy the number of equations needed.
1. Total mass balance:
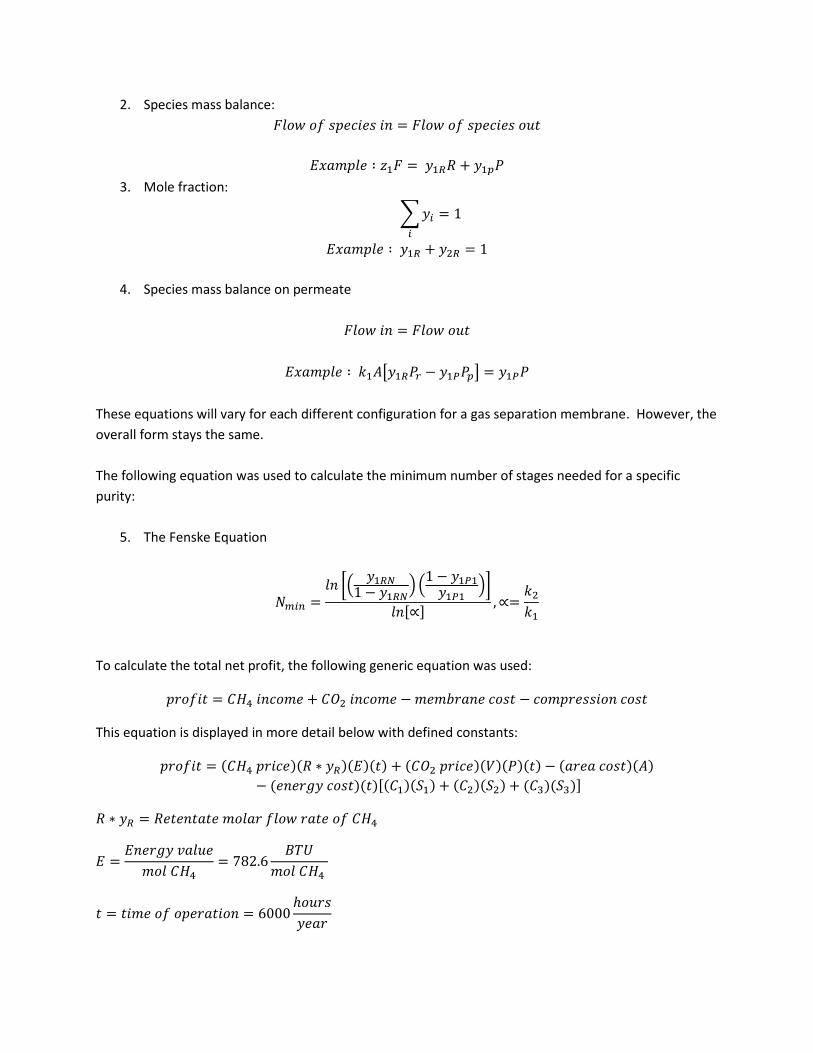
2. Species mass balance:
3. Mole fraction:
∑
4. Species mass balance on permeate
[ ]
These equations will vary for each different configuration for a gas separation membrane. However, the
overall form stays the same.
The following equation was used to calculate the minimum number of stages needed for a specific
purity:
5. The Fenske Equation
[(
) (
)]
[ ]
To calculate the total net profit, the following generic equation was used:
This equation is displayed in more detail below with defined constants:
[ ]

A = total area of membrane system
(
⁄ )
Cost Analysis
When simulating the differing processes for gas separation membrane, limitations of this separation
method made it impossible to obtain certain purities. In a single stage system (Figure 1) it is physically
impossible to generate a stream of 95% purity or higher. To test this, the inlet pressure was set equal to
one million psia. Even with this large pressure, there were no realistic solutions. Therefore, achieving a
high purity by only changing the inlet pressure is not physically possible. In attempt to use a reflux
stream in a single stage (Figure 6) a few values for the reflux stream were used to compare the results.
No matter what the value of the reflux stream was, the recovery value stayed constant. It was found
that adding a reflux stream only increases the required area of the membrane.
By increasing the inlet pressure in a single stage (Figure 7) the recovery was very similar, but the
required area decreased. An arbitrary value of 600 psi was used since that is a specification for some of
the higher purity streams. The profit for the 40% methane stream turned out to be the most profitable.
A higher inlet pressure of 700 psi yielded a slightly higher profit. It would be possible to find the
pressure that would maximize profit; however, increasing the pressure of the inlet feed does not
increase the profit significantly. So, for the purposes of this project, it is not necessary to find this exact
value.

The Fenske equation was utilized in order to calculate the number of stages needed to achieve high
purity of methane. To achieve a 95% purity, a minimum of two stages are needed In order to achieve
<50 ppm CO2, a minimum of four stages are needed. After evaluating the two-stage system (Figure 8), a
good amount of money was made, but not as much as a single stage with a pressurized inlet feed. After
setting up a system with four stages, no realistic solutions were calculated. Therefore, this requires
even more stages to achieve. After comparing the value of liquefied natural gas to the cost of
membranes for more than four stages, the conclusion was made that the cost of membrane would far
outweigh the income from selling the liquefied natural gas.
After the analysis was completed it was evident that the most profitable parameters for the process was
700psi to produce medium energy gas. This yielded a profit of 13.2 million.
Figure 5: Single Stage GSM
Figure 6: Single Stage GSM with Reflux

Figure 7: Single Stage GSM with Compressed Feed Stream
Figure 8: Two-Staged GSM with Compressed Feed and Reflux


Appendix
(1)
(2)
(3)
Figure 9. HYSYS, Peng Robinson Calculation of Molar Flow Rate
Section References
1. "Energy from Fossil Fuels." Energy from Fossil Fuels. Western Oregon University, n.d. Web. 22
Apr. 2014.
2. Fogler, H. Scott. "Appendix B." Elements of Chemical Reaction Engineering. 4th ed. Harlow
(Essex): Pearson Education, 2014. 1017-019. Print.
3. "Uconeer 3.3." Values of the Universal Gas Constant "R" from Uconeer. Katmar Software, n.d.
Web. 23 Apr. 2014.
4. Zydney, Andrew “CHE 410 Problem Set 5”. Problem 2. 2014

Cryogenic Distillation
Figure 10: Cryogenic Distillation Diagram
We first look at XY plot to get an idea of how many stages this process will need. Figure 11 shows our
feed being distilled at the same pressure it enters, 334.7 psia.
Figure 11: X-Y Diagram for Methane-CO2 System

Figure 11 explains how many stages will be needed to distill our feed at 334.7 psi based on the desired
product. The black lines represent our feed of 13% methane and shows that only one stage will be
necessary when the desired product has less than 89% methane. The outliers on the graph are not
relevant to our process and can be disregarded. The results to make each type of product gas are
below.
Low Energy Gas
Our original feed is a gas with 13% CH4 so it is already a low energy gas (10-40%). When sold as is, it
makes roughly $1.9 million per year.
Medium Energy Gas
To produce medium energy gas (40-70%) we can use flash distillation at a pressure of 334.7 psia. Table
6 shows the temperature, costs, and profits for three different purities of medium energy gas. All costs
and profits in Table 6 are in $/year.
Table 6
Purity (%CH4)
Condenser Temp (F)
Refrigeration Cost
Plate Cost CH4 Fuel profit
CO2 Profit Net Profit
40.1 -27.56 2,376,000 420,000 2,331,629 12,967,060 12,502,689
55.0 -43.44 3,322,230 420,000 2,315,664 14,550,885 13,124,320
69.9 -63.48 4,197,660 420,000 2,306,598 15,449,795 13,138,733
High Energy Gas
For high energy gas (70%-95%), we may use flash distillation if the purity is below 89% CH4 in the
overhead and column distillation if above 89%. To find the most cost efficient method, three gases
were produced each with a different %CH4 and a liquid of 99% CO2. The column was run at 334.7 psia
again. Table 7 shows the costs and profits in $/year.
Table 7
Purity Condenser Temp(F)
Refrigeration Cost
Plate Cost CH4 Fuel profit
CO2 Profit Net Profit
70.1 -63.79 4,197,660 420,000 2,690,942 15,459,336 13,532,618
82.5 -87.23 5,637,600 420,000 2,685,046 15,953,430 12,580,876
94.5 -126.6 7,266,000 840,000 2,695,428 16,294,184 10,883,612
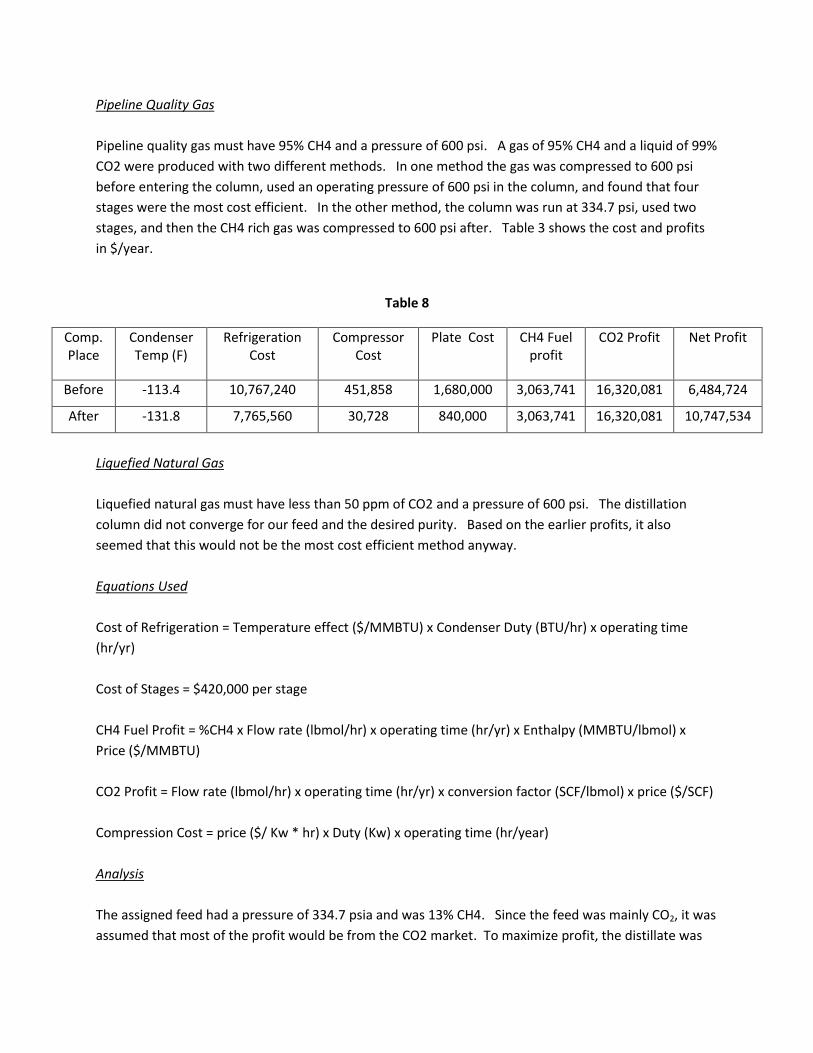
Pipeline Quality Gas
Pipeline quality gas must have 95% CH4 and a pressure of 600 psi. A gas of 95% CH4 and a liquid of 99%
CO2 were produced with two different methods. In one method the gas was compressed to 600 psi
before entering the column, used an operating pressure of 600 psi in the column, and found that four
stages were the most cost efficient. In the other method, the column was run at 334.7 psi, used two
stages, and then the CH4 rich gas was compressed to 600 psi after. Table 3 shows the cost and profits
in $/year.
Table 8
Comp. Place
Condenser Temp (F)
Refrigeration Cost
Compressor Cost
Plate Cost CH4 Fuel profit
CO2 Profit Net Profit
Before -113.4 10,767,240 451,858 1,680,000 3,063,741 16,320,081 6,484,724
After -131.8 7,765,560 30,728 840,000 3,063,741 16,320,081 10,747,534
Liquefied Natural Gas
Liquefied natural gas must have less than 50 ppm of CO2 and a pressure of 600 psi. The distillation
column did not converge for our feed and the desired purity. Based on the earlier profits, it also
seemed that this would not be the most cost efficient method anyway.
Equations Used
Cost of Refrigeration = Temperature effect ($/MMBTU) x Condenser Duty (BTU/hr) x operating time
(hr/yr)
Cost of Stages = $420,000 per stage
CH4 Fuel Profit = %CH4 x Flow rate (lbmol/hr) x operating time (hr/yr) x Enthalpy (MMBTU/lbmol) x
Price ($/MMBTU)
CO2 Profit = Flow rate (lbmol/hr) x operating time (hr/yr) x conversion factor (SCF/lbmol) x price ($/SCF)
Compression Cost = price ($/ Kw * hr) x Duty (Kw) x operating time (hr/year)
Analysis
The assigned feed had a pressure of 334.7 psia and was 13% CH4. Since the feed was mainly CO2, it was
assumed that most of the profit would be from the CO2 market. To maximize profit, the distillate was

always set to exit with 99% CO2. As seen in the results, the most profitable output stream was the CO2.
Similarly, because the process is cryogenic distillation the refrigeration was always the highest cost.
When using flash distillation, only one stage was used and the column was run at 334.7 psi. To keep
costs low, the gas was not compressed or expanded before entering the column. When running the
column at higher pressures the refrigeration costs were lower but so were the profits making it
undesirable. When more than 1 stage was needed to produce the desired product, the number of
stages used altered the refrigeration costs. The correct number of stages to use was decided by
comparing the change in refrigeration costs to the cost of adding more stages. When run at higher
pressures, more stages were needed so the pressure was kept low.
In pipeline quality gas there is a specification of 600 psi. After testing both, compressing the gas before
and after the distillation, it is most cost efficient to compress the gas after passing through the column.
This way the refrigeration and compression cost are kept as low as possible.
Overall, the most cost efficient method for the feed of 13% CH4 is to produce a high quality gas of
approximately 70.1% CH4. The net profit for this method is $13,532,618 per year.
Appendix CH4 enthalpy - 891 KJ per mol (1) Conversion factors: 453.59327 mol per lbmol (1) 1 BTU per 1.054 KJ 1 MMBTU per 10^6 BTU 1 SCF per 0.0026412 lbmol (2) References 1. Aspen HYSYS 2. http://en.wikipedia.org/wiki/Standard_cubic_foot
Final Recommendations After taking into consideration the financial and pragmatic factors for each method, it was determined
that the cryogenic distillation would be the best system moving forward. It makes about the same
amount of money as gas separation membrane, but takes up much less space. Although this analysis is
not exhaustive, the profit made by the distillation column so far outweighs the profit from the
absorption columns that it is safe to say this is the desired purification method.
There are other minor costs and considerations that should be made that are not detailed in the
problem statement. For instance, the real estate costs, labor costs, packaging costs, insurance costs,
transportation costs, facility upkeep, and general taxes could be taken into account to get more realistic
numbers. The impact of all these assumptions is unknown at this present time. Pumping costs were

almost uniformly neglected in the analysis for this project. The HYSIS calculation used in distillation
likely takes these costs into account, but their impact is minimal. These costs would be very similar to
identical for each calculation so their absence doesn’t affect the relative profitability of the four
processes.
In order to obtain a better financial estimate, these assumptions needed to be accounted for. In order
to calculate the real estate costs, a prime location would need to be found based on a few factors. It
would be best to build the column in a place that is close to both the company that is supplying the raw
gas and the companies that are buying the products. Also, a location with low property value and taxes
would be ideal. Once this location is found, the costs for property, taxes, and transportation could be
found and calculated. A packaging method would need to be researched that minimizes costs while still
transporting the products effectively. In addition, research would need to be made in order to estimate
how much labor for operation and upkeep would be needed for a system similar to the size of our
column.