natural gas infrastructure and domestic tight oil development
TRANSCRIPT
1
Follow the Money: Natural Gas Infrastructure and
Domestic Tight Oil Development
Donald Santa
President & CEO
Interstate Natural Gas Association of America

2
Spotting the Trends
INGAA Foundation projection
of North American natural gas
infrastructure requirements is
regularly updated
In 2011, for the first time,
projection included crude oil
and NGL infrastructure
Recognized that shift to “wet”
gas plays and resurgence of
domestic oil affected natural
gas infrastructure development

3
Infrastructure Capital Requirements
Oil Pipeline Infrastructure 2011-20 2011-35 Average
Annual
Miles of Transmission Mainline (1000s) 13.0 19.3 0.8
Cost of Transmission Mainline (Billions 2010$) $19.6 $31.4 $1.3
NGL Pipeline Infrastructure 2011-20 2011-35 Average
Annual
Miles of Transmission Mainline (1000s) 10.6 12.5 0.5
Cost of Transmission Mainline (Billions 2010$) $12.3 $14.5 $0.6
Source: North American Natural Gas Midstream
Infrastructure Through 2035 – A Secure Energy Future
Natural Gas Infrastructure 2011-20 2010-35 Average
Annual
Miles of Transmission Mainline (1000s) 16.4 35.6 1.4
Cost of Transmission Mainline (Billions 2010$) $46.2 $97.7 $3.9

4
Jobs & Economic Benefits of Midstream Infrastructure
Development: US Economic Impacts through 2035
Highlights economic benefits
of constructing, operating and
maintaining the midstream
infrastructure
jobs
labor income,
value added,
economic output
federal, state and local tax
generation

5
Midstream Investment Spurs Economic Growth,
Jobs
Billions of 2011 dollars, employment in average annual jobs supported
NATURAL GAS INVESTMENT PLUS O&M IMPACTS
OIL INVESTMENT PLUS O&M IMPACTS
NATURAL GAS LIQUIDS (NGL) INVESTMENT PLUS O&M IMPACTS TOTAL
Investment, $ Billions
(Lower 48)
$190.3 Investment
$ Billions
(Lower 48)
$22.7 Investment
$ Billions
(Lower 48)
$16.1 $229.1
Results Results Results Results
Avg. Annual Employment
103,029 Avg. Annual Employment
12,659 Avg. Annual Employment
9,651 125,339
Income $140.6 Income $17.3 Income $13.2 $171.1
Value Added $214.3 Value Added $26.3 Value Added $20.1 $260.7
Output $420.4 Output $51.7 Output $39.4 $511.5
State and Local Taxes
$16.5 State and Local Taxes
$2.0 State and Local Taxes
$1.6 $20.1
Federal Taxes
$30.3 Federal Taxes
$3.7 Federal Taxes $2.8 $36.8
Source: Jobs & Economic Benefits of Midstream Infrastructure
Development: US Economic Impacts through 2035

6
Commodity Pricing Relationships
0
5
10
15
20
25
30
35
40
0
100
200
300
400
500
600
700
800
Jan
-96
Feb
-97
Mar
-98
Ap
r-9
9
May
-00
Jun
-01
Jul-
02
Au
g-0
3
Sep
-04
Oct
-05
No
v-0
6
Dec
-07
Jan
-09
Feb
-10
Mar
-11
Oil-
Gas
Pri
ce R
aio
Pri
ce In
dex
*
Historical Oil-Gas Price Relationship
Gas 1-Month NYMEX
Crude 1-Month NYMEX
OGPR
*Oil & Gas prices indexed to 100 in Jan-96
Source: Alliance Pipeline

7
Follow the Money to the “Wet” Plays
“Wet Gas” wells carry
market price advantages
over other shale basins
The higher the liquid
content, the cheaper the
break-even price
Source: Black & Veatch

8
Percentage of Gas Flared in North Dakota

9
Why Does Infrastructure Lag Behind Drilling?
Widely scattered wells
Large area
Drilling to hold leases
Weather challenges
Difficulties in obtaining rights-of-way
Existing facilities designed for smaller volume wells
Time needed to design, permit and construct new facilities
Manpower, equipment and housing shortages
Each situation is unique and affects processing economics
Source: Oneok Partners
10
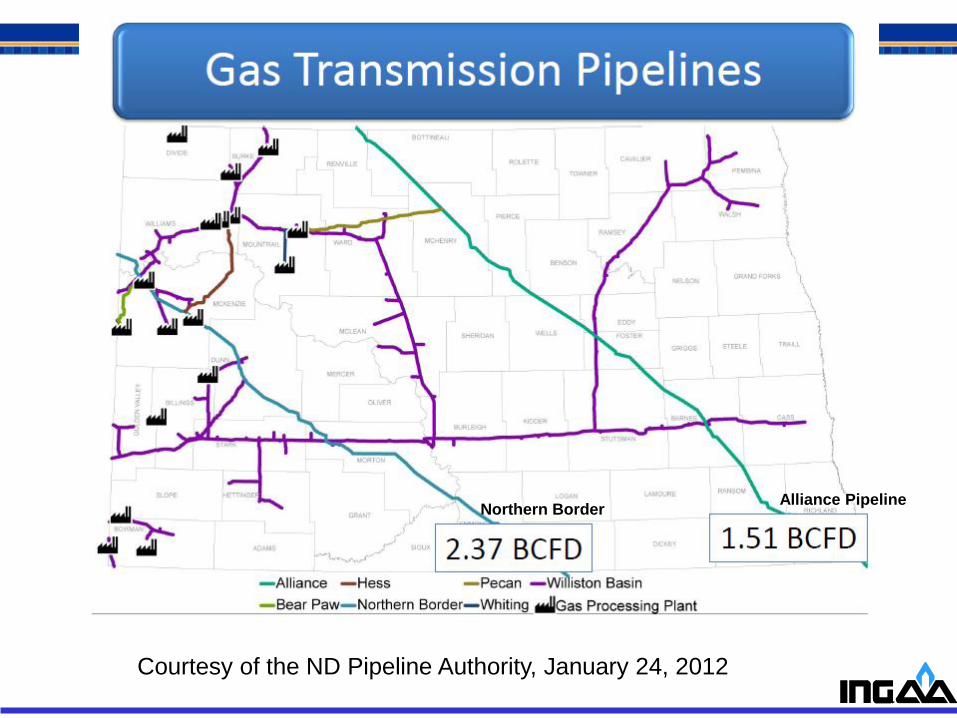
Courtesy of the ND Pipeline Authority, January 24, 2012
Northern Border Alliance Pipeline

11
Producers vs. Gatherers/Processors:
Investment Considerations With Shale Plays
Producers
Nimble: Drilling rigs can be
re-deployed quickly
High initial volumes enable
investment to be recouped
quickly
Gathers & Processors
Fixed: Infrastructure is
immobile once investment
has been made
Absent continued drilling,
steep decline curves mean
that peak flow may occur in
year one

12
Transmission Pipeline Investment Considerations
Supply Push Pipelines
Producer shippers want to
limit contract duration to
minimize balance sheet
obligation
Re-contracting risk because
producer focus may shift to
other prospects
Greater credit risk – producer
credit quality typically lower
than LDCs and electric
utilities
Demand Pull Pipelines
LDCs and electric utilities are
likely to enter longer contracts
The market is much more
predictable and not nearly as
susceptible to shift as
production
Less credit risk – LDCs and
electric utilities typically have
high credit ratings

13
Follow the Money:
Natural Gas Infrastructure and Tight Oil Development
Commodity pricing relationship drives investment
Infrastructure lag caused by multiple factors
Investment Considerations
Producers vs. Gathers & Processors
Supply Push vs. Demand Pull Pipelines
All shale plays are not created equal

14
Donald Santa
President & CEO
Interstate Natural Gas Association of America
202.216.5901
http://www.ingaa.org