natural gas imports by south asia: pipelines or pipedreams
TRANSCRIPT

A version of this appeared in Economic & Political Weekly (1999) XXXIV(18)
Natural Gas Imports by South Asia: Pipelines or Pipedreams?TransAsia Pipeline System (TAPS): A Shared Natural Gas Pipeline
for India and Pakistan from West and Central Asia
Rahul Tongia and V. S. ArunachalamDept. of Engineering & Public Policy
Carnegie Mellon UniversityPittsburgh, PA 15213 USA
Tel: (412) 268 2670Fax: (412) 268 3757
Email: [email protected]; [email protected]
September 20, 1998
Abstract: There must be few other situations where there are eager purchasers of naturalgas (India and Pakistan), willing suppliers of natural gas (Turkmenistan, Iran, Qatar andOman), and yet, no pipeline. The distances involved are modest, and techno-economicviability appears straightforward. This paper examines in detail the policy, technology,and economics of an overland pipeline supplying natural gas to Pakistan and India. Sucha pipeline would be shared by both countries, and would represent a unique opportunityfor cooperation.† As pipelines exhibit significant economies of scale, a shared pipelinewould offer the lowest price natural gas for both countries. Pakistani consumers wouldobtain cheaper gas than from a lower capacity pipeline for their exclusive use, alsobenefiting from transit fees paid by Indian consumers. An alternative to land-basedpipelines through Pakistan for India would be liquefied natural gas, which is moreexpensive due to the capital-intensive nature of the liquefaction process. However, anyoverland gas pipeline does not depend solely on economic viability, but on politicalacceptance as well. This study addresses some of the potential concerns, brieflydiscussing options for overcoming security of supply worries. Through cooperating onsuch a venture, one that offers the promise of significantly helping to build theinfrastructure of both countries, there is the possibility of the neighboring countriesbecoming partners in progress, instead of languishing as prisoners of geography.
Keywords: Natural gas, pipelines, India, Pakistan, confidence building measure
† This analysis was largely performed before the nuclear tests conducted by India and Pakistan. Whilethese might create short-term barriers to communication and cooperation, they do not detract from eitherthe attractive benefits of such a pipeline, nor from the need for discussion about this or other forms ofcooperation. In fact, with economic sanctions coming into force, it might induce both countries to look fornew methods of saving on infrastructure expenditure and foreign exchange. A pipeline project would notonly be all that, but it will also be a meaningful, long-term avenue for cooperation.
2
Introduction
If the 20th century has been described as the century of oil, the coming century is
being heralded as the era of natural gas. Within ten years, the share of natural gas in
world primary energy supply is expected to overtake even that of coal, with an annual
growth in consumption estimated at 3.2%, compared to about 2% for oil and for coal.
This growth is most dramatic in the power sector, where, due to improvements in
combined cycle power plant technologies, natural gas has emerged as the fuel of choice
for generation of electricity. The largest share of growth of primary energy used for
power production during the period 1995-2020 will be from natural gas (EIA, 1998).
While the use of coal for power production is also expected to grow during this period,
by 71%, natural gas usage in this sector is expected to jump by 168%.
The benefits of natural gas based power production are many, including the
lowest price electricity, reduced environmental impact (locally as well as globally), and
amenability to rapid construction. In addition to technological improvements, the
increased use of natural gas is explained by shifts in policy regarding its use for power
production. An example is the UK, which, in this decade, will increase its share of
natural gas from virtually zero to over one third of the electricity generated.
India and Pakistan both look to natural gas as an attractive fuel, not only for
power production but also for other applications. Because of modest domestic reserves,
both countries are examining various options to import natural gas either through
pipelines or by tankers as liquefied natural gas. This study examines the feasibility of a
shared pipeline for India and Pakistan, supplying gas from countries in West and Central
Asia. This is not the first study to suggest natural gas imports for Pakistan and India,

3
though not necessarily through a pipeline shared between the two countries (Kubota,
1996; Siddiqui and Tahir-Kheli, 1996; Raza, 1998). To be viable, such a pipeline would
need to demonstrate not only techno-economic feasibility, but also political acceptance in
both countries.
This paper is divided into three main sections. In the first section, we summarize
the power and natural gas sectors in both countries and also review the uses of natural gas
and technologies for its transportation. In the second section, we discuss the proposed
pipeline system, including the factors involved in the choice of supplier nations and on
the routing of the pipeline. We also analyze the viability of such a pipeline using
applicable criteria. The last section examines the policy and decision framework needed
for such a pipeline. This paper concludes with a brief discussion of concerns that both
countries may have, and possible avenues for overcoming the apprehensions that might
hinder what is otherwise an economically attractive venture.
Infrastructure in India and Pakistan
Electricity
While there are significant differences in the two countries’ electricity profiles,
most notably in choice of fuels, an analysis of their energy and power scenarios reveals a
greater similarity than chance would explain. In terms of electricity generation
capacities, Pakistan has an installed capacity of 14,689 MW (HDIP, 1998), and India has
an installed capacity of 84,965 MW (CEA, 1997), excluding their captive power plants.
Table 1 shows the capacity and power generation in both countries by fuel type. These
figures lead to an annual per capita generation in Pakistan and India of around 450 kWh
and 420 kWh, respectively. It is important to note that these numbers are for gross

4
generation only; the consumption is likely to be lower by about 25% due to in-plant
consumption and high transmission and distribution (T&D) losses. These numbers
compare unfavorably with the 1995 world average net generation of over 2,200
kWh/year.
Table 1 Gross Electr icity Generation Capacity and Generation 1996–97Pakistan India
Capacity Generation Capacitya Generation b
MW(%)
(%) MW(%)
(%)
Hydropower 4,826(32.5)
35.3 21,618(25.4)
18.7
Natural Gas 4,015 c
(27.3)27.1 6,698
(7.9)Coal 150
(1.0)0.6 53,643d
(63.1)Oil/Diesel 5,561 c
(37.9)36.4 266
(0.3)
79.2for all
thermale
Nuclear 137(0.9)
0.6 1,840(2.2)
2.1
Wind 900(1.1)
(included inthermal)
Total: 14,869(100.0)
100.0 84,965(100.0)
100.0
1996-1997 Generation(billion kWh)
59.1 394.5f
Sources: Pakistan Energy Yearbook 1997; CEA Annual Report 1996-97; Ministry of Power AnnualReport 1996-97; Economic Survey 1997-98, Govt. of India
a As of March 31, 1997 (provisional); this capacity is the working (derated) capacity.b March 31, 1996 through December 31, 1996 (provisional).c Our estimate for breakdown between natural gas and fuel oil/high-speed diesel based power. Many
plants have dual (or multi) fuel provision, and fuel used depends on supply.d This total is technically listed as steam-based, but separate categories are given for gas and diesel,
implying this is largely coal-fired. However, a small amount of oil-based power might be included.e The generation is given as “ thermal”, including coal, gas, oil, and wind. Estimates of the respective
contribution can be made from their share of total capacity. However, generation by coal is higher than
its capacity would indicate, due to its higher load factors. We estimate it’s contribution overall at over70% of the total generation.f Provisional

5
The very high T&D losses actually incorporate widespread pilferage, which is
rampant not only in rural areas but in some big cities as well. The utilization pattern is
also similar: unlike in more economically developed countries, agriculture has grown to
be a major consumer of electricity, with a consumption of 16.6% in Pakistan (1996-97)
and 30.6% in India (1994-95), and the share consumed by industry is steadily declining.
Rural electrification, seen as a symbol of empowerment, has been a priority in both
countries, more so in India, though scarcity conditions still prevail. The power sector is
regulated, and the prices charged to consumers are often below supply costs. This is
especially the case for agricultural and domestic consumers, whose electricity is cross-
subsidized, at least partially, by industrial and commercial users, paying more than the
average cost.
Natural Gas
Natural gas does not substantially contribute to India’s generation of electricity.
This is because of an earlier government policy of prioritizing use of its modest reserves
for producing fertilizers and petrochemicals. Proven Indian reserves are not large, about
490 billion cubic meters (BCM), which constitutes about 0.3% of the world's reserves
(BP, 1998).1 Table 2 shows the consumption patterns for natural gas in India and
Pakistan. It is estimated that by 2000, the potential Indian demand for natural gas would
be about 80 BCM/year (Ministry of Petroleum and Natural Gas, 1995). Domestic
production is unlikely to be above 25 BCM, leaving a large volume for imports or to be
substituted by other (less preferred) fuels.
1 This number is markedly lower than the reserves listed at the end of 1996: 690 BCM. It is unclear whathas led to this downward revision in estimates.

6
Table 2 Consumption of Natural Gas by SectorPakistan India
1996-97 (%) 1993 (%)Power Production 32.5 31Fertilizer 25.5 41Domestic 19.3General Industry/Commercial 21.5Other 1.5 a
combined 28% b
Total: 100.0 100
Production 1996-97 (BCM) 19.8 22.7 c
Sources: Pakistan Energy Yearbook 1997; Min. of Petroleum and Natural Gas Annual Report 1996-97,Govt. of India� ����� ��� ��� ��� ��� � � � ��� � ��� ��� ������� �� �� �� ����� ������ � � ���� ����� ��� ��� ��� � � �"! �$#� � � � � �� ��� � ! % ��� � � � & ' ��� �� � � � �$� � ��� ��(#�� � � �)� �$ * #� � � �)� �+�� �,� � ��� ��! �c Annual production is extrapolated from the April-December 1996 production.
The use of natural gas in Pakistan is older and more widespread than in India.
Beginning with the Sui gas fields in the early 1950s, Pakistan has developed a
widespread transmission and distribution network. Estimates for proven reserves vary,
but Govt. of Pakistan documents show about 507 BCM of gas (HDIP, 1998).
International estimates are a little higher, at 590 BCM (BP, 1998). In addition to use in
power plants and industry, natural gas is also used for domestic consumption (Table 2).
Pakistan seeks to increase the use of natural gas, especially for power production. There
have been many estimates of future demand, and all show strong growth rates. Reports
for (potential) demand by 2002 are about 33 BCM/year for Pakistan (Wajahatullah,
1997), though domestic production is not expected to rise dramatically above the current
levels.
The official government figure for Pakistan leads to a reserves to production ratio
(R/P) of 25.6 years, and the reserves estimate for India leads to a R/P of 21.6 years.
While these appear low, they are about double the North American R/P of 11.5 years

7
(BP, 1998). However, the Indian and Pakistani ratios are based on the current low
production and consumption levels. To increase the use of gas, both nations have
expressed a strong and immediate intent to import natural gas (Nawaz Sharif, 1998;
Chaudhary Nisar Ali Khan, 1998; Murasoli Maran, 1996).
Electricity Growth and Natural Gas
The 1996-97 shortage of electric power in India was officially stated to be at
11.5% average and 18% peak (Ministry of Power, 1997b). Unofficial estimates are
higher, almost 15% and 30%, respectively (Businessline, 1996). This gap between
supply and demand is expected to worsen, with addition of capacity falling far short of
even the modest downward-revised targets.2
One of the methods for improving the supply of electricity has been to open the
generation sector to independent power producers (IPPs). While this was started in 1991
with India’s liberalization of the power and other sectors, the actual contribution from
IPPs has been low. This is blamed on two main reasons: the poor financial health of the
State Electricity Boards (SEBs, the state utilities), as well as bureaucratic and regulatory
hurdles.
Pakistan also looked to IPPs to improve its power supply position. Anticipating
high returns, this sector became the target of the bulk of foreign investment in Pakistan.
The growth of IPPs has been strong, with 2,884 MW of IPP capacity, generating 30% of
the thermal-based electricity produced in 1996-97 (HDIP, 1998). Another 3,000 MW are
expected to come online in the next few years (Aijazuddin, 1998). Critics of IPPs feel the
2 During the VIII Plan (1992-97), the anticipated need for increase in capacity was 48,000 MW, excludingcaptive power. The resource-based Plan target was 30, 538 MW, but the actual increase reported by CEA(1997) was only 16,422.47 MW.

8
growth rates for such power plants are too high, driven by foreign investors’ appetite for
very high returns, leading to production of more power than can be consumed profitably.
There are also reports of bad planning and corrupt practices. Given the sluggish growth
of Pakistan's economy in the past few years, it is expected that, in the near term, Pakistan
will have a surplus of electricity.3
The bulk of these projects in Pakistan are based on fuel oil, which is easy to
import and the plants for which can be constructed relatively quickly. However,
electricity from fuel oil is not as competitive as that from other fuels such as natural gas,
especially when viewed in terms of fuel (i.e., marginal) costs. Even with the recent
decrease in oil prices there has not been a decrease in electricity tariffs.4 One suggestion
has been to substitute natural gas for the more expensive fuel oil, which would result in
significant foreign exchange savings.
Natural Gas: Use and Transport
Natural gas has emerged as the fuel of choice for various uses. It is most
extensively used by domestic consumers for cooking and heating, petrochemical and
fertilizer industries as both fuel and feedstock, and by power producers for generating
electricity. While there are substitutes for natural gas in industry (e.g., naphtha for
fertilizer plants), current prices make natural gas more competitive.
3 Due to the likely surplus of power in Pakistan, coupled with the liquidity and foreign-exchange crises,there were moves towards exporting power to India. However, these were put off due to politicaldifferences. In addition, we expect any surplus capacity is likely to become a shortfall over time.4 IPPs in Pakistan are bound to buy fuel oil from Pakistan State Oil (PSO). PSO is not passing on thereductions in fuel prices to the IPPs; it is thought that the "savings" from cheaper oil are used to help thegovernment’s balance sheet instead. Recently, the Pakistani government took strong actions against manyIPPs, accusing them of corruption (which could be a valid excuse for canceling the contracts) (Saleem,1998). While some IPPs have "voluntarily" offered to reduce electricity prices, they cite the high oil pricesthey face as a barrier to lowering the tariffs (Ahmed, 1998).

9
Worldwide trade in natural gas is also growing rapidly, and its reserves are more
distributed throughout the world than those of oil. The proven reserves have more than
doubled in the last 20 years, increasing the world R/P to 64.1 years in 1997 (BP, 1998).
Power Plants
A large proportion of upcoming IPP projects in India are expected to be based on
natural gas (or an equivalent fuel capable of firing a gas turbine), far more than the
availability of natural gas would suggest. In part, this can be explained by the higher
returns investors see for gas-based projects, and is an artifact of the regulatory
environment (Tongia and Banerjee, 1998).
The main reason for worldwide growth of natural gas for power production is the
improvement in the combined cycle gas turbine (CCGT). The efficiency of combined
cycle plants is approaching 60%5, which is the highest for thermal generation. The
capital costs have fallen during the 90s to about $425/kW for overnight construction
costs, which is about half that of coal-based power plants. The two-year construction
time is also very rapid, twice as quick as for coal plants. This is all the more relevant
when considering the high cost of capital (high interest rates) in developing countries. A
reduced construction period would thus help to lower interest during construction. In
addition, such plants are suitable for peak as well as base-load power, and offer great
flexibility for use in an unstable grid. Another major benefit to use of natural gas is
environmental. Natural gas is seen as a clean fuel, with almost no particulate emissions,
5 This is the net efficiency, based on higher heating value. This is important as in South Asia, many quotesare for gross output, which can be a few percent higher (more so for coal-based power). The net output(and efficiency) is lower because of the in-plant or so-called auxiliary consumption.
10
reduced sulfur and NOx emissions, as well as some 40-50% reduction in carbon
emissions compared to coal (United Nations, 1997).
The primary benefit of such plants is the low cost of electricity. In the US, the
cost of power from a new CCGT plant is estimated to be below 4 cents per kWh (about
1.6 Rs./kWh). US estimates place the share of electricity costs due to fuel at about 65%
(EIA, 1997a). This should be weighed by the low price US power producers pay for
natural gas, in the neighborhood of $2.5/MMBtu.
Alternatives to natural gas such as oil are more expensive. A barrel of crude oil
has an energy content of about 5.8 MMBtu. At the rate of $15/barrel, that works out to
about $2.6/MMBtu. Preferred fuels for use in combined cycle plants, light and medium
distillates, are more expensive than this and their prices are often more volatile than that
of natural gas. Other oil-based fuels are often used in steam-cycle or diesel plants, which
have much lower efficiencies.
Transportation Technology
There are some difficulties in the use of natural gas. The first is of availability:
73% of the world’s known reserves are in West Asia and Former Soviet Union states
(BP, 1998). In addition to this, its low energy density (especially vis-à-vis oil) makes it
difficult to store and transport. While oil can easily be shipped by tankers, gas must
typically be transported through pipelines, which are capital-intensive.
Pipeline technology is well established and relatively mature. For long-distance
transmission, natural gas is transported through high-pressure (900+ p.s.i.) pipelines with
diameters typically in the 3-4 foot range. A transmission system consists of not only pipe
to transport the gas but also of compressor stations—to repressurize the gas which loses

11
pressure due to friction—at regular intervals. A small fraction of the transported gas is
consumed by the gas-driven compressors, though it is possible to use electric
compressors instead. The most notable improvements in technology have been for
superior materials and advanced welding techniques that have made pipelines thinner-
walled, safer, and less expensive than before.
The other method of transport, as liquefied natural gas (LNG), is even more
capital intensive. This is because natural gas liquefies only at very low temperatures,
below -160 degrees Celsius. For a 6 million tons/year system (about 8 BCM/year
regasified), liquefaction plants, LNG tankers, receiving and storage terminals, and
regasification facilities can typically cost over four billion dollars.6 Because of this, for
relatively short distances—under about 2,000 miles—pipelines are less expensive than
LNG.
Strong economies of scale exist for natural gas pipelines, more so than for LNG
facilities. The volumes economically transported by a pipeline strongly depend on the
pipeline diameter. Due to the non-linear effects of friction and pressure losses, doubling
the diameter of a pipe allows for about six times the gas flow.7 Typical transmission
6 Based on typical ranges for component costs (EIA, 1997b), we estimate an LNG chain of above size andmoderate transit distance costs between 3.5 and 7.2 billion dollars.7 Many modern formulae are variants of the Weymouth formula:
L
ppdQ
22
213/8926.36
−= ; where
Q = cubic feet of gas per hour, standard gas pressure, temperature, and specific gravityd = internal diameter of pipeline, inchesL = length of pipe, milesp1 = inlet pressure, pounds per square inch absolutep2 = outlet pressure, pounds per square inch absolute
More practicable formulae for modern transmission systems include the modified panhandle formula,which is what is used in this analysis (see Appendix for more details).
12
pipelines operate most economically at volumes of about 20 BCM/year, or greater at
higher pressures.
Pakistan has been negotiating with a number of its neighbors for gas pipelines
(see section on Pipeline Routes). However, all these projects appear to have stalled.
India had negotiated with Oman for a deep-sea pipeline for natural gas to western India.
However, the daunting technical difficulties (being the deepest pipeline proposed ever)
with consequent economic uncertainties made the project nonviable.8 There were also
reports of pipelines coming from West Asia (such as from Iran), but these projects have
not taken off due to difficulties on routing. India prefers a pipeline that would travel
along the coast of Pakistan, instead of on-land. Pakistan has reportedly opposed such
routes in favor of land-based options. In light of the poor prospects for gas from the
west, India is resigned to consider LNG, despite its higher costs. These higher costs are
justified because there are no alternatives on the horizon. In this paper, we suggest that a
shared land-based pipeline for Indian consumers through Pakistan would be preferable
for both countries.9 This analysis hopes to provide information and numbers on the
benefits of a shared pipeline, which were treated in abstract terms until now.
Proposed Pipeline System: TransAsia Pipeline System (TAPS)
This study examines a natural gas pipeline (TransAsia Pipeline System, or TAPS)
as a system for delivery of natural gas to both Pakistan and India. Any one of the gas-
8 This deep-sea pipeline would be several kilometers deep in some places. In comparison, thetransmediterranean (Transmed) pipeline to Italy is only 600 meters at its deepest.9 There are reports of potential imports from gas fields in Bangladesh, as well as further east (Myanmar).However, Bangladesh’s proven reserves are relatively modest, and such pipelines would only supply gas tothe eastern portion of India. Without waiting for these developments, a number of companies areestablishing LNG terminals along the coasts of India as a quicker method of obtaining natural gas. Forexample, Enron intends to use LNG for the second phase of its Dabhol power project. Such LNG terminals

13
rich nations of West or Central Asia can be the supplier. In this analysis, we choose four
of the more promising supplier nations: Turkmenistan, Iran, Qatar, and Oman. Figure 1
shows a map of possible routes through TAPS. We have assumed land-based pipelines to
the extent possible. TAPS is expected to either begin in or traverse Iran, and then pass
through the southern part of Pakistan, before terminating in India.
Figure 1 Pipeline Routes
Indore
- onwards to India
TAPS
TAPS(across water)
CENTGAS
- to Pakistan
Indore
Baroda333333333
KarachiGwadar
222222222
444444444
Gas supplyConsumptioncenter
New Delhi
Multan
1 Turkmenistan 2 Iran 3 Oman 4 Qatar1 Turkmenistan 2 Iran 3 Oman 4 Qatar1 Turkmenistan 2 Iran 3 Oman 4 Qatar1 Turkmenistan 2 Iran 3 Oman 4 Qatar1 Turkmenistan 2 Iran 3 Oman 4 Qatar1 Turkmenistan 2 Iran 3 Oman 4 Qatar1 Turkmenistan 2 Iran 3 Oman 4 Qatar1 Turkmenistan 2 Iran 3 Oman 4 Qatar1 Turkmenistan 2 Iran 3 Oman 4 Qatar
111111111
Pakistan
Afghanistan
Iran
Turkmenistan
QatarIndia
Oman
The consumption points shown in both nations are for indicative purposes only. Actual consumption need
not be clustered, and imported gas can also join an existing transmission/distribution network.
We have modeled the flow of various volumes of natural gas parametrically,
based on standard pipeline technology. The pipeline diameter is 48 inches, a standard
size, and we assume the capacity factor for the pipeline to be 90% on average, varying
between 80% and 100%. Table 3 shows major system parameters used in the studies,
and the Appendix shows more detailed model assumptions. We calculate the total
would not necessarily compete with piped gas for customers. Even to the extent any LNG terminals serve
14
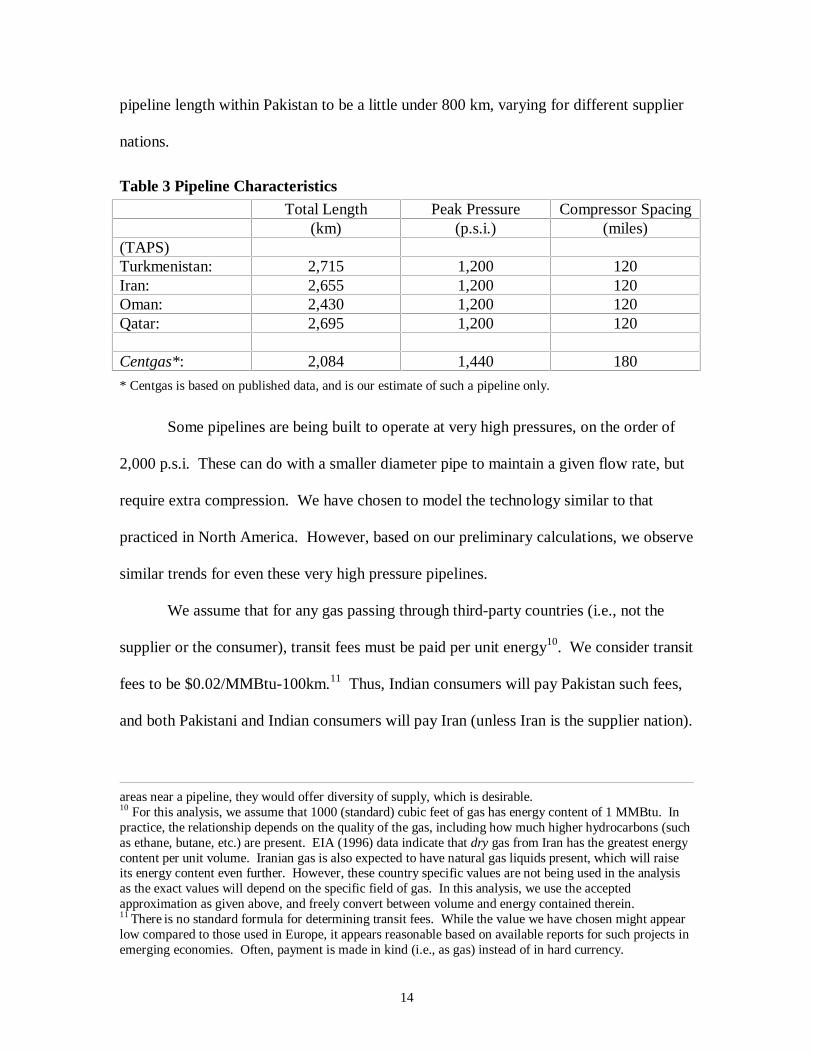
pipeline length within Pakistan to be a little under 800 km, varying for different supplier
nations.
Table 3 Pipeline CharacteristicsTotal Length Peak Pressure Compressor Spacing
(km) (p.s.i.) (miles)(TAPS)Turkmenistan: 2,715 1,200 120Iran: 2,655 1,200 120Oman: 2,430 1,200 120Qatar: 2,695 1,200 120
Centgas*: 2,084 1,440 180
* Centgas is based on published data, and is our estimate of such a pipeline only.
Some pipelines are being built to operate at very high pressures, on the order of
2,000 p.s.i. These can do with a smaller diameter pipe to maintain a given flow rate, but
require extra compression. We have chosen to model the technology similar to that
practiced in North America. However, based on our preliminary calculations, we observe
similar trends for even these very high pressure pipelines.
We assume that for any gas passing through third-party countries (i.e., not the
supplier or the consumer), transit fees must be paid per unit energy10. We consider transit
fees to be $0.02/MMBtu-100km.11 Thus, Indian consumers will pay Pakistan such fees,
and both Pakistani and Indian consumers will pay Iran (unless Iran is the supplier nation).
areas near a pipeline, they would offer diversity of supply, which is desirable.10 For this analysis, we assume that 1000 (standard) cubic feet of gas has energy content of 1 MMBtu. Inpractice, the relationship depends on the quality of the gas, including how much higher hydrocarbons (suchas ethane, butane, etc.) are present. EIA (1996) data indicate that dry gas from Iran has the greatest energycontent per unit volume. Iranian gas is also expected to have natural gas liquids present, which will raiseits energy content even further. However, these country specific values are not being used in the analysisas the exact values will depend on the specific field of gas. In this analysis, we use the acceptedapproximation as given above, and freely convert between volume and energy contained therein.11 There is no standard formula for determining transit fees. While the value we have chosen might appearlow compared to those used in Europe, it appears reasonable based on available reports for such projects inemerging economies. Often, payment is made in kind (i.e., as gas) instead of in hard currency.

15
The costs shown in the following sections are meant to be representative of
realistic values and their main utility is to show robust trends from our analysis. The
exact prices will vary slightly based on negotiation, financing, technology, routing, etc.
The Supplier Nations
Turkmenistan: Turkmenistan’s reserves are estimated at 98-155 trillion cubic feet (Tcf =
28.3 BCM); unofficial estimates place the value five times higher. The official estimates
imply a R/P ratio of 82-129 years.
Turkmenistan has traditionally relied on natural gas for a significant portion of its export
earnings. Since the break-up of the Soviet Union, Turkmenistan has seen its production
fall from a 1989 peak of 89.9 BCM/year to about 32.3 in 1995 (International Energy
Agency, 1995; EIA-CABS, September 1997). It is estimated that Turkmenistan has an
existing production capacity of 75 BCM/year of gas, 75% of which is available for export
(EIA-CABS, September 1997).
Turkmenistan is especially interested in new export routes, as it is owed over a billion
dollars by Former Soviet Union states for gas it exported (Weltsch, 1996). Because of
this, it was ready to be a partner to a project led by the American company Unocal, under
the Centgas consortium. Centgas has plans to build a pipeline from Turkmenistan to
Multan in Pakistan (and perhaps onwards to Delhi), traversing Afghanistan. While
considerable progress was made in technical planning, there are serious doubts as to the
short-term prospects due to the continuing civil unrest in Afghanistan.12 Based on
12 Based on details of the Centgas negotiations that have been released, the delivered price in Multan issupposed to be between $1.65-2.05/MMBtu, indexed to oil prices (Rashid, 1998). This is a favorable pricefor the consumers, but it appears to be low for the suppliers and transporters. Such prices appear morereasonable for higher flow volumes than currently negotiated by Pakistan. In addition, Unocal, the leader

16
available data, we have attempted to model the Centgas line as well, to show the
prospects for such a pipeline if it were to be shared by Pakistan and India. Our
calculations for the Centgas line are meant to be representative of trends only, and do not
necessarily reflect prevailing prices elsewhere or estimates made by other analyses.
The only routes for Turkmen gas to Pakistan would be through Afghanistan (e.g., the
Centgas line), or through Iran (e.g., TAPS).
Iran: Iran has the second largest reserves in the world, after Russia, and these reserves
are estimated at 810 Tcf (EIA-CABS, March 1998). In 1996, the production was 2.6 Tcf,
implying a R/P ratio of over 300 years. However, the gas industry is underdeveloped;
much of the gas is being used for reinjection into oil fields (38% in 1996) and some is
being flared (almost 12% in 1996).
Due to depressed oil prices, and in hopes of earning from more exports, Iran plans to
increase its gas output significantly. However, there is considerable American resistance
to any foreign investment in Iran’s oil and gas sectors. This was formulated into a strict
policy directive in 1996 with the Iran-Libya Sanction Act (ILSA), which places sanctions
against foreign companies investing more than twenty million dollars in the oil or gas
industries of these countries.
In spite of these difficulties, Iran is anxious to develop its large South Pars Field.13 This
field is shown in Figure 1 as the source of Iranian gas for India and Pakistan. In addition
to being relatively near, gas piped from Iran does not have to traverse a third country
before reaching Pakistan, which avoids transit fees and reduces political difficulties.
of the Centgas consortium, is being sued by the Argentinean firm Bridas, which claims rights to theTurkmen gas that is to be transported to Pakistan.

17
Oman: Oman has not been a traditional player in the natural gas market, but is looking to
diversify its exports away from oil. Its reserves of 30 Tcf (EIA-CABS, January 1998)
result in an estimated R/P ratio of just over 200 years. In the near term Oman expects to
export natural gas in the form of LNG. A 6.6 million tons per year facility is under
development, and most of its output is already earmarked.
Qatar: Qatar has the third largest reserves of natural gas in the world, 250 Tcf, and a R/P
of around 520 years. A special feature is that Qatar has the largest reserves of non-
associated gas in the world, most of which is in the North Field with 239 Tcf of
recoverable reserves (EIA-CABS, May 1997). Qatar began exporting LNG in 1996, and
has two LNG projects ongoing or underway: Qatar LNG Company (Qatargas), and Ras
Laffan LNG Company (Rasgas). Enron is discussing with Qatari officials for a third LNG
project, of 5 million tons/year (mt/year) capacity. This would meet the needs of its
Dabhol power plant in Maharashtra, about 2 mt/year of LNG, with the remaining gas
available for other power projects in India.
Pipeline Routes
There are alternative pipeline proposals, including a similar land-based pipeline
from Iran to Pakistan (and potentially to India). This would be along the so-called central
route, slightly north of the TAPS route shown in Figure 1. Another route considered was
from Qatar to Pakistan along the coast of Iran (the Gulf-South Asia, or GUSA, line), for a
capacity of about 16 BCM/year. This project has also stalled, possibly on pricing issues
(typical sea-based pipelines are around two times more expensive than land-based
pipelines (International Energy Agency, 1994; Kubota, 1996). The proposed (and
13 The South Pars field, containing an estimated 128 Tcf of non-associated gas, is an extension of Qatar’s

18
subsequently shelved) Oman-India deep-sea pipeline would have had a capacity about
half that of a land-based pipeline, and was expected to cost between 5-10 billion dollars.
We point out that the analysis methodology used in this analysis is largely applicable to
any route, and the results will be broadly similar.
The decision on the route to be taken for the pipeline depends on the terrain and
other technical considerations. It is also subject to policy decisions, such as which
regions will receive (and benefit from) the most gas. For supplying different regions of
Pakistan, a proposal to go via the so-called central route has the benefit of being able to
supply both Sindh and Punjab Regions with gas. From the Indian perspective, the
Centgas line would be most suitable for supplying gas to the Punjab–Delhi regions. The
coastal or central lines would be better designed for south Rajasthan, Gujarat, and
Madhya Pradesh. This western region is expected to be a region of high industrial
growth, with Gujarat leading the way with numerous petrochemical plants coming up that
can consume gas. From a policy perspective, there are advantages to going towards
Gujarat. In addition to high industrialization (implying latent or even existing demand),
piped gas can link with LNG or other fuels arriving at the coast. However, there is
greater netback (comparative) value for piped gas delivered to the Delhi region, as
alternative fuels such as LNG arriving at the coasts would need to be piped inland for
consumption.
The decision on which country should be the supplier is also not a simple matter
of economics. Other factors matter. For instance, the US objects to not only anyone
North Field. This is an additional reason Iran would wish to tap this field soon.
19
buying gas from Iran, but even to pipelines transiting through Iran.14 Afghanistan, the
only other route from Turkmenistan, is mired in a civil war that makes consideration of
any transit route through Afghanistan premature.15 The entire issue of gas and oil
pipelines routing out of the Caspian Sea region has been described as the last “great
game” (Smith, 1996). Decisions on pipelines out of West and Central Asia will have
profound geostrategic implications for the coming decades.
Pricing Structure
Unlike oil prices, natural gas prices are not primarily determined by the market
but are subject to project specifics and negotiations, and tend to vary significantly. There
are two main types of price-setting mechanisms for natural gas projects: netback and
costs-plus. Netback is essentially a measure of the substitution value of the gas taking
into account alternatives for specific end uses (opportunity cost). While netback pricing
is usually favored by suppliers, we assume a costs-plus mechanism for setting gas prices,
which is typical for most energy infrastructure projects in emerging economies (Razavi,
1996). While the exact rates of return required by investors will depend on the calculated
risks of the project, such projects are not likely to be very different from major power
projects in the region. It is likely that there will only be limited or non-recourse financing
available for such ventures. Based on power projects in the area, we estimate a nominal
cost of capital as being 16%. Through leverage with cheaper debt, we estimate equity
14 There are mixed signals that have been emerging from the US administration. When Total (France),Gazprom (Russia), and Petronas (Malaysia), announced that they were investing in Iran’s offshore gasfields, after wavering for some time, the US Administration decided to waive the sanctions that ILSAwould have required (Bennet, 1998).15 While the Taliban recently gained control of many opposition strongholds in early August 1998 and nowcontrol much of the country, this does not imply their recognition as the Government of Afghanistan. Itwas after these events that Unocal announced that they were suspending their participation in the Centgasconsortium, citing political unrest in Afghanistan and lack of a recognized government in power (Unocal,

20
returns on the order of 25%, which is not considered overly high for such projects. For
our calculations, we have used US dollars for both investment and repayments, and have
assumed the availability of a tax holiday. We have also assumed a 15-year accounting
life, which is at least 10 or more years less than the expected life of the pipeline. This
financial package can simulate a wide range of equity returns for investors.
We define the transmission costs as the total annual costs of gas transmitted
divided by the volume of gas consumed. The annual costs consist of capital costs (to
cover pipeline and compressor station costs), gas costs for consumption by compressors,
operation and maintenance costs (fixed and variable), and transit fees paid. The capital
costs are assumed to be split pro-rata between India and Pakistan. For the sections up to
delivery points in Pakistan, the capital costs will be shared as per the negotiated
consumption. For the sections from there on to India, all the capital costs will be borne
by Indian consumers.
In pipeline transmission, the flow is a function of the diameter and the pressure
(see footnote 7 for a simplified formula). Given a fixed diameter, it is possible, up to a
point, to increase flow economically through increased compression. In this analysis, we
choose different flow rates, and optimize the compressor sizes accordingly, i.e., the entire
compression system is optimized for lowest cost flow for given volumes. If a lower
volume of gas is transmitted than designed for, that is an inefficiency not accounted for.
Transmission costs are only a portion of the total costs that the end-user faces. In
this analysis, we examine only the transmission costs and not the onwards distribution
costs. Assuming small consumers, the distribution costs can be two or more times the
1998). This last point might prove more elusive, given concerns over women’s and human rights and thereported harboring of terrorists by the Taliban.
21
transmission costs (International Energy Agency, 1994) because of the smaller-diameter
pipeline, lower capacity factors, and the increased costs for laying a pipeline near more
densely populated areas. However, we expect much of this gas will be used for power or
industrial production and the plants could therefore be situated in proximity to the
pipeline, reducing or virtually eliminating distribution costs. Alternatively, this gas can
be fed into an existing gas transmission and distribution network.
The other major component of delivered gas costs is the cost of the gas itself, paid
to the supplier. Typically, supplier nation prices are indexed to oil or oil product prices.
While the exact prices may vary slightly depending on the quality of the gas and
negotiations, we assume an equal wellhead price of $1.10/MMBtu for gas from all the
countries. Estimates for marginal cost of gas in producer nations are between $0.50-
0.60/MMBtu, indicating the supplier price we have used to be reasonable.
Many forms of ownership are possible for such a pipeline, with a stake held by
any or all of the following: the producers, the consumers, a transmission company, and
oil and gas distributors. In addition to these obvious stakeholders, such projects are
targets for outside financing, which is useful given the magnitude of investment required,
in the billions of dollars. Direct involvement by governments would show support for the
project, and would also be required for funding from multilateral agencies (Razavi,
1996). Other than funding, the foreign exchange and other guarantees that multilateral
agencies can provide are very useful for reducing investor risks (and thus lowering costs
of capital). The World Bank has shown explicit interest in such projects, both because of
the leverage they offer vis-à-vis private participation and due to the non-commercial
(political) risks of such ventures (The World Bank, 1996).

22
Results
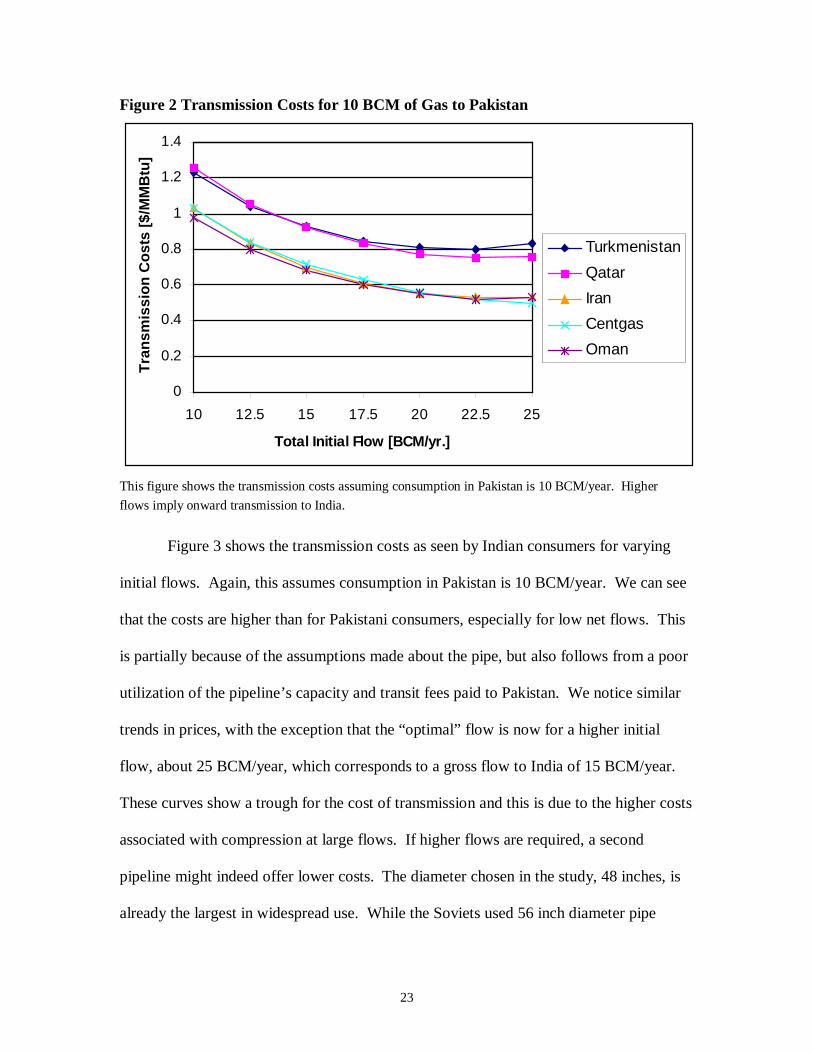
Figure 2 shows the cost of natural gas transmission to Pakistan from all of the
four possible supplier nations via TAPS, as well as based on the Centgas pipeline (which
is based on Turkmen gas transmitted through Afghanistan). The cost for Pakistani
consumers is based on their consumption of 10 BCM/year. Extra flows above this level
are intended for consumers in India. The gas volumes shown in this figure are the initial
flows at the beginning of the pipeline. A small fraction of the gas is consumed by the
compressors and this is taken into account when calculating prices. The figure shows
that transmission costs drop significantly with higher flow, with lowest costs for flows
over 20 BCM/year. This “optimal” flow is higher than would be the case without Indian
consumption due to the benefit of transit fees that offset additional compression costs for
higher flows. The main factors affecting the price are the distances involved, as well the
length the pipeline traverses a third country. Broadly speaking, there are two levels of
prices, slightly higher for Turkmenistan (via TAPS) and Qatar, and lower for Iran, Oman,
and Centgas.
23
Figure 2 Transmission Costs for 10 BCM of Gas to Pakistan
0
0.2
0.4
0.6
0.8
1
1.2
1.4
10 12.5 15 17.5 20 22.5 25
Total Initial Flow [BCM/yr.]
Tra
nsm
issi
on
Co
sts
[$/M
MB
tu]
Turkmenistan
Qatar
Iran
Centgas
Oman
This figure shows the transmission costs assuming consumption in Pakistan is 10 BCM/year. Higher
flows imply onward transmission to India.
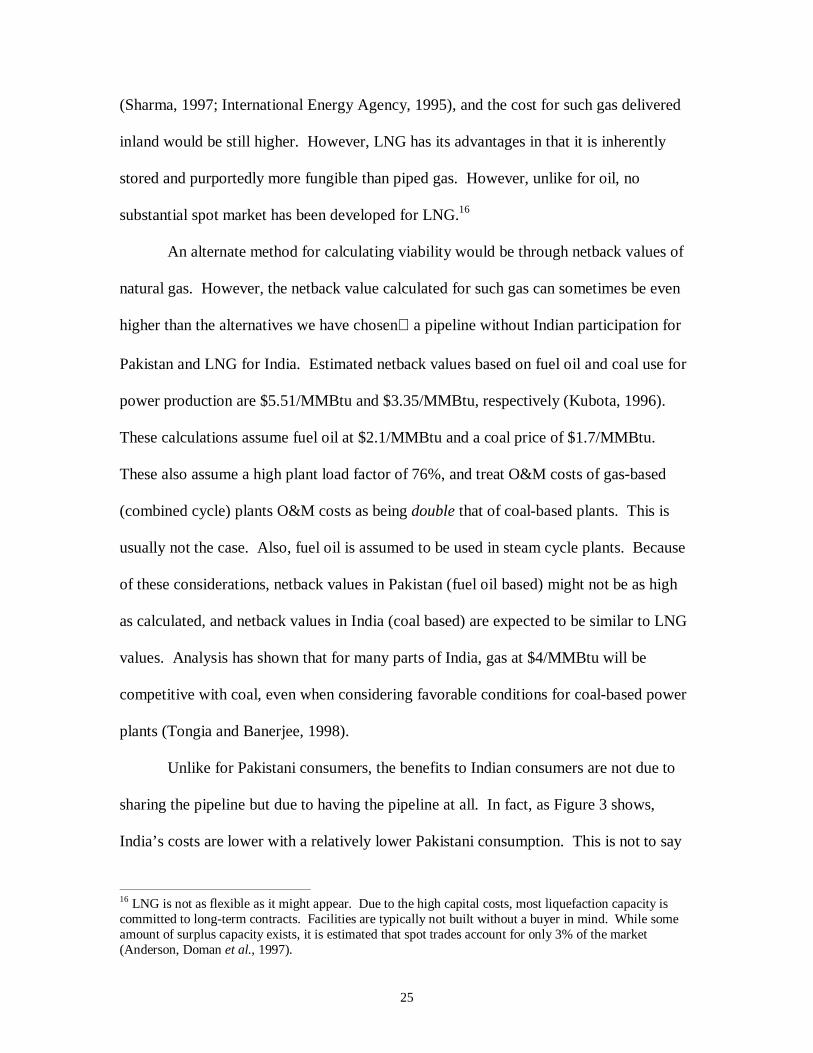
Figure 3 shows the transmission costs as seen by Indian consumers for varying
initial flows. Again, this assumes consumption in Pakistan is 10 BCM/year. We can see
that the costs are higher than for Pakistani consumers, especially for low net flows. This
is partially because of the assumptions made about the pipe, but also follows from a poor
utilization of the pipeline’s capacity and transit fees paid to Pakistan. We notice similar
trends in prices, with the exception that the “optimal” flow is now for a higher initial
flow, about 25 BCM/year, which corresponds to a gross flow to India of 15 BCM/year.
These curves show a trough for the cost of transmission and this is due to the higher costs
associated with compression at large flows. If higher flows are required, a second
pipeline might indeed offer lower costs. The diameter chosen in the study, 48 inches, is
already the largest in widespread use. While the Soviets used 56 inch diameter pipe

24
extensively, their cost-effectiveness has not been shown, and virtually no companies
today advocate such large pipelines.
Figure 3 Transmission costs for Gas to India
0
0.5
1
1.5
2
2.5
3
3.5
10 12.5 15 17.5 20 22.5 25
Total Initial Flow [BCM/yr.]
Tra
nsm
issi
on
Co
sts
[$/M
MB
tu]
Turkmenistan
Qatar
Iran
Oman
Centgas
This figure assumes that consumption in Pakistan is 10 BCM/year, leaving the remainder as gross supply
to India.
Metrics for Evaluation
The delivered cost of gas for both countries is the sum of the supplier nation costs
($1.10/MMBtu) and the transmission costs. Based on these costs, for Pakistani
consumers, sharing a pipeline would result in net savings of about 20 percent. These
savings do not include the benefits of avoiding oil imports or value addition due to
utilization of the gas.
For India, the benefits of gas from such a pipeline can be measured in comparison
to the price for LNG, which would be available at coastal regions. The ex-terminal (post
gasification) price of LNG is expected to be in the neighborhood of $3.60/MMBtu
25
(Sharma, 1997; International Energy Agency, 1995), and the cost for such gas delivered
inland would be still higher. However, LNG has its advantages in that it is inherently
stored and purportedly more fungible than piped gas. However, unlike for oil, no
substantial spot market has been developed for LNG.16
An alternate method for calculating viability would be through netback values of
natural gas. However, the netback value calculated for such gas can sometimes be even
higher than the alternatives we have chosena pipeline without Indian participation for
Pakistan and LNG for India. Estimated netback values based on fuel oil and coal use for
power production are $5.51/MMBtu and $3.35/MMBtu, respectively (Kubota, 1996).
These calculations assume fuel oil at $2.1/MMBtu and a coal price of $1.7/MMBtu.
These also assume a high plant load factor of 76%, and treat O&M costs of gas-based
(combined cycle) plants O&M costs as being double that of coal-based plants. This is
usually not the case. Also, fuel oil is assumed to be used in steam cycle plants. Because
of these considerations, netback values in Pakistan (fuel oil based) might not be as high
as calculated, and netback values in India (coal based) are expected to be similar to LNG
values. Analysis has shown that for many parts of India, gas at $4/MMBtu will be
competitive with coal, even when considering favorable conditions for coal-based power
plants (Tongia and Banerjee, 1998).
Unlike for Pakistani consumers, the benefits to Indian consumers are not due to
sharing the pipeline but due to having the pipeline at all. In fact, as Figure 3 shows,
India’s costs are lower with a relatively lower Pakistani consumption. This is not to say
16 LNG is not as flexible as it might appear. Due to the high capital costs, most liquefaction capacity iscommitted to long-term contracts. Facilities are typically not built without a buyer in mind. While someamount of surplus capacity exists, it is estimated that spot trades account for only 3% of the market(Anderson, Doman et al., 1997).

26
that there are no benefits from sharing. Adding a partner spreads the risks, and also adds
a market. We discuss these in the section on Benefits by Sharing.
In Figures 4 and 5, we show the effects of sharing a pipeline on delivered cost of
gas for varying levels of consumption in Pakistan. These are for gas from Turkmenistan
via TAPS and via Centgas, respectively. For these calculations we assume that the
Pakistan consumption can be met either alone, or by sharing a 20 BCM/year pipeline
with Indian consumers. As expected, when going alone, the lower the Pakistani
consumption, the higher the costs are. However, by sharing, the opposite is true: lower
consumption leads to lower costs! To separate the effects of economies of scale and
transit fees, we show another pair of curves representing shared pipelines with no transit
fees. If the full-flow pipeline were to transmit more than 20 BCM/year, the savings to
Pakistani consumers at low levels of consumption would be still greater.

27
Figure 4 Delivered Cost of Gas in Pakistan from Turkmenistan (via TAPS)
1.5
1.75
2
2.25
2.5
2.75
7.5 10 12.5 15 17.5 20
Consumption in Pakistan [BCM/yr.]
Del
iver
ed C
ost
s [$
/MM
Btu
]alone
shared 20 BCM line
shared line with notransit fees
This figure shows the price of gas in Pakistan for various levels of consumption. A shared line implies therest of the 20 BCM/year capacity is used for transmission onwards to India; alone implies underutilization
of the pipeline’s potential capacity.
28
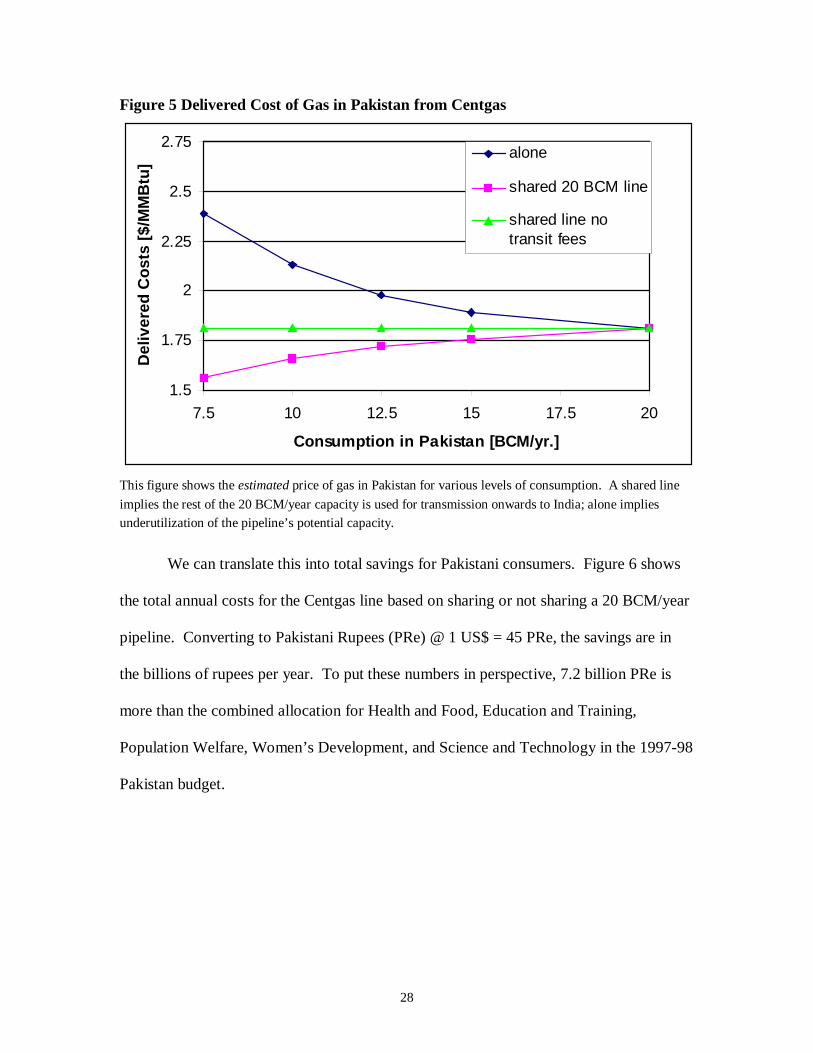
Figure 5 Delivered Cost of Gas in Pakistan from Centgas
1.5
1.75
2
2.25
2.5
2.75
7.5 10 12.5 15 17.5 20
Consumption in Pakistan [BCM/yr.]
Del
iver
ed C
ost
s [$
/MM
Btu
]alone
shared 20 BCM line
shared line notransit fees
This figure shows the estimated price of gas in Pakistan for various levels of consumption. A shared line
implies the rest of the 20 BCM/year capacity is used for transmission onwards to India; alone impliesunderutilization of the pipeline’s potential capacity.
We can translate this into total savings for Pakistani consumers. Figure 6 shows
the total annual costs for the Centgas line based on sharing or not sharing a 20 BCM/year
pipeline. Converting to Pakistani Rupees (PRe) @ 1 US$ = 45 PRe, the savings are in
the billions of rupees per year. To put these numbers in perspective, 7.2 billion PRe is
more than the combined allocation for Health and Food, Education and Training,
Population Welfare, Women’s Development, and Science and Technology in the 1997-98
Pakistan budget.

29
Figure 6 Total Annual Costs to Pakistan for Natural Gas from Centgas, Sharing vs.Not-sharing a Pipeline
0
200
400
600
800
1000
1200
1400
7.5 10 12.5 15 17.5 20
Consumption in Pakistan [BCM/yr.]
An
nu
al C
ost
s [M
illio
n $
]
alone
shared 20 BCM line
- 2.7 Billion PRe Savings
. 7.2 Billion PRe Savings
This is an approximation based on public data. A shared line implies the rest of the 20 BCM/year capacity
is used for transmission onwards to India; alone implies underutilization of the pipeline’s potential
capacity. Pakistani Rupees (PRe) shown are converted from dollars @ $1 = 45 PRe.
Benefits by Sharing
The results show clear benefits for both nations from such a pipeline. These are
direct economic benefits, arising from economies of scale and transit fees, and are
relatively easy to quantify. Economic considerations are not the sole indicators of the
viability of the project. Political issues and advantages remain prominent and must be
addressed as well. While Iran and Centgas (Turkmenistan) appear to be the most
promising suppliers based purely on commercial considerations, other routes, which
might be politically more expedient, are also attractive. In this section, we discuss other
benefits of a joint India-Pakistan pipeline as well.
30
Transit Fees, Economies of Scale, and other Operational Benefits
We have shown in the Results section how Pakistani consumers save significantly
by sharing a pipeline operating on higher flow. In addition to economies of scale, transit
fees can be a source of significant foreign exchange earnings. Long-distance pipelines
operate most economically at volumes around or above 20 BCM/year. It is unlikely that
Pakistan, in the coming years, would be able to consume such volumes of imported gas.
In addition, it usually takes a few years for a pipeline to ramp up to the target capacity.
The lower the target capacity is, the higher would be the penalty for reduced
consumption. Gearing the pipeline towards full-flow would therefore result in significant
savings in the initial years of operation. This may prove to be especially important given
the high costs of capital for such projects. Sharing a pipeline with Indian consumers
would also be beneficial as they would share other operating costs, such as compressor
losses.
Increased Market for Natural Gas
While many would readily agree to the short-term benefits to Pakistani consumers
by sharing a pipeline, there remain questions as to long-term benefits, considering that
Pakistani ability to consume imported gas would eventually rise to the point of maximum
economies of scale.
There is an inevitable degree of uncertainty in projections for future demand of
energy for a country. The demand for natural gas in Pakistan will be dependent not only
on economic growth—while determining the very growth itself, to some extent—but also
on the ability of the country to pay for the gas. Potential demand has not always been an

31
indicator of supply. In both countries, there has traditionally been a gap between the two
when it comes to energy.
In the future, if Pakistan needs to consume more gas than a shared pipeline would
provide, the benefits logic would apply to further shared ventures as well. Stated simply,
it’ s cheaper for Pakistan to consume fractions of several pipelines than a single pipeline,
more so given limited initial demand. Unlike a single pipeline, which would be
underutilized initially, multiple shared pipelines could be constructed to match growth in
demand, and would thus be able to operate most efficiently at high capacity.
Multiple pipelines provide greater security of supply, both technically and
commercially, due to the diversity of supply and, possibly, pipeline routes. Diversity of
supply is amongst the most important considerations for security of supply (International
Energy Agency, 1995; Bohi and Toman, 1996). In addition, it is expected that
subsequent pipelines will be less expensive,17 and would be determined more by
economic considerations than political ones.
Financing Issues
It can also be shown that just having an extra market improves the commercial
viability of such a project. It not only provides greater flexibility and room for growth,
but it also reduces the risk of default.18 Having the Indian market available to investors
17 The first of a kind pipeline is always expected to be more expensive, partially because of uncertainty inoperating parameters. Future pipelines also benefit from reduced surveying and Right-of-Way charges.They can also benefit from shared compressor stations.18 A simplified statistical example will show how this might work. Assume that the Pakistani demand willlikely be ‘P’ , and Indian demand ‘ I’ . These will also have a variance, Var[P] and Var[I], respectively. Ifwe assume that the two demands are normally distributed, then the variance of the sum will be:
Var[P + I] = Var[P] + Var[I] +2Covar[P,I]Assuming that the demands in the two countries are independent, the last term drops to zero. With this,
the standard deviation of the sum of the outputs (σ[P + I]) decreases by the factor of their square roots (inrelative terms). This can be seen as:
σ[P + I] = √(Var[P+I]) = √(σ2[P] + σ2[I])
32
might result in a lower cost of borrowing money. This is all the more relevant
considering the present difficulties facing the Pakistani economy.
Pakistan’s debt is now approximately 90% of its GDP. Debt servicing is
budgeted at 71.9% of the 1998-99 net federal revenue receipts, or 45.5% of the total
federal expenditure. The 1997-98 budget provided for federal revenues of PRe 326
billion. Defense expenditure was budgeted at PRe 134 billion and debt servicing at PRe
248 billion, totaling PRe 382 billion expenditure for just these two outlays. It is projected
that debt servicing alone will rise within a few years to surpass total federal revenues.
Such sovereign risks do not necessarily reduce investments—the cost of capital just
becomes more expensive.
It is difficult to quantify the savings in project financing due to sharing without
extensive risk-return tradeoff analyses. It is safe to assume even if financing costs don’t
fall, investors will be more willing to accept project risks. They would also be willing to
participate in such a project even without counter-guarantees for all possible
contingencies. This could speed up the implementation of the project. An additional
benefit would be the availability of Indian capital for the pipeline. It is possible that
Indian investments be used to cover some of Pakistan’s initial capital costs, and these
could be amortized, say, through transit fees.
Continuing the example, assuming P = I, the flow for both nations together would be twice the Pakistani
flow but have only √2 the standard deviation.There is a flaw with this simplified analysis in that it requires the covariance of the two demands to be
zero, i.e., the demands to be independent of each other. What influences demand? A reasonable answer isoverall economic growth. Given the limited interactions between the two nations’ economies, theassumption of independence can be a satisfactory approximation. We have also assumed normaldistributions for both nations’ demands, which might be conservative. The greater the uncertainty in theirindividual demands, the greater would be the benefits from combining markets.

33
Cheaper Power for India
The benefits for Indian consumers are also significant. We expect that a primary
user of imported gas would be the power sector. Many upcoming power plants intend to
use gas or premium distillates such as naphtha as fuel. Due to limits on domestic
availability of gas, many projects would rely on LNG. Compared to the estimated ex-
terminal price of $3.60/MMBtu for LNG, gas from such a pipeline would be 20-30
percent cheaper. The exact savings would depend on where the power plants are sited,
and the costs of alternatives such as LNG, naphtha, or even coal.
Gas through Pakistan would be available in the western part of the country. The
route shown in Figure 1 comes close to the existing Hazira-Bijapur-Jagdishpur (HBJ)
trunk gas pipeline, offering the possibility of interconnection and diversity of supply.
The HBJ pipeline is already over-committed, underlining the need for more gas.
If we assume that 10 BCM/year is available to India from a shared pipeline, this
volume of gas could power approximately 7,500 MW of combined cycle power plants.19
This would make a significant contribution to the power sector, and is almost 20% of the
IX Plan (1997-2002) target for increase in generation capacity. Indian consumers would
also benefit from the cheapest additional power, as fuel costs are the largest component
of electricity tariffs from gas-based power (Tongia and Banerjee, 1998).
Window of Opportunity
The window of opportunity for such a project is in the consumers’ favor, with oil
prices currently at what are, in real terms, the lowest they’ve been since the early
seventies. This is relevant because gas prices are typically indexed to oil prices, and most

34
gas contracts are for medium to long term supplies (15-20 years). Most forecasts for oil
prices during this period project low increases in price (EIA, 1998).
There is an increasing perception among developing countries that the economic
growth of the West was fuelled by cheap and readily available energy. If inexpensive
fossil fuels could be the prime mover for the prosperity of the West, it is only natural that
emerging economies also look for their own supplies of energy.
If Indian consumers do not receive access to piped gas through Pakistan, they will
be left with no option but to depend on LNG. Once that step is taken in the broader
economy, there will be less incentive to go for piped gas. There are already some
projects along coastal India that opt for the LNG option. Such projects may limit
investments—and the need—for such a pipeline.
Confidence Building Measure
There are not many instances of large-scale cooperation between India and
Pakistan. A lonely example is the often cited 1960 Indus Water Treaty (Khoja, 1998). A
shared gas pipeline is a strong platform for evolution of cooperation, leading to
interdependence between India and Pakistan. It would also turn out to be an effective
confidence building measure (CBM). There are few arenas as ripe for cooperation as the
energy sector. Given the large investments and expenditures for energy and
infrastructure in both countries, such cooperation could be the basis for continued
cooperation in affiliated (and other) fields.
19 This electrical capacity assumes that the gas is available as per the instantaneous demand. In reality, tomatch peak loads, alternative supply should be available or there must be appropriate load-sharing.
35
There is precedent for gas pipelines to be built between countries with political
differences. The Soviet Union began delivery of natural gas to Western Europe in 1968
(Davis, 1984), and the pipeline was constructed during the height of cold war tensions.
While a joint pipeline might be a strong CBM, and appears to be economically
attractive, many believe that this alone may not be a strong enough driver for its
acceptance. They cite that India and Pakistan do not trade enough with each other,
annually losing an estimated billion dollars. While part of this can be attributed to the
resistance of vested interests—especially in the agricultural sector—in both countries, we
do not feel that this argument is relevant for the pipeline. The pipeline has virtually no
losing stakeholders, and would be a purely economic transaction. For both countries to
accept the pipeline, they must stop playing zero-sum game strategies as they have in the
past (Perkovich, 1996); the pipeline is a win-win prospect.
Policy Issues and Concerns
Pakistan—Does India Complicate the Picture?
The savings shown in Figures 4 and 5 are based on varying levels of gas
consumption in Pakistan. There remains the issue of what the actual consumption might
be, both initially, and how it might change (grow) over time. Some of the benefits by
sharing are based on relatively low consumption in Pakistan. If the Pakistani
consumption is high enough, will it be worth having gas go onwards to India?
Table 4 shows a compilation of demand projections for Pakistan. We can see that
the demand projections vary, especially in the initial years. The 1998 numbers show a
large latent demand; how much of the demand for 2010 will either be unfulfilled, or
substituted with another fuel, is unknown.

36
Table 4 Demand Projections for Pakistan from Different Studies
Year Govt. ofPakistan
LondonEconomics
World Bank Average
1998 32.20 22.89 25.18 26.752002 36.83 32.89 30.19 33.302006 40.04 40.12 35.36 38.852010 43.92 48.97 44.48 45.79
units: BCM/year (Adapted from: Wajahatullah, 1997)
To attempt to show what the needs for imports will be, it is important to project
the output from domestic supplies. There are some reports that show that the domestic
supplies have peaked, and will decline in the coming years (e.g., Wajahatullah, 1997).
Other estimates show that production will not peak for a number of years (e.g., Raza,
1998).
One of the important drivers for gas imports is cited as the need to switch from
the more expensive fuel oil to natural gas for power production. According to an
estimate, 1 trillion cubic feet of gas, used in power plants, results in savings of $1.4
billion of foreign exchange (based on oil at $18/barrel and 40% operator share and gas at
$2.25/MMBtu) (Lodhi, 1998). This translates into savings of approximately $250 million
for every 5 BCM used to replace fuel oil in power production. However, we are not sure
that all the gas imported would result in such avoided costs, especially given the
depressed oil prices that are projected for the coming years. Also, the government
doesn’t place use of gas for replacement of fuel oil in power plants on a high priority.
Higher priorities are given for the domestic sector, fertilizer production, high-speed diesel
replacement in the power sector, and kerosene replacement in the domestic sector
(Wajahatullah, 1997). In addition, largely due to limited economic growth, there is an
expectation that there will be a short-term surplus of power, limiting the need for power

37
plants and natural gas as fuel. Also, no new large fertilizer plants are under planning
(Wajahatullah, 1997).
Even under subdued Pakistani demand as projected by a few Pakistani analysts,
we conclude that it still makes sense to lay a pipeline to Pakistan. However, sharing the
pipeline would increase its commercial viability significantly, allowing its full potential
to be utilized sooner. The lower the cost of gas, the less would be the possible need for
government subsidy or intervention.
For the initial years, we feel that 10 BCM/year is a reasonable estimate for
Pakistani imports. This is 60% of the 1996-97 consumption of gas (HDIP, 1998). Such a
volume for Pakistan implies great scope for adding the Indian consumers to better utilize
a pipeline’s capacity.
There is the impression that regardless of the benefits of adding India to the
pipeline, its addition complicates things and might slow down supply of gas to Pakistan.
On the contrary, with effort to overcome expected concerns, we argue that having Indian
consumers as well would speed up implementation of any such project.20
The rational policy for Pakistan would be to demand that no steps should be taken
that make gas in Pakistan more expensive or delay its arrival. One option would be to
build a pipeline to Pakistan, and then consider extending it to India as per the availability
of spare capacity. However, such a pipeline would not necessarily optimize for the
higher flows, and would also be more expensive per unit gas transported. This is all the
20 There are conflicting reports as to the viability of and need for a pipeline to Pakistan in the immediatefuture. Government views suggest that imported gas is necessary and financially attractive right now. Onthe other hand, Broken Hill Proprietors (BHP)involved in work on an Iran-Pakistan (and possibly India)pipelinehave announced they are suspending work on the pipeline project until at least 2005 (Dawn,1998). They cite lack of demand for imported gas and new discoveries of gas fields within Pakistan.However, we suspect this is also driven by the weak Pakistani economy. This only highlights theimportance of Indian participation for speeding up a pipeline for Pakistani consumers.

38
more important for the proposed very high pressure pipelines, where different flow
volumes are best served by different diameter pipelines (see Raza, 1998, for sample
calculations). Based on our analysis and looking at other pipeline projects, we do not see
how including Indian consumers for the pipeline would delay Pakistani gas or make it
more expensive.
India—Security of Supply
There is the strong perception by some in India that a pipeline through Pakistan
would be a risky proposition. In addition to the cost of the pipeline itself, there is the
greater investment downstream in power and industrial plants to utilize the piped gas.
The fact that the Indus Water Treaty has held up for over 25 years, through two wars,
should show that a pipeline could transcend political differences.
The risks of disruption can be minimized or countered by a number of
mechanisms. We expect that much of the gas will be used for power production, in
combined-cycle power plants. These are often made to operate with dual or multiple
fuels, such as naphtha or other distillates. This flexibility is desirable as insurance against
supply disruptions and price shocks. The cost per 1,000 MW plant for the required type
of fuel oil/distillate for one month’s usage would be around $15 million (excluding
transport and storage). Table 5 shows multifuelling of gas-based power plants in various
OECD countries.
The piped gas could be linked to domestic gas networks, which could be fed by
not only domestic gas but also LNG. It is also possible for gas to be stored in strategic
reserves; many OECD countries have extensive underground gas storage, enough for
months of consumption (International Energy Agency, 1995). However, such storage
39
takes years to develop, and is also not necessarily the optimal method for dealing with
short-term disruptions in supply (Flanigan, 1995).
At a policy level, gas transmission agreements can be strengthened by subjecting
them to international frameworks and agreements. Indian consumers would then not
have to worry overly about disruptions, and would rely on the legal framework for
resolving such matters and on pressure from multilateral agencies to ensure compliance.
With a number of countries and institutions involved in the project, it would be difficult
to disrupt supplies for political reasons.
Another mechanism would be for Pakistan to have a take-or-pay clause for the
entire volume of gas if there were to be a disruption of supplies to India. This would be
of interest to the producers and investors and would induce compliance as Pakistan would
find it difficult to pay for the entire volume without Indian participation. Equally, Indian
consumers would be bound to pay for their negotiated share of gas. In addition, a
supplier nation agreement might be so arranged where if there were any untoward
disruption of gas supplies to India, Pakistan’s supplies would also be curtailed. This
measure could be combined with a take-or-pay clause, to secure producers’ and
investors’ earnings.
While these steps may appear cumbersome, requiring many negotiations between
India and Pakistan (and the other stakeholders), it must be remembered that all gas
negotiations are inherently complex, but are not exceptional or unrealizable.
Experience from other Countries’ Gas Imports
When considering security issues for natural gas, most concerns center on the
reliability of supply and not on transit routes. Algeria is still remembered by European
40
consumers for its 1979 unilateral changes in price (Zartman and Bassani, 1987). On a
strategic front, there were concerns, mainly American, over Soviet supplies of gas to
Western Europe (Blinken, 1987). It was projected that some Western European countries
would become dependent on the Soviet Union for about a third of their gas supplies, or 5-
10% of their overall energy supplies. However, the Europeans found this to be
acceptable, and they actually ended up importing less gas from the Soviet Union than
initially planned.
Fears over disruption were mainly divided into threats of stoppage as leverage of
political pressure, and actual disruptions during times of hostility. In the India-Pakistan
case, chances of official threats of disruption will be less, as Pakistan is both a transit
route and also a consumer. Disruption would therefore be against their long-term
interests. However, as in the Soviet-European case, the odds of disruption during conflict
would be high. While analyzing the Europe-Soviet issue, Blinken (1987) writes, “In case
of war, however, Moscow would certainly stop the flow of its gas to the West and
recovery time by the EEC could be a key strategic concern. Because of dual-firing
capability and stockpiling, such a cutoff would not unduly harm the West’s defense
capacity in a conflict lasting one month or less.” The effects of stoppage of supply on the
economy and national security would be greater if there were simultaneous oil and gas
supply disruptions.
If the pipeline were to be in place in a few years, its supplies would amount to
about 25% of the gas consumed in India. This is similar to the dependence some Western
European countries have on each of their major non-OECD suppliers, Algeria and Russia
(Table 5) (International Energy Agency, 1995). However, given likely gas use in power

41
production and lack of underground storage, the effects of disruption would be higher in
India than in Europe for a similar percentage supply lost.
Table 5 Security Indicators for Natural Gas Imports (Select OECD Countries)
CountryGas’ Share ofTotal PrimaryEnergy Supply
(%)
Number ofSignificantSuppliersa
Russia’sShare (%)
Algeria’sShare (%)
Multifuel Gas PowerCapacity (%)b
Austria 20.8 2 74 - 91.3
Belgium/Luxem.
17.7 3 - 40 97.6c
Finland 8.8 1 100 - 86.1
France 12.1 5 32 27 91.2
Germany 16.7 4 31 - 75.6
Italy 25.8 4 27 30 99.5
Spain 6.2 5 - 51 100
Switzerland 7.6 3 17 - n.a.
Turkey 6.9 2 95 - 24.6
USA 91.5
Source: International Energy Agency (1995)a 5% or greater supply; includes domesticb 1992c Belgium only
An option would be for India to blend its piped gas with LNG. The exact ratio of
blending would depend on the acceptable average price. This step would also be useful
in meeting fluctuations in demand from the power sector. The load factors that are
desirable for such a pipeline are higher than what are likely from the power sector. Line-

42
pack21 aside, LNG would be very attractive for meeting peak demand and to help sustain
a higher installed power capacity from imports.
Other Concerns
While financing such a large project is an expected concern, we do not anticipate
it to be a major hurdle given the large number of institutions and countries that could be
involved. While some may view imported natural gas as a drain on foreign exchange,
imports can also be viewed as an alternative to exhausting domestic reserves, which
could be stored for emergencies, meeting peak requirements and variations in demand,
and price flattening. Indeed, storage is an option the US exercises heavily, with about
100 BCM of working gas stored underground! This is almost a fifth of its annual
production (EIA-CABS, April 1998).
One other issue that needs assent is the inclusion of Iran as a supplier, or even as a
transit route. This is an independent issue, which needs resolving, but is not seen as
central to India and Pakistan collaborating on a pipeline.
Discussion
Many people we have held discussions with think such a pipeline is a good idea,
but the prospects for its becoming reality are bleak, given the legion of outstanding
differences between the two nations. To us, this is the biggest obstacle, that discussions
over a pipeline could be held hostage to other unrelated issues.
This pipeline will not be a panacea for the ills of the peoples of both nations.
Many promising ventures fail because too much importance is placed on secondary
21 Line-pack is the buildup of gas within the pipeline itself for short-term storage (such as for meetingdiurnal variations). This takes advantage of off-peak flows for building up higher pressures along thepipeline, which are released during peak flows.

43
benefits. For Pakistan to benefit economically, all it has to do is allow a pipeline to
continue onwards to India.
When asked how politically viable transmission of gas through Pakistan to India
is, the Pakistani Petroleum Minister, Chaudhary Nisar Ali Khan, responded: “I think it is
totally viable, there is not the slightest doubt. It is basically a political decision which we
have to take, but onward transmission of gas from Pakistan to India is not only viable but
very convenient…Economically, physically, it is very feasible” (WGI, 1997).22
A major perspective from which decisions should be made is economic. While
the exact savings will vary with specific details yet to be worked out, the trends we have
shown are robust. The savings possible are enormous, not to mention that it might foster
a new era of cooperation between the peoples of both countries.
Acknowledgements: This research is supported by the W. Alton Jones Foundation and the
Department of Engineering and Public Policy, Carnegie Mellon University. We have benefited
from discussions with numerous colleagues, government officials, and industry specialists, many
of whom we are unable to formally acknowledge. We gratefully acknowledge the discussions
with and comments from George Perkovich, Benoit Morel, Shyam Sunder, Granger Morgan,
James Jensen, Shirin Tahir-Kheli, Hilal Raza, Vijay Kelkar, Vaqar Zakaria, R. P. Sharma, and M.
K. Narayanan. The authors are responsible for the contents.
22 Similar statements have been made about the Centgas pipeline continuing on to India. At a presentationin New Delhi by Unocal, the Pakistani Petroleum and Natural Gas Secretary, Dr. Gulfaraz Ahmed,commented, “This proposal aims at regionally and optimally bringing gas from a nearby source to bothcountries by exploiting the economies of scale. The defraying of cost by both countries would result in awin-win situation for both and in the process also provide a market for the gas of the land-lockedTurkmenistan” (Srinivasan, 1997).

44
References
Ahmed, Sultan (1998). Pressure to Slash Furnace Oil Prices. Dawn: Internet Edition, May11, 1998, p. Business.
Aijazuddin, F. S. (1998). When Power Turns Sour. Dawn: Internet Edition, June 29,1998, p. Business.
Anderson, Arthur T., Doman, Linda E. and Rypinski, Arthur (1997). DevelopmentPatterns for LNG Supply and Demand. Energy Information Administration, US Dept.of Energy: Washington, D.C.
Bennet, James (1998). To Clear Air With Europe, U.S. Waives Some Sanctions. NewYork Times: Internet Edition, May 19, 1998, p. International.
Blinken, Antony J. (1987). Ally versus ally: America, Europe, and the Siberian PipelineCrisis. Praeger Publishers: New York.
Bohi, Douglas R. and Toman, Michael A. (1996). The Economics of Energy Security.Kluwer Academic Publishers: Boston.
BP (1998). BP Statistical Review of World Energy 1998: Natural Gas. British Petroleum.
Businessline (1996). Bleak Power Scenario-- Editorial. The Hindu Businessline, February23, 1996.
CEA (1997). Central Electricity Authority Annual Report 1996-97. CEA, Ministry ofPower, Govt. of India: New Delhi.
Davis, J. D. (1984). Blue Gold: The Political Economy of Natural Gas. George Allen &Unwin: London.
Dawn (1998). Gas Pipeline from Iran to Pakistan on Hold. Dawn: Internet Edition,August 19, 1998, p. 1.
EIA (1996). International Energy Annual 1996. Energy Information Administration:Washington, D.C.
EIA (1997a). Annual Energy Outlook 1998. Energy Information Administration, USDept. of Energy: Washington, D.C.
EIA (1997b). Worldwide Natural Gas Supply and Demand and the Outlook for GlobalLNG trade. Energy Information Administration, US Dept. of Energy: Washington, D.C.
EIA (1998). International Energy Outlook 1998. Energy Information Administration, USDept. of Energy: Washington, D.C.
EIA-CABS (updated periodically). On-line Country Analysis Briefs,http://www.eia.doe.gov. Energy Information Administration, US Dept. of Energy:Washington, D.C.

45
Flanigan, Orin (1995). Underground Gas Storage Facilities. Gulf Publishing Co.:Houston.
HDIP (1998). Pakistan Energy Yearbook 1997. Hydrocarbon Development Institute ofPakistan, Ministry of Petroleum & Natural Resources, Govt. of Pakistan: Islamabad.
International Energy Agency (1994). Natural Gas Transportation: Organization andRegulation. OECD: Paris.
International Energy Agency (1995). The IEA Natural Gas Security Study. OECD/IEA:Paris.
Pakistani Petroleum Minister Khan, Chaudhary Nisar Ali (1998). Keynote Address.Presented at 2nd Pakistan Oil & Gas Summit ’98. Ministry of Petroleum and NaturalResources, Govt. of Pakistan: Islamabad. February 18, 1998.
Khoja, Khurshid (1998). Confidence-Building between India and Pakistan: Lessons,Opportunities, and Imperatives. Stimson Center: Washington, D.C.
Kubota, Shigeru (1996). Natural Gas Trade in Asia and the Middle East. Industry andEnergy Department, The World Bank: Washington, D.C.
Lodhi, Kamil (1998). As excerpted by F. Hashmi in Market Prospects in Pakistan. Dawn:Internet Edition, March 2, 1998.
Indian Industries Minister Maran, Murasoli (1996). As quoted by Correspondent in’Initiative on LNG Will Help Infrastructure’. The Hindu Businessline: Internet Edition,October 29, 1996.
Ministry of Finance (1998). Economic Survey 1997-98. Ministry of Finance (EconomicDivision), Govt. of India: New Delhi.
Ministry of Petroleum and Natural Gas (1995). Natural Gas in India: Strategies forDevelopment. Chemical Weekly 40(39): 147-155.
Ministry of Petroleum and Natural Gas (1997). Annual Report 1996-97. Ministry ofPetroleum and Natural Gas, Govt. of India: New Delhi.
Ministry of Power (1997a). 1996-97 Annual Report. Ministry of Power, Govt. of India:New Delhi.
Ministry of Power (1997b). Presentation on Power Sector in India. Infrastructure Forumon Energy and Transportation: Washington, D. C., U.S.-India Business Council.
Perkovich, George (1996). India, Pakistan, and the United States: The Zero-Sum Game.World Policy Journal XI I I (2).
Rashid, Ahmed (1998). The Turkmenistan-Afghanistan-Pakistan Pipeline:Company/Government Relations and Regional Politics. Presented at PipelineDiplomacy in Central Asia Conference. Institute of Strategic Studies: Islamabad. March26, 1998.

46
Raza, Hilal A. (1998). Natural Gas Import Options for South Asia. Presented at India andPakistan Opportunities in Economic Growth, Technology, and Security- IV Meeting.Hydrocarbon Development Institute of Pakistan, Govt. of Pakistan: Muscat, Oman.March 21-23, 1998.
Razavi, Hossein (1996). Financing Energy Projects in Emerging Economies. PennWellPublishing: Tulsa.
Saleem, Dr. Farrukh (1998). IPPs: Govt Scaring Away Investors. Dawn: Internet Edition,May 18, 1998, p. Business.
Pakistani Prime Minister Sharif, Muhammad Nawaz (1998). Prime Minister’s Speech.Presented at 2nd Pakistan Oil & Gas Summit ’98. Ministry of Petroleum and NaturalResources, Govt. of Pakistan: Islamabad. February 18, 1998.
Sharma, R. P. (1997). Personal Communication. Executive Director (M&P), GasAuthority of India Ltd.
Siddiqui, Toufiq A. and Tahir-Kheli, Shirin (1996). Enhancing Regional Cooperation inSouth Asia through Collaboration in Energy and Environment. Presented at UNDPWorkshop. UNDP: Singapore. December 2-4, 1995.
Smith, Dianne L. (1996). Central Asia: A New Great Game? Strategic Studies Institute,U.S. Army War College: Carlisle.
Srinivasan, Raghuvir (1997). Unocal Moots Turkmenistan-Delhi Gas Pipeline. The HinduBusinessline: Internet Edition, January 10, 1997.
Talachi, Rahim Kazemi (1986). Optimization of Natural Gas Pipeline Design. Universityof Texas at El Paso.
The World Bank (1996). International Roundtable on Natural Gas Trade: A BriefSummary of Presentations and Discussions. The World Bank: Washington, D.C.
Tongia, Rahul and Banerjee, Rangan (1998). Price of Power in India. Energy Policy26(7): 557-575.
True, Warren R. (1996). Pipeline Economics (OGJ Special): US Pipelines ContinueGains into 1996. Oil and Gas Journal 94(48).
United Nations (1997). New Energy Technologies and Policies. UN Climate ChangeBulletin 2nd Quarter(14).
Unocal (1998). Unocal Position Statement: Proposed Central Asia Gas (CentGas)Pipeline Project. August 21, 1998. Unocal Corporation.
Wajahatullah, K. M. (1997). The supply of Gas to Pakistan- Rationale for Imports and theEconomics Behind the Choices. Presented at 3rd Annual Middle East Gas Summit1997. Sui Southern Gas Company Ltd., Pakistan: Dubai. October 18-23, 1997.
Weltsch, Jerome D. (1996). Turkmen Oil and Natural Gas: The Viability of DeliveringProsperity to Global Markets. Trade and Environment Database, American University:Washington, D.C.

47
WGI (1997). Pakistan Ready to Accelerate Plans for Gas Imports, Demand. World GasIntelligence, August 29, 1997, p. 4-6.
Zartman, I. William and Bassani, Antonella (1987). The Algerian Gas Negotiations.Foreign Policy Institute, School of Advanced International Studies, Johns HopkinsUniversity: Washington, D.C.

48
Appendix
Pipe Capital Costs ]120
)1200-PressurePeak(
60
1200[1000 +× ($/in-diameter–km)
This allows $20,000/in-diamter–km as the cost for TAPS, butincludes a 50% linear variation with pressure deviating from 1,200p.s.i.This is the installed cost for overland pipelines; undersea pipe costs
are double these.
Compressor Capital Costs 2.69 × 10⁶ – 9.54 × 10⁵ × log10(Compressor Capacity in MW) ($/MW)
This is a fit based on a data from North America (True, 1996), andproduces better estimates in the flow ranges considered than the linearassumption of $1.3 million per MW used by Kubota (1996).
Compressor Redundancy 50%
Compressor O&M costs 4% of capital costs (per annum)
Pipe O&M costs 1.5% of capital costs (per annum)
Pressure drops across flows are estimated from the Modified Panhandle Equation, which is appropriatefor long-distance transmission calculations (Talachi, 1986):
51.0
961.0
22
2153.202.1)(025.735
−=
GZTL
ppD
P
ZTEQ
AAB
BBpB where:
QB = Volume flow rate in standard cubic feet per day (scfd)Ep = Pipeline efficiency factorTB = Base Temperature, °RankineZB = Base compressibility factor (dimensionless)PB = Base pressure, psiaD = Inside diameter, inchesP1 = Inlet pressure, psiaP2 = Outlet pressure, psiaL = Length of Pipeline, milesTA = Average temperature of flowing gas, °RankineZA = Compressibility factor at average temperature and pressure (dimensionless)G = Gas specific gravity (dimensionless)
This neglects effects of elevation changes.