native fish community structure and indo-pacific lionfish ... · marine ecology progress series mar...
TRANSCRIPT

MARINE ECOLOGY PROGRESS SERIESMar Ecol Prog Ser
Vol. 509: 241–254, 2014doi: 10.3354/meps10882
Published August 27
INTRODUCTION
Warming global temperature is linked to spatialshifts in species distributions (Parmesan & Yohe 2003,IPCC 2007). In recent years, shifts in fish distributionshave been documented as generally poleward and
changing depths as fishes follow their optimal tem-perature range (Perry et al. 2005, Nye et al. 2009,Sorte et al. 2010a). The extent of these distributionshifts varies depending on the regional biogeographyand species physiology. For example, in the North Seaand northeastern United States, species at the south-
© Inter-Research 2014 · www.int-res.com*Corresponding author: [email protected]
Native fish community structure and Indo-Pacific lionfishPterois volitans densities along a depth-temperature
gradient in Onslow Bay, North Carolina, USA
Paula E. Whitfield1,*, Roldan C. Muñoz2, Christine A. Buckel1, Brian P. Degan1, D. Wilson Freshwater3, Jonathan A. Hare4
1Center for Coastal Fisheries and Habitat Research, NCCOS, NOAA, 101 Pivers Island Road, Beaufort, North Carolina 28516, USA2National Marine Fisheries Service, NOAA, 101 Pivers Island Road, Beaufort, North Carolina 28516, USA
3Center for Marine Science, University of North Carolina Wilmington, 5600 Marvin K. Moss Road, Wilmington, North Carolina 28409, USA
4Narragansett Laboratory, Northeast Fisheries Science Center, National Marine Fisheries Service, NOAA, 28 Tarzwell Drive, Narragansett, Rhode Island 02882, USA
ABSTRACT: We quantified native fish densities along a depth-temperature gradient within a tem-perate-tropical marine transition zone (North Carolina continental shelf) to examine the role ofdepth and temperature in structuring these communities. We also examined the distribution of in-vasive lionfish (Pterois volitans, P. miles) to evaluate a laboratory-derived thermal minimum for lion-fish. We collected year-round continuous bottom water temperature data from 2000 to 2010 and sur-veyed lionfish (2004 to 2010), conspicuous fishes (2006 to 2010) and cryptic smaller-bodied fishes(2007 to 2010) at depths from 5 to 46 m using SCUBA. Bottom water temperatures were constantacross the depth gradient during summer and increased from inshore to offshore during winter. Theconspicuous fish community was structured by 3 depth zones, 5–14, 15–37 and 38–46 m, that corre-sponded with winter mean temperatures of 13.9, 17.9 and 20.9°C, respectively. The cryptic fishcommunity was structured by 4 depth zones, 5–15, 18–24, 27–38.5 and 39.5–46 m, with correspon-ding winter mean bottom temperatures of 13.8, 15.6, 18.7 and 20.9°C. In contrast, summer tempera-tures were not important in structuring either the conspicuous or the cryptic fish community. Thus,fish communities in the spring/summer appear to be structured by the pattern of bottom water tem-perature experienced the previous winter, supporting previous studies that indicate winter mini-mum temperature is important for determining fish distribution and abundance in temperatemarine ecosystems. In addition, the deeper fish communities were dominated by tropical species.Lionfish, a tropical species, was found in the highest densities from 38 to 46 m and present in loca-tions with a winter mean of 15.3°C and higher. Increasing temperatures could favor a potential ex-pansion of invasive lionfish and native tropical species into the nearshore waters on the North Car-olina shelf, resulting in unforeseen community structure and trophic disruptions.
KEY WORDS: Lionfish · Pterois volitans · Conspicuous fish · Cryptic fish · Winter mean temperature ·Depth · North Carolina · Hard bottom habitat · Climate change
Resale or republication not permitted without written consent of the publisher
FREEREE ACCESSCCESS

Mar Ecol Prog Ser 509: 241–254, 2014
ern extent of their range exhibited the greatest distri-bution shifts poleward, while those at the northernboundary shifted poleward and in some cases deeper(Perry et al. 2005, Nye et al. 2009). Fish communitiesin transition zones off the western coast of Australiaand in the northern Gulf of Mexico and the Mediter-ranean Sea are becoming more tropical (Ben Rais Las-ram & Mouillot 2009, Fodrie et al. 2010, Wernberg etal. 2013). Projections off the eastern coast of Australiaand the United States are for warmer winter tempera-tures to increase overwintering survival of tropicalfishes, resulting in range expansions (Figueira &Booth 2010, Hare et al. 2012b). Thus, marine bound-aries that represent zoogeographic transitions (e.g.temperate-tropical) may be important areas to detectevidence consistent with climate change impacts. Inwarm-temperate locations such as the Carolinian bio-geographic province, shifts in distribution may resultin changes in fish communities from temperatespecies to subtropical and tropical species (Parker &Dixon 1998, Ben Rais Lasram & Mouillot 2009, Nye etal. 2009, Fodrie et al. 2010), possibly leading to localextirpation of some species and colonization by others(Fodrie et al. 2010, Cheung et al. 2012, 2013).
In the Southeast US Continental Shelf Large Mar-ine Ecosystem (hereafter Southeast US Shelf), CapeHatteras, North Carolina, represents the northernboundary, where cooler temperate waters originat-ing from the Labrador Current converge with war -mer tropical Gulf Stream waters from the south,resulting in a year-round north-south gradient inwater temperature. Thus, Cape Hatteras representsboth a southern and northern boundary for manytemperate and tropical species, respectively. In addi-tion, just south of Cape Hatteras, there is a winter-induced inshore-offshore thermal gradient charac-terized by colder near-coastal waters and warmeroffshore waters that are thermally moderated year-round by the Gulf Stream (Atkinson et al. 1983). Thisthermal gradient is caused by winter cooling ofinshore shallow waters, while offshore the GulfStream continues to provide warm water from moresouthern areas (Atkinson et al. 1983).
The winter inshore-offshore temperature gradienton the Southeast US Shelf is coincident with the shelfdepth gradient and likely influences fish communitystructure year-round. Previous studies in this regionfound that fish communities shift from temperate totropical based on depth, with colder winter tempera-tures usually attributed as the main factor in this shift(i.e. distance from the Gulf Stream) (Miller & Ri chards1980, Grimes et al. 1982, Chester et al. 1984, Sedberry& Van Dolah 1984). Temperature-linked overwinter
survival is an important factor in determining abun-dance and distribution of marine species along theeastern coast of the United States (Hurst 2007). Ifocean warming trends continue as projected (IPCC2007), the Southeast US Shelf should warm, resultingin an inshore shift in species distributions, analogousto poleward shifts seen elsewhere (Perry et al. 2005,Ben Rais Lasram & Mouillot 2009, Fodrie et al. 2010).Species-specific differential shifts in distributionscould potentially alter interspecific interactions andfood webs and have important impacts on fisheries(Nye et al. 2009, Cheung et al. 2012, 2013). However,to date there has not been a quantitative examinationof depth and bottom water temperature influence onfish community structure within this region.
Climate change is one of multiple stressors actingon marine ecosystems (Breitburg & Riedel 2005). TheSoutheast US Shelf is also under stress from the inva-sion of the Indo-Pacific lionfish (Pterois volitans,P. miles), and the present overwintering distributionof lionfish extends from Cape Hatteras south to thenorthern coast of South America (Betancur-R et al.2011). Lionfish are considered a major threat toAtlantic reefs by reducing reef fish recruitment andbiomass and have been implicated in cascadingimpacts such as decreased coral cover on coral reefs(Albins & Hixon 2008, Lesser & Slattery 2011, Greenet al. 2012). Water temperature is thought to be oneof the few abiotic factors to control lionfish distribu-tion on a large scale. The thermal tolerance of lion-fish was established experimentally by Kimball et al.(2004); lionfish perish at 10°C. Thus, in addition topotential changes in fish community structure, war -ming temperatures in the Southeast US Shelf shouldmake the area more favorable to lionfish.
Our goal was to document the role of depth andbottom temperature in influencing fish communitystructure within the Southeast US Shelf near itsnorthern boundary. We examined both summer andwinter bottom temperature to evaluate the impor-tance of maximum and minimum temperatures.Baseline community data combined with concomi-tant collection of key environmental variables arenecessary to establish causality between the environ-ment and community change (Parmesan & Yohe2003) and for the development of predictive tools toexamine the consequences of change (Cheung et al.2012, 2013, Hare et al. 2012a, Wuenschel et al. 2012).To establish the biological baseline, we surveyed thefish community of larger mobile species along withsmaller-bodied cryptic fishes that appear to show in -creased sensitivity to changes in temperature (Perryet al. 2005). To establish the environmental baseline,
242

Whitfield et al.: Depth-temperature influence on lionfish and native fishes off North Carolina
we deployed temperature sensors at the sur vey sitesand quantified summer and winter bottom tempera-ture, a key variable structuring fish communities inthis region and elsewhere (Parker & Dixon 1998,Kimball et al. 2004, Figueira & Booth 2010, Wuen-schel et al. 2012). We used the temperature data tocalculate temperature preference for several of theabundant species in the survey and to evaluate thelaboratory-defined thermal tolerance of lionfish.
MATERIALS AND METHODS
Site characteristics
Fish surveys were conducted annually from 2004 to2010 on natural hard bottom reefs (calcium carbonaterock outcroppings), rock jetties and shipwreck sitesacross the shelf in Onslow Bay, North Carolina, fromdepths of 5 to 46 m (see Table S1 in the Supplement atwww.int-res.com/articles/ suppl/m509 p241_ supp. pdf).Sites were chosen to represent a gradient of depthand, by proxy, winter bottom water temperature.However, the closeness of the shallower locations tothe authors’ home port resulted in an uneven distribu-tion of samples across Onslow Bay, North Carolina(Fig. 1). Surveys were conduc ted annually betweenApril and September based on ship time availability.
Data loggers (HOBO® Water Temp Pro V1 and V2,HOBO® TidBiT v.1) were used to collect bottomwater temperatures and were deployed opportunisti-cally at up to 20 locations across the shelf for differingtime periods (maximum of 10 yr) (see Table S2 in theSupplement). In some cases, temperature loggerswere deployed prior to commencement of fish sur-veys. On reef sites, loggers were attached near thesubstrate to small moorings with attached subsurfacefloats, whereas on shipwrecks, loggers were at -tached di rectly to the structure. Data loggers re -corded 1 observation every 30 min and were re -trieved annually (Fig. 1). Depth at each site wasconfirmed in situ, but for analyses (below), depthswere derived from NOAA chart number 11520.
Bottom water temperature analysis
To characterize the climatology of Onslow Bay dur-ing the 2001 to 2010 time period, we calculated themean winter and mean summer bottom water temper-ature for each year and site based on the dailyaverage from the 3 coldest winter months (January,February and March) and the 3 warmest months
(August, September and October), respectively. Therelationship between mean winter temperature anddepth was examined using linear regression analysis,with temperature as the dependent variable anddepth as the independent variable. The relationshipbetween mean summer temperature and depth wasexamined using non-parametric Spearman correla-tion, as the data could not be transformed to meet theassumptions of parametric statistics. We also calcu-lated winter bottom temperature at selected depthsacross the shelf to illustrate the overall trend in bottomtemperature throughout the time period of the study.
Fish surveys
Fish abundance has been estimated within theSoutheast US Shelf using hook and line (Grimes et al.1982, Chester et al. 1984), trawling (Sedberry & VanDolah 1984), stationary point counts (Parker & Dixon1998) and video surveys (Burge et al. 2012). However,with the exception of stationary point counts andvideo surveys, these methods do not effectively cen -sus smaller benthic-oriented (cryptic) fishes (Willis2001). To address these deficiencies, we utilized 2 dif-ferent diver-based underwater visual census (UVC)band transects (Samoilys & Carlos 2000), hereafter re-ferred to as conspicuous and cryptic fish surveys.Conspicuous fish surveys examined highly mobileconspicuous fish of all sizes (area sampled: 50 × 10 m =500 m2) from 2006 to 2010. Cryptic fish surveys (areasampled: 50 × 2 m = 100 m2) characterized only thesmaller-bodied (<10 cm total length) cryptic (or juve-nile) fishes (Willis 2001) from 2007 to 2010. For thosespecies observed on both transect types, the adultswere generally observed on the conspicuous transects,and the juveniles were generally observed on thecryptic transects. Lionfish were surveyed from 2004 to2010 using the same method as conspicuous fish, withlionfish-specific surveys oc curring 2 yr prior to com-mencement of community surveys. Our surveys forlion fish and other native fishes were the same and pre-dated recommendations of lionfish-specific surveyme thods from coral reef habitats (Green 2012). Werou tinely looked underneath ledge overhangs andwithin crevices and found that in the hard bottomhabitats of Onslow Bay, lionfish were easily visible ei-ther on top of the habitat structure, at the base/sand in-terface of ledges or underneath ledge overhangs. Allfish were identified to the lowest taxonomic level (gen-erally species) and assigned a biogeographic designa-tion of temperate, subtropical or tropical based on pu -b lished sources from FishBase (Froese & Pauly 2014).
243

Mar Ecol Prog Ser 509: 241–254, 2014
Fish data analysis: relationships to temperature and depth
Multivariate analyses
Conspicuous and cryptic fish densities were firstsquare root transformed to reduce the influence ofcommon species, converted into resemblance matricesusing Bray-Curtis similarity and visually examined asmulti-dimensional scaling plots in PRIMER (Clarke &Warwick 2001, Clarke & Gorley 2006). We used thesimilarity profile (SIMPROF) procedure to determineif there was significant structure within the data towarrant further analysis. The categorical variableyear was examined using ANOSIM. The in fluence ofcontinuous environmental variables (mean summerand winter bottom temperature and depth) on fishcommunity structure was examined using the globalBEST and LINKTREE procedures (Clarke et al. 2008).In addition, we added lionfish and predator densities(i.e. groupers) to the global BEST and LINKTREEanalyses for the cryptic fish community to examinethe potential influence of these factors on cryptic fish
community structure. The global BEST procedure de-termines the combination of environmental variablesthat ‘best’ explains fish community structure. Envi-ronmental covariates that were found to be collinear(Spearman rank correlation ρ > 0.9) were identifiedand removed prior to BEST analysis (Clarke et al.2008). Thus, in the case of conspicuous fish, the envi-ronmental data consisted of depth and each tempera-ture variable (analyzed separately), and for crypticfish, the variables depth, winter and summer temper-ature, lionfish and predator densities (derived fromthe conspicuous fish transects) were examined, withdepth and the temperature variables alternately re-moved. Following the methods outlined in Clarke &Warwick (2001), the environmental data were ob-served in draftsman plots, transformed (if needed tocorrect skewness), normalized and converted to re-semblance matrices using the Euclidean distance co-efficient. Variable(s) in global BEST with the highestSpearman rank correlations with the fish resemblancematrices were explored further in LINKTREE, withthe SIMPROF test set at the 0.05 significance level.We further constrained the results so that groups with
244
Fig. 1. (A) Lionfish surveys (¡) from 2004 to 2005. (B) Lionfish and native conspicuous and cryptic fish surveys from 2006 to2010 (not all sites surveyed every year). ‘T’ followed by a number indicates general location of each temperature sensor.Details on number of years for each location are shown in Table S2 in the Supplement at www.int-res.com/articles/ suppl/
m509 p241_supp.pdf

Whitfield et al.: Depth-temperature influence on lionfish and native fishes off North Carolina 245
less than 4 sites would not be split further. The LINK-TREE procedure is a form of constrained clusteranalysis that uses a sequence of SIMPROF tests toidentify the specific breaks or ‘cutoffs’ of the valueswithin the environmental data that best explain thestructure within the biotic community (Clarke et al.2008). SIMPER analysis was conducted to determinethe individual species (or taxa) that comprise the dif-ferent LINKTREE-derived depth zones.
Univariate analyses
The relationship between Shannon diversity forboth conspicuous and cryptic communities and depthand winter temperature was examined using regres-sion analysis, with diversity as the dependent variableand either depth or winter temperature as independ-ent variables. Only winter temperatures were ana-lyzed because multivariate analyses found no effectof summer bottom temperatures on fish communitystructure. To examine the influence of depth and win-ter temperature on the tropical composition withinthe fish assemblage, we calculated a TropicalizationIndex (TI) based on the percentage contribution oftropical species to the entire fish community at eachsite (Wernberg et al. 2013). We conducted regressionanalyses using the index as the dependent variableand depth as the independent variable. The conspic-uous fish data were ranked to meet the assumptionsfor parametric linear regression analyses.
We also calculated a median temperature of occur-rence for many of the conspicuous and cryptic spe-cies and examined the temperature distribution oflionfish in more detail. Relatively abundant specieswere included in this analysis: average density overthe whole study period >100 ind. ha−1 and >20 occur-rences (conspicuous) and >15 occurrences (cryptic).Mean winter temperature and log10-transformed fishabundance were used; data were transformed toreduce the influence of highly abundant observa-tions. Median temperature of occurrence was calcu-lated using a quotient analysis (van der Lingen et al.2005) as modified by Röckmann et al. (2011). Boot-strapping was used to calculate 95% confidenceintervals for the median temperature of occurrenceestimate; specifically, winter temperature and abun-dance observations were re-sampled with replace-ment to generate replicate datasets of the same sizeas the original data set for each species.
Three analyses were conducted to examine lionfishdistribution by depth and temperature in more detail.First, lionfish densities were examined by depth zone
(from LINKTREE results) and year, using a Kruskal-Wallis 1-way ANOVA on ranks to examine lionfishdensity differences across year and depth zone. Sec-ond, the temperature limit of lionfish (based on meanwinter temperature) was estimated using the proba-bility density function of temperature of occurrence.The confidence intervals derived from bootstrappingwere used to determine the temperature at which theprobability of lionfish abundance exceeds 0. Third,the relationship between lionfish densities and sum-mer temperatures were examined using linear re -gression analysis. Lionfish densities were ranked tomeet assumptions for parametric statistics.
RESULTS
Depth and bottom water temperature relationship
We found a strong linear relationship betweendepth and winter temperature within Onslow Bay(Fig. 2A, linear regression, temperature °C = 8.892 +[0.241 × depth], R2 = 0.72, p < 0.001). There was norelationship between summer bottom temperatureand depth (Spearman rank correlation ρ = −0.032, p =0.755), with summer temperature nearly homoge-neous across Onslow Bay (Fig. 2B). Winter tempera-ture by year and depth show a consistent pattern byyear across the shelf, with shallow areas being thecoldest and deeper areas being the warmest, with nointerannual trend for increasing temperatures duringthe time period of this study (Fig. 2C). In fact, therewas a consistent decrease across the shelf in wintertemperature during the winter of 2008 to 2009. Depthand winter temperature are collinear variables (ρ >0.9); as such, multivariate analyses were conductedseparately with winter temperature, summer temper-ature and depth to avoid statistical problems relatedto covariance (Clarke et al. 2008).
Fish community analyses
Multivariate analyses
In 2006 to 2010, 142 taxa from 42 families wereobserved on the conspicuous fish transects, and in2007 to 2010, 101 taxa from 28 families were ob -served on the cryptic fish transects (see Table S3 inthe Supplement). We found inherent multivariatestructure within the conspicuous and cryptic commu-nities, warranting further multivariate investigation(SIMPROF, conspicuous Π = 4.182, p = 0.001; cryptic

Mar Ecol Prog Ser 509: 241–254, 2014
Π = 3.933, p = 0.001). There was no difference amongyears for the conspicuous (ANOSIM R = 0.03, p =0.29) or cryptic (ANOSIM R = 0.047 p = 0.09) fishcommunities; thus, all data were pooled across yearsfor subsequent analyses. Depth provided a slightlybetter fit for describing fish community structure
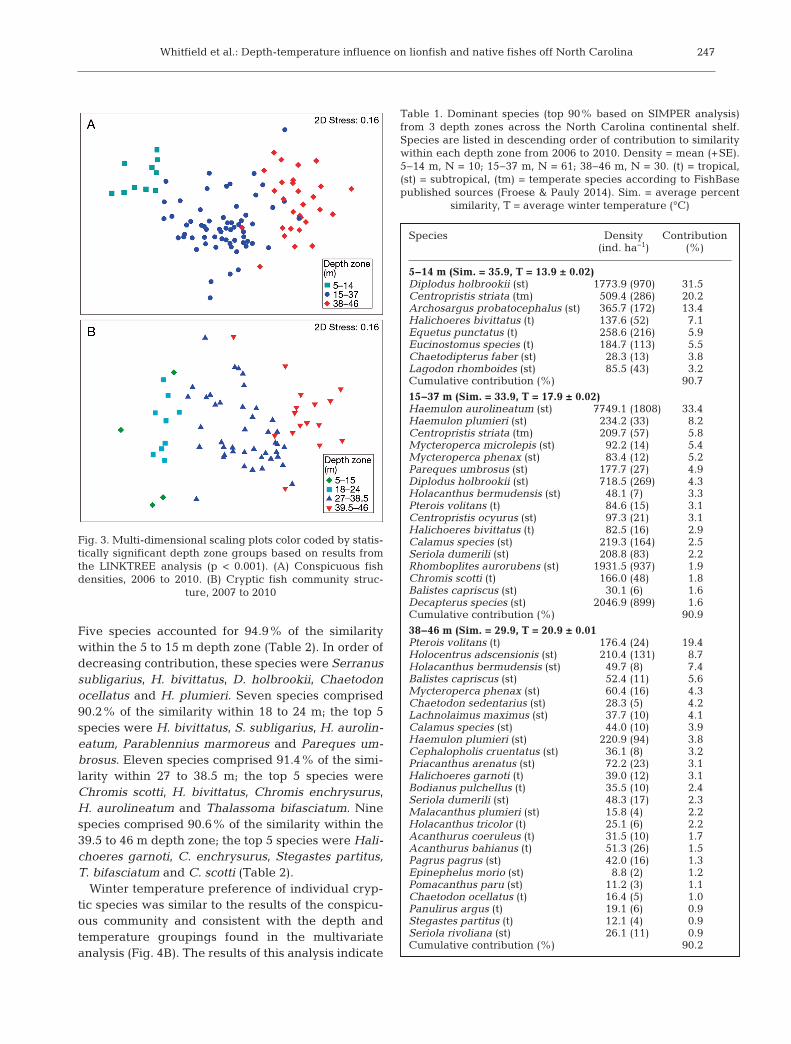
(global BEST depth: conspicuous ρ = 0.687, p = 0.001;cryptic ρ = 0.644, p = 0.001) than mean winter tem-perature (global BEST winter temperature: conspicu-ous ρ = 0.560, p = 0.001; cryptic ρ = 0.577, p = 0.001).Summer temperature was found to be the leastimportant in describing fish community structure(global BEST summer temperature: conspicuous ρ =0.261, p = 0.001; cryptic ρ = 0.231, p = 0.001). Depthstructured the conspicuous fish community into 3main clusters (LINKTREE B > 66% separation), 5–14,15–37 and 38–46 m (Fig. 3A), with the greatest sepa-ration or difference among groups occurring atdepths <14 m and >15 m (B = 85%). These depthzones corresponded with winter mean temperaturesof 13.9, 17.9 and 20.9°C, respectively. The crypticcommunity was separated by 4 depth categories (B >61%), 5–15, 18–24, 27–38.5 and 39.5–46 m (Fig. 3B),with the greatest community separation (B = 84%)between depths <24 m and >27 m. These depthzones corresponded to winter mean temperatures of13.8, 15.6, 18.7 and 20.9 °C, respectively.
Results of the conspicuous fish SIMPER analysisindicated 8 species responsible for 90.7% of the sim-ilarity within 5 to 14 m (Table 1). The top 5 speciesresponsible for characterizing this depth zone wereDiplodus holbrookii, Centropristis striata, Archosar-gus probatocephalus, Halichoeres bivittatus andEquetus punctatus. Seventeen species comprised90.9% of the similarity within 15 to 37 m, and the top5 species were Haemulon aurolineatum, Haemulonplumieri, C. striata, Mycteroperca microlepis andMycteroperca phenax. Lionfish were ranked ninth inpercent contribution within this depth zone. Twenty-five species comprised 90.2% of the similarity within38 to 46 m, with lionfish ranking the highest in per-cent contribution (19.4%) within this depth zone,along with Holocentrus adscensionis, Holacanthusbermudensis, Balistes capriscus and M. phenax inorder of decreasing contribution (Table 1).
Winter temperature preference of individual species was consistent with the depth and tempera-ture groupings found in the multivariate analysis(Fig. 4A). Some warm-water species were found inthe deep depth zone, and some warm-water andintermediate-temperature species were found in themid-depth zone. Only cooler-water species werefound in the inshore zone. The mean temperaturepreference of lionfish was 17.7°C; the lionfish wasone of the warm-water species but was found in boththe deep and mid-depth zones.
Similar to conspicuous fish, the number of crypticfish species representative of the individual depthzones tended to increase with depth across the shelf.
246
Fig. 2. (A) Mean winter bottom temperature (°C) and depth(m) and the associated regression line (see ‘Results: Depthand bottom water temperatuer relationship’). (B) Scatter plotof summer mean bottom temperature (°C) by depth, illus-trating no trend in summer temperatures by depth. (C) Winter bottom temperature (°C) across selected sites withindifferent depths. Each point represents 1 location or an aver-
age of up to 2 sites within the depth
Whitfield et al.: Depth-temperature influence on lionfish and native fishes off North Carolina
Five species accounted for 94.9% of the similaritywithin the 5 to 15 m depth zone (Table 2). In order ofdecreasing contribution, these species were Serranussubligarius, H. bivittatus, D. holbrookii, Chaetodonocellatus and H. plumieri. Seven species comprised90.2% of the similarity within 18 to 24 m; the top 5species were H. bivittatus, S. subligarius, H. aurolin-eatum, Parablennius marmoreus and Pareques um -bro sus. Eleven species comprised 91.4% of the simi-larity within 27 to 38.5 m; the top 5 species wereChromis scotti, H. bivittatus, Chromis enchrysurus,H. aurolineatum and Thalassoma bifasciatum. Ninespecies comprised 90.6% of the similarity within the39.5 to 46 m depth zone; the top 5 species were Hali-choeres garnoti, C. enchrysurus, Stegastes partitus,T. bifasciatum and C. scotti (Table 2).
Winter temperature preference of individual cryp-tic species was similar to the results of the conspicu-ous community and consistent with the depth andtemperature groupings found in the multivariateanalysis (Fig. 4B). The results of this analysis indicate
247
Species Density Contribution (ind. ha−1) (%)
5−14 m (Sim. = 35.9, T = 13.9 ± 0.02)Diplodus holbrookii (st) 1773.9 (970) 31.5Centropristis striata (tm) 509.4 (286) 20.2Archosargus probatocephalus (st) 365.7 (172) 13.4Halichoeres bivittatus (t) 137.6 (52) 7.1Equetus punctatus (t) 258.6 (216) 5.9Eucinostomus species (t) 184.7 (113) 5.5Chaetodipterus faber (st) 28.3 (13) 3.8Lagodon rhomboides (st) 85.5 (43) 3.2Cumulative contribution (%) 90.7
15−37 m (Sim. = 33.9, T = 17.9 ± 0.02)Haemulon aurolineatum (st) 7749.1 (1808) 33.4Haemulon plumieri (st) 234.2 (33) 8.2Centropristis striata (tm) 209.7 (57) 5.8Mycteroperca microlepis (st) 92.2 (14) 5.4Mycteroperca phenax (st) 83.4 (12) 5.2Pareques umbrosus (st) 177.7 (27) 4.9Diplodus holbrookii (st) 718.5 (269) 4.3Holacanthus bermudensis (st) 48.1 (7) 3.3Pterois volitans (t) 84.6 (15) 3.1Centropristis ocyurus (st) 97.3 (21) 3.1Halichoeres bivittatus (t) 82.5 (16) 2.9Calamus species (st) 219.3 (164) 2.5Seriola dumerili (st) 208.8 (83) 2.2Rhomboplites aurorubens (st) 1931.5 (937) 1.9Chromis scotti (t) 166.0 (48) 1.8Balistes capriscus (st) 30.1 (6) 1.6Decapterus species (st) 2046.9 (899) 1.6Cumulative contribution (%) 90.9
38−46 m (Sim. = 29.9, T = 20.9 ± 0.01Pterois volitans (t) 176.4 (24) 19.4Holocentrus adscensionis (st) 210.4 (131) 8.7Holacanthus bermudensis (st) 49.7 (8) 7.4Balistes capriscus (st) 52.4 (11) 5.6Mycteroperca phenax (st) 60.4 (16) 4.3Chaetodon sedentarius (st) 28.3 (5) 4.2Lachnolaimus maximus (st) 37.7 (10) 4.1Calamus species (st) 44.0 (10) 3.9Haemulon plumieri (st) 220.9 (94) 3.8Cephalopholis cruentatus (st) 36.1 (8) 3.2Priacanthus arenatus (st) 72.2 (23) 3.1Halichoeres garnoti (t) 39.0 (12) 3.1Bodianus pulchellus (t) 35.5 (10) 2.4Seriola dumerili (st) 48.3 (17) 2.3Malacanthus plumieri (st) 15.8 (4) 2.2Holacanthus tricolor (t) 25.1 (6) 2.2Acanthurus coeruleus (t) 31.5 (10) 1.7Acanthurus bahianus (t) 51.3 (26) 1.5Pagrus pagrus (st) 42.0 (16) 1.3Epinephelus morio (st) 8.8 (2) 1.2Pomacanthus paru (st) 11.2 (3) 1.1Chaetodon ocellatus (t) 16.4 (5) 1.0Panulirus argus (t) 19.1 (6) 0.9Stegastes partitus (t) 12.1 (4) 0.9Seriola rivoliana (st) 26.1 (11) 0.9Cumulative contribution (%) 90.2
Table 1. Dominant species (top 90% based on SIMPER analysis)from 3 depth zones across the North Carolina continental shelf.Species are listed in descending order of contribution to similaritywithin each depth zone from 2006 to 2010. Density = mean (+SE).5−14 m, N = 10; 15−37 m, N = 61; 38−46 m, N = 30. (t) = tropical,(st) = subtropical, (tm) = temperate species according to FishBasepublished sources (Froese & Pauly 2014). Sim. = average percent
similarity, T = average winter temperature (°C)
Fig. 3. Multi-dimensional scaling plots color coded by statis-tically significant depth zone groups based on results fromthe LINKTREE analysis (p < 0.001). (A) Conspicuous fishdensities, 2006 to 2010. (B) Cryptic fish community struc-
ture, 2007 to 2010

Mar Ecol Prog Ser 509: 241–254, 2014
2 main groupings, the cooler water species, occurringin shallower water and with a median temperaturepreference between 11.2 and 13.0°C, and the war mer-water species, occurring in deeper waterwith temperatures between 16.0 and 18.3°C. Thetemperature preference of Stegas tes variabilis oc cursbetween the 2 groups, at a median temperature ofoccurrence of 14.2°C.
Univariate analyses
A positive relationship was foundbetween conspicuous fish diversityand depth (linear regression Shan-non diversity = 2.025 + [0.0166 ×depth] [R2 = 0.25, p < 0.001]), butno relationship was found betweencryptic fish diversity and depth(R2 = 0.0022, p = 0.7). For both theconspicuous and cryptic fish com-munities, a positive relationshipwas found between the Tropical-ization Index (TI) and depth (R2 =0.32, p < 0.001, regression: rank(TI) = 4.633 + (1.500 × depth); R2 =0.54, p < 0.001, regression: TI =7.808 + (1.790 × depth), respec-tively, Fig. 5). Overall, the crypticfish community had a higher TIthan conspicuous fishes. The TI forcryptic fishes ranged from 12.5 to100 with an average of 65, andthe index for conspicuous fishesranged from 4.8 to 60 with an aver-age of 26.8.
Lionfish were found within the15 to 37 and 38 to 46 m depth zonesthroughout the study, with den -sities ranging from 0 to 440 ind.ha−1. Overall, lionfish densities in -creased from 2004 to 2007 then in2009 decreased back to pre-2006levels (Fig. 6). This decrease mayin part be attributed to colder win-ter bottom temperatures that oc -curred during the winter of 2008 to2009 (Fig. 6). The highest lionfishdensities were found in the 38 to46 m depth zone. However, therewas no significant difference inlionfish densities between depthzones (15–37 and 38–46 m, p =0.259) or among years (p = 0.113).The probability density function
indicated that lionfish are absent from areas wheremean winter temperature falls below 14°C and startto occur at temperatures between 14 and 16°C(Fig. 7); site-specific data show that lionfish wereonly observed in locations with a winter mean tem-perature of above 15.3°C and higher. There was norelation ship between lionfish density and summertemperature (F = 0.00204, p > 0.964).
248
Fig. 4. (A) Median winter temperature preference of conspicuous species. Depthzone designation from the multivariate analyses are provided on the left: I =5–14 m, M = 15–37 m, D = 38–46 m. Species for which designations were not pos-sible are denoted by -----; these species were not observed frequently enough touse the quotient analysis. (B) Median winter temperature preference of crypticspecies. Depth zone designation from the multivariate analyses are provided onthe left: I = 5–15 m, Mi = 18–24 m, dM = 27–38.5 m, D = 39.5–46 m. Error bars:
95% confidence intervals

Whitfield et al.: Depth-temperature influence on lionfish and native fishes off North Carolina
DISCUSSION
The North Carolina shelf is characterized by a win-ter temperature gradient of increasing bottom watertemperatures that coincides with increasing depth,where the offshore waters are moderated year-roundby the presence of the warm Gulf Stream current(Atkinson et al. 1983). This temperature gradient isstrongest during the coldest months of the year: Jan-
249
Fig. 5. Tropicalization Index (TI) by depth (m) with resultinglinear regression line (see ‘Results: Univariate analyses’).(A) Conspicuous species, (B) cryptic species. Note change in
y-axis scale
Fig. 6. Lionfish densities in Onslow Bay by year and depthzone with winter mean bottom water temperature overlaid.This mean temperature is an average of the 15–37 and38–46 m depth zones; lionfish were never observed within the
5–14 m depth zone during the study. Error bars: SE
Species Density Contribution (ind. ha−1) (%)
5−15 m (Sim. = 20.2, T = 13.8 ± 0.04)Serranus subligarius (st) 987.5 (649) 25.9Halichoeres bivittatus (t) 513.4 (209) 25.2Diplodus holbrookii (st) 17034 (13902) 16.8Chaetodon ocellatus (t) 145.2 (83) 15.0Haemulon plumieri (st) 101.5 (45) 11.9Cumulative contribution (%) 94.9
18−24 m (Sim. = 42.1, T = 15.6 ± 0.01)Halichoeres bivittatus (t) 2786.2 (324) 31.9Serranus subligarius (st) 1227.5 (134) 22.2Haemulon
aurolineatum (st) 7073.8 (2873) 10.7Parablennius marmoreus (st) 492.5 (161) 8.1Pareques umbrosus (st) 721.2 (310) 8.1Haemulon plumieri (st) 1825.0 (707) 5.2Centropristis striata (st) 245.0 (92) 4.1Cumulative contribution (%) 90.2
27−38.5 m (Sim. = 34.4, T = 18.7 ± 0.02)Chromis scotti (t) 4863.8 (726) 32.5Halichoeres bivittatus (t) 964.0 (164) 12.0Chromis enchrysurus (t) 1216.0 (206) 11.8Haemulon aurolineatum (t) 18285.8(6272) 10.5Thalassoma bifasciatum (t) 1021.8 (208) 8.2Stegastes partitus (t) 391.6 (102) 5.4Halichoeres garnoti (t) 285.6 (84) 3.2Serranus subligarius (st) 288.3 (87) 2.4Stegastes variabilis (t) 229.1 (65) 2.2Parablennius marmoreus (st) 341.6 (179) 1.6Centropristis ocyurus (st) 208.1 (111) 1.5Cumulative contribution (%) 91.4
39.5−46 m (Sim. = 32.1, T = 20.9 ± 0.02)Halichoeres garnoti (t) 880.7 (227) 27.0Chromis enchrysurus (t) 1961.8 (796) 22.5Stegastes partitus (t) 305.1 (64) 11.7Thalassoma bifasciatum (t) 350.6 (152) 7.9Chromis scotti (t) 2263.8 (1590) 6.7Serranus baldwini (t) 153.0 (44) 5.0Canthigaster rostrata (t) 130.3 (64) 3.8Serranus phoebe (st) 125.4 (44) 3.5Chromis insolatus (t) 221.4 (120) 2.6Cumulative contribution (%) 90.6
Table 2. Dominant cryptic fish species (top ~90% based on SIMPERanalysis) from 4 depth zones across the North Carolina continentalshelf. Species are listed in descending order of contribution to sim-ilarity within each depth zone from 2007 to 2010. Density = mean(+SE). 5−15 m, N = 4; 18−24 m, N = 10; 27−38.5 m, N = 41; 39.5−46 m, N = 16. (t) = tropical, (st) = subtropical, (tm) = temperate species according to FishBase published sources (Froese & Pauly2014). Sim. = average percent similarity, T = average winter
temperature (°C)

Mar Ecol Prog Ser 509: 241–254, 2014
uary, February and March. In contrast, during thesummer months, the temperature across the shelf ishomogeneous. The correlation of winter temperaturewith depth makes it difficult to distinguish the role ofeither in structuring fish communities in Onslow Bay.However, evidence of winter temperature as animportant factor in structuring these fish communi-ties exists. First, many of the warm-water speciesobserved only in the deepest depth zone are found inshallow waters in more tropical areas (Froese & Pauly2014). Second, an increasingly tropical fish commu-nity composition with depth and increasing bottomtemperatures was found for both the conspicuousand cryptic fish communities. The shift to a moretropical composition with increasing depth has beenobserved and attributed to warmer winter bottomtemperatures in previous studies within the South-east US Shelf (Miller & Richards 1980, Grimes et al.1982, Chester et al. 1984, Sedberry & Van Dolah1984). Third, lionfish are found in shallow watersthroughout much of the western Atlantic, but offNorth Carolina, they are restricted to deeper andwarmer waters. Since there was no bias towardgreater habitat structure (presumably preferredhabitat) in the deeper waters (Table S1 in the Supple-ment), these data suggest that temperature is respon-sible for the cross-shelf pattern in fish community offNorth Carolina. However, other biotic and abioticfactors cannot be ruled out. Some of these factorsinclude pH, dissolved oxygen, habitat complexity,predator and prey distributions, and differential
recruitment. These factors were not measuredin the present study, but our work provides abaseline pattern of community structure thatis at least partially explained by winter bottomtemperature and depth. These baseline datacan now be used to detect future changes tothe fish communities such as continued tropi-calization (Parker & Dixon 1998) and speciesrange shifts (Figueira & Booth 2010), as sug-gested by Booth et al. (2011).
One of the objectives of this work was toevaluate the laboratory-derived thermal mini-mum for lionfish in the field. Lionfish perishedin the laboratory at 10°C (the chronic lethalminimum), regardless of the rate of tempera-ture decline or the acclimation temperature oflionfish (Kimball et al. 2004). This differs fromthe field-derived minimum thermal thresholdof 15.3°C (mean winter temperature) found inthis study. However, 15.3°C is a mean valuethat represents a threshold for detecting lion-fish presence/ absence in the field, while 10°C
is the temperature where lionfish death oc curredin the laboratory. Thus, perfect correspondence be -tween the laboratory-derived chronic lethal mini-mum and the field-derived presence/absence mini-mum threshold is not expected, and differencesbetween laboratory-derived and observed minimumthre sholds have been found in previous studies(Figueira et al. 2009, Figueira & Booth 2010). Further,Kimball et al. (2004) found that lionfish ceased feed-ing at 15.3°C and became ‘stationary and lethargic’at 13°C, which may increase their susceptibility topredation (Maljkovic et al. 2008). These physiologi-cal and behavioral limits appear to have an effect onlionfish distribution within the bounds determined bydirect lethal effects of temperature. It is not knownwhether lionfish move in response to cold wintertemperatures or stay and perish (McBride & Able1998); juveniles and young adults in an estuary dis-played high site fidelity (Jud & Layman 2012), butGreen et al. (2011) examined adult lionfish on patchreefs and showed that movements of at least 130 mwere possible. Whether lionfish move or not, theirdistribution continues to be limited to the deeper,warmer waters offshore of North Carolina, suggest-ing that winter bottom temperature is an importantmechanism controlling their distribution in the field(Kimball et al. 2004).
The issue of fish movement is relevant to the com-munity analyses conducted here. Depth and wintertemperature are important environmental variables.Depth is fixed over the annual cycle, whereas tem-
250
Fig. 7. Probability density of lionfish occurrence as a function ofmean winter temperature. The probability density was calculated asa single parameter quotient (see ‘Materials and methods: Univariateanalyses’). Also shown are lionfish densities as a function of meanwinter temperature estimated during the conspicuous fish surveys.
Gray area indicates 95% confidence intervals

Whitfield et al.: Depth-temperature influence on lionfish and native fishes off North Carolina 251
perature varies (warm in the summer, cold in thewinter). We found a strong relationship betweendepth, winter temperature and community structure,which was measured during the spring and summer.Either depth is a dominant factor shaping distribu-tions, or winter temperature is dominant, and move-ment between winter and spring/summer is minimal.Under this latter hypothesis, the distributions ob ser -ved in the spring/summer reflect the pattern of bot-tom temperature experienced the winter before. Thequestion of depth or bottom temperature regulationof fish distribution is important (Hare et al. 2012a),and continued research in Onslow Bay could evalu-ate which factor is most important. As Onslow Baycontinues to warm, if temperature is more important,warmer-water species should move into shallowerwater. If depth is more important, warmer-water spe-cies should remain within preferred depth ranges. Inaddition to these longer-term studies, shorter-termstudies could be conducted to examine the scale ofannual and seasonal movements of lionfish and otherabundant fishes using acoustic telemetry or traditio -nal tagging.
In the future, the greatest rate of communitychange in the Southeast US Shelf is likely to be in thenearshore waters (Simpson et al. 2011). Range ex pan -sions of tropical and subtropical species north ofCape Hatteras are also expected (Hare et al. 2012b),similar to poleward expansions predicted off the east-ern coast of Australia (Figueira et al. 2009, Figueira &Booth 2010). However, it is difficult to predict specificwinners and losers with continued war ming, butgiven the high abundance of lionfish and their inva-sion success within the Atlantic, lionfish arelikely to be one of the species to expand theirrange if winter temperatures become morephysiologically hospitable (Sorte et al.2010a,b). Lionfish have additional value as apotential indicator species for detectingcommunity change in this region for 3 mainreasons: (1) they have an established in situthermal minimum threshold based on meanwinter bottom temperature (they are presentin temperatures of 15.3°C and higher), (2)there are few factors known to limit their dis-tribution on a large scale other than temper-ature and (3) they are easily recognized. If li-onfish become established year-round inareas previously known to be uninhabitable(e.g. habitats <27 m depth off North Car-olina), then this could indicate that the ther-mal regime is shifting to favor more tropicalspecies in general. Predicting future range
expansions or contractions of other species is moreproblematic, since thermal tolerance data are notavailable for most species (but see Figue ira & Booth2010, Hare et al. 2012b). However, our analyses re -vealed several tropical species (in addition to lionfish)that are abundant yet restricted to warmer offshoredepths in Onslow Bay but have wide depth distribu-tions within the tropics (Tables 1, 2 & 3). We proposethat these fishes (Halichoeres garnoti, Thalassoma bi-fasciatum, Holacanthus tricolor, Chro mis enchrysu-rus, C. scotti and C. insolatus) (Tables 1 & 2) may begood candidates as species most likely to expandtheir distributions shoreward and/ or northward (Hareet al. 2012b) under current global warming scenarios(IPCC 2007). Collectively, this group of species couldbe considered an ecological indicator if (like lionfish)they become established year-round in areas previ-ously uninhabitable (Table 3). In addition, the tem-perature thresholds calculated in this study can nowbe used to project future fish community distributionsbased on various carbon emissions projections (Figs.6 & 7) (Cheung et al. 2012, 2013, Hare et al. 2012b,Wuenschel et al. 2012).
There is limited evidence that tropicalization of thefish community is already occurring within OnslowBay, North Carolina (Parker & Dixon 1998), as it is inthe northern Gulf of Mexico (Fodrie et al. 2010),Mediterranean Sea (Ben Rais Lasram & Mouillot2009) and western Australian coast (Wernberg et al.2013). At one location in Onslow Bay (~29 m depth),Parker & Dixon (1998) documented 29 new tropicalspecies and increased abundance in 28 other speciesbetween the 1970s and early 1990s. In addition, 3
Species Depth range (m) Mean winter FishBase NC, temperature
this study range (°C)
Halichoeres garnoti 2−80 29.2−46 14.1−20.6Thalassoma bifasciatum 0−40 28−46 16.8−20.6Stegastes partitus 0−100 28−46 15.3−20.6Chromis enchrysurus 5−146 27−46 14.1−20.6Chromis insolatus 20−100 29.2−42 17.6−19.6Holacanthus tricolor 3−92 29.2−42 17.2−20.6Chromis scotti 15−116 27−42 12.9−20.2Pterois volitans 2−55a 27−46 15.3−20.6
aLionfish in its native range; lionfish occur up to 304.8 m in invadedrange (R. Gilmore unpubl. data)
Table 3. List of common tropical fish species, with reportedly widedepth distributions (FishBase, Froese & Pauly 2014) compared to thetruncated depth distributions found in this study off North Carolina(NC). Mean winter temperature ranges are from this study. All specieswere ranked within the top ~90% within their respective depth zones
based on similarity analyses (Tables 1 & 2)
Mar Ecol Prog Ser 509: 241–254, 2014
species (1 subtropical, 2 tropical) observed in thisstudy (cherub fish Centropyge argi, orange backbass Serranus anularis and the greater soapfish Ryp-ticus saponaceous) (see Table S3 in the Supplement)were recently documented as new species to NorthCarolina by Quattrini et al. (2004). Although it isunclear whether these reports are because of moreeffective sampling of the cryptic fish communities(i.e. UVC, video) or a northern range expansion, theoverall trend toward more tropical composition isexpected to continue based on current global carbonemissions projections (IPCC 2007, Cheung et al.2012). In fact, in our study we found the cryptic fishcommunity to be dominated by tropical species, con-sistent with the idea that smaller-bodied fishes withshort generation times have a demonstrated sensitiv-ity to changing climate conditions (Perry et al. 2005,Bellwood et al. 2006). However, we found that de -tecting community change using comparisons withprevious studies of conspicuous and cryptic fisheswithin the depths that we examined is problematicbecause of either the biases associated with the vari-ous methods themselves (Connell et al. 1998, Bennettet al. 2009, Burge et al. 2012) or, in the case of crypticspecies (Table 2), the lack of previous data. Investi-gations examining fish community structure in res -ponse to changing climatic conditions that do notconsider cryptic fishes may fail to detect communityshifts if they occur (Bellwood et al. 2006).
Most previous studies in the region used extractivesampling techniques such as angling, which targetslarger, economically valuable species (Grimes et al.1982, Chester et al. 1984), or trawling, which can un-derestimate larger mobile species and is restricted tolow-relief habitat (Sedberry & Van Dolah 1984). Oth-ers used direct observation methods such as stationarypoint counts using video and divers (Parker & Dixon1998, Burge et al. 2012). Fish community differencesbetween extractive sampling and direct observationmethods are common (Connell et al. 1998) and havebeen most recently noted in the North Carolina regionby Burge et al. (2012). Burge et al. (2012) used videoand diver stationary point counts to survey fishes andsummarized differences between the 18 most fre-quently encountered species in their study and 7 pre-vious studies (Appendix 3, Burge et al. 2012). Becauseof the variety of sampling methods and the locationand scale of the studies, robust conclusions regardingcommunity change are difficult. However, the taxaand general order of importance of species within ourstudy (Table 1) were in broad agreement with thespecies most important in Burge et al. (2012), and thetop-ranking species identified in several previous
studies (Grimes et al. 1982, Chester et al. 1984, Sed-berry & Van Dolah 1984) were also representedwithin the top 90% of identified fish taxa here(Table 1).
CONCLUSIONS
Temperate-tropical marine transition zones such asthe coastal waters along the North Carolina coastmay be areas that will undergo the most ecosystemchange as a result of warming ocean temperatures,and previous studies highlighted the importance ofthese regions as climate change hotspots (Booth et al.2011). The baseline data collected in this study willassist in detecting climate change impacts, such asthe expansion of tropical fish communities into areaspreviously uninhabited, and will allow the projectionof species distribution shifts based on future carbonemissions (IPCC 2007) and the temperature thresh-olds we report. A diverse assemblage of ecologicallyand economically valuable fishes can be found onNorth Carolina temperate reefs, many of which areconsidered overfished and have suffered populationdeclines in recent years (Rudershausen et al. 2008). Ifwinter temperatures are indeed the overriding factorin structuring these hard bottom reef communities,the continued warming of global temperatures maycause further changes to fish community structure.Increasing temperatures also favor a potential ex -pansion of the invasive lionfish population across theshelf (and northward). These 3 factors combinedcould further stress native fish communities, poten-tially leading to unforeseen fish community structureand trophic disruptions as the marine communityresponds to warmer temperatures (Sorte et al.2010a), complicating recovery efforts for some spe-cies (Nye et al. 2009).
Disclaimer. The scientific results and conclusions, as well asany views or opinions expressed herein, are those of theauthors and do not necessarily reflect the views of NOAA orthe Department of Commerce.
Acknowledgements. This project spanned 7 yr and wasfunded by several sources including NOAA’s UnderseaResearch Program, Invasive Species Program and NCCOSand the Center for Fisheries and Habitat Research in Beau-fort, North Carolina. We especially thank with great ap -preciation Doug Kesling (National Undersea Research Cen-ter-University of North Carolina Wilmington [NURC-UNCW],Cooperative Institute for Ocean Exploration, Research andTechnology [CIOERT]) and the many other technical andsafety divers and boat captains that shared their time andenergy with us, including Casey Coy, Jay Styron, Joe Hoyt,Jenny Vander Pluym, Jennifer Dorton, Lauren Heesemann,
252

Whitfield et al.: Depth-temperature influence on lionfish and native fishes off North Carolina
Brad Teer, Brett Harrision, Abigail Poray, John Hackney,Shay Viehman, Roger Mays, Brandon Puckett, Jitka Hyni ova,Thomas Nassif, Thor Dunmire, Kathryn O’ Shaughnessy,Captain Dan Aspenliter, Clem Shemanski, Ken Johns, LanceHorn, Tom Potts and Mike Winfield. We also thank CaptainGeorge Purifoy Jr. for deploying and retrieving temperaturesensors for many years across Onslow Bay. We also thankCaptain Robert Purifoy, Captain Bobby Edwards, CaptainWoo Woo Harker and Captain Terrell Gould. We thank MikeLacroix and Gary Fisher for providing technical assistanceand Thomas Nassif for being the best Teacher at Sea ever.The NOAA ship ‘Nancy Foster’ and her crew is gratefullyacknowledged and thanked. Dr. Richard Ehrenkaufer (alsoknown as Dr. Bogus) is also thanked for his generous donationof Bogue Pier water temperature data. We also thank PattiMarraro and Mark Fonseca. The manuscript was improvedsignificantly by reviewers Nate Bachelor, ChristinaSchobernd, Todd Kellison, Don Field, B. William Gottholmand Alex Chester, as well as 1 anonymous reviewer and JoelFodrie. Finally, this research would not have been possiblewithout the advanced technical diving programs of CIOERTand the now-defunct NURC-UNCW technical dive trainingprogram; we gratefully acknowledge their help in makingthis research happen.
LITERATURE CITED
Albins MA, Hixon MA (2008) Invasive Indo-Pacific lionfishPterois volitans reduce recruitment of Atlantic coral-reeffishes. Mar Ecol Prog Ser 367: 233−238
Atkinson LP, Lee TN, Blanton JO, Chandler WS (1983) Cli-matology of the southeastern United States continentalshelf waters. J Geophys Res 88: 4705−4718
Bellwood DR, Hoey AS, Ackerman JL, Depczynski M (2006)Coral bleaching, reef fish community phase shifts andthe resilience of coral reefs. Glob Change Biol 12: 1587−1594
Bennett RH, Goetz A, Sauer WHH, Cowley PD, Palmer RM(2009) Optimisation of underwater visual census andcontrolled angling methods for monitoring subtidal tem-perate reef fish communities. Afr J Mar Sci 31: 277−287
Ben Rais Lasram F, Mouillot D (2009) Increasing southerninvasion enhances congruence between endemic andexotic Mediterranean fish fauna. Biol Invasions 11: 697−711
Betancur-R R, Hines A, Acero A, Orti G, Wilbur AE, Fresh-water DW (2011) Reconstructing the lionfish invasion: insights into greater Caribbean biogeography. J Bio-geogr 38: 1281−1293
Booth DJ, Bond N, Macreadie P (2011) Detecting rangeshifts among Australian fishes in response to climatechange. Mar Freshw Res 62: 1027−1042
Breitburg DL, Riedel GF (2005) Multiple stressors in marinesystems. In: Norse EA, Crowder LB (eds) Marine conser-vation biology: the science of maintaining the sea’s biodi-versity. Island Press, Washington, DC, p 167−182
Burge EJ, Atack JD, Andrews C, Binder BM and others(2012) Underwater video monitoring of groupers and theassociated hard-bottom reef fish assemblage of NorthCarolina. Bull Mar Sci 88: 15−38
Chester AJ, Huntman GR, Tester PA, Manooch CS III (1984)South Atlantic Bight reef fish communities as represen -ted in hook-and-line catches. Bull Mar Sci 34: 267−279
Cheung WWL, Meeuwig JJ, Feng M, Harvey E and others
(2012) Climate-change induced tropicalisation of marinecommunities in western Australia. Mar Freshw Res 63: 415−427
Cheung WWL, Watson R, Pauly D (2013) Signature of oceanwarming in global fisheries catch. Nature 497: 365−368
Clarke KR, Gorley RN (2006) PRIMER v6: user manual/tuto-rial. PRIMER-E, Plymouth
Clarke KR, Warwick RM (2001) Change in marine commu-nities: an approach to statistical analysis and interpreta-tion. PRIMER-E, Plymouth
Clarke KR, Somerfield PJ, Gorley RN (2008) Testing of nullhypotheses in exploratory community analyses: similar-ity profiles and biota-environment linkage. J Exp MarBiol Ecol 366: 56−69
Connell SD, Samoilys MA, Smith MPL, Leqata J (1998)Comparisons of abundance of coral-reef fish: catch andeffort surveys vs visual census. Aust J Ecol 23: 579−586
Figueira WF, Booth DJ (2010) Increasing ocean tempera-tures allow tropical fishes to survive overwinter in tem-perate waters. Glob Change Biol 16: 506−516
Figueira WF, Biro P, Booth DJ, Valenzuela VC (2009) Per-formance of tropical fish recruiting to temperate habitats: role of ambient temperature and implications of climatechange. Mar Ecol Prog Ser 384: 231−239
Fodrie FJ, Heck KL, Powers SP, Graham WM, Robinson KL(2010) Climate-related, decadal-scale assemblage chan -ges of seagrass-associated fishes in the northern Gulf ofMexico. Glob Change Biol 16: 48−59
Froese R, Pauly D (2014) FishBase. www.fishbase.org(accessed 19 May 2014)
Green SJ (2012) Monitoring: an essential action. In: MorrisJA Jr (ed) Invasive lionfish: a guide to control and man-agement. Gulf Caribb Fish Inst Spec Publ Ser No. 1,Marathon, FL, p 51−71
Green SJ, Akins JL, Cote IM (2011) Foraging behaviour andprey consumption in the Indo-Pacific lionfish on Baha -mian coral reefs. Mar Ecol Prog Ser 433: 159−167
Green SJ, Akins JL, Maljkovic A, Cote IM (2012) Invasivelionfish drive Atlantic coral reef fish declines. PLoS ONE7: e32596
Grimes CB, Manooch CS, Huntsman GR (1982) Reef androck outcropping fishes of the outer continental shelf ofNorth Carolina and South Carolina and ecological noteson the red porgy and vermilion snapper. Bull Mar Sci 32: 277−289
Hare JA, Manderson JP, Nye JA, Alexander MA and others(2012a) Cusk (Brosme brosme) and climate change: assessing the threat to a candidate marine fish speciesunder the US Endangered Species Act. ICES J Mar Sci69: 1753−1768
Hare JA, Wuenschel MJ, Kimball ME (2012b) Projectingrange limits with coupled thermal tolerance — climatechange models: an example based on gray snapper (Lut-janus griseus) along the US east coast. PLoS ONE 7: e52294
Hurst T (2007) Causes and consequences of winter mortalityin fishes. J Fish Biol 71: 315−345
IPCC (Intergovernmental Panel on Climate Change) (2007)Summary for policymakers. In: Solomon S, Qin D, Man-ning M and others (eds) Climate change 2007: the phys-ical science basis. Contribution of Working Group I to theFourth Assessment Report of the IntergovernmentalPanel on Climate Change. Cambridge University Press,Cambridge
Jud ZR, Layman CA (2012) Site fidelity and movement pat-
253

Mar Ecol Prog Ser 509: 241–254, 2014
terns of invasive lionfish, Pterois spp., in a Florida estu-ary. J Exp Mar Biol Ecol 414−415: 69−74
Kimball ME, Miller JM, Whitfield PE, Hare JA (2004) Ther-mal tolerance and potential distribution of invasive lion-fish (Pterois volitans/miles complex) on the east coast ofthe United States. Mar Ecol Prog Ser 283: 269−278
Lesser MP, Slattery M (2011) Phase shift to algal dominatedcommunities at mesophotic depths associated with lion-fish (Pterois volitans) invasion on a Bahamian coral reef.Biol Invasions 13: 1855−1868
Maljkovic A, van Leeuwen TE, Cove SN (2008) Predation onthe invasive red lionfish, Pterois volitans (Pisces: Scor-paenidae), by native groupers in the Bahamas. CoralReefs 27: 501
McBride RS, Able KW (1998) Ecology and fate of butterfly-fishes, Chaetodon spp., in the temperate, western NorthAtlantic. Bull Mar Sci 63: 401−416
Miller GC, Richards WJ (1980) Reef fish habitat, faunalassemblages, and factors determining distributions inthe South Atlantic Bight. Annu Proc Gulf Caribb Fish Inst32: 114−130
Nye JA, Link JS, Hare JA, Overholtz WJ (2009) Changingspatial distribution of fish stocks in relation to climateand population size on the Northeast United States con-tinental shelf. Mar Ecol Prog Ser 393: 111−129
Parker RO, Dixon RL (1998) Changes in a North Carolinareef fish community after 15 years of intense fishing —global warming implications. Trans Am Fish Soc 127: 908−920
Parmesan C, Yohe G (2003) A globally coherent fingerprintof climate change impacts across natural systems. Nature421: 37−42
Perry AL, Low PJ, Ellis JR, Reynolds JD (2005) Climatechange and distribution shifts in marine fishes. Science308: 1912−1915
Quattrini AM, Ross SW, Sulak KJ, Necaise AM, Casazza TL,Dennis GD (2004) Marine fishes new to continentalUnited States waters, North Carolina, and the Gulf ofMexico. Southeast Nat 3: 155–172
Röckmann C, Dickey-Collas M, Payne MR, van Hal R (2011)Realized habitats of early-stage North Sea herring: look-
ing for signals of environmental change. ICES J Mar Sci68: 537−546
Rudershausen PJ, Williams EH, Buckel JA, Potts JC,Manooch CS III (2008) Comparison of reef fish catch perunit effort and total mortality between the 1970s and2005-2006 in Onslow Bay, North Carolina. Trans Am FishSoc 137: 1389−1405
Samoilys MA, Carlos G (2000) Determining methods ofunderwater visual census for estimating the abundanceof coral reef fishes. Environ Biol Fishes 57: 289−304
Sedberry GR, Van Dolah RF (1984) Demersal fish assem-blages associated with hard bottom habitat in the SouthAtlantic Bight of the USA. Environ Biol Fishes 11: 241−258
Simpson SD, Jennings S, Johnson MP, Blanchard JL, SchonPJ, Sims DW, Genner MJ (2011) Continental shelf-wideresponse of a fish assemblage to rapid warming of thesea. Curr Biol 21: 1565−1570
Sorte CJ, Williams SL, Carlton JT (2010a) Marine range shiftsand species introductions: comparative spread rates andcommunity impacts. Glob Ecol Biogeogr 19: 303−316
Sorte CJ, Williams SL, Zerebecki RA (2010b) Ocean warm-ing increases threat of invasive species in a marine foul-ing community. Ecology 91: 2198−2204
van der Lingen C, Castro L, Drapeau L, Checkley D Jr (eds)(2005) Report of a GLOBEC-SPACC workshop on char-acterizing and comparing the spawning habitats of smallpelagic fish. GLOBEC Report 21, GLOBEC InternationalProject Office, Plymouth
Wernberg T, Smale DA, Tuya F, Thomsen MS and others(2013) An extreme climatic event alters marine ecosys-tem structure in a global biodiversity hotspot. Nat ClimChang 3: 78−82
Willis TJ (2001) Visual census methods underestimate den-sity and diversity of cryptic reef fishes. J Fish Biol 59: 1408−1411
Wuenschel MJ, Hare JA, Kimball ME, Able KW (2012) Eval-uating juvenile thermal tolerance as a constraint on adultrange of gray snapper (Lutjanus griseus): a combinedlaboratory, field and modeling approach. J Exp Mar BiolEcol 436−437: 19−27
254
Editorial responsibility: Charles Birkeland, Honolulu, Hawaii, USA
Submitted: December 13, 2013; Accepted: May 26, 2014Proofs received from author(s): August 12, 2014