nationwide cil service developing a viable community infrastructure levy
TRANSCRIPT

Nationwide CIL ServiceNCS
Developing A ViableDeveloping A ViableCommunity Infrastructure Community Infrastructure
LevyLevy
Nationwide CIL ServiceNCS
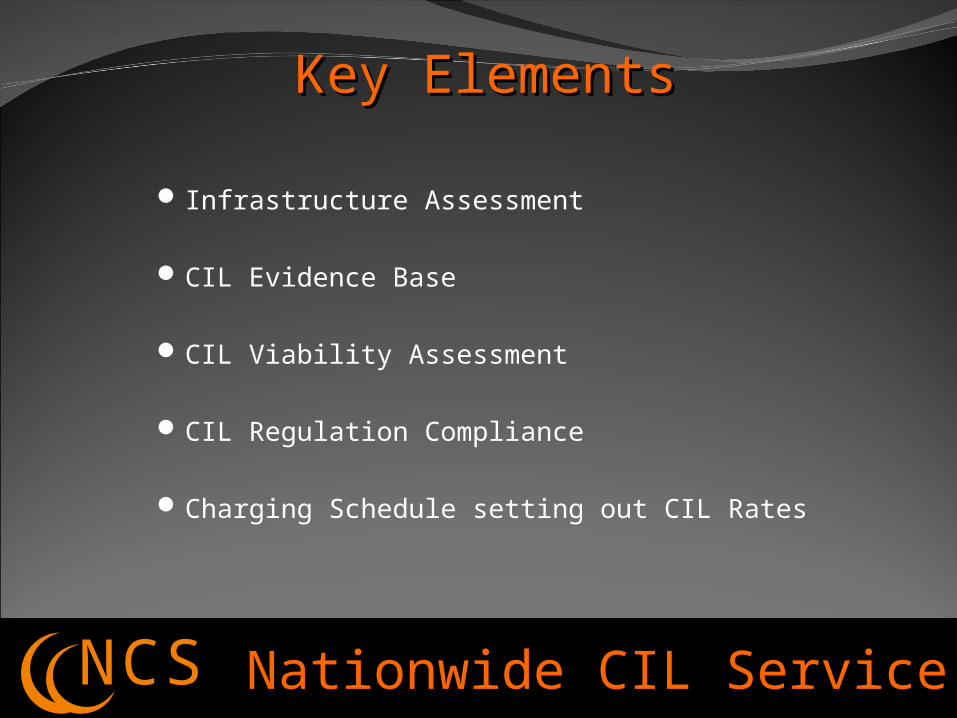
Key ElementsKey Elements
Infrastructure Assessment
CIL Evidence Base
CIL Viability Assessment
CIL Regulation Compliance
Charging Schedule setting out CIL Rates

Nationwide CIL ServiceNCS
Infrastructure AssessmentInfrastructure Assessment• Establish the Infrastructure required to Support Growth
• Determine the Infrastructure Projects desired to be funded by CIL
and assess the Delivery Costs
• Determine Alternative Funding Sources
• Calculate the Infrastructure Funding Deficit
• Confirm the Infrastructure List for Examination

Nationwide CIL ServiceNCS
Evidence Base – Statutory GuidanceEvidence Base – Statutory GuidanceKey guidance contained within paras 20-40 of the CIL Charge Setting and
Charging Schedule Procedures March 2010. An area based approach – a broad test of viability across that area rather
than rates being relevant to specific development sites
Appropriate available evidence across the area as a whole – sampling of development sites will be appropriate but if a differential CIL system is desired more fine grained sampling will be required to justify the differential approach.– not fully comprehensive or exhaustive.
Charging Authority should demonstrate that CIL rates are ‘informed by’ the evidence and consistent with it. No requirement for rates to mirror the evidence – there is room for pragmatism

Nationwide CIL ServiceNCS
Evidence Base – Statutory GuidanceEvidence Base – Statutory Guidance
Charging Authorities should take account of regulatory requirements that impact on the cost of development eg Affordable Housing policy
Authorities may consider changes to economic circumstances over the
lifetime of a charging schedule (eg sensitivity testing)
Authorities may rely on published data but may want to ensure CIL rates take account of current market conditions by sampling recent market transactions.

Nationwide CIL ServiceNCS
Evidence Base - PracticalitiesEvidence Base - Practicalities Undertake an area wide survey of land and property values. Existing evidence may
be used (eh SHLAA, AH Surveys, VOA Reports) but it should rely on consistent assumptions.
Obtain evidence of construction costs, fee rates, statutory fees, warranties,
contingency rates that is applicable to the local area If a differential rate CIL system is desired, the evidence base should be sufficiently
comprehensive and detailed to justify different rates for different categories and locations of development.
The valuation evidence should be sufficiently detailed to enable charging zone
boundaries to be justified in a differential rate system

Nationwide CIL ServiceNCS
Evidence Base – Sub MarketsEvidence Base – Sub Markets Investigate potential variations in economic sub-markets for both residential and commercial property
This is an overview to determine broad variations and potential CIL charging zones and may therefore rely on area wide evidence rather than the sort of market specific evidence required to justify development viability (eg VOA comparative data)
Values within the chosen test areas (eg wards, parishes, post codes) will tend to group together to inform potential CIL Charging Zones. ResidentialC3
Ward A, B, E, F
Ward C, D, G,
WardS, T, U, V, W,
WardH, I J, X,Y, Z
WardK, L, M, N, O,P,Q, R
Av House Price £170,000 £200,000 £240,000 £270,000 £320,000

Nationwide CIL ServiceNCS
Evidence Base – Land & Property ValuationEvidence Base – Land & Property ValuationResidential (C3) - Land Values per Ha, Land Values per ‘house type’ plot based on relevant density assumptions
Commercial - Land Values per Ha & Development Values :-General Retail (A1, A2, A3, A4, A5) Food Retail (A1) Industrial (B1b, B1c, B2, B8) Offices (B1a)Hotels (C1) Residential Institutions (C2)Institutional and Community (D1) Leisure (D2)Agricultural Sui Generis - sample based on planning history.
Residential Ward A, B, E, F
Ward C, D, G,
WardS, T, U, V, W,
WardH, I J, X,Y, Z
WardK, L, M, N, O,P,Q, R
Land Value (Ha) £800,000 £1,100,000 £1,400,000 £1,700,000 £2,300,000
Sales Value (Sqm) £1800 £2000 £2300 £2500 £3,000

Nationwide CIL ServiceNCS
Fixed Rate or Differential RatesFixed Rate or Differential RatesFixed rates are simple to apply and administerFixed rates may be appropriate in homogenous urban areas.Fixed rates may unreasonably tax public services e.g. schools and
community buildings.
Differential rates may better reflect the economic circumstances of larger Authorities with significant variations in character, land and property value.
Differential Rates recognise that many types of development and development in disadvantaged locations will not be capable of making any CIL contribution.
Differential Rates must be based solely on economic viability evidence and require greater justification and more fine grained viability assessment

Nationwide CIL ServiceNCS
Charging ZonesCharging ZonesDetermine Charging Zone Complexity – a direct reflection of micro economic circumstances or a broad overview?
Charging Zones may be quite simple (urban/rural) but
in many cases the economic circumstances will justify a more sophisticated approach
Influence of Local Policy
Residential Zones are likely to differ from Commercial
Zones and require separate Maps.
Charging Zones may be based on any type of boundary
(Parishes, Wards, Post Codes) but must be robust and defensible based on the valuation evidence
Future Proofing

Nationwide CIL ServiceNCS
Viability Assessment – The PrincipleViability Assessment – The Principle
CIL will generally be extracted from the increase in land value resulting from planning permission. The approach to land valuation assumptions is essential to establishing a robust CIL system
NPPF March 2012 – “To ensure viability, the costs of any requirements likely to be applied to development should provide competitive returns to a willing land owner and willing developer to enable the development to be deliverable”.
Development Value
CIL
Planning Obligations
Developers Profit
Construction Costs
Land Value
Nationwide CIL ServiceNCS
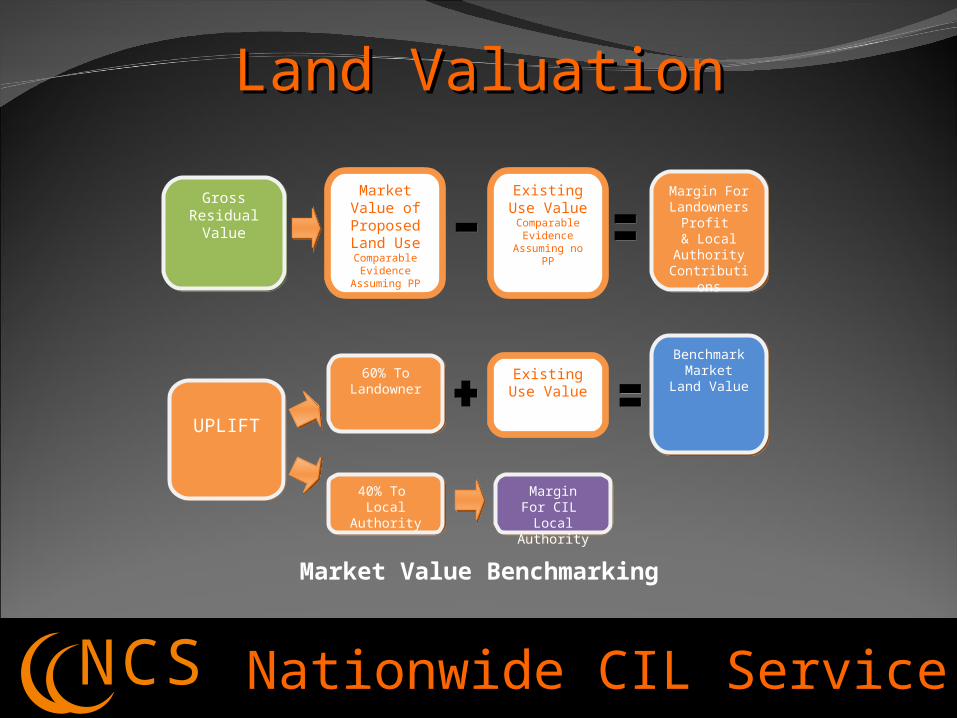
Land ValuationLand Valuation
Market Value of Proposed
Land UseComparable
Evidence Assuming PP
Gross Residual Value
Gross Residual Value
Existing Use Value
Comparable Evidence Assuming
no PP
Margin ForLandowners
Profit & Local
Authority Contributions
Margin ForLandowners
Profit & Local
Authority Contributions
60% To Landowner
60% To Landowner
40% To Local Authority
40% To Local Authority
UPLIFTUPLIFT
MarginFor CIL
Local Authority
MarginFor CIL
Local Authority
Existing Use Value
BenchmarkMarket Land
Value
BenchmarkMarket Land
Value
Market Value Benchmarking

Nationwide CIL ServiceNCS
Land Value BenchmarksLand Value Benchmarks
Residential Base Land Value Assumptions
3 Bed House Plot Value Zone 1 Zone 2 Zone 3 Zone 4 Zone 5 Greenfield to Residential 9600 10800 13200 15000 20000 Industrial to Residential 12000 13800 17200 19800 27500 Residential to Residential 16000 18000 22000 25000 40000
NCS
Commercial Land Value Assumptions
Food Retail Land Value Sqm Zone 1 Zone 2 Zone 3 Zone 4 Greenfield to Food Retail 121 151 151 181 Industrial to Food Retail 132 162 162 192 Food Retail 200 250 250 300
NCS

Nationwide CIL ServiceNCS
Viability Assessment – The ModelViability Assessment – The ModelDevelopment Value (Based on Floor Area)Eg 2000sqm Industrial Unit@ £1,100 per sqm
£2,200,000
Development Costs
Land Value £400,000
Construction Costs @ £450sqm £900,000
Abnormal Construction Costs (Optional) £0
Professional Fees (% Costs) £90,000
Legal Fees (% Value) £30,000
Statutory Fees (% Costs) £30,000
Sales & Marketing Fees (% Value) £40,000
Contingencies (% Costs) £50,000
Section 106 Contributions (Optional) £0
Finance Costs (% Costs) £100,000
Developers Profit (%Return on cost or revenue) £350,000
Total £1,990,000
Output
Gross Margin £210,000
CIL Rate (Maximum Levy per sqm) £105

Nationwide CIL ServiceNCS
Affordable Housing AssessmentAffordable Housing Assessment
Residential Viability Appraisal
DEVELOPMENT SCENARIOMixed Residential Apartments 10
BASE LAND VALUE SCENARIO Greenfield to Residential 2 bed houses 20DEVELOPMENT LOCATION (ZONE) Zone 1 3 Bed houses 40DEVELOPMENT DETAILS 0 Total Units 4 bed houses 20Affordable Proportion 30% 0 Affordable Units 5 bed house 10Affordable Mix 30%Intermediate 20%Social Rent 50% Affordable Rent Development Floorspace 6489 Sqm Market Housing 2163 Sqm Affordable HousingDevelopment Value Market Houses
7 Apartments 65sqm 2200£ per sqm £1,001,00014 2 bed houses 70sqm 2200£ per sqm £2,156,00028 3 Bed houses 88sqm 2200£ per sqm £5,420,00014 4 bed houses 115sqm 2200£ per sqm £3,542,0007 5 bed house 140sqm 2200£ per sqm £2,156,000
Intermediate Houses 60%Open Market Value
3 Apartments 65sqm 1320£ per sqm £231,6605 2 Bed house 70sqm 1320£ per sqm £415,8002 3 Bed House 88sqm 1320£ per sqm £209,088
Social Rent Houses 40%Open Market Value 2 Apartments 65sqm 880£ per sqm £102,9603 2 Bed house 70sqm 880£ per sqm £184,8001 3 Bed House 88sqm 880£ per sqm £92,928
Affordable Rent Houses 50%Open Market Value 5 Apartments 65sqm 1100£ per sqm £321,7508 2 Bed house 70sqm 1100£ per sqm £321,7502 3 Bed House 88sqm 1100£ per sqm £92,928
100 Total Units Development Value £16,702,686
NCS

Nationwide CIL ServiceNCS
Viability Testing – The ResultsViability Testing – The Results
Maximum Residential CIL Rates per sqm 25% Affordable Housing
Charging Zone/Base Land ValueMixed Residential
Development Starter Housing Apartment Block 3 Bed Houses
1 High Value
Greenfield to Residential £159 £172 -£49 £183
Industrial to Residential £138 £146 -£78 £161
Residential to Residential -£84 -£48 -£145 -£37
2 Medium Value
Greenfield to Residential £50 £65 -£140 £115
Industrial to Residential £30 £41 -£169 £90
Residential to Residential -£167 -£132 -£225 -£81
3 Low Value
Greenfield to Residential -£116 -£80 -£467 -£62
Industrial to Residential -£136 -£103 -£496 -£83
Residential to Residential -£281 -£229 -£532 -£210
NCS

Nationwide CIL ServiceNCS
Determine development floorspace projections for chargeable categories of development over the plan period
Test various rates of CIL against development projections and establish draft CIL rates
Calculate total CIL revenue from all chargeable development and compare
with the Infrastructure Funding Deficit
It will be important to demonstrate that the overall revenue raised by CIL does not exceed the level required to meet the Infrastructure Funding Deficit …….. If it does, CIL rates have been set too high. This will be the first test of examination.
CIL Revenue ProjectionCIL Revenue Projection

Nationwide CIL ServiceNCS
CIL Regulation 14 requires that a Charging Authority, in setting CIL rates:-
Must aim to strike what appears to the Charging Authority to be an appropriate balance between ‘the desirability of funding infrastructure from CIL’ ... ‘and the potential effects (taken as a whole) of the imposition of CIL on the economic viability of development across its area’
• Ensure rates are set in accordance with the Statutory Guidance(CSCSP March 2010 – Paras 34-40 on consistency of approach)
• Where the evidence indicates negative or very marginal viability, zero CIL rates may be considered
• CIL is not a policy tool. Statutory Guidance advises that rates should only be set in accordance with economic viability evidence
• Selectively favouring certain categories of development by zero rating them to encourage growth may breach State Aid rules. CIL challenges may emerge beyond Examination
CIL Rate Setting – The Appropriate BalanceCIL Rate Setting – The Appropriate Balance

Nationwide CIL ServiceNCS
CIL Charging ScheduleCIL Charging ScheduleWhen CIL Charging Zones and Proposed CIL Rates have been fixed and approved by the Authority, a Preliminary Draft Charging Schedule can be prepared for public consultation.
For a Variable Rate system the PDCS will comprise a Charging Zone Map and a table of CIL rates for each category. Additional maps and tables will be required where Charging Zones differ between Commercial and Residential uses.