national western life insurance company € € form 10-q...item 3. quantitative and qualitative...
TRANSCRIPT

UNITED STATESSECURITIES AND EXCHANGE COMMISSION
Washington, D.C. 20549
FORM 10-Q
þ QUARTERLY REPORT PURSUANT TO SECTION 13 OR 15(d) OF
THE SECURITIES EXCHANGE ACT OF 1934
For the Quarterly Period Ended March 31, 2007
o TRANSITION REPORT PURSUANT TO SECTION 13 OR 15(d) OF
THE SECURITIES EXCHANGE ACT OF 1934
For the transition period from __________ to __________
Commission File Number: 2-17039
NATIONAL WESTERN LIFE INSURANCE COMPANY(Exact name of Registrant as specified in its charter)
COLORADO 84-0467208 (State of Incorporation) (I.R.S. Employer Identification Number)
850 EAST ANDERSON LANE AUSTIN, TEXAS 78752-1602 (512) 836-1010
(Address of Principal Executive Offices) (Telephone Number)
Indicate by check mark whether the Registrant (1) has filed all reports required to be filed by Section 13 or 15(d) of the Securities Exchange Act of 1934 during the preceding 12 months (or for such shorter period that the Registrant was required to file such reports), and (2) has been subject to such filing requirements for the past 90 days: Yes þ No o Indicate by check mark whether the registrant is a large accelerated filer, an accelerated filer, or a non-accelerated filer. See definition of "accelerated filer and large accelerated file" in Rule 12b-2 of the Exchange Act. Large accelerated filer o Accelerated filer þ Non-accelerated filer o Indicate by check mark whether the registrant is a shell company (as defined in Rule 12b-2 of the Exchange Act). Yes o No þ As of May 8, 2007, the number of shares of Registrant's common stock outstanding was: Class A - 3,422,324 and Class B - 200,000.

INDEX
Page
Part I. Financial Information: 3
Item 1. Financial Statements 3
Condensed Consolidated Balance Sheets March 31, 2007 (Unaudited) and December 31, 2006 4
Condensed Consolidated Statements of Earnings For the Three Months Ended March 31, 2007 and 2006 (Unaudited) 5
Condensed Consolidated Statements of Comprehensive Income For the Three Months Ended March 31, 2007 and 2006 (Unaudited) 6
Condensed Consolidated Statements of Stockholders' Equity For the Three Months Ended March 31, 2007 and 2006 (Unaudited) 7
Condensed Consolidated Statements of Cash Flows For the Three Months Ended March 31, 2007 and 2006 (Unaudited) 8
Notes to Condensed Consolidated Financial Statements (Unaudited) 10
Item 2. Management's Discussion and Analysis of Financial Condition and Results of Operations 19
Item 3. Quantitative and Qualitative Disclosures About Market Risk 42
Item 4. Controls and Procedures 42
Part II. Other Information: 42
Item 1. Legal Proceedings 42
Item 1A. Risk Factors 42
Item 2. Unregistered Sales of Equity Securities and Use of Proceeds 43
Item 6. Exhibits 43
Signatures 44
2

Index
PART I. FINANCIAL INFORMATION
ITEM 1. FINANCIAL STATEMENTS
NATIONAL WESTERN LIFE INSURANCE COMPANY AND SUBSIDIARIES CONDENSED CONSOLIDATED BALANCE SHEETS
(In thousands) (Unaudited) March 31, December 31,
ASSETS 2007 2006 Investments:
Securities held to maturity, at amortized cost $ 3,642,261 3,603,434 Securities available for sale, at fair value 1,929,249 1,902,568 Mortgage loans, net of allowances for possible losses ($2,100) 105,389 103,325 Policy loans 87,469 86,856 Derivatives 63,815 72,012 Other long-term investments 21,991 22,822
Total investments 5,850,174 5,791,017 Cash and short-term investments 35,040 49,901 Deferred policy acquisition costs 638,088 643,964 Deferred sales inducements 94,181 93,139 Accrued investment income 63,821 64,393 Other assets 46,174 51,029 $ 6,727,478 6,693,443
Note: The condensed consolidated balance sheet at December 31, 2006, has been derived from the audited consolidated financial statements as of that date. See accompanying notes to condensed consolidated financial statements.
3

Index
NATIONAL WESTERN LIFE INSURANCE COMPANY AND SUBSIDIARIES CONDENSED CONSOLIDATED BALANCE SHEETS
(In thousands, except share amounts) (Unaudited) March 31, December 31,
LIABILITIES AND STOCKHOLDERS' EQUITY 2007 2006 LIABILITIES: Future policy benefits:
Traditional life and annuity contracts $ 139,166 138,382 Universal life and annuity contracts 5,400,023 5,395,075
Other policyholder liabilities 118,622 112,449 Federal income tax liability:
Current 4,777 1,666 Deferred 38,269 32,207
Other liabilities 72,544 80,680 Total liabilities 5,773,401 5,760,459 COMMITMENTS AND CONTINGENCIES (Note 5 and 8) STOCKHOLDERS' EQUITY: Common stock:
Class A - $1 par value; 7,500,000 shares authorized; 3,422,324 and 3,420,824 issued and outstanding in 2007 and 2006 3,422 3,421 Class B - $1 par value; 200,000 shares authorized, issued, and outstanding in 2007 and 2006 200 200
Additional paid-in capital 36,236 36,110 Accumulated other comprehensive income (loss) 758 (3,731)Retained earnings 913,461 896,984 Total stockholders' equity 954,077 932,984 $ 6,727,478 6,693,443
Note: The condensed consolidated balance sheet at December 31, 2006, has been derived from the audited consolidated financial statements as of that date. See accompanying notes to condensed consolidated financial statements.
4

Index
NATIONAL WESTERN LIFE INSURANCE COMPANY AND SUBSIDIARIES CONDENSED CONSOLIDATED STATEMENTS OF EARNINGS
For the Three Months Ended March 31, 2007 and 2006 (Unaudited)
(In thousands, except per share amounts) 2007 2006 Premiums and other revenue:
Traditional life and annuity premiums $ 4,733 3,991 Universal life and annuity contract revenues 28,796 26,956 Net investment income 77,026 98,687 Other income 3,316 5,198 Realized gains on investments 241 1,423
Total premiums and other revenue 114,112 136,255 Benefits and expenses:
Life and other policy benefits 10,974 11,442 Amortization of deferred acquisition costs 23,785 22,298 Universal life and annuity contract interest 37,433 56,048 Other operating expenses 14,116 25,374
Total benefits and expenses 86,308 115,162 Earnings before Federal income taxes 27,804 21,093 Provision (benefit) for Federal income taxes:
Current 4,314 11,487 Deferred 4,818 (4,439)
Total Federal income taxes 9,132 7,048 Net earnings $ 18,672 14,045
Basic Earnings Per Share $ 5.16 3.88
Diluted Earnings Per Share $ 5.11 3.84
See accompanying notes to condensed consolidated financial statements.
5

Index
NATIONAL WESTERN LIFE INSURANCE COMPANY AND SUBSIDIARIES CONDENSED CONSOLIDATED STATEMENTS OF COMPREHENSIVE INCOME
For the Three Months Ended March 31, 2007 and 2006 (Unaudited)
(In thousands) 2007 2006 Net earnings $ 18,672 14,045 Other comprehensive income (loss), net of effects of
deferred policy acquisition costs and taxes: Net unrealized gains (losses) on securities:
Net unrealized holding gains (losses) arising during period 4,723 (10,466)
Reclassification adjustment for gains included in net earnings (167) (892)
Amortization of net unrealized gains related to transferred securities 20 7
Net unrealized gains (losses) on securities 4,576 (11,351)
Foreign currency translation adjustments (87) 65
Other comprehensive income (loss) 4,489 (11,286)
Comprehensive income $ 23,161 2,759
See accompanying notes to condensed consolidated financial statements.
6

Index
NATIONAL WESTERN LIFE INSURANCE COMPANY AND SUBSIDIARIES CONDENSED CONSOLIDATED STATEMENTS OF STOCKHOLDERS' EQUITY
For the Three Months Ended March 31, 2007 and 2006 (Unaudited)
(In thousands) 2007 2006 Common stock:
Balance at beginning of year $ 3,621 3,613 Shares exercised under stock option plan 1 13
Balance at end of period 3,622 3,626 Additional paid-in capital:
Balance at beginning of year 36,110 37,923 Shares exercised under the stock option plan, net of tax benefits 126 491
Balance at end of period 36,236 38,414 Accumulated other comprehensive income:
Unrealized gains (losses) on securities: Balance at beginning of year 3,148 10,401 Change in unrealized gains (losses) during period 4,576 (11,351)
Balance at end of period 7,724 (950)
Foreign currency translation adjustments:
Balance at beginning of year 3,122 3,300 Change in translation adjustments during period (87) 65
Balance at end of period 3,035 3,365
Benefit plan liability adjustment:
Balance at beginning of year (10,001) (3,137)Change in benefit plan liability adjustment during period - -
Balance at end of period (10,001) (3,137)
Accumulated other comprehensive income (loss) at end of period 758 (722)
Retained earnings:
Balance at beginning of year 896,984 821,908 Cumulative effect of change in accounting principle, net of tax (2,195) - Net earnings 18,672 14,045
Balance at end of period 913,461 835,953
Repurchase of common stock - (1,210)
Total stockholders' equity $ 954,077 876,061
See accompanying notes to condensed consolidated financial statements.
7

Index
NATIONAL WESTERN LIFE INSURANCE COMPANY AND SUBSIDIARIES CONDENSED CONSOLIDATED STATEMENTS OF CASH FLOWS
For the Three Months Ended March 31, 2007 and 2006 (Unaudited)
(In thousands) 2007 2006 Cash flows from operating activities:
Net earnings $ 18,672 14,045 Adjustments to reconcile net earnings to net cash from operating activities:
Universal life and annuity contract interest 37,434 56,048 Surrender charges and other policy revenues (8,600) (8,760)
Realized gains on investments (236) (1,423)
Accrual and amortization of investment income (996) (1,564)
Depreciation and amortization 356 385 (Increase) decrease in value of derivatives 8,590 (16,014)
Increase in deferred policy acquisition and sales inducement costs (1,290) (296)
(Increase) decrease in accrued investment income 610 (1,588)
(Increase) decrease in other assets 5,580 (4,798)
Increase in liabilities for future policy benefits 784 106 Increase in other policyholder liabilities 6,173 8,335 Increase in Federal income tax liability 7,788 6,359 Increase (decrease) in other liabilities (10,547) 15,570 Other (1,750) 769
Net cash provided by operating activities 62,568 67,174 Cash flows from investing activities:
Proceeds from sales of: Securities held to maturity 5,175 - Securities available for sale 234 9,409 Other investments 171 1,865
Proceeds from maturities and redemptions of: Securities held to maturity 28,571 24,736 Securities available for sale 78,592 18,127 Derivatives 8,570 6,849
Purchases of: Securities held to maturity (71,837) (85,278)
Securities available for sale (87,912) (48,922)
Other investments (9,576) (6,502)
Principal payments on mortgage loans 13,912 5,773 Cost of mortgage loans acquired (16,066) (1,733)
Decrease in policy loans (613) 109 Other (938) (461)
Net cash used in investing activities (51,717) (76,028)
(Continued on next page)
8

Index
NATIONAL WESTERN LIFE INSURANCE COMPANY AND SUBSIDIARIES CONDENSED CONSOLIDATED STATEMENTS OF CASH FLOWS, CONTINUED
For the Three Months Ended March 31, 2007 and 2006 (Unaudited)
(In thousands) 2007 2006 Cash flows from financing activities:
Deposits to account balances for universal life and annuity contracts $ 111,937 127,625
Return of account balances on universal life and annuity contracts (137,622) (132,621)
Issuance of common stock under stock option plan 127 295 Repurchases of common stock - (1,210)
Net cash used in financing activities (25,556) (5,911)
Effect of foreign exchange (156) 222 Net decrease in cash and short-term investments (14,861) (14,543)Cash and short-term investments at beginning of year 49,901 31,355 Cash and short-term investments at end of period $ 35,040 16,812
SUPPLEMENTAL DISCLOSURES OF CASH FLOW INFORMATION: Cash paid during the first quarter for:
Interest $ 10 10 Income taxes 1,254 -
See accompanying notes to condensed consolidated financial statements.
9

NATIONAL WESTERN LIFE INSURANCE COMPANY AND SUBSIDIARIES
NOTES TO CONDENSED CONSOLIDATED FINANCIAL STATEMENTS(Unaudited)
(1) CONSOLIDATION AND BASIS OF PRESENTATION
The accompanying unaudited condensed consolidated financial statements have been prepared in accordance with U.S. generally accepted accounting principles ("GAAP") for interim financial information and the instructions to Form 10-Q and Article 10 of Regulation S-X. Accordingly, they do not include all of the information and footnotes required by GAAP for annual financial statements. In the opinion of management, the accompanying condensed consolidated financial statements contain all adjustments necessary to present fairly the financial position of the Company as of March 31, 2007, and the results of its operations and its cash flows for the three months ended March 31, 2007 and 2006. The results of operations for the three months ended March 31, 2007 and 2006 are not necessarily indicative of the results to be expected for the full year. For further information, refer to the consolidated financial statements and notes included in the Company's Annual Report on Form 10-K for the year ended December 31, 2006 accessible free of charge through the Company's internet site at www.nationalwesternlife.com or the Securities and Exchange Commission internet site at www.sec.gov. The accompanying condensed consolidated financial statements include the accounts of National Western Life Insurance Company and its wholly-owned subsidiaries ("Company"), The Westcap Corporation, NWL Investments, Inc., NWL Services, Inc., and NWL Financial, Inc. All significant intercorporate transactions and accounts have been eliminated in consolidation. Certain reclassifications have been made to the prior periods to conform to the reporting categories used in 2007. (2) CHANGES IN ACCOUNTING PRINCIPLES
In September 2005, the AICPA issued Statement of Position 05-1, Accounting by Insurance Enterprises for Deferred Acquisition Costs in Connection with Modifications or Exchanges of Insurance Contracts ("SOP 05-1") which is effective for internal replacements occurring in fiscal years beginning after December 15, 2006. SOP 05-1 provides guidance on accounting by insurance enterprises for deferred acquisition costs on internal replacements of insurance and investment contracts other than those specifically described in FASB No. 97. SOP 05-1 defines an internal replacement as a modification in product benefits, features, rights, or coverages that occurs by the exchange of a contract for a new contract, or by amendment, endorsement, or rider to a contract, or by the election of a feature or coverage within a contract. The Company has an impact related to the adoption of SOP 05-1 for contracts which have annuitized and relative to reinstatements of contracts in that the unamortized deferred acquisition costs and deferred sales inducement assets must be written-off at the time of annuitization and may not be continued related to reinstatements. SOP 05-1 results in changes in assumptions relative to estimated gross profits which affects unamortized deferred acquisition costs, unearned revenue liabilities, and deferred sales inducement balances as of the beginning of the year. The effect of this SOP on beginning retained earnings as of January 1, 2007 was a decrease of $2.2 million, net of tax, as detailed below.
Index
Amounts (In thousand) Write-off of deferred acquisition cost $ 3,321 Adjustment to deferred annuity revenue 56 3,377 Federal income tax (1,182)
Cumulative effect of change in accounting for internal replacements and investment contracts $ 2,195
10

The FASB issued Interpretation No. 48, Accounting for Uncertainty in Income Taxes, an interpretation of FASB Statement No. 109 ("FIN 48"), dated June, 2006. The interpretation requires public companies to recognize the tax benefits of uncertain tax positions only where the position is "more likely than not" to be sustained assuming examination by tax authorities. The amount recognized would be the amount that represents the largest amount of tax benefit that is greater than 50% likely of being ultimately realized. A liability would be recognized for any benefit claimed, or expected to be claimed, in a tax return in excess of the benefit recorded in the financial statements, along with any interest and penalty (if applicable) on the excess. FIN 48 requires a tabular reconciliation of the change in the aggregate unrecognized tax benefits claimed, or expected to be claimed, in tax returns and disclosure relating to accrued interest and penalties for unrecognized tax benefits. Discussion is required for those uncertain tax positions where it is reasonably possible that the estimate of the tax benefit will change significantly in the next 12 months. FIN 48 is effective for fiscal years beginning after December 15, 2006. The adoption of FIN 48 did not have a material impact on the Company's consolidated financial statements. On February 16, 2006, the FASB issued SFAS No. 155, Accounting for Certain Hybrid Financial Instruments, which amends SFAS No. 133, Accounting for Derivatives and Hedging Activities, and SFAS No. 140, Accounting for Transfers and Servicing of Financial Assets and Extinguishments of Liabilities. Hybrid financial instruments are single financial instruments that contain an embedded derivative. Under SFAS No. 155, entities can elect to record certain hybrid financial instruments at fair value as individual financial instruments. Prior to this amendment, certain hybrid financial instruments were required to be separated into two instruments - a derivative and host - and generally only the derivative was recorded at fair value. SFAS No. 155 also requires that beneficial interests in securitized assets be evaluated for either freestanding or embedded derivatives. SFAS No. 155 is effective for all financial instruments acquired or issued after January 1, 2007. SFAS No. 155 did not have a material effect on the Company's consolidated financial statements on the date of adoption. In September 2006, the FASB issued SFAS No. 157, Fair Value Measurements. This Statement defines fair value, establishes a framework for measuring fair value in generally accepted accounting principles, and requires additional disclosures about fair value measurements. This Statement does not require any new fair value measurements, but the application of this Statement could change current practices in determining fair value. The Company plans to adopt this guidance effective January 1, 2008. The Company is currently assessing the impact of SFAS No. 157 on the Company's consolidated financial position and results of operations. (3) STOCKHOLDERS' EQUITY The Company is restricted by state insurance laws as to dividend amounts which may be paid to stockholders without prior approval from the Colorado Division of Insurance. The Company paid no cash dividends on common stock during the three months ended March 31, 2007 and 2006, as it generally follows a policy of retaining any earnings in order to finance the development of business and to meet regulatory requirements for capital. In February of 2007, the FASB issued SFAS No. 159, The Fair Value Option for Financial Assets and Financial Liabilities. This Statement permits entities to choose to measure many financial instruments and certain other items at fair value. SFAS No. 159 is effective for fiscal years beginning after November 15, 2007. The Company is currently assessing the impact of SFAS No. 159.
Index
11

(4) EARNINGS PER SHARE Basic earnings per share of common stock are computed by dividing net income by the weighted-average basic common shares outstanding during the period. Diluted earnings per share assumes the issuance of common shares applicable to stock options in the denominator.
(5) PENSION AND OTHER POSTRETIREMENT PLANS (A) Defined Benefit Pension Plans The Company sponsors a qualified defined benefit pension plan covering substantially all employees. The plan provides benefits based on the participants' years of service and compensation. The Company makes annual contributions to the plan that complies with the minimum funding provisions of the Employee Retirement Income Security Act of 1974 ("ERISA"). The following summarizes the components of net periodic benefit cost.
The Company expects to contribute $1.8 million to the plan in 2007. As of March 31, 2007, the Company has contributed $0.3 million to the plan.
Index
2007 2006 Numerator for basic and diluted earnings per share:
Earnings available to common stockholders before and after assumed conversions $ 18,672 14,045
Denominator:
Basic earnings per share - weighted-average shares 3,621 3,618
Effect of dilutive stock options 35 37
Diluted earnings per share - adjusted weighted-average shares for assumed conversions 3,656 3,655
Basic earnings per share $ 5.16 3.88
Diluted earnings per share $ 5.11 3.84
Three Months Ended March 31, 2007 2006 (In thousands) Service cost $ 173 171 Interest cost 255 244 Expected return on plan assets (237) (228)
Amortization of prior service cost 1 1 Amortization of net loss 88 83 Net periodic benefit cost $ 280 271
12

The Company also sponsors a non-qualified defined benefit plan primarily for senior officers. The plan provides benefits based on the participants' years of service and compensation. The pension obligations and administrative responsibilities of the plan are maintained by a pension administration firm, which is a subsidiary of American National Insurance Company ("ANICO"). ANICO has guaranteed the payment of pension obligations under the plan. However, the Company has a contingent liability with respect to the pension plan should these entities be unable to meet their obligations under the existing agreements. Also, the Company has a contingent liability with respect to the plan in the event that a plan participant continues employment with the Company beyond age seventy, the aggregate average annual participant salary increases exceed 10% per year, or any additional employees become eligible to participate in the plan. If any of these conditions are met, the Company would be responsible for any additional pension obligations resulting from these items. Amendments were made to the plan to allow an additional employee to participate and to change the benefit formula for the Chairman of the Company. As previously mentioned, these additional obligations are a liability to the Company. Effective December 31, 2004, this plan was frozen with respect to the continued accrual of benefits of the Chairman and the President of the Company in order to comply with law changes under the American Jobs Creation Act of 2004 ("Act"). Effective July 1, 2005, the Company established a second non-qualified defined benefit plan for the benefit of the Chairman of the Company. This plan is intended to provide for post-2004 benefit accruals that mirror and supplement the pre-2005 benefit accruals under the previously discussed non-qualified plan, while complying with the requirements of the Act. Effective November 1, 2005, the Company established a third non-qualified defined benefit plan for the benefit of the President of the Company. This plan is intended to provide for post-2004 benefit accruals that supplement the pre-2005 benefit accruals under the first non-qualified plan as previously discussed, while complying with the requirements of the Act. The following summarizes the components of net periodic benefit costs for these non-qualified plans.
The Company expects to contribute $1.5 million to these plans in 2007. As of March 31, 2007, the Company has contributed $0.3 million to the plan. (B) Defined Benefit Postretirement Plans The Company sponsors two healthcare plans to provide postretirement benefits to certain fully-vested individuals. The following summarizes the components of net periodic benefit costs.
Index
Three Months Ended March 31, 2007 2006 (In thousands) Service cost $ 407 324 Interest cost 177 73 Amortization of prior service cost 260 162 Amortization of net loss 46 - Net periodic benefit cost $ 890 559
Three Months Ended March 31, 2007 2006 (In thousands) Interest cost $ 29 25 Amortization of prior service cost 26 26 Net periodic benefit cost $ 55 51
13

As previously disclosed in its financial statements for the year ended December 31, 2006, the Company expects to contribute minimal amounts to the plan in 2007.
(6) SEGMENT AND OTHER OPERATING INFORMATION
Under Statement of Financial Accounting Standards ("SFAS") No. 131, Disclosures About Segments of an Enterprise and Related Information, the Company defines its reportable operating segments as domestic life insurance, international life insurance, and annuities. These segments are organized based on product types and geographic marketing areas. A summary of segment information for the quarters ended March 31, 2007 and 2006 is provided below.
Index
Selected Segment Information: Domestic International Life Life All Insurance Insurance Annuities Others Totals (In thousands) March 31, 2007: Selected Balance Sheet Items: Deferred policy acquisition
costs and sales inducements $ 52,491 180,409 499,369 - 732,269 Total segment assets 388,103 723,250 5,487,541 103,794 6,702,688 Future policy benefits 316,880 509,015 4,713,294 - 5,539,189 Other policyholder liabilities 10,812 18,605 89,205 - 118,622 Three Months Ended March 31, 2007: Condensed Income Statements: Premiums and contract
revenues $ 6,333 21,671 5,525 - 33,529 Net investment income 4,678 5,762 65,753 833 77,026 Other income 14 45 228 3,029 3,316
Total revenues 11,025 27,478 71,506 3,862 113,871 Policy benefits 6,141 3,677 1,156 - 10,974 Amortization of deferred
acquisition costs 1,864 8,163 13,758 - 23,785 Universal life and investment
annuity contract interest 2,320 5,252 29,861 - 37,433 Other operating expenses 2,712 4,310 4,481 2,613 14,116 Federal income taxes (660) 1,995 7,303 410 9,048
Total expenses 12,377 23,397 56,559 3,023 95,356 Segment earnings (losses) $ (1,352) 4,081 14,947 839 18,515
14

Reconciliations of segment information to the Company's condensed consolidated financial statements are provided below.
Index
Domestic International Life Life All Insurance Insurance Annuities Others Totals (In thousands) March 31, 2006: Selected Balance Sheet Items: Deferred policy acquisition
costs and sales inducements $ 46,656 170,959 504,707 - 722,322 Total segment assets 372,095 653,254 5,303,082 96,410 6,424,841 Future policy benefits 310,572 456,038 4,594,157 - 5,360,767 Other policyholder liabilities 11,786 18,357 78,749 - 108,892 Three Months Ended March 31, 2006: Condensed Income Statements: Premiums and contract
revenues $ 5,834 19,384 5,729 - 30,947 Net investment income 5,196 7,014 85,998 479 98,687 Other income 8 23 2,707 2,460 5,198
Total revenues 11,038 26,421 94,434 2,939 134,832 Policy benefits 4,954 5,381 1,107 - 11,442 Amortization of deferred
acquisition costs 1,401 4,941 15,956 - 22,298 Universal life and investment
annuity contract interest 2,270 5,941 47,837 - 56,048 Other operating expenses 5,262 8,118 9,761 2,233 25,374 Federal income taxes (949) 680 6,584 235 6,550
Total expenses 12,938 25,061 81,245 2,468 121,712 Segment earnings (losses) $ (1,900) 1,360 13,189 471 13,120
Three Months Ended March 31, 2007 2006 (In thousands) Premiums and Other Revenue: Premiums and contract revenues $ 33,529 30,947 Net investment income 77,026 98,687 Other income 3,316 5,198 Realized gains on investments 241 1,423 Total consolidated premiums and other revenue $ 114,112 136,255
15
(7) SHARE-BASED PAYMENTS The Company has a stock and incentive plan ("Plan") which provides for the grant of any or all of the following types of awards to eligible employees: (1) stock options, including incentive stock options and nonqualified stock options; (2) stock appreciation rights, in tandem with stock options or freestanding; (3) restricted stock; (4) incentive awards; and (5) performance awards. The Plan began on April 21, 1995, and was to terminate on April 20, 2005, unless terminated earlier by the Board of Directors. The Plan was amended on June 25, 2004 to extend the termination date to April 20, 2010. The number of shares of Class A, $1.00 par value, common stock which may be issued under the Plan, or as to which stock appreciation rights or other awards may be granted, may not exceed 300,000. These shares may be authorized and unissued shares. The Company has only issued nonqualified stock options. All of the employees of the Company and its subsidiaries are eligible to participate in the Plan. In addition, directors of the Company, other than Compensation and Stock Option Committee members, are eligible for restricted stock awards, incentive awards, and performance awards. Company directors, including members of the Compensation and Stock Option Committee, are eligible for nondiscretionary stock options. The directors' stock options vest 20% annually following one full year of service to the Company from the date of grant. The officers' stock options vest 20% annually following three full years of service to the Company from the date of grant. Options issued expire after ten years. No awards were issued in 2007 or 2006.
Index
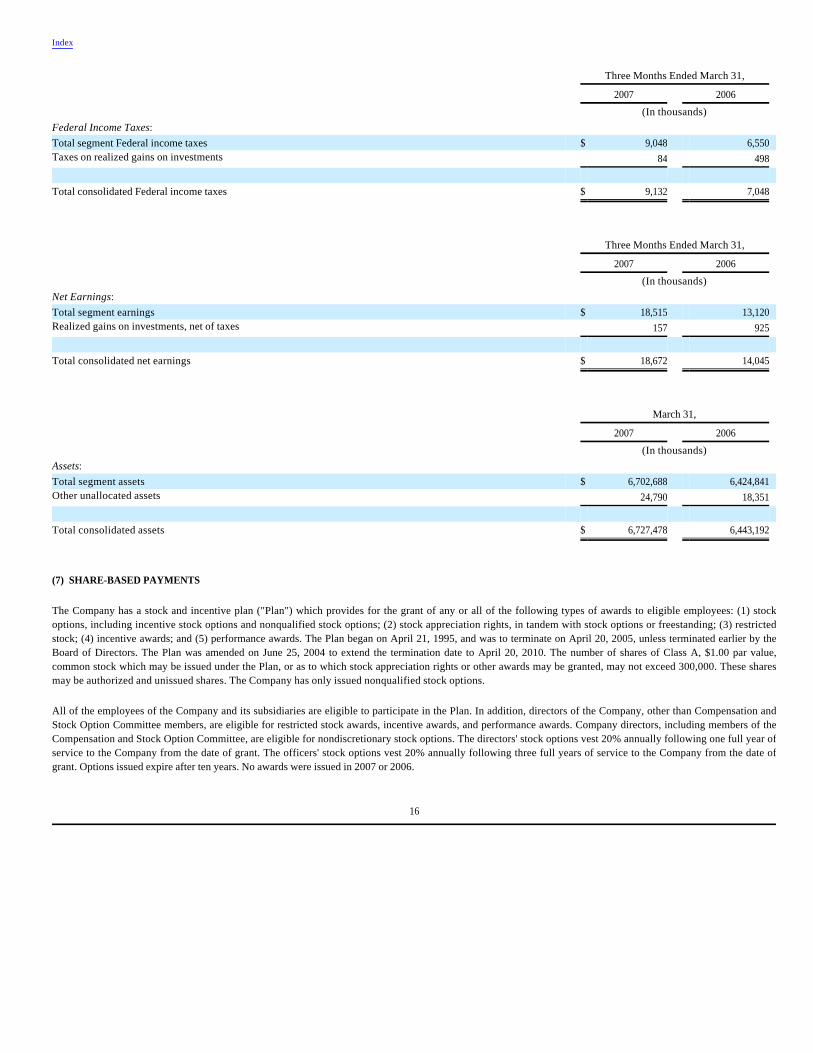
Three Months Ended March 31, 2007 2006 (In thousands) Federal Income Taxes: Total segment Federal income taxes $ 9,048 6,550 Taxes on realized gains on investments 84 498 Total consolidated Federal income taxes $ 9,132 7,048
Three Months Ended March 31, 2007 2006 (In thousands) Net Earnings: Total segment earnings $ 18,515 13,120 Realized gains on investments, net of taxes 157 925 Total consolidated net earnings $ 18,672 14,045
March 31, 2007 2006 (In thousands) Assets: Total segment assets $ 6,702,688 6,424,841 Other unallocated assets 24,790 18,351 Total consolidated assets $ 6,727,478 6,443,192
16

Through December 31, 2005, the Company classified the Plan as equity awards, and as such, utilized the grant date fair value method to measure compensation. Effective March 10, 2006, as more fully described below, the Company's Plan classification was changed to liability and accordingly, the Company began using the current fair value method to measure compensation cost. A summary of shares available for grant and stock option activity is detailed below.
The total intrinsic value of options exercised was $2.4 million and $1.9 million for the three months ended March 31, 2007 and 2006, respectively. The total share-based liabilities paid were $2.2 million for the three months ended March 31, 2007. The total fair value of shares vested during the three months ended March 31, 2007 was $0.3 million. The following table summarizes information about stock options outstanding at March 31, 2007.
The aggregate intrinsic value in the table above is based on the closing stock price of $244.80 per share on March 31, 2007.
Index
Options Outstanding Weighted- Shares Average Available Exercise For Grant Shares Price Balance at January 1, 2007 26,477 128,465 $ 123.00 Stock Options:
Exercised - (17,020) 100.38 Forfeited 1,110 (1,110) 131.23
Balance at March 31, 2007 27,587 110,335 $ 126.40
Options Outstanding Weighted- Average Number Remaining Options Outstanding Contractual Life Exercisable Exercise prices: $ 85.13 81 0.1 years 81 105.25 9,130 1.0 years 9,130 112.38 6,800 1.2 years 6,800 92.13 26,574 4.1 years 12,198 95.00 7,200 4.2 years 7,200 150.00 60,550 7.1 years 3,800 Totals 110,335 39,209 Aggregate intrinsic value (in thousands) $ 13,064 $ 5,488
17

In estimating the fair value of the options outstanding at March 31, 2007 and 2006, the Company employed the Black-Scholes option pricing model with assumptions as detailed below.
The Company reviewed the contractual term relative to the options as well as perceived future behavior patterns of exercise. Volatility is based on historical volatility over the expected term. The pre-tax compensation cost recognized in the financial statements related to the Plan was $1.3 million and $12.5 million for the three months ended March 31, 2007 and 2006, respectively. The related tax benefit recognized was $0.4 million and $4.4 million for the three months ended March 31, 2007 and 2006, respectively. Effective March 10, 2006, the Company adopted and implemented a limited stock buy-back program which provides option holders the additional alternative of selling shares acquired through the exercise of options directly back to the Company. Option holders may elect to sell such acquired shares back to the Company at any time within ninety (90) days after the exercise of options at the prevailing market price as of the date of notice of election. The buy-back program did not alter the terms and conditions of the Plan, however the program necessitated a change in accounting from the equity classification to the liability classification. The modification affected 35 plan participants who had options outstanding on the date of modification and resulted in $11.7 million of total incremental pre-tax compensation cost due to the change from the equity to liability classification. As of March 31, 2007, the total compensation cost related to nonvested options not yet recognized was $0.3 million. This amount is expected to be recognized over a weighted-average period of 2 years. The Company recognizes compensation cost over the graded vesting periods. For the three months ended March 31, 2007 and 2006, the total cash received from the exercise of options under the Plan was $0.1 million and $0.2 million, respectively.
(8) LEGAL PROCEEDINGS
In the course of an audit of a charitable tax-exempt foundation, the Internal Revenue Service (“IRS”) raised an issue under the special provisions of the Internal Revenue Code (“IRC”) governing tax-exempt private foundations as to certain interest-bearing loans from the Company to another corporation in which the tax-exempt foundation owns stock. The issue is whether such transactions constitute indirect self-dealing by the foundation, the result of which would be excise taxes on the Company by virtue of its participation in such transactions. By letter to the Company dated August 21, 2003, the IRS proposed an initial excise tax liability in the total amount approximating one million dollars as a result of such transactions. The Company disagrees with the IRS analysis. The Company is contesting the matter and expects to prevail on the merits. On October 14, 2003, in response to the IRS letter, the Company requested that this issue instead be referred to the IRS National Office for technical advice. The IRS audit team agreed and the matter was referred in November of 2003 to the IRS National Office. Such technical advice has now been issued by the IRS National Office in the form of a memorandum analyzing the issue which concludes that such loans do not constitute indirect self-dealing. This technical advice memorandum is binding on the IRS audit team. The Company is a defendant in three class action lawsuits, and one class has been certified regarding an alleged violation of section 17200 of the California Business and Professions Code. Management believes that the Company has good and meritorious defenses and intends to continue to vigorously defend itself against these claims.
Index
2007 2006 Expected term of options 2 to 6 years 2 to 6 years Expected volatility:
Range 15.63% to 23.72% 17.36% to 24.28%
Weighted-average 19.36% 20.09%
Expected dividends - - Risk-free rate:
Range 4.57% to 4.95% 4.99% to 5.06%
Weighted-average 4.67% 5.02%
18

The Company is involved or may become involved in various other legal actions, in the normal course of business, in which claims for alleged economic and punitive damages have been or may be asserted, some for substantial amounts. Although there can be no assurances, at the present time, the Company does not anticipate that the ultimate liability arising from potential, pending, or threatened legal actions, will have a material adverse effect on the financial condition or operating results of the Company.
ITEM 2. MANAGEMENT'S DISCUSSION AND ANALYSISOF FINANCIAL CONDITION AND RESULTS OF OPERATIONS
FORWARD-LOOKING STATEMENTS
The Private Securities Litigation Reform Act of 1995 provides a "safe harbor" for forward-looking statements. Certain information contained herein or in other written or oral statements made by or on behalf of National Western Life Insurance Company or its subsidiaries is or may be viewed as forward-looking. Although the Company has used appropriate care in developing any such information, forward-looking information involves risks and uncertainties that could significantly impact actual results. These risks and uncertainties include, but are not limited to, matters described in the Company's filings with the Securities and Exchange Commission ("SEC") such as exposure to market risks, anticipated cash flows or operating performance, future capital needs, and statutory or regulatory related issues. However National Western, as a matter of policy, does not make any specific projections as to future earnings, nor does it endorse any projections regarding future performance that may be made by others. Whether or not actual results differ materially from forward-looking statements may depend on numerous foreseeable and unforeseeable events or developments. Also, the Company undertakes no obligation to publicly update or revise any forward-looking statements, whether as a result of new information, future developments, or otherwise. OVERVIEW
Insurance Operations - Domestic
The Company is currently licensed to do business in all states except for New York. Products marketed are annuities, universal life insurance, equity-indexed annuities and universal life, and traditional life insurance, which include both term and whole life products. The Company’s domestic sales have historically been more heavily weighted toward annuity products, which include single and flexible premium deferred annuities, single premium immediate annuities, and equity-indexed annuities. Most of these annuities can be sold as tax qualified or nonqualified products. At March 31, 2007, the Company maintained approximately 123,000 annuity policies in force. National Western markets and distributes its domestic products primarily through independent national marketing organizations ("NMOs"). These NMOs assist the Company in recruiting, contracting, and managing independent agents. The Company currently has approximately 9,100 independent agents contracted. Roughly 19% of these contracted agents have submitted policy applications to the Company in the past twelve months.
Insurance Operations - International
The Company's international operations focus on foreign nationals in upper socioeconomic classes. Insurance products are issued primarily to residents of countries in Central and South America, the Caribbean, Eastern Europe, Asia and the Pacific Rim. Issuing policies to residents of countries in these different regions provides diversification that helps to minimize large fluctuations that could arise due to various economic, political, and competitive pressures that may occur from one country to another. Products issued to international residents are almost entirely universal life and traditional life insurance products. However, certain annuity and investment contracts are also available. At March 31, 2007, the Company had approximately 68,900 international life insurance policies in force representing approximately $13.4 billion in face amount of coverage. International applications are submitted by independent contractor consultants and broker-agents. The Company has approximately 4,300 independent international consultants and brokers currently contracted, 45% of which have submitted policy applications to the Company in the past twelve months.
Index
19

There are some inherent risks of accepting international applications which are not present within the domestic market that are reduced substantially by the Company in several ways. As previously described, the Company accepts applications from foreign nationals in upper socioeconomic classes who have substantial financial resources. This targeted customer base coupled with the Company's conservative underwriting practices have historically resulted in claims experience, due to natural causes, similar to that in the United States. The Company minimizes exposure to foreign currency risks by requiring payment of premiums, claims and other benefits almost entirely in United States dollars. Finally, the Company's nearly forty years of experience with the international products and its longstanding independent consultant and broker-agents relationships further serve to minimize risks. SALES
Life Insurance
The following table sets forth information regarding the Company's life insurance sales activity as measured by annualized first year premiums. While the figures shown below are in accordance with industry practice and represent the amount of new business sold during the periods indicated, they are considered a non-GAAP financial measure. The Company believes sales are a measure of distribution productivity and are a leading indicator of future revenue trends. However, revenues are driven by sales in prior periods as well as in the current period and therefore, a reconciliation of sales to revenues is not meaningful or determinable.
Life insurance sales as measured by annualized first year premiums increased 18% in the first quarter of 2007 as compared to the first quarter of 2006. Both of the Company's life lines of business, international and domestic, posted increases over the comparable results in the first quarter of 2006 with international sales up 12% and domestic sales 60% greater.
Index
Three Months Ended March 31,
2007 2006
(In thousands) International:
Universal life $ 1,644 1,906 Traditional life 1,727 1,219 Equity-indexed life 4,727 4,135
8,098 7,260 Domestic:
Universal life 373 695 Traditional life 75 64 Equity-indexed life 1,422 408
1,870 1,167 Totals $ 9,968 8,427
20

Company management has placed considerable emphasis on building domestic life insurance sales as a strategic focus and in response to comments from outside rating agencies reviewing the Company. Domestic operations have generally focused more heavily on annuity sales than on life insurance sales. The Company spent the greater part of 2003 and 2004 revamping its domestic life operations by changing the way it contracts distribution for life business, eliminating products and distribution that have not contributed significantly to earnings, and creating new and competitive products. A single premium universal life ("SPUL") product was launched at the end of 2003 beginning a diversification of the Company's product portfolio away from smaller dollar face amount policies. The Company released its first equity-indexed universal life ("EIUL") product for its domestic markets at the end of the third quarter of 2005 and began receiving applications. This product accounted for 76% of domestic life insurance sales in the first three months of 2007 and management anticipates this share to continue throughout the remainder of the year. With the introduction of the EIUL and SPUL products and the discontinued marketing of smaller premium and volume life insurance policies, the Company has seen an increase in the average amount of per policy coverage purchased in its domestic markets as shown in the following table:
The Company's international life business consists of applications submitted from residents in various regions outside of the United States, the volume of which typically varies based upon changes in the socioeconomic climates of these regions. Historically, the Company has experienced a simultaneous combination of rising and declining sales in various countries; however, the appeal of the Company's dollar-denominated life insurance products overcomes many of the local and national difficulties. Applications submitted from residents of Latin America and the Pacific Rim perennially have comprised the majority of the Company's international life insurance sales. Over the past few years, effort has been directed toward the sale of a traditional endowment form of life insurance product for residents of Eastern European and the Commonwealth of Independent States (former Soviet Union). More recently, the Company's universal life product offerings have been made available to residents of these countries. While business is still be in a formative phase, sales from these countries have gradually become a larger percentage of overall international sales as shown below.
Year-to-date, the Company has recorded sales to residents outside of the United States in over thirty different countries with Brazil (27%), Taiwan (18%), and Kazakhstan (13%) making up the largest markets.
Index
Average New Policy Face Amount Domestic International Year ended December 31, 2003 $ 76,100 219,600 Year ended December 31, 2004 101,700 234,500 Year ended December 31, 2005 137,900 245,900 Year ended December 31, 2006 315,800 254,700 Three months ended March 31, 2007 353,200 217,600
Three Months Ended March 31, 2007 2006 Percentage of International Sales:
Latin America 60.6% 70.4%
Pacific Rim 18.6 14.6 Eastern Europe 20.8 15.0
Totals 100.0% 100.0%
21

The table below sets forth information regarding the Company's life insurance in force for each date presented.
Annuities
The following table sets forth information regarding the Company's annuity sales activity as measured by single and annualized first year premiums. Similar to life insurance sales, these figures are considered a non-GAAP financial measure but are shown in accordance with industry practice and depict the Company's sales productivity.
Annuity sales for the first three months of 2007 were 11% lower than the comparable period in 2006 continuing a trend that began in the first quarter of 2004. Annuity sales in the first quarter of 2004 represented the tail end of the increase in fixed annuity sales that began in 2003 when the Company achieved nearly $1.2 billion in sales. Annuity sales began trending lower due to a combination of declining interest rates, investors returning to alternative investment vehicles and the Company managing its targeted levels of risk and statutory capital and surplus. During the past couple of years interest rate levels have experienced an infrequent occurrence where the yield curve is inverted, that is, longer term interest rate levels were below shorter term interest rate levels. In such an environment, consumers opt for short term investment vehicles such as bank certificates of deposits rather than longer term choices which include fixed rate annuities. The Company's mix of annuity sales has shifted the past few years. With a stronger performance in the equity market, sales of equity-indexed annuity products became more prevalent beginning in 2004 and have continued thus far in 2007. Over the past several years sales of equity-indexed products have consistently accounted for more than one-half of all annuity sales and were 70% in the first quarter of 2007. For all equity-indexed products, the Company purchases over the counter options to fully hedge the equity return feature. The options are purchased relative to the issuance of the annuity contracts in such a manner to minimize timing risk. Generally, the index return during the indexing period (if the underlying index increases), less any asset fees and participation rate limits, is credited to the contract holders electing the equity feature at the beginning of the contract year. The Company does not deliberately mismatch or under hedge for the equity feature of these products.
Index
Insurance In Force as of March 31,
2007 2006
($ in thousands) Universal life:
Number of policies 75,550 78,920 Face amounts $ 8,007,830 8,077,810
Traditional life:
Number of policies 52,880 54,490 Face amounts $ 1,756,000 1,736,000
Equity-indexed life:
Number of policies 20,630 16,520 Face amounts $ 4,519,930 3,411,650
Rider face amounts $ 1,817,290 1,603,430 Total life insurance:
Number of policies 149,060 149,930 Face amounts $ 16,101,050 14,828,890
Three Months Ended March 31, 2007 2006 (In thousands) Equity-indexed annuities $ 68,684 59,522 Other deferred annuities 27,657 46,693 Immediate annuities 1,722 4,079 Total $ 98,063 110,294
22

The sizable increase in annuity sales volume the past several years has required a greater level of asset/liability analysis. The Company monitors its asset/liability matching within the self-constraints of desired capital levels. Despite the amounts of new business, the company's capital level remains substantially above industry averages and regulator targets. The following table sets forth information regarding annuities in force for each date presented.
Critical Accounting Estimates Accounting policies discussed below are those considered critical to an understanding of the Company's financial statements.
Impairment of Investment Securities. The Company's accounting policy requires that a decline in the value of a security below its amortized cost basis be evaluated to determine if the decline is other-than-temporary. The primary factors considered in evaluating whether a decline in value for fixed income and equity securities is other-than-temporary include: (a) the length of time and the extent to which the fair value has been less than cost, (b) the financial conditions and near-term prospects of the issuer, (c) whether the debtor is current on contractually obligated principal and interest payments, and (d) the intent and ability of the Company to retain the investment for a period of time sufficient to allow for any anticipated recovery. In addition, certain securitized financial assets with contractual cash flows are evaluated periodically by the Company to update the estimated cash flows over the life of the security. If the Company determines that the fair value of the securitized financial asset is less than its carrying amount and there has been a decrease in the present value of the estimated cash flows since the previous estimate, then an other-than-temporary impairment charge is recognized. When a security is deemed to be impaired a charge is recorded as net realized losses equal to the difference between the fair value and amortized cost basis of the security. Once an impairment charge has been recorded, the fair value of the impaired investment becomes its new cost basis and the Company continues to review the other-than-temporarily impaired security for appropriate valuation on an ongoing basis. Under U.S. generally accepted accounting principles, the Company is not permitted to increase the basis of impaired securities for subsequent recoveries in value.
Index
Annuities in Force as of March 31, 2007 2006 ($ in thousand) Equity-indexed annuities
Number of policies 31,000 27,730 GAAP annuity reserves $ 1,834,094 1,624,965
Other deferred annuities
Number of policies 79,020 83,250 GAAP annuity reserves $ 2,627,803 2,719,428
Immediate annuities
Number of policies 12,990 12,450 GAAP annuity reserves $ 248,420 246,786
Total annuities
Number of policies 123,010 123,430 GAAP annuity reserves $ 4,710,317 4,591,179
23

Deferred Policy Acquisition Costs ("DAC"). The Company is required to defer certain policy acquisition costs and amortize them over future periods. These costs include commissions and certain other expenses that vary with and are primarily associated with acquiring new business. The deferred costs are recorded as an asset commonly referred to as deferred policy acquisition costs. The DAC asset balance is subsequently charged to income over the lives of the underlying contracts in relation to the anticipated emergence of revenue or profits. Actual revenue or profits can vary from Company estimates resulting in increases or decreases in the rate of amortization. The Company regularly evaluates to determine if actual experience or other evidence suggests that earlier estimates should be revised. Assumptions considered significant include surrender and lapse rates, mortality, expense levels, investment performance, and estimated interest spread. Should actual experience dictate that the Company change its assumptions regarding the emergence of future revenues or profits (commonly referred to as "unlocking"), the Company would record a charge or credit to bring its DAC balance to the level it would have been if using the new assumptions from the inception date of each policy. DAC is also subject to periodic recoverability and loss recognition testing. These tests ensure that the present value of future contract-related cash flows will support the capitalized DAC balance to be amortized in the future. The present value of these cash flows, less the benefit reserve, is compared with the unamortized DAC balance and if the DAC balance is greater, the deficiency is charged to expense as a component of amortization and the asset balance is reduced to the recoverable amount. Deferred Sales Inducements. Costs related to sales inducements offered on sales to new customers, principally on investment type contracts and primarily in the form of additional credits to the customer's account value or enhancements to interest credited for a specified period, which are beyond amounts currently being credited to existing contracts, are deferred and recorded as other assets. All other sales inducements are expensed as incurred and included in interest credited to contract holders' funds. Deferred sales inducements are amortized to income using the same methodology and assumptions as DAC, and are included in interest credited to contract holders' funds. Deferred sales inducements are periodically reviewed for recoverability. Future Policy Benefits. Because of the long-term nature of insurance contracts, the Company is liable for policy benefit payments many years into the future. The liability for future policy benefits represents estimates of the present value of the Company's expected benefit payments, net of the related present value of future net premium collections. For traditional life insurance contracts, this is determined by standard actuarial procedures, using assumptions as to mortality (life expectancy), morbidity (health expectancy), persistency, and interest rates, which are based on the Company's experience with similar products. The assumptions used are those considered to be appropriate at the time the policies are issued. An additional provision is made on most products to allow for possible adverse deviation from the assumptions assumed. For universal life and annuity products, the Company's liability is the amount of the contract's account balance. Account balances are also subject to minimum liability calculations as a result of minimum guaranteed interest rates in the policies. While management and Company actuaries have used their best judgment in determining the assumptions and in calculating the liability for future policy benefits, there is no assurance that the estimate of the liabilities reflected in the financial statements represents the Company's ultimate obligation. In addition, significantly different assumptions could result in materially different reported amounts. Revenue Recognition. Premium income for the Company's traditional life insurance contracts is generally recognized as the premium becomes due from policyholders. For annuity and universal life contracts, the amounts collected from policyholders are considered deposits and are not included in revenue. For these contracts, fee income consists of policy charges for policy administration, cost of insurance charges and surrender charges assessed against policyholders' account balances which are recognized in the period the services are provided. Investment activities of the Company are integral to its insurance operations. Since life insurance benefits may not be paid until many years into the future, the accumulation of cash flows from premium receipts are invested with income reported as revenue when earned. Anticipated yields on investments are reflected in premium rates, contract liabilities, and other product contract features. These anticipated yields are implied in the interest required on the Company's net insurance liabilities (future policy benefits less deferred acquisition costs) and contractual interest obligations in its insurance and annuity products. The Company benefits to the extent actual net investment income exceeds the required interest on net insurance liabilities and manages the rates it credits on its products to maintain the targeted excess or "spread" of investment earnings over interest credited. The Company will continue to be required to provide for future contractual obligations in the event of a decline in investment yield. For more information concerning revenue recognition, investment accounting, and interest sensitivity, please refer to Note 1, Summary of Significant Accounting Policies, and Note 3, Investments, in the Notes to Consolidated Financial Statements included in the Company's Annual Report on Form 10-K for the year ended December 31, 2006, and the discussions under Investments in Item 3 of this report.
Index
24

Pension Plans and Other Postretirement Benefits. The Company sponsors a qualified defined benefit pension plan covering substantially all employees and three nonqualified defined benefit plans covering certain senior officers. In addition, the Company also has postretirement healthcare benefits for certain senior officers. In accordance with prescribed accounting standards, the Company annually reviews plan assumptions. The Company annually reviews its pension benefit plan assumptions which include the discount rate, the expected long-term rate of return on plan assets, and the compensation increase rate. The assumed discount rate is set based on the rates of return on high quality long-term fixed income investments currently available and expected to be available during the period to maturity of the pension benefits. The assumed long-term rate of return on plan assets is generally set at the rate expected to be earned based on long-term investment policy of the plans and the various classes of the invested funds, based on the input of the plan's investment advisors and consulting actuary and the plan's historic rate of return. The compensation rate increase assumption is generally set at a rate consistent with current and expected long-term compensation and salary policy, including inflation. These assumptions involve uncertainties and judgment and therefore actual performance may not be reflective of the assumptions. Other postretirement benefit assumptions include future events affecting retirement age, mortality, dependency status, per capita claims costs by age, healthcare trend rates, and discount rates. Per capita claims cost by age is the current cost of providing postretirement healthcare benefits for one year at each age from the youngest age to the oldest age at which plan participants are expected to receive benefits under the plan. Healthcare trend rates involve assumptions about the annual rate(s) of change in the cost of healthcare benefits currently provided by the plan, due to factors other than changes in the composition of the plan population by age and dependency status. These rates implicitly consider estimates of healthcare inflation, changes in utilization, technological advances and changes in health status of the participants. These assumptions involve uncertainties and judgment, and therefore actual performance may not be reflective of the assumptions. Other significant accounting policies, although not involving the same level of measurement uncertainties as those discussed above but nonetheless important to an understanding of the financial statements, are described in the Company's annual report on Form 10-K for the year ended December 31, 2006.
RESULTS OF OPERATIONS
The Company's consolidated financial statements are prepared in accordance with U.S. generally accepted accounting principles ("GAAP"). In addition, the Company regularly evaluates operating performance using non-GAAP financial measures which exclude or segregate derivatives and realized investment gains and losses from operating revenues and earnings. Similar measures are commonly used in the insurance industry in order to assess profitability and results from ongoing operations. The Company believes that the presentation of these non-GAAP financial measures enhances the understanding of the Company's results of operations by highlighting the results from ongoing operations and the underlying profitability factors of the Company's business. The Company excludes or segregates derivatives and realized investment gains and losses because such items are often the result of events which may or may not be at the Company's discretion and the fluctuating effects of these items could distort trends in the underlying profitability of the Company's business. Therefore, in the following sections discussing consolidated operations and segment operations appropriate reconciliations have been included to report information management considers useful in enhancing an understanding of the Company's operations to reportable GAAP balances reflected in the consolidated financial statements.
Index
25

Consolidated Operations
Revenues. The following details Company revenues.
Traditional life and annuity premiums - Traditional life and annuity premiums increased 18.6% in the first three months of 2007 compared to the same period in 2006. Traditional life insurance premiums for products such as whole life and term life are recognized as revenues over the premium-paying period. Universal life and annuity contract revenues - Revenues for universal life and annuity contract revenues increased 6.8% for the three months in 2007 compared to 2006 and consist of policy charges for the cost of insurance, administration charges, and surrender charges assessed against policyholder account balances. Revenues in the form of cost of insurance charges were $17.9 million in the first quarter of 2007 compared to $16.5 million for the quarter ended March 31, 2006. Surrender charges assessed against policyholder account balances upon withdrawal decreased to $7.6 million in the first quarter of 2007 versus $7.7 million in 2006. Net investment income - A detail of net investment income is provided below.
Income from other invested assets for the three months ended March 31, 2006 includes a profit participation interest of $1.6 million and residual profits of $1.1 million from the sale of equity loans during the quarter. Derivative income and losses are recorded as a component of investment income but may fluctuate substantially from
period to period based on the performance of the S&P 500® Composite Stock Price Index ("S&P 500 Index®"). See the discussion that follows this section relating to index options and derivatives.
Index
Three Months Ended March 31,
2007
2006
(In thousands) Traditional life and annuity premiums $ 4,733 3,991 Universal life and annuity contract revenues 28,796 26,956 Net investment income (excluding derivatives) 81,621 83,511 Other income 3,316 5,198 Operating revenues 118,466 119,656 Derivative income (loss) (4,595) 15,176 Realized gains on investments 241 1,423 Total revenues $ 114,112 136,255
Three Months Ended March 31, % of Total 2007 2006 2007 2006
(In thousands) Gross investment income:
Debt securities $ 76,316 76,125 92.7% 90.1%
Mortgage loans 2,208 2,638 2.7 3.1 Policy loans 1,645 1,580 2.0 1.9 Other invested assets 2,121 4,184 2.6 4.9
Total investment income 82,290 84,527 100.0% 100.0%
Investment expenses 669 1,016 Net investment income
(excluding derivatives) 81,621 83,511 Derivative income (loss) (4,595) 15,176 Net investment income $ 77,026 98,687
26

To ensure the Company will be able to pay future commitments to policyholders and provide a financial return, the funds received as premium payments and deposits are invested in high quality investments, primarily debt securities. The income from these investments is closely monitored by the Company due to its significant impact on the business. Net investment income performance is summarized as follows:
The yield on average invested assets decreased from 6.15% in 2006 to 5.75% in 2007, excluding derivatives. The higher yield in 2006 compared to 2007 is due to the additional income recognized from the other invested assets of $2.7 million as previously described. Net investment income performance is analyzed excluding the derivative income which is a common practice in the insurance industry in order to assess underlying profitability and results from ongoing operations. Derivative income (loss) - Index options are derivative financial instruments used to fully hedge the equity return component of the Company's equity-indexed
products. Index options are intended to act as hedges to match closely the returns on the S&P 500 Index®. With an increase or decline in this index, the index option values likewise increase or decline. Any income or loss from the sale or expiration of the options, as well as period-to-period changes in fair values, are reflected as a component of net investment income. However, increases or decreases in income from these options are substantially offset by corresponding increases or decreases in amounts credited to equity-indexed annuity and life policyholders. Derivative components included in net investment income and the corresponding contract interest amounts are detailed below for each date presented.
Other income - Other income primarily pertains to the Company's operations involving a nursing home. Revenues associated with this operation were $3.0 million and $2.5 million for the three months ended March 31, 2007 and 2006, respectively. Included in other income for the three months ended March 31, 2006 is $2.6 million resulting from partial lawsuit settlements.
Index
Three Months Ended March 31, 2007 2006 (In thousands) Excluding derivatives:
Net investment income $81,621 83,511 Average invested assets, at amortized cost $ 5,673,090 5,431,222 Annual yield on average invested assets 5.75% 6.15%
Including derivatives:
Net investment income $ 77,026 98,687 Average invested assets, at amortized cost $ 5,750,193 5,448,962 Annual yield on average invested assets 5.36% 7.24%
Three Months Ended March 31,
2007
2006
(In thousands) Derivatives:
Unrealized income (loss) $ (8,590) 16,014 Realized income (loss) 3,995 (838)
Total income (loss) included in net investment income $ (4,595) 15,176
Total contract interest $ 37,434 56,048
27

Realized gains on investments - Realized investment gains of $0.2 million and $1.4 million were recorded in the first quarters of 2007 and 2006, respectively. The gains in 2006 are primarily due to sales of collaterialized bond obligation holdings from the debt securities portfolio which had previously been impaired. Benefits and Expenses. The following details benefits and expenses.
Life and other policy benefits - Death claims decreased from $8.9 million during the first quarter of 2006 to $7.7 million for the quarter ended March 31, 2007. While death claim amounts are subject to variation from period to period, the Company's mortality experience has generally been consistent with its product pricing assumptions. Amortization of deferred acquisition costs - Life insurance companies are required to defer certain expenses associated with acquiring new business. The majority of these acquisition expenses consist of commissions paid to agents, underwriting costs, and certain marketing expenses and sales inducements. The Company defers sales inducements in the form of first year interest bonuses on annuity and universal life products that are directly related to the production of new business. These charges are deferred and amortized using the same methodology and assumptions used to amortize other capitalized acquisition costs and the amortization is included in contract interest. Recognition of these deferred policy acquisition costs in the financial statements occurs over future periods in relation to the emergence of profits priced into the products sold. This emergence of profits is based upon assumptions regarding premium payment patterns, mortality, persistency, investment performance, and expense patterns. Companies are required to review these assumptions periodically to ascertain whether actual experience has deviated significantly from that assumed. If it is determined that a significant deviation has occurred, the emergence of profits pattern is to be "unlocked" and reset based upon the actual experience. While the Company is required to evaluate its emergence of profits continually, management believes that the current amortization patterns of deferred policy acquisition costs are reflective of actual experience. Amortization of deferred policy acquisition costs increased to $23.8 million in the first quarter of 2007 compared to $22.3 million reported in 2006. In accordance with the newly adopted SOP 05-1, the Company’s amortization of these deferred costs is expected to increase in the future. Under this pronouncement, annuitizations and certain internal replacements of contracts result in the associated unamortized deferred acquisition costs, unearned revenue liabilities, and deferred sales inducement assets being written off. Universal life and annuity contract interest - The Company closely monitors its credited interest rates on interest sensitive policies, taking into consideration such factors as profitability goals, policyholder benefits, product marketability, and economic market conditions. As long term interest rates change, the Company's credited interest rates are often adjusted accordingly, taking into consideration the factors as described above. The difference between yields earned over policy credited rates is often referred to as the "interest spread". Raising policy credited rates can typically have more of an immediate impact than higher market rates on the Company's investment portfolio yield, making it more difficult to maintain the current interest spread.
Index
Three Months Ended March 31,
2007
2006
(In thousands) Life and other policy benefits $ 10,974 11,442 Amortization of deferred acquisition costs 23,785 22,298 Universal life and annuity contract interest 37,433 56,048 Other operating expenses 14,116 25,374 Totals $ 86,308 115,162
28

The Company's approximated average credited rates are as follows:
Contract interest also includes the performance of the equity-index component of the Company's derivative products as noted which resulted in losses of $4.6 million and income of $15.2 million in the first three months of 2007 and 2006, respectively. As previously noted, the recent market performance of these equity-index features is included in contract interest expense while also impacting the Company's investment income given the hedge nature of the options purchased for these products. Other operating expenses - Other operating expenses consist of general administrative expenses, licenses and fees, and commissions not subject to deferral. Like revenues from other income, nursing home operation expenses are included in other operating expenses in the amount of $2.6 million and $2.2 million for the first quarters of 2007 and 2006, respectively. Other operating expenses for the first quarter of 2006 includes additional compensation cost of $12.5 million as a result of implementation of liability accounting under SFAS 123(R) for the Company's stock option plan. Implementation of liability accounting resulted in a current charge for option costs related to outstanding vested and unvested options. Compensation cost recorded in the first quarter of 2007 totaled $1.3 million. Federal Income Taxes. Federal income taxes on earnings from continuing operations reflect effective tax rates of 32.8% and 33.4% for the first quarter of 2007 and 2006, respectively, which are lower than the expected Federal rate of 35%. The effective tax rate is lower than the Federal rate of 35% primarily due to tax-exempt investment income related to municipal securities and dividends-received deductions on income from stocks.
Segment Operations
Summary of Segment Earnings
A summary of segment earnings (losses) for the quarters ended March 31, 2007 and 2006 is provided below. The segment earnings exclude realized gains and losses on investments, net of taxes.
Index
March 31, March 31, 2007 2006 2007 2006 (Excluding derivative products) (Including derivative products) Annuity 3.30% 3.85% 2.53% 4.18%
Interest sensitive life 3.42% 4.34% 4.43% 5.25%
Domestic International Life Life All Insurance Insurance Annuities Others Totals (In thousands) Segment earnings (losses):
March 31, 2007 $ (1,352) 4,081 14,947 839 18,515
March 31, 2006 $ (1,900) 1,360 13,189 471 13,120
29

Domestic Life Insurance Operations
A comparative analysis of results of operations for the Company's domestic life insurance segment is detailed below.
Revenues from domestic life insurance operations include life insurance premiums on traditional type products and revenues from universal life insurance. Revenues from traditional products are simply premiums collected, while revenues from universal life insurance consist of policy charges for the cost of insurance, policy administration fees, and surrender charges assessed during the period. A comparative detail of premiums and contract revenues is provided below.
The Company's U.S. operations have typically emphasized annuity product sales over life product sales but recent efforts have been made to attract new independent agents and to promote life products to improve domestic sales. It is the Company's goal to increase domestic life product sales through increased recruiting of new distribution and the development of new life insurance products. The Company had approximately 9,100 contracted agents as of March 31, 2007.
Index
Three Months Ended March 31, 2007 2006 (In thousands) Premiums and other revenue:
Premiums and contract revenues $ 6,333 5,834 Net investment income 4,678 5,196 Other income 14 8
Total premiums and other revenue 11,025 11,038 Benefits and expenses:
Life and other policy benefits 6,141 4,954 Amortization of deferred policy acquisition costs 1,864 1,401 Universal life insurance contract interest 2,320 2,270 Other operating expenses 2,712 5,262
Total benefits and expenses 13,037 13,887 Segment earnings (losses) before Federal income taxes (2,012) (2,849)
Provision (benefit) for Federal income taxes (660) (949)
Segment losses $ (1,352) (1,900)
Three Months Ended March 31, 2007 2006 (In thousands) Universal life insurance revenues $ 5,190 4,468 Traditional life insurance premiums 1,712 1,748 Reinsurance premiums (569) (382)
Totals $ 6,333 5,834
30

Premiums collected on universal life products are not reflected as revenues in the Company's statements of earnings in accordance with GAAP. Actual universal life premiums collected are detailed below.
Other operating expenses were $2.7 million and $5.3 million for the three months ended March 31, 2007 and 2006. The decrease in 2007 primarily results from an additional expense in 2006 due to an increase in compensation costs under SFAS 123(R) as a result of the implementation of liability accounting. International Life Insurance Operations
A comparative analysis of results of operations for the Company's international life insurance segment is detailed below.
As with domestic operations, revenues from the international life insurance segment include both premiums on traditional type products and revenues from universal life insurance. A comparative detail of premiums and contract revenues is provided below.
Index
Three Months Ended March 31, 2007 2006 (In thousands) Universal life insurance:
First year and single premiums $ 2,841 3,872 Renewal premiums 4,177 3,592
Totals $ 7,018 7,464
Three Months Ended March 31, 2007 2006 (In thousands) Premiums and other revenue:
Premiums and contract revenues $ 21,671 19,384 Net investment income 5,762 7,014 Other income 45 23
Total premiums and other revenue 27,478 26,421 Benefits and expenses:
Life and other policy benefits 3,677 5,381 Amortization of deferred policy acquisition costs 8,163 4,941 Universal life insurance contract interest 5,252 5,941 Other operating expenses 4,310 8,118
Total benefits and expenses 21,402 24,381 Segment earnings before Federal income taxes 6,076 2,040 Provision for Federal income taxes 1,995 680 Segment earnings $ 4,081 1,360
Three Months Ended March 31, 2007 2006 (In thousands) Universal life insurance revenues $ 20,687 19,437 Traditional life insurance premiums 3,577 2,746 Reinsurance premiums (2,593) (2,799)
Totals $ 21,671 19,384
31

International operations have emphasized universal life policies over traditional life insurance products. Premiums collected on universal life products are not reflected as revenues in the Company's statements of earnings in accordance with GAAP. Actual universal life premiums collected are detailed below.
The Company's international life operations have been a significant part of the Company's business which is based upon a long standing reputation in the international market. The Company reported increased sales of equity-indexed universal life products for international life operations with premiums approximating $16.0 million and $12.7 million for the first quarter of 2007 and 2006, respectively. As previously noted, net investment income and contract interest include a decrease
due to the S&P 500 Index® performance relative to equity-indexed products in the current quarter of 2007 compared to the same period in 2006. A detail of net investment income for international life insurance operations is provided below.
As the international life insurance in force continues to grow, the Company anticipates operating earnings to similarly increase. The amount of international life insurance in force has grown from $12.4 billion at March 31, 2006, to $13.4 billion at March 31, 2007.
Amortization of deferred policy acquisition costs increased approximately 65% comparing the first three months of 2007 to the same period in 2006. This increase is due primarily to the application of SOP 05-1 as previously discussed. Amortization expense increases due to the requirement to write-off deferred balances on contracts that are considered substantially changed under this new guidance. The balances were previously carried and amortized over the projected life of the contract.
Other operating expenses were $4.3 million and $8.1 million for the three months ended March 31, 2007 and 2006. The decrease in 2007 primarily results from an additional expense in 2006 due to an increase in compensation costs under SFAS 123(R) as a result of the implementation of liability accounting.
Index
Three Months Ended March 31, 2007 2006 (In thousands) Universal life insurance:
First year and single premiums $ 8,929 8,539 Renewal premiums 20,503 19,009
Totals $ 29,432 27,548
Three Months Ended March 31, 2007 2006 (In thousands) Net investment income
(excluding derivatives) $ 6,286 6,322 Derivative income (loss) (524) 692 Net investment income $ 5,762 7,014
32

Annuity Operations
The Company's annuity operations are almost exclusively in the United States. Although some of the Company's investment contracts are available to international residents, current sales are small relative to total annuity sales. A comparative analysis of results of operations for the Company's annuity segment is detailed below.
Revenues from annuity operations include primarily surrender charges and recognition of deferred revenues relating to immediate or payout annuities. A comparative detail of the components of premiums and annuity contract revenues is provided below.
The Company's earnings are dependent upon annuity contracts persisting or remaining in force. While premium and contract revenues decline with a reduction in surrender charges, the Company's investment earnings benefit as more policies remain in force.
Index
Three Months Ended March 31, 2007 2006 (In thousands) Premiums and other revenue:
Premiums and contract revenues $ 5,525 5,729 Net investment income 65,753 85,998 Other income 228 2,707
Total premiums and other revenue 71,506 94,434 Benefits and expenses:
Life and other policy benefits 1,156 1,107 Amortization of deferred policy acquisition costs 13,758 15,956 Annuity contract interest 29,861 47,837 Other operating expenses 4,481 9,761
Total benefits and expenses 49,256 74,661 Segment earnings before Federal income taxes 22,250 19,773 Provision for Federal income taxes 7,303 6,584 Segment earnings $ 14,947 13,189
Three Months Ended March 31, 2007 2006 (In thousands) Surrender charges $ 4,392 4,549 Payout annuity and other revenues 1,126 1,173 Traditional annuity premiums 7 7 Totals $ 5,525 5,729
33

Deposits collected on annuity contracts are not reflected as revenues in the Company's statements of earnings in accordance with GAAP. Actual annuity deposits collected for the three months ended March 31, 2007 and 2006 are detailed below.
Sales of equity-indexed annuities were consistent comparing March 31, 2006 quarter end deposits collected to the first quarter of 2007. Equity-indexed product sales typically follow the stock market in that sales are higher when confidence is high in the stock market and low if the stock market is showing poor performance. Since the Company does not offer variable products or mutual funds, these equity-indexed products provide an interest crediting alternative to the Company's existing fixed annuity products and have continued to be a significant portion of the Company’s annuity business. Other deferred annuity deposits decreased during the quarter ended March 31, 2007 versus March 31, 2006 with $32.7 million collected as compared to $46.0 million, respectively. These product sales have been trending lower over the past few years due to low interest rates and investor preferences. As a selling inducement, many of the deferred products include a first year interest bonus in addition to a base interest rate. These bonus rates are deferred in conjunction with other capitalized policy acquisition costs. The amount deferred and amortized over future periods amounted to approximately $4.2 million and $4.7 million during the first quarter of 2007 and 2006, respectively. A detail of net investment income for annuity operations is provided below.
Net investment income excluding derivatives decreased from $71.5 million to $69.8 million for the three months ended March 31, 2006 and 2007, respectively.
Derivative income and loss fluctuate from period to period based on the S&P 500 Index® performance. Other income for the quarter ended March 31, 2006 includes $2.6 million relating to lawsuit settlements. The Company is required to periodically adjust deferred policy acquisition amortization factors for actual experience that varies from assumptions. In the first quarter of 2006, a true-up of assumptions based upon actual results increased amortization for the current period.
Index
Three Months Ended March 31, 2007 2006 (In thousands) Equity-indexed annuities $ 63,453 64,340 Other deferred annuities 32,686 46,009 Immediate annuities 1,774 3,000 Totals $ 97,913 113,349
Three Months Ended March 31, 2007 2006 (In thousands) Net investment income
(excluding derivatives) $ 69,824 71,514 Derivative income (loss) (4,071) 14,484 Net investment income $ 65,753 85,998
34

Annuity contract interest includes the equity component return associated with the Company's equity-indexed annuities. The detail of equity-indexed annuity contract interest compared to contract interest for all other annuities is as follows:
As previously noted, contract interest reflects a decrease due to the S&P 500 Index® performance relative to equity-indexed products, decreasing in the current quarter of 2007 compared to the same period in 2006. Other operating expenses were $4.5 million and $9.8 million during the quarters ended March 31, 2007 and 2006, respectively. The decrease in 2007 primarily results from an additional expense in 2006 as a result of implementing liability accounting related to the Company's stock option plan under SFAS 123(R) accounting guidance. Other Operations
National Western's primary business encompasses its domestic and international life insurance operations and its annuity operations. However, National Western also has small real estate, nursing home, and other investment operations through its wholly-owned subsidiaries. Nursing home operations generated $0.4 million and $0.2 million of operating earnings in the first quarters of 2007 and 2006, respectively. INVESTMENTS
General
The Company's investment philosophy emphasizes the prudent handling of policyowners' and stockholders' funds to achieve security of principal, to obtain the maximum possible yield while maintaining security of principal, and to maintain liquidity in a measure consistent with current and long-term requirements of the Company. The Company's overall conservative investment philosophy is reflected in the allocation of its investments, which is detailed below as of March 31, 2007 and December 31, 2006. The Company emphasizes investment grade debt securities, with smaller holdings in mortgage loans and policy loans.
Index
Three Months Ended March 31,
2007
2006
(In thousands) Equity-indexed annuities $ 7,841 21,485 All other annuities 23,857 28,782 Gross contract interest 31,698 50,267 Bonus interest deferred and capitalized (4,165) (4,721)Bonus interest amortization 2,328 2,291 Total contract interest $ 29,861 47,837
Composition of Investments March 31, 2007 December 31, 2006 Amount % Amount % (In thousands) (In thousands) Debt securities $ 5,548,398 94.8 $ 5,484,799 94.7 Mortgage loans 105,389 1.8 103,325 1.8 Policy loans 87,469 1.5 86,856 1.5 Derivatives 63,815 1.1 72,012 1.2 Equity securities 23,112 0.4 21,203 0.4 Real estate 12,110 0.2 12,113 0.2 Other 9,881 0.2 10,709 0.2 Totals $ 5,850,174 100.0 $ 5,791,017 100.0

35

Debt and Equity Securities The Company maintains a diversified portfolio which consists primarily of corporate, mortgage-backed, and public utilities fixed income securities. Investments in mortgage-backed securities include primarily U.S. government agency pass-through securities and collateralized mortgage obligations ("CMO"). As of March 31, 2007 and December 31, 2006, the Company's debt securities portfolio consisted of the following:
The Company has expanded its holdings of U.S. government and private mortgage-backed securities over the past several years given attractive yields and spreads. Because the Company's holdings of mortgage-backed securities are subject to prepayment and extension risk, the Company has substantially reduced these risks by investing primarily in collateralized mortgage obligations, which have more predictable cash flow patterns than pass-through securities. These securities, known as planned amortization class I ("PAC I") and sequential tranches are designed to amortize in a more predictable manner than other CMO classes or pass-throughs. Using this strategy, the Company can more effectively manage and reduce prepayment and extension risks, thereby helping to maintain the appropriate matching of the Company's assets and liabilities. In addition to diversification, an important aspect of the Company's investment approach is managing the credit quality of its investments in debt securities. As of March 31, 2007, 97.6% of the Company's debt securities were investment grade quality. Thorough credit analysis is performed on potential corporate investments including examination of a company's credit and industry outlook, financial ratios and trends, and event risks. This emphasis is reflected in the high average credit
rating of the Company's portfolio. In the table below, investments in debt securities are classified according to credit ratings by Standard and Poor's ("S&P®"), or other nationally recognized statistical rating organizations if securities were not rated by S&P® .
Index
Composition of Debt Securities March 31, 2007 December 31, 2006 Amount % Amount % (In thousands) (In thousands) Corporate $ 2,446,846 44.1 $ 2,384,762 43.5 Mortgage-backed securities 1,851,412 33.4 1,817,532 33.1 Public utilities 624,211 11.3 623,649 11.4 U.S. government/agencies 417,328 7.5 447,573 8.2 Asset-backed securities 118,628 2.1 122,101 2.2 States & political subdivisions 59,339 1.1 58,627 1.1 Foreign governments 30,634 0.5 30,555 0.5 Totals $ 5,548,398 100.0 $ 5,484,799 100.0
March 31, 2007 December 31, 2006 Amount % Amount % (In thousands) (In thousands) AAA and U.S. government $ 2,507,723 45.2 $ 2,485,122 45.3 AA 292,098 5.3 284,965 5.2 A 1,340,245 24.1 1,330,980 24.3 BBB 1,277,192 23.0 1,237,151 22.5 BB and other below investment grade 131,140 2.4 146,581 2.7 Totals $ 5,548,398 100.0 $ 5,484,799 100.0
36

The Company does not purchase below investment grade securities. Investments held in debt securities below investment grade are the result of subsequent downgrades of the securities. During the first quarter of 2007, the Company's percentage of below investment grade securities decreased primarily as a result of the sale of one security, the call of one security and the maturity of two securities along with the upward fluctuation in market pricing. The Company's holdings of below investment grade securities as a percentage of total invested assets is relatively small compared to industry averages. These holdings are summarized below.
The Company is closely monitoring its other below investment grade holdings by reviewing investment performance indicators including information such as issuer operating performance, debt ratings, analyst reports and other economic factors that may affect these specific investments. While additional losses are not currently anticipated based on the existing status and condition of these securities, continued credit deterioration of some securities is possible, which may result in further writedowns. Holdings in below investment grade securities by category are summarized below.
Index
Below Investment Grade Debt Securities Estimated % of Amortized Carrying Fair Invested Cost Value Value Assets (In thousands except percentages) March 31, 2007 $ 127,336 131,140 131,904 2.2%
December 31, 2006 $ 145,858 146,581 146,170 2.5%
December 31, 2005 $ 168,423 170,455 167,770 3.1%
Below Investment Grade Debt Securities as of March 31, 2007 Amortized Carrying Fair Fair Cost Value Value Value 2007 2007 2007 2006 (In thousands) Retail $ 38,965 39,018 39,060 39,033 Utilities/Energy 22,415 24,281 24,835 24,451 Telecommunication 19,996 18,458 18,458 17,999 Asset-backed 12,249 12,249 11,540 11,611 Transportation 9,039 9,900 9,900 9,725 Manufacturing 6,020 9,880 9,919 8,323 Auto finance 6,167 6,167 6,005 6,200 Other 12,485 11,187 11,187 10,467 Totals $ 127,336 131,140 130,904 127,809
37

The Company is required to classify its investments in debt and equity securities into one of three categories: (a) trading securities, (b) securities available for sale, or (c) securities held to maturity. The Company purchases securities with the intent to hold to maturity and accordingly does not maintain a portfolio of trading securities. Of the remaining two categories, available for sale and held to maturity, the Company makes a determination based on various factors including the type and quality of the particular security and how it will be incorporated into the Company's overall asset/liability management strategy. As shown in the table below, at March 31, 2007, approximately 35% of the Company's total debt and equity securities, based on fair values, were classified as securities available for sale. This slight increase in available for sale securities is a result of short-term investments in bonds. These holdings provide the Company flexibility to react to market opportunities and conditions and to practice active management within the portfolio to provide adequate liquidity to meet policyholder obligations and other cash needs.
In accordance with SFAS No. 115, Accounting for Certain Debt and Equity Securities, during the first quarter of 2007 one security was sold from the held to maturity portfolio due to significant credit deterioration. The amortized cost of the bond was $5.2 million and resulted in a realized gain of $19,000. No securities were sold during the first quarter of 2006. No securities were transferred from the held to maturity portfolio during the first quarter of 2007 or 2006.
Proceeds from sales of securities available for sale totaled $0.2 million and $9.4 million during the first quarter of 2007 and 2006, respectively, which resulted in realized gains of $0.1 million and $1.4 million.
Mortgage Loans and Real Estate
In general, the Company originates loans on high quality, income-producing properties such as shopping centers, freestanding retail stores, office buildings, industrial and sales or service facilities, selected apartment buildings, hotels, and healthcare facilities. The location of these loans is typically in major metropolitan areas that offer a potential for property value appreciation. Credit and default risk is minimized through strict underwriting guidelines and diversification of underlying property types and geographic locations. In addition to being secured by the property, mortgage loans with leases on the underlying property are often guaranteed by the leasee. This approach has proven to result in higher quality mortgage loans with fewer defaults. The Company held net investments in mortgage loans totaling $105.4 million and $103.3 million at March 31, 2007 and December 31, 2006, respectively. The Company does not recognize interest income on impaired loans which are deemed to be uncollectible. Interest income not recognized totaled $0.4 million in 2007, relating to an impaired loan. There was no interest income unrecognized for the three months ended March 31, 2006. The Company's direct investments in real estate are not a significant portion of its total investment portfolio as many of these investments were acquired through mortgage loan foreclosures. The Company also participates in several real estate joint ventures and limited partnerships that invest primarily in income-producing retail properties. These investments have enhanced the Company's overall investment portfolio returns. The Company's real estate investments totaled approximately $12.1 million at March 31, 2007 and December 31, 2006, and consist primarily of income-producing properties which are being operated by a wholly-owned subsidiary of the Company. The Company monitors the condition and market values of these properties on a regular basis and makes repairs and capital improvements to keep the properties in good condition. There were no writedowns in the first quarters of 2007 or 2006 associated with these properties.
Index
Fair Amortized Unrealized Value Cost Gains (Losses) (In thousands) Securities held to maturity: Debt securities $ 3,626,477 3,642,261 (15,784)
Securities available for sale: Debt securities 1,906,137 1,908,921 (2,784) Equity securities 23,112 13,606 9,506 Totals $ 5,555,726 5,564,788 (9,062)
38

Market Risk Market risk is the risk of change in market values of financial instruments due to changes in interest rates, currency exchange rates, commodity prices, or equity prices. The most significant market risk exposure for National Western is interest rate risk. The fair values of fixed income debt securities correlate to external market interest rate conditions. Because interest rates are fixed on almost all of the Company's debt securities, market values typically increase when market interest rates decline, and decrease when market interest rates rise. However, market values may fluctuate for other reasons, such as changing economic conditions or increasing event-risk concerns. The correlation between fair values and interest rates for debt securities is reflected in the tables below.
Changes in interest rates typically have a significant impact on the fair values of the Company's debt securities. Market interest rates of the ten-year U.S. Treasury bond decreased approximately 6 basis points from year-end 2006 reducing the unrealized loss to $18.6 million on a portfolio of approximately $5.6 billion. The Company would expect similar results in the future from any significant upward or downward movement in market rates. However, since the majority of the Company's debt securities are classified as held to maturity, which are recorded at amortized cost, changes in fair values have relatively small effects on the Company's consolidated balance sheet. The Company manages interest rate risk through on-going cash flow testing required for insurance regulatory purposes. Computer models are used to perform cash flow testing under various commonly used stress test interest rate scenarios to determine if existing assets would be sufficient to meet projected liability outflows. Sensitivity analysis allows the Company to measure the potential gain or loss in fair value of its interest-sensitive instruments and to protect its economic value and achieve a predictable spread between what is earned on invested assets and what is paid on liabilities. The Company seeks to minimize the impact of interest risk through surrender charges that are imposed to discourage policy surrenders. Interest rate changes can be anticipated in the computer models and the corresponding risk addressed by management actions affecting asset and liability instruments. However, potential changes in the values of financial instruments indicated by hypothetical interest rate changes will likely be different from actual changes experienced, and the differences could be significant. The Company performed detailed sensitivity analysis as of December 31, 2006, for its interest rate-sensitive assets and liabilities. The changes in market values of the Company's debt securities in the first quarter of 2007 were reasonable given the expected range of results of this analysis.
Index
March 31, December 31, 2007 2006 (In thousands except percentages) Debt securities - fair value $ 5,532,614 5,448,990 Debt securities - amortized cost $ 5,551,182 5,498,461 Fair value as a percentage of amortized cost 99.67 % 99.10 %
Unrealized losses $ (18,568) (49,471)
Ten-year U.S. Treasury bond - decrease in yield for the quarter (0.06)%
Unrealized Loss Balance At At Change in March 31, December 31, Unrealized 2007 2006 Losses (In thousands) Debt securities held to maturity $ (15,784) (35,809) 20,025 Debt securities available for sale (2,784) (13,662) 10,878 Totals $ (18,568) (49,471) 30,903
39

LIQUIDITY AND CAPITAL RESOURCES
Liquidity
Liquidity requirements are met primarily by funds provided from operations. Premium deposits and revenues, investment income, and investment maturities are the primary sources of funds while investment purchases, policy benefits, and operating expenses are the primary uses of funds. The Company historically has not been put in the position of liquidating invested assets to provide cash flow. However, investments consist primarily of marketable debt securities that could be readily converted to cash for liquidity needs. The Company may also borrow up to $40 million on its bank line of credit for short-term cash needs. A primary liquidity concern for life insurers is the risk of an extraordinary level of early policyholder withdrawals. The Company includes provisions within its annuity and universal life insurance policies, such as surrender charges, that help limit and discourage early withdrawals. The actual amounts paid by product line in connection with surrenders and withdrawals for the quarters ended March 31 are noted in the table below.
The above contractual withdrawals, as well as the level of surrenders experienced, were generally consistent with the Company's assumptions in asset/liability management, and the associated cash outflows did not have an adverse impact on overall liquidity. Individual life insurance policies are less susceptible to withdrawal than annuity reserves and deposit liabilities because policyholders may incur surrender charges and undergo a new underwriting process in order to obtain a new insurance policy. Cash flow projections and tests under various market interest rate scenarios are also performed to assist in evaluating liquidity needs and adequacy. The Company currently expects available liquidity sources and future cash flows to be more than adequate to meet the demand for funds. In the past, cash flows from the Company's insurance operations have been sufficient to meet current needs. Cash flows from operating activities were $62.6 million and $67.2 million for the three months ended March 31, 2007 and 2006, respectively. The Company also has significant cash flows from both scheduled and unscheduled investment security maturities, redemptions, and prepayments. These cash flows totaled $115.7 million and $49.7 million for the three months ended March 31, 2007 and 2006, respectively. These cash flow items could be reduced if interest rates rise. Net cash inflows (outflows) from the Company's universal life and investment annuity deposit product operations totaled $25.7 million and $5.0 million during the three months ended March 31, 2007 and 2006, respectively. Capital Resources
The Company relies on stockholders' equity for its capital resources as there is no long-term debt outstanding and the Company does not anticipate the need for any long-term debt in the near future. As of March 31, 2007, the Company had commitments of approximately $8.0 million which were approved by the Company's Board of Directors for the construction of a nursing home facility in Central Texas. The construction of the new facility is expected to begin in 2007.
Index
Three Months Ended March 31, 2007 2006 (In thousands) Product Line:
Traditional Life $ 990 915 Universal Life 8,047 7,018 Annuities 91,979 90,532
Total $ 101,016 98,465
40

OFF-BALANCE SHEET ARRANGEMENTS AND CONTRACTUAL OBLIGATIONS
It is not Company practice to enter into off-balance sheet arrangements nor is it Company policy to issue guarantees to third parties, other than in the normal course of issuing insurance contracts. Commitments related to insurance products sold are reflected as liabilities for future policy benefits. Insurance contracts guarantee certain performances by the Company. Insurance reserves are the means by which life insurance companies determine the liabilities that must be established to assure that future policy benefits are provided for and can be paid. These reserves are required by law and based upon standard actuarial methodologies to ensure fulfillment of commitments guaranteed to policyholders and their beneficiaries, even though the obligations may not be due for many years. Refer to Note (1) in the Notes to Consolidated Financial Statements included in the Company's Annual Report on Form 10-K for the year ended December 31, 2006 for a discussion of reserving methods. The table below summarizes future estimated cash payments under existing contractual obligations.
(1) Refer to Note 9 in the Notes to Consolidated Financial Statements relating to leases in the Company’s Annual Report on Form 10-K. (2) Life claims payable include benefit and claim liabilities for which the Company believes the amount and timing of the payment is essentially fixed and determinable. Such amounts generally relate to incurred and reported death and critical illness claims including an estimate of claims incurred but not reported. (3) Other long-term reserve liabilities include obligations that are reported within the Company's reserve liabilities that reflect determinable payout patterns related to immediate annuities. The above amounts are undiscounted whereas the amounts included in future policy benefit liabilities are discounted in accordance with GAAP. Liabilities for future policy benefits and other policyholder liabilities of approximately $5.2 billion as of March 31, 2007 have been excluded from the contractual obligations table. These excluded liabilities include future policy benefits relating to life insurance products, deferred annuities, and universal life products. Amounts excluded from the table are comprised of policies or contracts where (a) the Company is not currently making payments and will not make payments in the future until the occurrence of a payment triggering event, such as death or (b) the occurrence of a payment triggering event, such as a surrender of a policy or contract, which is outside of the control of the Company. The timing of these payments is not reasonably fixed and determinable. These uncertainties are considered in the Company's asset/liability management program as previously noted. CHANGES IN ACCOUNTING PRINCIPLES AND CRITICAL ACCOUNTING POLICIES Changes in Accounting Principles Refer to Note 2 of the Notes to Condensed Consolidated Financial Statements.
Index
Payment Due by Period Less Than 1 - 3 3 - 5 More Than Total 1 Year Years Years 5 Years (In thousands) Operating lease obligations (1) $ 2,325 808 1,300 217 - Loan commitments 8,000 8,000 - - - Life claims payable (2) 49,102 49,102 - - - Other long-term reserve liabilities
reflected on the balance sheet under GAAP (3) 370,453 72,988 108,289 55,158 134,018
Total $ 429,880 130,898 109,589 55,375 134,018
41

REGULATORY AND OTHER ISSUES Statutory Accounting Practices Regulations that affect the Company and the insurance industry are often the result of efforts by the National Association of Insurance Commissioners ("NAIC"). The NAIC routinely publishes new regulations as model acts or laws which states subsequently adopt as part of their insurance regulations. Currently, the Company is not aware of any NAIC regulatory matter material to its operations or reporting of financial results. Risk-Based Capital Requirements The NAIC established risk-based capital ("RBC") requirements to help state regulators monitor the financial strength and stability of life insurers by identifying those companies that may be inadequately capitalized. Under the NAIC's requirements, each insurer must maintain its total capital above a calculated threshold or take corrective measures to achieve the threshold. The threshold of adequate capital is based on a formula that takes into account the amount of risk each company faces on its products and investments. The RBC formula takes into consideration four major areas of risk which are: (i) asset risk which primarily focuses on the quality of investments; (ii) insurance risk which encompasses mortality and morbidity risk; (iii) interest rate risk which involves asset/liability matching issues; and (iv) other business risks. Statutory laws prohibit public dissemination of certain RBC information. However, the Company's current statutory capital and surplus is significantly in excess of the threshold RBC requirements.
ITEM 3. QUANTITATIVE AND QUALITATIVE DISCLOSURESABOUT MARKET RISK
This information is included in Item 2, Management's Discussion and Analysis of Financial Condition and Results of Operations, in the Investments in Debt and Equity Securities section.
ITEM 4. CONTROLS AND PROCEDURES
The Company's management, with the participation of the Company's Chief Executive Officer and Chief Financial Officer, has evaluated the effectiveness of the Company's disclosure controls and procedures (as such term is defined in Rules 13a-15(e) and 15d-15(e) under the Securities Exchange Act of 1934) as of the end of the period covered by this report. Based on such evaluation, the Company's Chief Executive Officer and Chief Finanical Officer have concluded that, as of the end of such period, the Company's disclosure controls and procedures are effective in recording, processing, summarizing, and reporting, on a timely basis, information required to be disclosed by the Company in the reports that it files or submits under the Exchange Act. There have been no changes in the Company's internal controls over financial reporting (as defined in Rules 13a-15(f) and 15d-15(f) under the Exchange Act) during the quarter ended March 31, 2007 that have materially affected, or are reasonably likely to materially affect, the Company's internal controls over financial reporting.
PART II. OTHER INFORMATIONITEM 1. LEGAL PROCEEDINGS
Refer to Note 7 "Legal Proceedings" of the accompanying financial statements included in this Form 10-Q.
ITEM 1A. RISK FACTORS
There have been no changes relative to the risk factors disclosed in the Company's Annual Report on Form 10-K for the year ended December 31, 2006.
Index
42

ITEM 2. UNREGISTERED SALES OF EQUITY SECURITIES AND USE OF PROCEEDS
Effective March 10, 2006, the Company adopted and implemented a limited stock buy-back program associated with the Company's 1995 Stock Option and Incentive Plan ("Plan") which provides Option Holders the additional alternative of selling shares acquired through the exercise of options directly back to the Company. Option Holders may elect to sell such acquired shares back to the Company at any time within ninety (90) days after the exercise of options at the prevailing market price as of the date of notice of election. During the month ended March, 2007, the Company purchased 15,520 shares from option holders at an average price of $244.73. These purchased shares are reported in the Company's condensed consolidated financial statements as authorized and unissued.
ITEM 6. EXHIBITS
(a) Exhibits
Index
Exhibit 31(a) - Certification of Chief Executive Officer pursuant to Section 302 of the Sarbanes-Oxley Act of 2002. Exhibit 31(b) - Certification of Chief Financial Officer pursuant to Section 302 of the Sarbanes-Oxley Act of 2002. Exhibit 32(a) - Certification of Chief Executive Officer and Chief Financial Officer pursuant to 18 U.S.C. Section 1350, as adopted
pursuant to Section 906 of the Sarbanes-Oxley Act of 2002.
43

Index
SIGNATURES
Pursuant to the requirements of the Securities Exchange Act of 1934, the Registrant has duly caused this report to be signed on its behalf by the undersigned thereunto duly authorized.
NATIONAL WESTERN LIFE INSURANCE COMPANY(Registrant)
Date: May 9, 2007 /S/ Ross R. Moody Ross R. Moody President, Chief Operating Officer, and Director (Authorized Officer) Date: May 9, 2007 /S/ Brian M. Pribyl Brian M. Pribyl Senior Vice President, Chief Financial & Administrative Officer and Treasurer (Principal Financial Officer) Date: May 9, 2007 /S/ Kay E. Osbourn Kay E. Osbourn Vice President, Controller and Assistant Treasurer (Principal Accounting Officer)

EXHIBIT 31(a)
CERTIFICATION
I, Robert L. Moody, certify that:
1. I have reviewed this report on Form 10-Q of National Western Life Insurance Company; 2. Based on my knowledge, this report does not contain any untrue statement of a material fact or omit to state a material
fact necessary to make the statements made, in light of the circumstances under which such statements were made, not misleading with respect to the period covered by this report;
3. Based on my knowledge, the financial statements, and other financial information included in this report, fairly present
in all material respects the financial condition, results of operations and cash flows of the registrant as of, and for, the periods presented in this report;
4. The registrant's other certifying officer and I are responsible for establishing and maintaining disclosure controls and
procedures (as defined in Exchange Act Rules 13a-15(e) and 15d-15(e)) and internal control over financial reporting (as defined in Exchange Act Rules 13a-15(f) and 15d-15(f)) for the registrant and have:
a) Designed such disclosure controls and procedures, or caused such disclosure controls and procedures to be
designed under our supervision, to ensure that material information relating to the registrant, including its consolidated subsidiaries, is made known to us by others within those entities, particularly during the period in which this report is being prepared;
b) Designed such internal control over financial reporting, or caused such internal control over financial reporting to be
designed under our supervision, to provide reasonable assurance regarding the reliability of financial reporting and the preparation of financial statements for external purposes in accordance with generally accepted accounting principles;
c) Evaluated the effectiveness of the registrant's disclosure controls and procedures and presented in this report our
conclusions about the effectiveness of the disclosure controls and procedures, as of the end of the period covered by this report based on such evaluation; and
d) Disclosed in this report any change in the registrant's internal control over financial reporting that occurred during
the registrant's most recent fiscal quarter (the registrant's fourth fiscal quarter in the case of an annual report) that has materially affected, or is reasonably likely to materially affect, the registrant's internal control over financial reporting; and
5. The registrant's other certifying officer and I have disclosed, based on our most recent evaluation of internal control
over financial reporting, to the registrant's auditors and the audit committee of registrant's board of directors (or persons performing the equivalent functions):
a) All significant deficiencies and material weaknesses in the design or operation of internal control over financial
reporting which are reasonably likely to adversely affect the registrant's ability to record, process, summarize and report financial information; and
b) Any fraud, whether or not material, that involves management or other employees who have a significant role in the
registrant's internal control over financial reporting.
Date: May 9, 2007 /S/ Robert L. Moody
Robert L. Moody
Chairman of the Board and
Chief Executive Officer

EXHIBIT 31(b)
CERTIFICATION
I, Brian M. Pribyl, certify that:
1. I have reviewed this report on Form 10-Q of National Western Life Insurance Company; 2. Based on my knowledge, this report does not contain any untrue statement of a material fact or omit to state a material
fact necessary to make the statements made, in light of the circumstances under which such statements were made, not misleading with respect to the period covered by this report;
3. Based on my knowledge, the financial statements, and other financial information included in this report, fairly present
in all material respects the financial condition, results of operations and cash flows of the registrant as of, and for, the periods presented in this report;
4. The registrant's other certifying officer and I are responsible for establishing and maintaining disclosure controls and
procedures (as defined in Exchange Act Rules 13a-15(e) and 15d-15(e)) and internal control over financial reporting (as defined in Exchange Act Rules 13a-15(f) and 15d-15(f)) for the registrant and have:
a) Designed such disclosure controls and procedures, or caused such disclosure controls and procedures to be
designed under our supervision, to ensure that material information relating to the registrant, including its consolidated subsidiaries, is made known to us by others within those entities, particularly during the period in which this report is being prepared;
b) Designed such internal control over financial reporting, or caused such internal control over financial reporting to
be designed under our supervision, to provide reasonable assurance regarding the reliability of financial reporting and the preparation of financial statements for external purposes in accordance with generally accepted accounting principles;
c) Evaluated the effectiveness of the registrant's disclosure controls and procedures and presented in this report our
conclusions about the effectiveness of the disclosure controls and procedures, as of the end of the period covered by this report based on such evaluation; and
d) Disclosed in this report any change in the registrant's internal control over financial reporting that occurred during
the registrant's most recent fiscal quarter (the registrant's fourth fiscal quarter in the case of an annual report) that has materially affected, or is reasonably likely to materially affect, the registrant's internal control over financial reporting; and
5. The registrant's other certifying officer and I have disclosed, based on our most recent evaluation of internal control
over financial reporting, to the registrant's auditors and the audit committee of registrant's board of directors (or persons performing the equivalent functions):
a) All significant deficiencies and material weaknesses in the design or operation of internal control over financial
reporting which are reasonably likely to adversely affect the registrant's ability to record, process, summarize and report financial information; and
b) Any fraud, whether or not material, that involves management or other employees who have a significant role in the
registrant's internal control over financial reporting.
Date: May 9, 2007 /S/ Brian M. Pribyl
Brian M. Pribyl
Senior Vice President,
Chief Financial and
Administrative Officer, and
Treasurer

EXHIBIT 32(a)
CERTIFICATION PURSUANT TO18 U.S.C. SECTION 1350,
AS ADOPTED PURSUANT TOSECTION 906 OF THE SARBANES-OXLEY ACT OF 2002
In connection with the Quarterly Report of National Western Life Insurance Company ("Company") on Form 10-Q for the period ended March 31, 2007 as filed with the Securities and Exchange Commission on or about the date hereof ("Report"), I, Robert L. Moody, Chairman of the Board and Chief Executive Officer of the Company and I, Brian M. Pribyl, Senior Vice President, Chief Financial and Administrative Officer, and Treasurer of the Company, each certify, pursuant to 18 U.S.C. Section 1350, as adopted pursuant to Section 906 of the Sarbanes-Oxley Act of 2002, that:
(1) to my knowledge, the Report fully complies with the requirements of Section 13(a) or 15(d) of the Securities Exchange Act of 1934, and
(2) the information contained in the Report fairly presents, in all material respects, the financial condition and results of operations of the Company.
Date: May 9, 2007 /S/Robert L. Moody Robert L. Moody Chairman of the Board and Chief Executive Officer /S/Brian M. Pribyl Brian M. Pribyl Senior Vice President, Chief Financial and Administrative Officer, and Treasurer