national water commission annual report 2014–15 ... national water commission annual report...
TRANSCRIPT

5 Financial statements
32National Water Commission Annual Report 2014–15
Financial statements

33Section 5 Financial statements

34National Water Commission Annual Report 2014–15

35Section 5 Financial statements
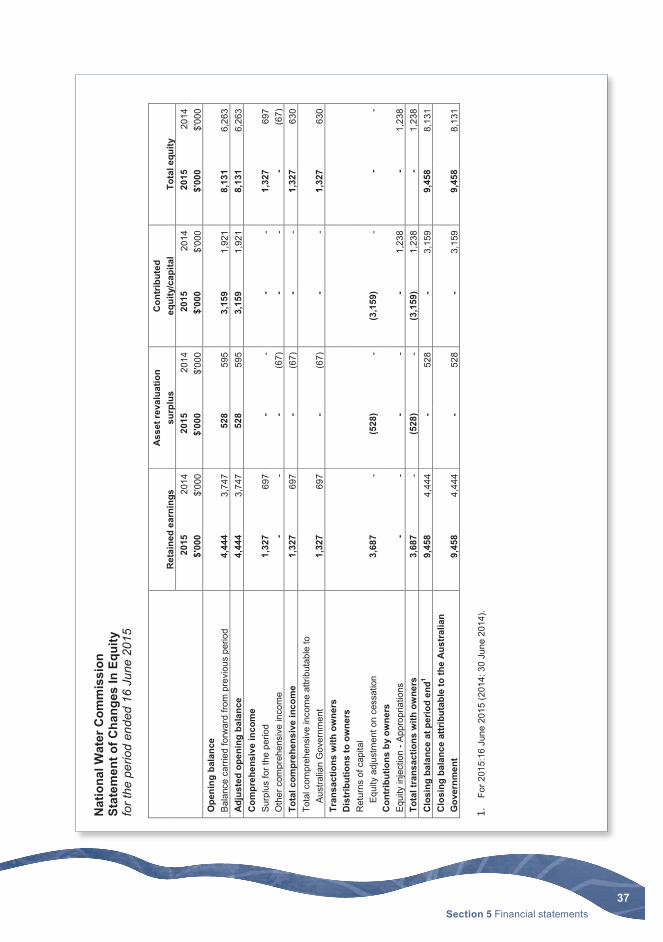
National Water CommissionStatement of Comprehensive Incomefor the period ended 16 June 2015
The above statement should be read in conjunction with the accompanying notes.
2015 2014Notes $'000 $'000
NET COST OF SERVICESExpenses
Employee benefits 4A 2,428 5,148Suppliers 4B 1,204 2,446Depreciation and amortisation 8A 57 241Finance costs - unwinding of discount - 4Write-down and impairment of assets 4C 5 -
Total expenses 3,694 7,839
Own-Source IncomeOwn-source revenue
Other revenue 5A 56 222Total own-source revenue 56 222
GainsMakegood provision reversals 43 -
Total gains 43 -Total own-source income 99 222
Net cost of services (3,595) (7,617)
Revenue from Government - Departmental appropriations 4,922 8,314Surplus attributable to the Australian Government 1,327 697
OTHER COMPREHENSIVE INCOMEItems not subject to subsequent reclassification to net cost of services
Changes in asset revaluation surplus - (67)Total comprehensive loss - (67)
Total comprehensive income attributable to the Australian Government 1,327 630

36National Water Commission Annual Report 2014–15
National Water CommissionStatement of Financial Positionas at 16 June 2015
The above statement should be read in conjunction with the accompanying notes.
2015 2014Notes $'000 $'000
ASSETSFinancial assets
Cash and cash equivalents - 118Trade and other receivables 7A 9,458 9,371
Total financial assets 9,458 9,489
Non-financial assetsProperty, plant and equipment 8A - 24Computer software purchased 8A - 38Prepayments - 24
Total non-financial assets - 86
Total assets 9,458 9,575
LIABILITIESPayables
Suppliers 9A - 83Other payables 9B - 197
Total payables - 280
ProvisionsEmployee provisions 10A - 1,011Other provisions 10B - 153
Total provisions - 1,164
Total liabilities - 1,444
Net assets 9,458 8,131
EQUITYContributed equity - 3,159Reserves - 528Retained surplus 9,458 4,444
Total equity 9,458 8,131
37Section 5 Financial statements
Nat
iona
l Wat
er C
omm
issi
onSt
atem
ent o
f Cha
nges
In E
quity
for t
he p
erio
d en
ded
16 J
une
2015
The
abov
e st
atem
ent s
houl
d be
read
in c
onju
nctio
n w
ith th
e ac
com
pany
ing
note
s.
Ret
aine
d ea
rnin
gsA
sset
reva
luat
ion
surp
lus
Con
trib
uted
eq
uity
/cap
ital
Tota
l equ
ity
2015
2014
2015
2014
2015
2014
2015
2014
$'00
0$'
000
$'00
0$'
000
$'00
0$'
000
$'00
0$'
000
Ope
ning
bal
ance
Bal
ance
car
ried
forw
ard
from
pre
viou
s pe
riod
4,44
43,
747
528
595
3,15
91,
921
8,13
16,
263
Adj
uste
d op
enin
g ba
lanc
e4,
444
3,74
752
859
53,
159
1,92
18,
131
6,26
3C
ompr
ehen
sive
inco
me
Sur
plus
for t
he p
erio
d1,
327
697
--
--
1,32
769
7O
ther
com
preh
ensi
ve in
com
e-
--
(67)
--
-(6
7)To
tal c
ompr
ehen
sive
inco
me
1,32
769
7-
(67)
--
1,32
763
0To
tal c
ompr
ehen
sive
inco
me
attri
buta
ble
toA
ustra
lian
Gov
ernm
ent
1,32
769
7-
(67)
--
1,32
763
0Tr
ansa
ctio
ns w
ith o
wne
rsD
istr
ibut
ions
to o
wne
rs
R
etur
ns o
f cap
ital
Equ
ity a
djus
tmen
t on
cess
atio
n3,
687
-(5
28)
-(3
,159
)-
--
Con
trib
utio
ns b
y ow
ners
Equ
ity in
ject
ion
-App
ropr
iatio
ns-
--
--
1,23
8-
1,23
8To
tal t
rans
actio
ns w
ith o
wne
rs3,
687
-(5
28)
-(3
,159
)1,
238
-1,
238
Clo
sing
bal
ance
at p
erio
d en
d19,
458
4,44
4-
528
-3,
159
9,45
88,
131
Clo
sing
bal
ance
attr
ibut
able
to th
e A
ustr
alia
n G
over
nmen
t9,
458
4,44
4-
528
-3,
159
9,45
88,
131
1.Fo
r 201
5:16
Jun
e 20
15 (2
014:
30
June
201
4).
38National Water Commission Annual Report 2014–15
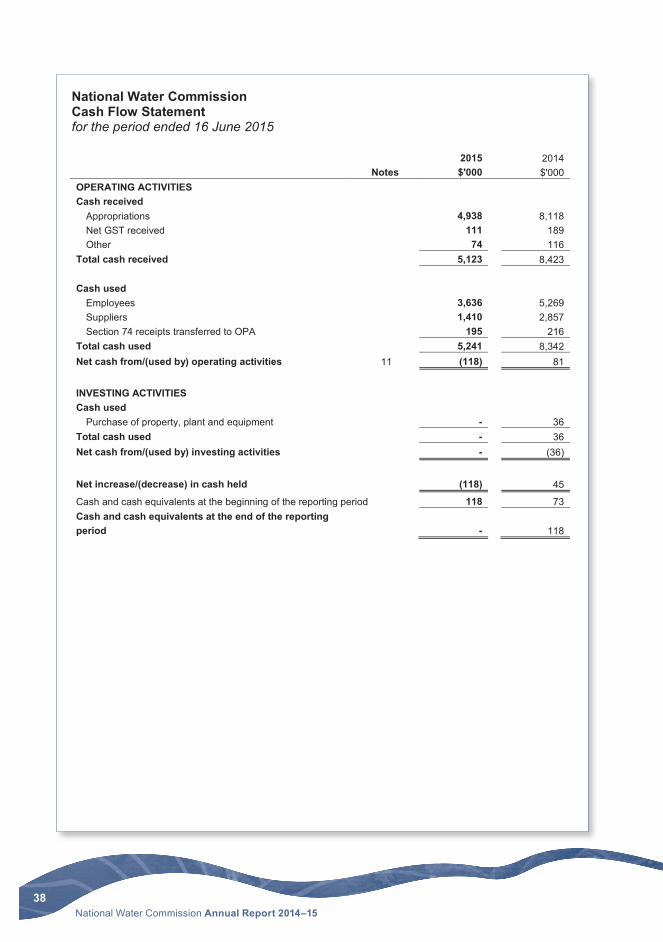
National Water CommissionCash Flow Statementfor the period ended 16 June 2015
The above statement should be read in conjunction with the accompanying notes.
2015 2014Notes $'000 $'000
OPERATING ACTIVITIESCash received
Appropriations 4,938 8,118Net GST received 111 189Other 74 116
Total cash received 5,123 8,423
Cash usedEmployees 3,636 5,269Suppliers 1,410 2,857Section 74 receipts transferred to OPA 195 216
Total cash used 5,241 8,342Net cash from/(used by) operating activities 11 (118) 81
INVESTING ACTIVITIESCash used
Purchase of property, plant and equipment - 36Total cash used - 36Net cash from/(used by) investing activities - (36)
Net increase/(decrease) in cash held (118) 45
Cash and cash equivalents at the beginning of the reporting period 118 73Cash and cash equivalents at the end of the reporting period - 118
39Section 5 Financial statements
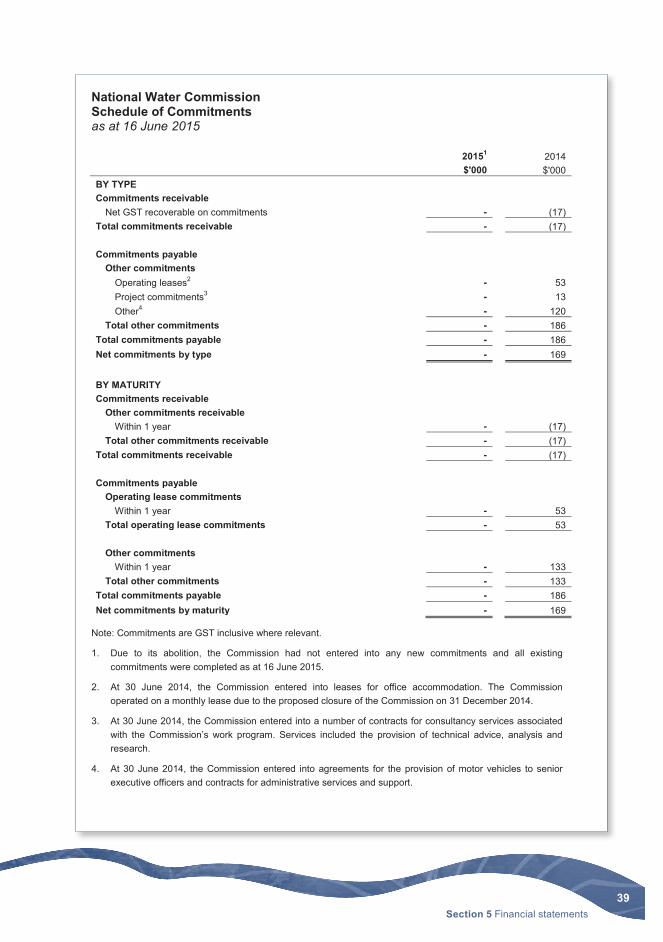
National Water CommissionSchedule of Commitments as at 16 June 2015
The above schedule should be read in conjunction with the accompanying notes.
20151 2014$'000 $'000
BY TYPECommitments receivable
Net GST recoverable on commitments - (17)Total commitments receivable - (17)
Commitments payableOther commitments
Operating leases2 - 53Project commitments3 - 13Other4 - 120
Total other commitments - 186Total commitments payable - 186Net commitments by type - 169
BY MATURITYCommitments receivable
Other commitments receivableWithin 1 year - (17)
Total other commitments receivable - (17)Total commitments receivable - (17)
Commitments payableOperating lease commitments
Within 1 year - 53Total operating lease commitments - 53
Other commitmentsWithin 1 year - 133
Total other commitments - 133Total commitments payable - 186Net commitments by maturity - 169
Note: Commitments are GST inclusive where relevant.
1. Due to its abolition, the Commission had not entered into any new commitments and all existing commitments were completed as at 16 June 2015.
2. At 30 June 2014, the Commission entered into leases for office accommodation. The Commission operated on a monthly lease due to the proposed closure of the Commission on 31 December 2014.
3. At 30 June 2014, the Commission entered into a number of contracts for consultancy services associated with the Commission’s work program. Services included the provision of technical advice, analysis and research.
4. At 30 June 2014, the Commission entered into agreements for the provision of motor vehicles to senior executive officers and contracts for administrative services and support.
40National Water Commission Annual Report 2014–15
National Water CommissionTable of Contents - Notes
Note 1: Summary of Significant Accounting Policies
Note 2: Events After the Reporting Period
Note 3: Net Cash Appropriation Arrangements
Note 4: Expenses
Note 5: Own-Source Income
Note 6: Fair Value Measurements
Note 7: Financial Assets
Note 8: Non-Financial Assets
Note 9: Payables
Note 10: Provisions
Note 11: Cash Flow Reconciliation
Note 12: Senior Management Personnel Remuneration
Note 13: Appropriations
Note 14: Reporting of Outcomes
Note 15: Budgetary Reports and Explanations of Major Variances

41Section 5 Financial statements
Note 1: Summary of Significant Accounting Policies1.1 Objectives of the National Water Commission
The National Water Commission (the Commission) was established on 17 December 2004 with the passage of the National Water Commission Act 2004. The National Water Commission Act 2004 was amended with effect from 1 July 2012, making a number of changes to the functions and operating arrangements of the Commission. The Commission was part of the Environment portfolio. The Commission was an Australian Government controlled entity.
The Commission was abolished with effect from 17 June 2015 following the passage of the National Water Commission (Abolition) Act 2015 (NWC Abolition Act).
The Commission provided independent assurance of the Council of Australian Governments national reform agenda and promoted the objectives of the National Water Initiative Intergovernmental Agreement.
The Commission was structured to meet the following outcome:
Outcome 1: Informed decisions by governments on national water issues, and improved management of Australia’s water resources, through advocacy, facilitation and independent advice.
The Commission’s activities contributing towards this outcome were classified as departmental. Departmental activities involve the use of assets, liabilities, income and expenses controlled or incurred by the Commission in its own right. Administered activities involve the management or oversight by an entity, on behalf of the government, of items controlled or incurred by the government. The Commission had no administered activities in 2014-15 (2013-14: none).
1.2 Basis of Preparation of the Financial Statements
The financial statements are general purpose financial statements and are required by section 42 of the Public Governance, Performance and Accountability Act 2013.
The financial statements have been prepared in accordance with:
a) Financial Reporting Rule (FRR) for reporting periods ending on or after 1 July 2014; and
b) Australian Accounting Standards and Interpretations issued by the Australian Accounting Standards Board (AASB) that apply for the reporting period.
The functions of the Commission have been distributed to the Productivity Commission, the Department of the Environment, ABARES and the Bureau of Meteorology, and relevant assets and liabilities have transferred and are continuing in the Department of the Environment. The financial statements have been prepared on a going concern basis (on the basis that assets and liabilities will be realised in the normal course of business).
The financial statements have been prepared on an accrual basis and in accordance with the historical cost convention, except for certain assets and liabilities at fair value. Except where stated, no allowance is made for the effect of changing prices on the results or the financial position.
The financial statements are presented in Australian dollars and values are rounded to the nearest thousand dollars unless otherwise specified.
The financial statements are for the period 1 July 2014 to 16 June 2015 whereas the comparatives are for the 12 month period 1 July 2013 to 30 June 2014.
Unless an alternative treatment is specifically required by an accounting standard or the FRR, assets and liabilities are recognised in the statement of financial position when and only when it is probable that future economic benefits will flow to the entity or a future sacrifice of economic benefits will be required and the amounts of the assets or liabilities can be reliably measured. However, assets and liabilities arising under executory contracts are not recognised unless required by an accounting standard. Liabilities and assets that are unrecognised are reported in the schedule of commitments or the contingencies note.
Unless alternative treatment is specifically required by an accounting standard, income and expenses are recognised in the Statement of Comprehensive Income when and only when the flow, consumption or loss of economic benefits has occurred and can be reliably measured.
Section 10 of the NWC Abolition Act requires the Secretary of the Department of the Environment to prepare the final financial statements for the Commission.

42National Water Commission Annual Report 2014–15
1.3 Significant Accounting Judgements and Estimates
In the process of applying the accounting policies listed in this note, the Commission has not made any judgements that could have a significant impact on the amounts recorded in the financial statements.
1.4 New Australian Accounting Standards
No accounting standard has been adopted earlier than the application date as stated in the standard.
Adoption of New Australian Accounting Standard Requirements
The issuance of AASB 1055 Budgetary Reporting requires the Commission to disclose budgeted information, presented to Parliament in the Portfolio Budget Statements. The Commission will also be required to provide explanations of significant variances between the budgeted amounts and actual results. This standard appliesto reporting periods commencing on or after 1 July 2014.
No new or revised standards were issued prior to the signing of the statement by the Secretary and Chief Finance Officer of the Department of the Environment, that were applicable to the current reporting period had a material impact on the Commission’s financial statements.
1.5 Revenue
Resources Received Free of Charge
Resources received free of charge are recognised as revenue when, and only when, a fair value can be reliably determined and the services would have been purchased if they had not been donated. Use of those resources is recognised as an expense. Resources received free of charge are recorded as either revenue or gains depending on their nature.
Amounts appropriated for departmental appropriations for the year (adjusted for any formal additions and reductions) are recognised as Revenue from Government when the Commission gains control of the appropriation. Appropriations receivable are recognised at their nominal amounts.
Revenue from Government
1.6 Transactions with the Government as Owner
Amounts appropriated which are designated as ‘equity injections’ for a year (less any formal reductions) and Departmental Capital Budgets (DCBs) are recognised directly in contributed equity in that year.
Equity Injections
Other Distributions to Owners
There were no transactions with the Government as owner during 2014-15 (2013-14: none).
1.7 Employee Benefits
Liabilities for ‘short-term employee benefits’ (as defined in AASB 119 Employee Benefits) and termination benefits expected within twelve months of the end of the reporting period are measured at their nominal amounts. The nominal amount is calculated with regard to the rates expected to be paid on settlement of the liability.
Leave
The liability for employee benefits includes provision for annual leave and long service leave. No provision has been made for sick leave as all sick leave is non-vesting and the average sick leave taken in future years by employees of the Commission is estimated to be less than the annual entitlement for sick leave.
The leave liabilities are calculated on the basis of employees’ remuneration at the estimated salary rates that will be applied at the time the leave is taken, including the Commission’s employer superannuation contribution rates to the extent that the leave is likely to be taken during service rather than paid out on termination.
The liability for long service leave has been determined in accordance with the ‘short hand’ method permitted for small agencies under the FRR. The estimate of the present value of the liability takes into account staff turnover rates and expected pay increases.

43Section 5 Financial statements
Separation and Redundancy
Provision is made for separation and redundancy benefit payments. The Commission recognises a provision for termination when it has developed a detailed formal plan for the terminations and has informed those employees affected that it will carry out the terminations.
Superannuation
The Commission’s employees are members of the Commonwealth Superannuation Scheme (CSS), the Public Sector Superannuation Scheme (PSS), the PSS accumulation plan (PSSap) or other elected defined contribution schemes.
The CSS and PSS are defined benefit schemes for the Australian Government. The PSSap is a definedcontribution scheme.
The liability for defined benefits is recognised in the financial statements of the Australian Government and is settled by the Australian Government in due course. This liability is reported in the Department of Finance’s administered schedules and notes.
The Commission makes employer contributions to the employees’ superannuation scheme at rates determined by an actuary to be sufficient to meet the current cost to the Government. The Commission accounts for the contributions as if they were contributions to defined contribution plans.
The liability for superannuation recognised as at 30 June represents outstanding contributions for the final fortnight of the year.
1.8 Leases
Operating lease payments are expensed on a straight-line basis which is representative of the pattern of benefits derived from the leased assets.
1.9 Financial Assets
Cash and cash equivalents
Cash is recognised at its nominal amount. Cash and cash equivalents include:
a) cash on hand; andb) deposits on demand in bank accounts.
Loans and Receivables
Trade receivables are classified as ‘loans and receivables’ and recorded at face value less any impairment. Trade receivables are recognised where the Commission has a legal right to receive cash. Trade receivables are derecognised upon payment.
All financial assets are expected to be recovered in no more than 12 months unless otherwise specified.
Impairment of Financial Assets
Loans and receivables are assessed for impairment at the end of each reporting period. Allowances are made when collectability of the debt is no longer probable.
1.10 Financial Liabilities
The Commission classifies its financial liabilities which include supplier and other payables as ‘other financial liabilities’.
Supplier and other payables are recognised at amortised cost. Liabilities are recognised to the extent that the goods or services have been received (and irrespective of having been invoiced). Supplier and other payables are derecognised upon payment.
All financial liabilities are expected to be settled in no more than 12 months unless otherwise specified.

44National Water Commission Annual Report 2014–15
1.11 Contingent Liabilities and Contingent Assets
The Commission had no quantifiable, unquantifiable or significant remote contingent assets or liabilities as at 16 June 2015 (2013-14: nil).
1.12 Acquisition of Assets
Assets are recorded at cost on acquisition except as stated below. The cost of acquisition includes the fair value of assets transferred in exchange and liabilities undertaken. Financial assets are initially measured at their fair value plus transaction costs where appropriate.
Assets acquired at no cost, or for nominal consideration, are initially recognised as assets and income at their fair value at the date of acquisition, unless acquired as a consequence of restructuring of administrative arrangements. In the latter case, assets are initially recognised as contributions by owners at the amounts at which they were recognised in the transferor’s accounts immediately prior to the restructuring.
1.13 Property, Plant and Equipment
Asset Recognition Threshold
Purchases of property, plant and equipment are recognised initially at cost in the Statement of Financial Position, except for purchases costing less than $1,000, which are expensed in the year of acquisition (other than where they form part of a group of similar items which are significant in total).
Revaluations
Following initial recognition at cost, property, plant and equipment are carried at fair value less subsequent accumulated depreciation and accumulated impairment losses. Valuations are conducted with sufficient frequency to ensure that the carrying amounts of assets do not differ materially from the assets’ fair values as at the reporting date. The regularity of independent valuations depends upon the volatility of movements in market values for the relevant assets.
Depreciation
Depreciable property, plant and equipment assets are written off to their estimated residual values over their estimated useful lives to the Commission using, in all cases, the straight-line method of depreciation.
Depreciation rates (useful lives), residual values and methods are reviewed at each reporting date and necessary adjustments are recognised in the current, or current and future reporting periods, as appropriate.
Depreciation rates applying to each class of depreciable asset are based on the following useful lives:
2015 2014Leasehold improvements Lease term Lease termPlant and equipment 5 to 7 years 5 to 7 yearsIT equipment 3 years 3 years
As the Commission was abolished with effect from 17 June 2015, the useful lives of all property, plant and equipment assets were adjusted and all assets were fully depreciated by 16 June 2015.
Impairment
Where indications of impairment exist, the asset’s recoverable amount is estimated and an impairmentadjustment made if the asset’s recoverable amount is less than its carrying amount.
The recoverable amount of an asset is the higher of its fair value less costs of disposal and its value in use. Value in use is the present value of the future cash flows expected to be derived from the asset. Where the future economic benefit of an asset is not primarily dependent on the asset’s ability to generate future cash flows, and the asset would be replaced if the Commission were deprived of the asset, its value in use is taken to be its depreciated replacement cost.
Derecognition
An item of property, plant and equipment is derecognised upon disposal or when no further future economic benefits are expected from its use or disposal.

45Section 5 Financial statements
1.14 Intangibles
The Commission’s intangibles comprise internally developed software and purchased software for internal use. These assets are carried at cost less accumulated amortisation and accumulated impairment losses.
Software is amortised on a straight-line basis over its anticipated useful life. The useful lives of the Commission’s software are 2 to 3 years (2013-14: 2 to 3 years).
As the Commission was abolished with effect from 17 June 2015, the useful lives of all intangible assets were adjusted and all intangible assets were fully amortised by 16 June 2015.
1.15 Taxation
The Commission is exempt from all forms of taxation except Fringe Benefits Tax (FBT) and the Goods and Services Tax (GST).
Revenues, expenses and assets are recognised net of GST except:
• where the amount of GST incurred is not recoverable from the Australian Taxation Office; and
• for receivables and payables.
1.16 Constitutional and Other Legal Requirements
The Australian Government continues to have regard to developments in case law, including the High Court’s most recent decision on Commonwealth expenditure in Williams v Commonwealth [2014] HCA 23, as they contribute to the larger body of law relevant to the development of Commonwealth programs. In accordance with its general practice, the Government will continue to monitor and assess risk and decide on any appropriate actions to respond to risks of expenditure not being consistent with constitutional or other legal requirements.
Note 2: Events After the Reporting Period
The Commission was abolished with effect from 17 June 2015 following the passage of the National Water Commission (Abolition) Act 2015 (NWC Abolition Act). Accordingly, there were no subsequent events that had the potential to significantly affect the ongoing structure and financial activities of the Commission.
Note 3: Net Cash Appropriation Arrangements
2015 2014$'000 $'000
Total comprehensive income less depreciation/amortisation expenses previously funded through revenue appropriations1 1,270 389Plus: depreciation/amortisation expenses previously funded through revenue appropriation 57 241Total comprehensive income - as per the Statement of Comprehensive Income 1,327 630
1. From 2010-11, the Government introduced net cash appropriation arrangements, where revenue appropriations for depreciation/amortisation expenses ceased. Entities now receive a separate capital budget provided through equity appropriations. Capital budgets are to be appropriated in the period when cash payment for capital expenditure is required.

46National Water Commission Annual Report 2014–15
Note 4: Expenses
2015 2014$'000 $'000
Note 4A: Employee BenefitsWages and salaries 1,033 3,923Superannuation:
Defined contribution plans 95 443Defined benefit plans 209 298
Leave and other entitlements 164 452Separation and redundancies 927 32Total employee benefits 2,428 5,148
Note 4B: Suppliers
Goods and services supplied or renderedConsultants/contractors 170 597Travel 33 248Information and communication technology 224 449Property operating expenses 51 94Staff-related expenses 47 132General goods and services 337 343Total goods and services supplied or rendered 862 1,863
Goods supplied in connection withRelated parties 1 -External parties 18 21
Total goods supplied 19 21
Services rendered in connection withRelated parties 467 425External parties 376 1,417
Total services rendered 843 1,842Total goods and services supplied or rendered 862 1,863
Other suppliersOperating lease rentals in connection with
External partiesMinimum lease payments 329 557
Workers compensation expenses 13 26Total other suppliers 342 583Total suppliers 1,204 2,446
Note 4C: Write-Down and Impairment of Assets
Impairment of property, plant and equipment 2 -Impairment on intangible assets 3 -Total write-down and impairment of assets 5 -

47Section 5 Financial statements
Note 5: Own-Source Income
2015 2014$'000 $'000
Own-Source Revenue
Note 5A: Other Revenue
Resources received free of chargeRemuneration of auditors 44 53
Revenue from external entities 12 169Total other revenue 56 222
Note 6: Fair Value Measurements
The following tables provide an analysis of assets and liabilities that are measured at fair value.
The different levels of the fair value hierarchy are defined below.
Level 1: Quoted prices (unadjusted) in active markets for identical assets or liabilities that the entity can access at measurement date.
Level 2: Inputs other than quoted prices included within Level 1 that are observable for the asset or liability, either directly or indirectly.
Level 3: Unobservable inputs for the asset or liability.
Note 6A: Fair Value Measurements, Valuation Techniques and Inputs Used
Fair value measurements at the end of the reporting period For Level 2 fair value measurements
2015 2014Category
Valuation technique Inputs used$'000 $'000
Non-financial assetsProperty, plant and equipment
- 24 Level 2 Cost approach
Market cost at acquisitionand consumed economicbenefit/obsolescence of asset
Total non-financial assets - 24
The highest and best use of all non-financial assets are the same as their current use. No change in valuation technique occurred during the period.

48National Water Commission Annual Report 2014–15
Note 7: Financial Assets
2015 2014$'000 $'000
Note 7A: Trade and Other Receivables
Goods and services receivables in connection withRelated parties - 2External parties - 63
Total goods and services receivables - 65
Appropriations receivablesExisting programs 9,454 9,275
Total appropriations receivables 9,454 9,275
Other receivablesGST receivable from the Australian Taxation Office - 31FBT receivable from the Australian Taxation Office 4 -
Total other receivables 4 31Total trade and other receivables 9,458 9,371
Trade and other receivables aged as followsNot overdue 9,458 9,307Overdue by
0 to 30 days - 1031 to 60 days - 54
Total trade and other receivables 9,458 9,371
Credit terms for trade and other receivables were within 30 days (2013-14: 30 days).

49Section 5 Financial statements
Not
e 8:
N
on-F
inan
cial
Ass
ets
Not
e 8A
: Rec
onci
liatio
n of
the
Ope
ning
and
Clo
sing
Bal
ance
s of
Bui
ldin
gs, P
rope
rty,
Pla
nt a
nd E
quip
men
t and
Inta
ngib
les
Rec
onci
liatio
n of
the
open
ing
and
clos
ing
bala
nces
of b
uild
ings
, pro
pert
y, p
lant
and
equ
ipm
ent a
nd in
tang
ible
s fo
r 201
5
Leas
ehol
d im
prov
emen
tsPr
oper
ty, p
lant
an
d eq
uipm
ent
Com
pute
rso
ftwar
ein
tern
ally
deve
lope
d
Com
pute
rso
ftwar
epu
rcha
sed
Tota
l$’
000
$’00
0$’
000
$’00
0$’
000
As
at 1
Jul
y 20
14G
ross
boo
k va
lue
442
220
6434
61,
072
Acc
umul
ated
dep
reci
atio
n/am
ortis
atio
n an
d im
pairm
ent
(442
)(1
96)
(64)
(308
)(1
,010
)To
tal a
s at
1 J
uly
2014
-24
-38
62Im
pairm
ents
reco
gnis
ed in
net
cos
t of s
ervi
ces
-(2
)-
(3)
(5)
Dep
reci
atio
n/am
ortis
atio
n-
(22)
-(3
5)(5
7)To
tal a
s at
16
June
201
5-
--
--
Tota
l as
at 1
6Ju
ne 2
015
repr
esen
ted
byG
ross
boo
k va
lue
--
--
-A
ccum
ulat
ed d
epre
ciat
ion/
amor
tisat
ion
and
impa
irmen
t-
--
--
Tota
l as
at 1
6Ju
ne 2
015
--
--
-

50National Water Commission Annual Report 2014–15
Not
e 8A
(Con
t'd):
Rec
onci
liatio
n of
the
Ope
ning
and
Clo
sing
Bal
ance
s of
Bui
ldin
gs, P
rope
rty,
Pla
nt a
nd E
quip
men
t and
Inta
ngib
les
Rec
onci
liatio
n of
the
open
ing
and
clos
ing
bala
nces
of b
uild
ings
, pro
perty
, pla
nt a
nd e
quip
men
t and
inta
ngib
les
for 2
014
Leas
ehol
d im
prov
emen
tsP
rope
rty, p
lant
an
d eq
uipm
ent
Com
pute
rso
ftwar
ein
tern
ally
deve
lope
d
Com
pute
rso
ftwar
epu
rcha
sed
Tota
l$’
000
$’00
0$’
000
$’00
0$’
000
As
at 1
Jul
y 20
13G
ross
boo
k va
lue
442
221
6431
01,
037
Acc
umul
ated
dep
reci
atio
n/am
ortis
atio
n an
d im
pairm
ent
(290
)(1
18)
(59)
(236
)(7
03)
Tota
l as
at 1
Jul
y 20
1315
210
35
7433
4A
dditi
ons
-by
purc
hase
- -
- 36
36R
eval
uatio
ns a
nd im
pairm
ents
reco
gnis
ed in
oth
er c
ompr
ehen
sive
inco
me
-(2
0)-
(47)
(67)
Dep
reci
atio
n/am
ortis
atio
n(1
52)
(59)
(5)
(25)
(241
)To
tal a
s at
30
June
201
4-
24-
3862
Tota
l as
at 3
0 Ju
ne 2
014
repr
esen
ted
by
Gro
ss b
ook
valu
e44
222
064
346
1,07
2A
ccum
ulat
ed d
epre
ciat
ion/
amor
tisat
ion
and
impa
irmen
t(4
42)
(196
)(6
4)(3
08)
(1,0
10)
Tota
l as
at 3
0 Ju
ne 2
014
-24
-38
62
51Section 5 Financial statements
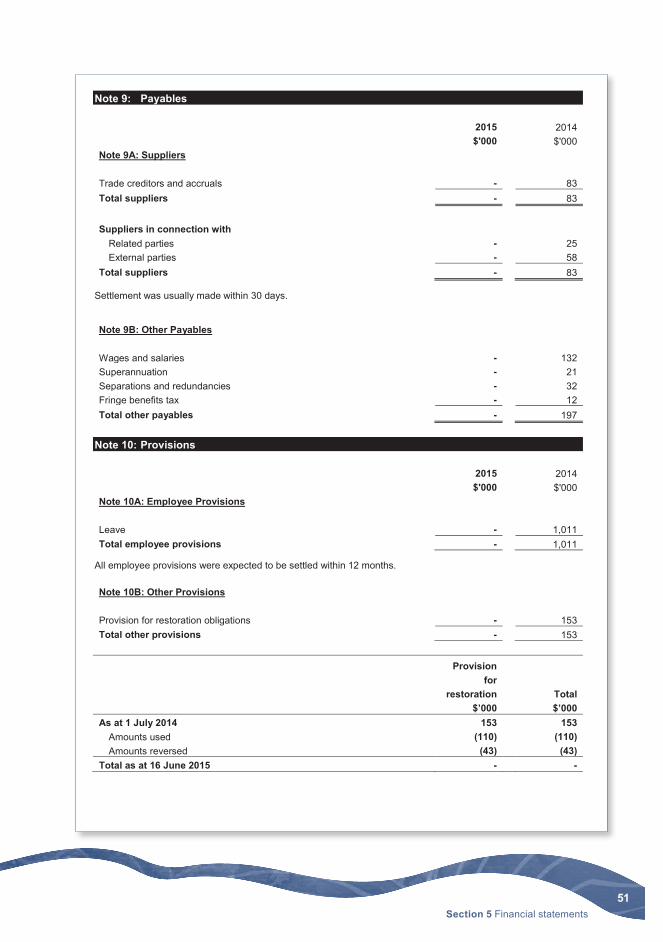
Note 9: Payables
2015 2014$'000 $'000
Note 9A: Suppliers
Trade creditors and accruals - 83Total suppliers - 83
Suppliers in connection withRelated parties - 25External parties - 58
Total suppliers - 83
Settlement was usually made within 30 days.
Note 9B: Other Payables
Wages and salaries - 132Superannuation - 21Separations and redundancies - 32Fringe benefits tax - 12Total other payables - 197
Note 10: Provisions
2015 2014 $'000 $'000Note 10A: Employee Provisions
Leave - 1,011Total employee provisions - 1,011
All employee provisions were expected to be settled within 12 months.
Note 10B: Other Provisions
Provision for restoration obligations - 153Total other provisions - 153
Provision for
restoration Total$’000 $’000
As at 1 July 2014 153 153Amounts used (110) (110)Amounts reversed (43) (43)
Total as at 16 June 2015 - -
52National Water Commission Annual Report 2014–15
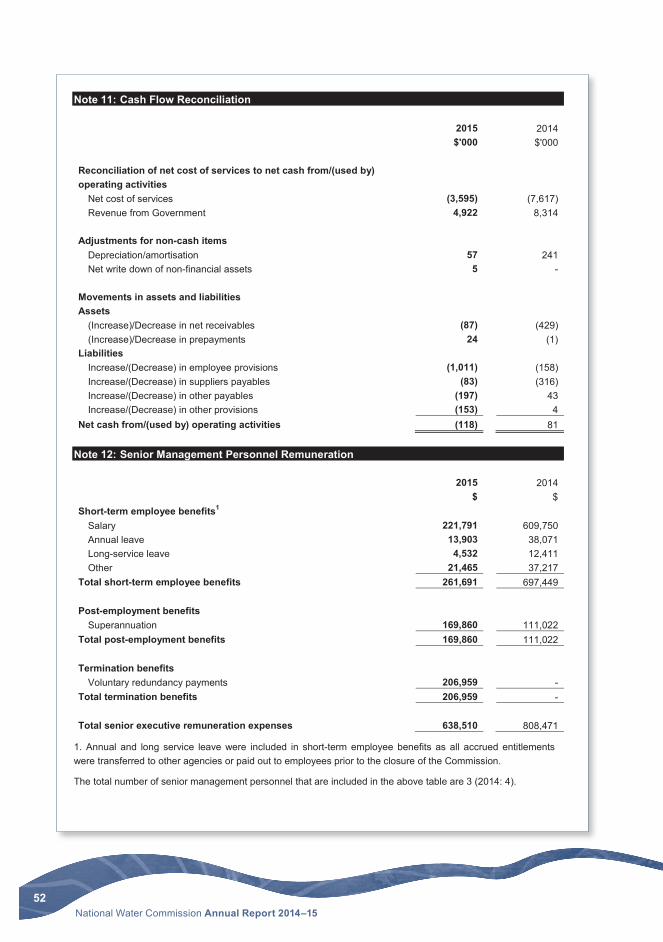
Note 11: Cash Flow Reconciliation
2015 2014$'000 $'000
Reconciliation of net cost of services to net cash from/(used by) operating activities
Net cost of services (3,595) (7,617)Revenue from Government 4,922 8,314
Adjustments for non-cash itemsDepreciation/amortisation 57 241Net write down of non-financial assets 5 -
Movements in assets and liabilitiesAssets
(Increase)/Decrease in net receivables (87) (429)(Increase)/Decrease in prepayments 24 (1)
LiabilitiesIncrease/(Decrease) in employee provisions (1,011) (158)Increase/(Decrease) in suppliers payables (83) (316)Increase/(Decrease) in other payables (197) 43Increase/(Decrease) in other provisions (153) 4
Net cash from/(used by) operating activities (118) 81
Note 12: Senior Management Personnel Remuneration
2015 2014$ $
Short-term employee benefits1
Salary 221,791 609,750Annual leave 13,903 38,071Long-service leave 4,532 12,411Other 21,465 37,217
Total short-term employee benefits 261,691 697,449
Post-employment benefitsSuperannuation 169,860 111,022
Total post-employment benefits 169,860 111,022
Termination benefitsVoluntary redundancy payments 206,959 -
Total termination benefits 206,959 -
Total senior executive remuneration expenses 638,510 808,471
1. Annual and long service leave were included in short-term employee benefits as all accrued entitlements were transferred to other agencies or paid out to employees prior to the closure of the Commission.
The total number of senior management personnel that are included in the above table are 3 (2014: 4).

53Section 5 Financial statements
Not
e 13
: App
ropr
iatio
ns
Not
e 13
A: A
nnua
l App
ropr
iatio
ns ('
Rec
over
able
GST
exc
lusi
ve')
Ann
ual A
ppro
pria
tions
for 2
015
App
ropr
iatio
n A
ctPG
PA A
ctAp
prop
riatio
n ap
plie
d in
201
5 (c
urre
nt a
nd
prio
r yea
rs)
Varia
nce
Sect
ion
51
dete
rmin
atio
nsAn
nual
Ap
prop
riatio
nAF
MSe
ctio
n 74
Sect
ion
75To
tal
appr
opria
tion
$'00
0$'
000
$'00
0$'
000
$'00
0$'
000
$'00
0$'
000
Dep
artm
enta
lO
rdin
ary
annu
al s
ervi
ces
4,92
2-
195
-5,
117
(4,9
38)
179
-To
tal d
epar
tmen
tal
4,92
2-
195
-5,
117
(4,9
38)
179
-
Ann
ual A
ppro
pria
tions
for 2
014
App
ropr
iatio
n Ac
tFM
A Ac
tA
ppro
pria
tion
appl
ied
in 2
014
(cur
rent
and
pr
ior y
ears
)V
aria
nce
Sec
tion
51
dete
rmin
atio
ns
Ann
ual
App
ropr
iatio
nA
FMS
ectio
n 31
Sec
tion
32To
tal
appr
opria
tion
$'00
0$'
000
$'00
0$'
000
$'00
0$'
000
$'00
0$'
000
Dep
artm
enta
lO
rdin
ary
annu
al s
ervi
ces
8,31
4-
216
-8,
530
(7,9
04)
626
-O
ther
ser
vice
sE
quity
1,23
8-
--
1,23
8-
1,23
8-
Tota
l dep
artm
enta
l9,
552
-21
6-
9,76
8(7
,904
)1,
864
-
54National Water Commission Annual Report 2014–15
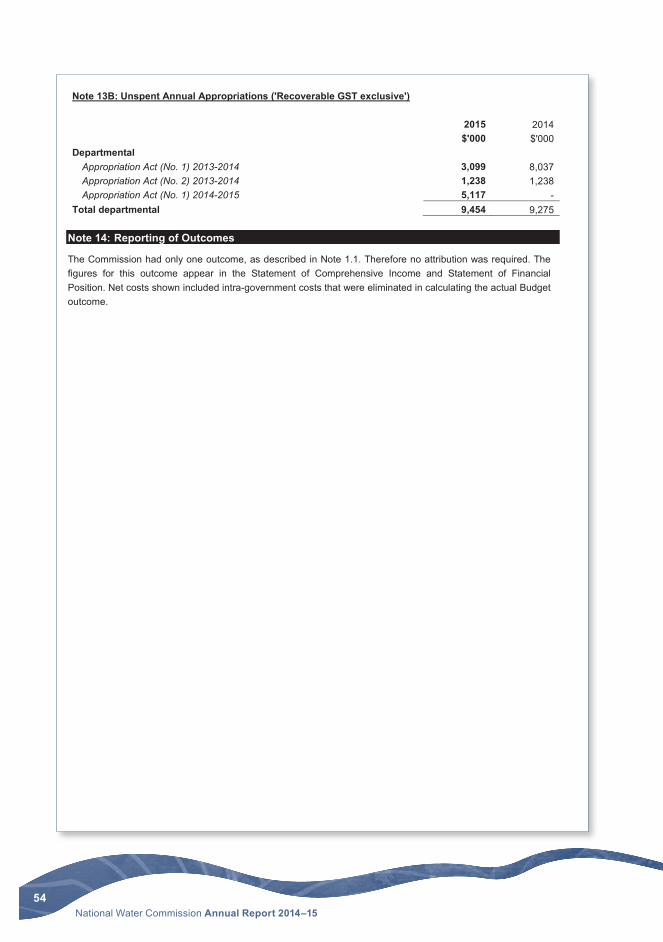
Note 13B: Unspent Annual Appropriations ('Recoverable GST exclusive')
2015 2014$'000 $'000
DepartmentalAppropriation Act (No. 1) 2013-2014 3,099 8,037Appropriation Act (No. 2) 2013-2014 1,238 1,238Appropriation Act (No. 1) 2014-2015 5,117 -
Total departmental 9,454 9,275
Note 14: Reporting of Outcomes
The Commission had only one outcome, as described in Note 1.1. Therefore no attribution was required. The figures for this outcome appear in the Statement of Comprehensive Income and Statement of Financial Position. Net costs shown included intra-government costs that were eliminated in calculating the actual Budget outcome.

55Section 5 Financial statements
Note 15: Budgetary Reports and Explanations of Major Variances
The following tables provide a comparison of the original budget as presented in the 2014-15 Portfolio Budget Statements (PBS) to the 2014-15 final outcome as presented in accordance with Australian Accounting Standards for the Commission. The Budget is not audited.
Note 15A: Departmental Budgetary Reports
Statement of Comprehensive Incomefor the period ended 16 June 2015 Actual Budget estimate
Original1 Variance2
2015 2015 2015$'000 $'000 $'000
NET COST OF SERVICESExpenses
Employee benefits 2,428 3,539 (1,111)Suppliers 1,204 1,436 (232)Depreciation and amortisation 57 129 (72)Write-down and impairment of assets 5 - 5
Total expenses 3,694 5,104 (1,410)
Own-Source IncomeOwn-source revenue
Other revenue 56 53 3Total own-source revenue 56 53 3
GainsMakegood provision reversals 43 - 43
Total gains 43 - 43Total own-source income 99 53 46
Net cost of services (3,595) (5,051) 1,456
Revenue from Government - Departmental appropriations 4,922 4,922 -Surplus/(Deficit) attributable to the Australian Government 1,327 (129) 1,456
OTHER COMPREHENSIVE INCOMEItems not subject to subsequent reclassification to net cost of services
Changes in asset revaluation surplus - - -Total comprehensive income/(loss) - - -
Total comprehensive income/(loss) attributable to the Australian Government 1,327 (129) 1,456
1. The Commission’s original budgeted financial statement that was first presented to parliament in respect of the reporting period (the 2014-15 Portfolio Budget Statements (PBS)).
2. Between the actual and original budgeted amounts for 2015. Explanations of major variances are provided further below.
56National Water Commission Annual Report 2014–15
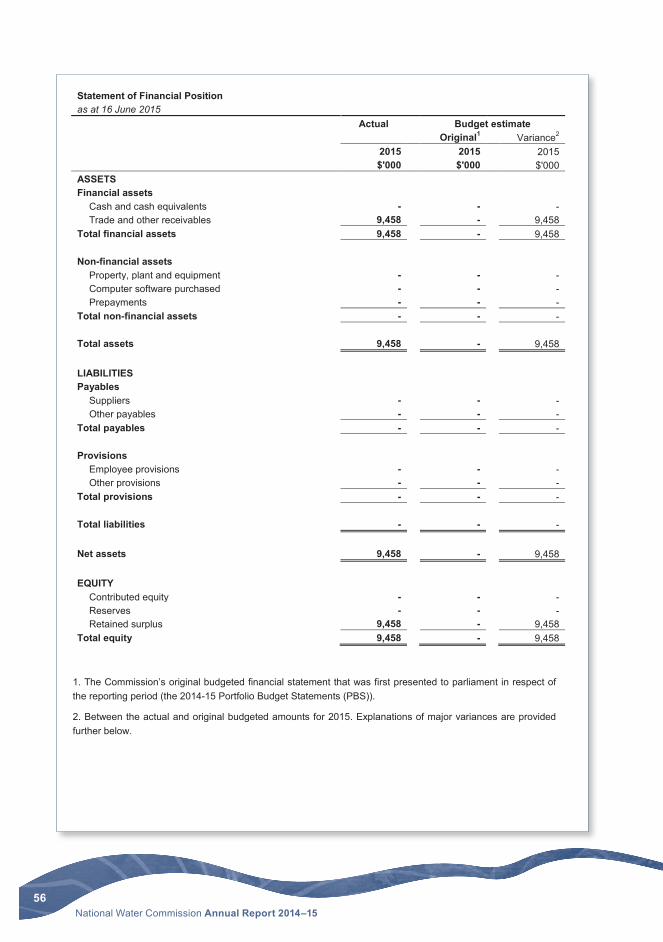
Statement of Financial Positionas at 16 June 2015
Actual Budget estimateOriginal1 Variance2
2015 2015 2015$'000 $'000 $'000
ASSETSFinancial assets
Cash and cash equivalents - - -Trade and other receivables 9,458 - 9,458
Total financial assets 9,458 - 9,458
Non-financial assetsProperty, plant and equipment - - -Computer software purchased - - -Prepayments - - -
Total non-financial assets - - -
Total assets 9,458 - 9,458
LIABILITIESPayables
Suppliers - - -Other payables - - -
Total payables - - -
ProvisionsEmployee provisions - - -Other provisions - - -
Total provisions - - -
Total liabilities - - -
Net assets 9,458 - 9,458
EQUITYContributed equity - - -Reserves - - -Retained surplus 9,458 - 9,458
Total equity 9,458 - 9,458
1. The Commission’s original budgeted financial statement that was first presented to parliament in respect of the reporting period (the 2014-15 Portfolio Budget Statements (PBS)).
2. Between the actual and original budgeted amounts for 2015. Explanations of major variances are provided further below.

57Section 5 Financial statements
Stat
emen
t of C
hang
es in
Equ
ityfo
r the
per
iod
ende
d 16
Jun
e 20
15R
etai
ned
earn
ings
Ass
et re
valu
atio
n su
rplu
sC
ontr
ibut
ed e
quity
/cap
ital
Tota
l equ
ityA
ctua
lB
udge
t est
imat
eA
ctua
lB
udge
t est
imat
eA
ctua
lB
udge
t est
imat
eA
ctua
lB
udge
t est
imat
eO
rigin
al1
Var
ianc
e2O
rigin
al1
Var
ianc
e2O
rigin
al1
Var
ianc
e2O
rigin
al1
Var
ianc
e2
2015
2015
2015
2015
2015
2015
2015
2015
2015
2015
2015
2015
$'00
0$'
000
$'00
0$'
000
$'00
0$'
000
$'00
0$'
000
$'00
0$'
000
$'00
0$'
000
Ope
ning
bal
ance
Bal
ance
car
ried
forw
ard
from
pre
viou
s pe
riod
4,44
43,
497
947
528
595
(67)
3,15
93,
159
-8,
131
7,25
188
0A
djus
ted
open
ing
bala
nce
4,44
43,
497
947
528
595
(67)
3,15
93,
159
-8,
131
7,25
188
0C
ompr
ehen
sive
inco
me
Sur
plus
/(Def
icit)
for t
he p
erio
d1,
327
(129
)1,
456
1,32
7(1
29)
1,45
6To
tal c
ompr
ehen
sive
inco
me
1,32
7(1
29)
1,45
6-
--
--
-1,
327
(129
)1,
456
Tota
l com
preh
ensi
ve in
com
e at
tribu
tabl
e to
Aus
tralia
n G
over
nmen
t1,
327
(129
)1,
456
--
--
--
1,32
7(1
29)
1,45
6Tr
ansa
ctio
ns w
ith o
wne
rsD
istr
ibut
ions
to o
wne
rsR
etur
ns o
f cap
ital
Cas
h tra
nsfe
rs to
the
OP
A-
(3,3
68)
3,36
8-
--
--
--
(3,3
68)
3,36
8E
quity
adj
ustm
ent o
n ce
ssat
ion
3,68
7-
3,68
7(5
28)
(595
)67
(3,1
59)
(3,1
59)
--
(3,7
54)
3,75
4To
tal t
rans
actio
ns w
ith o
wne
rs3,
687
(3,3
68)
7,05
5(5
28)
(595
)67
(3,1
59)
(3,1
59)
--
(7,1
22)
7,12
2C
losi
ng b
alan
ce a
t per
iod
end
9,45
8-
9,45
8-
--
--
-9,
458
-9,
458
Clo
sing
bal
ance
attr
ibut
able
to th
e A
ustr
alia
n G
over
nmen
t9,
458
-9,
458
--
--
--
9,45
8-
9,45
8
1. T
he C
omm
issi
on’s
orig
inal
bud
gete
d fin
anci
al s
tate
men
t tha
t was
firs
t pre
sent
ed to
par
liam
ent i
n re
spec
t of t
he re
porti
ng p
erio
d (th
e 20
14-1
5P
ortfo
lio B
udge
t Sta
tem
ents
(P
BS
)).
2. B
etw
een
the
actu
al a
nd o
rigin
al b
udge
ted
amou
nts
for 2
015.
Exp
lana
tions
of m
ajor
var
ianc
esar
e pr
ovid
ed fu
rther
bel
ow.

58National Water Commission Annual Report 2014–15
Cash Flow Statementfor the period ended 16 June 2015
Actual Budget estimateOriginal1 Variance2
2015 2015 2015$'000 $'000 $'000
OPERATING ACTIVITIESCash received
Appropriations 4,938 6,507 (1,569)Net GST received 111 - 111Other 74 - 74
Total cash received 5,123 6,507 (1,384)
Cash usedEmployees 3,636 4,859 (1,223)Suppliers 1,410 1,599 (189)Section 74 receipts transferred to OPA 195 - 195
Total cash used 5,241 6,458 (1,217)Net cash from/(used by) operating activities (118) 49 (167)
INVESTING ACTIVITIESCash used
Purchase of property, plant and equipment - 230 (230)Total cash used - 230 (230)Net cash from/(used by) investing activities - (230) 230
Net increase/(decrease) in cash held (118) (181) 63Cash and cash equivalents at the beginning of the reporting period 118 181 (63)Cash and cash equivalents at the end of the reporting period - - -
1. The Commission’s original budgeted financial statement that was first presented to parliament in respect of the reporting period (the 2014-15 Portfolio Budget Statements (PBS)).
2. Between the actual and original budgeted amounts for 2015. Explanations of major variances are provided further below.

59Section 5 Financial statements
Note 15B: Departmental Major Budget Variances for 2015
Explanations of major variances Affected line items (and statement)Employees / Suppliers / AppropriationsThe Commission was appropriated funding in 2014-15 to meet the cost of the completion of its Triennial Assessment report and subordinate reports and for closure activities. Employee expense funding was based on a stepped reduction in staff resources and the payment of separation costs if needed. The variance is due to the earlier than expected departure of staff and the non-payment of separation costs where staff transferred to other Commonwealth agencies.
Employee benefits and Suppliers (Statement of Comprehensive Income),Appropriations, Employees and Suppliers (Cash Flow Statement)
Depreciation and amortisationDepreciation and amortisation expense was lower thananticipated due to asset value adjustments made at 30 June 2014 to reflect reduced asset useful lives as a result of the proposed closure of the Commission.
Depreciation and amortisation (Statement of Comprehensive Income)
Gains / Purchase of property, plant and equipmentLower than expected costs for makegood activities on the Commission’s leased office premises resulted in a $43,000 write-back of the associated provision for restoration.The budget provided equity funding for the makegood of the Commission’s leased office premises. The actual makegood expenditure was funded by operating appropriations.
Makegood provision reversals (Statement of Comprehensive Income) Purchase of property, plant and equipment(Cash Flow Statement)
Trade and other receivables / EquityThe budget was prepared on the assumption that the Commission’s unspent annual appropriations would be formally reduced prior to the Commission’s cessation date.
Trade and other receivables, Retained surplus (Statement of Financial Position /Statement of Changes in Equity)