national urban transport improvement project...
TRANSCRIPT

National Urban Transport
Improvement Project (BRT)KenyaJune 25, 2015
Team:James TheuriWalter NyatwangaMohamed AbdullahiChristine OgutDenis OdeckPatrick MwinziKavita SethiWendy AyresJonathan Hall Julia BirdSusumu Yoshida

Intervention Summary
• The project is intended to implement a 25km BRT service from JKIA (Airport) through the CBD to the western side of the city
• The objective is to reduce congestion,improve mobility and access to services

Evaluation Questions
• What is the impact of the BRT (Ndovu Line) along the A104 corridor on: -
(i) Access to employment and services?
(ii) Location of economic activities?
(iii) Land use and land values?
• How can we induce modal shift amongst pedestrians, car users and matatu (mini bus) users?
• Two experimental designs for the two categories of users

Evaluation Design (RCT 1)
• Pedestrians: Intervention – fare subsidy
• Influence: price
• Treatment group 1: high subsidy (300)
• Treatment group 2: medium subsidy (300)
• Treatment group 3: low subsidy (300)
• Control group: no subsidy (300)
Testing causal impact of prices on modal shift among pedestrians, and subsequent economic
outcomes

Evaluation Design (RCT 2)
• Car and Matatu users: Intervention – information
• Influences: speed, reliability
• Treatment group: receive morning phone texts with travel time info on both modes (BRT and car/Matatu) - sample size (1000)
• Control group: no information provided – sample size (1000)
Testing causal impact of information to car users and matatu on modal shift and economic outcomes

Data collection
1. Household survey
– Household characteristics
– Household location
– Job location
– Commuting time
– Mode of transport
2. Cell phone surveys

Implementation Timeline
• Two waves of survey work – baseline and follow up:
(i) Implement experiments within a defined time window (say 6 months) before start of the BRT
(ii) Same experiments 6 months after start of BRT
• Frequent cellular contacts to determine monthly changes in commuter patterns and jobs

Presentation
ends
here

Impact Evaluation of Dar es SalaamBus Rapid Transit (BRT) System
TanzaniaJune 25, 2015

Intervention SummaryDevelopment Objective: “To support Tanzania’s economicgrowth by providing enhanced urban transport facilities thatare reliable and cost effective”
Components to be Evaluated:
• Phase 1 of a Bus Rapid Transit system in Dar esSalaam (DART System phase 1)
• Accompanying activities: – protect the poor from displacement and
expropriation due to rising land values and/or speculation
– manage public expectations and head off conflict with existing service providers (daladalas)
• Evaluate BRT expansion in Phases 2-6

Evaluation QuestionsPrimary Question:
[P1] Can improving public transportation via a DART system
– Reduce travel times and increase urban mobility?
– Increase employment and growth by reducing job searchcosts and raising worker and firm productivity?
– Increase inter-firm trade and competition between markets?
– Improve air quality by displacing polluting vehicles, reducingprivate vehicle use and lowering vehicle idle time?
– Increase road safety, via fewer vehicles and better roads?
– Improve individual welfare, by increasing commuter income,health, leisure consumption, and property values?

Secondary Questions:
[S1] Can short-term incentives (1 week free BRTtravel) nudge people into regularly using publictransport?
[S2] Can access to land/residential license/title protectpoor homeowners from displacement andexpropriation by speculators?
[S3] Can rent subsidies protect the poor fromdisplacement?

Evaluation Design
Two strategies:1. Difference-in-Differences
– Compare “control” individuals (for whom travel route via BRT is equivalent to route via daladalas) to “treatment” individuals (whose travel routes are affected)
– Use variation in treatment intensity (proximity to BRT terminal) to identify treatment effects
2. Randomized Controlled Trial– Encouragement design: offer randomly selected group
of ~1000 commuters free BRT passes for one week– Measure outcomes before and periodically after, for an
appropriate time to be decided
Improving public transport:

Strategy 1:1. Difference-in-Differences
– Compare “control” individuals (for whom travel route via BRT is equivalent to route via daladalas) to “treatment” individuals (whose travel routes are affected)
– Use variation in treatment intensity (proximity to BRT terminal) to identify treatment effects
2. Randomized Controlled Trial– Encouragement design: offer randomly selected group
of ~1000 commuters free BRT passes for one week– Measure outcomes before and periodically after, for an
appropriate time to be decided

1. Difference-in-Differences
All locations 1 hr travel time from central Dar
Before BRT is introduced
1 hourw/ daladalas
Control
Treatment

i
1. Difference-in-Differences
All locations 1 hr travel time from central Dar
After BRT is introduced
15 minsw/ BRT
Control
Treatment

Strategy 2:1. Difference-in-Differences
– Compare “control” individuals (for whom travel route via BRT is equivalent to route via daladalas) to “treatment” individuals (whose travel routes are affected)
– Use variation in treatment intensity (proximity to BRT terminal) to identify treatment effects
2. Randomized Controlled Trial– Encouragement design: offer randomly selected group
of ~1000 commuters free BRT passes for one week– Measure outcomes (including sustained use/change in
travel habits) before and periodically after, for an appropriate time to be decided

i
2. Randomized Controlled Trial
Control
Treatment

Protecting the poorProblem: Poor homeowners/renters displaced due to rising rents/speculative land purchasesTwo treatments:1. Land titles
– Finance purchase of land licenses/titles for 1,000 land/homeowners randomly selected from 500m band alongside BRT corridor
– Provide information about expected future land values to discourage immediate land sales
2. Rent subsidy– Provide $10-40 monthly rent subsidy (using external funds) to
offset expected rent increases for 1,000 renters randomly selected from 500m band alongside BRT corridor
Evaluation Design

Managing expectationsProblem: Public and daladala owners upset about disruption to regular commute, facing higher costs / reduced profits
Possible treatment: Public information campaign
– Provide information about travel time, safety, comfort
– Target randomly selected individuals using robocalls, text messages
– Possible variation: User testimonials about satisfaction with BRT
Evaluation Design

• Existing data– Traffic demand surveys (2007, 2008, 2011)
• Collected by DART Agency• Data on pre-BRT commute times for all planned phases
– 2012 census• Information on demographics, land ownership, assets, firms
• Planned survey data collection– Baseline and follow-up data to be collected in and around
planned BRT expansion areas• Will also be used as baseline for future expansion (Phases 2-6)
– Outcomes include commute times, usage, willingness to pay, subjective satisfaction, demographics, income, employment, consumption, etc.
Sample and Data

Thank you

Lima Metro Line 2
PeruJune 25, 2015

Intervention summary
25
Objective: Improve accessibility and reduce emissions
Target population2,261,804
Population in 13 districts2,412,724
Travel demand per day660,000
35 Km – 35 stations – 13 districts

Evaluation QuestionsFirst order questions:
• What is the impact of the metro line on:
– accessibility (job, education, health)?
– housing values?
– on job generation in surrounding areas?
– emissions and noise in surrounding areas?
– on quality of life (income, assets, health, education)?
Second order questions:
• Impact on the demand of the metro and other outcomes of:
– different information campaigns?
– different levels or types of incentives?
– different Transit Oriented Development Initiatives around stations?
Intermediate outcomes
Final outcomes

Existing data
• Household level data (Baseline JICA 2011 O/D Travel Survey)– 22.700 households and 78.850 people
– Assets, mobility patterns, education, employment, household composition, income, etc.
• Housing values data (Municipality cadastral and Capeco data)
• Air quality data (Cleaner Air Institutional Committee)
Data collectionHousehold survey sample
• Step 1: Stratified random sampling within predetermined bands around the metro corridors using JICA sample
• Step 2: Use matching methods to select the best control households, excluding those close to connections to the metro (aprox. 4000 households)
• Step 3: Collect panel data (every two years) on balanced (pre-matched) subsample, giving them ICT devices

T T
T
T
T
T
TT
C
CC
C
CC
C
C Matched ~ 1,300 Control Households (C)
Stratified Random sampling~ 2,700 Treatment Households (T)
Household survey sample

Evaluation Design
Phase 1:
• Difference-in-Differences estimation (Fixed effects regression)
Phase 2:
• Experimental design
– Random promotion (information and/or incentives) to subset of treatment HHs
– Evaluate the impact of the promotion per se
• Instrumental variables: Use the promotion as an IV to estimate the impact of using the metro

Timeline
2015 – Finalize Evaluation Design- Funds / Sampling Frame
2016 – Pilot Survey – Focus groups - Baseline
2017 – Random Promotion
2018 – 2nd Survey
2020 – 3rd Survey
2022 – 4th Survey

That’s all folks!

Team and staffing
• Ministerio de Transportes y Comunicaciones y AATE
• World Bank, IDB, CAF
• External researchers

Budget
• Surveys: US$ 50 per HH, US$ 30 Data plan promotional, 4000 HHs: US$ 320,000 per wave
• Number of Waves: 4
• Institutional strengthening:
• 2 External Researchers:
• Staff time:
• Quality control:

Rio de Janeiro:Enhancing Public Management for Service Delivery Project
BrazilJune 25, 2015

Equipe
Roberto Motta (SETRANS) Daniel Pulido (World Bank)
Luis Gustavo Martins (SEASDH) Kate Vyborny (Duke University)
Adriana Mota (SEASDH) Nilesh Fernando (Harvard University)
Henrique Futuro (SETRANS) Florence Kondylis (World Bank)
Kaio Marcio de Pava (SEASDH) Rita Damasceno (World Bank)
Julio Nascimento (PUC-RJ) Astrid Zwager (World Bank)
Washington Faustino (PUC-RJ) Jonathan Doyle (Premise)
Niki Sri-Kumar (Premise)

Componentes a serem avaliados
Componente 1 - Transport subsidy targeting
Componente 2 - Gender segregated public transport
Componente 3- Using Public Transport to Improve Womens’ Access to GBV Services• What are the relevant constrains to seek access to
GBV targeted public services?• Is information on the types of violations and services
offered sufficient or are there other barriers like fear of retaliation, transportation, etc.? The assessment of potential barriers will feed into the design of an IE to test how to overcome these additional barriers.

Component 1: Intervention Summary
• Objective: Target the Single Fare Policy (Bilhete Unico Intermunicipal-BUI): Key social program of the State: 1 million trips per day
• Components to be evaluated:
– Inter-municipal transport service (Suburban rail, ferries, long haul buses)

Evaluation Questions
• Is the subsidy policy benefiting those who need it the most?
• Does the subsidy have an impact on the income of those who benefit?– How do impacts differ by gender, education and other
characteristics, and how can this help improve targeting?
• What other benefits could be obtained by changing the subsidy rules?– To increase impact on incomes– To reduce social costs (congestion, CO2 emissions)

Evaluation Design
• Natural experiment – using change time window for transport subsidy change
• Treatment group: Live far enough away to be affected by this change
• Control group: people who are indifferent to change
Sample and Data
• Main Data:
– Fare card data from users
• Survey
• Additional Data
– Micro data from urban transport master plan
– Origin-Destination Survey results

Timeline
• Confirm data availability: July 2015
• Review additional sources of data: July-August 2015
• Prepare detailed concept: September 2015
• First mission: October 2015
• Implementation: October 2015-2016

Componente 2: Intervenção
Vagão exclusivo no Sistema de Trem e Metro:
• Um grande número de mulheres sofrem assédiono transporte público, gerando a necessidade de uma política que possa garantir a segurança das passageiras durante o seu deslocamento
• Lei 4733/2006: As empresas que administram o sistema ferroviário e metroviário no Estado do Rio de Janeiro ficam obrigadas a destinarem vagões exclusivamente para mulheres.

Vagão Rosa
Horário 6h – 9h 17h – 20h

Pergunta de Pesquisa
Qual a efetividade da política pública de vagãoexclusivo para mulheres na redução da suavulnerabilidade ao assédio nos transportesurbanos?

Desenho da Avaliação
Tempo
Ho
rári
od
o d
ia
Linha de baseStatus quo
Melhora na visibilidadee cumprimento da lei
Extenção do horário
6h
–9
h1
7h
–2
0h
10
h –
5h
21
h –
16
h

Desenho da Avaliação
Tempo
Ho
rári
od
o d
ia
Grupo de Controle
Grupo de Controle
Grupo de Tratamento
Grupo de Tratamento
Linha de baseStatus quo
Melhora na visibilidadee cumprimento da lei
Extenção do horário
6h
–9
h1
7h
–2
0h
AvaliarImpacto da melhora do cumprimento

Desenho da Avaliação
Tempo
Ho
rári
od
o d
ia
Melhora na visibilidadee cumprimento da lei
6h
–9
h1
7h
–2
0h
Avaliarimpactodo vagão:
RDD + Diff-em-Diff
21h
Extenção do horário
* * * * * *
* * * * * * *
* ** * * * * *
* * * * * *
* * * * * ** * * * * * *
* * * * * * * * *
* * * * * * * * *
16h
* * * * * * *
* * * * * * *
* * * * * * * * * * * * *
* * * * * * ** * * * * *

Desenho da Avaliação
Assédio
Tempo
Extenção do horário
20:30h
19:30h
**
**
* **
**
* ** *
*
* ** *
*
*
*
* ** *
*
*
*
* ** *
** *
* ** *
*
*
*
* ** *
**
*
**
* **
**
* ** *
**
** ** *
*

Data Collection Phase 1
Days 1 - 30:
1. Build an initial baseline network of
50-60 local women distributed
across the system
2. Build and test geo-sample frame
3. Complete and test infrastructure
4. Begin to test four sample
methodologies
a. 1 or 2 Hour Sessions
b. 3-5 Station Rides
c. Control Ride
d. Platform Survey
5. Investigate Question Format
a. Subject questions only
b. Subway status questions plus
subject
c. Control questions (no
harassment)
Key: We don’t know so gather a lot of data
1. ~50 ppl X 2 rides per day X 5 days a week X
2 weeks = 1000 rides in 2 Weeks

Data Collection - Phase 2
Baseline Enforcement Extension
Objective: Have the network // Drive a lot of capture
Days 31 - 60:
1. Determine whether network size is
optimal
2. Finalize ride modalities
3. Operationalize Network
4. Finalize Sample Methodology
5. Drive Volume
Key: Frequently review data coming in
1. ~60 ppl X 2 rides per day X 5 days a
week X 4 weeks = 2400
Observations in 4 Weeks
-Ride 1 - 2 Hours
-Answer multiple
questions // not just
subject questions
-Ride 4 Stops
-Answer multiple
questions // subject
only
-Stand on Metro
platform
-Observe for 20
minutes
-Ride the train
-Observe for 20
minutes

Objective: Add enforcement activity to survey
Days 61 - 90:
1. Review network
2. Add questions / attempt to keep
modalities
3. Monitor Network (bias)
4. Monitor Methodology
Key: Frequently review data coming in
1. ~60 ppl X 2 rides per day X 5 days a
week X 4 weeks = 2400
Observations in 4 Weeks
-Ride 1 - 2 Hours
-Answer multiple
questions // not just
subject questions
-Ride 4 Stops
-Answer multiple
questions // subject
only
-Stand on Metro
platform
-Observe for 20
minutes
-Ride the train
-Observe for 20
minutes
Baseline Enforcement Extension
Data Collection - Phase 3

Objective: Add Time Extension to Survey
Days 91 - 120:
1. Review Network
2. Add questions / attempt to keep
modalities
3. Monitor Network (bias)
4. Monitor Methodology
Key: Frequently review data coming in
1. ~60 ppl X 3 rides per day X 5 days a
week X 4 weeks = 3600
Observations in 4 Weeks
-Ride 1 - 2 Hours
-Answer multiple
questions // not just
subject questions
-Ride 4 Stops
-Answer multiple
questions // subject
only
-Stand on Metro
platform
-Observe for 20
minutes
-Ride the train
-Observe for 20
minutes
Baseline Enforcement Extension
Data Collection - Phase 4

Application

OBRIGADA!!

Pro poor incentives to public transport
ColombiaJune 25, 2015

Intervention Summary
• Objective: The objective of the project is to improve the affordability ofpublic transport and the mobility of poor and marginal individuals ofBogotá in order to increase their access to labor market opportunities andimprove their quality of life.
• Components to be evaluated: pro-poor subsidy for users of the TransMilenio BRT targeting persons with a SISBEN score less than or equal to 40. We will evaluate different budget-neutral subsidy designs.
• Primary outcomes : labor market and quality of life outcomes
• Currently each eligible person receives a 50% subsidy for up to 40 trips (36,000 COP per month)
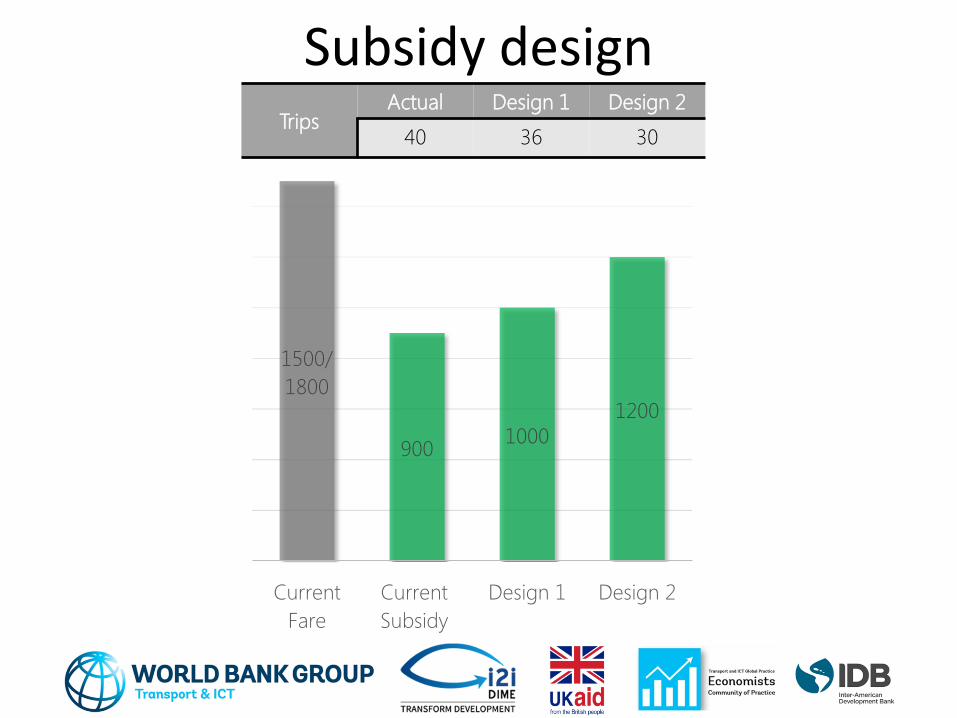
1500/
1800
9001000
1200
Current
Fare
Current
Subsidy
Design 1 Design 2
TripsActual Design 1 Design 2
40 36 30
Subsidy design
Evaluation Questions
1. Does the subsidy increase use of the Transmilenio system?
2. Which subsidy design is most effective in increasing use?
3. Which subsidy design has the greatest positive impacts on labor market and quality-of-life outcomes?

Bogota population
Eligibles(Sisben <40)
Ineligibles(Sisben >40)
Claim No Claim
Use No use
RCT
1 2 3 Pure
control
Evaluation Design
Sample and DataData: 1. SISBEN data: National program (administered by local governments) which seeks
to classify individuals’ eligibility for different social programs 2. Secretary of Mobility- Transmilenio data: Information related to public
transportation3. Baseline data (dedicated questionnaire)4. Follow up data (dedícated questionnaire; at least one round; maybe high-
frequency data collection through mobile phones)
Sample:Criteria to be considered in the design and sample selection and randomization of the subsidy:• It is intended to be representative by gender: analyze heterogeneous effects of the
subsidy.• Stratify by “clusters” of SISBEN score (e.g. 0-10; 11-20; etc.) • Reference outcomes for sample size calculations: likelihood of being employed,
labor income per hour, victimization

Timeline
1. Proposal of evaluation and intervention design to the Capital District. Discussion of modalities of intervention and impact assessment - April 2016
2. Preparation of concept note by the research team equipment - July 2016
3. Selection of participants (invitation) –September 2016
4. Baseline – October - November 2016

Thank you!
Wuhan Integrated
Transport Development ChinaJune 25, 2015

Intervention SummaryProject objective: Improve Transport Efficiency, Management, and Planning in Wuhan.
• Big Data Center
• Platforms to make information available
• Pilot projects
Data enables:
• Better decision making and more efficiency (users and authorities)
• New types of interventions (pilots)
• Better impact evaluations

Evaluation Questions
• Pilot 1: Public Transport Information1. What is the impact of providing users with Bus location and occupancy on a) ridership b) user satisfaction?
• Pilot 2: Smart Parking2. What is the impact of providing users with Smart Parking information on congestion?
• Pilot 3: Intelligent Traffic management pilot
3. What is the impact of providing users with expressway traffic information on congestion?

Evaluation Design
• Experimental variation of sign functionality.
• Signs ON/OFF several times using an experimental methodology during a trial period.
• We expect congestion to fall and driving patterns to change where signs are active.

Evaluation Design (2)
ON OFF

Sample and Data
Real time Data:
- Speed on segments between links on express way
- Traffic volume
- Other (weather, time, accidents)
Sample:
- Daily congestion level.

Thank you!

Timeline
• Data collection is already in place.
• Pilot 1: Intelligent Transport Systems in specific expressways starts in the later 2016.
• Pilot 2: Smart Parking Area starts this year
• Pilot 3: Public Transport Information starts in the beginning of 2017