national survey report of pv power applications in the ... · pv power applications in the...
TRANSCRIPT

National Survey Report of
PV Power Applications in
the Netherlands 2013
Prepared by
RVO, Netherlands Enterprise Agency
1 of 22
TABLE OF CONTENTS
Foreword ......................................................................................................... 3
Introduction ..................................................................................................... 3
1 INSTALLATION DATA .......................................................................................... 4
1.1 Applications for Photovoltaics ................................................................... 4
1.2 Total photovoltaic power installed ............................................................. 4
2 COMPETITIVENESS OF PV ELECTRICITY ................................................................... 6
2.1 Module prices ........................................................................................ 6
2.2 System prices ......................................................................................... 6
2.3 Financial Parameters and programs (leasing…) .............................................. 7
2.4 Additional Country information ................................................................. 7
3 Policy Framework .............................................................................................. 8
3.1 Direct support policies ............................................................................. 8
3.2 Direct Support measures .......................................................................... 8
3.2.1 Support measures exiting in 2013 .................................................... 8
3.2.2 Support measures phased out in 2013 .............................................. 10
3.2.3 New support measures implemented in 2013 .................................... 10
3.2.4 Measures currently discussed but not implemented yet ....................... 10
3.2.5 Financing and cost of support measures ............................................ 10
3.3 Indirect policy issues ............................................................................... 10
3.3.1 International policies affecting the use of PV Power Systems ................. 10
3.3.2 The introduction of any favourable environmental regulations .............. 10
3.3.3 Policies relating to externalities of conventional energy ....................... 10
3.3.4 Taxes on pollution (e.g. carbon tax) .................................................. 10
3.3.5 National policies and programmes to promote the use of PV in
foreign non-IEA countries ......................................................................... 10
4 Highlights of R&D .............................................................................................. 11
4.1 Highlights of R&D .................................................................................... 11
4.2 Public budgets for market stimulation, demonstration / field test
programmes and R&D ........................................................................................ 11
5 Industry ........................................................................................................... 12
5.1 Production of feedstocks, ingots and wafers (crystalline silicon industry) ......................................................................................................... 12
5.2 Production of photovoltaic cells and modules (including TF and CPV)................. 12
5.3 Manufacturers and suppliers of other components ........................................ 13
2 of 22
6 PV IN THE ECONOMY ......................................................................................... 14
6.1 LABOUR PLACES ..................................................................................... 14
6.2 Business value ........................................................................................ 14
7 Interest from electricity stakeholders .................................................................... 15
7.1 Structure of the electricity system .............................................................. 15
7.2 Interest from electricity utility businesses .................................................... 15
7.3 Interest from municipalities and local governments ....................................... 15
8 Standards and codes .......................................................................................... 16
9 Highlights and prospects ..................................................................................... 16
Annex A Literature ...................................................................................................... 17
Definitions, Symbols and Abbreviations ............................................................................ 18

3 of 22
Foreword
The International Energy Agency (IEA), founded in November 1974, is an autonomous body within
the framework of the Organisation for Economic Co-operation and Development (OECD) which
carries out a comprehensive programme of energy co-operation among its 23 member countries.
The European Commission also participates in the work of the Agency.
The IEA Photovoltaic Power Systems Programme (IEA-PVPS) is one of the collaborative R & D
agreements established within the IEA and, since 1993, its participants have been conducting a
variety of joint projects in the applications of photovoltaic conversion of solar energy into electricity.
The 24 participating countries are Australia (AUS), Austria (AUT), Belgium (BEL), Canada (CAN), China
(CHN), Denmark (DNK), France (FRA), Germany (DEU), Israel (ISR), Italy (ITA), Japan (JPN), Korea
(KOR), Malaysia (MYS), Mexico (MEX), the Netherlands (NLD), Norway (NOR), Portugal (PRT), Spain
(ESP), Sweden (SWE), Switzerland (CHE), Thailand (THA), Turkey (TUR), the United Kingdom (GBR)
and the United States of America (USA). The European Commission (EC), the European Photovoltaic
Industry Association (EPIA), the US Solar Electric Power Association (SEPA), the US Solar Energy
Industries Association (SEIA) and the Copper Alliance are also members.
The overall programme is headed by an Executive Committee composed of one representative from
each participating country or organization, while the management of individual Tasks (research
projects / activity areas) is the responsibility of Operating Agents. Information about the active and
completed tasks can be found on the IEA-PVPS website www.iea-pvps.org
Introduction
The objective of Task 1 of the IEA Photovoltaic Power Systems Programme is to promote and
facilitate the exchange and dissemination of information on the technical, economic, environmental
and social aspects of PV power systems. Task 1 activities support the broader PVPS objectives: to
contribute to cost reduction of PV power applications, to increase awareness of the potential and
value of PV power systems, to foster the removal of both technical and non-technical barriers and to
enhance technology co-operation. An important deliverable of Task 1 is the annual “Trends in
photovoltaic applications” report. In parallel, National Survey Reports are produced annually by
each Task 1 participant. This document is the country National Survey Report for the year 2013.
Information from this document will be used as input to the annual Trends in photovoltaic
applications report.
The PVPS website www.iea-pvps.org also plays an important role in disseminating information
arising from the programme, including national information.
Cover: Private house design by owner M. de Graaf with 125 m2 of solar panels.

4 of 22
1 INSTALLATION DATA
The PV power system market is defined as the market of all nationally installed (terrestrial) PV
applications with a PV capacity of 40 W or more. A PV system consists of modules, inverters,
batteries and all installation and control components for modules, inverters and batteries. Other
applications such as small mobile devices are not considered in this report.
For the purposes of this report, PV installations are included in the 2013 statistics if the PV
modules were installed and connected to the grid between 1 January and 31 December 2013,
although commissioning may have taken place at a later date.
1.1 Applications for Photovoltaics
In the Netherlands the PV market is divided in 6 segments or sub-segments:
1. Grid-connected systems (division based on the SDE-scheme)
a. large systems: more than 100 kW
b. medium-sized systems: less than 100 kW, but more than 15 kW
c. small systems: less than 15 kW
2. Off-grid:
a. stand-alone systems (parking meters, sluices and locks, flood gates, emergency telephones,
buoys etc.)
b. mobile systems (caravan’s, mobile homes, ships, mobile road marking, etc.)
c. consumer goods (watches, battery chargers, radio’s, garden lights, etc.)
There appears to be little activity in segments 2a stand alone systems and 2b mobile systems. No
market information is available for segment 2c, consumer goods, as these are not registered as
PV products. Since 2004, the off-grid market stabilized at a level of 5 MW.
1.2 Total photovoltaic power installed
The total cumulative installed PV power in the Netherlands at the end of 2013 was 739 MW
(source: CBS Dec 2014). The growth of the cumulative installed power in 2013 was 375 MW. The
annual growth and the cumulative installed power are given in table 1.
Table 1: PV power installed
Cumulative installed power
2007* 2008* 2009* 2010** 2011** 2012**
2013**/***
Total [MW] 53.1 57.2 67.5 88.2 145 365 739
Increase compared to level year before [%]
8 % 18 % 31 % 64 % 152 % 103 %
Increase [MW] 4.1 10.3 20.7 58 220 375
Increase compared to increase year before [%]
250 % 200 % 275 % 387 % 170 %
* Until 2009, the installed capacity was fairly accurately known. Almost all solar panels were installed with grants and thus registered. ** From 2010 the error rate increased. Falling prices and the possibility of net metering (by law since 2004, for grid connections of 3 x 80 A or less) made it also interesting for individuals to install panels without a subsidy. *** According to the Association of Energy Network Operators in the Netherlands the total cumulative installed PV power is about 762 MW in July 2014 [5].
Table 2: Data collection process:
Is the collection process done by an official body or CBS

5 of 22
a private company/Association?
Link to official statistics (if this exists) http://statline.cbs.nl
Additional comments on market and data
collection:
Accurancy: 20% [13]
Table 3: PV power and the broader national energy market [source CBS].
MW-GW for capacities and GWh-
TWh for energy
2013 numbers 2012 numbers
Total power generation capacities
(all technologies)
3255 PJ 3269 PJ
Total electricity production in GWh
(renewables including hydropower)
11992 GWh 12532 GWh
Total electricity production as a %
of total electricity consumption
(renewables including hydropower)
10,12% 10,48%
Total power generation capacities
(renewables including hydropower)
Total electricity demand (=
consumption)
118.506 mln kWh 119.616 mln kWh
New power generation capacities
installed during the year (all
technologies)
New power generation capacities
installed during the year
(renewables including hydropower)
Total PV electricity production in
GWh-TWh 564 GWh 254 GWh
Total PV electricity production as a
% of total electricity consumption 0,43 % 0,21 %
TotalPV electricity production as a
% renewable electricity 1,8 0,9
Table 4: Other informations
2013 Numbers (optional)
Number of PV systems in
operation in your country (a split
per market segment is interesting)
185.443 [5]
Capacity of decommissioned PV
systems during the year in MW
2

6 of 22
2 COMPETITIVENESS OF PV ELECTRICITY
2.1 Module prices
Table 6: Typical module prices for a number of years [1, 2]
Year
Q4
2011
Q1
2012
Q2
2012
Q3
2012
Q4
2012
Q1
2013
Q2
2013
Q3
2013
Q4
2013
Standard module
price(s): incl.
VAT
Typical
460 442 339 334 287 282 269 254 252
€/Wp (incl. VAT) 2.29 2.1 1.59 1.52 1.26 1.2 1.13 1.07 1.06
€/Wp (excl. VAT) 1.92 1.76 1.34 1.26 1.04 1.02 0.96 0.91 0.9
2.2 System prices
Table 7: Turnkey Prices of Typical Applications
Category/Size Typical applications and brief details Current prices
per W
OFF-GRID Up to 1 kW
OFF-GRID >1 kW
Grid-connected Rooftop up to 10 kW
(residential) 1,4 Euro/Wp
[1,2]
Grid-connected Rooftop from 10 to 250 kW
(commercial)
Grid-connected Rooftop above 250kW
(industrial)
Grid-connected Ground-mounted above 1
MW Survey ongoing SDE plus
Other category existing in your country
(hybrid diesel-PV, hybrid with battery…)
Table 8: National trends in system prices (current) for different applications
Price/Wp
Q1
2012
Q2
2012
Q3
2012
Q4
2012
Q1
2013
Q2
2013
Q3
2013
Q4
2013
Residential PV
systems < 10 KW
(flat roof)
1.67 1.57 1.51 1.52 1.44 1.54 1.458 1.428
Residential PV
systems < 10 KW
(sloping roof)
1.63 1.53 1.48 1.46 1.38 1.5 1.405 1.395
Commercial and
industrial n.d n.d. n.d. n.d. n.d. n.d. n.d. n.d.
Ground-mounted n.d. n.d. n.d. n.d. n.d. n.d. n.d. n.d.

7 of 22
2.3 Financial Parameters and programs (leasing…)
Table 9: PV financing scheme
Average Cost of
capital
Description of a
specific PV
financing scheme
(leasing, renting…)
http://www.rvo.nl/sites/default/files/2014/02/Rekenvoorbeelden%20Zon%20
SDE%2B%202014.pdf
in Dutch example SDEplus incentive
2.4 Additional Country information
Table 10: Country information
Retail Electricity Prices for an household (range) 0.2 euro/kWh
http://www.cbs.nl/nl-
NL/menu/themas/industrie-
energie/faq/specifiek/faq-energieprijzen-
ene.htm
Retail Electricity Prices for a commercial
company (range)
0.1 euro /kWh
Retail Electricity Prices for an industrial
company (range)
0.08 euro / kWh
Population at the end of 2013 (or latest known) 16.9 mln
https://www.cia.gov/library/publications/the-
world-factbook/geos/nl.html
Country size (km2) 41.5
Average PV yield (according to the current PV
development in the country) in kWh/kWp
850 kWh/kWp
Name and market share of major electric
utilities.
No reliable data known, market share utilities is
marginal

8 of 22
3 POLICY FRAMEWORK
This chapter describes the support policies aiming directly or indirectly to drive the development of
PV. Direct support policies have a direct influence on PV development by incentivizing or simplifying
or defining adequate policies. Indirect support policies change the regulatory environment in a way
that can push PV development.
3.1 Direct support policies
Table 11: PV support measures (summary table)
On-going measures Measures that commenced
during 2013
Feed-in tariffs (gross / net?) + SDE + > 15 KWp SDE +
Capital subsidies for equipment or total
cost
+
Green electricity schemes Certiq Certiq
PV-specific green electricity schemes - -
Renewable portfolio standards (RPS)
PV requirement in RPS
Investment funds for PV
Income tax credits VAT may be reclaimed over
the purchase and
installation of solar panels
(decision European court)
Prosumers’ incentives (self-consumption,
net-metering, net-billing…)
Net metering, (no limit)
Postcode cluster
Net metering
Commercial bank activities e.g. green
mortgages promoting PV
+ various
Activities of electricity utility businesses +
Sustainable building requirements EPC
3.2 Direct Support measures
3.2.1 Support measures exiting in 2013
The SDE+, SDE and MEP schemes have allocated subsidies for 221 MWe in solar power projects.
Over half of this was allocated in 2013. The low number of solar power projects in 2012 can be
explained by the large number of applications for renewable heat and biomass combined heat and
power installations. These types of projects could apply for SDE+ subsidy for the first time
in 2012, which subsequently happened en masse. 97 percent of the total budget was allocated to
projects in these categories. This resulted in the subsidy budget being already depleted in
phase 1. The 2013 budget was only depleted by phase 6, which resulted in 661 positively approved
solar power projects.
Alternative government incentives for solar power:
The government supports solar power in a number of ways on top of the MEP, SDE and SDE+. The
government also supports solar power through: the Energy Investment Allowance (EIA), the
9 of 22
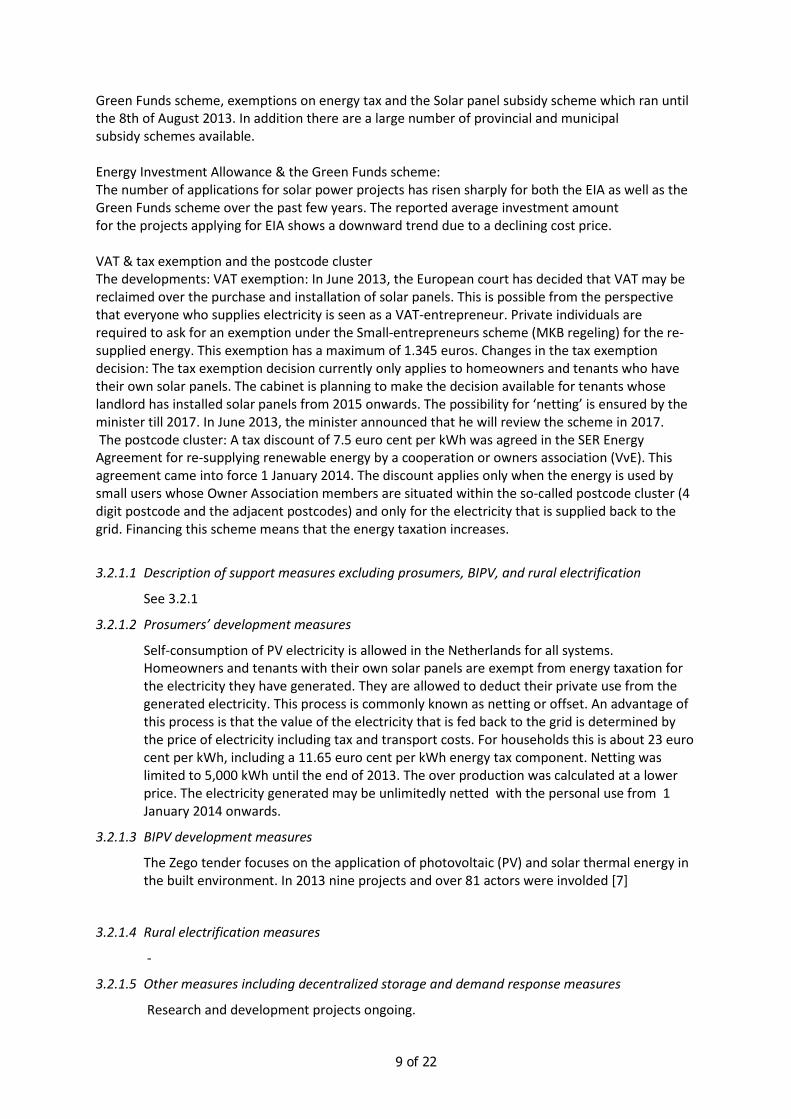
Green Funds scheme, exemptions on energy tax and the Solar panel subsidy scheme which ran until
the 8th of August 2013. In addition there are a large number of provincial and municipal
subsidy schemes available.
Energy Investment Allowance & the Green Funds scheme:
The number of applications for solar power projects has risen sharply for both the EIA as well as the
Green Funds scheme over the past few years. The reported average investment amount
for the projects applying for EIA shows a downward trend due to a declining cost price.
VAT & tax exemption and the postcode cluster
The developments: VAT exemption: In June 2013, the European court has decided that VAT may be
reclaimed over the purchase and installation of solar panels. This is possible from the perspective
that everyone who supplies electricity is seen as a VAT-entrepreneur. Private individuals are
required to ask for an exemption under the Small-entrepreneurs scheme (MKB regeling) for the re-
supplied energy. This exemption has a maximum of 1.345 euros. Changes in the tax exemption
decision: The tax exemption decision currently only applies to homeowners and tenants who have
their own solar panels. The cabinet is planning to make the decision available for tenants whose
landlord has installed solar panels from 2015 onwards. The possibility for ‘netting’ is ensured by the
minister till 2017. In June 2013, the minister announced that he will review the scheme in 2017.
The postcode cluster: A tax discount of 7.5 euro cent per kWh was agreed in the SER Energy
Agreement for re-supplying renewable energy by a cooperation or owners association (VvE). This
agreement came into force 1 January 2014. The discount applies only when the energy is used by
small users whose Owner Association members are situated within the so-called postcode cluster (4
digit postcode and the adjacent postcodes) and only for the electricity that is supplied back to the
grid. Financing this scheme means that the energy taxation increases.
3.2.1.1 Description of support measures excluding prosumers, BIPV, and rural electrification
See 3.2.1
3.2.1.2 Prosumers’ development measures
Self-consumption of PV electricity is allowed in the Netherlands for all systems.
Homeowners and tenants with their own solar panels are exempt from energy taxation for
the electricity they have generated. They are allowed to deduct their private use from the
generated electricity. This process is commonly known as netting or offset. An advantage of
this process is that the value of the electricity that is fed back to the grid is determined by
the price of electricity including tax and transport costs. For households this is about 23 euro
cent per kWh, including a 11.65 euro cent per kWh energy tax component. Netting was
limited to 5,000 kWh until the end of 2013. The over production was calculated at a lower
price. The electricity generated may be unlimitedly netted with the personal use from 1
January 2014 onwards.
3.2.1.3 BIPV development measures
The Zego tender focuses on the application of photovoltaic (PV) and solar thermal energy in
the built environment. In 2013 nine projects and over 81 actors were involded [7]
3.2.1.4 Rural electrification measures
-
3.2.1.5 Other measures including decentralized storage and demand response measures
Research and development projects ongoing.

10 of 22
3.2.2 Support measures phased out in 2013
In 2012 and 2013, private individuals had the opportunity to reclaim up to 15 percent of the
purchase price of solar panels as part of the Solar panel subsidy scheme. The State made over
50 million euros available in support. The subsidy scheme came to an end in August 2013 as
the available budget had depleted.
3.2.3 New support measures implemented in 2013
Netting was limited to 5,000 kWh until the end of 2013. The over production was calculated at
a lower price. The electricity generated may be unlimitedly netted with the personal use
from 1 January 2014 onwards.
3.2.4 Measures currently discussed but not implemented yet
Tax regime (EIA): removing asbestos and placing PV
3.2.5 Financing and cost of support measures
The costs of the SDE + are financed by a surcharge on electricity bills.
3.3 Indirect policy issues
The EPC is relevant for PV since in northern Europe it is difficult to become energy neutral
without the use of PV installations.
3.3.1 International policies affecting the use of PV Power Systems
N.A.
3.3.2 The introduction of any favourable environmental regulations
N.A.
3.3.3 Policies relating to externalities of conventional energy
N.A.
3.3.4 Taxes on pollution (e.g. carbon tax)
N.A
3.3.5 National policies and programmes to promote the use of PV in foreign non-IEA countries
Development aid programmes. Not covered here.

11 of 22
4 HIGHLIGHTS OF R&D
4.1 Highlights of R&D
The TKI-Solar is one of the Top Consortia for knowledge and innovation. In the TKI-Solar,
entrepreneurs, government officials and scientists collaborate. The innovation contract focuses on
three main programme lines: PV systems and applications, wafer-based silicon PV technologies and
thin film PV technologies. A total of 30 projects started in 2013 committing 50 Meuro in project cost
and a contribution of 24.7 Meuro in public funding. 95 companies and 105 knowledge institutes
collaborate in these projects.
The key research partnerships in the three focus areas are:
- SEAC (Solar Energy Application Centre; an initiative of ECN and TNO) for systems &
applications;
- Silicon Competence Centre (ECN, FOM-Amolf, TUD-Dimes) for wafer-based silicon PV
technologies;
- Solliance (TNO, ECN, TU/e, Holst Centre, IMEC and FZ Jülich) for thin-film technologies.
- DIFFER has started one division of its solar fuels program in 2012.
Alongside these national initiatives there are several active provinces with extensive applied
research activities in solar energy, such as
• Energy Valley (the three Northern provinces) and Limburg with the
• BIHTS program on building integrated high tech systems. The totalpublic – private
investment (including innovation vouchers) for BIHTS over the coming years amounts to 19
MEUR.
4.2 Public budgets for market stimulation, demonstration / field test programmes and
R&D
Table 12: Public budgets for R&D, demonstration/field test programmes and market incentives.
R & D Demo/Field test
Thin film PV
technologies
Waferbased
silicon PV
technologie
ZEGO (PV systems and
aplications)
National 3.4 M€ 11.1 M€ 10.2 M€
State/regional
Total 24.7M€

12 of 22
5 INDUSTRY
5.1 Production of feedstocks, ingots and wafers (crystalline silicon industry)
The Netherlands has a few manufacturers of PV products. Examples of these manufacturers are
HyET Solar (thin film) and Solland Solar (crystalline silicon). The latter is in Italian hands, but its
capacity in the Netherlands is expanding. Further, there are several companies that aim to start
production in the Netherlands in the next few years. These companies include Energyra, LineSolar,
Peer+ and TULiPPS Solar. Their focus is mainly on innovative products like high-performance
modules, smart energy glass or durable low-weight BIPV modules[3].
Table 13: Production information for the year for silicon feedstock, ingot and wafer producers
Manufacturers (or
total national
production)
Process &
technology Total Production
Product destination (if
known) Price (if known)
- Silicon
feedstock tonnes
- sc-Si ingots. tonnes
- mc-Si ingots tonnes
- sc-Si wafers MW
Solland Solar Cells bv mc-Si wafers 150 MW1
1: source: www.sollandsolar.com
Describe briefly the overseas activities of any key companies also operating in other countries.
5.2 Production of photovoltaic cells and modules (including TF and CPV)
Module manufacturing is defined as the industry where the process of the production of PV modules
(the encapsulation) is done. A company may also be involved in the production of ingots, wafers or
the processing of cells, in addition to fabricating the modules with frames, junction boxes etc. The
manufacturing of modules may only be counted to a country if the encapsulation takes place in that
country.
The Netherlands has some world-leading manufacturers of PV production machines. Examples of
these companies are ASMI, Eurotron, Lamers HTS, Levitech, Meco, Roth & Rau B.V., Rimas, Smit
Ovens, SoLayTec, Tempress and VDL Flow . The Netherlands has some large chemical companies like
Akzo Nobel and DSM who supply materials to the PV industry. Over the past few years, especially
the latter increased its focus on PV, for instance by developing an anti-reflection coating for solar
panels (Khepricoat) that can improve efficiencies up to 4% and by acquiring a Dutch start-up (Solar
Excel) that had developed a foil that ‘catches’ sunlight using a unique light management technology.
To increase the demand for these products, DSM has activities in other segments of the value chain
as well. For instance, the company works on demonstration projects to proof the performance of
their products. An example of such a demonstration project is the 1 MW PV system on top of one of
their factories in India. Further, DSM has a strong position in R&D and it might take a step into PV
recycling [3].
RVO has developed a Solar Energy Sector App, a new app that provides an overview of companies
and organizations that are active in the solar energy sector in the Netherlands. The purpose of the

13 of 22
app is that companies in this sector can find each other easily (www.rvo.nl). Over 200 organizations
have registered.
Total PV cell and module manufacture together with production capacity information is summarised
in Table 14 below.
Table 14: Production and production capacity information for 2013
Cell/Module
manufacturer (or
total national
production)
Technology
(sc-Si, mc-Si,
a-Si, CdTe)
Total Production (MW) Maximum production capacity
(MW/yr)
Cell Module Cell Module
Wafer-based PV manufactures
1 a b
2 c d e f
3 etc
Total
Thin film manufacturers
1 x x y y
2
Cells for concentration
1 g h
TOTALS a+c+x+g d+x b+e+y+h f+y
5.3 Manufacturers and suppliers of other components
For roughly any component of a PV system, the Netherlands has a representative company. This
includes for instance (micro-) inverters, power optimizers and storage systems (e.g. Mastervolt,
Heliox, Femtogrid and Victron Energy), mounting systems (e.g. Esdec, Van Der Valk Systems,
Freenergics Solar Supplies and Bosch Rexroth), monitoring systems (e.g. Plugwise and ReRa
Solutions) and solar radiation measuring instruments (e.g. Kipp & Zonen). The latter exists since
1830 and has its equipment in operation at PV projects all over the world [3].

14 of 22
6 PV IN THE ECONOMY
6.1 LABOUR PLACES
Table 15: Estimated PV-related labour places in 2013
Research and development (not including companies) n.d.
Manufacturing of products throughout the PV value chain from
feedstock to systems, including company R&D
n.d.
Distributors of PV products
System and installation companies
Electricity utility businesses and government n.d.
Other n.d.
Total 4900 [13]
6.2 Business value
Table 16: Value of PV business
Sub-market Capacity installed
in 2013 (MW)
Price per W
(from table 7)
Value Totals
Off-grid domestic n.d
Off-grid non-
domestic n.d.
Grid-connected
distributed 358 1,4 358 x 1,4 501 M€
Grid-connected
centralized
Export of PV products n.d
Change in stocks held n.d.
Import of PV products n.d.
Value of PV business 501 M€
If possible, please provide some brief comment on the industry value chain in your country or
provide references to articles, reports dealing with this topic.
15 of 22
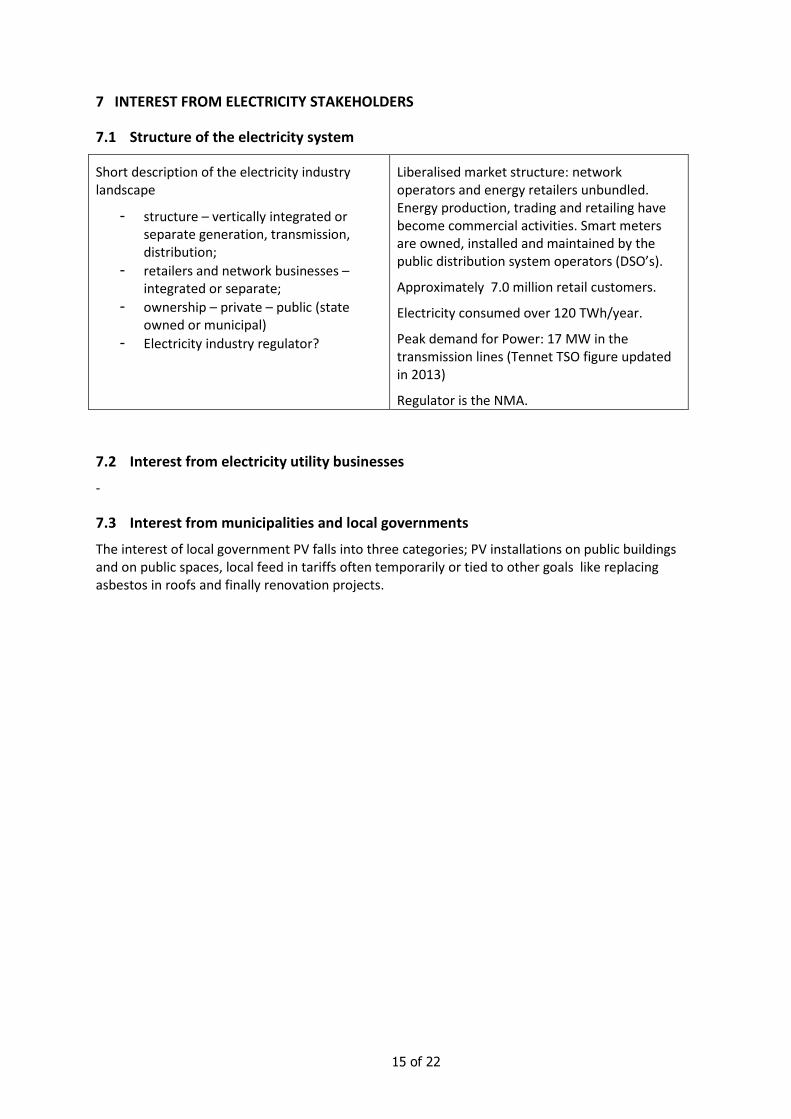
7 INTEREST FROM ELECTRICITY STAKEHOLDERS
7.1 Structure of the electricity system
Short description of the electricity industry
landscape
- structure – vertically integrated or
separate generation, transmission,
distribution;
- retailers and network businesses –
integrated or separate;
- ownership – private – public (state
owned or municipal)
- Electricity industry regulator?
Liberalised market structure: network
operators and energy retailers unbundled.
Energy production, trading and retailing have
become commercial activities. Smart meters
are owned, installed and maintained by the
public distribution system operators (DSO’s).
Approximately 7.0 million retail customers.
Electricity consumed over 120 TWh/year.
Peak demand for Power: 17 MW in the
transmission lines (Tennet TSO figure updated
in 2013)
Regulator is the NMA.
7.2 Interest from electricity utility businesses
-
7.3 Interest from municipalities and local governments
The interest of local government PV falls into three categories; PV installations on public buildings
and on public spaces, local feed in tariffs often temporarily or tied to other goals like replacing
asbestos in roofs and finally renovation projects.
16 of 22
8 STANDARDS AND CODES
In line with the European directive on renewable energy resources (RES), a technical guideline and
certification scheme for the installation of solar systems was set up in 2012. The guideline,
“Handboek Zonne-Energie, Bouwkundige en Installatietechnische richtlijnen voor zonne-
energiesystemen”, was composed by ISSO - Building Services Research Institute and initiated by NL
Agency, Holland Solar, UNETO-VNI, OTIB, and ISSO.
The photovoltaic section of the guideline is divided in three different modules, each with their own
certification scheme. The three modules are:
• Expertise of photovoltaic systems
• Mounting of photovoltaic systems
• Installation of solar systems
A certificate can only be obtained by individuals. To obtain such a certificate, an exam must be
passed at the CITO institute. All of the obtained certificates are registered on the site www.qbisnl.nl.
Commercial organisations that offer a course built on the guideline are BDA,BGA,IIR and
Switch2Solar, among other organisations.
To ensure the quality level of the certificates and training, Stichting KBI has been appointed by the
national government to accredit training institutes offering the courses and exams.
For the downstream PV industry, achieving a certification scheme accepted by all market parties on
the national level was an important non-technical milestone for 2012.
Based on the above certifications, among other ones, certain photovoltaic qualifications and quality
labels can be obtained by installers. Examples of such qualifications and labels are “SEI”, the
“Zonnekeur-Installateur”, and the KOMO-keurmerk BRL9933.
It is expected that the quality labels will enhance the quality of the total value stream, ranging from
components and systems to installation works. Qualified installers assemble certified materials into
reliable systems, following certified installation schemes. The availability of quality labels will thus
contribute to the further growth of the market. Quality labels will assure potential customers that
components and installation works meet specific standards, which can help these consumers to
make purchase decisions.
The labels will also indirectly contribute to the overall quality of installed systems, reducing the
number of nonfunctioning systems. This will enhance the public support for PV in general.
9 HIGHLIGHTS AND PROSPECTS
It is the Dutch government’s ambition to have 14 percent renewable energy by 2020 and 16% in
2023 but no specific targets for individual technologies. Nevertheless the sector expects to have
installed between 4 and 8 GWp by that time which would be 3-6% of the total electricity supply.
The Energy Agreement for Sustainable Growth was finalised on 6 September 2013. This agreement
details the arrangements made between cabinet, employers, employees, nature and environmental
organisations, energy corporations, decentralised governments and a substantial number of other
organisations, to realise more sustainable energy and energy reductions in The Netherlands.

17 of 22
ANNEX A LITERATURE
1. Inventarisatie PV markt Nederland – Status april 2014, Stichting Monitoring Zonnestroom, Sark,
W.G.J.H.M. van, Muizebelt, P., Cace, J., Utrecht
2. Inventarisatie PV markt Nederland – Prijsontwikkelingen in 2013, Stichting Monitoring
Zonnestroom, Sark, W.G.J.H.M. van, Muizebelt, P., Cace, J., Utrecht
3. International positioning of the Dutch PV sector, Atrive, Energy Indeed, 2014
4. Rapportage hernieuwbare energie, deel 1 implementatie 2003 – 2013, RVO
5. News item the Association of Energy Network Operators in the Netherlands, July 2014
6. Klimaatmonitor, website
http://klimaatmonitor.databank.nl/quickstep/QsBasic.aspx?sel_guid=7be98fde-bca3-4c45-a601-
1742e03e3118
7. TKI Solar Energy, Terugblik 2013, 28 feb. 2014
8. Economic Radar of the Sustainable Energy Sector in the Netherlands 2008 – 2011, edition 2013.
Heerlen : Statistics Netherlands
9. Hernieuwbare Energie in Nederland 2012, CBS
10. The State of Renewable Energies in Europe, edition 2013, 13th
EurObserv’ER Report
11. EPIA, Global Market Outlook for Photovoltaics 2014 - 2018, 2014
12. EPIA factsheet: Sustainability of Photovoltaic Systems, Job Creations, 2012
13. Hernieuwbare Energie in Nederland 2013, CBS

18 of 22
DEFINITIONS, SYMBOLS AND ABBREVIATIONS
For the purposes of this and all IEA PVPS National Survey Reports, the following definitions apply:
PV power system market: The market for all nationally installed (terrestrial) PV applications with a
PV power capacity of 40 W or more.
Installed PV power: Power delivered by a PV module or a PV array under standard test conditions
(STC) – irradiance of 1 000 W/m2, cell junction temperature of 25
oC, AM 1,5 solar spectrum – (also
see ‘Rated power’).
Rated power: Amount of power produced by a PV module or array under STC, written as W.
PV system: Set of interconnected elements such as PV modules, inverters that convert d.c. current of
the modules into a.c. current, storage batteries and all installation and control components with a
PV power capacity of 40 W or more.
CPV: Concentrating PV
Hybrid system: A system combining PV generation with another generation source, such as diesel,
hydro, wind.
Module manufacturer: An organisation carrying out the encapsulation in the process of the
production of PV modules.
Off-grid domestic PV power system: System installed to provide power mainly to a household or
village not connected to the (main) utility grid(s). Often a means to store electricity is used (most
commonly lead-acid batteries). Also referred to as ‘stand-alone PV power system’. Can also provide
power to domestic and community users (plus some other applications) via a ‘mini-grid’, often as a
hybrid with another source of power.
Off-grid non-domestic PV power system: System used for a variety of industrial and agricultural
applications such as water pumping, remote communications, telecommunication relays, safety and
protection devices, etc. that are not connected to the utility grid. Usually a means to store electricity
is used. Also referred to as ‘stand-alone PV power system’.
Grid-connected distributed PV power system: System installed to provide power to a grid-connected
customer or directly to the electricity grid (specifically where that part of the electricity grid is
configured to supply power to a number of customers rather than to provide a bulk transport
function). Such systems may be on or integrated into the customer’s premises often on the demand
side of the electricity meter, on public and commercial buildings, or simply in the built environment
on motorway sound barriers etc. They may be specifically designed for support of the utility
distribution grid. Size is not a determining feature – while a 1 MW PV system on a rooftop may be
large by PV standards, this is not the case for other forms of distributed generation.
Grid-connected centralized PV power system: Power production system performing the function of
a centralized power station. The power supplied by such a system is not associated with a particular
electricity customer, and the system is not located to specifically perform functions on the electricity
grid other than the supply of bulk power. Typically ground mounted and functioning independently
of any nearby development.
Turnkey price: Price of an installed PV system excluding VAT/TVA/sales taxes, operation and
maintenance costs but including installation costs. For an off-grid PV system, the prices associated
with storage battery maintenance/replacement are excluded. If additional costs are incurred for
19 of 22
reasons not directly related to the PV system, these should be excluded. (E.g. If extra costs are
incurred fitting PV modules to a factory roof because special precautions are required to avoid
disrupting production, these extra costs should not be included. Equally the additional transport
costs of installing a telecommunication system in a remote area are excluded).
Field Test Programme: A programme to test the performance of PV systems/components in real
conditions.
Demonstration Programme: A programme to demonstrate the operation of PV systems and their
application to potential users/owners.
Market deployment initiative: Initiatives to encourage the market deployment of PV through the
use of market instruments such as green pricing, rate based incentives etc. These may be
implemented by government, the finance industry, electricity utility businesses etc.
Final annual yield: Total PV energy delivered to the load during the year per kW of power installed.
Performance ratio: Ratio of the final annual (monthly, daily) yield to the reference annual (monthly,
daily) yield, where the reference annual (monthly, daily) yield is the theoretical annual (monthly, daily)
available energy per kW of installed PV power.
Currency: The currency unit used throughout this report is euro.
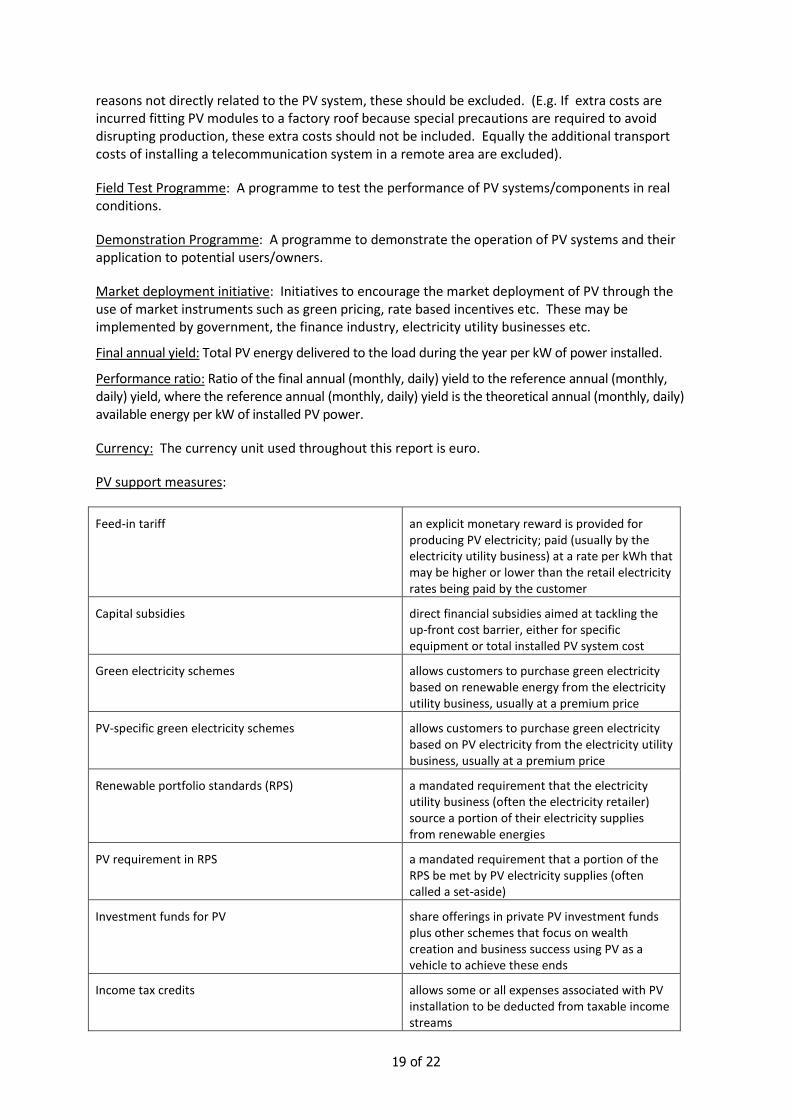
PV support measures:
Feed-in tariff an explicit monetary reward is provided for
producing PV electricity; paid (usually by the
electricity utility business) at a rate per kWh that
may be higher or lower than the retail electricity
rates being paid by the customer
Capital subsidies direct financial subsidies aimed at tackling the
up-front cost barrier, either for specific
equipment or total installed PV system cost
Green electricity schemes allows customers to purchase green electricity
based on renewable energy from the electricity
utility business, usually at a premium price
PV-specific green electricity schemes allows customers to purchase green electricity
based on PV electricity from the electricity utility
business, usually at a premium price
Renewable portfolio standards (RPS) a mandated requirement that the electricity
utility business (often the electricity retailer)
source a portion of their electricity supplies
from renewable energies
PV requirement in RPS a mandated requirement that a portion of the
RPS be met by PV electricity supplies (often
called a set-aside)
Investment funds for PV share offerings in private PV investment funds
plus other schemes that focus on wealth
creation and business success using PV as a
vehicle to achieve these ends
Income tax credits allows some or all expenses associated with PV
installation to be deducted from taxable income
streams

20 of 22
Compensation schemes (self-consumption, net-
metering, net-billing…)
These schemes allow consumers to reduce their
electricity bill thanks to PV production valuation.
The schemes must be detailed in order to better
understand if we are facing self-consumption
schemes (electricity consumed in real-time is
not accounted and not invoiced) or net-billing
schemes (the electricity taken from the grid and
the electricity fed into the grid are tracked
separately, and the electricity account is
reconciled over a billing cycle). The
compensation for both the electricity self-
consumed and injected into the grid should be
detailed. Net-metering schemes are specific
since they allows PV customers to incur a zero
charge when their electricity consumption is
exactly balanced by their PV generation, while
being charged the applicable retail tariff when
their consumption exceeds generation and
receiving some remuneration for excess
electricity exported to the grid
Commercial bank activities includes activities such as preferential home
mortgage terms for houses including PV systems
and preferential green loans for the installation
of PV systems
Activities of electricity utility businesses includes ‘green power’ schemes allowing
customers to purchase green electricity,
operation of large-scale (utility-scale) PV plants,
various PV ownership and financing options with
select customers and PV electricity power
purchase models
Sustainable building requirements includes requirements on new building
developments (residential and commercial) and
also in some cases on properties for sale, where
the PV may be included as one option for reducing
the building’s energy foot print or may be
specifically mandated as an inclusion in the
building development

21 of 22