national survey on the transnistrian reintegration ... · 1 national survey on the transnistrian...
TRANSCRIPT
1
NATIONAL SURVEY ON THE
TRANSNISTRIAN REINTEGRATION
PROSPECTS: public perceptions
SURVEY-BASED RESEARCH
Chisinau, May 2014
2
CONTENT
Introduction ................................................................................................................................................ 4
METHODOLOGICAL ISSUES/METHODOLOGY ........................................................................... 4
Conflict settlement in Transnistria as a priority for the public agenda .............................................. 6
Perceptions on the prospects for Transnistria's conflict resolution .................................................... 9
The process of Transnistria Settlement ................................................................................................. 12
Views with regard to the form of Transnistrian conflict resolution ................................................. 18
Transnistrian conflict settlement vs. European integration ........................................................... 25
Conclusions ............................................................................................................................................... 26
ANNEX 1: SURVEY RESULTS IN TABLES ......................................................................................... 28
3
List of Figures
Figure 1. Personal priorities................................................................................................................ 6 Figure 2. To what extent is lack of progress in the Transnistrian conflict settlement affecting your family
welfare .............................................................................................................................................. 7
Figure 3. Level of interest towards the Transnistrian conflict ................................................................ 7 Figure 4. Transnistrian issue indicated among the main priority issues for the Government ....................... 8
Figure 5. Priorities for Government's agenda ........................................................................................................ 8
Figure 6. Importance of the Transnistrian issue for the country's leadership .......................................... 9 Figure 7. Importance of conflict resolution for the future of the country .......................................................... 9
Figure 8. Does Moldova need Transnistria in its composition? .......................................................................... 9 Figure 9. To what extent is it possible to settle the Transnistrian conflict? ..................................................... 10
Figure 10. When will the conflict be settled? ....................................................................................................... 10
Figure 11. The likelihood of conflict settlement by means of negotiations acceptable to Moldova ............. 10
Figure 12. Does the Transnistrian conflict present a danger to the security of the Republic of Moldova
and peace in the region? .......................................................................................................................................... 11
Figure 13. Public information about the realiable measures promoted by the Republic of Moldova ......... 12
Figure 14. Awareness level of citizens about the ongoing negotiations in the „5 +2” format, overall and by
level of interest in the Transnistrian issue ............................................................................................................. 13
Figure 15. Degree of satisfaction with the progress of negotiations on Transnistria issue…………………13
Figure 16. Appreciation of the role of the parties to the negotiations in the "5 +2" format ........................... 14
Figure 17. Assessment of the role of the actors involoved in promoting confidence-building measures ... 14
Figure 18. Changes in attitude towards the Russian Federation following the annexation of Crimea ....... 15
Figure 19. Appreciation of the need for the presence of the peacekeeping mission in its current form ..... 16
Figure 20. Attitudes towards peacekeeping mission .......................................................................................... 16
Figure 21. Opinions regarding the need to establish an international mission of civil observers ................ 17
Figure 22. Whom does the settlement of the Transnistrian conflict depend on and what is the main
obstacle to solving it ................................................................................................................................................. 18
Figure 23. Which party should make the most concessions to settle the conflict ........................................... 19
Figure 24. What compromises can Moldova make to settle the conflict .......................................................... 19
Figure 25. What compromises can Transnistria make to settle the conflict..................................................... 20
Figure 26. Status of Transnistria within the Republic of Moldova ................................................................... 20
Figure 27. Acceptance of the federalization of the Republic of Moldova ........................................................ 22
Figure 28. Acceptance of Transnistria own attributes stipulated in the Constitution of the Republic of
Moldova ..................................................................................................................................................................... 23
Figure 29. Considerations on the possibility of creating a common economic space between the RM and
TR ................................................................................................................................................................................ 24
Figure 30. The common economic space between the RM and TR will facilitate to obtain political
compromise to settle the Transnistrian conflict ................................................................................... 24 Figure 31. Is the Transnistrian problem an obstacle on the path to EU integration? ..................................... 25
Figure 32. It the integration of Moldova into the EU possible without settling the Transnistria conflict? . 25
4
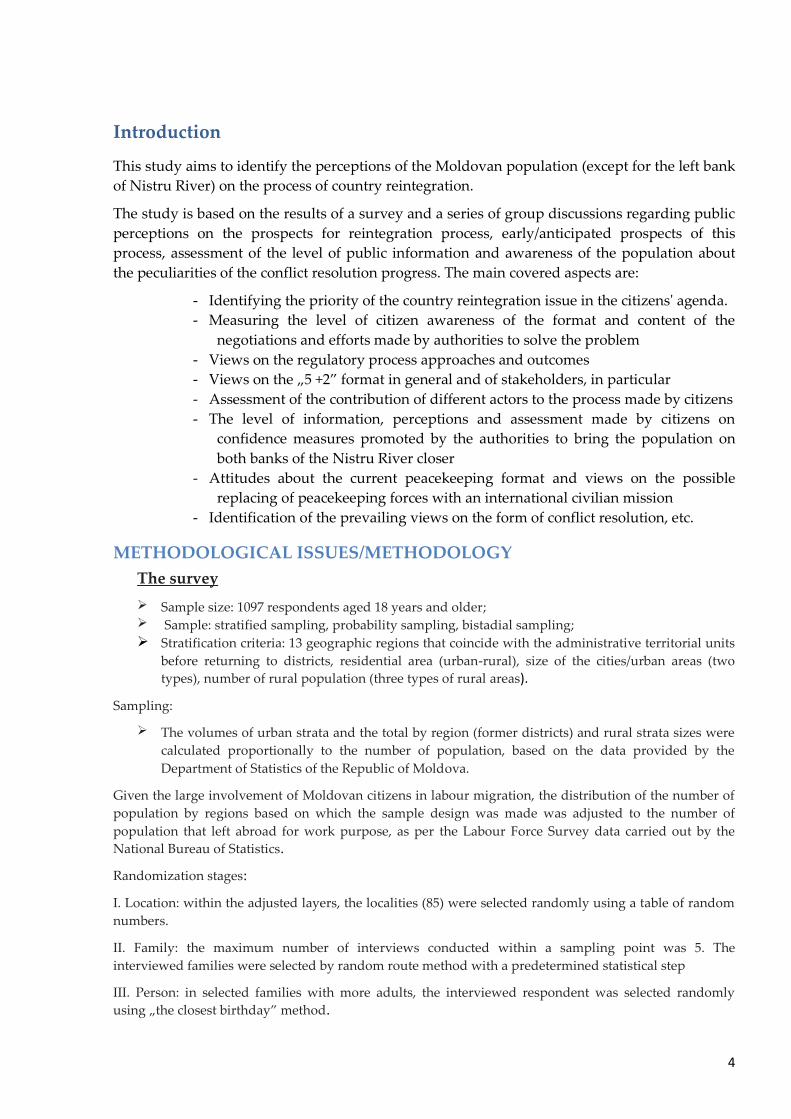
Introduction
This study aims to identify the perceptions of the Moldovan population (except for the left bank
of Nistru River) on the process of country reintegration.
The study is based on the results of a survey and a series of group discussions regarding public
perceptions on the prospects for reintegration process, early/anticipated prospects of this
process, assessment of the level of public information and awareness of the population about
the peculiarities of the conflict resolution progress. The main covered aspects are:
- Identifying the priority of the country reintegration issue in the citizens' agenda.
- Measuring the level of citizen awareness of the format and content of the
negotiations and efforts made by authorities to solve the problem
- Views on the regulatory process approaches and outcomes
- Views on the „5 +2” format in general and of stakeholders, in particular
- Assessment of the contribution of different actors to the process made by citizens
- The level of information, perceptions and assessment made by citizens on
confidence measures promoted by the authorities to bring the population on
both banks of the Nistru River closer
- Attitudes about the current peacekeeping format and views on the possible
replacing of peacekeeping forces with an international civilian mission
- Identification of the prevailing views on the form of conflict resolution, etc.
METHODOLOGICAL ISSUES/METHODOLOGY
The survey
Sample size: 1097 respondents aged 18 years and older; Sample: stratified sampling, probability sampling, bistadial sampling;
Stratification criteria: 13 geographic regions that coincide with the administrative territorial units
before returning to districts, residential area (urban-rural), size of the cities/urban areas (two
types), number of rural population (three types of rural areas).
Sampling:
The volumes of urban strata and the total by region (former districts) and rural strata sizes were
calculated proportionally to the number of population, based on the data provided by the
Department of Statistics of the Republic of Moldova.
Given the large involvement of Moldovan citizens in labour migration, the distribution of the number of
population by regions based on which the sample design was made was adjusted to the number of
population that left abroad for work purpose, as per the Labour Force Survey data carried out by the
National Bureau of Statistics.
Randomization stages:
I. Location: within the adjusted layers, the localities (85) were selected randomly using a table of random
numbers.
II. Family: the maximum number of interviews conducted within a sampling point was 5. The
interviewed families were selected by random route method with a predetermined statistical step
III. Person: in selected families with more adults, the interviewed respondent was selected randomly
using „the closest birthday” method.
5
Representativeness: the sample is representative for the adult population of the Republic of Moldova,
with a maximal error margin of ±3%.
Data collection period: 14 - 23 May, 2014. Interviews were conducted at respondents' residence. The
questionnaire was drafted in Romanian and Russian, offering the respondents the opportunity to choose.
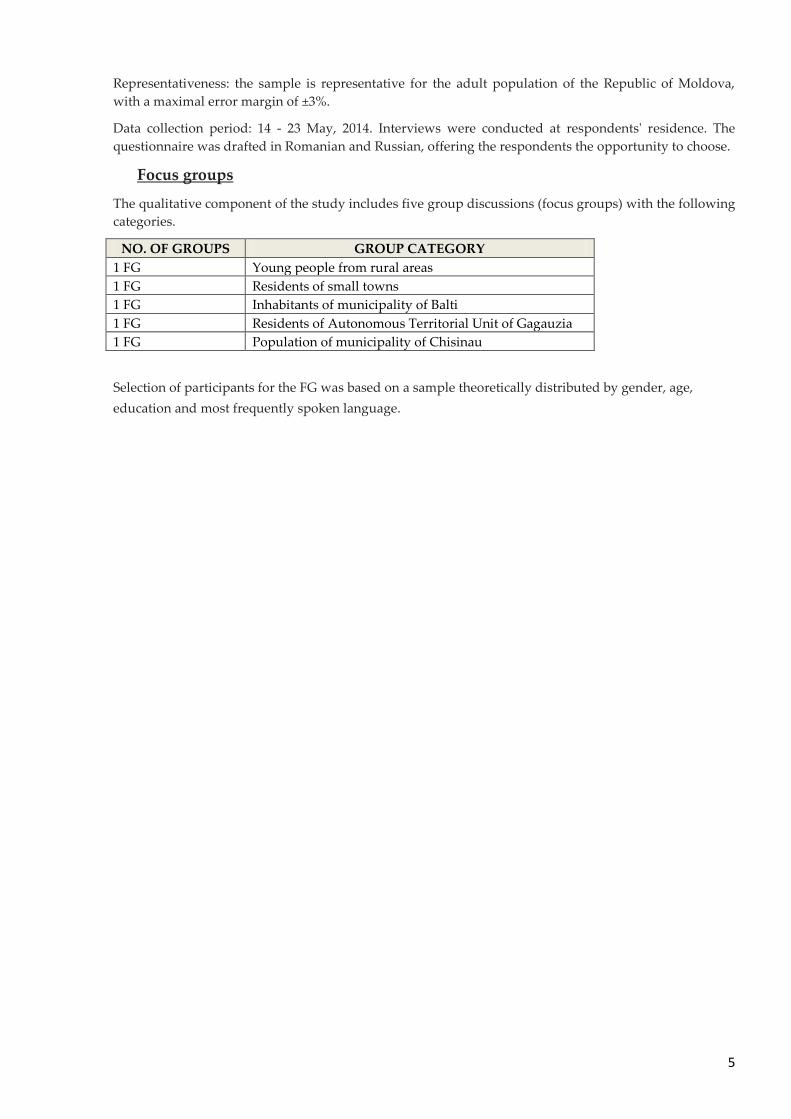
Focus groups
The qualitative component of the study includes five group discussions (focus groups) with the following
categories.
NO. OF GROUPS GROUP CATEGORY
1 FG Young people from rural areas
1 FG Residents of small towns
1 FG Inhabitants of municipality of Balti
1 FG Residents of Autonomous Territorial Unit of Gagauzia
1 FG Population of municipality of Chisinau
Selection of participants for the FG was based on a sample theoretically distributed by gender, age,
education and most frequently spoken language.
6
Conflict settlement in Transnistria as a priority for the public agenda
After 20 years of status quo, the Transnistrian conflict is perceived by the public as a political
issue, far from existential one that would affect the lives of real citizens. The modest economic
exchanges and field separation in media between the two banks of the Nistru River, as well as
massive migration flows have minimized the daily interconnection between both populations.
Thus, the number one challenge for all existing governments is placed by citizens at the bottom
of their concerns. Generally speaking, the situation is perceived as a prestigious one (political,
governmental) but not essential at all, while the resolution of Transnistrian conflict is declared
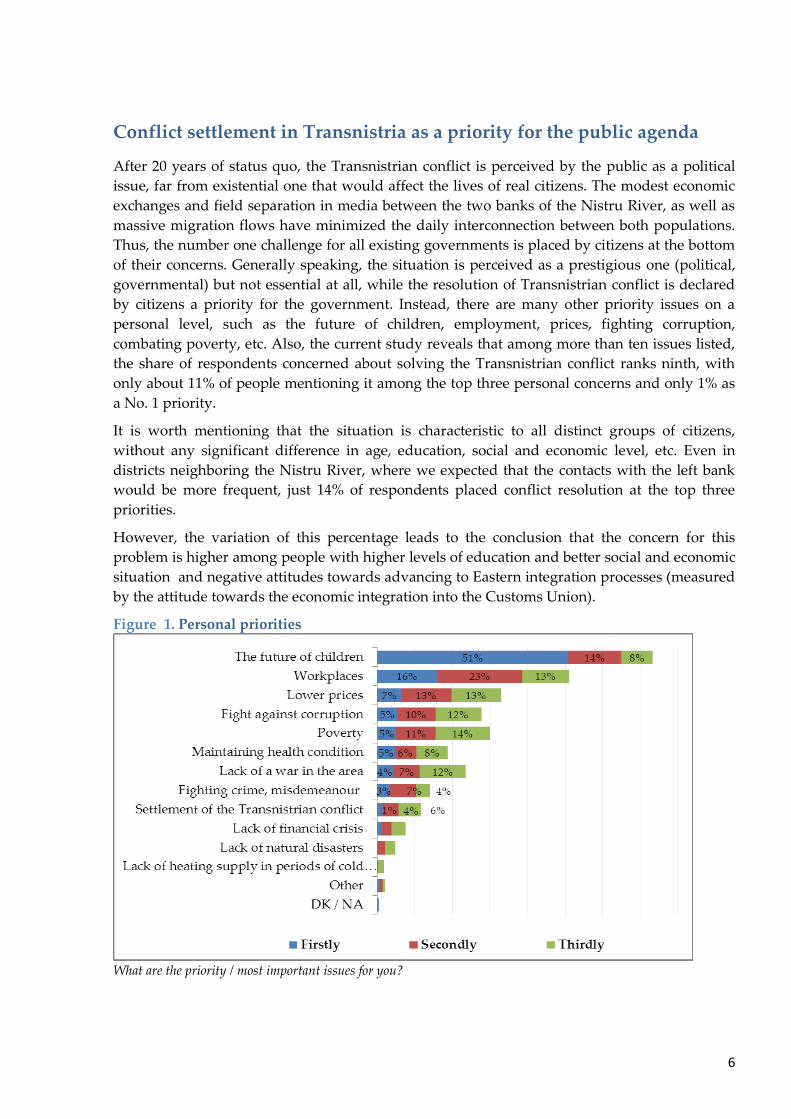
by citizens a priority for the government. Instead, there are many other priority issues on a
personal level, such as the future of children, employment, prices, fighting corruption,
combating poverty, etc. Also, the current study reveals that among more than ten issues listed,
the share of respondents concerned about solving the Transnistrian conflict ranks ninth, with
only about 11% of people mentioning it among the top three personal concerns and only 1% as
a No. 1 priority.
It is worth mentioning that the situation is characteristic to all distinct groups of citizens,
without any significant difference in age, education, social and economic level, etc. Even in
districts neighboring the Nistru River, where we expected that the contacts with the left bank
would be more frequent, just 14% of respondents placed conflict resolution at the top three
priorities.
However, the variation of this percentage leads to the conclusion that the concern for this
problem is higher among people with higher levels of education and better social and economic
situation and negative attitudes towards advancing to Eastern integration processes (measured
by the attitude towards the economic integration into the Customs Union).
Figure 1. Personal priorities
What are the priority / most important issues for you?
7
In fact, the situation perfectly fits the explanation for the public perception of various problems
placing them at different levels - national, local and personal. Thus, the Transnistrian conflict
for ordinary people has no visible implications at the personal or local level, at the same time
being given a major significance to the issue at the general national level. This also explains the
modest role of the issue in the top personal priorities (I am primarily concerned by issues that
can visibly affect my everyday life). Since this problem does not affect the welfare of their
family in any way (most of the
respondents do not see their lives being
affected by the fact that the conflict
remains unsettled) (see Diagram, Annex 1,
the Table).
The confirmation of the above can be
found in the focus group discussions
conducted, taking advantage that the
prevailing position is that failure to settle
the conflict affects people who have
relatives in Transnistria only, while the majority of respondents believe that the Transnistria-
Moldova relations can not affect them in any way.
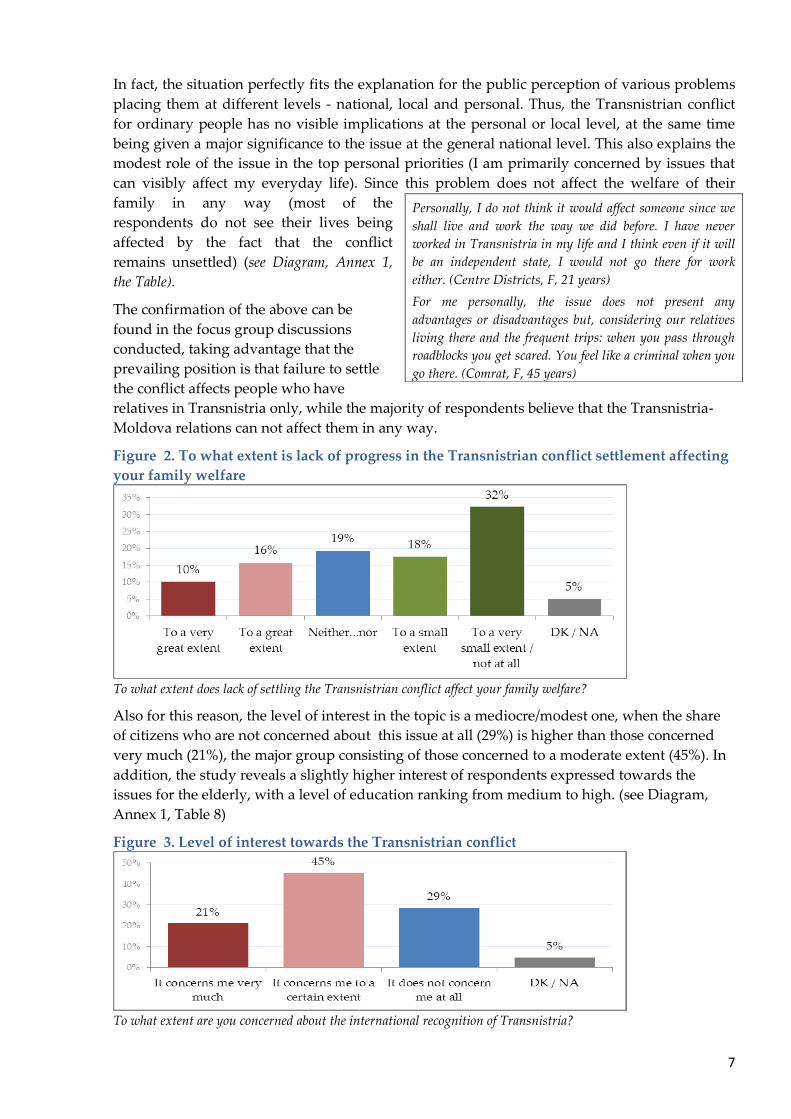
Figure 2. To what extent is lack of progress in the Transnistrian conflict settlement affecting
your family welfare
To what extent does lack of settling the Transnistrian conflict affect your family welfare?
Also for this reason, the level of interest in the topic is a mediocre/modest one, when the share
of citizens who are not concerned about this issue at all (29%) is higher than those concerned
very much (21%), the major group consisting of those concerned to a moderate extent (45%). In
addition, the study reveals a slightly higher interest of respondents expressed towards the
issues for the elderly, with a level of education ranking from medium to high. (see Diagram,
Annex 1, Table 8)
Figure 3. Level of interest towards the Transnistrian conflict
To what extent are you concerned about the international recognition of Transnistria?
Personally, I do not think it would affect someone since we
shall live and work the way we did before. I have never
worked in Transnistria in my life and I think even if it will
be an independent state, I would not go there for work
either. (Centre Districts, F, 21 years)
For me personally, the issue does not present any
advantages or disadvantages but, considering our relatives
living there and the frequent trips: when you pass through
roadblocks you get scared. You feel like a criminal when you
go there. (Comrat, F, 45 years)
8
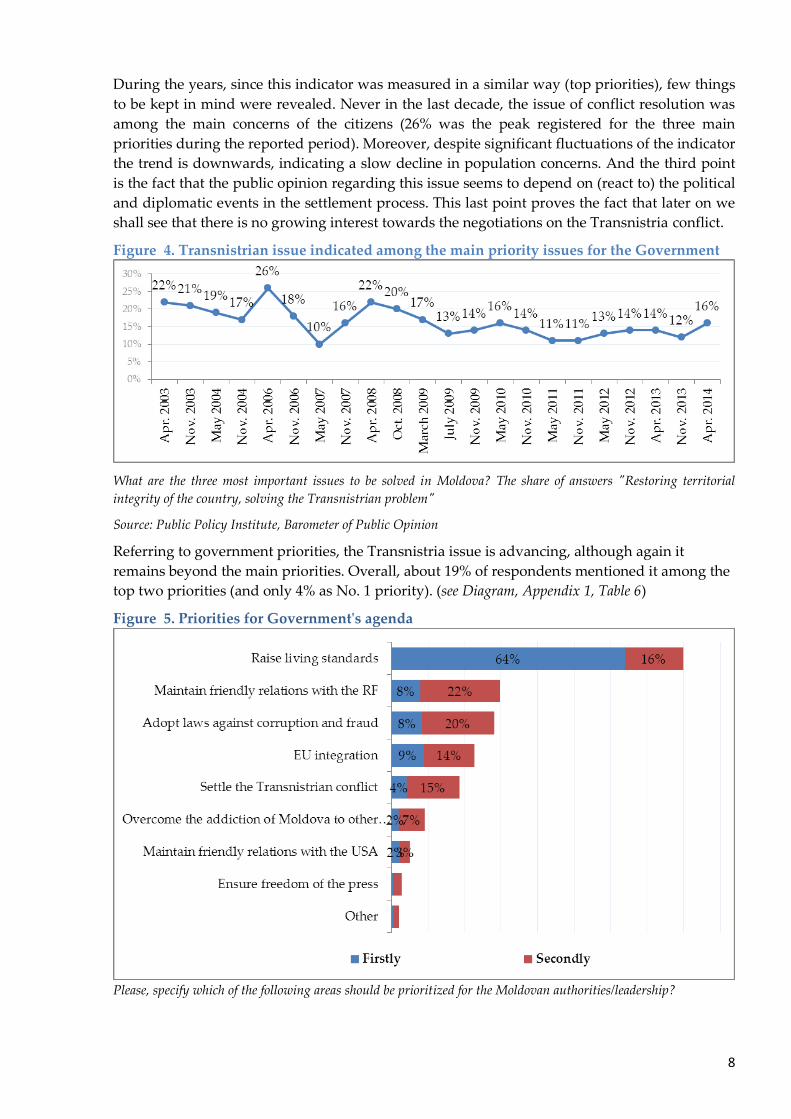
During the years, since this indicator was measured in a similar way (top priorities), few things
to be kept in mind were revealed. Never in the last decade, the issue of conflict resolution was
among the main concerns of the citizens (26% was the peak registered for the three main
priorities during the reported period). Moreover, despite significant fluctuations of the indicator
the trend is downwards, indicating a slow decline in population concerns. And the third point
is the fact that the public opinion regarding this issue seems to depend on (react to) the political
and diplomatic events in the settlement process. This last point proves the fact that later on we
shall see that there is no growing interest towards the negotiations on the Transnistria conflict.
Figure 4. Transnistrian issue indicated among the main priority issues for the Government
What are the three most important issues to be solved in Moldova? The share of answers "Restoring territorial
integrity of the country, solving the Transnistrian problem"
Source: Public Policy Institute, Barometer of Public Opinion
Referring to government priorities, the Transnistria issue is advancing, although again it
remains beyond the main priorities. Overall, about 19% of respondents mentioned it among the
top two priorities (and only 4% as No. 1 priority). (see Diagram, Appendix 1, Table 6)
Figure 5. Priorities for Government's agenda
Please, specify which of the following areas should be prioritized for the Moldovan authorities/leadership?
9
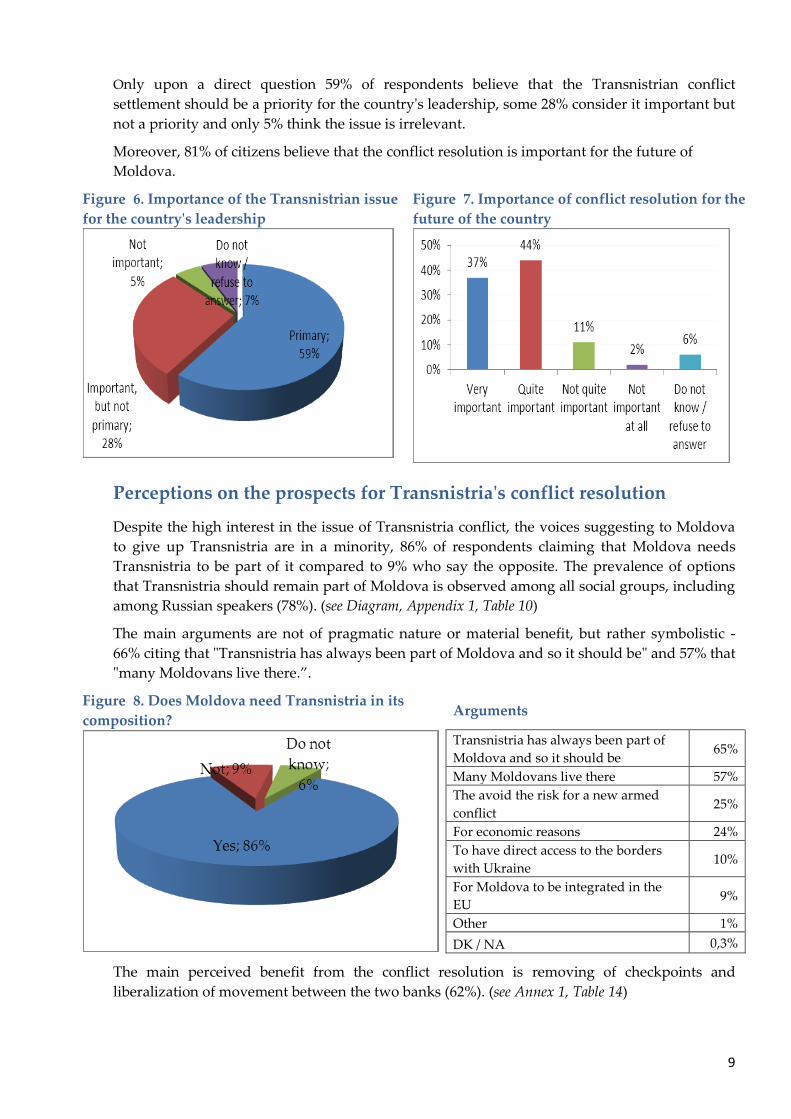
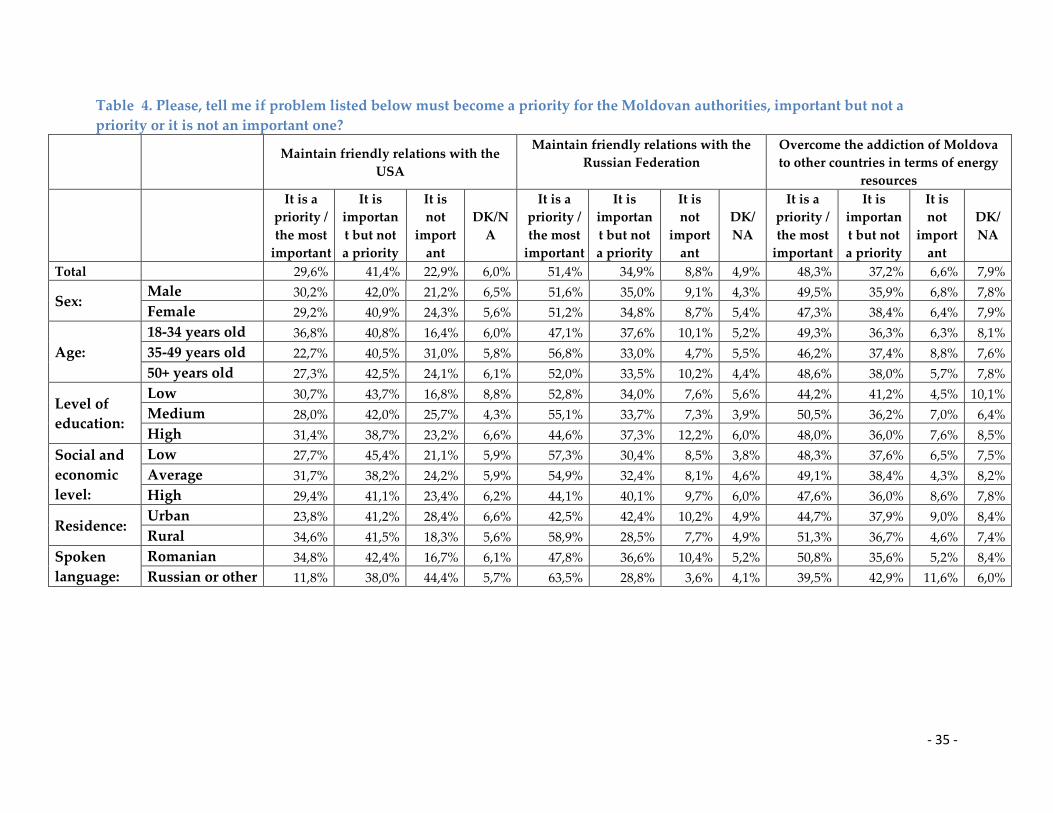
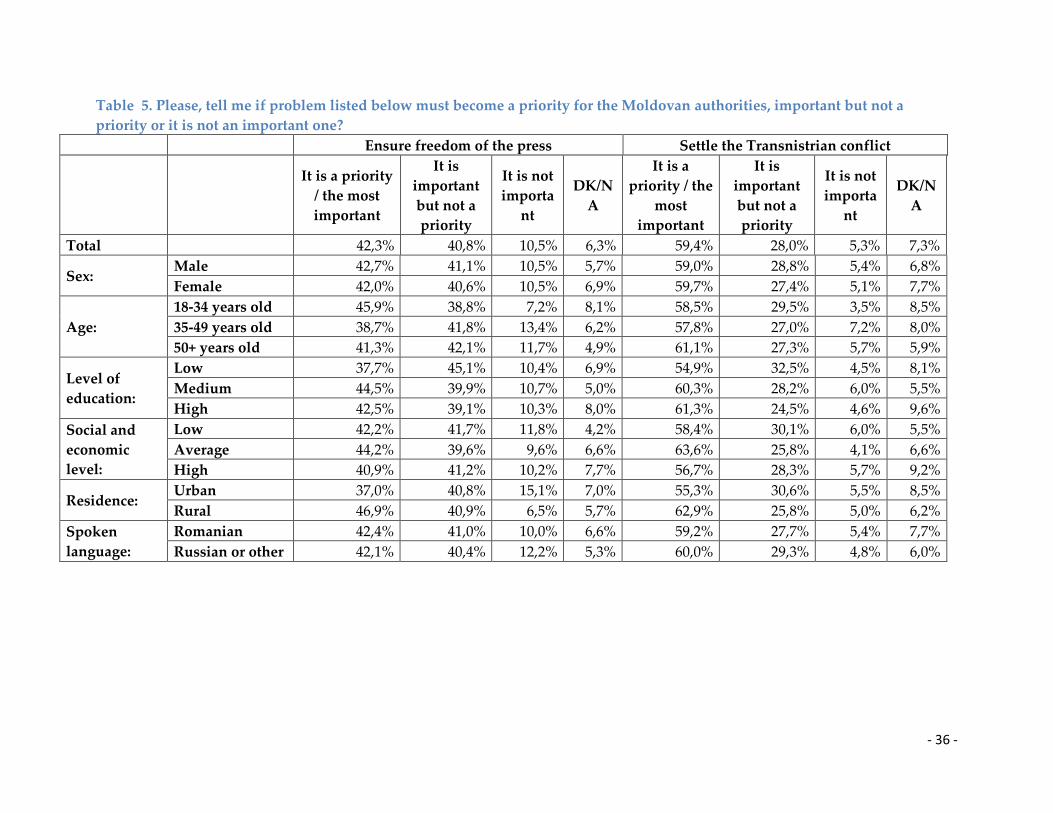
Only upon a direct question 59% of respondents believe that the Transnistrian conflict
settlement should be a priority for the country's leadership, some 28% consider it important but
not a priority and only 5% think the issue is irrelevant.
Moreover, 81% of citizens believe that the conflict resolution is important for the future of
Moldova.
Figure 6. Importance of the Transnistrian issue
for the country's leadership
Figure 7. Importance of conflict resolution for the
future of the country
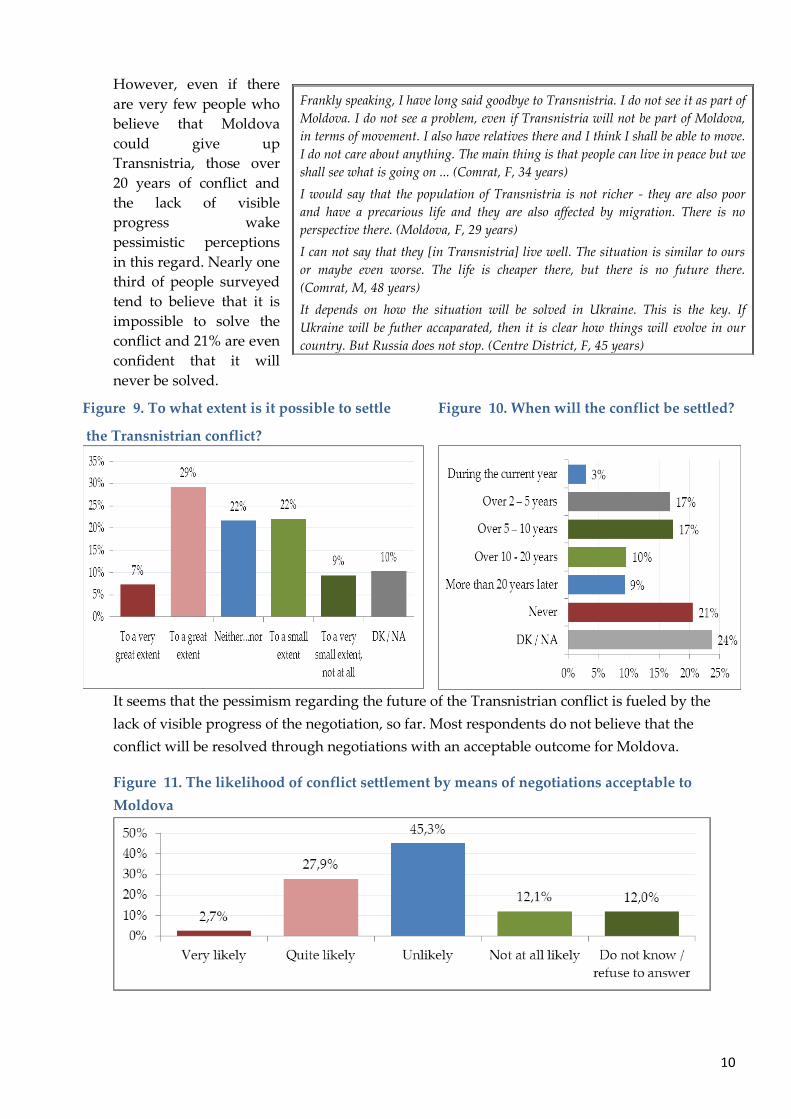
Perceptions on the prospects for Transnistria's conflict resolution
Despite the high interest in the issue of Transnistria conflict, the voices suggesting to Moldova
to give up Transnistria are in a minority, 86% of respondents claiming that Moldova needs
Transnistria to be part of it compared to 9% who say the opposite. The prevalence of options
that Transnistria should remain part of Moldova is observed among all social groups, including
among Russian speakers (78%). (see Diagram, Appendix 1, Table 10)
The main arguments are not of pragmatic nature or material benefit, but rather symbolistic -
66% citing that "Transnistria has always been part of Moldova and so it should be" and 57% that
"many Moldovans live there.”.
Figure 8. Does Moldova need Transnistria in its
composition? Arguments
Transnistria has always been part of
Moldova and so it should be 65%
Many Moldovans live there 57%
The avoid the risk for a new armed
conflict 25%
For economic reasons 24%
To have direct access to the borders
with Ukraine 10%
For Moldova to be integrated in the
EU 9%
Other 1%
DK / NA 0,3%
The main perceived benefit from the conflict resolution is removing of checkpoints and
liberalization of movement between the two banks (62%). (see Annex 1, Table 14)
10
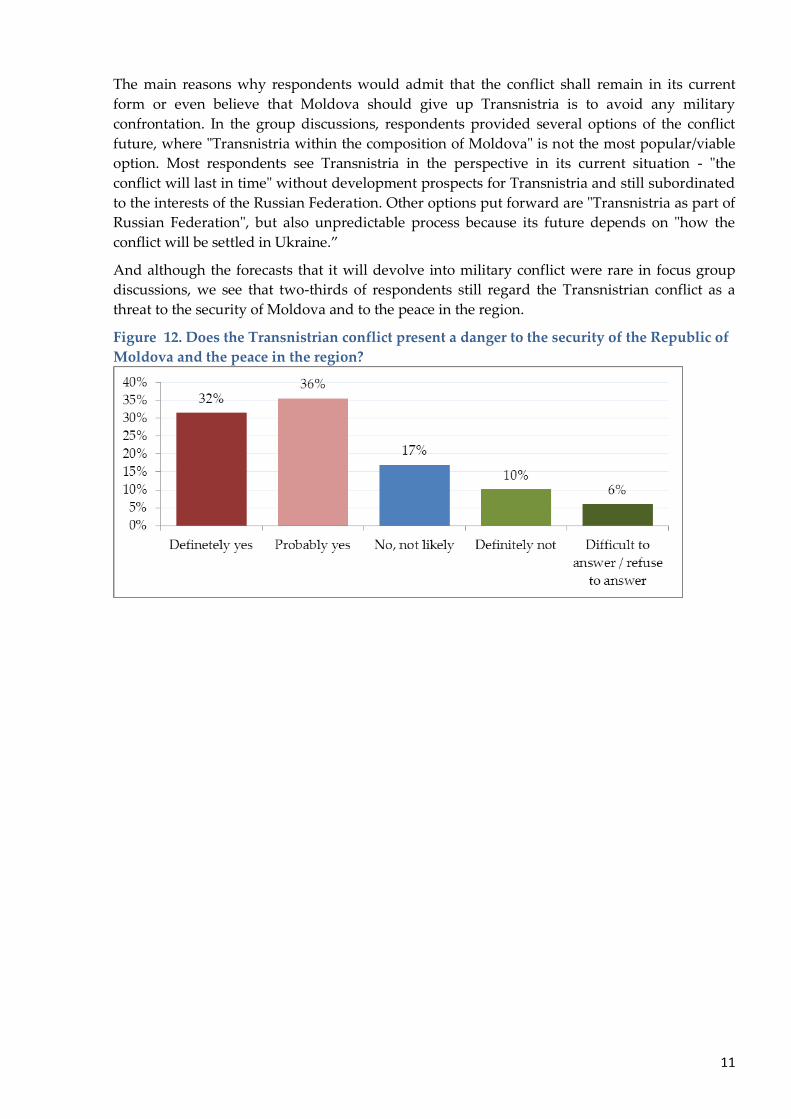
However, even if there
are very few people who
believe that Moldova
could give up
Transnistria, those over
20 years of conflict and
the lack of visible
progress wake
pessimistic perceptions
in this regard. Nearly one
third of people surveyed
tend to believe that it is
impossible to solve the
conflict and 21% are even
confident that it will
never be solved.
Figure 9. To what extent is it possible to settle
the Transnistrian conflict?
Figure 10. When will the conflict be settled?
It seems that the pessimism regarding the future of the Transnistrian conflict is fueled by the
lack of visible progress of the negotiation, so far. Most respondents do not believe that the
conflict will be resolved through negotiations with an acceptable outcome for Moldova.
Figure 11. The likelihood of conflict settlement by means of negotiations acceptable to
Moldova
Frankly speaking, I have long said goodbye to Transnistria. I do not see it as part of
Moldova. I do not see a problem, even if Transnistria will not be part of Moldova,
in terms of movement. I also have relatives there and I think I shall be able to move.
I do not care about anything. The main thing is that people can live in peace but we
shall see what is going on ... (Comrat, F, 34 years)
I would say that the population of Transnistria is not richer - they are also poor
and have a precarious life and they are also affected by migration. There is no
perspective there. (Moldova, F, 29 years)
I can not say that they [in Transnistria] live well. The situation is similar to ours
or maybe even worse. The life is cheaper there, but there is no future there.
(Comrat, M, 48 years)
It depends on how the situation will be solved in Ukraine. This is the key. If
Ukraine will be futher accaparated, then it is clear how things will evolve in our
country. But Russia does not stop. (Centre District, F, 45 years)
11
The main reasons why respondents would admit that the conflict shall remain in its current
form or even believe that Moldova should give up Transnistria is to avoid any military
confrontation. In the group discussions, respondents provided several options of the conflict
future, where "Transnistria within the composition of Moldova" is not the most popular/viable
option. Most respondents see Transnistria in the perspective in its current situation - "the
conflict will last in time" without development prospects for Transnistria and still subordinated
to the interests of the Russian Federation. Other options put forward are "Transnistria as part of
Russian Federation", but also unpredictable process because its future depends on "how the
conflict will be settled in Ukraine.”
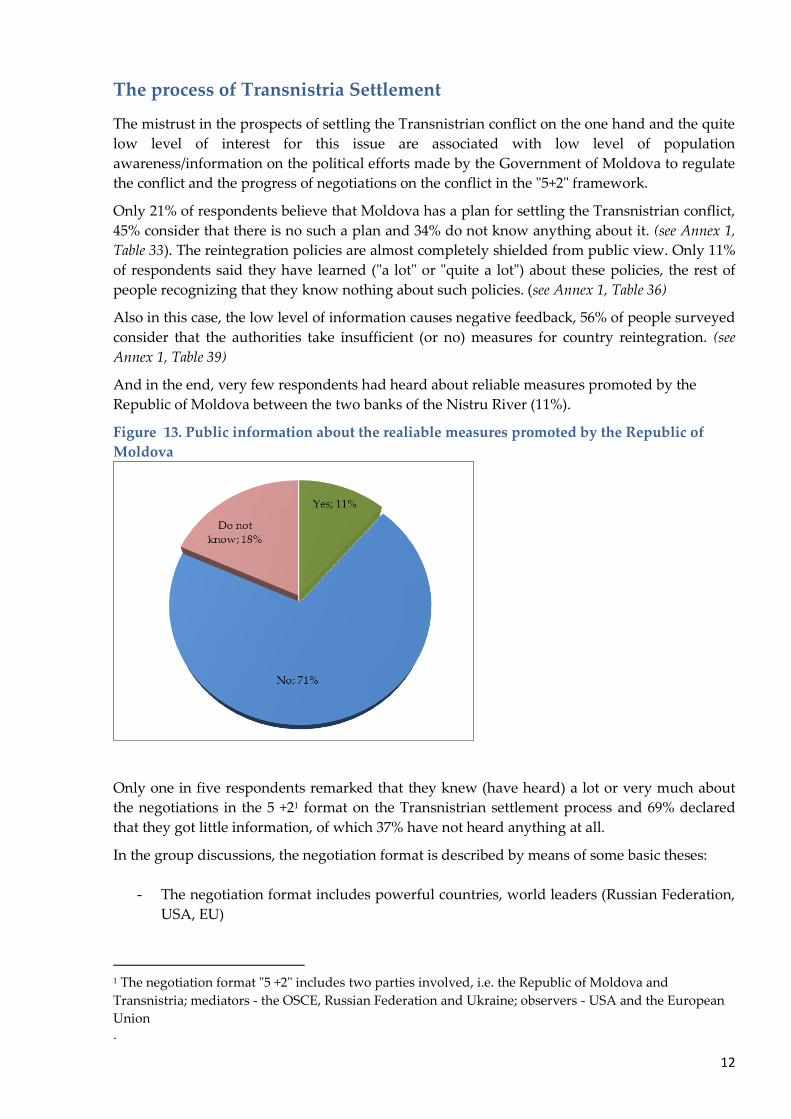
And although the forecasts that it will devolve into military conflict were rare in focus group
discussions, we see that two-thirds of respondents still regard the Transnistrian conflict as a
threat to the security of Moldova and to the peace in the region.
Figure 12. Does the Transnistrian conflict present a danger to the security of the Republic of
Moldova and the peace in the region?
12
The process of Transnistria Settlement
The mistrust in the prospects of settling the Transnistrian conflict on the one hand and the quite
low level of interest for this issue are associated with low level of population
awareness/information on the political efforts made by the Government of Moldova to regulate
the conflict and the progress of negotiations on the conflict in the "5+2" framework.
Only 21% of respondents believe that Moldova has a plan for settling the Transnistrian conflict,
45% consider that there is no such a plan and 34% do not know anything about it. (see Annex 1,
Table 33). The reintegration policies are almost completely shielded from public view. Only 11%
of respondents said they have learned ("a lot" or "quite a lot") about these policies, the rest of
people recognizing that they know nothing about such policies. (see Annex 1, Table 36)
Also in this case, the low level of information causes negative feedback, 56% of people surveyed
consider that the authorities take insufficient (or no) measures for country reintegration. (see
Annex 1, Table 39)
And in the end, very few respondents had heard about reliable measures promoted by the
Republic of Moldova between the two banks of the Nistru River (11%).
Figure 13. Public information about the realiable measures promoted by the Republic of
Moldova
Only one in five respondents remarked that they knew (have heard) a lot or very much about
the negotiations in the 5 +21 format on the Transnistrian settlement process and 69% declared
that they got little information, of which 37% have not heard anything at all.
In the group discussions, the negotiation format is described by means of some basic theses:
- The negotiation format includes powerful countries, world leaders (Russian Federation,
USA, EU)
1 The negotiation format "5 +2" includes two parties involved, i.e. the Republic of Moldova and
Transnistria; mediators - the OSCE, Russian Federation and Ukraine; observers - USA and the European
Union .

13
- The discussions in the negotiation process are useless, the format is not working, no
results being felt
- In the framework of these negotiations, the Republic of Moldova is constrained to give
up in favour of Transnistria
- There is little information available about activities and meetings on the negotiation
process.
The degree of correlation between awareness-level and interest expressed by the population to
the negotiation process indicates that the current state is rather determined by the low media
coverage of the process. Even among respondents who are concerned / interested in this issue,
more than half remarked decreased level of information available.
The low level of awareness about the progress of negotiations on the conflict is characteristic to
women, young people, people with lower educational and low to medium socio-economic
levels. (see Annex 1, Table 19)
Figure 14. Awareness level of citizens about the ongoing negotiations in the „5 +2” format,
overall and by level of interest in the Transnistrian issue
At the same time, the study revealed a high level of dissatisfaction with the progress in
negotiations on Transnistria conflict, where 35% of respondents are not satisfied and other 36%
are not quite/very satisfied with the results. The degree of dissatisfaction correlates with the
level of awareness about the negotiation process, the most dissatisfied people being those who
are informed about the process itself.
Figure 15. Degree of satisfaction with the progress of negotiations on Transnistria issue
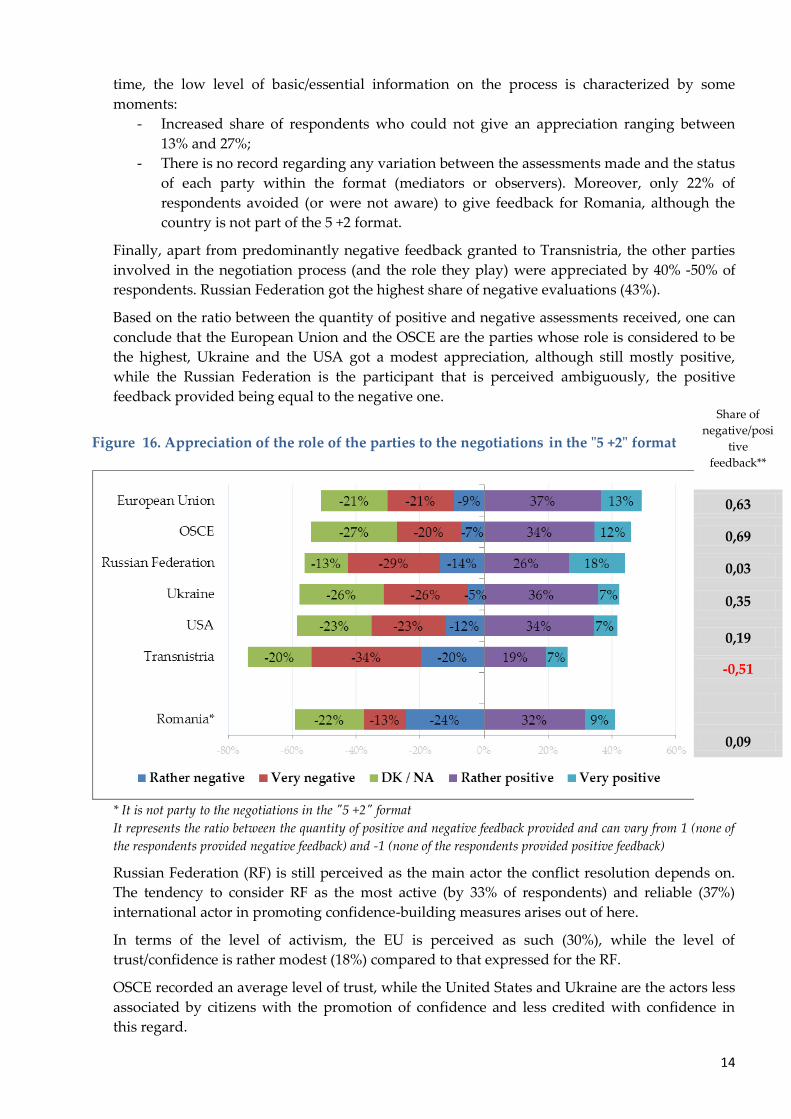
The appreciation of the role played by parties in the negotiations in the "5 +2" format is an
ambiguous one, either party being assessed predominantly negative or positive. At the same
14
time, the low level of basic/essential information on the process is characterized by some
moments:
- Increased share of respondents who could not give an appreciation ranging between
13% and 27%;
- There is no record regarding any variation between the assessments made and the status
of each party within the format (mediators or observers). Moreover, only 22% of
respondents avoided (or were not aware) to give feedback for Romania, although the
country is not part of the 5 +2 format.
Finally, apart from predominantly negative feedback granted to Transnistria, the other parties
involved in the negotiation process (and the role they play) were appreciated by 40% -50% of
respondents. Russian Federation got the highest share of negative evaluations (43%).
Based on the ratio between the quantity of positive and negative assessments received, one can
conclude that the European Union and the OSCE are the parties whose role is considered to be
the highest, Ukraine and the USA got a modest appreciation, although still mostly positive,
while the Russian Federation is the participant that is perceived ambiguously, the positive
feedback provided being equal to the negative one.
Figure 16. Appreciation of the role of the parties to the negotiations in the "5 +2" format
Share of
negative/posi
tive
feedback**
0,63
0,69
0,03
0,35
0,19
-0,51
0,09
* It is not party to the negotiations in the "5 +2" format
It represents the ratio between the quantity of positive and negative feedback provided and can vary from 1 (none of
the respondents provided negative feedback) and -1 (none of the respondents provided positive feedback)
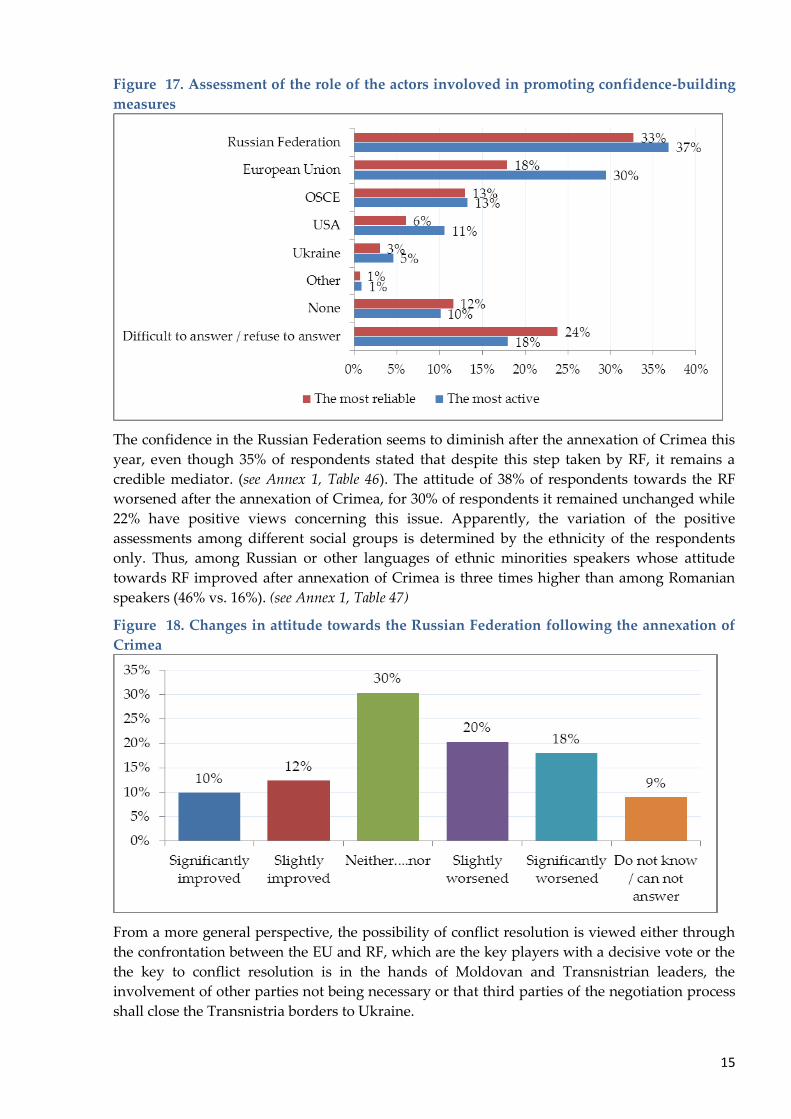
Russian Federation (RF) is still perceived as the main actor the conflict resolution depends on.
The tendency to consider RF as the most active (by 33% of respondents) and reliable (37%)
international actor in promoting confidence-building measures arises out of here.
In terms of the level of activism, the EU is perceived as such (30%), while the level of
trust/confidence is rather modest (18%) compared to that expressed for the RF.
OSCE recorded an average level of trust, while the United States and Ukraine are the actors less
associated by citizens with the promotion of confidence and less credited with confidence in
this regard.
15
Figure 17. Assessment of the role of the actors involoved in promoting confidence-building
measures
The confidence in the Russian Federation seems to diminish after the annexation of Crimea this
year, even though 35% of respondents stated that despite this step taken by RF, it remains a
credible mediator. (see Annex 1, Table 46). The attitude of 38% of respondents towards the RF
worsened after the annexation of Crimea, for 30% of respondents it remained unchanged while
22% have positive views concerning this issue. Apparently, the variation of the positive
assessments among different social groups is determined by the ethnicity of the respondents
only. Thus, among Russian or other languages of ethnic minorities speakers whose attitude
towards RF improved after annexation of Crimea is three times higher than among Romanian
speakers (46% vs. 16%). (see Annex 1, Table 47)
Figure 18. Changes in attitude towards the Russian Federation following the annexation of
Crimea
From a more general perspective, the possibility of conflict resolution is viewed either through
the confrontation between the EU and RF, which are the key players with a decisive vote or the
the key to conflict resolution is in the hands of Moldovan and Transnistrian leaders, the
involvement of other parties not being necessary or that third parties of the negotiation process
shall close the Transnistria borders to Ukraine.
16
Peacekeeping mission established after the armed conflict in 1992 and provided by the Russian
Federation is more often categorized as a useless one, outdated over the time. Periodic incidents
in the checkpoint in the
zone, including the most
serious incident on
January 1, 2012, when a
Moldovan civilian died
after being shot by a
peacekeeper, launch
regular massive waves in
media on this mission.
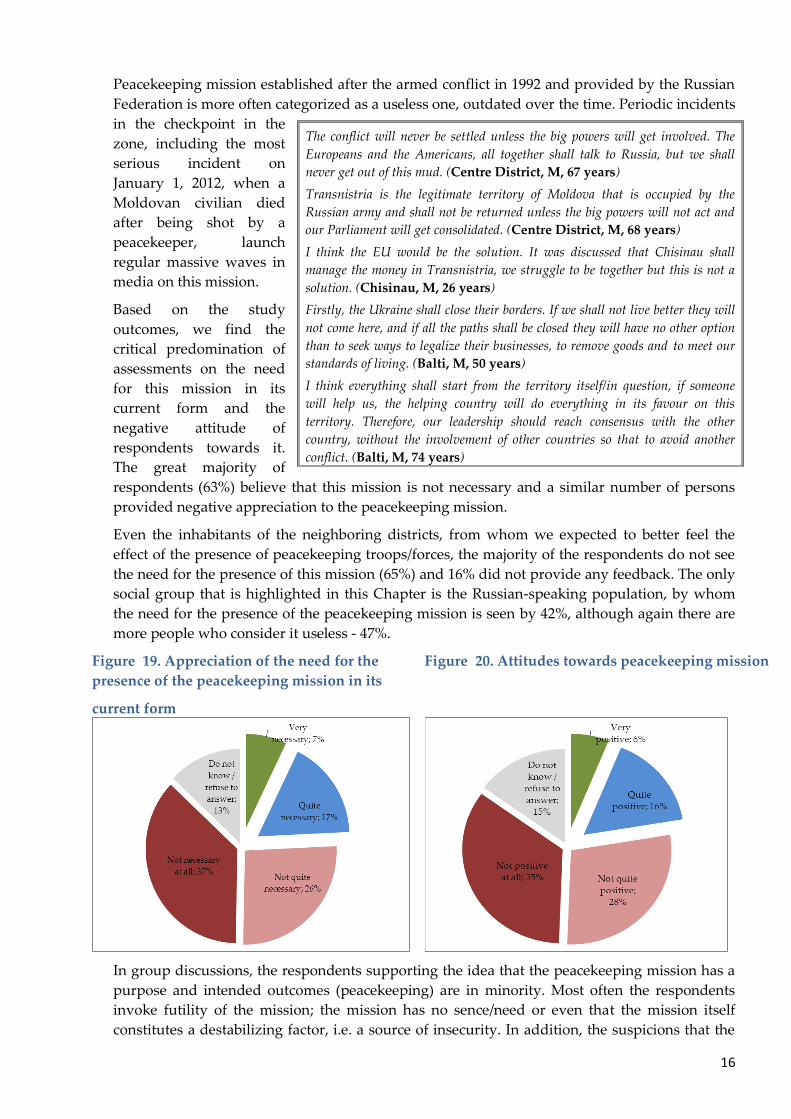
Based on the study
outcomes, we find the
critical predomination of
assessments on the need
for this mission in its
current form and the
negative attitude of
respondents towards it.
The great majority of
respondents (63%) believe that this mission is not necessary and a similar number of persons
provided negative appreciation to the peacekeeping mission.
Even the inhabitants of the neighboring districts, from whom we expected to better feel the
effect of the presence of peacekeeping troops/forces, the majority of the respondents do not see
the need for the presence of this mission (65%) and 16% did not provide any feedback. The only
social group that is highlighted in this Chapter is the Russian-speaking population, by whom
the need for the presence of the peacekeeping mission is seen by 42%, although again there are
more people who consider it useless - 47%.
Figure 19. Appreciation of the need for the
presence of the peacekeeping mission in its
current form
Figure 20. Attitudes towards peacekeeping mission
In group discussions, the respondents supporting the idea that the peacekeeping mission has a
purpose and intended outcomes (peacekeeping) are in minority. Most often the respondents
invoke futility of the mission; the mission has no sence/need or even that the mission itself
constitutes a destabilizing factor, i.e. a source of insecurity. In addition, the suspicions that the
The conflict will never be settled unless the big powers will get involved. The
Europeans and the Americans, all together shall talk to Russia, but we shall
never get out of this mud. (Centre District, M, 67 years)
Transnistria is the legitimate territory of Moldova that is occupied by the
Russian army and shall not be returned unless the big powers will not act and
our Parliament will get consolidated. (Centre District, M, 68 years)
I think the EU would be the solution. It was discussed that Chisinau shall
manage the money in Transnistria, we struggle to be together but this is not a
solution. (Chisinau, M, 26 years)
Firstly, the Ukraine shall close their borders. If we shall not live better they will
not come here, and if all the paths shall be closed they will have no other option
than to seek ways to legalize their businesses, to remove goods and to meet our
standards of living. (Balti, M, 50 years)
I think everything shall start from the territory itself/in question, if someone
will help us, the helping country will do everything in its favour on this
territory. Therefore, our leadership should reach consensus with the other
country, without the involvement of other countries so that to avoid another
conflict. (Balti, M, 74 years)
17
peacekeeping mission is in fact a tool to ensure the interests of someone under the existing
circumstances are raised very often, moslty the interests of the Russian Federation but also
those of the Transnistrian region.
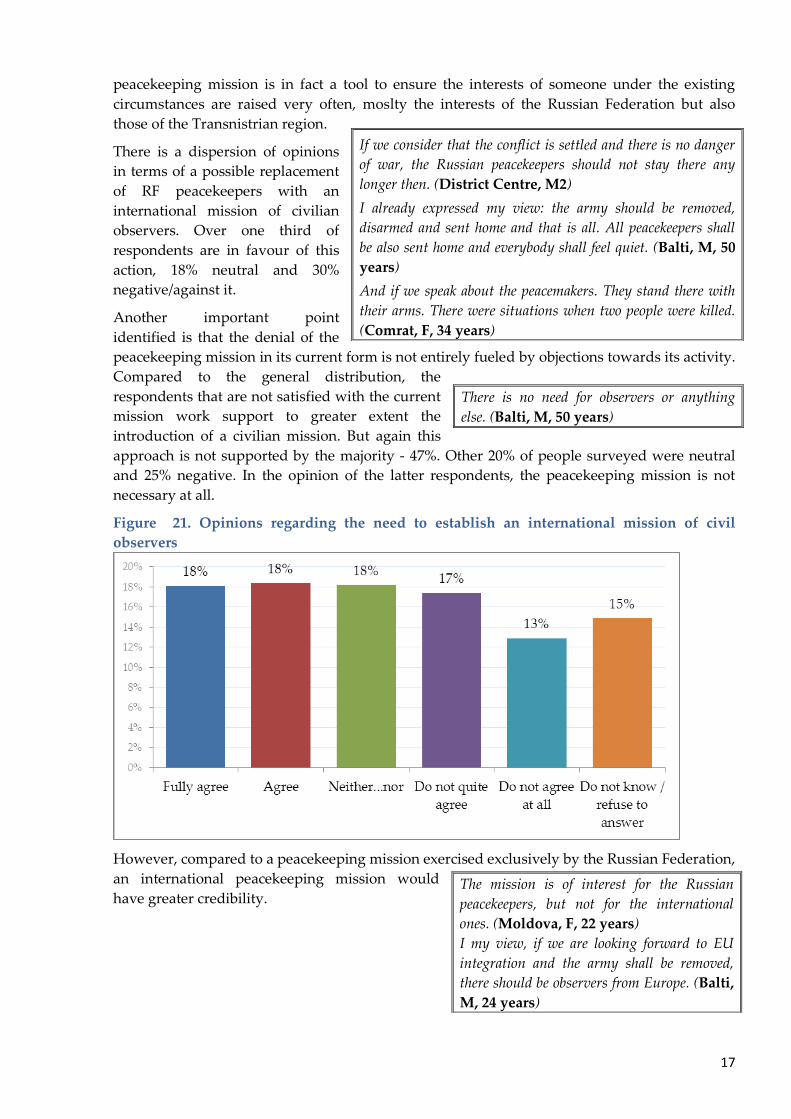
There is a dispersion of opinions
in terms of a possible replacement
of RF peacekeepers with an
international mission of civilian
observers. Over one third of
respondents are in favour of this
action, 18% neutral and 30%
negative/against it.
Another important point
identified is that the denial of the
peacekeeping mission in its current form is not entirely fueled by objections towards its activity.
Compared to the general distribution, the
respondents that are not satisfied with the current
mission work support to greater extent the
introduction of a civilian mission. But again this
approach is not supported by the majority - 47%. Other 20% of people surveyed were neutral
and 25% negative. In the opinion of the latter respondents, the peacekeeping mission is not
necessary at all.
Figure 21. Opinions regarding the need to establish an international mission of civil
observers
However, compared to a peacekeeping mission exercised exclusively by the Russian Federation,
an international peacekeeping mission would
have greater credibility.
If we consider that the conflict is settled and there is no danger
of war, the Russian peacekeepers should not stay there any
longer then. (District Centre, M2)
I already expressed my view: the army should be removed,
disarmed and sent home and that is all. All peacekeepers shall
be also sent home and everybody shall feel quiet. (Balti, M, 50
years)
And if we speak about the peacemakers. They stand there with
their arms. There were situations when two people were killed.
(Comrat, F, 34 years)
There is no need for observers or anything
else. (Balti, M, 50 years)
The mission is of interest for the Russian
peacekeepers, but not for the international
ones. (Moldova, F, 22 years)
I my view, if we are looking forward to EU
integration and the army shall be removed,
there should be observers from Europe. (Balti,
M, 24 years)
18
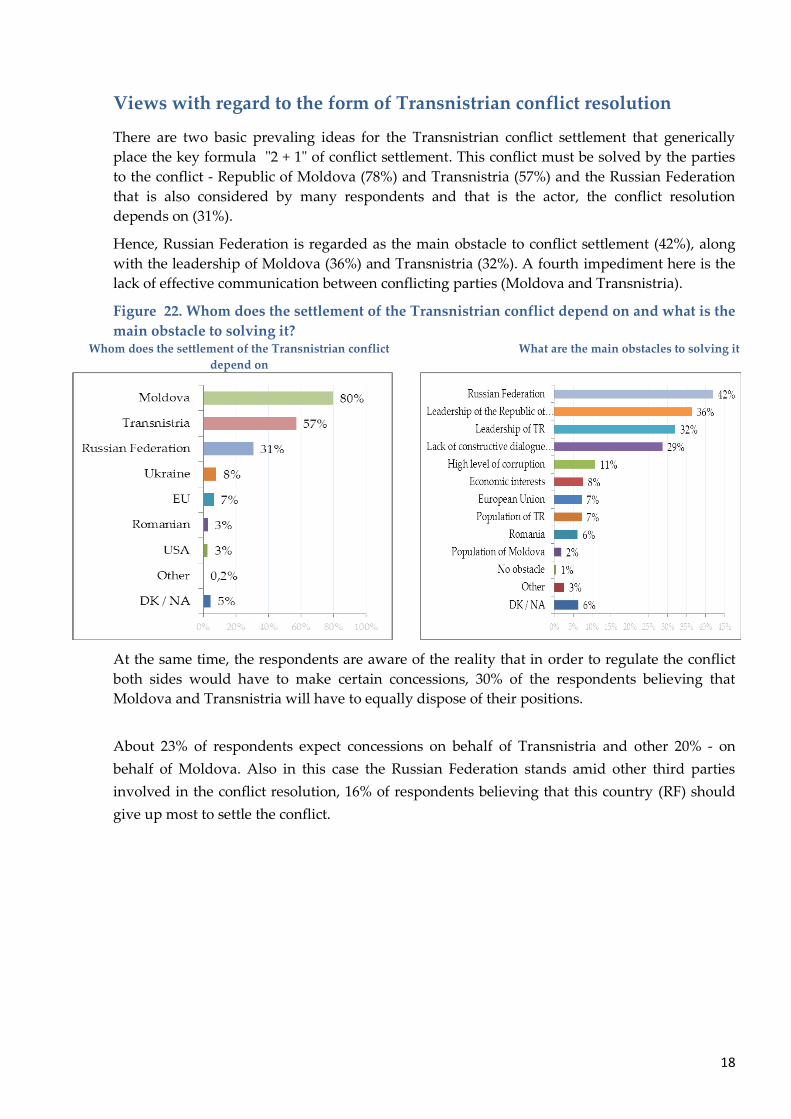
Views with regard to the form of Transnistrian conflict resolution
There are two basic prevaling ideas for the Transnistrian conflict settlement that generically
place the key formula "2 + 1" of conflict settlement. This conflict must be solved by the parties
to the conflict - Republic of Moldova (78%) and Transnistria (57%) and the Russian Federation
that is also considered by many respondents and that is the actor, the conflict resolution
depends on (31%).
Hence, Russian Federation is regarded as the main obstacle to conflict settlement (42%), along
with the leadership of Moldova (36%) and Transnistria (32%). A fourth impediment here is the
lack of effective communication between conflicting parties (Moldova and Transnistria).
Figure 22. Whom does the settlement of the Transnistrian conflict depend on and what is the
main obstacle to solving it? Whom does the settlement of the Transnistrian conflict
depend on
What are the main obstacles to solving it
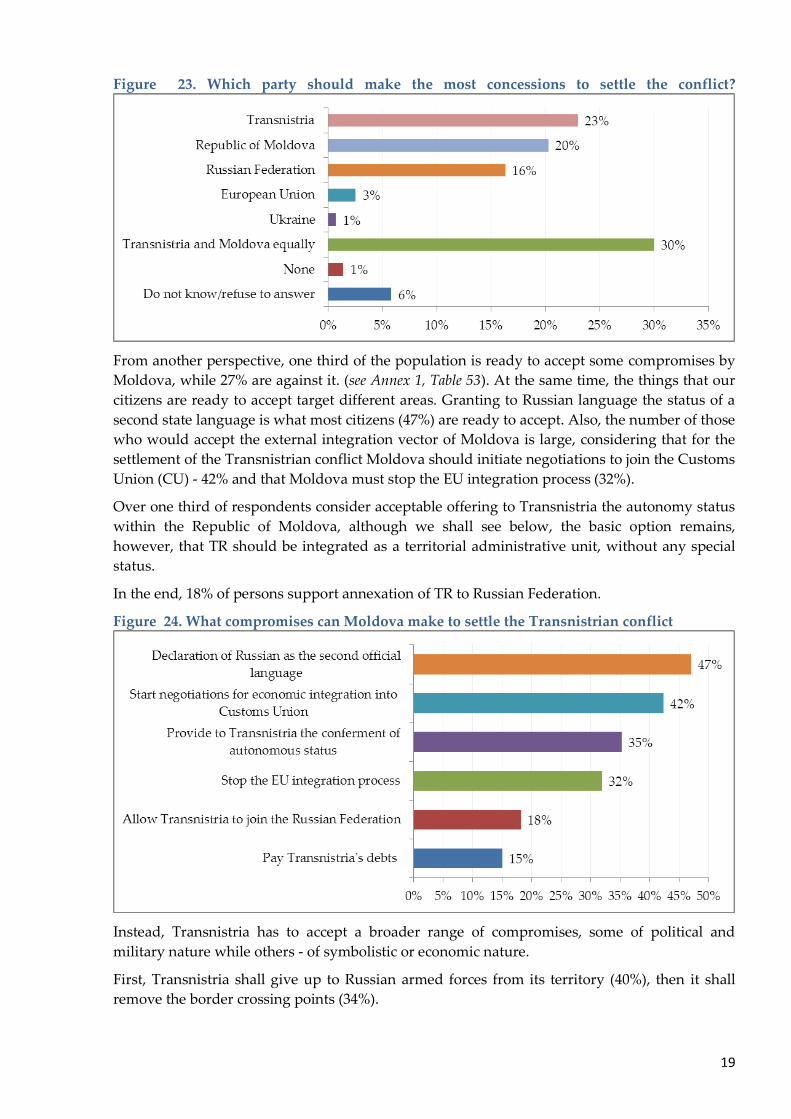
At the same time, the respondents are aware of the reality that in order to regulate the conflict
both sides would have to make certain concessions, 30% of the respondents believing that
Moldova and Transnistria will have to equally dispose of their positions.
About 23% of respondents expect concessions on behalf of Transnistria and other 20% - on
behalf of Moldova. Also in this case the Russian Federation stands amid other third parties
involved in the conflict resolution, 16% of respondents believing that this country (RF) should
give up most to settle the conflict.
19
Figure 23. Which party should make the most concessions to settle the conflict?
From another perspective, one third of the population is ready to accept some compromises by
Moldova, while 27% are against it. (see Annex 1, Table 53). At the same time, the things that our
citizens are ready to accept target different areas. Granting to Russian language the status of a
second state language is what most citizens (47%) are ready to accept. Also, the number of those
who would accept the external integration vector of Moldova is large, considering that for the
settlement of the Transnistrian conflict Moldova should initiate negotiations to join the Customs
Union (CU) - 42% and that Moldova must stop the EU integration process (32%).
Over one third of respondents consider acceptable offering to Transnistria the autonomy status
within the Republic of Moldova, although we shall see below, the basic option remains,
however, that TR should be integrated as a territorial administrative unit, without any special
status.
In the end, 18% of persons support annexation of TR to Russian Federation.
Figure 24. What compromises can Moldova make to settle the Transnistrian conflict
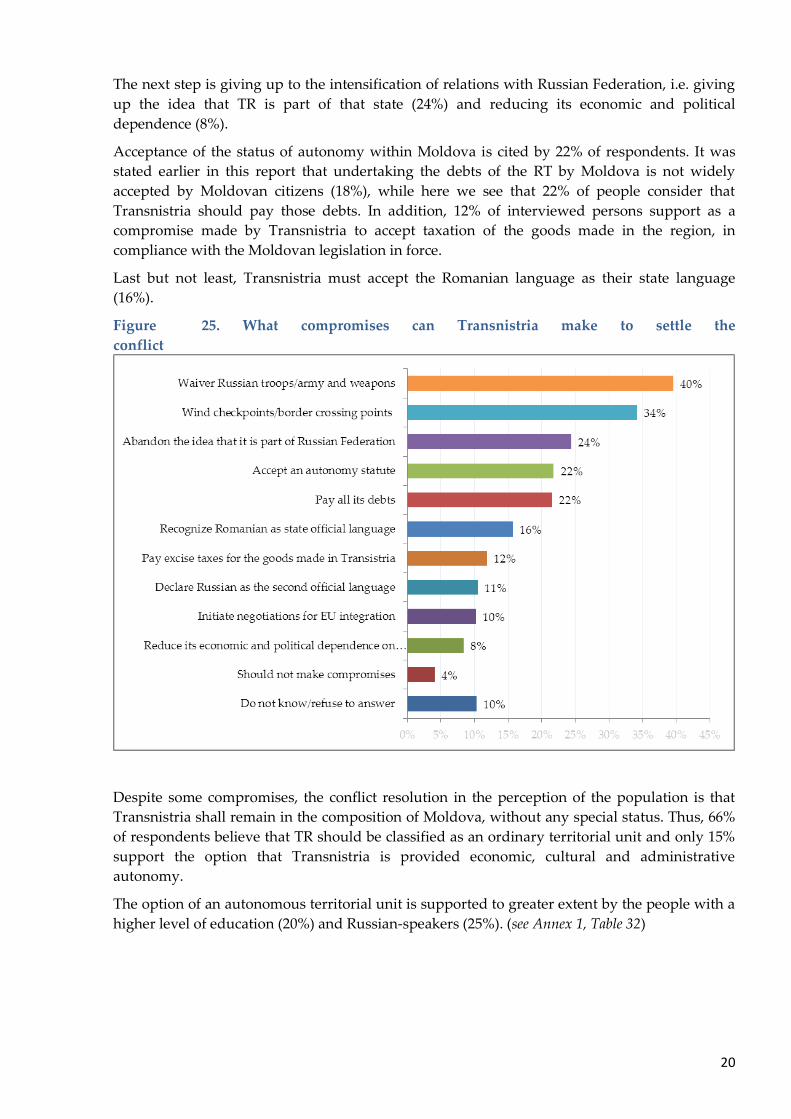
Instead, Transnistria has to accept a broader range of compromises, some of political and
military nature while others - of symbolistic or economic nature.
First, Transnistria shall give up to Russian armed forces from its territory (40%), then it shall
remove the border crossing points (34%).
20
The next step is giving up to the intensification of relations with Russian Federation, i.e. giving
up the idea that TR is part of that state (24%) and reducing its economic and political
dependence (8%).
Acceptance of the status of autonomy within Moldova is cited by 22% of respondents. It was
stated earlier in this report that undertaking the debts of the RT by Moldova is not widely
accepted by Moldovan citizens (18%), while here we see that 22% of people consider that
Transnistria should pay those debts. In addition, 12% of interviewed persons support as a
compromise made by Transnistria to accept taxation of the goods made in the region, in
compliance with the Moldovan legislation in force.
Last but not least, Transnistria must accept the Romanian language as their state language
(16%).
Figure 25. What compromises can Transnistria make to settle the
conflict
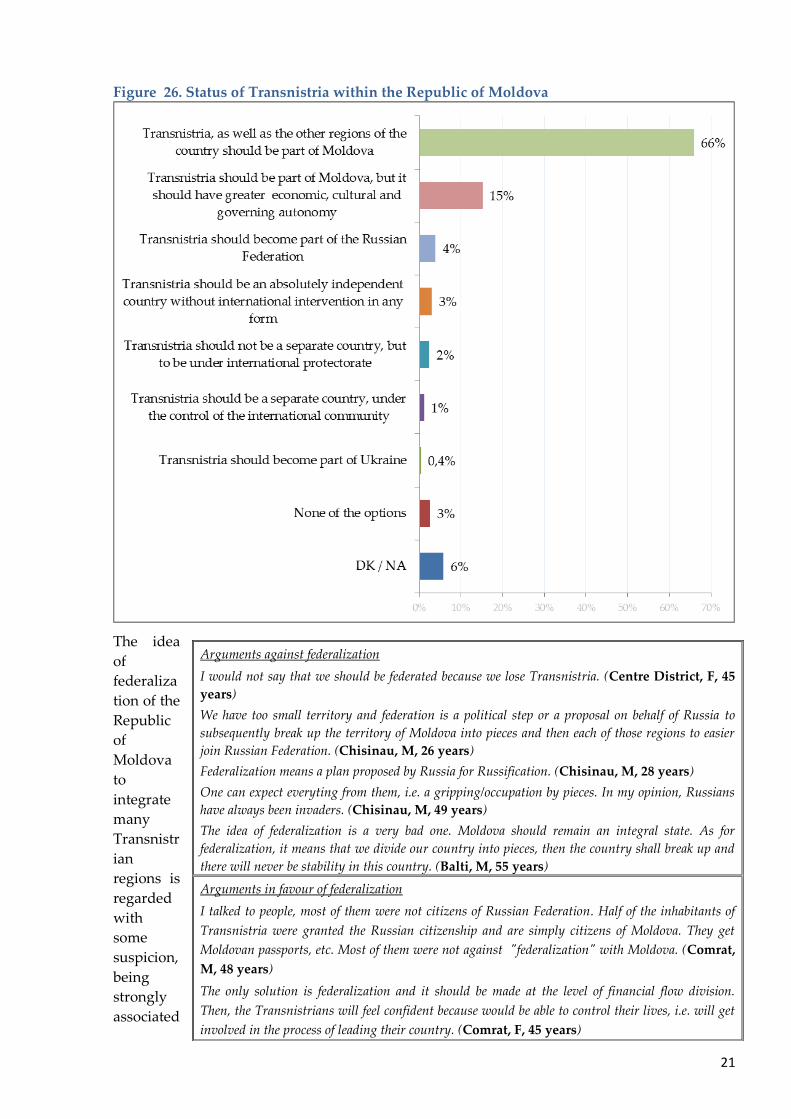
Despite some compromises, the conflict resolution in the perception of the population is that
Transnistria shall remain in the composition of Moldova, without any special status. Thus, 66%
of respondents believe that TR should be classified as an ordinary territorial unit and only 15%
support the option that Transnistria is provided economic, cultural and administrative
autonomy.
The option of an autonomous territorial unit is supported to greater extent by the people with a
higher level of education (20%) and Russian-speakers (25%). (see Annex 1, Table 32)
21
Figure 26. Status of Transnistria within the Republic of Moldova
The idea
of
federaliza
tion of the
Republic
of
Moldova
to
integrate
many
Transnistr
ian
regions is
regarded
with
some
suspicion,
being
strongly
associated
Arguments against federalization
I would not say that we should be federated because we lose Transnistria. (Centre District, F, 45
years)
We have too small territory and federation is a political step or a proposal on behalf of Russia to subsequently break up the territory of Moldova into pieces and then each of those regions to easier
join Russian Federation. (Chisinau, M, 26 years)
Federalization means a plan proposed by Russia for Russification. (Chisinau, M, 28 years)
One can expect everyting from them, i.e. a gripping/occupation by pieces. In my opinion, Russians
have always been invaders. (Chisinau, M, 49 years)
The idea of federalization is a very bad one. Moldova should remain an integral state. As for
federalization, it means that we divide our country into pieces, then the country shall break up and
there will never be stability in this country. (Balti, M, 55 years)
Arguments in favour of federalization
I talked to people, most of them were not citizens of Russian Federation. Half of the inhabitants of
Transnistria were granted the Russian citizenship and are simply citizens of Moldova. They get
Moldovan passports, etc. Most of them were not against "federalization" with Moldova. (Comrat,
M, 48 years)
The only solution is federalization and it should be made at the level of financial flow division.
Then, the Transnistrians will feel confident because would be able to control their lives, i.e. will get
involved in the process of leading their country. (Comrat, F, 45 years)
22
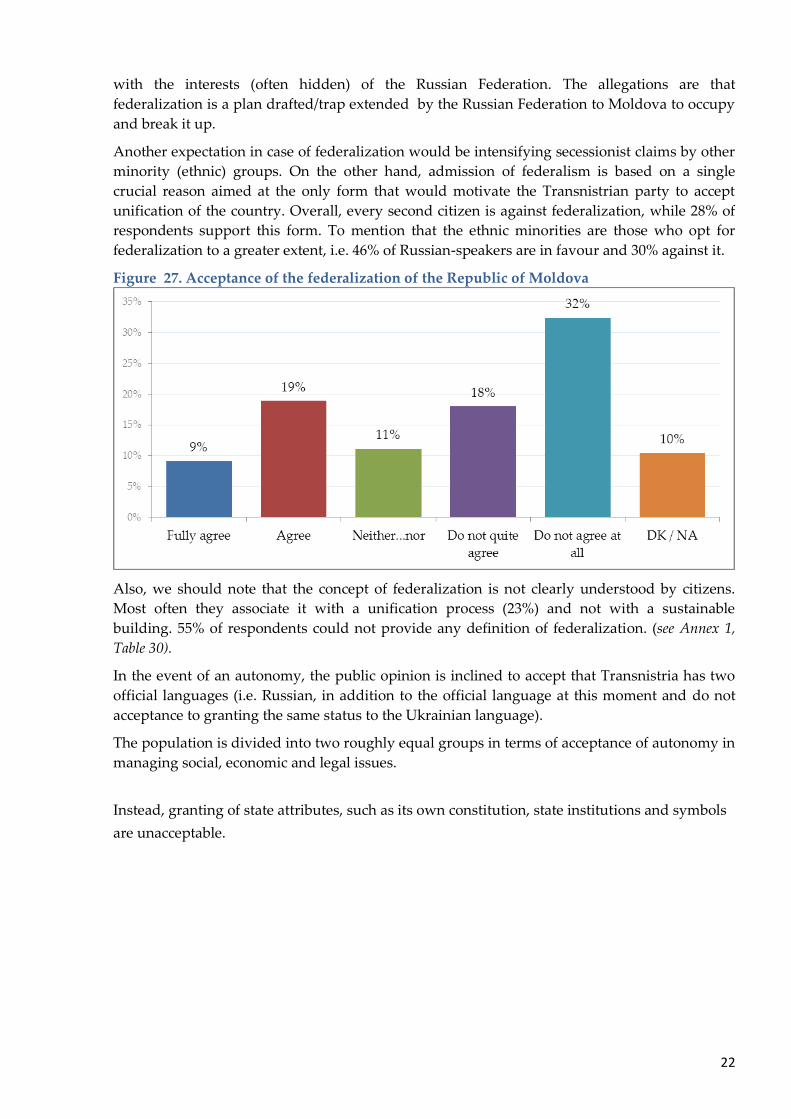
with the interests (often hidden) of the Russian Federation. The allegations are that
federalization is a plan drafted/trap extended by the Russian Federation to Moldova to occupy
and break it up.
Another expectation in case of federalization would be intensifying secessionist claims by other
minority (ethnic) groups. On the other hand, admission of federalism is based on a single
crucial reason aimed at the only form that would motivate the Transnistrian party to accept
unification of the country. Overall, every second citizen is against federalization, while 28% of
respondents support this form. To mention that the ethnic minorities are those who opt for
federalization to a greater extent, i.e. 46% of Russian-speakers are in favour and 30% against it.
Figure 27. Acceptance of the federalization of the Republic of Moldova
Also, we should note that the concept of federalization is not clearly understood by citizens.
Most often they associate it with a unification process (23%) and not with a sustainable
building. 55% of respondents could not provide any definition of federalization. (see Annex 1,
Table 30).
In the event of an autonomy, the public opinion is inclined to accept that Transnistria has two
official languages (i.e. Russian, in addition to the official language at this moment and do not
acceptance to granting the same status to the Ukrainian language).
The population is divided into two roughly equal groups in terms of acceptance of autonomy in
managing social, economic and legal issues.
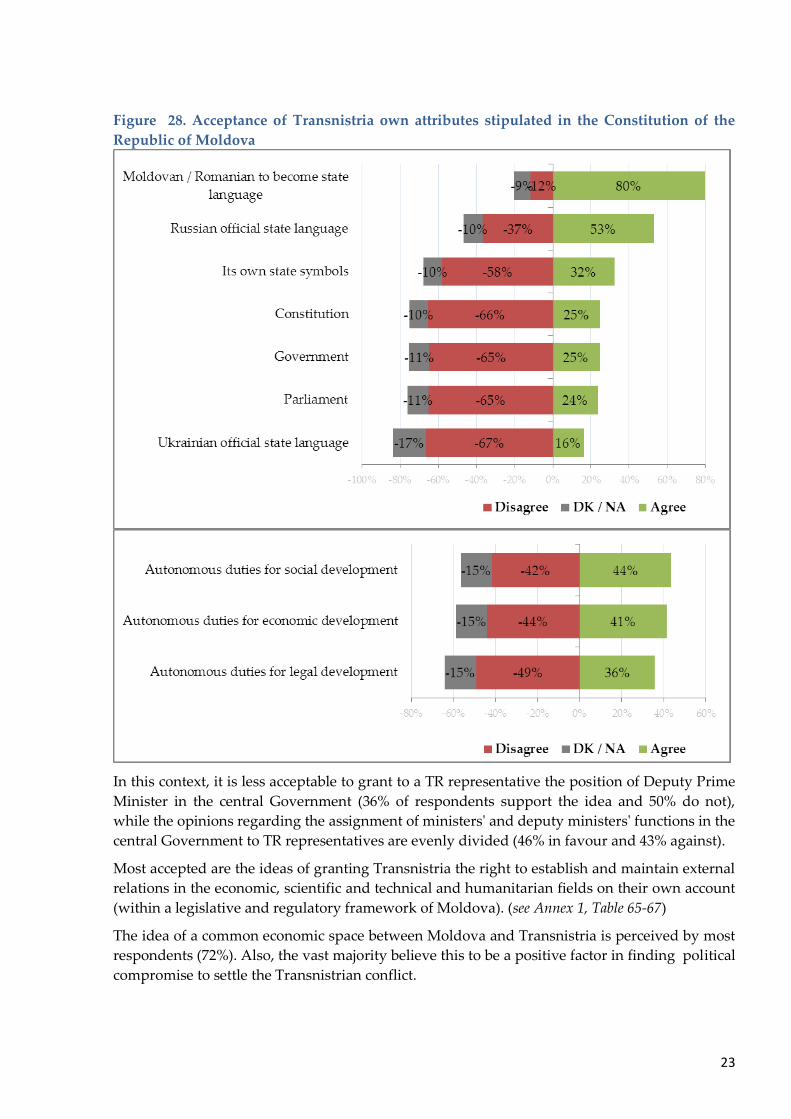
Instead, granting of state attributes, such as its own constitution, state institutions and symbols
are unacceptable.
23
Figure 28. Acceptance of Transnistria own attributes stipulated in the Constitution of the
Republic of Moldova
In this context, it is less acceptable to grant to a TR representative the position of Deputy Prime
Minister in the central Government (36% of respondents support the idea and 50% do not),
while the opinions regarding the assignment of ministers' and deputy ministers' functions in the
central Government to TR representatives are evenly divided (46% in favour and 43% against).
Most accepted are the ideas of granting Transnistria the right to establish and maintain external
relations in the economic, scientific and technical and humanitarian fields on their own account
(within a legislative and regulatory framework of Moldova). (see Annex 1, Table 65-67)
The idea of a common economic space between Moldova and Transnistria is perceived by most
respondents (72%). Also, the vast majority believe this to be a positive factor in finding political
compromise to settle the Transnistrian conflict.

24
Figure 29. Considerations on the possibility
of creating a common economic space
between the RM and TR
Figure 30. The common economic space
between the RM and TR will facilitate to obtain
political compromise to settle the Transnistrian
conflict
As an essence, this initiative is perceived in terms of reducing the selling price of products on
both sides (43%), rather than through imposing excise taxes. (see Annex 1, Table 70)

25
Transnistrian conflict settlement vs. European integration
The study reveals that, largely, the Moldovan citizens do not necessarily see the integration into
the European structures being conditioned by settlement of the Transnistrian conflict, although
the issue is perceived as an obstacle to that effect (about 58%).
Figure 31. Is the Transnistrian problem
an obstacle on the path to EU integration?
Figure 32. It the integration of Moldova into the EU
possible without settling the Transnistria conflict?
Given a choice between the EU integration and the country reunification options, the division is
evident, i.e. 26% of respondents would opt for EU integration giving up to Transnistria
reintegration with Moldova and 38% would support the opposite option - abandoning the idea
of EU integration in favour of country's reunification. One has to remark a somehow alarming
trend, i.e. that the "progressive" part of the society, i.e. youth with high education level and the
population with the high social and economic status tend to support to a greater extent the
option of "giving up Transnistria" in favour of EU integration. (see Annex 1, Table 51)
Instead, the maintainance of the neutrality status is necessary to settle the conflict for 58% of
respondents (19% sustaining the opposite). (see Annex 1, Table 68)
26
Conclusions
- Despite a high level of (declared) concern, the population concerns in settling the
Transnistrian conflict is not a priority for the citizens. This fact should not be interpreted
as lack of civic position or prevailing opinion that Moldova must give up Transnistria.
The explanation is that a) at the personal (household) level , the Transnistrian conflict
does not translate into any noticeable effect and b) the persistence of the problem over 20
years of the military/armed conflict introduces an element of "fatigue" in the subjective
perceptions of this issue.
- Changes in the share of citizens who place the Transnistrian problem among the top
priorities over the time (2003-2014) show a steady decline. At the same time, the
fluctuation of the interest level is not correlated to major events in the evolution of the
regulatory process (eg. "Kozak Memorandum", "Yushchenko Plan").
- The concern of the population towards Transnistrian problem has a "sacred" nature, i.e.
it is not important or vital at the personal level, but solving the problem must remain a
priority for the Government and it is considered significant for the country's future.
- As a result, most citizens still believe that Moldova needs Transnistria in its composition
(86%), but the most cited reasons in support of that view are not pragmatic but symbolic
- "Transnistria has always been part of Moldova and so it should be" and that "there are
many Moldovans living there".
- The main visible benefits from the eventual settlement of the conflict are related to the
liberalization of the movement between the two banks of the Nistru River, including
removing the checkpoints. And all these are despite the fact that the conflict is perceived
by most citizens as a threat to the security of the country and the region.
- The expectations towards settlement of the conflict are ambiguous and contradictory.
On one hand, a vision that would include most citizens, the population being divided
almost equally between those with positive expectations ("the conflict resolution is
possible") and pessimistic ones. Also, the share of respondents are numerous: those who
hope the conflict shall be settled in medium term, those who hope that it will be solved
in the long term and those who believe it will never be resolved (21%). However, the
expectations that the conflict will be settled through negotiations and in a form
acceptable to Moldova are rather pessimistic.
- The study reveals a very low level of public awareness about the particularities of the
country's reintegration. For instance, 71% of respondents had never heard about the
confidence measures promoted in the framework of the regulatory process. Also, the
share of citizens who feel informed about the progress of negotiations on the conflict in
the "5+2" format is quite small.
- The low level of awareness about the evolution of the country's reintegration policies
and lack of visible progress in the process of negotiations raise a high level of
dissatisfaction towards the negotiation process.
- The role of the parties to the negotiations in the "5 +2" format is appreciated mostly
positive, except for Transnistria, whose role is considered predominantly negative, as
well as the role of the Russian Federation with equal shares of both positive and
negative evaluations.
- Overall, the perceptions of the role of each party is determined rather by citizen's
attitudes towards each of those countries. One has to mention that the Russian
27
Federation and the European Union are the actors with highest appreciations (in terms
of confidence level and the active role in the negotiation process).
- The attitudes toward the current peacekeeping format is probably the element most
clearly formed in public opinion. The current peacekeeping mission is considered
negative by most citizens, whose need is not seen.
- Also, not only the essence of the current mission arises dissatisfaction. There persists a
common view that peacekeeping missions are not usually necessary, regardless of their
form.
- Despite the fact that the current format consists of seven parties involved in the
negotiation, the future of the conflict is regarded as being in the hands of only three
actors, i.e. Moldova, Transnistria and the Russian Federation. Therefore, these three
parties and the lack of communication between the Nistru River banks are considered
the main obstacles in settling the conflict.
- The compromises to be made by parties to the reintegration process are multiple, the
contradictory elements getting significant number of supporters. With reference to the
compromises to be accepted by Moldova in terms of reintegration, two major elements
stand out, i.e the official status of the Russian language (as second state language) and
adopting to enhance regional integration oriented towards East (CU integration and
abandoning the vector oriented towards the EU). The administrative integration format
was ranked fourth only (i.e. granting autonomous status within Moldova).
- With reference to the compromises Transnistria has to accept one can highlight
removing Russian troops/army and weapons from its territory, liquidating
checkpoints/border crossing points and giving up the idea to be part of RF.
- Apparently, the public opinion supports the idea of providing a special status for
Transnistria within Moldova. The overall position is that Transnistria should not have
any particular political-administrative status within the country. Only 15% of
respondents are in favour of providing more economic, cultural and administrative
autonomy. At the same time, the share of those who accept the idea of federalization of
Moldova in the context of territorial reintegration of Transnistria is significant (27%).
- And finally, the creation of a common economic space between both river banks is
supported by the vast majority of citizens.

28
ANNEX 1: SURVEY RESULTS IN TABLES
Public opinion towards the
resolution of the
Transnistrian conflict
Chisinau 2014
29
List of Tables
Table 1. Sampling structure.................................................................................................................................... 32
Table 2. How satisfied are you, in general, with the Moldova-Transnistria relations? ............................ - 33 -
Table 3. Please, tell me if problem listed below must become a priority for the Moldovan authorities,
important but not a priority or it is not an important one? ........................................................................... - 34 -
Table 4. Please, tell me if problem listed below must become a priority for the Moldovan authorities,
important but not a priority or it is not an important one? ........................................................................... - 35 -
Table 5. Please, tell me if problem listed below must become a priority for the Moldovan authorities,
important but not a priority or it is not an important one? ........................................................................... - 36 -
Table 6. Please, tell me which of the following areas/directions should become a priority for Moldova
authorities? ........................................................................................................................................................... - 37 -
Table 7. What are the priority / important issues for you? ........................................................................... - 38 -
Table 8. To what extent are you concerned about the subject of international recognition of Transnistria? -
39 -
Table 9. In your opinion, how important is the Transnistrian conflict resolution for the future of Moldova
- very important, quite important, not too important or not important at all? ........................................... - 40 -
Table 10. In your view, does Moldova need Transnistria in its composition? ........................................... - 41 -
Table 11. If you mentioned that Moldova needs Transnistria in its composition, what were the reasons to
consider so? .......................................................................................................................................................... - 42 -
Table 12. In your view, does the Transnistrian conflict present a threat to the security of the Republic of
Moldova and peace in the region? .................................................................................................................... - 43 -
Table 13. To what extent does the lack of settling the Transnistrian conflict affect the wellbeing your
family? ................................................................................................................................................................... - 44 -
Table 14. Please, tell me, what in your opinion would be the benefits of the Transnistrian conflict
resolution? ............................................................................................................................................................ - 45 -
Table 15. How do you think, to what extent is the settling of the Transnistrian conflict possible? ........ - 46 -
Table 16. Who in your opinion should settle the Transnistrian conflict? ................................................... - 47 -
Table 17. In your opinion, what are the major obstacles to solving the Transnistrian conflict? .............. - 48 -
Table 18. In your opinion, when shall the Transnistrian conflict be definitely settled? .......................... - 49 -
Table 19. As you know, the negotiations on the so-called "5 + 2" format on Transnistria's status are
ongoing. Tell me, please, how much have you heard or read about these negotiations? ......................... - 50 -
Table 20. How satisfied are you with the progress in Transnistria negotiations? ..................................... - 51 -
Table 21. Now, I shall name the countries and international organizations (IOs) participating in the
negotiations on the status of Transnistria. Please, tell me how you appreciate the role of each country/IO
in these negotiations - very positive, quite positive, rather negative or very negative?............................ - 52 -
Table 22. Now, I shall name the countries and international organizations (IOs) participating in the
negotiations on the status of Transnistria. Please, tell me how you appreciate the role of each country/IO
in these negotiations - very positive, quite positive, rather negative or very negative?............................ - 53 -
Table 23. Now, I shall name the countries and international organizations (IOs) participating in the
negotiations on the status of Transnistria. Please, tell me how you appreciate the role of each country/IO
in these negotiations - very positive, quite positive, rather negative or very negative?............................ - 54 -
Table 24. Now, I shall name the countries and international organizations (IOs) participating in the
negotiations on the status of Transnistria. Please, tell me how you appreciate the role of each country/IO
in these negotiations - very positive, quite positive, rather negative or very negative?............................ - 55 -
Table 25. How likely it is, in your view, that the negotiations on the status of Transnistria will reach an
agreement acceptable to Moldova? ................................................................................................................... - 56 -
Table 26. What, in your opinion, is the main obstacle to normalizing Moldova-Transnistria relations? . - 57
-
Table 27. As you know, there are checking points/peacekeeping posts installed at the borders of
Transnistria to maintain the security in the region. Some experts argue that those peacekeepers are not
necessary there, while others say their presence is rather necessary. How do you think: is it necessary or
not? ........................................................................................................................................................................ - 58 -
30
Table 28. How do you assess the role of the Russian peacekeepers in maintaining security in the region? -
59 -
Table 29. Tell me please if you agree that Russian peacekeepers are replaced by an international mission
of civilian observers? ........................................................................................................................................... - 60 -
Table 30. Tell me please, how do you understand the term of the Federalization or Federation? ......... - 61 -
Table 31. Tell me please if you agree that the Republic of Moldova to become a federation of three
components: Transnistria, Gagauzia and the rest of Moldova territory with equal rights? ..................... - 62 -
Table 32. At present, various ways to settle the Transnistrian conflict are proposed. Which of the
following options do you consider the best for solving the Transnistrian conflict? .................................. - 63 -
Table 33. In your opinion, has Moldova a plan for settling the Transnistrian conflict? ........................... - 64 -
Table 34. If Moldova has a plan for settling the Transnistrian conflict, what does this plan envisage?. - 65 -
Table 35. If Moldova has a plan for settling the Transnistrian conflict, what does this plan envisage?. - 66 -
Table 36. Tell me please if you know anything about the reintegration policy of the Republic of Moldova? ................................................................................................................................................................................ - 67 -
Table 37. If you mentioned that you know a lot or quite a lot about the reintegration policy of the
Republic of Moldova, tell me please what exactly you know, what does this reintegration policy
envisage? ............................................................................................................................................................... - 68 -
Table 38. If you mentioned that you know a lot or quite a lot about the reintegration policy of the
Republic of Moldova, tell me please what exactly you know, what does this reintegration policy
envisage? ............................................................................................................................................................... - 69 -
Table 39. To what extent, do you think, the Moldovan authorities take enough action for reintegration? .. -
70 -
Table 40. How do you think, what actions should Moldovan authorities take to settle the Transnistrian
conflict? ................................................................................................................................................................. - 71 -
Table 41. How well do you know or are you aware of the actions taken by the Moldovan authorities to
settle this conflict? ............................................................................................................................................... - 72 -
Table 42. Do you know the reliable measures promoted by the Republic of Moldova to settle the
Transnistrian conflict? ......................................................................................................................................... - 73 -
Table 43. In your opinion, which of the following measures can be included in the lists of reliable ones,
promoted by Moldova to settle the Transnistrian conflict? ........................................................................... - 74 -
Table 44. In your opinion, which of the most active international actors promote confidence-building
measures between Moldova and Transnistria? ............................................................................................... - 75 -
/Table 45. Which of the most active international actors enjoy the greatest deal of confidence in
promoting reliable measures between Moldova and Transnistria? ............................................................. - 75 -
Table 46. Tell me please, is Russia still a credible mediator in the settlement of Transnistrian issue after
the annexation of Crimea by the Russian Federation? ................................................................................... - 77 -
Table 47. Tell me please, has your opinion towards Russia improved or worsened after the annexation of
Crimea by the Russian Federation? .................................................................................................................. - 78 -
Table 48. With Russia's annexation of Crimea, Tiraspol asked the Russian officials to also annex
Transnistria to their territory. How do you think, what should the authorities in Chisinau do in this case? -
79 -
Table 49. In your view, is the Transnistrian conflict an obstacle (a problem) for Moldova on the path to
European integration?......................................................................................................................................... - 80 -
Table 50. How do you think, what are the chances of Moldova to join the EU without solving the
Transnistrian conflict? ......................................................................................................................................... - 81 -
Table 51. If you would have the opportunity to choose between the accession of Moldova to the EU and
reintegration of Transnistria, what would you choose?................................................................................. - 82 -
Table 52. Who do you think should make the greatest concessions (compromises) in the process of
Transnistrian conflict resolution? ...................................................................................................................... - 83 -
Table 53. To what extent would you be ready to accept any compromises made by Moldova to settle the
Transnistrian conflict? ......................................................................................................................................... - 84 -
Table 54. In your opinion, what compromises should Moldova make to settle the Transnistrian conflict? -
85 -

31
Table 55. In your opinion, what compromises should Moldova make to settle the Transnistrian conflict? -
86 -
Table 56. In your opinion, what compromises should Transnistria make to settle the Transnistrian
conflict? ................................................................................................................................................................. - 87 -
Table 57. What can (must) Moldova sacrifice and what efforts should it make to build a common state
with Transnistria? ................................................................................................................................................ - 88 -
Table 58. What can (must) Moldova sacrifice and what efforts should it make to build a common state
with Transnistria? ................................................................................................................................................ - 89 -
Table 59. Tell me please if you agree that Transnistria has the following.... .............................................. - 90 -
Table 60. Tell me please if you agree that Transnistria has the following.... .............................................. - 91 -
Table 61. Tell me please if you agree that Transnistria has the following.... .............................................. - 92 -
Table 62. Tell me please if you agree that Transnistria has the following.... .............................................. - 93 -
Table 63. Tell me please if you agree that Transnistria should solve its problems related to....
independently, as stipulated in the Constitution of the Republic of Moldova? ......................................... - 94 -
Table 64. Tell me please if you agree that Transnistria should solve its problems related to....
independently, as stipulated in the Constitution of the Republic of Moldova? ......................................... - 95 -
Table 65. Tell me, please, if you agree or disagree with the following statements...? ............................... - 96 -
Table 66. Tell me, please, if you agree or disagree with the following statements...? ............................... - 97 -
Table 67. Tell me, please, if you agree or disagree with the following statements...? .............................. - 98 -
Table 68. How do you think, in order to settle the Transnistrian conflict is it necessary for Moldova to
maintain its neutrality? ....................................................................................................................................... - 99 -
Table 69. How do you think, is it possible to create a common economic space (i.e. that their goods could
reach Moldovan markets and vice versa) between Moldova and Transnistria? ...................................... - 100 -
/Table 70. In your opinion, what should Moldova and Transnistria do to create a common economic
space (i.e. that their goods could reach Moldovan markets and vice versa) between Moldova and
Transnistria? ....................................................................................................................................................... - 100 -
Table 71. How do you think, if this common economic space is created (i.e. that their goods could reach
Moldovan markets and vice versa) between Moldova and Transnistria, could it facilitate to find a political
compromise to settlement the Transnistrian conflict? .................................................................................. - 102 -
Table 72. Tell me please, what should the Republic of Moldova do, if the Russian Federation shall
recognize Transnistria's independence? ......................................................................................................... - 103 -
32
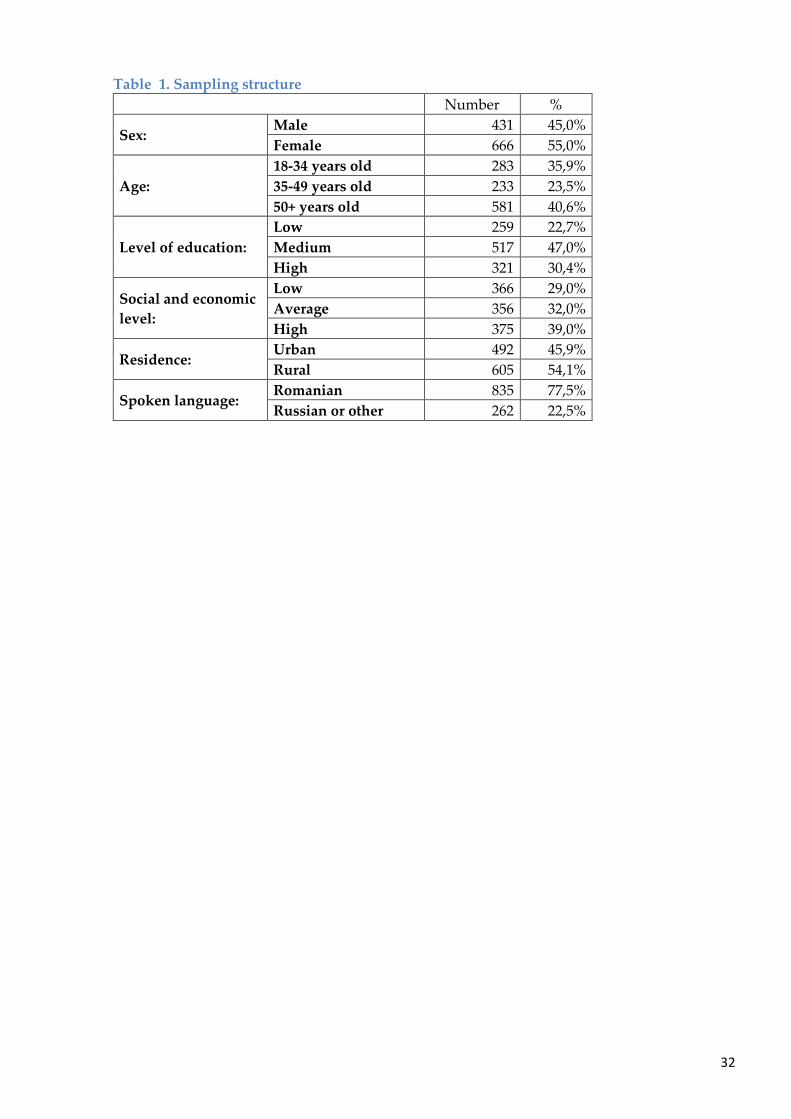
Table 1. Sampling structure
Number %
Sex: Male 431 45,0%
Female 666 55,0%
Age:
18-34 years old 283 35,9%
35-49 years old 233 23,5%
50+ years old 581 40,6%
Level of education:
Low 259 22,7%
Medium 517 47,0%
High 321 30,4%
Social and economic
level:
Low 366 29,0%
Average 356 32,0%
High 375 39,0%
Residence: Urban 492 45,9%
Rural 605 54,1%
Spoken language: Romanian 835 77,5%
Russian or other 262 22,5%
- 33 -
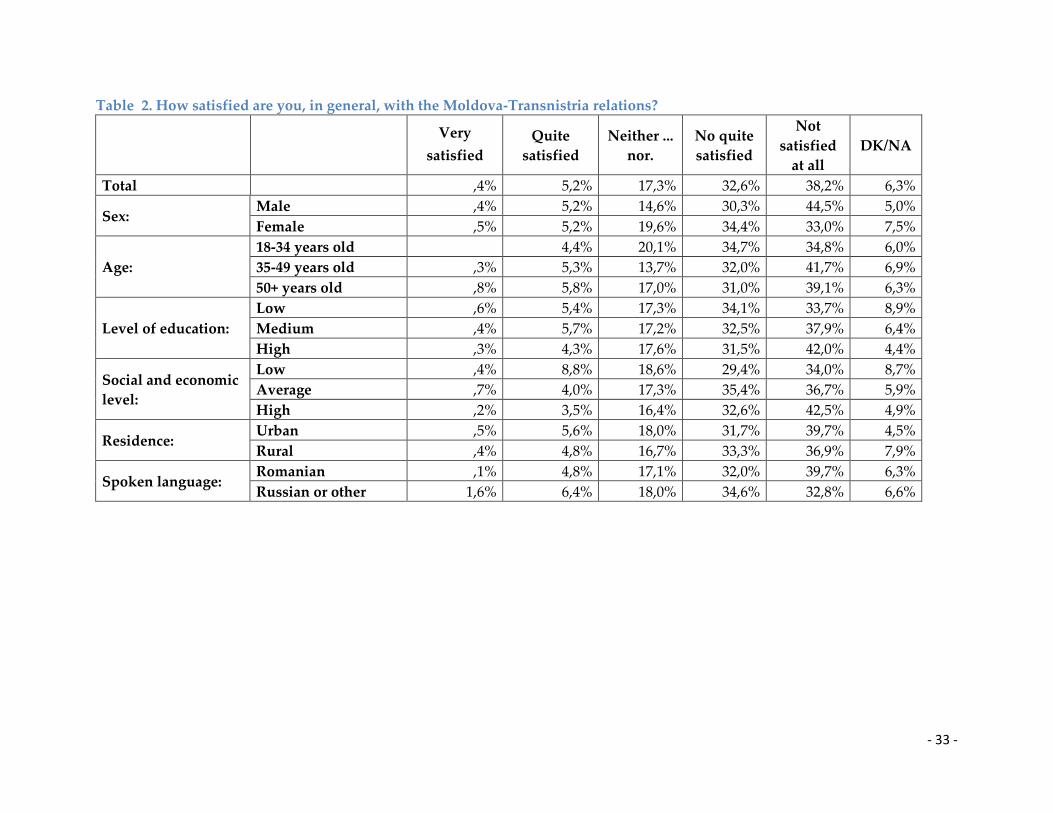
Table 2. How satisfied are you, in general, with the Moldova-Transnistria relations?
Very
satisfied
Quite
satisfied
Neither ...
nor.
No quite
satisfied
Not
satisfied
at all
DK/NA
Total ,4% 5,2% 17,3% 32,6% 38,2% 6,3%
Sex: Male ,4% 5,2% 14,6% 30,3% 44,5% 5,0%
Female ,5% 5,2% 19,6% 34,4% 33,0% 7,5%
Age:
18-34 years old 4,4% 20,1% 34,7% 34,8% 6,0%
35-49 years old ,3% 5,3% 13,7% 32,0% 41,7% 6,9%
50+ years old ,8% 5,8% 17,0% 31,0% 39,1% 6,3%
Level of education:
Low ,6% 5,4% 17,3% 34,1% 33,7% 8,9%
Medium ,4% 5,7% 17,2% 32,5% 37,9% 6,4%
High ,3% 4,3% 17,6% 31,5% 42,0% 4,4%
Social and economic
level:
Low ,4% 8,8% 18,6% 29,4% 34,0% 8,7%
Average ,7% 4,0% 17,3% 35,4% 36,7% 5,9%
High ,2% 3,5% 16,4% 32,6% 42,5% 4,9%
Residence: Urban ,5% 5,6% 18,0% 31,7% 39,7% 4,5%
Rural ,4% 4,8% 16,7% 33,3% 36,9% 7,9%
Spoken language: Romanian ,1% 4,8% 17,1% 32,0% 39,7% 6,3%
Russian or other 1,6% 6,4% 18,0% 34,6% 32,8% 6,6%

- 34 -
Table 3. Please, tell me if problem listed below must become a priority for the Moldovan authorities, important but not a
priority or it is not an important one?
Raise living standards
Adopt laws against corruption and
fraud EU integration
It is a
priority /
the most
important
It is
important
but not a
priority
It is
not
import
ant
DK/
NA
It is a
priority /
the most
important
It is
importan
t but not
a priority
It is
not
import
ant
DK/
NA
It is a
priority /
the most
important
It is
importan
t but not
a priority
It is
not
import
ant
DK/
NA
Total 88,0% 8,9% 0,6% 2,6% 65,6% 26,7% 3,4% 4,4% 33,3% 30,7% 30,3% 5,8%
Sex: Male 87,3% 9,8% 0,5% 2,5% 66,6% 26,4% 2,8% 4,2% 34,0% 33,0% 28,2% 4,8%
Female 88,5% 8,1% 0,6% 2,8% 64,8% 26,8% 3,8% 4,5% 32,7% 28,7% 32,0% 6,6%
Age:
18-34 years old 83,9% 11,8% 1,0% 3,3% 68,5% 22,9% 3,6% 5,1% 42,1% 30,9% 21,9% 5,2%
35-49 years old 86,8% 10,6% 2,6% 65,4% 26,8% 3,7% 4,1% 24,5% 31,2% 37,4% 6,9%
50+ years old 92,3% 5,2% 0,5% 2,1% 63,1% 29,9% 3,1% 3,9% 30,5% 30,1% 33,6% 5,7%
Level of
education:
Low 89,8% 7,7% 0,6% 1,9% 64,1% 26,1% 4,8% 5,0% 33,0% 34,0% 25,4% 7,5%
Medium 87,0% 10,8% 0,4% 1,9% 67,6% 26,2% 3,1% 3,1% 30,6% 28,9% 36,5% 4,0%
High 88,1% 6,8% 0,7% 4,4% 63,7% 27,7% 2,7% 5,9% 37,5% 30,9% 24,2% 7,3%
Social and
economic
level:
Low 91,7% 6,2% 1,2% 1,0% 63,6% 30,4% 3,0% 3,0% 30,3% 31,0% 33,3% 5,5%
Average 89,1% 8,8% 2,1% 69,4% 22,2% 4,1% 4,3% 31,3% 30,1% 34,0% 4,6%
High 84,2% 10,9% 0,6% 4,3% 64,0% 27,5% 3,1% 5,4% 37,1% 30,9% 25,0% 7,1%
Residence
:
Urban 87,0% 7,9% 0,8% 4,3% 62,9% 26,9% 4,1% 6,1% 30,2% 31,2% 30,9% 7,6%
Rural 88,8% 9,7% 0,4% 1,2% 67,9% 26,5% 2,8% 2,9% 35,8% 30,2% 29,7% 4,2%
Spoken
language:
Romanian 87,6% 9,6% 0,7% 2,1% 67,1% 25,5% 3,5% 3,9% 40,7% 29,8% 23,7% 5,7%
Russian or other 89,4% 6,3% 4,3% 60,5% 30,6% 3,0% 6,0% 7,6% 33,5% 52,8% 6,2%
- 35 -
Table 4. Please, tell me if problem listed below must become a priority for the Moldovan authorities, important but not a
priority or it is not an important one?
Maintain friendly relations with the
USA
Maintain friendly relations with the
Russian Federation
Overcome the addiction of Moldova
to other countries in terms of energy
resources
It is a
priority /
the most
important
It is
importan
t but not
a priority
It is
not
import
ant
DK/N
A
It is a
priority /
the most
important
It is
importan
t but not
a priority
It is
not
import
ant
DK/
NA
It is a
priority /
the most
important
It is
importan
t but not
a priority
It is
not
import
ant
DK/
NA
Total 29,6% 41,4% 22,9% 6,0% 51,4% 34,9% 8,8% 4,9% 48,3% 37,2% 6,6% 7,9%
Sex: Male 30,2% 42,0% 21,2% 6,5% 51,6% 35,0% 9,1% 4,3% 49,5% 35,9% 6,8% 7,8%
Female 29,2% 40,9% 24,3% 5,6% 51,2% 34,8% 8,7% 5,4% 47,3% 38,4% 6,4% 7,9%
Age:
18-34 years old 36,8% 40,8% 16,4% 6,0% 47,1% 37,6% 10,1% 5,2% 49,3% 36,3% 6,3% 8,1%
35-49 years old 22,7% 40,5% 31,0% 5,8% 56,8% 33,0% 4,7% 5,5% 46,2% 37,4% 8,8% 7,6%
50+ years old 27,3% 42,5% 24,1% 6,1% 52,0% 33,5% 10,2% 4,4% 48,6% 38,0% 5,7% 7,8%
Level of
education:
Low 30,7% 43,7% 16,8% 8,8% 52,8% 34,0% 7,6% 5,6% 44,2% 41,2% 4,5% 10,1%
Medium 28,0% 42,0% 25,7% 4,3% 55,1% 33,7% 7,3% 3,9% 50,5% 36,2% 7,0% 6,4%
High 31,4% 38,7% 23,2% 6,6% 44,6% 37,3% 12,2% 6,0% 48,0% 36,0% 7,6% 8,5%
Social and
economic
level:
Low 27,7% 45,4% 21,1% 5,9% 57,3% 30,4% 8,5% 3,8% 48,3% 37,6% 6,5% 7,5%
Average 31,7% 38,2% 24,2% 5,9% 54,9% 32,4% 8,1% 4,6% 49,1% 38,4% 4,3% 8,2%
High 29,4% 41,1% 23,4% 6,2% 44,1% 40,1% 9,7% 6,0% 47,6% 36,0% 8,6% 7,8%
Residence: Urban 23,8% 41,2% 28,4% 6,6% 42,5% 42,4% 10,2% 4,9% 44,7% 37,9% 9,0% 8,4%
Rural 34,6% 41,5% 18,3% 5,6% 58,9% 28,5% 7,7% 4,9% 51,3% 36,7% 4,6% 7,4%
Spoken
language:
Romanian 34,8% 42,4% 16,7% 6,1% 47,8% 36,6% 10,4% 5,2% 50,8% 35,6% 5,2% 8,4%
Russian or other 11,8% 38,0% 44,4% 5,7% 63,5% 28,8% 3,6% 4,1% 39,5% 42,9% 11,6% 6,0%
- 36 -
Table 5. Please, tell me if problem listed below must become a priority for the Moldovan authorities, important but not a
priority or it is not an important one?
Ensure freedom of the press Settle the Transnistrian conflict
It is a priority
/ the most
important
It is
important
but not a
priority
It is not
importa
nt
DK/N
A
It is a
priority / the
most
important
It is
important
but not a
priority
It is not
importa
nt
DK/N
A
Total 42,3% 40,8% 10,5% 6,3% 59,4% 28,0% 5,3% 7,3%
Sex: Male 42,7% 41,1% 10,5% 5,7% 59,0% 28,8% 5,4% 6,8%
Female 42,0% 40,6% 10,5% 6,9% 59,7% 27,4% 5,1% 7,7%
Age:
18-34 years old 45,9% 38,8% 7,2% 8,1% 58,5% 29,5% 3,5% 8,5%
35-49 years old 38,7% 41,8% 13,4% 6,2% 57,8% 27,0% 7,2% 8,0%
50+ years old 41,3% 42,1% 11,7% 4,9% 61,1% 27,3% 5,7% 5,9%
Level of
education:
Low 37,7% 45,1% 10,4% 6,9% 54,9% 32,5% 4,5% 8,1%
Medium 44,5% 39,9% 10,7% 5,0% 60,3% 28,2% 6,0% 5,5%
High 42,5% 39,1% 10,3% 8,0% 61,3% 24,5% 4,6% 9,6%
Social and
economic
level:
Low 42,2% 41,7% 11,8% 4,2% 58,4% 30,1% 6,0% 5,5%
Average 44,2% 39,6% 9,6% 6,6% 63,6% 25,8% 4,1% 6,6%
High 40,9% 41,2% 10,2% 7,7% 56,7% 28,3% 5,7% 9,2%
Residence: Urban 37,0% 40,8% 15,1% 7,0% 55,3% 30,6% 5,5% 8,5%
Rural 46,9% 40,9% 6,5% 5,7% 62,9% 25,8% 5,0% 6,2%
Spoken
language:
Romanian 42,4% 41,0% 10,0% 6,6% 59,2% 27,7% 5,4% 7,7%
Russian or other 42,1% 40,4% 12,2% 5,3% 60,0% 29,3% 4,8% 6,0%

- 37 -
Table 6. Please, tell me which of the following areas/directions should become a priority for Moldova authorities?
Rai
se l
ivin
g
stan
dar
ds
Ad
op
t la
ws
agai
nst
corr
up
tio
n a
nd
fra
ud
EU
in
teg
rati
on
Mai
nta
in f
rien
dly
rela
tio
ns
wit
h t
he
US
A
Mai
nta
in f
rien
dly
rela
tio
ns
wit
h t
he
RF
Ov
erco
me
th
e
add
icti
on
of
Mo
ldo
va
to o
ther
co
un
trie
s in
term
s o
f en
erg
y
reso
urc
es
En
sure
fre
edo
m o
f
the
pre
ss
Set
tle
the
Tra
nsn
istr
ian
co
nfl
ict
Oth
er
It i
s d
iffi
cult
fo
r m
e
to a
nsw
er
Total 79,4% 27,4% 22,3% 5,1% 29,1% 8,8% 2,8% 18,2% 2,1% 1,2%
Sex: Male 79,0% 26,4% 22,6% 5,7% 28,3% 9,4% 3,1% 19,0% 1,0% 1,2%
Female 79,7% 28,2% 22,1% 4,5% 29,7% 8,4% 2,5% 17,5% 2,9% 1,3%
Age:
18-34 years old 76,7% 27,0% 32,4% 6,2% 24,3% 6,6% 4,0% 16,3% 2,3% 1,4%
35-49 years old 79,5% 27,0% 17,8% 4,0% 34,6% 10,8% 2,2% 18,0% ,3% 1,1%
50+ years old 81,7% 28,0% 16,0% 4,7% 30,1% 9,7% 2,0% 19,9% 2,8% 1,2%
Level of
education:
Low 81,3% 27,3% 16,3% 5,4% 30,0% 8,0% 2,6% 19,4% 3,1% 1,0%
Medium 79,8% 25,5% 21,8% 5,0% 33,7% 9,5% 2,5% 16,7% 1,3% ,7%
High 77,4% 30,5% 27,6% 4,9% 21,2% 8,5% 3,3% 19,5% 2,4% 2,2%
Social and
economic
level:
Low 81,0% 30,6% 12,8% 3,3% 32,9% 8,8% 3,0% 17,8% 2,5% 1,3%
Average 81,3% 27,6% 21,7% 6,7% 28,4% 6,5% 2,4% 19,8% 1,7% 1,5%
High 76,6% 24,9% 29,9% 5,0% 26,7% 10,8% 2,9% 17,1% 2,0% 1,0%
Residence: Urban 76,2% 25,5% 23,4% 3,7% 31,3% 12,3% 2,7% 19,2% 2,0% 1,5%
Rural 82,1% 29,0% 21,4% 6,2% 27,1% 5,9% 2,9% 17,3% 2,1% 1,0%
Spoken
language:
Romanian 78,7% 28,9% 26,8% 5,5% 22,6% 9,6% 3,1% 17,8% 2,4% 1,2%
Russian or other 81,7% 22,3% 6,9% 3,6% 51,3% 6,3% 1,8% 19,5% ,9% 1,6%
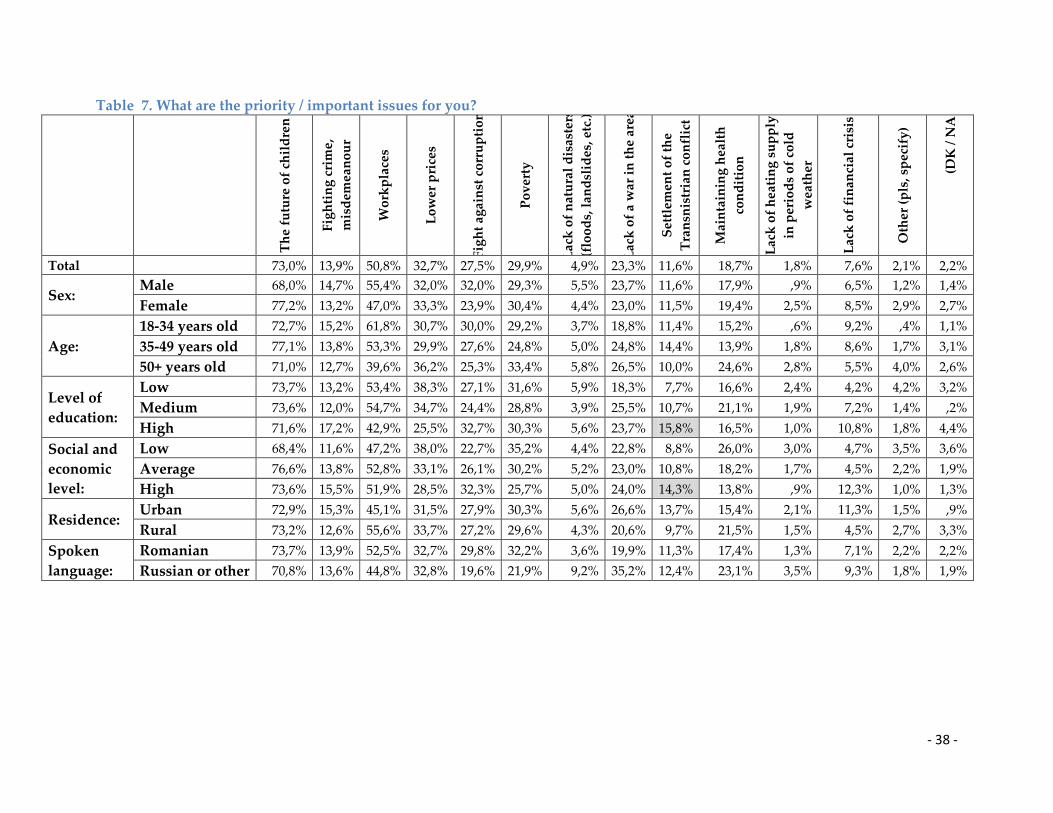
- 38 -
Table 7. What are the priority / important issues for you?
Th
e fu
ture
of
chil
dre
n
Fig
hti
ng
cri
me
,
mis
dem
ean
ou
r
Wo
rkp
lace
s
Lo
wer
pri
ces
Fig
ht
agai
nst
co
rru
pti
on
Po
ver
ty
Lac
k o
f n
atu
ral
dis
aste
rs
(flo
od
s, l
and
slid
es, e
tc.)
Lac
k o
f a
war
in
th
e ar
ea
Set
tlem
ent
of
the
Tra
nsn
istr
ian
co
nfl
ict
Mai
nta
inin
g h
ealt
h
con
dit
ion
Lac
k o
f h
eati
ng
su
pp
ly
in p
erio
ds
of
cold
wea
ther
Lac
k o
f fi
nan
cial
cri
sis
Oth
er (
pls
, sp
ecif
y)
(DK
/ N
A
Total 73,0% 13,9% 50,8% 32,7% 27,5% 29,9% 4,9% 23,3% 11,6% 18,7% 1,8% 7,6% 2,1% 2,2%
Sex: Male 68,0% 14,7% 55,4% 32,0% 32,0% 29,3% 5,5% 23,7% 11,6% 17,9% ,9% 6,5% 1,2% 1,4%
Female 77,2% 13,2% 47,0% 33,3% 23,9% 30,4% 4,4% 23,0% 11,5% 19,4% 2,5% 8,5% 2,9% 2,7%
Age:
18-34 years old 72,7% 15,2% 61,8% 30,7% 30,0% 29,2% 3,7% 18,8% 11,4% 15,2% ,6% 9,2% ,4% 1,1%
35-49 years old 77,1% 13,8% 53,3% 29,9% 27,6% 24,8% 5,0% 24,8% 14,4% 13,9% 1,8% 8,6% 1,7% 3,1%
50+ years old 71,0% 12,7% 39,6% 36,2% 25,3% 33,4% 5,8% 26,5% 10,0% 24,6% 2,8% 5,5% 4,0% 2,6%
Level of
education:
Low 73,7% 13,2% 53,4% 38,3% 27,1% 31,6% 5,9% 18,3% 7,7% 16,6% 2,4% 4,2% 4,2% 3,2%
Medium 73,6% 12,0% 54,7% 34,7% 24,4% 28,8% 3,9% 25,5% 10,7% 21,1% 1,9% 7,2% 1,4% ,2%
High 71,6% 17,2% 42,9% 25,5% 32,7% 30,3% 5,6% 23,7% 15,8% 16,5% 1,0% 10,8% 1,8% 4,4%
Social and
economic
level:
Low 68,4% 11,6% 47,2% 38,0% 22,7% 35,2% 4,4% 22,8% 8,8% 26,0% 3,0% 4,7% 3,5% 3,6%
Average 76,6% 13,8% 52,8% 33,1% 26,1% 30,2% 5,2% 23,0% 10,8% 18,2% 1,7% 4,5% 2,2% 1,9%
High 73,6% 15,5% 51,9% 28,5% 32,3% 25,7% 5,0% 24,0% 14,3% 13,8% ,9% 12,3% 1,0% 1,3%
Residence: Urban 72,9% 15,3% 45,1% 31,5% 27,9% 30,3% 5,6% 26,6% 13,7% 15,4% 2,1% 11,3% 1,5% ,9%
Rural 73,2% 12,6% 55,6% 33,7% 27,2% 29,6% 4,3% 20,6% 9,7% 21,5% 1,5% 4,5% 2,7% 3,3%
Spoken
language:
Romanian 73,7% 13,9% 52,5% 32,7% 29,8% 32,2% 3,6% 19,9% 11,3% 17,4% 1,3% 7,1% 2,2% 2,2%
Russian or other 70,8% 13,6% 44,8% 32,8% 19,6% 21,9% 9,2% 35,2% 12,4% 23,1% 3,5% 9,3% 1,8% 1,9%
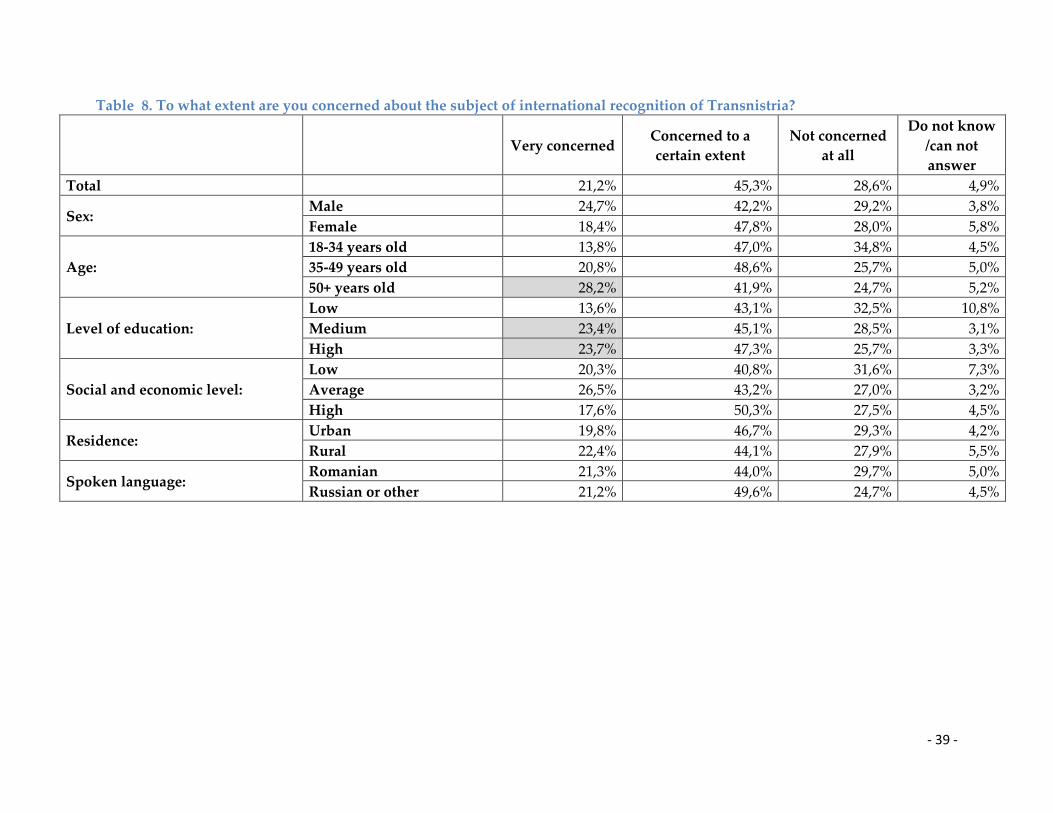
- 39 -
Table 8. To what extent are you concerned about the subject of international recognition of Transnistria?
Very concerned Concerned to a
certain extent
Not concerned
at all
Do not know
/can not
answer
Total 21,2% 45,3% 28,6% 4,9%
Sex: Male 24,7% 42,2% 29,2% 3,8%
Female 18,4% 47,8% 28,0% 5,8%
Age:
18-34 years old 13,8% 47,0% 34,8% 4,5%
35-49 years old 20,8% 48,6% 25,7% 5,0%
50+ years old 28,2% 41,9% 24,7% 5,2%
Level of education:
Low 13,6% 43,1% 32,5% 10,8%
Medium 23,4% 45,1% 28,5% 3,1%
High 23,7% 47,3% 25,7% 3,3%
Social and economic level:
Low 20,3% 40,8% 31,6% 7,3%
Average 26,5% 43,2% 27,0% 3,2%
High 17,6% 50,3% 27,5% 4,5%
Residence: Urban 19,8% 46,7% 29,3% 4,2%
Rural 22,4% 44,1% 27,9% 5,5%
Spoken language: Romanian 21,3% 44,0% 29,7% 5,0%
Russian or other 21,2% 49,6% 24,7% 4,5%

- 40 -
Table 9. In your opinion, how important is the Transnistrian conflict resolution for the future of Moldova - very important,
quite important, not too important or not important at all?
Very important Quite
important
Not quite
important
Not important
at all
Do not know
/can not
answer
Total 36,7% 44,4% 11,0% 1,6% 6,2%
Sex: Male 40,1% 40,1% 10,3% 2,3% 7,1%
Female 33,9% 48,0% 11,5% 1,1% 5,5%
Age:
18-34 years old 34,0% 45,4% 12,7% 2,0% 6,0%
35-49 years old 35,5% 45,5% 10,0% 1,7% 7,2%
50+ years old 39,8% 43,0% 10,0% 1,3% 5,9%
Level of education:
Low 23,8% 48,6% 13,4% 3,1% 11,2%
Medium 37,5% 45,2% 10,9% 1,7% 4,7%
High 45,1% 40,1% 9,3% ,5% 5,0%
Social and economic
level:
Low 33,0% 45,1% 10,6% 2,1% 9,1%
Average 37,8% 44,0% 9,8% 1,3% 7,1%
High 38,5% 44,3% 12,2% 1,5% 3,4%
Residence: Urban 35,8% 45,0% 13,1% 1,7% 4,3%
Rural 37,4% 44,0% 9,2% 1,6% 7,9%
Spoken language: Romanian 39,3% 41,7% 10,4% 1,6% 7,1%
Russian or other 27,8% 53,9% 12,9% 1,9% 3,5%

- 41 -
Table 10. In your view, does Moldova need Transnistria in its composition?
Yes No DK/NA
Total 85,5% 8,6% 5,9%
Sex: Male 85,0% 10,4% 4,5%
Female 85,8% 7,1% 7,1%
Age:
18-34 years old 82,8% 9,6% 7,6%
35-49 years old 83,8% 11,8% 4,3%
50+ years old 88,8% 5,9% 5,4%
Level of education:
Low 82,2% 9,6% 8,1%
Medium 87,3% 7,5% 5,2%
High 85,1% 9,5% 5,4%
Social and economic level:
Low 83,1% 9,1% 7,8%
Average 88,9% 5,6% 5,5%
High 84,4% 10,7% 5,0%
Residence: Urban 83,1% 10,3% 6,6%
Rural 87,5% 7,2% 5,3%
Spoken language: Romanian 87,6% 7,1% 5,3%
Russian or other 78,0% 13,8% 8,2%
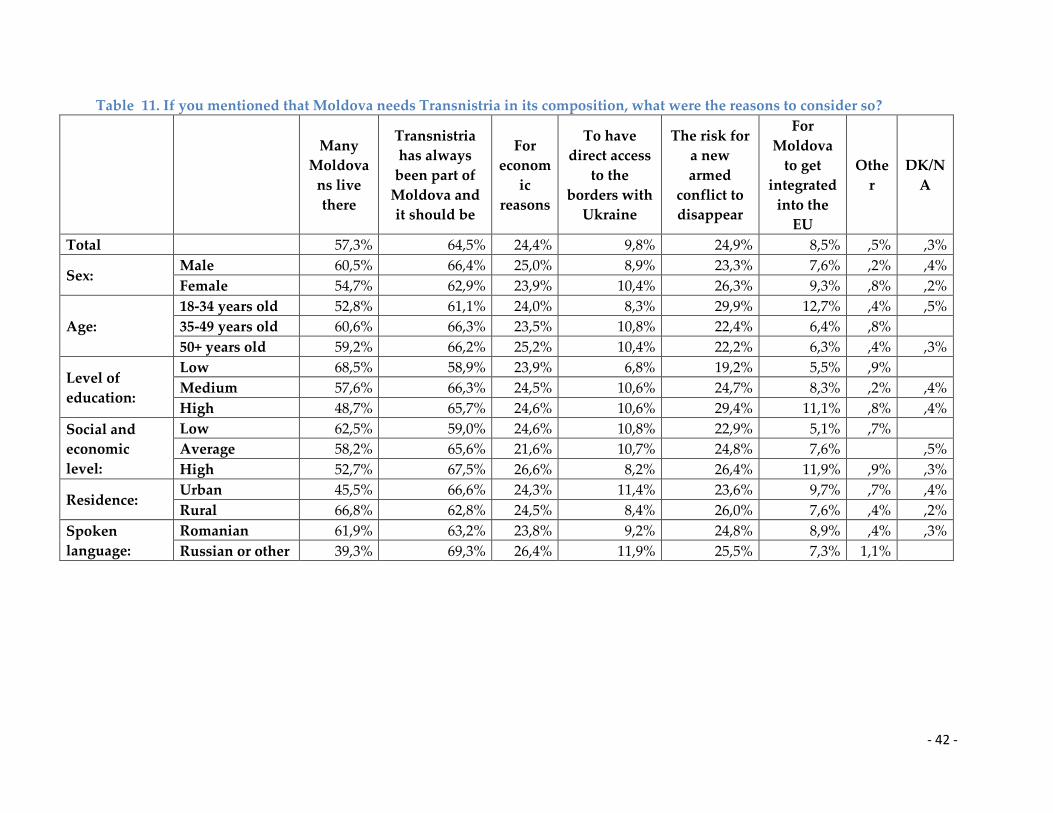
- 42 -
Table 11. If you mentioned that Moldova needs Transnistria in its composition, what were the reasons to consider so?
Many
Moldova
ns live
there
Transnistria
has always
been part of
Moldova and
it should be
For
econom
ic
reasons
To have
direct access
to the
borders with
Ukraine
The risk for
a new
armed
conflict to
disappear
For
Moldova
to get
integrated
into the
EU
Othe
r
DK/N
A
Total 57,3% 64,5% 24,4% 9,8% 24,9% 8,5% ,5% ,3%
Sex: Male 60,5% 66,4% 25,0% 8,9% 23,3% 7,6% ,2% ,4%
Female 54,7% 62,9% 23,9% 10,4% 26,3% 9,3% ,8% ,2%
Age:
18-34 years old 52,8% 61,1% 24,0% 8,3% 29,9% 12,7% ,4% ,5%
35-49 years old 60,6% 66,3% 23,5% 10,8% 22,4% 6,4% ,8%
50+ years old 59,2% 66,2% 25,2% 10,4% 22,2% 6,3% ,4% ,3%
Level of
education:
Low 68,5% 58,9% 23,9% 6,8% 19,2% 5,5% ,9%
Medium 57,6% 66,3% 24,5% 10,6% 24,7% 8,3% ,2% ,4%
High 48,7% 65,7% 24,6% 10,6% 29,4% 11,1% ,8% ,4%
Social and
economic
level:
Low 62,5% 59,0% 24,6% 10,8% 22,9% 5,1% ,7%
Average 58,2% 65,6% 21,6% 10,7% 24,8% 7,6% ,5%
High 52,7% 67,5% 26,6% 8,2% 26,4% 11,9% ,9% ,3%
Residence: Urban 45,5% 66,6% 24,3% 11,4% 23,6% 9,7% ,7% ,4%
Rural 66,8% 62,8% 24,5% 8,4% 26,0% 7,6% ,4% ,2%
Spoken
language:
Romanian 61,9% 63,2% 23,8% 9,2% 24,8% 8,9% ,4% ,3%
Russian or other 39,3% 69,3% 26,4% 11,9% 25,5% 7,3% 1,1%

- 43 -
Table 12. In your view, does the Transnistrian conflict present a threat to the security of the Republic of Moldova and peace in
the region?
Definitely
yes
Probably
yes
No, not
likely
Definitely
not
Difficult to answer /
refuse to answer
Total 31,5% 35,5% 17,0% 10,1% 6,0%
Sex: Male 32,1% 32,2% 16,5% 12,8% 6,4%
Female 31,0% 38,2% 17,4% 8,0% 5,6%
Age:
18-34 years old 31,1% 39,3% 14,4% 10,0% 5,2%
35-49 years old 28,4% 33,1% 19,0% 11,1% 8,3%
50+ years old 33,6% 33,4% 18,1% 9,7% 5,2%
Level of
education:
Low 25,4% 37,5% 19,1% 7,9% 10,2%
Medium 30,2% 37,9% 16,1% 10,5% 5,3%
High 38,0% 30,2% 16,8% 11,2% 3,9%
Social and
economic level:
Low 32,0% 31,3% 18,7% 10,7% 7,3%
Average 27,9% 42,5% 14,8% 10,5% 4,4%
High 34,0% 32,8% 17,5% 9,4% 6,2%
Residence: Urban 28,2% 35,2% 18,8% 12,0% 5,8%
Rural 34,2% 35,7% 15,5% 8,5% 6,1%
Spoken
language:
Romanian 36,5% 37,1% 13,2% 6,9% 6,2%
Russian or other 14,1% 29,7% 29,9% 21,2% 5,1%
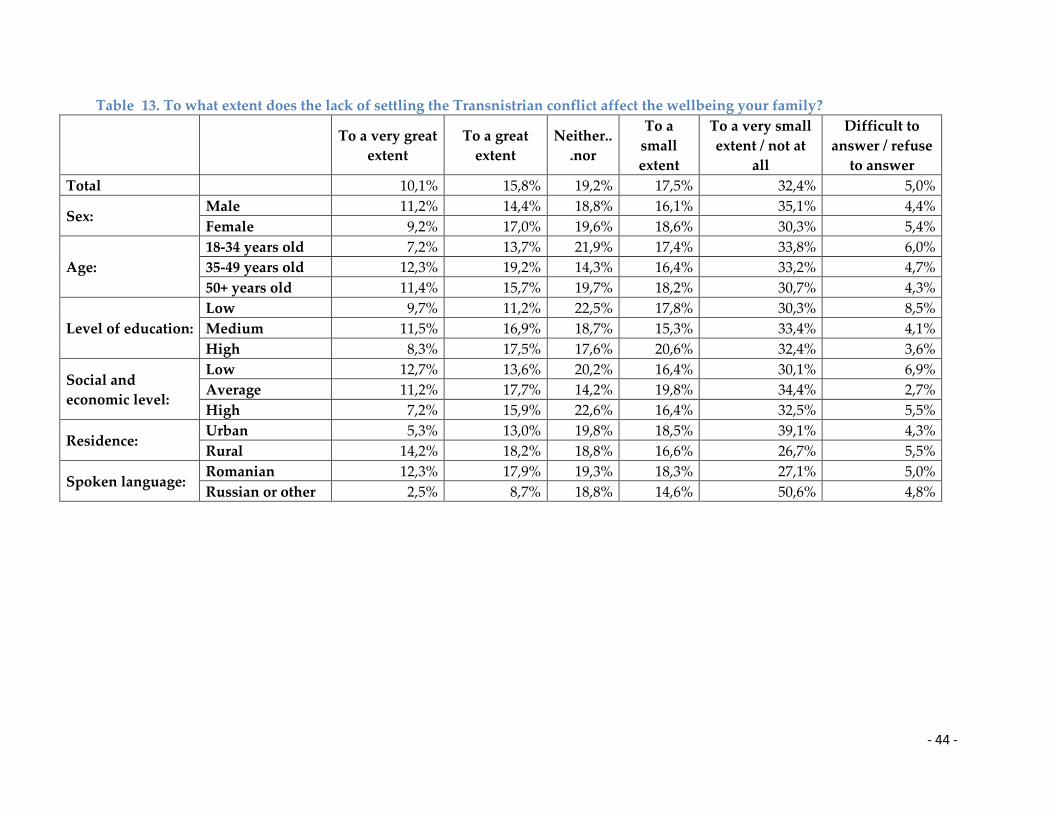
- 44 -
Table 13. To what extent does the lack of settling the Transnistrian conflict affect the wellbeing your family?
To a very great
extent
To a great
extent
Neither..
.nor
To a
small
extent
To a very small
extent / not at
all
Difficult to
answer / refuse
to answer
Total 10,1% 15,8% 19,2% 17,5% 32,4% 5,0%
Sex: Male 11,2% 14,4% 18,8% 16,1% 35,1% 4,4%
Female 9,2% 17,0% 19,6% 18,6% 30,3% 5,4%
Age:
18-34 years old 7,2% 13,7% 21,9% 17,4% 33,8% 6,0%
35-49 years old 12,3% 19,2% 14,3% 16,4% 33,2% 4,7%
50+ years old 11,4% 15,7% 19,7% 18,2% 30,7% 4,3%
Level of education:
Low 9,7% 11,2% 22,5% 17,8% 30,3% 8,5%
Medium 11,5% 16,9% 18,7% 15,3% 33,4% 4,1%
High 8,3% 17,5% 17,6% 20,6% 32,4% 3,6%
Social and
economic level:
Low 12,7% 13,6% 20,2% 16,4% 30,1% 6,9%
Average 11,2% 17,7% 14,2% 19,8% 34,4% 2,7%
High 7,2% 15,9% 22,6% 16,4% 32,5% 5,5%
Residence: Urban 5,3% 13,0% 19,8% 18,5% 39,1% 4,3%
Rural 14,2% 18,2% 18,8% 16,6% 26,7% 5,5%
Spoken language: Romanian 12,3% 17,9% 19,3% 18,3% 27,1% 5,0%
Russian or other 2,5% 8,7% 18,8% 14,6% 50,6% 4,8%

- 45 -
Table 14. Please, tell me, what in your opinion would be the benefits of the Transnistrian conflict resolution?
Removal of
checkpoints
and free
movement
Liquidate
smuggling
of goods
across the
Transnistria
n-Moldovan
border
Increased
revenue to
the state
budget by
paying taxes
Increased revenue
to the state budget
by paying excises
on goods made in
Transnistria
Peace in
the
region
Other DK/N
A
Total 61,8% 38,6% 29,3% 18,2% 2,4% 1,4% 14,8%
Sex: Male 64,5% 40,1% 29,9% 16,1% 2,2% 1,6% 14,5%
Female 59,5% 37,3% 28,9% 20,0% 2,6% 1,3% 15,0%
Age:
18-34 years old 57,7% 41,0% 31,4% 20,6% 2,9% ,8% 14,4%
35-49 years old 63,7% 36,7% 27,0% 16,8% 1,4% 1,1% 16,3%
50+ years old 64,2% 37,5% 28,8% 17,0% 2,6% 2,2% 14,2%
Level of education:
Low 54,6% 29,2% 21,9% 13,8% 1,4% 1,5% 22,0%
Medium 66,7% 41,0% 28,2% 18,2% 2,2% 1,4% 12,4%
High 59,5% 41,8% 36,6% 21,6% 3,5% 1,5% 13,1%
Social and
economic level:
Low 61,4% 30,2% 22,5% 12,9% 3,2% ,9% 18,7%
Average 62,7% 39,7% 27,7% 18,0% 1,3% 2,3% 12,1%
High 61,3% 43,8% 35,7% 22,4% 2,7% 1,1% 14,0%
Residence: Urban 60,2% 41,3% 31,9% 21,2% 2,2% 1,4% 13,6%
Rural 63,1% 36,3% 27,2% 15,7% 2,5% 1,5% 15,7%
Spoken language: Romanian 62,7% 40,1% 31,6% 19,9% 2,2% 1,4% 12,7%
Russian or other 58,7% 33,1% 21,4% 12,4% 2,9% 1,5% 22,0%
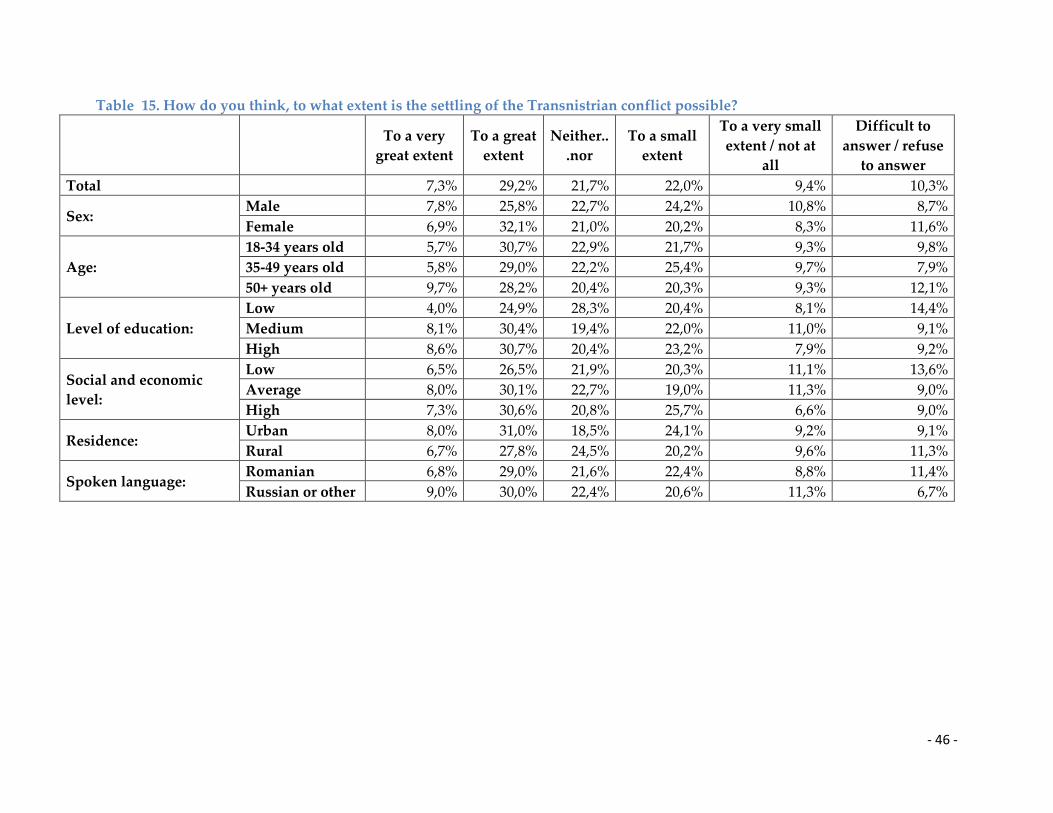
- 46 -
Table 15. How do you think, to what extent is the settling of the Transnistrian conflict possible?
To a very
great extent
To a great
extent
Neither..
.nor
To a small
extent
To a very small
extent / not at
all
Difficult to
answer / refuse
to answer
Total 7,3% 29,2% 21,7% 22,0% 9,4% 10,3%
Sex: Male 7,8% 25,8% 22,7% 24,2% 10,8% 8,7%
Female 6,9% 32,1% 21,0% 20,2% 8,3% 11,6%
Age:
18-34 years old 5,7% 30,7% 22,9% 21,7% 9,3% 9,8%
35-49 years old 5,8% 29,0% 22,2% 25,4% 9,7% 7,9%
50+ years old 9,7% 28,2% 20,4% 20,3% 9,3% 12,1%
Level of education:
Low 4,0% 24,9% 28,3% 20,4% 8,1% 14,4%
Medium 8,1% 30,4% 19,4% 22,0% 11,0% 9,1%
High 8,6% 30,7% 20,4% 23,2% 7,9% 9,2%
Social and economic
level:
Low 6,5% 26,5% 21,9% 20,3% 11,1% 13,6%
Average 8,0% 30,1% 22,7% 19,0% 11,3% 9,0%
High 7,3% 30,6% 20,8% 25,7% 6,6% 9,0%
Residence: Urban 8,0% 31,0% 18,5% 24,1% 9,2% 9,1%
Rural 6,7% 27,8% 24,5% 20,2% 9,6% 11,3%
Spoken language: Romanian 6,8% 29,0% 21,6% 22,4% 8,8% 11,4%
Russian or other 9,0% 30,0% 22,4% 20,6% 11,3% 6,7%

- 47 -
Table 16. Who in your opinion should settle the Transnistrian conflict?
Moldova Transnist
ria
Ukrain
e
Russian
Federati
on
Romani
a USA EU Other
Difficult to
answer / refuse
to answer
Total 79,8% 57,3% 8,0% 30,8% 2,8% 2,5% 6,6% ,2% 4,5%
Sex: Male 79,6% 55,8% 9,6% 33,4% 3,4% 3,5% 7,3% ,2% 4,2%
Female 80,0% 58,5% 6,6% 28,7% 2,3% 1,7% 6,0% ,2% 4,7%
Age:
18-34 years old 76,0% 51,2% 8,9% 30,8% 2,1% 2,2% 5,6% 6,9%
35-49 years old 81,3% 65,0% 9,3% 32,8% 1,8% 2,2% 4,5% 3,2%
50+ years old 82,3% 58,2% 6,4% 29,6% 3,9% 3,0% 8,7% ,5% 3,2%
Level of
education:
Low 78,7% 57,7% 3,9% 26,6% 2,8% 1,6% 3,9% ,3% 6,8%
Medium 79,9% 57,2% 8,6% 30,6% 2,3% 2,0% 4,5% ,3% 4,1%
High 80,4% 57,1% 10,1% 34,2% 3,6% 4,0% 11,8% 3,4%
Social and
economic
level:
Low 80,2% 56,1% 5,1% 29,4% 3,1% 1,6% 4,6% ,5% 5,4%
Average 79,1% 59,3% 9,5% 31,6% 3,7% 1,8% 6,0% ,2% 4,3%
High 80,1% 56,5% 8,8% 31,2% 1,8% 3,9% 8,6% 4,0%
Residence: Urban 78,3% 56,8% 8,6% 34,8% 2,6% 2,9% 6,9% 4,9%
Rural 81,1% 57,7% 7,4% 27,4% 2,9% 2,2% 6,3% ,4% 4,2%
Spoken
language:
Romanian 80,7% 55,8% 8,0% 28,8% 3,3% 2,9% 8,0% ,3% 4,7%
Russian or other 76,7% 62,3% 8,0% 37,5% 1,1% 1,3% 1,8% 4,0%

- 48 -
Table 17. In your opinion, what are the major obstacles to solving the Transnistrian conflict?
Ru
ssia
n F
eder
atio
n
Lea
der
ship
of
the
Rep
ub
lic
of
Mo
ldo
va
Lea
der
ship
of
the
TR
Hig
h l
evel
of
corr
up
tio
n
Po
pu
lati
on
of
TR
Po
pu
lati
on
of
Mo
ldo
va
Lac
k o
f co
nst
ruct
ive
dia
log
ue
bet
wee
n t
he
two
sid
es
Ro
man
ia
Eu
rop
ean
Un
ion
Eco
no
mic
in
tere
sts
Oth
er
No
ob
stac
le
Dif
ficu
lt t
o a
nsw
er /
refu
se t
o a
nsw
er
Total 42,0% 36,4% 32,0% 10,8% 7,3% 1,9% 28,6% 6,2% 7,3% 7,6% 2,4% ,5% 6,4%
Sex: Male 45,4% 38,2% 30,4% 11,7% 7,3% 2,3% 25,0% 5,5% 9,1% 7,1% 3,0% ,6% 6,0%
Female 39,2% 35,0% 33,3% 10,1% 7,3% 1,6% 31,6% 6,8% 5,8% 8,0% 2,0% ,4% 6,8%
Age:
18-34 years old 46,7% 38,1% 36,0% 13,5% 7,7% 2,2% 26,3% 3,1% 5,6% 8,7% 2,1% ,3% 7,2%
35-49 years old 37,4% 37,4% 31,9% 10,5% 6,8% 2,1% 31,2% 8,2% 9,1% 6,8% 3,6% ,7% 5,4%
50+ years old 40,5% 34,4% 28,5% 8,7% 7,2% 1,6% 29,1% 7,7% 7,7% 7,1% 2,1% ,5% 6,4%
Level of
education:
Low 38,3% 33,9% 26,3% 8,1% 8,0% ,3% 22,7% 8,8% 6,1% 2,8% 3,4% 1,4% 11,1%
Medium 41,2% 39,0% 32,8% 9,3% 6,3% 2,9% 29,3% 6,6% 9,2% 8,7% 1,5% ,4% 6,1%
High 46,1% 34,3% 35,0% 15,1% 8,3% 1,6% 31,9% 3,6% 5,2% 9,4% 3,1% 3,6%
Social and
economic
level:
Low 34,6% 34,4% 25,3% 8,5% 6,5% 2,2% 29,3% 10,9% 8,2% 6,9% 2,3% ,6% 9,1%
Average 41,5% 34,7% 34,3% 8,8% 7,7% 1,6% 27,5% 7,2% 7,6% 6,7% 2,1% ,4% 5,9%
High 47,9% 39,4% 35,1% 14,2% 7,6% 2,1% 29,0% 1,8% 6,4% 8,8% 2,9% ,4% 4,9%
Residence: Urban 41,3% 34,8% 33,2% 12,9% 8,6% 2,4% 32,6% 4,3% 7,9% 9,2% 2,2% ,3% 5,9%
Rural 42,6% 37,8% 31,0% 9,0% 6,2% 1,5% 25,2% 7,8% 6,7% 6,2% 2,7% ,6% 6,9%
Spoken
language:
Romanian 48,9% 34,8% 33,1% 11,3% 8,0% 1,4% 26,1% 4,5% 5,1% 7,5% 2,0% ,4% 6,4%
Russian or other 18,5% 41,9% 28,2% 9,1% 4,7% 3,6% 37,2% 11,8% 14,7% 7,9% 4,0% ,8% 6,6%
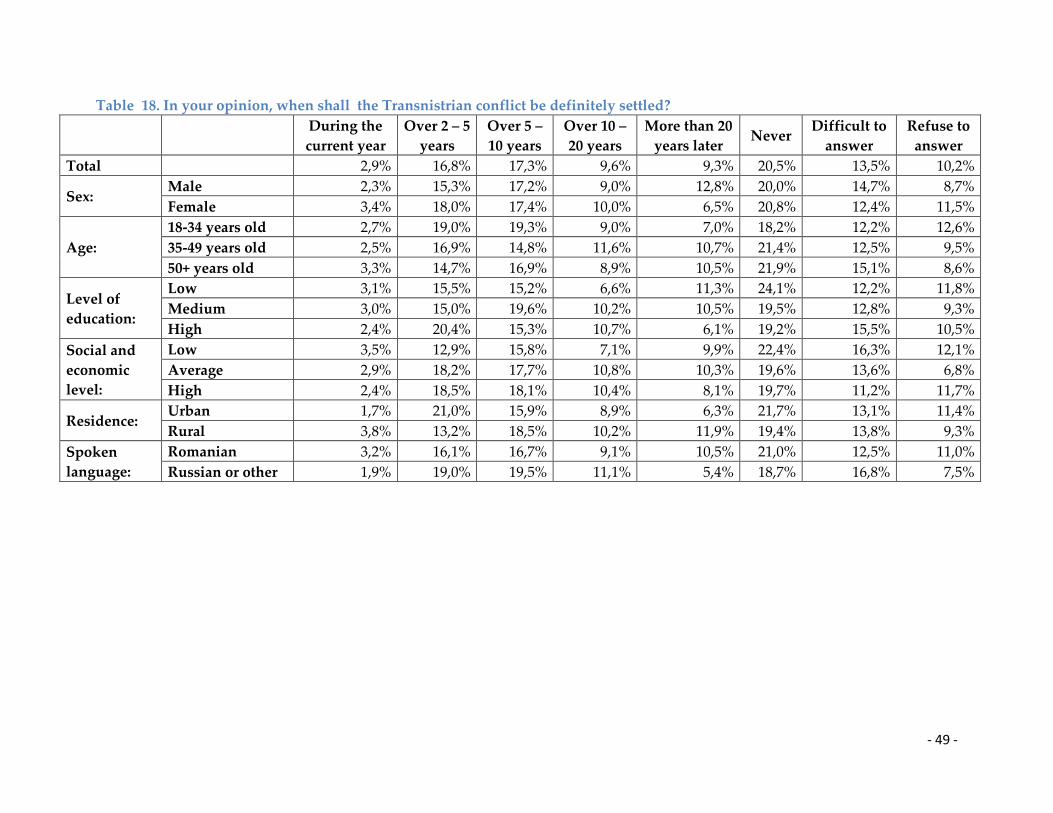
- 49 -
Table 18. In your opinion, when shall the Transnistrian conflict be definitely settled?
During the
current year
Over 2 – 5
years
Over 5 –
10 years
Over 10 –
20 years
More than 20
years later Never
Difficult to
answer
Refuse to
answer
Total 2,9% 16,8% 17,3% 9,6% 9,3% 20,5% 13,5% 10,2%
Sex: Male 2,3% 15,3% 17,2% 9,0% 12,8% 20,0% 14,7% 8,7%
Female 3,4% 18,0% 17,4% 10,0% 6,5% 20,8% 12,4% 11,5%
Age:
18-34 years old 2,7% 19,0% 19,3% 9,0% 7,0% 18,2% 12,2% 12,6%
35-49 years old 2,5% 16,9% 14,8% 11,6% 10,7% 21,4% 12,5% 9,5%
50+ years old 3,3% 14,7% 16,9% 8,9% 10,5% 21,9% 15,1% 8,6%
Level of
education:
Low 3,1% 15,5% 15,2% 6,6% 11,3% 24,1% 12,2% 11,8%
Medium 3,0% 15,0% 19,6% 10,2% 10,5% 19,5% 12,8% 9,3%
High 2,4% 20,4% 15,3% 10,7% 6,1% 19,2% 15,5% 10,5%
Social and
economic
level:
Low 3,5% 12,9% 15,8% 7,1% 9,9% 22,4% 16,3% 12,1%
Average 2,9% 18,2% 17,7% 10,8% 10,3% 19,6% 13,6% 6,8%
High 2,4% 18,5% 18,1% 10,4% 8,1% 19,7% 11,2% 11,7%
Residence: Urban 1,7% 21,0% 15,9% 8,9% 6,3% 21,7% 13,1% 11,4%
Rural 3,8% 13,2% 18,5% 10,2% 11,9% 19,4% 13,8% 9,3%
Spoken
language:
Romanian 3,2% 16,1% 16,7% 9,1% 10,5% 21,0% 12,5% 11,0%
Russian or other 1,9% 19,0% 19,5% 11,1% 5,4% 18,7% 16,8% 7,5%
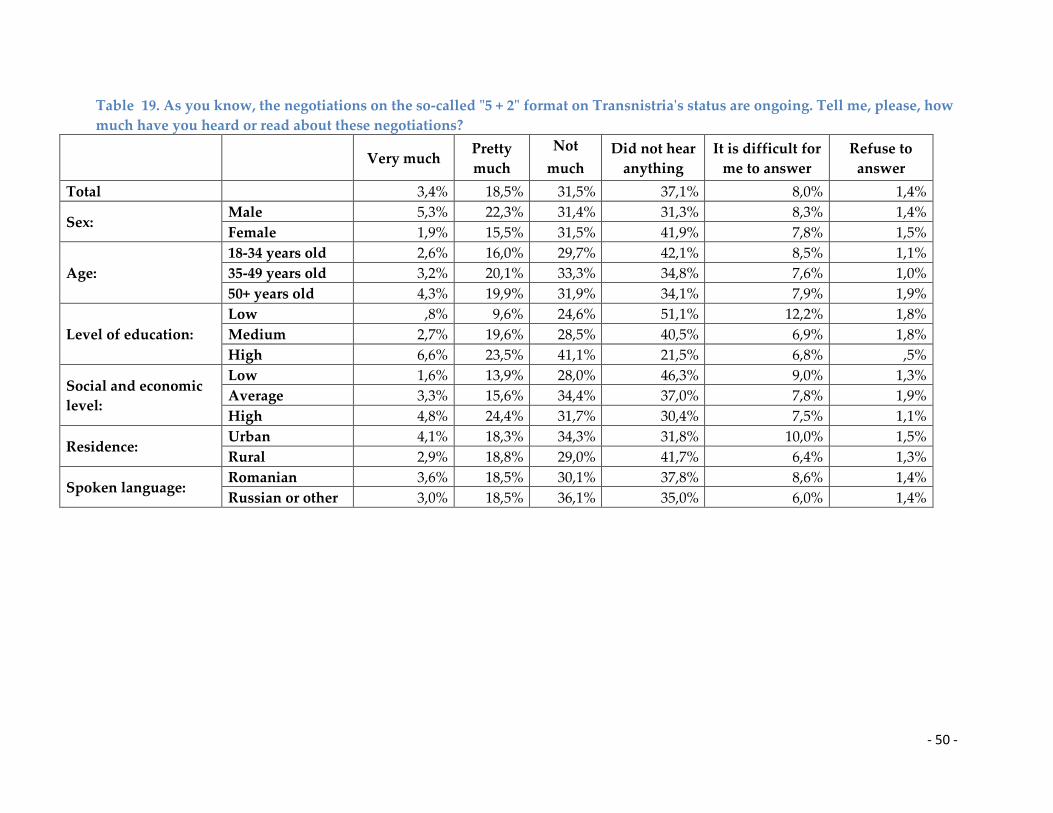
- 50 -
Table 19. As you know, the negotiations on the so-called "5 + 2" format on Transnistria's status are ongoing. Tell me, please, how
much have you heard or read about these negotiations?
Very much
Pretty
much
Not
much
Did not hear
anything
It is difficult for
me to answer
Refuse to
answer
Total 3,4% 18,5% 31,5% 37,1% 8,0% 1,4%
Sex: Male 5,3% 22,3% 31,4% 31,3% 8,3% 1,4%
Female 1,9% 15,5% 31,5% 41,9% 7,8% 1,5%
Age:
18-34 years old 2,6% 16,0% 29,7% 42,1% 8,5% 1,1%
35-49 years old 3,2% 20,1% 33,3% 34,8% 7,6% 1,0%
50+ years old 4,3% 19,9% 31,9% 34,1% 7,9% 1,9%
Level of education:
Low ,8% 9,6% 24,6% 51,1% 12,2% 1,8%
Medium 2,7% 19,6% 28,5% 40,5% 6,9% 1,8%
High 6,6% 23,5% 41,1% 21,5% 6,8% ,5%
Social and economic
level:
Low 1,6% 13,9% 28,0% 46,3% 9,0% 1,3%
Average 3,3% 15,6% 34,4% 37,0% 7,8% 1,9%
High 4,8% 24,4% 31,7% 30,4% 7,5% 1,1%
Residence: Urban 4,1% 18,3% 34,3% 31,8% 10,0% 1,5%
Rural 2,9% 18,8% 29,0% 41,7% 6,4% 1,3%
Spoken language: Romanian 3,6% 18,5% 30,1% 37,8% 8,6% 1,4%
Russian or other 3,0% 18,5% 36,1% 35,0% 6,0% 1,4%
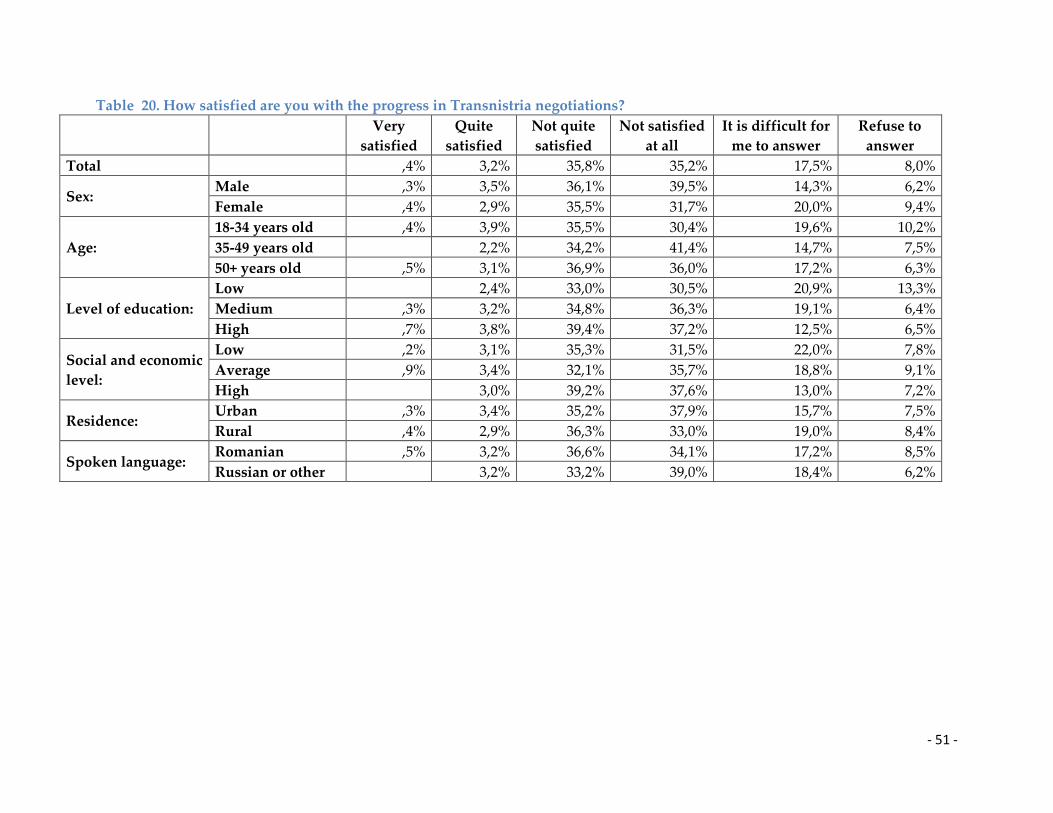
- 51 -
Table 20. How satisfied are you with the progress in Transnistria negotiations?
Very
satisfied
Quite
satisfied
Not quite
satisfied
Not satisfied
at all
It is difficult for
me to answer
Refuse to
answer
Total ,4% 3,2% 35,8% 35,2% 17,5% 8,0%
Sex: Male ,3% 3,5% 36,1% 39,5% 14,3% 6,2%
Female ,4% 2,9% 35,5% 31,7% 20,0% 9,4%
Age:
18-34 years old ,4% 3,9% 35,5% 30,4% 19,6% 10,2%
35-49 years old 2,2% 34,2% 41,4% 14,7% 7,5%
50+ years old ,5% 3,1% 36,9% 36,0% 17,2% 6,3%
Level of education:
Low 2,4% 33,0% 30,5% 20,9% 13,3%
Medium ,3% 3,2% 34,8% 36,3% 19,1% 6,4%
High ,7% 3,8% 39,4% 37,2% 12,5% 6,5%
Social and economic
level:
Low ,2% 3,1% 35,3% 31,5% 22,0% 7,8%
Average ,9% 3,4% 32,1% 35,7% 18,8% 9,1%
High 3,0% 39,2% 37,6% 13,0% 7,2%
Residence: Urban ,3% 3,4% 35,2% 37,9% 15,7% 7,5%
Rural ,4% 2,9% 36,3% 33,0% 19,0% 8,4%
Spoken language: Romanian ,5% 3,2% 36,6% 34,1% 17,2% 8,5%
Russian or other 3,2% 33,2% 39,0% 18,4% 6,2%
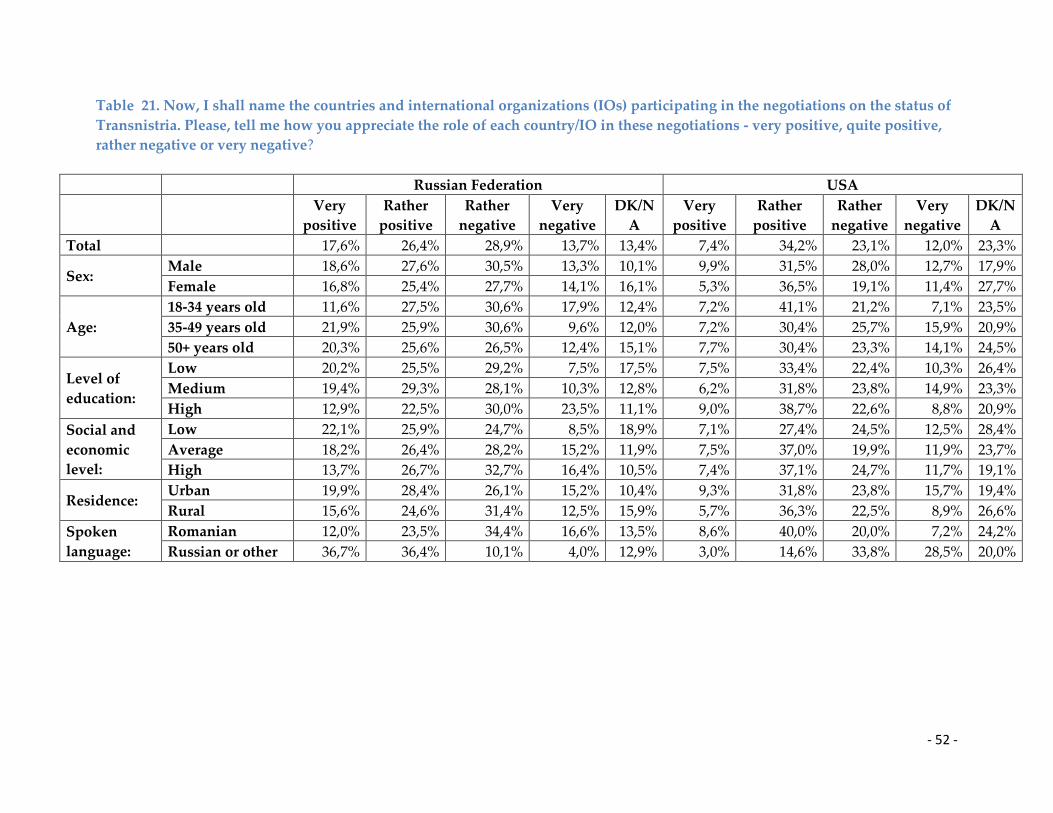
- 52 -
Table 21. Now, I shall name the countries and international organizations (IOs) participating in the negotiations on the status of
Transnistria. Please, tell me how you appreciate the role of each country/IO in these negotiations - very positive, quite positive,
rather negative or very negative?
Russian Federation USA
Very
positive
Rather
positive
Rather
negative
Very
negative
DK/N
A
Very
positive
Rather
positive
Rather
negative
Very
negative
DK/N
A
Total 17,6% 26,4% 28,9% 13,7% 13,4% 7,4% 34,2% 23,1% 12,0% 23,3%
Sex: Male 18,6% 27,6% 30,5% 13,3% 10,1% 9,9% 31,5% 28,0% 12,7% 17,9%
Female 16,8% 25,4% 27,7% 14,1% 16,1% 5,3% 36,5% 19,1% 11,4% 27,7%
Age:
18-34 years old 11,6% 27,5% 30,6% 17,9% 12,4% 7,2% 41,1% 21,2% 7,1% 23,5%
35-49 years old 21,9% 25,9% 30,6% 9,6% 12,0% 7,2% 30,4% 25,7% 15,9% 20,9%
50+ years old 20,3% 25,6% 26,5% 12,4% 15,1% 7,7% 30,4% 23,3% 14,1% 24,5%
Level of
education:
Low 20,2% 25,5% 29,2% 7,5% 17,5% 7,5% 33,4% 22,4% 10,3% 26,4%
Medium 19,4% 29,3% 28,1% 10,3% 12,8% 6,2% 31,8% 23,8% 14,9% 23,3%
High 12,9% 22,5% 30,0% 23,5% 11,1% 9,0% 38,7% 22,6% 8,8% 20,9%
Social and
economic
level:
Low 22,1% 25,9% 24,7% 8,5% 18,9% 7,1% 27,4% 24,5% 12,5% 28,4%
Average 18,2% 26,4% 28,2% 15,2% 11,9% 7,5% 37,0% 19,9% 11,9% 23,7%
High 13,7% 26,7% 32,7% 16,4% 10,5% 7,4% 37,1% 24,7% 11,7% 19,1%
Residence: Urban 19,9% 28,4% 26,1% 15,2% 10,4% 9,3% 31,8% 23,8% 15,7% 19,4%
Rural 15,6% 24,6% 31,4% 12,5% 15,9% 5,7% 36,3% 22,5% 8,9% 26,6%
Spoken
language:
Romanian 12,0% 23,5% 34,4% 16,6% 13,5% 8,6% 40,0% 20,0% 7,2% 24,2%
Russian or other 36,7% 36,4% 10,1% 4,0% 12,9% 3,0% 14,6% 33,8% 28,5% 20,0%
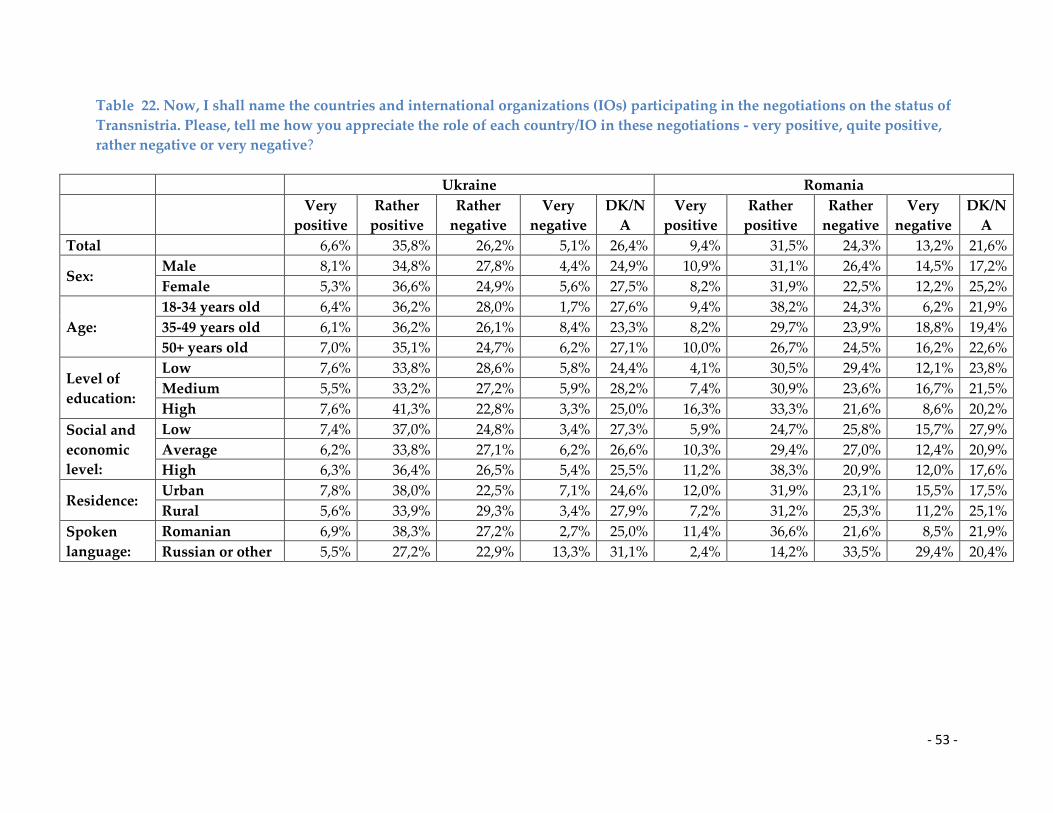
- 53 -
Table 22. Now, I shall name the countries and international organizations (IOs) participating in the negotiations on the status of
Transnistria. Please, tell me how you appreciate the role of each country/IO in these negotiations - very positive, quite positive,
rather negative or very negative?
Ukraine Romania
Very
positive
Rather
positive
Rather
negative
Very
negative
DK/N
A
Very
positive
Rather
positive
Rather
negative
Very
negative
DK/N
A
Total 6,6% 35,8% 26,2% 5,1% 26,4% 9,4% 31,5% 24,3% 13,2% 21,6%
Sex: Male 8,1% 34,8% 27,8% 4,4% 24,9% 10,9% 31,1% 26,4% 14,5% 17,2%
Female 5,3% 36,6% 24,9% 5,6% 27,5% 8,2% 31,9% 22,5% 12,2% 25,2%
Age:
18-34 years old 6,4% 36,2% 28,0% 1,7% 27,6% 9,4% 38,2% 24,3% 6,2% 21,9%
35-49 years old 6,1% 36,2% 26,1% 8,4% 23,3% 8,2% 29,7% 23,9% 18,8% 19,4%
50+ years old 7,0% 35,1% 24,7% 6,2% 27,1% 10,0% 26,7% 24,5% 16,2% 22,6%
Level of
education:
Low 7,6% 33,8% 28,6% 5,8% 24,4% 4,1% 30,5% 29,4% 12,1% 23,8%
Medium 5,5% 33,2% 27,2% 5,9% 28,2% 7,4% 30,9% 23,6% 16,7% 21,5%
High 7,6% 41,3% 22,8% 3,3% 25,0% 16,3% 33,3% 21,6% 8,6% 20,2%
Social and
economic
level:
Low 7,4% 37,0% 24,8% 3,4% 27,3% 5,9% 24,7% 25,8% 15,7% 27,9%
Average 6,2% 33,8% 27,1% 6,2% 26,6% 10,3% 29,4% 27,0% 12,4% 20,9%
High 6,3% 36,4% 26,5% 5,4% 25,5% 11,2% 38,3% 20,9% 12,0% 17,6%
Residence: Urban 7,8% 38,0% 22,5% 7,1% 24,6% 12,0% 31,9% 23,1% 15,5% 17,5%
Rural 5,6% 33,9% 29,3% 3,4% 27,9% 7,2% 31,2% 25,3% 11,2% 25,1%
Spoken
language:
Romanian 6,9% 38,3% 27,2% 2,7% 25,0% 11,4% 36,6% 21,6% 8,5% 21,9%
Russian or other 5,5% 27,2% 22,9% 13,3% 31,1% 2,4% 14,2% 33,5% 29,4% 20,4%

- 54 -
Table 23. Now, I shall name the countries and international organizations (IOs) participating in the negotiations on the status of
Transnistria. Please, tell me how you appreciate the role of each country/IO in these negotiations - very positive, quite positive,
rather negative or very negative?
Organization for Security and Co-operation in
Europe – OSCE European Union
Very
positive
Rather
positive
Rather
negative
Very
negative
DK/N
A
Very
positive
Rather
positive
Rather
negative
Very
negative
DK/N
A
Total 11,5% 34,4% 20,0% 7,2% 26,8% 12,7% 36,5% 20,8% 9,4% 20,6%
Sex: Male 12,4% 36,6% 22,4% 6,7% 21,8% 14,8% 34,0% 23,8% 9,8% 17,6%
Female 10,7% 32,7% 18,0% 7,6% 30,9% 11,0% 38,6% 18,3% 9,0% 23,1%
Age:
18-34 years old 14,1% 37,3% 19,4% 3,9% 25,2% 14,7% 43,8% 17,7% 4,9% 18,9%
35-49 years old 9,4% 36,1% 19,6% 9,4% 25,5% 11,5% 35,3% 19,7% 11,9% 21,6%
50+ years old 10,4% 31,0% 20,7% 8,8% 29,0% 11,7% 30,7% 24,2% 11,8% 21,6%
Level of
education:
Low 7,3% 34,2% 22,6% 3,9% 32,0% 8,2% 36,1% 23,1% 6,5% 26,1%
Medium 10,5% 31,6% 19,5% 10,0% 28,4% 12,0% 32,7% 22,3% 12,1% 20,9%
High 16,2% 39,0% 18,9% 5,3% 20,5% 17,2% 42,6% 16,8% 7,2% 16,1%
Social and
economic
level:
Low 8,0% 30,7% 20,5% 6,3% 34,5% 7,2% 30,5% 24,2% 9,1% 28,9%
Average 11,5% 34,9% 19,3% 6,5% 27,8% 13,8% 36,6% 20,9% 9,4% 19,2%
High 14,1% 36,8% 20,3% 8,4% 20,4% 15,9% 40,9% 18,1% 9,5% 15,6%
Residence: Urban 15,0% 35,3% 18,3% 10,3% 21,1% 17,0% 35,2% 19,1% 13,3% 15,5%
Rural 8,5% 33,8% 21,5% 4,6% 31,7% 9,1% 37,6% 22,3% 6,0% 25,0%
Spoken
language:
Romanian 13,3% 39,9% 17,6% 3,1% 26,1% 15,3% 41,8% 17,6% 4,7% 20,6%
Russian or other 5,4% 15,6% 28,4% 21,4% 29,2% 3,9% 18,3% 31,8% 25,2% 20,7%
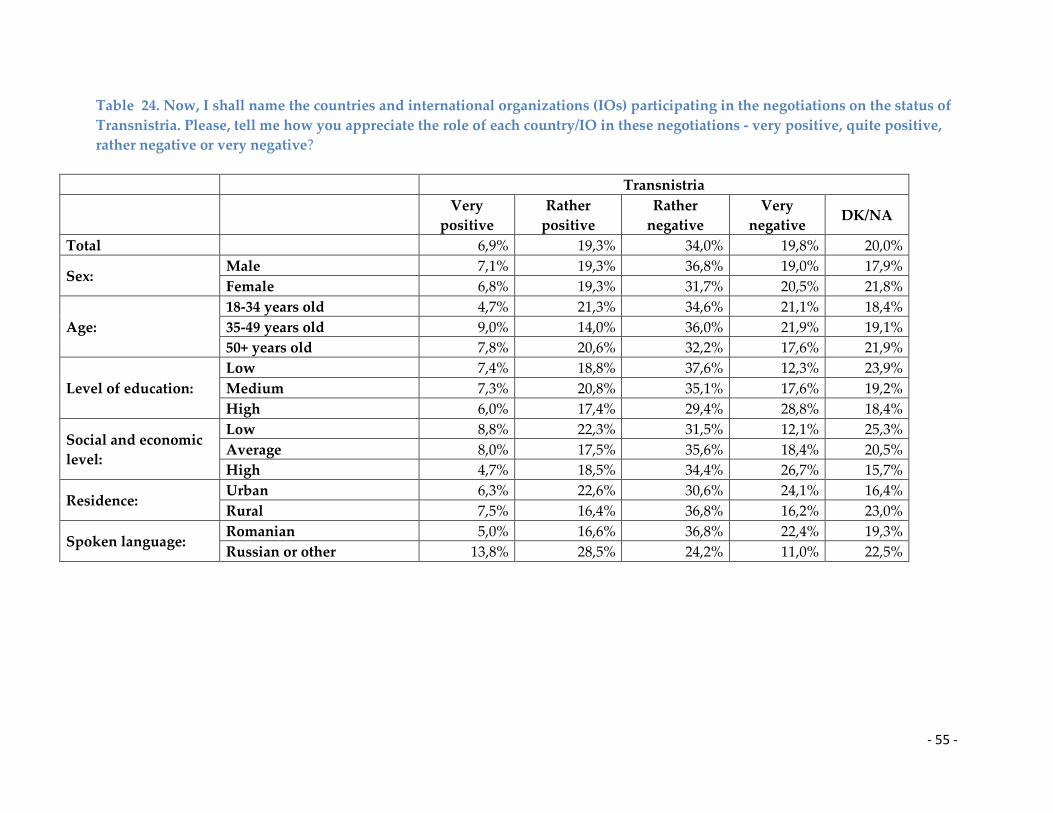
- 55 -
Table 24. Now, I shall name the countries and international organizations (IOs) participating in the negotiations on the status of
Transnistria. Please, tell me how you appreciate the role of each country/IO in these negotiations - very positive, quite positive,
rather negative or very negative?
Transnistria
Very
positive
Rather
positive
Rather
negative
Very
negative DK/NA
Total 6,9% 19,3% 34,0% 19,8% 20,0%
Sex: Male 7,1% 19,3% 36,8% 19,0% 17,9%
Female 6,8% 19,3% 31,7% 20,5% 21,8%
Age:
18-34 years old 4,7% 21,3% 34,6% 21,1% 18,4%
35-49 years old 9,0% 14,0% 36,0% 21,9% 19,1%
50+ years old 7,8% 20,6% 32,2% 17,6% 21,9%
Level of education:
Low 7,4% 18,8% 37,6% 12,3% 23,9%
Medium 7,3% 20,8% 35,1% 17,6% 19,2%
High 6,0% 17,4% 29,4% 28,8% 18,4%
Social and economic
level:
Low 8,8% 22,3% 31,5% 12,1% 25,3%
Average 8,0% 17,5% 35,6% 18,4% 20,5%
High 4,7% 18,5% 34,4% 26,7% 15,7%
Residence: Urban 6,3% 22,6% 30,6% 24,1% 16,4%
Rural 7,5% 16,4% 36,8% 16,2% 23,0%
Spoken language: Romanian 5,0% 16,6% 36,8% 22,4% 19,3%
Russian or other 13,8% 28,5% 24,2% 11,0% 22,5%

- 56 -
Table 25. How likely it is, in your view, that the negotiations on the status of Transnistria will reach an agreement acceptable to
Moldova?
Very likely Quite likely Unlikely
Not at all
likely
Do not know /
refuse to answer
Total 2,7% 27,9% 45,3% 12,1% 12,0%
Sex: Male 2,5% 27,9% 44,7% 13,4% 11,5%
Female 2,9% 27,8% 45,8% 11,0% 12,4%
Age:
18-34 years old 3,4% 25,7% 47,4% 10,2% 13,3%
35-49 years old 2,1% 26,0% 46,0% 13,7% 12,2%
50+ years old 2,4% 30,8% 43,1% 12,8% 10,8%
Level of education:
Low 2,3% 23,8% 40,9% 14,0% 19,0%
Medium 2,9% 29,7% 44,6% 12,0% 10,7%
High 2,7% 27,9% 49,7% 10,7% 8,9%
Social and economic
level:
Low 3,4% 25,7% 39,0% 13,2% 18,7%
Average 2,9% 30,4% 47,7% 10,5% 8,6%
High 2,1% 27,4% 48,0% 12,6% 9,9%
Residence: Urban 2,9% 27,6% 48,2% 10,7% 10,6%
Rural 2,5% 28,1% 42,8% 13,3% 13,3%
Spoken language: Romanian 2,9% 27,2% 44,2% 12,8% 12,9%
Russian or other 2,1% 30,2% 49,1% 9,5% 8,9%
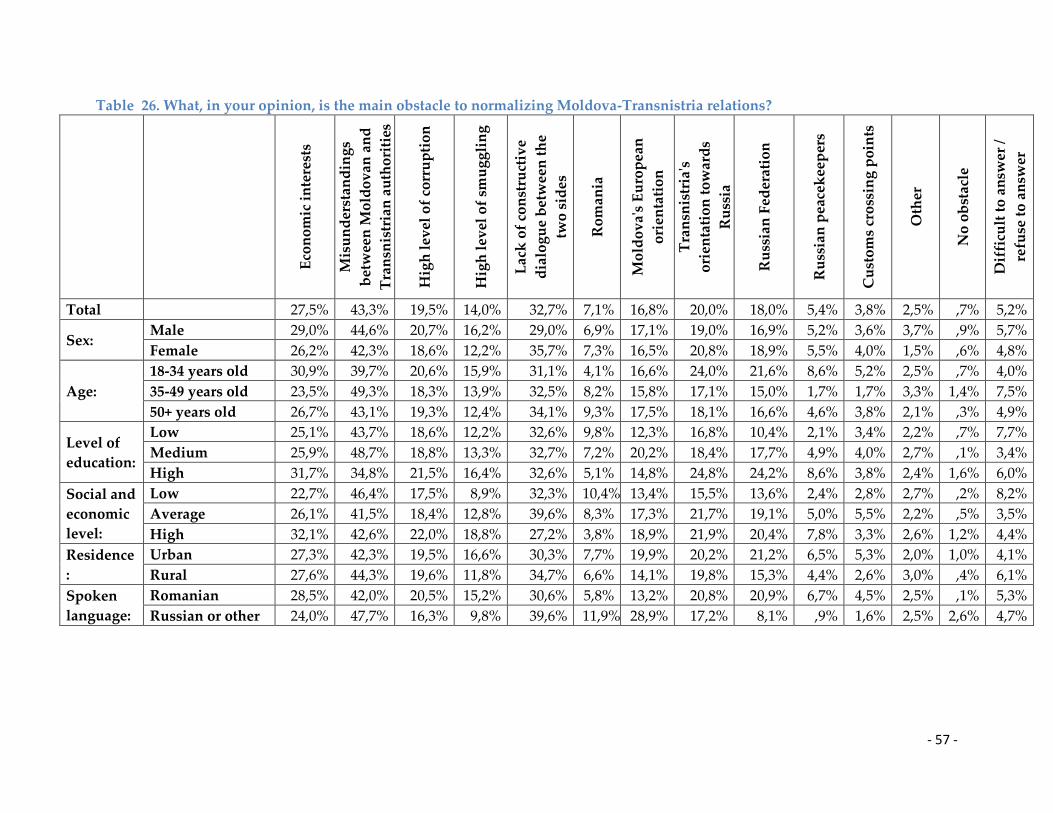
- 57 -
Table 26. What, in your opinion, is the main obstacle to normalizing Moldova-Transnistria relations?
E
con
om
ic i
nte
rest
s
Mis
un
der
stan
din
gs
bet
wee
n M
old
ov
an a
nd
Tra
nsn
istr
ian
au
tho
riti
es
Hig
h l
evel
of
corr
up
tio
n
Hig
h l
evel
of
smu
gg
lin
g
Lac
k o
f co
nst
ruct
ive
dia
log
ue
bet
wee
n t
he
two
sid
es
Ro
man
ia
Mo
ldo
va'
s E
uro
pea
n
ori
enta
tio
n
Tra
nsn
istr
ia's
ori
enta
tio
n t
ow
ard
s
Ru
ssia
Ru
ssia
n F
eder
atio
n
Ru
ssia
n p
eace
kee
per
s
Cu
sto
ms
cro
ssin
g p
oin
ts
Oth
er
No
ob
stac
le
Dif
ficu
lt t
o a
nsw
er /
refu
se t
o a
nsw
er
Total 27,5% 43,3% 19,5% 14,0% 32,7% 7,1% 16,8% 20,0% 18,0% 5,4% 3,8% 2,5% ,7% 5,2%
Sex: Male 29,0% 44,6% 20,7% 16,2% 29,0% 6,9% 17,1% 19,0% 16,9% 5,2% 3,6% 3,7% ,9% 5,7%
Female 26,2% 42,3% 18,6% 12,2% 35,7% 7,3% 16,5% 20,8% 18,9% 5,5% 4,0% 1,5% ,6% 4,8%
Age:
18-34 years old 30,9% 39,7% 20,6% 15,9% 31,1% 4,1% 16,6% 24,0% 21,6% 8,6% 5,2% 2,5% ,7% 4,0%
35-49 years old 23,5% 49,3% 18,3% 13,9% 32,5% 8,2% 15,8% 17,1% 15,0% 1,7% 1,7% 3,3% 1,4% 7,5%
50+ years old 26,7% 43,1% 19,3% 12,4% 34,1% 9,3% 17,5% 18,1% 16,6% 4,6% 3,8% 2,1% ,3% 4,9%
Level of
education:
Low 25,1% 43,7% 18,6% 12,2% 32,6% 9,8% 12,3% 16,8% 10,4% 2,1% 3,4% 2,2% ,7% 7,7%
Medium 25,9% 48,7% 18,8% 13,3% 32,7% 7,2% 20,2% 18,4% 17,7% 4,9% 4,0% 2,7% ,1% 3,4%
High 31,7% 34,8% 21,5% 16,4% 32,6% 5,1% 14,8% 24,8% 24,2% 8,6% 3,8% 2,4% 1,6% 6,0%
Social and
economic
level:
Low 22,7% 46,4% 17,5% 8,9% 32,3% 10,4% 13,4% 15,5% 13,6% 2,4% 2,8% 2,7% ,2% 8,2%
Average 26,1% 41,5% 18,4% 12,8% 39,6% 8,3% 17,3% 21,7% 19,1% 5,0% 5,5% 2,2% ,5% 3,5%
High 32,1% 42,6% 22,0% 18,8% 27,2% 3,8% 18,9% 21,9% 20,4% 7,8% 3,3% 2,6% 1,2% 4,4%
Residence
:
Urban 27,3% 42,3% 19,5% 16,6% 30,3% 7,7% 19,9% 20,2% 21,2% 6,5% 5,3% 2,0% 1,0% 4,1%
Rural 27,6% 44,3% 19,6% 11,8% 34,7% 6,6% 14,1% 19,8% 15,3% 4,4% 2,6% 3,0% ,4% 6,1%
Spoken
language:
Romanian 28,5% 42,0% 20,5% 15,2% 30,6% 5,8% 13,2% 20,8% 20,9% 6,7% 4,5% 2,5% ,1% 5,3%
Russian or other 24,0% 47,7% 16,3% 9,8% 39,6% 11,9% 28,9% 17,2% 8,1% ,9% 1,6% 2,5% 2,6% 4,7%
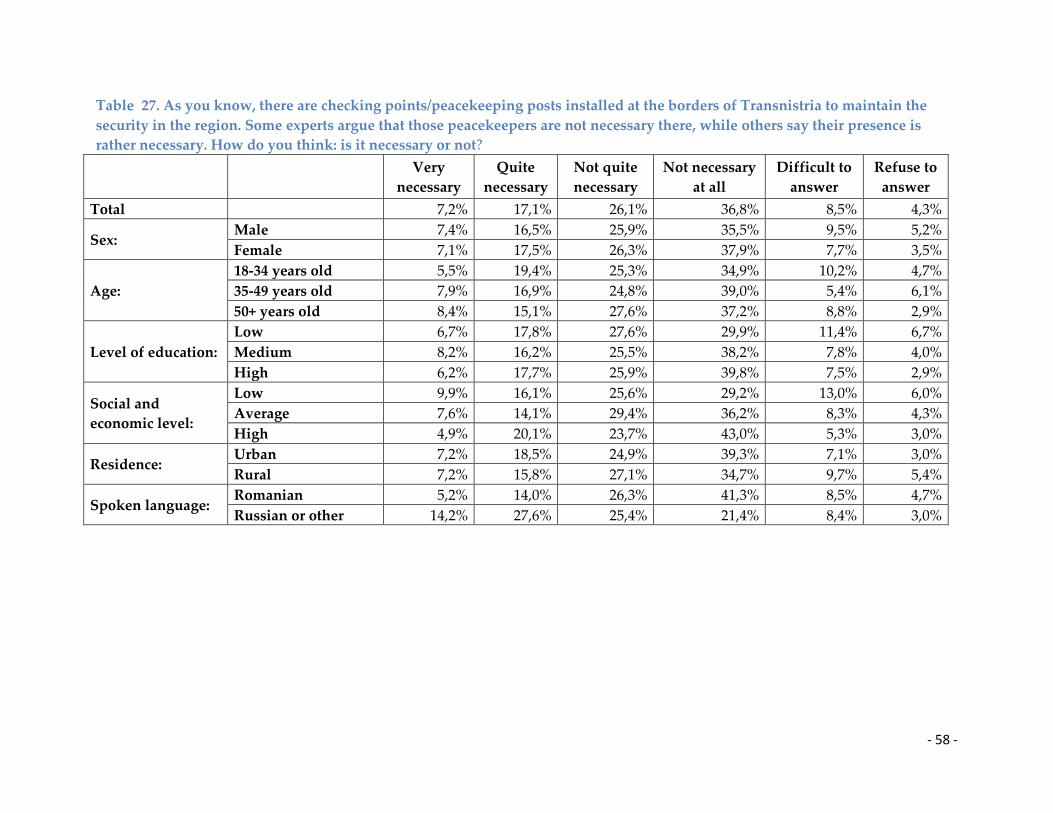
- 58 -
Table 27. As you know, there are checking points/peacekeeping posts installed at the borders of Transnistria to maintain the
security in the region. Some experts argue that those peacekeepers are not necessary there, while others say their presence is
rather necessary. How do you think: is it necessary or not?
Very
necessary
Quite
necessary
Not quite
necessary
Not necessary
at all
Difficult to
answer
Refuse to
answer
Total 7,2% 17,1% 26,1% 36,8% 8,5% 4,3%
Sex: Male 7,4% 16,5% 25,9% 35,5% 9,5% 5,2%
Female 7,1% 17,5% 26,3% 37,9% 7,7% 3,5%
Age:
18-34 years old 5,5% 19,4% 25,3% 34,9% 10,2% 4,7%
35-49 years old 7,9% 16,9% 24,8% 39,0% 5,4% 6,1%
50+ years old 8,4% 15,1% 27,6% 37,2% 8,8% 2,9%
Level of education:
Low 6,7% 17,8% 27,6% 29,9% 11,4% 6,7%
Medium 8,2% 16,2% 25,5% 38,2% 7,8% 4,0%
High 6,2% 17,7% 25,9% 39,8% 7,5% 2,9%
Social and
economic level:
Low 9,9% 16,1% 25,6% 29,2% 13,0% 6,0%
Average 7,6% 14,1% 29,4% 36,2% 8,3% 4,3%
High 4,9% 20,1% 23,7% 43,0% 5,3% 3,0%
Residence: Urban 7,2% 18,5% 24,9% 39,3% 7,1% 3,0%
Rural 7,2% 15,8% 27,1% 34,7% 9,7% 5,4%
Spoken language: Romanian 5,2% 14,0% 26,3% 41,3% 8,5% 4,7%
Russian or other 14,2% 27,6% 25,4% 21,4% 8,4% 3,0%
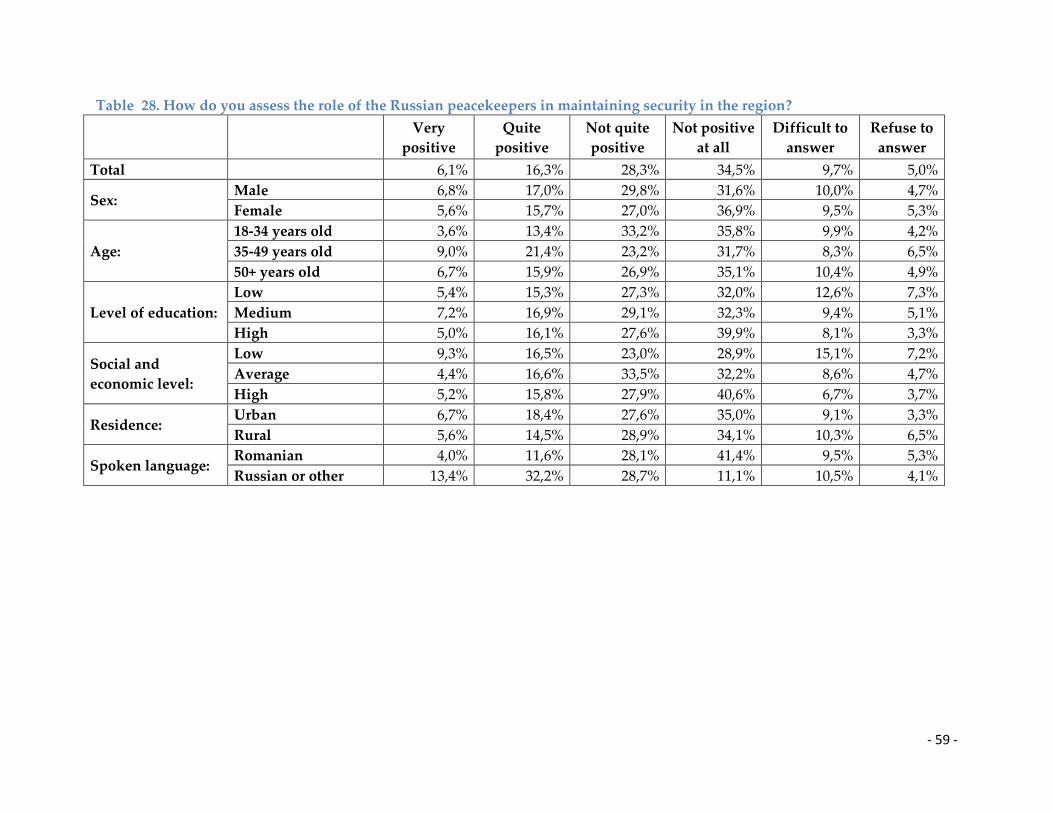
- 59 -
Table 28. How do you assess the role of the Russian peacekeepers in maintaining security in the region?
Very
positive
Quite
positive
Not quite
positive
Not positive
at all
Difficult to
answer
Refuse to
answer
Total 6,1% 16,3% 28,3% 34,5% 9,7% 5,0%
Sex: Male 6,8% 17,0% 29,8% 31,6% 10,0% 4,7%
Female 5,6% 15,7% 27,0% 36,9% 9,5% 5,3%
Age:
18-34 years old 3,6% 13,4% 33,2% 35,8% 9,9% 4,2%
35-49 years old 9,0% 21,4% 23,2% 31,7% 8,3% 6,5%
50+ years old 6,7% 15,9% 26,9% 35,1% 10,4% 4,9%
Level of education:
Low 5,4% 15,3% 27,3% 32,0% 12,6% 7,3%
Medium 7,2% 16,9% 29,1% 32,3% 9,4% 5,1%
High 5,0% 16,1% 27,6% 39,9% 8,1% 3,3%
Social and
economic level:
Low 9,3% 16,5% 23,0% 28,9% 15,1% 7,2%
Average 4,4% 16,6% 33,5% 32,2% 8,6% 4,7%
High 5,2% 15,8% 27,9% 40,6% 6,7% 3,7%
Residence: Urban 6,7% 18,4% 27,6% 35,0% 9,1% 3,3%
Rural 5,6% 14,5% 28,9% 34,1% 10,3% 6,5%
Spoken language: Romanian 4,0% 11,6% 28,1% 41,4% 9,5% 5,3%
Russian or other 13,4% 32,2% 28,7% 11,1% 10,5% 4,1%
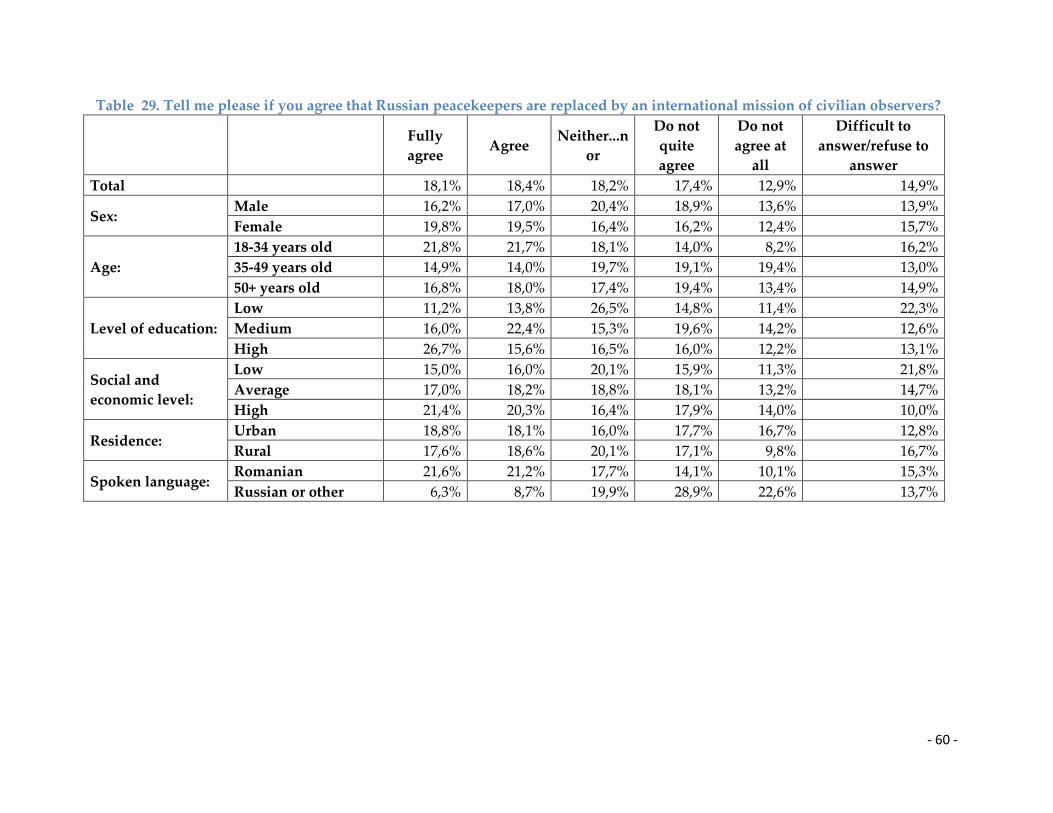
- 60 -
Table 29. Tell me please if you agree that Russian peacekeepers are replaced by an international mission of civilian observers?
Fully
agree Agree
Neither...n
or
Do not
quite
agree
Do not
agree at
all
Difficult to
answer/refuse to
answer
Total 18,1% 18,4% 18,2% 17,4% 12,9% 14,9%
Sex: Male 16,2% 17,0% 20,4% 18,9% 13,6% 13,9%
Female 19,8% 19,5% 16,4% 16,2% 12,4% 15,7%
Age:
18-34 years old 21,8% 21,7% 18,1% 14,0% 8,2% 16,2%
35-49 years old 14,9% 14,0% 19,7% 19,1% 19,4% 13,0%
50+ years old 16,8% 18,0% 17,4% 19,4% 13,4% 14,9%
Level of education:
Low 11,2% 13,8% 26,5% 14,8% 11,4% 22,3%
Medium 16,0% 22,4% 15,3% 19,6% 14,2% 12,6%
High 26,7% 15,6% 16,5% 16,0% 12,2% 13,1%
Social and
economic level:
Low 15,0% 16,0% 20,1% 15,9% 11,3% 21,8%
Average 17,0% 18,2% 18,8% 18,1% 13,2% 14,7%
High 21,4% 20,3% 16,4% 17,9% 14,0% 10,0%
Residence: Urban 18,8% 18,1% 16,0% 17,7% 16,7% 12,8%
Rural 17,6% 18,6% 20,1% 17,1% 9,8% 16,7%
Spoken language: Romanian 21,6% 21,2% 17,7% 14,1% 10,1% 15,3%
Russian or other 6,3% 8,7% 19,9% 28,9% 22,6% 13,7%
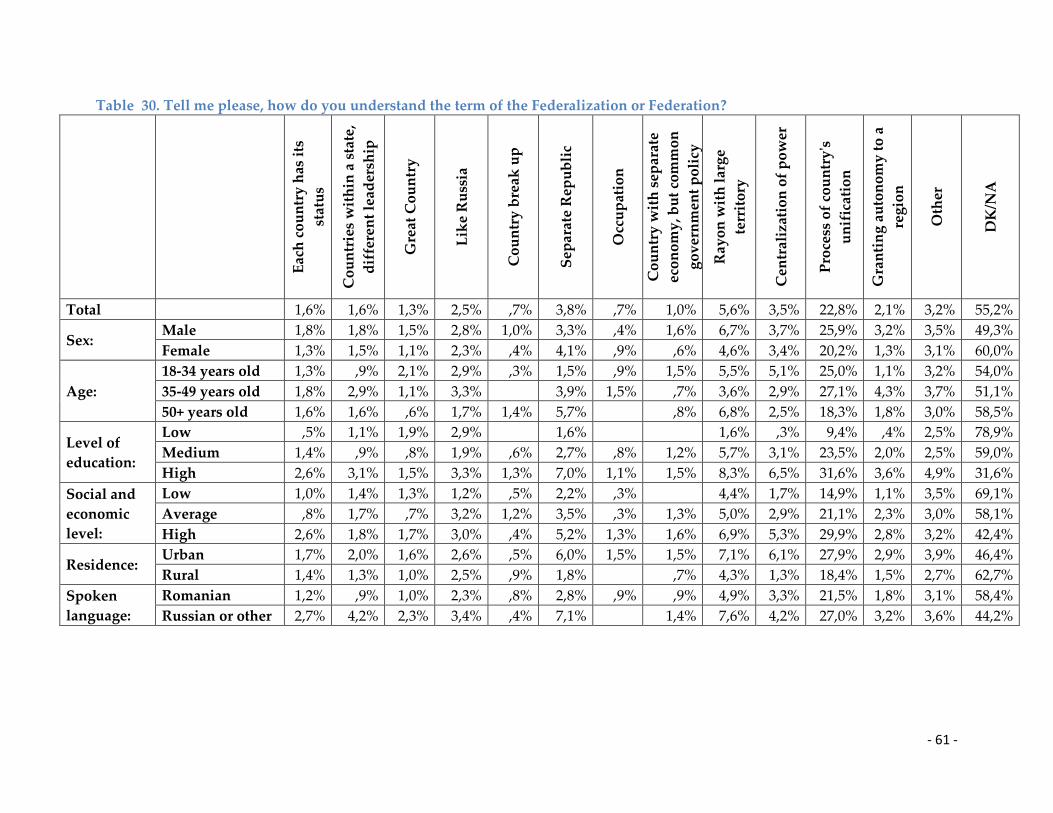
- 61 -
Table 30. Tell me please, how do you understand the term of the Federalization or Federation?
E
ach
co
un
try
has
its
stat
us
Co
un
trie
s w
ith
in a
sta
te,
dif
fere
nt
lead
ersh
ip
Gre
at C
ou
ntr
y
Lik
e R
uss
ia
Co
un
try
bre
ak u
p
Sep
arat
e R
epu
bli
c
Occ
up
atio
n
Co
un
try
wit
h s
epar
ate
eco
no
my
, bu
t co
mm
on
go
ver
nm
ent
po
licy
Ray
on
wit
h l
arg
e
terr
ito
ry
Cen
tral
izat
ion
of
po
wer
Pro
cess
of
cou
ntr
y's
un
ific
atio
n
Gra
nti
ng
au
ton
om
y t
o a
reg
ion
Oth
er
DK
/NA
Total 1,6% 1,6% 1,3% 2,5% ,7% 3,8% ,7% 1,0% 5,6% 3,5% 22,8% 2,1% 3,2% 55,2%
Sex: Male 1,8% 1,8% 1,5% 2,8% 1,0% 3,3% ,4% 1,6% 6,7% 3,7% 25,9% 3,2% 3,5% 49,3%
Female 1,3% 1,5% 1,1% 2,3% ,4% 4,1% ,9% ,6% 4,6% 3,4% 20,2% 1,3% 3,1% 60,0%
Age:
18-34 years old 1,3% ,9% 2,1% 2,9% ,3% 1,5% ,9% 1,5% 5,5% 5,1% 25,0% 1,1% 3,2% 54,0%
35-49 years old 1,8% 2,9% 1,1% 3,3% 3,9% 1,5% ,7% 3,6% 2,9% 27,1% 4,3% 3,7% 51,1%
50+ years old 1,6% 1,6% ,6% 1,7% 1,4% 5,7% ,8% 6,8% 2,5% 18,3% 1,8% 3,0% 58,5%
Level of
education:
Low ,5% 1,1% 1,9% 2,9% 1,6% 1,6% ,3% 9,4% ,4% 2,5% 78,9%
Medium 1,4% ,9% ,8% 1,9% ,6% 2,7% ,8% 1,2% 5,7% 3,1% 23,5% 2,0% 2,5% 59,0%
High 2,6% 3,1% 1,5% 3,3% 1,3% 7,0% 1,1% 1,5% 8,3% 6,5% 31,6% 3,6% 4,9% 31,6%
Social and
economic
level:
Low 1,0% 1,4% 1,3% 1,2% ,5% 2,2% ,3% 4,4% 1,7% 14,9% 1,1% 3,5% 69,1%
Average ,8% 1,7% ,7% 3,2% 1,2% 3,5% ,3% 1,3% 5,0% 2,9% 21,1% 2,3% 3,0% 58,1%
High 2,6% 1,8% 1,7% 3,0% ,4% 5,2% 1,3% 1,6% 6,9% 5,3% 29,9% 2,8% 3,2% 42,4%
Residence: Urban 1,7% 2,0% 1,6% 2,6% ,5% 6,0% 1,5% 1,5% 7,1% 6,1% 27,9% 2,9% 3,9% 46,4%
Rural 1,4% 1,3% 1,0% 2,5% ,9% 1,8% ,7% 4,3% 1,3% 18,4% 1,5% 2,7% 62,7%
Spoken
language:
Romanian 1,2% ,9% 1,0% 2,3% ,8% 2,8% ,9% ,9% 4,9% 3,3% 21,5% 1,8% 3,1% 58,4%
Russian or other 2,7% 4,2% 2,3% 3,4% ,4% 7,1% 1,4% 7,6% 4,2% 27,0% 3,2% 3,6% 44,2%

- 62 -
Table 31. Tell me please if you agree that the Republic of Moldova to become a federation of three components: Transnistria,
Gagauzia and the rest of Moldova territory with equal rights?
Fully
agree Agree
Neither...n
or
Do not
quite
agree
Do not
agree at
all
Difficult to
answer/refuse to
answer
Total 9,1% 18,9% 11,1% 18,0% 32,4% 10,4%
Sex: Male 8,8% 18,5% 13,0% 16,7% 35,4% 7,6%
Female 9,3% 19,3% 9,6% 19,0% 30,0% 12,8%
Age:
18-34 years old 6,3% 18,0% 13,5% 19,0% 33,7% 9,5%
35-49 years old 11,8% 18,7% 11,9% 17,7% 31,7% 8,2%
50+ years old 9,9% 19,8% 8,6% 17,3% 31,8% 12,6%
Level of education:
Low 6,9% 17,4% 14,0% 20,0% 23,2% 18,6%
Medium 9,5% 20,8% 9,5% 19,2% 31,1% 9,9%
High 10,0% 17,2% 11,6% 14,6% 41,3% 5,3%
Social and economic
level:
Low 9,3% 16,7% 9,2% 19,1% 28,0% 17,6%
Average 8,7% 22,1% 10,7% 19,2% 28,9% 10,4%
High 9,1% 17,9% 12,9% 16,2% 38,7% 5,2%
Residence: Urban 9,8% 19,8% 9,9% 18,3% 35,8% 6,4%
Rural 8,4% 18,2% 12,2% 17,7% 29,6% 13,9%
Spoken language: Romanian 5,6% 17,0% 10,5% 17,9% 38,5% 10,5%
Russian or other 20,8% 25,5% 13,4% 18,2% 11,8% 10,3%

- 63 -
Table 32. At present, various ways to settle the Transnistrian conflict are proposed. Which of the following options do you
consider the best for solving the Transnistrian conflict?
Tra
nsn
istr
ia, a
s w
ell
as t
he
oth
er
reg
ion
s o
f th
e co
un
try
sh
ou
ld b
e
par
t o
f M
old
ov
a
Tra
nsn
istr
ia s
ho
uld
be
par
t o
f
Mo
ldo
va,
bu
t it
sh
ou
ld h
ave
gre
ater
eco
no
mic
, cu
ltu
ral
and
go
ver
nin
g a
uto
no
my
Tra
nsn
istr
ia s
ho
uld
no
t b
e a
sep
arat
e co
un
try
, bu
t to
be
un
der
inte
rnat
ion
al p
rote
cto
rate
Tra
nsn
istr
ia s
ho
uld
be
a se
par
ate
cou
ntr
y, u
nd
er t
he
con
tro
l o
f th
e
inte
rnat
ion
al c
om
mu
nit
y
Tra
nsn
istr
ia s
ho
uld
be
an
abso
lute
ly i
nd
epen
den
t co
un
try
wit
ho
ut
inte
rnat
ion
al i
nte
rven
tio
n
in a
ny
fo
rm
Tra
nsn
istr
ia s
ho
uld
bec
om
e p
art
of
the
Ru
ssia
n F
eder
atio
n
Tra
nsn
istr
ia s
ho
uld
bec
om
e p
art
of
Uk
rain
e
No
ne
of
the
op
tio
ns
Dif
ficu
lt t
o a
nsw
er/r
efu
se t
o
answ
er
Total 66,0% 15,2% 2,4% 1,1% 2,9% 3,8% ,4% 2,5% 5,8%
Sex: Male 71,0% 13,0% 2,0% 1,7% 2,0% 3,4% ,5% 2,7% 3,9%
Female 61,9% 16,9% 2,7% ,7% 3,7% 4,1% ,3% 2,4% 7,4%
Age:
18-34 years old 64,9% 14,8% 2,8% 1,5% 3,8% 3,5% ,4% 2,8% 5,5%
35-49 years old 64,9% 15,4% 3,6% 1,4% 2,1% 5,5% ,3% 1,8% 5,0%
50+ years old 67,5% 15,4% 1,2% ,6% 2,5% 3,1% ,4% 2,6% 6,6%
Level of
education:
Low 66,9% 10,3% 1,6% ,3% 2,9% 4,1% ,4% 5,3% 8,3%
Medium 66,0% 14,5% 2,4% 2,0% 3,8% 3,6% ,2% 1,5% 5,9%
High 65,2% 19,7% 2,8% ,5% 1,5% 3,9% ,7% 1,9% 3,8%
Social and
economic
level:
Low 61,4% 15,8% 2,9% ,9% 3,0% 4,3% ,3% 3,7% 7,8%
Average 67,9% 13,0% 1,2% 1,0% 4,4% 4,0% 3,1% 5,5%
High 67,8% 16,4% 2,9% 1,4% 1,6% 3,3% ,8% 1,2% 4,6%
Residence: Urban 65,1% 16,5% 3,5% 1,9% 1,6% 4,7% ,7% 2,2% 3,8%
Rural 66,7% 14,0% 1,4% ,5% 4,0% 3,0% ,2% 2,8% 7,5%
Spoken
language:
Romanian 70,5% 12,2% 2,4% 1,3% 2,7% 2,3% ,4% 2,2% 6,0%
Russian or other 50,5% 25,2% 2,3% ,6% 3,5% 9,0% ,4% 3,5% 5,0%

- 64 -
Table 33. In your opinion, has Moldova a plan for settling the Transnistrian conflict?
Yes No Do not know
Total 21,0% 44,5% 34,4%
Sex: Male 20,6% 49,4% 30,0%
Female 21,4% 40,6% 38,0%
Age:
18-34 years old 21,4% 42,1% 36,5%
35-49 years old 18,1% 47,7% 34,2%
50+ years old 22,4% 44,9% 32,7%
Level of education:
Low 20,8% 38,3% 40,9%
Medium 17,5% 48,6% 33,8%
High 26,6% 42,9% 30,5%
Social and economic level:
Low 19,9% 40,8% 39,4%
Average 18,5% 47,1% 34,3%
High 23,9% 45,2% 30,8%
Residence: Urban 22,5% 44,5% 32,9%
Rural 19,8% 44,6% 35,7%
Spoken language: Romanian 22,4% 42,1% 35,5%
Russian or other 16,3% 53,0% 30,7%
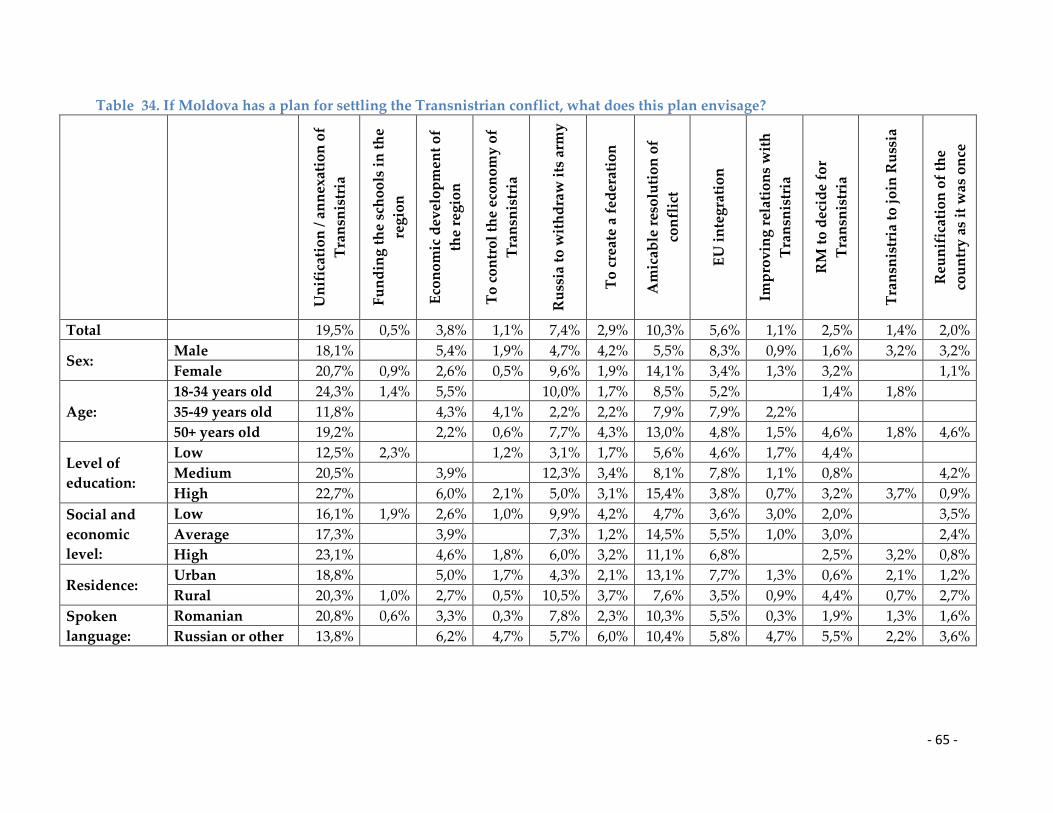
- 65 -
Table 34. If Moldova has a plan for settling the Transnistrian conflict, what does this plan envisage?
U
nif
icat
ion
/ a
nn
exat
ion
of
Tra
nsn
istr
ia
Fu
nd
ing
th
e sc
ho
ols
in
th
e
reg
ion
Eco
no
mic
dev
elo
pm
ent
of
the
reg
ion
To
co
ntr
ol
the
eco
no
my
of
Tra
nsn
istr
ia
Ru
ssia
to
wit
hd
raw
its
arm
y
To
cre
ate
a fe
der
atio
n
Am
icab
le r
eso
luti
on
of
con
flic
t
EU
in
teg
rati
on
Imp
rov
ing
rel
atio
ns
wit
h
Tra
nsn
istr
ia
RM
to
dec
ide
for
Tra
nsn
istr
ia
Tra
nsn
istr
ia t
o j
oin
Ru
ssia
Reu
nif
icat
ion
of
the
cou
ntr
y a
s it
was
on
ce
Total 19,5% 0,5% 3,8% 1,1% 7,4% 2,9% 10,3% 5,6% 1,1% 2,5% 1,4% 2,0%
Sex: Male 18,1% 5,4% 1,9% 4,7% 4,2% 5,5% 8,3% 0,9% 1,6% 3,2% 3,2%
Female 20,7% 0,9% 2,6% 0,5% 9,6% 1,9% 14,1% 3,4% 1,3% 3,2% 1,1%
Age:
18-34 years old 24,3% 1,4% 5,5% 10,0% 1,7% 8,5% 5,2% 1,4% 1,8%
35-49 years old 11,8% 4,3% 4,1% 2,2% 2,2% 7,9% 7,9% 2,2%
50+ years old 19,2% 2,2% 0,6% 7,7% 4,3% 13,0% 4,8% 1,5% 4,6% 1,8% 4,6%
Level of
education:
Low 12,5% 2,3% 1,2% 3,1% 1,7% 5,6% 4,6% 1,7% 4,4%
Medium 20,5% 3,9% 12,3% 3,4% 8,1% 7,8% 1,1% 0,8% 4,2%
High 22,7% 6,0% 2,1% 5,0% 3,1% 15,4% 3,8% 0,7% 3,2% 3,7% 0,9%
Social and
economic
level:
Low 16,1% 1,9% 2,6% 1,0% 9,9% 4,2% 4,7% 3,6% 3,0% 2,0% 3,5%
Average 17,3% 3,9% 7,3% 1,2% 14,5% 5,5% 1,0% 3,0% 2,4%
High 23,1% 4,6% 1,8% 6,0% 3,2% 11,1% 6,8% 2,5% 3,2% 0,8%
Residence: Urban 18,8% 5,0% 1,7% 4,3% 2,1% 13,1% 7,7% 1,3% 0,6% 2,1% 1,2%
Rural 20,3% 1,0% 2,7% 0,5% 10,5% 3,7% 7,6% 3,5% 0,9% 4,4% 0,7% 2,7%
Spoken
language:
Romanian 20,8% 0,6% 3,3% 0,3% 7,8% 2,3% 10,3% 5,5% 0,3% 1,9% 1,3% 1,6%
Russian or other 13,8% 6,2% 4,7% 5,7% 6,0% 10,4% 5,8% 4,7% 5,5% 2,2% 3,6%
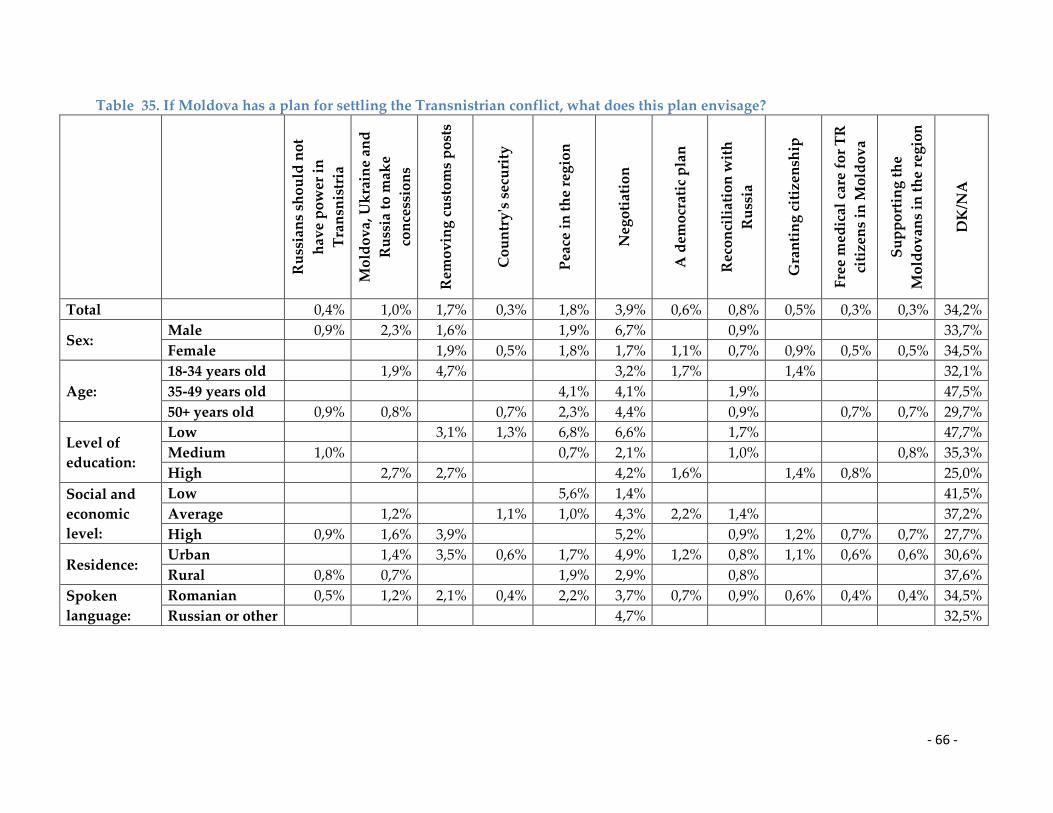
- 66 -
Table 35. If Moldova has a plan for settling the Transnistrian conflict, what does this plan envisage?
R
uss
ian
s sh
ou
ld n
ot
hav
e p
ow
er i
n
Tra
nsn
istr
ia
Mo
ldo
va,
Uk
rain
e an
d
Ru
ssia
to
mak
e
con
cess
ion
s
Rem
ov
ing
cu
sto
ms
po
sts
Co
un
try
's s
ecu
rity
Pea
ce i
n t
he
reg
ion
Neg
oti
atio
n
A d
emo
crat
ic p
lan
Rec
on
cili
atio
n w
ith
Ru
ssia
Gra
nti
ng
cit
izen
ship
Fre
e m
edic
al c
are
for
TR
citi
zen
s in
Mo
ldo
va
Su
pp
ort
ing
th
e
Mo
ldo
van
s in
th
e re
gio
n
DK
/NA
Total 0,4% 1,0% 1,7% 0,3% 1,8% 3,9% 0,6% 0,8% 0,5% 0,3% 0,3% 34,2%
Sex: Male 0,9% 2,3% 1,6% 1,9% 6,7% 0,9% 33,7%
Female 1,9% 0,5% 1,8% 1,7% 1,1% 0,7% 0,9% 0,5% 0,5% 34,5%
Age:
18-34 years old 1,9% 4,7% 3,2% 1,7% 1,4% 32,1%
35-49 years old 4,1% 4,1% 1,9% 47,5%
50+ years old 0,9% 0,8% 0,7% 2,3% 4,4% 0,9% 0,7% 0,7% 29,7%
Level of
education:
Low 3,1% 1,3% 6,8% 6,6% 1,7% 47,7%
Medium 1,0% 0,7% 2,1% 1,0% 0,8% 35,3%
High 2,7% 2,7% 4,2% 1,6% 1,4% 0,8% 25,0%
Social and
economic
level:
Low 5,6% 1,4% 41,5%
Average 1,2% 1,1% 1,0% 4,3% 2,2% 1,4% 37,2%
High 0,9% 1,6% 3,9% 5,2% 0,9% 1,2% 0,7% 0,7% 27,7%
Residence: Urban 1,4% 3,5% 0,6% 1,7% 4,9% 1,2% 0,8% 1,1% 0,6% 0,6% 30,6%
Rural 0,8% 0,7% 1,9% 2,9% 0,8% 37,6%
Spoken
language:
Romanian 0,5% 1,2% 2,1% 0,4% 2,2% 3,7% 0,7% 0,9% 0,6% 0,4% 0,4% 34,5%
Russian or other 4,7% 32,5%
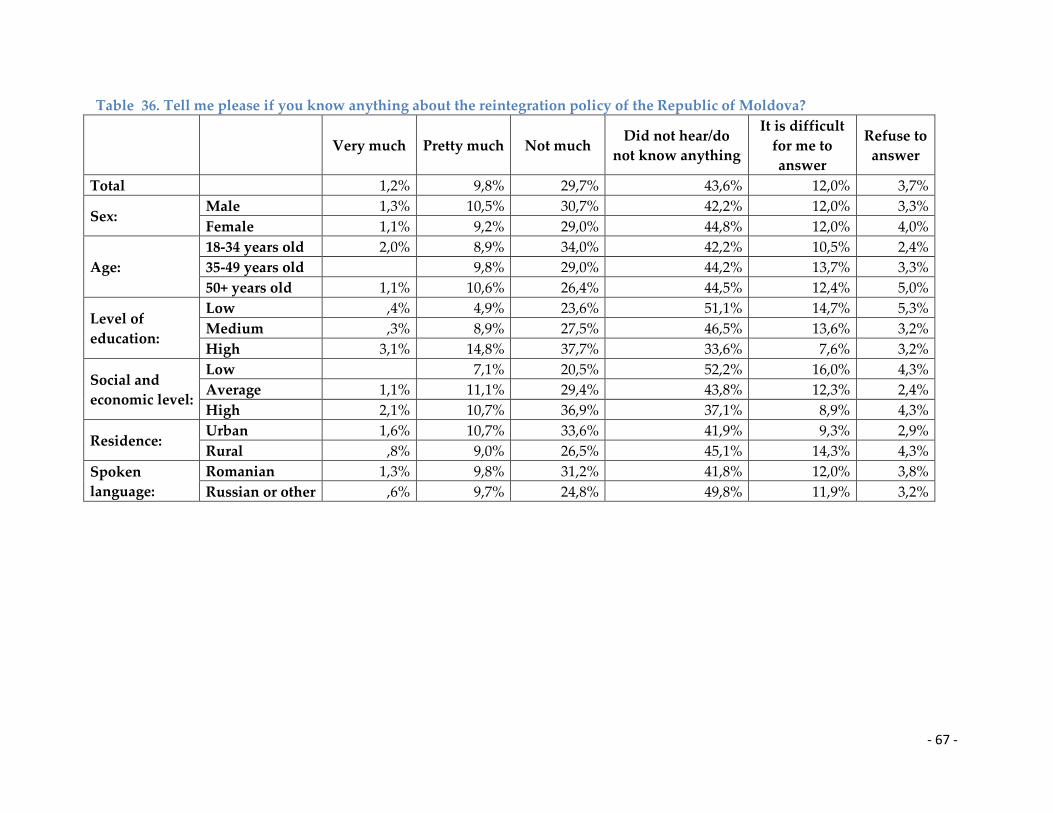
- 67 -
Table 36. Tell me please if you know anything about the reintegration policy of the Republic of Moldova?
Very much Pretty much Not much Did not hear/do
not know anything
It is difficult
for me to
answer
Refuse to
answer
Total 1,2% 9,8% 29,7% 43,6% 12,0% 3,7%
Sex: Male 1,3% 10,5% 30,7% 42,2% 12,0% 3,3%
Female 1,1% 9,2% 29,0% 44,8% 12,0% 4,0%
Age:
18-34 years old 2,0% 8,9% 34,0% 42,2% 10,5% 2,4%
35-49 years old 9,8% 29,0% 44,2% 13,7% 3,3%
50+ years old 1,1% 10,6% 26,4% 44,5% 12,4% 5,0%
Level of
education:
Low ,4% 4,9% 23,6% 51,1% 14,7% 5,3%
Medium ,3% 8,9% 27,5% 46,5% 13,6% 3,2%
High 3,1% 14,8% 37,7% 33,6% 7,6% 3,2%
Social and
economic level:
Low 7,1% 20,5% 52,2% 16,0% 4,3%
Average 1,1% 11,1% 29,4% 43,8% 12,3% 2,4%
High 2,1% 10,7% 36,9% 37,1% 8,9% 4,3%
Residence: Urban 1,6% 10,7% 33,6% 41,9% 9,3% 2,9%
Rural ,8% 9,0% 26,5% 45,1% 14,3% 4,3%
Spoken
language:
Romanian 1,3% 9,8% 31,2% 41,8% 12,0% 3,8%
Russian or other ,6% 9,7% 24,8% 49,8% 11,9% 3,2%

- 68 -
Table 37. If you mentioned that you know a lot or quite a lot about the reintegration policy of the Republic of Moldova, tell me
please what exactly you know, what does this reintegration policy envisage?
E
con
om
ic d
evel
op
men
t
Fre
e m
ov
emen
t
Eu
rop
ean
in
teg
rati
on
Cre
atin
g a
Fed
erat
ion
Des
tro
y t
he
loca
l
eco
no
my
an
d i
mp
ort
go
od
s fr
om
EU
Reu
nif
icat
ion
wit
h
Tra
nsn
istr
ia
Join
ing
th
e C
ust
om
s
Un
ion
Inte
gra
tio
n i
nto
inte
rnat
ion
al
org
aniz
atio
ns
Ch
ang
ing
cit
izen
ship
Rem
ov
ing
chec
kp
oin
ts/b
ord
er
cro
ssin
g p
oin
ts
Ret
urn
to
fo
rmer
Mo
ldo
va
Co
-op
erat
ing
wit
h i
ts
nei
gh
bo
urs
Total 9,4% 6,7% 16,4% 2,2% 1,6% 17,9% 1,7% 2,2% 0,5% 0,6% 1,9% 2,9%
Sex: Male 8,6% 9,3% 21,5% 3,0% 3,2% 12,0% 3,0%
Female 10,1% 4,2% 11,4% 1,5% 23,5% 3,4% 1,5% 1,0% 1,1% 3,7% 5,7%
Age:
18-34 years old 9,1% 13,1% 13,3% 12,6% 3,3% 3,3% 6,1%
35-49 years old 15,1% 7,1% 7,1% 7,5% 15,5% 3,6% 3,6% 3,6%
50+ years old 6,8% 4,7% 23,4% 1,7% 23,4% 1,3% 3,4% 1,2% 1,3%
Level of
education:
Low 17,5% 31,8% 20,4% 5,3% 4,8% 6,9%
Medium 15,0% 1,6% 15,1% 1,9% 16,4% 3,0% 4,9% 5,5%
High 7,0% 8,4% 14,0% 3,0% 3,2% 18,5% 4,4% 1,2%
Social and
economic
level:
Low 12,5% 3,4% 18,5% 7,9% 19,9% 2,8% 9,4%
Average 11,4% 5,3% 9,2% 27,5% 4,9% 2,1% 1,6% 2,1%
High 6,6% 9,1% 21,0% 1,6% 3,4% 9,5% 3,2% 2,6% 2,6%
Residence: Urban 13,3% 3,9% 16,2% 2,9% 3,1% 13,2% 2,9% 2,3% 2,3%
Rural 5,2% 9,8% 16,5% 1,5% 22,8% 3,6% 1,5% 1,1% 1,2% 1,5% 3,6%
Spoken
language:
Romanian 11,0% 8,5% 14,9% 0,9% 19,5% 1,9% 0,7% 2,4% 2,2%
Russian or other 3,5% 21,6% 7,1% 7,5% 11,9% 8,3% 3,5% 2,5% 5,5%

- 69 -
Table 38. If you mentioned that you know a lot or quite a lot about the reintegration policy of the Republic of Moldova, tell me
please what exactly you know, what does this reintegration policy envisage?
C
om
mo
n l
aws
for
Mo
ldo
va
and
Tra
nsn
istr
ia
Mo
ldo
va
to d
ecid
e fo
r
Tra
nsn
istr
ia a
nd
Gag
auzi
a
Org
aniz
ing
mee
tin
gs
and
neg
oti
atio
ns
Dev
elo
pm
ent
of
dem
ocr
acy
Cu
ltu
re
Eq
ual
ity
of
citi
zen
s
bef
ore
th
e la
w
Civ
iliz
atio
n
Imp
rov
emen
t in
th
e
stan
dar
d o
f li
vin
g
Eac
h c
ou
ntr
y t
o d
efen
d
thei
r o
wn
nat
ion
al
inte
rest
s
Imp
lem
enti
ng
ref
orm
s
Un
ific
atio
n w
ith
Ro
man
ia
DK
/NA
Total 0,7% 1,7% 17,6% 0,6% 0,7% 1,5% 4,5% 0,5% 2,2% 1,7% 0,6% 10,7%
Sex: Male 1,5% 17,9% 1,3% 1,5% 3,9% 3,2% 1,5% 1,3% 15,5%
Female 3,4% 17,3% 3,0% 5,0% 1,0% 1,1% 2,0% 6,1%
Age:
18-34 years old 2,8% 22,4% 2,8% 9,1% 2,8% 6,3%
35-49 years old 3,6% 11,5% 7,5% 18,1%
50+ years old 1,7% 16,6% 1,5% 1,7% 1,2% 2,8% 1,2% 1,3% 1,7% 1,5% 10,6%
Level of
education:
Low 5,3% 9,2% 4,8%
Medium 4,5% 17,3% 1,6% 5,5% 16,2%
High 1,5% 20,5% 1,3% 1,5% 3,1% 7,7% 1,0% 1,5% 1,3% 7,5%
Social and
economic
level:
Low 3,1% 2,8% 9,3% 10,3%
Average 2,8% 13,1% 1,8% 2,1% 4,3% 6,2% 4,4% 8,6%
High 1,6% 1,6% 27,0% 4,9% 1,3% 1,4% 12,4%
Residence: Urban 1,4% 3,4% 19,9% 1,4% 3,0% 4,4% 4,2% 1,4% 1,2% 7,5%
Rural 15,1% 1,3% 4,6% 1,1% 2,1% 14,0%
Spoken
language:
Romanian 2,2% 22,3% 0,8% 0,9% 1,3% 4,9% 0,7% 2,7% 2,2% 9,0%
Russian or other 3,5% 2,5% 3,0% 3,0% 16,7%

- 70 -
Table 39. To what extent, do you think, the Moldovan authorities take enough action for reintegration?
To a very
great
extent
To a
great
extent
Neither..
.nor
To a small
extent
To a very
small extent /
not at all
Difficult to
answer/refuse to
answer
Total 1,5% 8,7% 19,5% 35,6% 20,2% 14,5%
Sex: Male 1,3% 8,3% 19,0% 37,3% 22,3% 11,7%
Female 1,7% 9,0% 19,8% 34,2% 18,4% 16,9%
Age:
18-34 years old 1,0% 10,8% 19,0% 36,9% 16,6% 15,7%
35-49 years old 2,1% 4,4% 20,0% 35,6% 24,1% 13,7%
50+ years old 1,6% 9,3% 19,6% 34,4% 21,2% 14,0%
Level of
education:
Low ,8% 6,0% 23,2% 28,2% 18,8% 23,0%
Medium 1,9% 6,9% 17,8% 38,2% 22,8% 12,4%
High 1,4% 13,5% 19,3% 37,0% 17,2% 11,6%
Social and
economic level:
Low 2,2% 6,9% 19,1% 32,0% 21,2% 18,7%
Average ,8% 8,1% 21,6% 36,7% 19,9% 12,8%
High 1,5% 10,6% 18,0% 37,3% 19,7% 12,9%
Residence: Urban 1,3% 9,7% 17,9% 37,4% 22,9% 10,9%
Rural 1,6% 7,9% 20,8% 34,1% 17,9% 17,7%
Spoken language: Romanian 1,8% 9,8% 20,4% 34,9% 17,7% 15,4%
Russian or other ,3% 5,0% 16,2% 38,1% 28,8% 11,6%
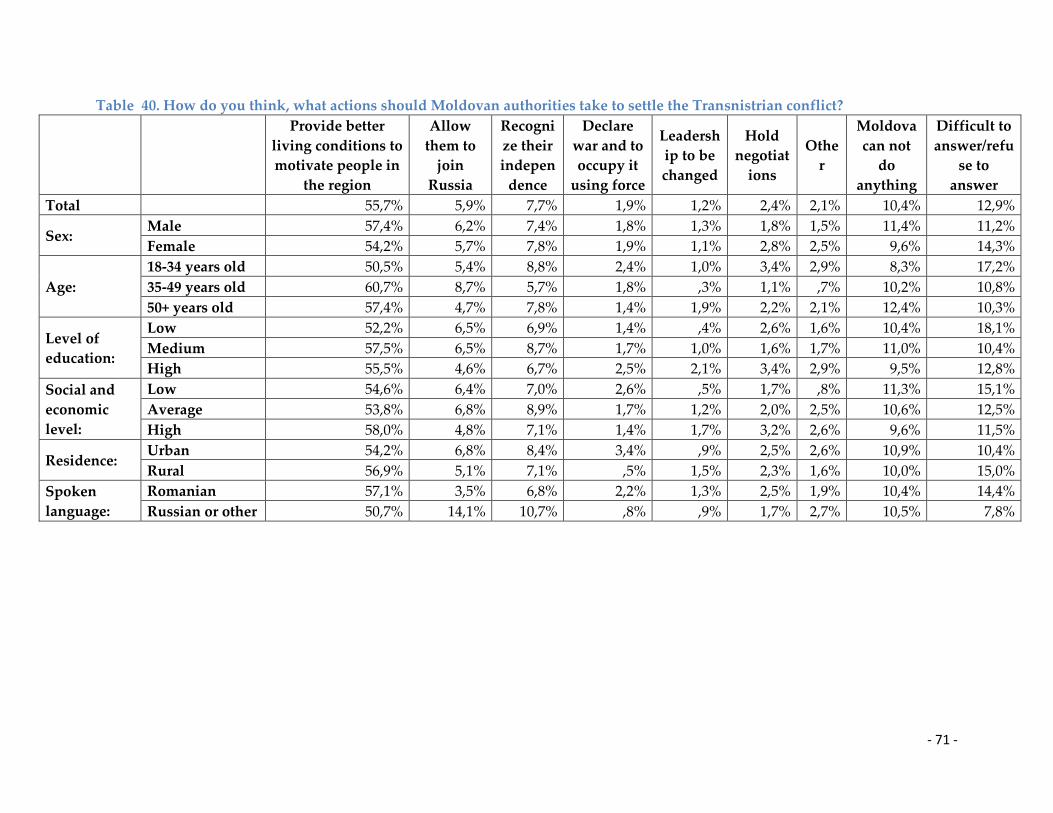
- 71 -
Table 40. How do you think, what actions should Moldovan authorities take to settle the Transnistrian conflict?
Provide better
living conditions to
motivate people in
the region
Allow
them to
join
Russia
Recogni
ze their
indepen
dence
Declare
war and to
occupy it
using force
Leadersh
ip to be
changed
Hold
negotiat
ions
Othe
r
Moldova
can not
do
anything
Difficult to
answer/refu
se to
answer
Total 55,7% 5,9% 7,7% 1,9% 1,2% 2,4% 2,1% 10,4% 12,9%
Sex: Male 57,4% 6,2% 7,4% 1,8% 1,3% 1,8% 1,5% 11,4% 11,2%
Female 54,2% 5,7% 7,8% 1,9% 1,1% 2,8% 2,5% 9,6% 14,3%
Age:
18-34 years old 50,5% 5,4% 8,8% 2,4% 1,0% 3,4% 2,9% 8,3% 17,2%
35-49 years old 60,7% 8,7% 5,7% 1,8% ,3% 1,1% ,7% 10,2% 10,8%
50+ years old 57,4% 4,7% 7,8% 1,4% 1,9% 2,2% 2,1% 12,4% 10,3%
Level of
education:
Low 52,2% 6,5% 6,9% 1,4% ,4% 2,6% 1,6% 10,4% 18,1%
Medium 57,5% 6,5% 8,7% 1,7% 1,0% 1,6% 1,7% 11,0% 10,4%
High 55,5% 4,6% 6,7% 2,5% 2,1% 3,4% 2,9% 9,5% 12,8%
Social and
economic
level:
Low 54,6% 6,4% 7,0% 2,6% ,5% 1,7% ,8% 11,3% 15,1%
Average 53,8% 6,8% 8,9% 1,7% 1,2% 2,0% 2,5% 10,6% 12,5%
High 58,0% 4,8% 7,1% 1,4% 1,7% 3,2% 2,6% 9,6% 11,5%
Residence: Urban 54,2% 6,8% 8,4% 3,4% ,9% 2,5% 2,6% 10,9% 10,4%
Rural 56,9% 5,1% 7,1% ,5% 1,5% 2,3% 1,6% 10,0% 15,0%
Spoken
language:
Romanian 57,1% 3,5% 6,8% 2,2% 1,3% 2,5% 1,9% 10,4% 14,4%
Russian or other 50,7% 14,1% 10,7% ,8% ,9% 1,7% 2,7% 10,5% 7,8%
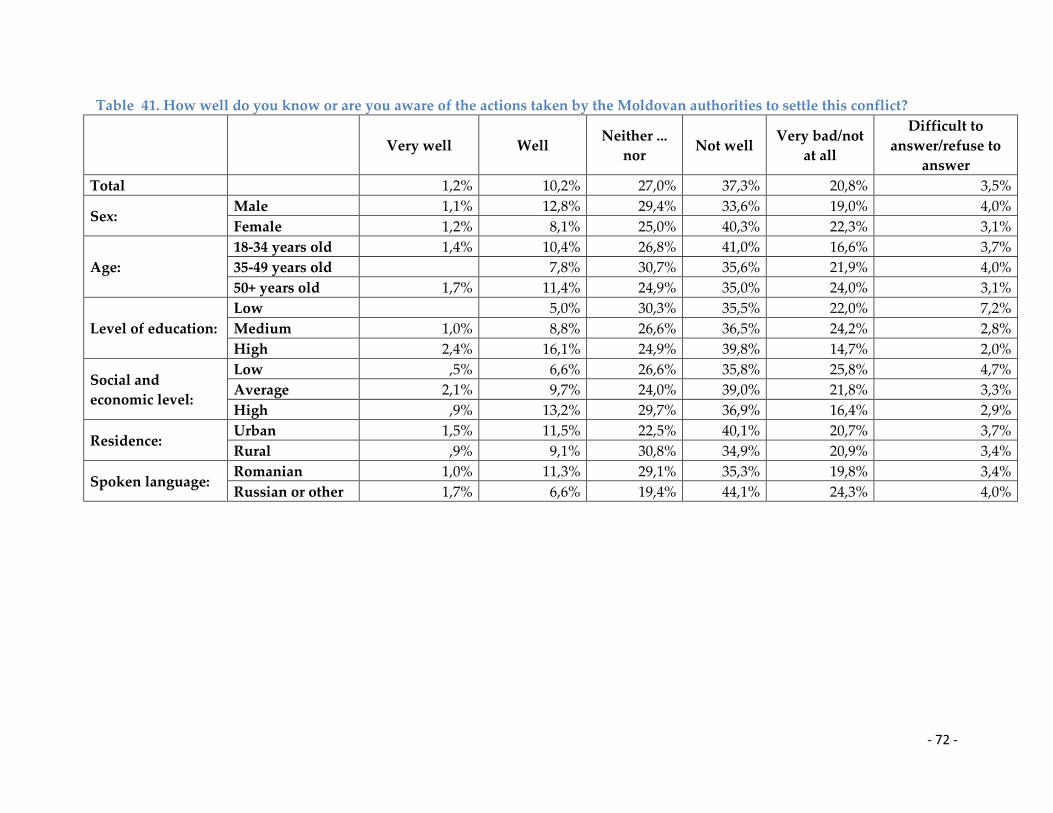
- 72 -
Table 41. How well do you know or are you aware of the actions taken by the Moldovan authorities to settle this conflict?
Very well Well Neither ...
nor Not well
Very bad/not
at all
Difficult to
answer/refuse to
answer
Total 1,2% 10,2% 27,0% 37,3% 20,8% 3,5%
Sex: Male 1,1% 12,8% 29,4% 33,6% 19,0% 4,0%
Female 1,2% 8,1% 25,0% 40,3% 22,3% 3,1%
Age:
18-34 years old 1,4% 10,4% 26,8% 41,0% 16,6% 3,7%
35-49 years old 7,8% 30,7% 35,6% 21,9% 4,0%
50+ years old 1,7% 11,4% 24,9% 35,0% 24,0% 3,1%
Level of education:
Low 5,0% 30,3% 35,5% 22,0% 7,2%
Medium 1,0% 8,8% 26,6% 36,5% 24,2% 2,8%
High 2,4% 16,1% 24,9% 39,8% 14,7% 2,0%
Social and
economic level:
Low ,5% 6,6% 26,6% 35,8% 25,8% 4,7%
Average 2,1% 9,7% 24,0% 39,0% 21,8% 3,3%
High ,9% 13,2% 29,7% 36,9% 16,4% 2,9%
Residence: Urban 1,5% 11,5% 22,5% 40,1% 20,7% 3,7%
Rural ,9% 9,1% 30,8% 34,9% 20,9% 3,4%
Spoken language: Romanian 1,0% 11,3% 29,1% 35,3% 19,8% 3,4%
Russian or other 1,7% 6,6% 19,4% 44,1% 24,3% 4,0%
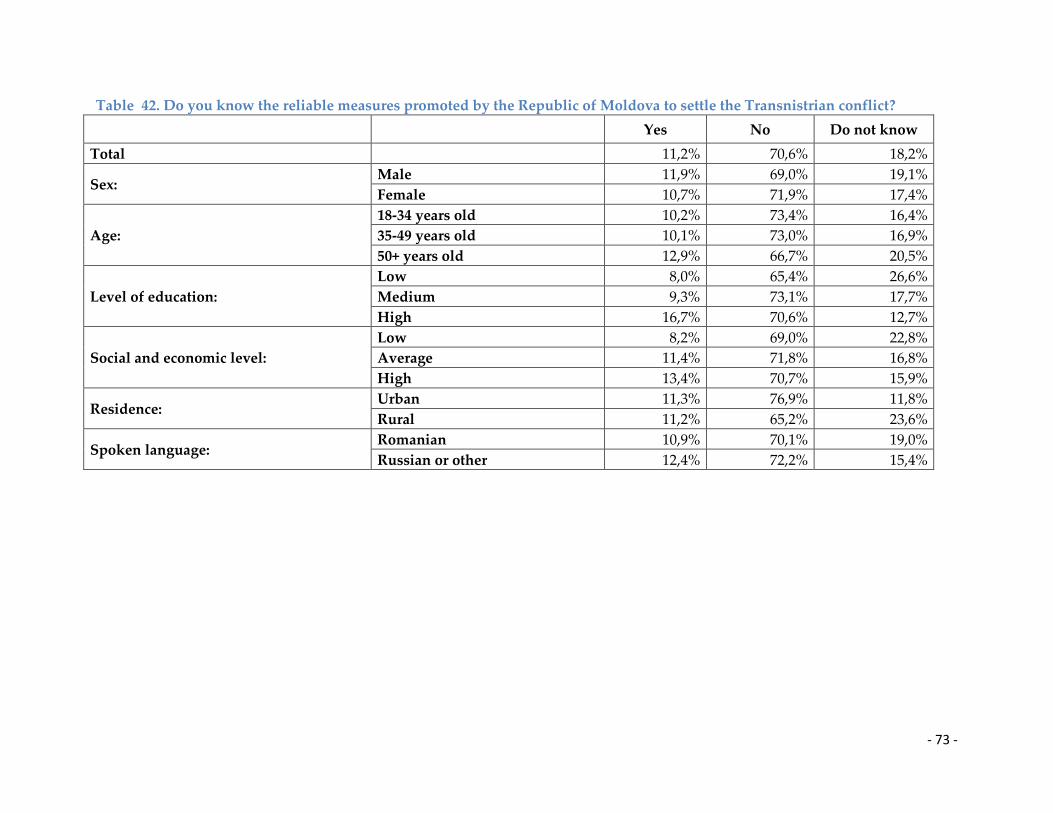
- 73 -
Table 42. Do you know the reliable measures promoted by the Republic of Moldova to settle the Transnistrian conflict?
Yes No Do not know
Total 11,2% 70,6% 18,2%
Sex: Male 11,9% 69,0% 19,1%
Female 10,7% 71,9% 17,4%
Age:
18-34 years old 10,2% 73,4% 16,4%
35-49 years old 10,1% 73,0% 16,9%
50+ years old 12,9% 66,7% 20,5%
Level of education:
Low 8,0% 65,4% 26,6%
Medium 9,3% 73,1% 17,7%
High 16,7% 70,6% 12,7%
Social and economic level:
Low 8,2% 69,0% 22,8%
Average 11,4% 71,8% 16,8%
High 13,4% 70,7% 15,9%
Residence: Urban 11,3% 76,9% 11,8%
Rural 11,2% 65,2% 23,6%
Spoken language: Romanian 10,9% 70,1% 19,0%
Russian or other 12,4% 72,2% 15,4%

- 74 -
Table 43. In your opinion, which of the following measures can be included in the lists of reliable ones, promoted by Moldova
to settle the Transnistrian conflict?
Business
Developme
nt
Civil
Society
Renovation of
social
infrastructure
through local
development
Health
Environmen
tal
Protection
Other None
Difficult to
answer/ref
use to
answer
Total 32,6% 31,5% 30,6% 19,8% 8,1% 2,0% 6,4% 27,5%
Sex: Male 36,2% 31,5% 31,6% 18,2% 7,3% 2,3% 7,3% 26,3%
Female 29,6% 31,5% 29,7% 21,2% 8,7% 1,7% 5,7% 28,5%
Age:
18-34 years old 32,1% 32,3% 33,5% 17,2% 7,0% 1,7% 6,7% 25,9%
35-49 years old 33,3% 29,8% 29,1% 18,9% 7,5% 3,6% 5,3% 28,6%
50+ years old 32,6% 31,7% 28,7% 22,7% 9,4% 1,2% 6,8% 28,3%
Level of
education:
Low 25,1% 26,4% 23,6% 19,8% 7,0% 1,6% 8,5% 33,3%
Medium 32,1% 30,6% 27,8% 22,0% 7,7% 2,4% 6,1% 28,6%
High 39,0% 36,5% 40,0% 16,5% 9,5% 1,5% 5,3% 21,4%
Social and
economic
level:
Low 25,7% 25,7% 20,6% 20,6% 7,8% 2,4% 9,1% 33,0%
Average 31,2% 32,0% 33,2% 23,1% 6,7% 2,0% 5,8% 27,8%
High 38,9% 35,3% 35,8% 16,7% 9,4% 1,5% 5,0% 23,2%
Residence: Urban 36,6% 35,8% 35,1% 18,3% 8,9% 1,3% 5,4% 23,1%
Rural 29,2% 27,8% 26,7% 21,1% 7,4% 2,5% 7,3% 31,2%
Spoken
language:
Romanian 32,1% 30,3% 31,5% 20,5% 8,3% 1,3% 6,2% 29,2%
Russian or other 34,3% 35,5% 27,3% 17,7% 7,3% 4,3% 7,4% 21,6%
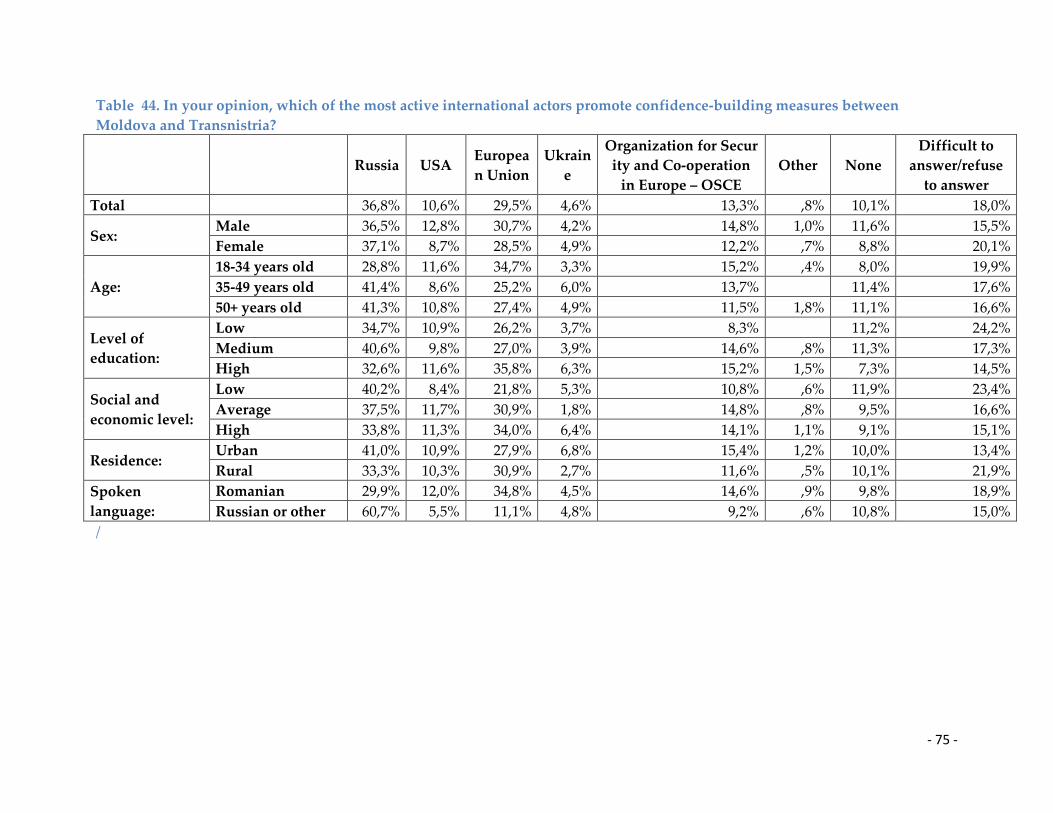
- 75 -
Table 44. In your opinion, which of the most active international actors promote confidence-building measures between
Moldova and Transnistria?
Russia USA Europea
n Union
Ukrain
e
Organization for Secur
ity and Co-operation
in Europe – OSCE
Other None
Difficult to
answer/refuse
to answer
Total 36,8% 10,6% 29,5% 4,6% 13,3% ,8% 10,1% 18,0%
Sex: Male 36,5% 12,8% 30,7% 4,2% 14,8% 1,0% 11,6% 15,5%
Female 37,1% 8,7% 28,5% 4,9% 12,2% ,7% 8,8% 20,1%
Age:
18-34 years old 28,8% 11,6% 34,7% 3,3% 15,2% ,4% 8,0% 19,9%
35-49 years old 41,4% 8,6% 25,2% 6,0% 13,7% 11,4% 17,6%
50+ years old 41,3% 10,8% 27,4% 4,9% 11,5% 1,8% 11,1% 16,6%
Level of
education:
Low 34,7% 10,9% 26,2% 3,7% 8,3% 11,2% 24,2%
Medium 40,6% 9,8% 27,0% 3,9% 14,6% ,8% 11,3% 17,3%
High 32,6% 11,6% 35,8% 6,3% 15,2% 1,5% 7,3% 14,5%
Social and
economic level:
Low 40,2% 8,4% 21,8% 5,3% 10,8% ,6% 11,9% 23,4%
Average 37,5% 11,7% 30,9% 1,8% 14,8% ,8% 9,5% 16,6%
High 33,8% 11,3% 34,0% 6,4% 14,1% 1,1% 9,1% 15,1%
Residence: Urban 41,0% 10,9% 27,9% 6,8% 15,4% 1,2% 10,0% 13,4%
Rural 33,3% 10,3% 30,9% 2,7% 11,6% ,5% 10,1% 21,9%
Spoken
language:
Romanian 29,9% 12,0% 34,8% 4,5% 14,6% ,9% 9,8% 18,9%
Russian or other 60,7% 5,5% 11,1% 4,8% 9,2% ,6% 10,8% 15,0%
/
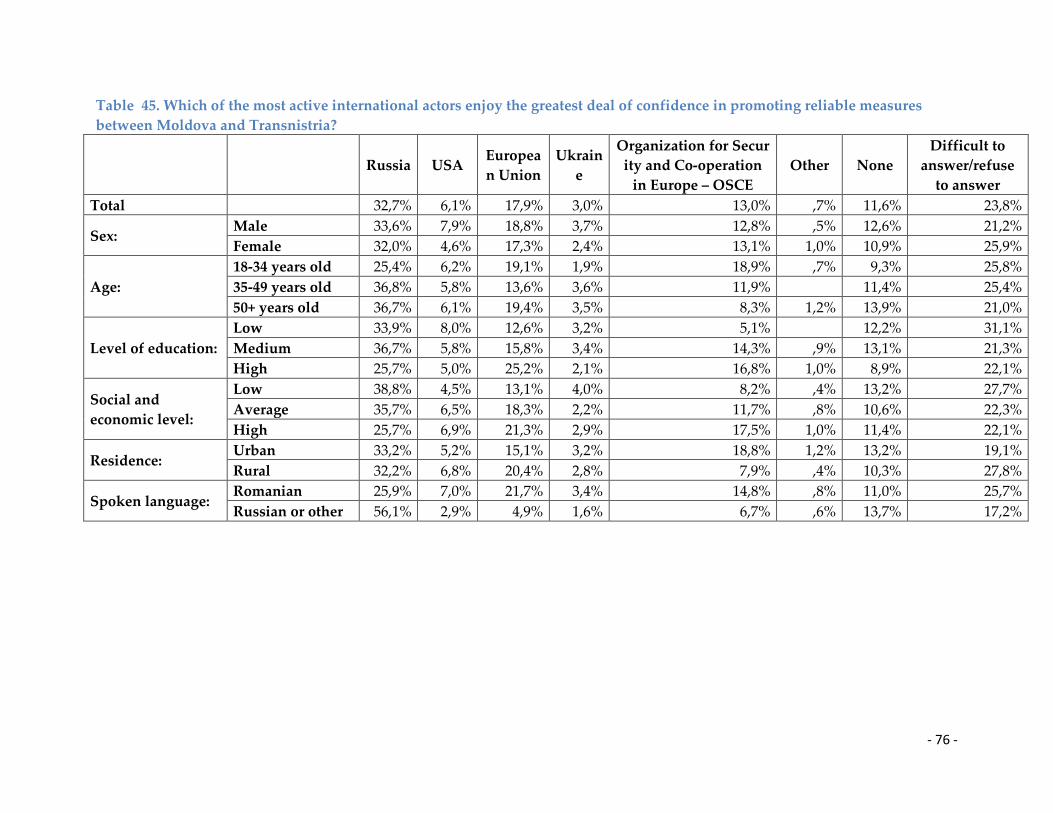
- 76 -
Table 45. Which of the most active international actors enjoy the greatest deal of confidence in promoting reliable measures
between Moldova and Transnistria?
Russia USA Europea
n Union
Ukrain
e
Organization for Secur
ity and Co-operation
in Europe – OSCE
Other None
Difficult to
answer/refuse
to answer
Total 32,7% 6,1% 17,9% 3,0% 13,0% ,7% 11,6% 23,8%
Sex: Male 33,6% 7,9% 18,8% 3,7% 12,8% ,5% 12,6% 21,2%
Female 32,0% 4,6% 17,3% 2,4% 13,1% 1,0% 10,9% 25,9%
Age:
18-34 years old 25,4% 6,2% 19,1% 1,9% 18,9% ,7% 9,3% 25,8%
35-49 years old 36,8% 5,8% 13,6% 3,6% 11,9% 11,4% 25,4%
50+ years old 36,7% 6,1% 19,4% 3,5% 8,3% 1,2% 13,9% 21,0%
Level of education:
Low 33,9% 8,0% 12,6% 3,2% 5,1% 12,2% 31,1%
Medium 36,7% 5,8% 15,8% 3,4% 14,3% ,9% 13,1% 21,3%
High 25,7% 5,0% 25,2% 2,1% 16,8% 1,0% 8,9% 22,1%
Social and
economic level:
Low 38,8% 4,5% 13,1% 4,0% 8,2% ,4% 13,2% 27,7%
Average 35,7% 6,5% 18,3% 2,2% 11,7% ,8% 10,6% 22,3%
High 25,7% 6,9% 21,3% 2,9% 17,5% 1,0% 11,4% 22,1%
Residence: Urban 33,2% 5,2% 15,1% 3,2% 18,8% 1,2% 13,2% 19,1%
Rural 32,2% 6,8% 20,4% 2,8% 7,9% ,4% 10,3% 27,8%
Spoken language: Romanian 25,9% 7,0% 21,7% 3,4% 14,8% ,8% 11,0% 25,7%
Russian or other 56,1% 2,9% 4,9% 1,6% 6,7% ,6% 13,7% 17,2%

- 77 -
Table 46. Tell me please, is Russia still a credible mediator in the settlement of Transnistrian issue after the annexation of
Crimea by the Russian Federation?
Yes No Do not know
Total 34,6% 44,4% 21,0%
Sex: Male 36,0% 43,3% 20,7%
Female 33,5% 45,3% 21,1%
Age:
18-34 years old 28,6% 49,0% 22,4%
35-49 years old 37,8% 42,7% 19,5%
50+ years old 38,1% 41,4% 20,5%
Level of education:
Low 31,3% 37,8% 30,9%
Medium 39,6% 40,5% 19,8%
High 29,4% 55,4% 15,3%
Social and economic level:
Low 37,2% 35,4% 27,4%
Average 36,4% 44,9% 18,6%
High 31,2% 50,7% 18,1%
Residence: Urban 39,9% 45,1% 15,0%
Rural 30,2% 43,8% 26,0%
Spoken language: Romanian 25,8% 51,9% 22,3%
Russian or other 65,1% 18,6% 16,3%
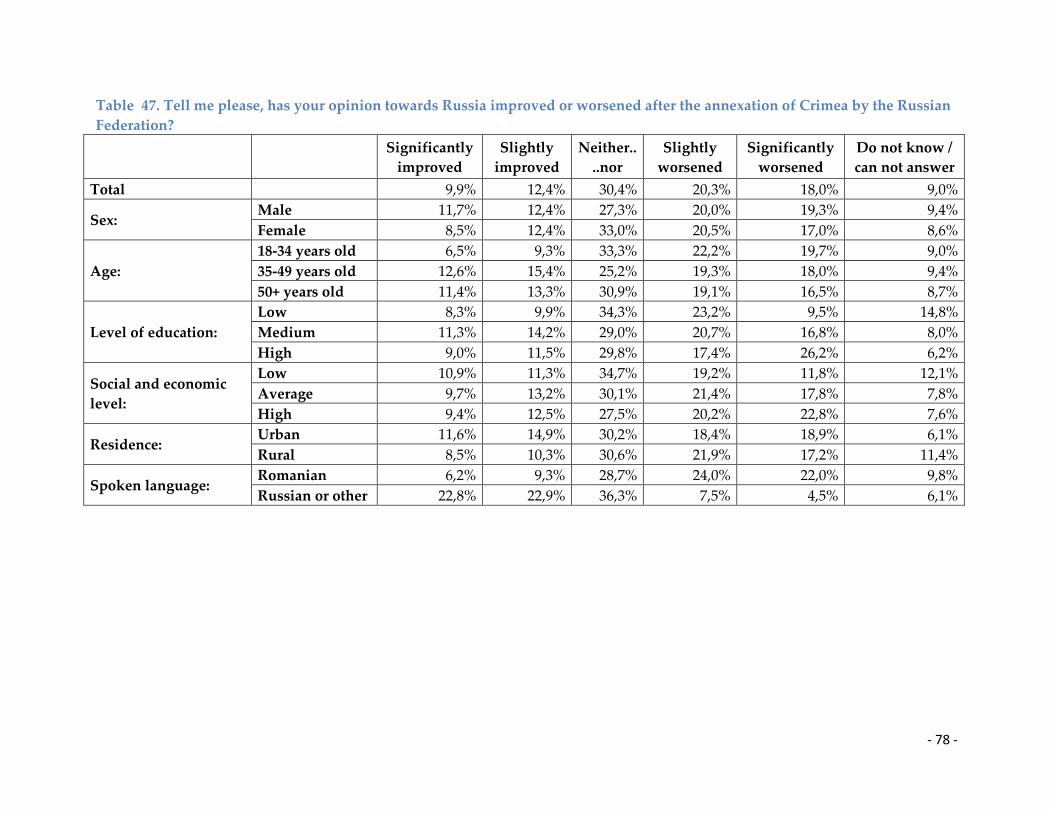
- 78 -
Table 47. Tell me please, has your opinion towards Russia improved or worsened after the annexation of Crimea by the Russian
Federation?
Significantly
improved
Slightly
improved
Neither..
..nor
Slightly
worsened
Significantly
worsened
Do not know /
can not answer
Total 9,9% 12,4% 30,4% 20,3% 18,0% 9,0%
Sex: Male 11,7% 12,4% 27,3% 20,0% 19,3% 9,4%
Female 8,5% 12,4% 33,0% 20,5% 17,0% 8,6%
Age:
18-34 years old 6,5% 9,3% 33,3% 22,2% 19,7% 9,0%
35-49 years old 12,6% 15,4% 25,2% 19,3% 18,0% 9,4%
50+ years old 11,4% 13,3% 30,9% 19,1% 16,5% 8,7%
Level of education:
Low 8,3% 9,9% 34,3% 23,2% 9,5% 14,8%
Medium 11,3% 14,2% 29,0% 20,7% 16,8% 8,0%
High 9,0% 11,5% 29,8% 17,4% 26,2% 6,2%
Social and economic
level:
Low 10,9% 11,3% 34,7% 19,2% 11,8% 12,1%
Average 9,7% 13,2% 30,1% 21,4% 17,8% 7,8%
High 9,4% 12,5% 27,5% 20,2% 22,8% 7,6%
Residence: Urban 11,6% 14,9% 30,2% 18,4% 18,9% 6,1%
Rural 8,5% 10,3% 30,6% 21,9% 17,2% 11,4%
Spoken language: Romanian 6,2% 9,3% 28,7% 24,0% 22,0% 9,8%
Russian or other 22,8% 22,9% 36,3% 7,5% 4,5% 6,1%
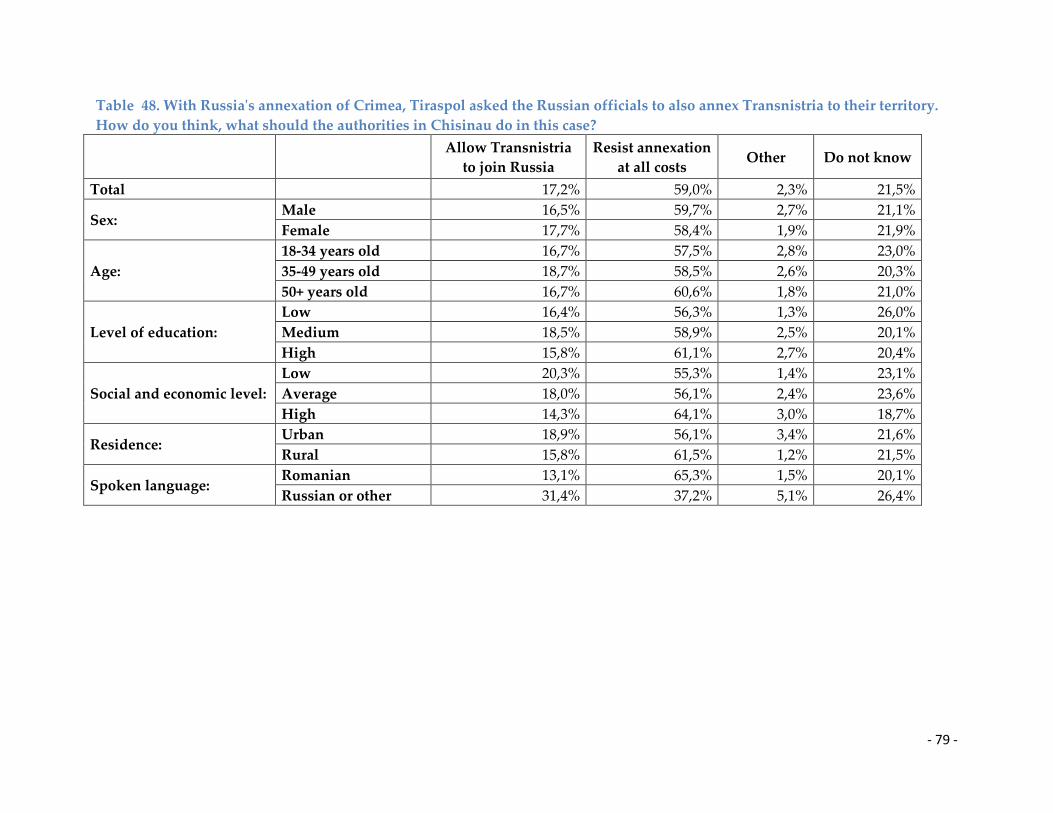
- 79 -
Table 48. With Russia's annexation of Crimea, Tiraspol asked the Russian officials to also annex Transnistria to their territory.
How do you think, what should the authorities in Chisinau do in this case?
Allow Transnistria
to join Russia
Resist annexation
at all costs Other Do not know
Total 17,2% 59,0% 2,3% 21,5%
Sex: Male 16,5% 59,7% 2,7% 21,1%
Female 17,7% 58,4% 1,9% 21,9%
Age:
18-34 years old 16,7% 57,5% 2,8% 23,0%
35-49 years old 18,7% 58,5% 2,6% 20,3%
50+ years old 16,7% 60,6% 1,8% 21,0%
Level of education:
Low 16,4% 56,3% 1,3% 26,0%
Medium 18,5% 58,9% 2,5% 20,1%
High 15,8% 61,1% 2,7% 20,4%
Social and economic level:
Low 20,3% 55,3% 1,4% 23,1%
Average 18,0% 56,1% 2,4% 23,6%
High 14,3% 64,1% 3,0% 18,7%
Residence: Urban 18,9% 56,1% 3,4% 21,6%
Rural 15,8% 61,5% 1,2% 21,5%
Spoken language: Romanian 13,1% 65,3% 1,5% 20,1%
Russian or other 31,4% 37,2% 5,1% 26,4%
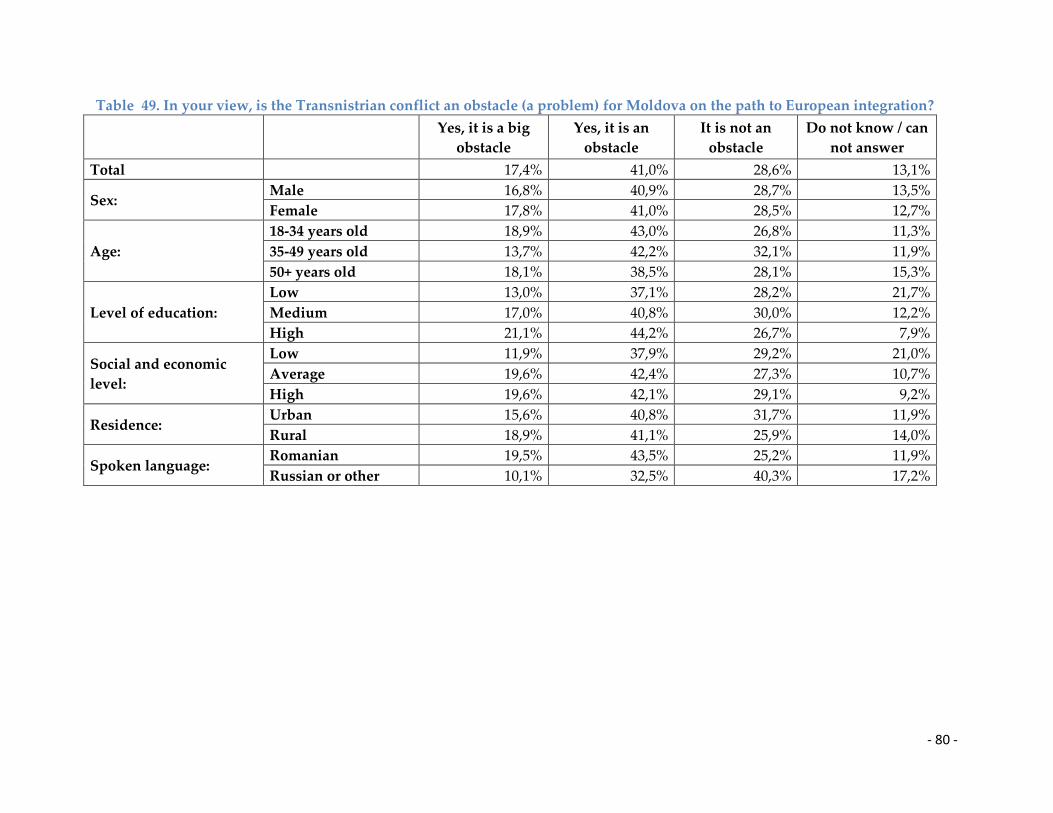
- 80 -
Table 49. In your view, is the Transnistrian conflict an obstacle (a problem) for Moldova on the path to European integration?
Yes, it is a big
obstacle
Yes, it is an
obstacle
It is not an
obstacle
Do not know / can
not answer
Total 17,4% 41,0% 28,6% 13,1%
Sex: Male 16,8% 40,9% 28,7% 13,5%
Female 17,8% 41,0% 28,5% 12,7%
Age:
18-34 years old 18,9% 43,0% 26,8% 11,3%
35-49 years old 13,7% 42,2% 32,1% 11,9%
50+ years old 18,1% 38,5% 28,1% 15,3%
Level of education:
Low 13,0% 37,1% 28,2% 21,7%
Medium 17,0% 40,8% 30,0% 12,2%
High 21,1% 44,2% 26,7% 7,9%
Social and economic
level:
Low 11,9% 37,9% 29,2% 21,0%
Average 19,6% 42,4% 27,3% 10,7%
High 19,6% 42,1% 29,1% 9,2%
Residence: Urban 15,6% 40,8% 31,7% 11,9%
Rural 18,9% 41,1% 25,9% 14,0%
Spoken language: Romanian 19,5% 43,5% 25,2% 11,9%
Russian or other 10,1% 32,5% 40,3% 17,2%
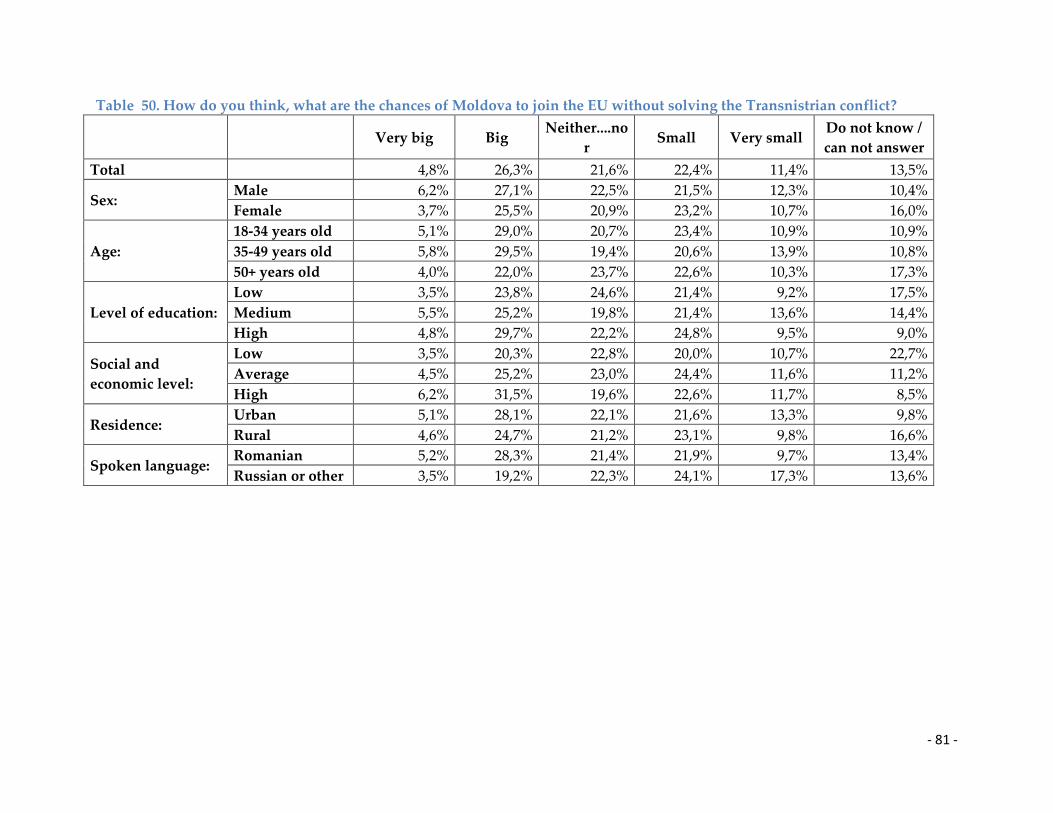
- 81 -
Table 50. How do you think, what are the chances of Moldova to join the EU without solving the Transnistrian conflict?
Very big Big
Neither....no
r Small Very small
Do not know /
can not answer
Total 4,8% 26,3% 21,6% 22,4% 11,4% 13,5%
Sex: Male 6,2% 27,1% 22,5% 21,5% 12,3% 10,4%
Female 3,7% 25,5% 20,9% 23,2% 10,7% 16,0%
Age:
18-34 years old 5,1% 29,0% 20,7% 23,4% 10,9% 10,9%
35-49 years old 5,8% 29,5% 19,4% 20,6% 13,9% 10,8%
50+ years old 4,0% 22,0% 23,7% 22,6% 10,3% 17,3%
Level of education:
Low 3,5% 23,8% 24,6% 21,4% 9,2% 17,5%
Medium 5,5% 25,2% 19,8% 21,4% 13,6% 14,4%
High 4,8% 29,7% 22,2% 24,8% 9,5% 9,0%
Social and
economic level:
Low 3,5% 20,3% 22,8% 20,0% 10,7% 22,7%
Average 4,5% 25,2% 23,0% 24,4% 11,6% 11,2%
High 6,2% 31,5% 19,6% 22,6% 11,7% 8,5%
Residence: Urban 5,1% 28,1% 22,1% 21,6% 13,3% 9,8%
Rural 4,6% 24,7% 21,2% 23,1% 9,8% 16,6%
Spoken language: Romanian 5,2% 28,3% 21,4% 21,9% 9,7% 13,4%
Russian or other 3,5% 19,2% 22,3% 24,1% 17,3% 13,6%
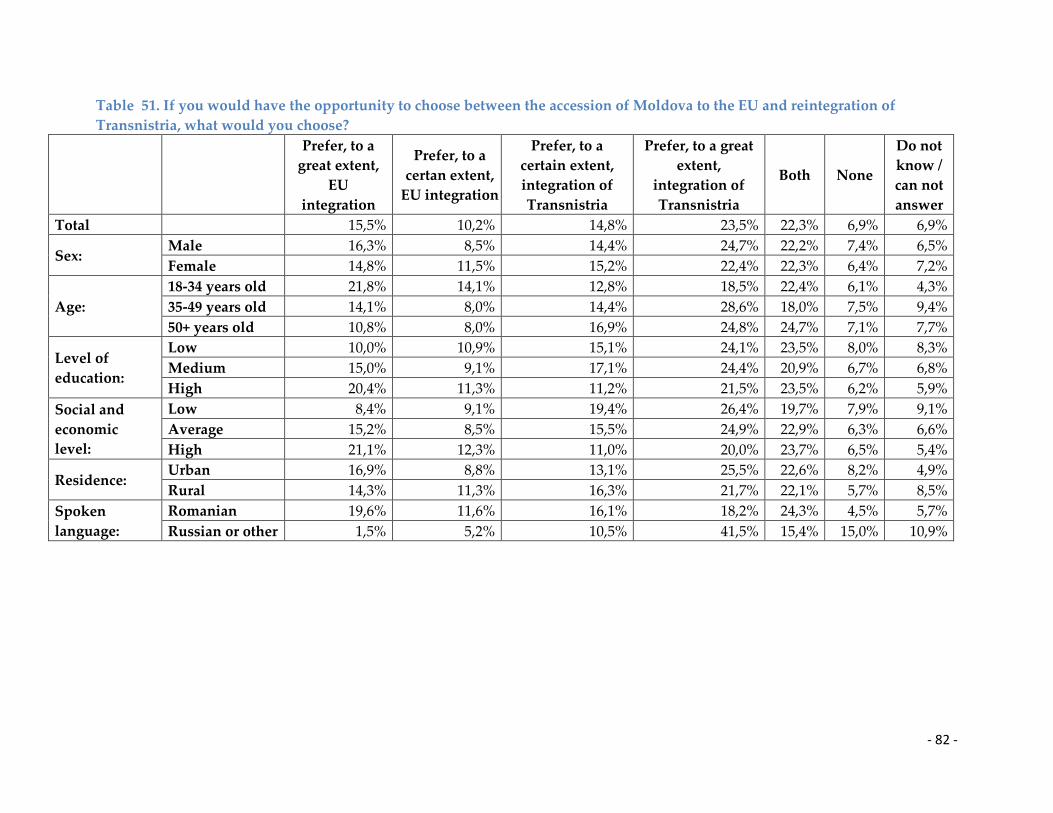
- 82 -
Table 51. If you would have the opportunity to choose between the accession of Moldova to the EU and reintegration of
Transnistria, what would you choose?
Prefer, to a
great extent,
EU
integration
Prefer, to a
certan extent,
EU integration
Prefer, to a
certain extent,
integration of
Transnistria
Prefer, to a great
extent,
integration of
Transnistria
Both None
Do not
know /
can not
answer
Total 15,5% 10,2% 14,8% 23,5% 22,3% 6,9% 6,9%
Sex: Male 16,3% 8,5% 14,4% 24,7% 22,2% 7,4% 6,5%
Female 14,8% 11,5% 15,2% 22,4% 22,3% 6,4% 7,2%
Age:
18-34 years old 21,8% 14,1% 12,8% 18,5% 22,4% 6,1% 4,3%
35-49 years old 14,1% 8,0% 14,4% 28,6% 18,0% 7,5% 9,4%
50+ years old 10,8% 8,0% 16,9% 24,8% 24,7% 7,1% 7,7%
Level of
education:
Low 10,0% 10,9% 15,1% 24,1% 23,5% 8,0% 8,3%
Medium 15,0% 9,1% 17,1% 24,4% 20,9% 6,7% 6,8%
High 20,4% 11,3% 11,2% 21,5% 23,5% 6,2% 5,9%
Social and
economic
level:
Low 8,4% 9,1% 19,4% 26,4% 19,7% 7,9% 9,1%
Average 15,2% 8,5% 15,5% 24,9% 22,9% 6,3% 6,6%
High 21,1% 12,3% 11,0% 20,0% 23,7% 6,5% 5,4%
Residence: Urban 16,9% 8,8% 13,1% 25,5% 22,6% 8,2% 4,9%
Rural 14,3% 11,3% 16,3% 21,7% 22,1% 5,7% 8,5%
Spoken
language:
Romanian 19,6% 11,6% 16,1% 18,2% 24,3% 4,5% 5,7%
Russian or other 1,5% 5,2% 10,5% 41,5% 15,4% 15,0% 10,9%
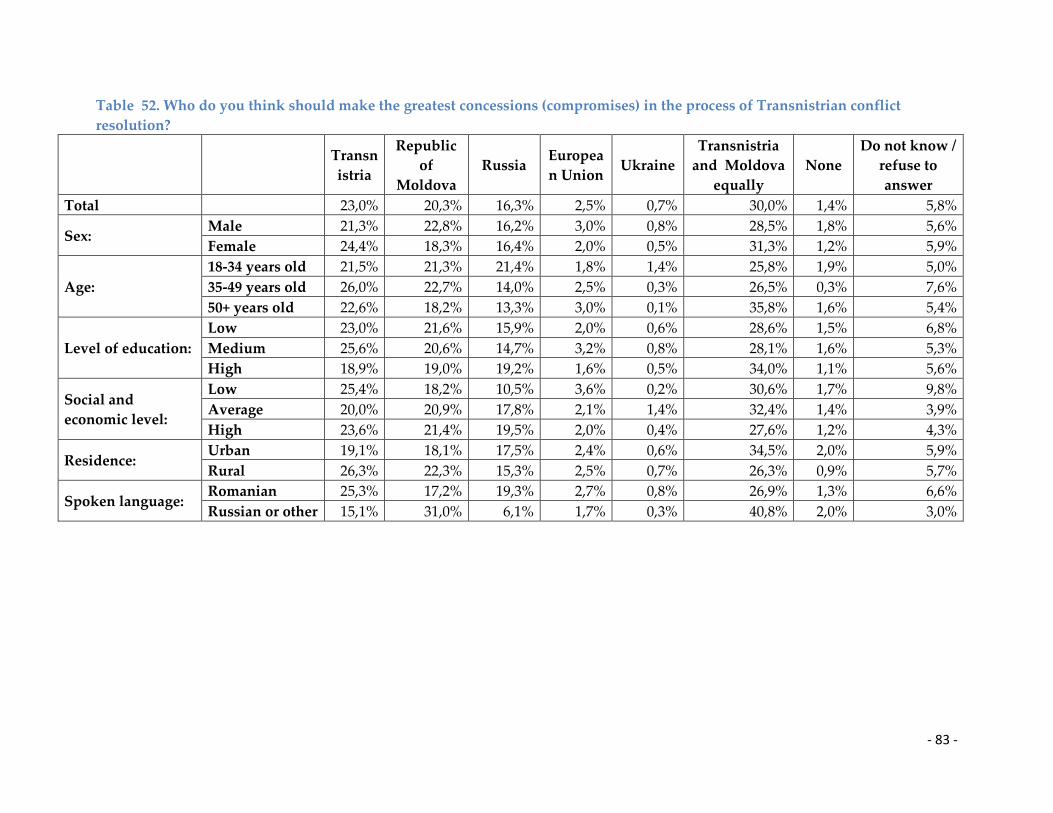
- 83 -
Table 52. Who do you think should make the greatest concessions (compromises) in the process of Transnistrian conflict
resolution?
Transn
istria
Republic
of
Moldova
Russia Europea
n Union Ukraine
Transnistria
and Moldova
equally
None
Do not know /
refuse to
answer
Total 23,0% 20,3% 16,3% 2,5% 0,7% 30,0% 1,4% 5,8%
Sex: Male 21,3% 22,8% 16,2% 3,0% 0,8% 28,5% 1,8% 5,6%
Female 24,4% 18,3% 16,4% 2,0% 0,5% 31,3% 1,2% 5,9%
Age:
18-34 years old 21,5% 21,3% 21,4% 1,8% 1,4% 25,8% 1,9% 5,0%
35-49 years old 26,0% 22,7% 14,0% 2,5% 0,3% 26,5% 0,3% 7,6%
50+ years old 22,6% 18,2% 13,3% 3,0% 0,1% 35,8% 1,6% 5,4%
Level of education:
Low 23,0% 21,6% 15,9% 2,0% 0,6% 28,6% 1,5% 6,8%
Medium 25,6% 20,6% 14,7% 3,2% 0,8% 28,1% 1,6% 5,3%
High 18,9% 19,0% 19,2% 1,6% 0,5% 34,0% 1,1% 5,6%
Social and
economic level:
Low 25,4% 18,2% 10,5% 3,6% 0,2% 30,6% 1,7% 9,8%
Average 20,0% 20,9% 17,8% 2,1% 1,4% 32,4% 1,4% 3,9%
High 23,6% 21,4% 19,5% 2,0% 0,4% 27,6% 1,2% 4,3%
Residence: Urban 19,1% 18,1% 17,5% 2,4% 0,6% 34,5% 2,0% 5,9%
Rural 26,3% 22,3% 15,3% 2,5% 0,7% 26,3% 0,9% 5,7%
Spoken language: Romanian 25,3% 17,2% 19,3% 2,7% 0,8% 26,9% 1,3% 6,6%
Russian or other 15,1% 31,0% 6,1% 1,7% 0,3% 40,8% 2,0% 3,0%
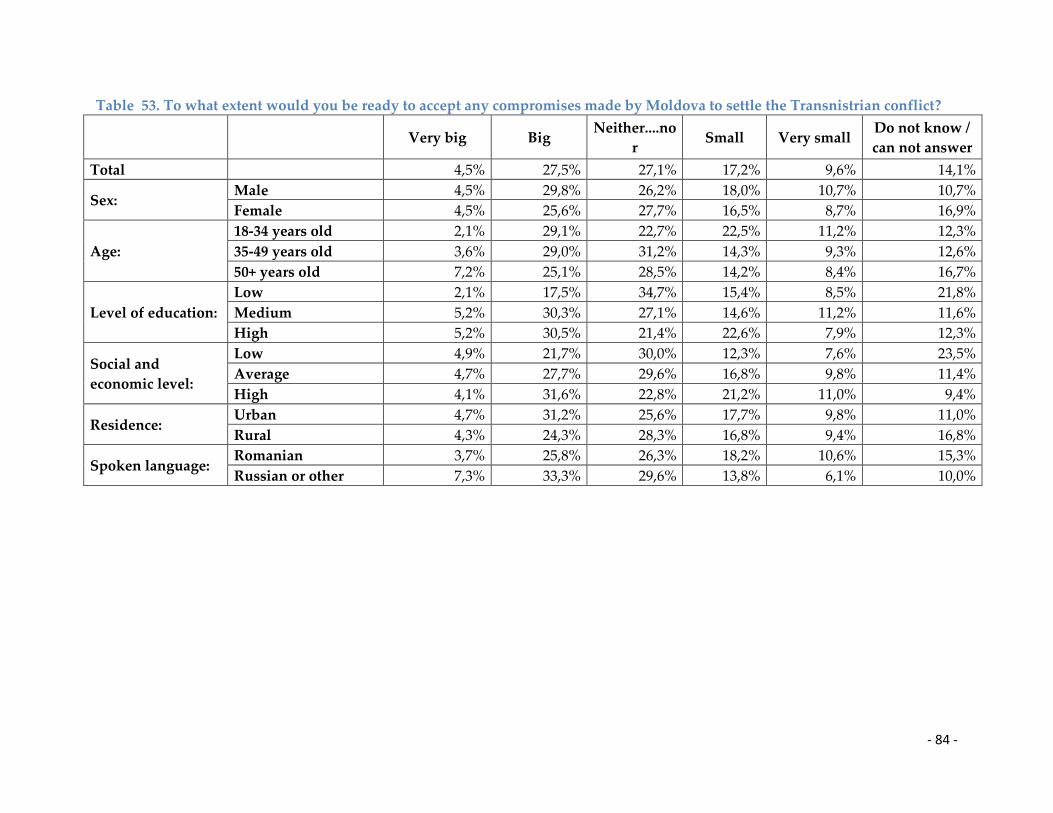
- 84 -
Table 53. To what extent would you be ready to accept any compromises made by Moldova to settle the Transnistrian conflict?
Very big Big
Neither....no
r Small Very small
Do not know /
can not answer
Total 4,5% 27,5% 27,1% 17,2% 9,6% 14,1%
Sex: Male 4,5% 29,8% 26,2% 18,0% 10,7% 10,7%
Female 4,5% 25,6% 27,7% 16,5% 8,7% 16,9%
Age:
18-34 years old 2,1% 29,1% 22,7% 22,5% 11,2% 12,3%
35-49 years old 3,6% 29,0% 31,2% 14,3% 9,3% 12,6%
50+ years old 7,2% 25,1% 28,5% 14,2% 8,4% 16,7%
Level of education:
Low 2,1% 17,5% 34,7% 15,4% 8,5% 21,8%
Medium 5,2% 30,3% 27,1% 14,6% 11,2% 11,6%
High 5,2% 30,5% 21,4% 22,6% 7,9% 12,3%
Social and
economic level:
Low 4,9% 21,7% 30,0% 12,3% 7,6% 23,5%
Average 4,7% 27,7% 29,6% 16,8% 9,8% 11,4%
High 4,1% 31,6% 22,8% 21,2% 11,0% 9,4%
Residence: Urban 4,7% 31,2% 25,6% 17,7% 9,8% 11,0%
Rural 4,3% 24,3% 28,3% 16,8% 9,4% 16,8%
Spoken language: Romanian 3,7% 25,8% 26,3% 18,2% 10,6% 15,3%
Russian or other 7,3% 33,3% 29,6% 13,8% 6,1% 10,0%
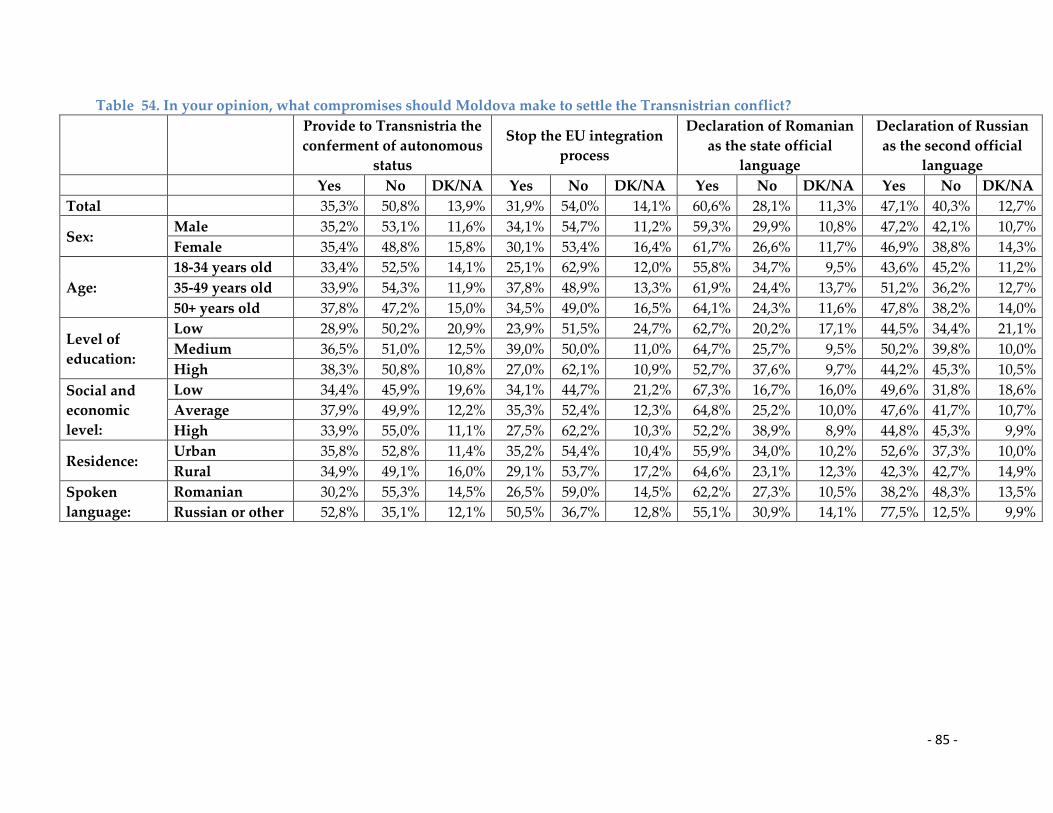
- 85 -
Table 54. In your opinion, what compromises should Moldova make to settle the Transnistrian conflict?
Provide to Transnistria the
conferment of autonomous
status
Stop the EU integration
process
Declaration of Romanian
as the state official
language
Declaration of Russian
as the second official
language
Yes No DK/NA Yes No DK/NA Yes No DK/NA Yes No DK/NA
Total 35,3% 50,8% 13,9% 31,9% 54,0% 14,1% 60,6% 28,1% 11,3% 47,1% 40,3% 12,7%
Sex: Male 35,2% 53,1% 11,6% 34,1% 54,7% 11,2% 59,3% 29,9% 10,8% 47,2% 42,1% 10,7%
Female 35,4% 48,8% 15,8% 30,1% 53,4% 16,4% 61,7% 26,6% 11,7% 46,9% 38,8% 14,3%
Age:
18-34 years old 33,4% 52,5% 14,1% 25,1% 62,9% 12,0% 55,8% 34,7% 9,5% 43,6% 45,2% 11,2%
35-49 years old 33,9% 54,3% 11,9% 37,8% 48,9% 13,3% 61,9% 24,4% 13,7% 51,2% 36,2% 12,7%
50+ years old 37,8% 47,2% 15,0% 34,5% 49,0% 16,5% 64,1% 24,3% 11,6% 47,8% 38,2% 14,0%
Level of
education:
Low 28,9% 50,2% 20,9% 23,9% 51,5% 24,7% 62,7% 20,2% 17,1% 44,5% 34,4% 21,1%
Medium 36,5% 51,0% 12,5% 39,0% 50,0% 11,0% 64,7% 25,7% 9,5% 50,2% 39,8% 10,0%
High 38,3% 50,8% 10,8% 27,0% 62,1% 10,9% 52,7% 37,6% 9,7% 44,2% 45,3% 10,5%
Social and
economic
level:
Low 34,4% 45,9% 19,6% 34,1% 44,7% 21,2% 67,3% 16,7% 16,0% 49,6% 31,8% 18,6%
Average 37,9% 49,9% 12,2% 35,3% 52,4% 12,3% 64,8% 25,2% 10,0% 47,6% 41,7% 10,7%
High 33,9% 55,0% 11,1% 27,5% 62,2% 10,3% 52,2% 38,9% 8,9% 44,8% 45,3% 9,9%
Residence: Urban 35,8% 52,8% 11,4% 35,2% 54,4% 10,4% 55,9% 34,0% 10,2% 52,6% 37,3% 10,0%
Rural 34,9% 49,1% 16,0% 29,1% 53,7% 17,2% 64,6% 23,1% 12,3% 42,3% 42,7% 14,9%
Spoken
language:
Romanian 30,2% 55,3% 14,5% 26,5% 59,0% 14,5% 62,2% 27,3% 10,5% 38,2% 48,3% 13,5%
Russian or other 52,8% 35,1% 12,1% 50,5% 36,7% 12,8% 55,1% 30,9% 14,1% 77,5% 12,5% 9,9%
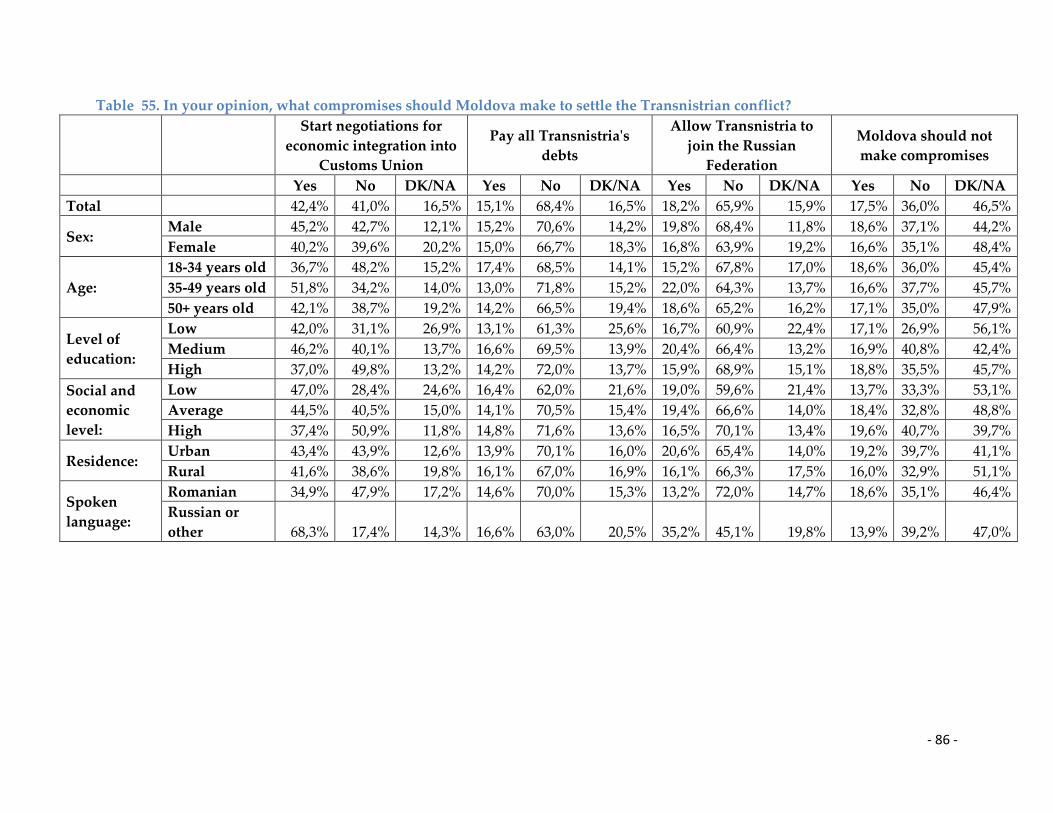
- 86 -
Table 55. In your opinion, what compromises should Moldova make to settle the Transnistrian conflict?
Start negotiations for
economic integration into
Customs Union
Pay all Transnistria's
debts
Allow Transnistria to
join the Russian
Federation
Moldova should not
make compromises
Yes No DK/NA Yes No DK/NA Yes No DK/NA Yes No DK/NA
Total 42,4% 41,0% 16,5% 15,1% 68,4% 16,5% 18,2% 65,9% 15,9% 17,5% 36,0% 46,5%
Sex: Male 45,2% 42,7% 12,1% 15,2% 70,6% 14,2% 19,8% 68,4% 11,8% 18,6% 37,1% 44,2%
Female 40,2% 39,6% 20,2% 15,0% 66,7% 18,3% 16,8% 63,9% 19,2% 16,6% 35,1% 48,4%
Age:
18-34 years old 36,7% 48,2% 15,2% 17,4% 68,5% 14,1% 15,2% 67,8% 17,0% 18,6% 36,0% 45,4%
35-49 years old 51,8% 34,2% 14,0% 13,0% 71,8% 15,2% 22,0% 64,3% 13,7% 16,6% 37,7% 45,7%
50+ years old 42,1% 38,7% 19,2% 14,2% 66,5% 19,4% 18,6% 65,2% 16,2% 17,1% 35,0% 47,9%
Level of
education:
Low 42,0% 31,1% 26,9% 13,1% 61,3% 25,6% 16,7% 60,9% 22,4% 17,1% 26,9% 56,1%
Medium 46,2% 40,1% 13,7% 16,6% 69,5% 13,9% 20,4% 66,4% 13,2% 16,9% 40,8% 42,4%
High 37,0% 49,8% 13,2% 14,2% 72,0% 13,7% 15,9% 68,9% 15,1% 18,8% 35,5% 45,7%
Social and
economic
level:
Low 47,0% 28,4% 24,6% 16,4% 62,0% 21,6% 19,0% 59,6% 21,4% 13,7% 33,3% 53,1%
Average 44,5% 40,5% 15,0% 14,1% 70,5% 15,4% 19,4% 66,6% 14,0% 18,4% 32,8% 48,8%
High 37,4% 50,9% 11,8% 14,8% 71,6% 13,6% 16,5% 70,1% 13,4% 19,6% 40,7% 39,7%
Residence: Urban 43,4% 43,9% 12,6% 13,9% 70,1% 16,0% 20,6% 65,4% 14,0% 19,2% 39,7% 41,1%
Rural 41,6% 38,6% 19,8% 16,1% 67,0% 16,9% 16,1% 66,3% 17,5% 16,0% 32,9% 51,1%
Spoken
language:
Romanian 34,9% 47,9% 17,2% 14,6% 70,0% 15,3% 13,2% 72,0% 14,7% 18,6% 35,1% 46,4%
Russian or
other 68,3% 17,4% 14,3% 16,6% 63,0% 20,5% 35,2% 45,1% 19,8% 13,9% 39,2% 47,0%
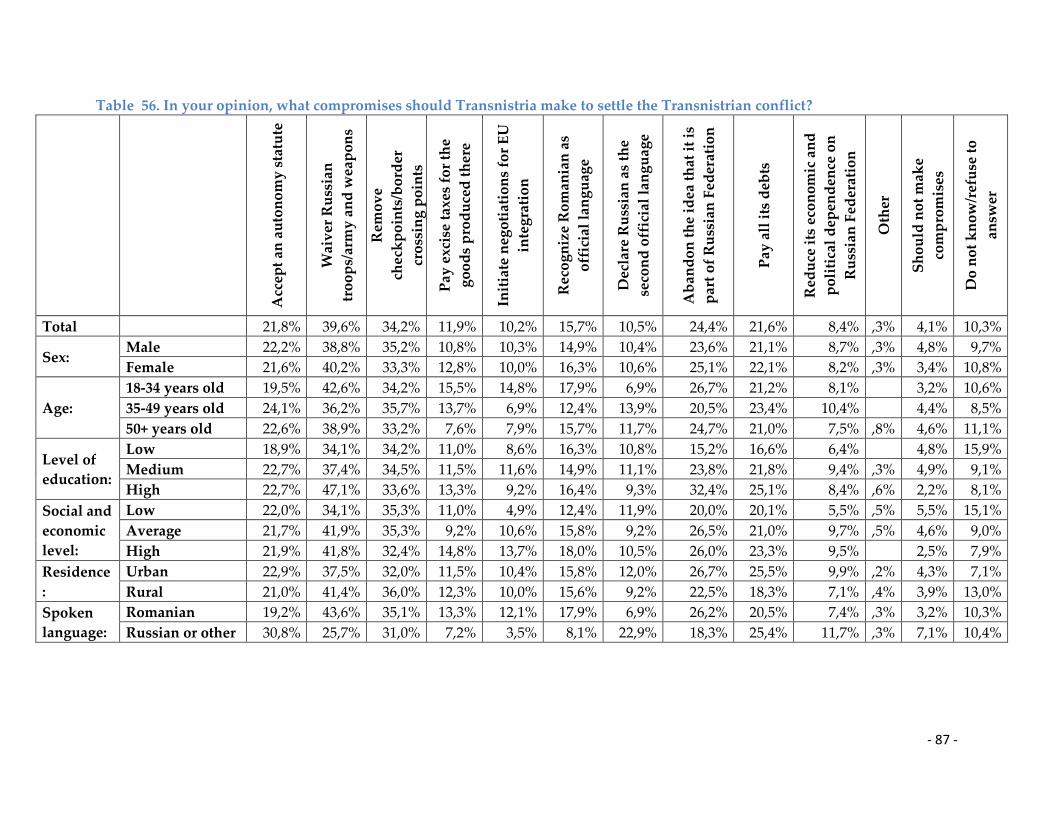
- 87 -
Table 56. In your opinion, what compromises should Transnistria make to settle the Transnistrian conflict?
Acc
ept
an a
uto
no
my
sta
tute
Wai
ver
Ru
ssia
n
tro
op
s/ar
my
an
d w
eap
on
s
Rem
ov
e
chec
kp
oin
ts/b
ord
er
cro
ssin
g p
oin
ts
Pay
exc
ise
taxe
s fo
r th
e
go
od
s p
rod
uce
d t
her
e
Init
iate
neg
oti
atio
ns
for
EU
inte
gra
tio
n
Rec
og
niz
e R
om
ania
n a
s
off
icia
l la
ng
uag
e
Dec
lare
Ru
ssia
n a
s th
e
seco
nd
off
icia
l la
ng
uag
e
Ab
and
on
th
e id
ea t
hat
it
is
par
t o
f R
uss
ian
Fed
erat
ion
Pay
all
its
deb
ts
Red
uce
its
eco
no
mic
an
d
po
liti
cal
dep
end
ence
on
Ru
ssia
n F
eder
atio
n
Oth
er
Sh
ou
ld n
ot
mak
e
com
pro
mis
es
Do
no
t k
no
w/r
efu
se t
o
answ
er
Total 21,8% 39,6% 34,2% 11,9% 10,2% 15,7% 10,5% 24,4% 21,6% 8,4% ,3% 4,1% 10,3%
Sex: Male 22,2% 38,8% 35,2% 10,8% 10,3% 14,9% 10,4% 23,6% 21,1% 8,7% ,3% 4,8% 9,7%
Female 21,6% 40,2% 33,3% 12,8% 10,0% 16,3% 10,6% 25,1% 22,1% 8,2% ,3% 3,4% 10,8%
Age:
18-34 years old 19,5% 42,6% 34,2% 15,5% 14,8% 17,9% 6,9% 26,7% 21,2% 8,1% 3,2% 10,6%
35-49 years old 24,1% 36,2% 35,7% 13,7% 6,9% 12,4% 13,9% 20,5% 23,4% 10,4% 4,4% 8,5%
50+ years old 22,6% 38,9% 33,2% 7,6% 7,9% 15,7% 11,7% 24,7% 21,0% 7,5% ,8% 4,6% 11,1%
Level of
education:
Low 18,9% 34,1% 34,2% 11,0% 8,6% 16,3% 10,8% 15,2% 16,6% 6,4% 4,8% 15,9%
Medium 22,7% 37,4% 34,5% 11,5% 11,6% 14,9% 11,1% 23,8% 21,8% 9,4% ,3% 4,9% 9,1%
High 22,7% 47,1% 33,6% 13,3% 9,2% 16,4% 9,3% 32,4% 25,1% 8,4% ,6% 2,2% 8,1%
Social and
economic
level:
Low 22,0% 34,1% 35,3% 11,0% 4,9% 12,4% 11,9% 20,0% 20,1% 5,5% ,5% 5,5% 15,1%
Average 21,7% 41,9% 35,3% 9,2% 10,6% 15,8% 9,2% 26,5% 21,0% 9,7% ,5% 4,6% 9,0%
High 21,9% 41,8% 32,4% 14,8% 13,7% 18,0% 10,5% 26,0% 23,3% 9,5% 2,5% 7,9%
Residence
:
Urban 22,9% 37,5% 32,0% 11,5% 10,4% 15,8% 12,0% 26,7% 25,5% 9,9% ,2% 4,3% 7,1%
Rural 21,0% 41,4% 36,0% 12,3% 10,0% 15,6% 9,2% 22,5% 18,3% 7,1% ,4% 3,9% 13,0%
Spoken
language:
Romanian 19,2% 43,6% 35,1% 13,3% 12,1% 17,9% 6,9% 26,2% 20,5% 7,4% ,3% 3,2% 10,3%
Russian or other 30,8% 25,7% 31,0% 7,2% 3,5% 8,1% 22,9% 18,3% 25,4% 11,7% ,3% 7,1% 10,4%
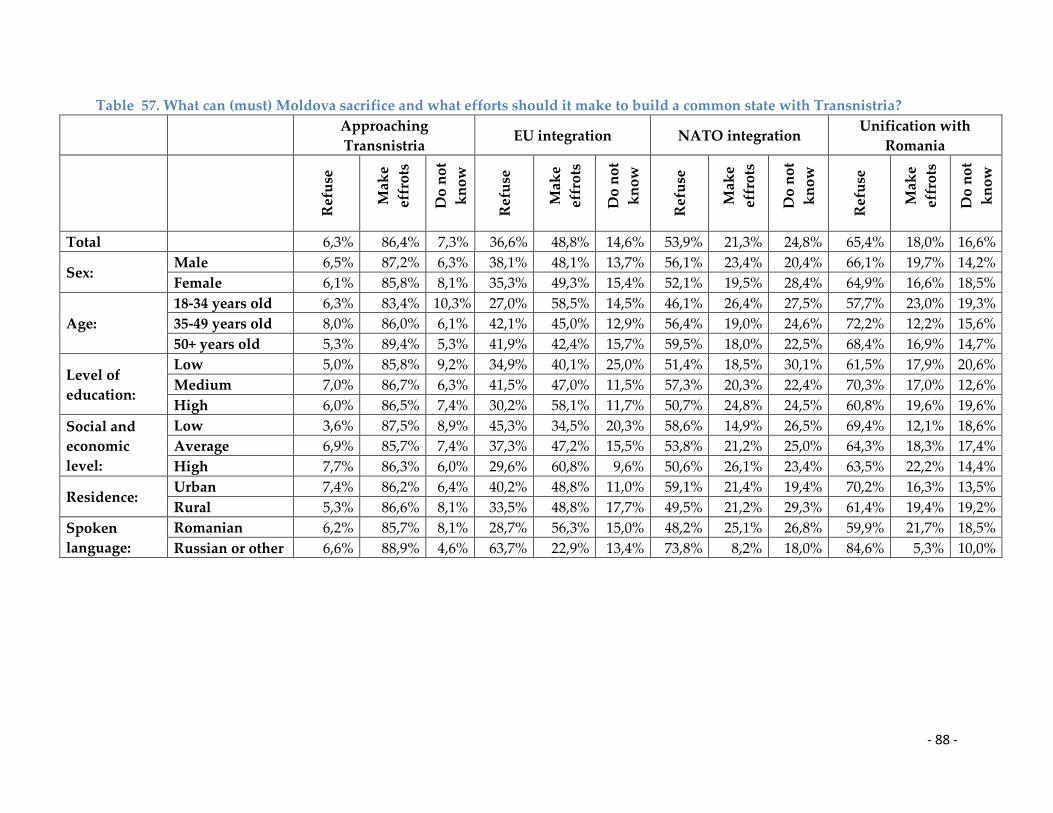
- 88 -
Table 57. What can (must) Moldova sacrifice and what efforts should it make to build a common state with Transnistria?
Approaching
Transnistria EU integration NATO integration
Unification with
Romania
Ref
use
Mak
e
effr
ots
Do
no
t
kn
ow
Ref
use
Mak
e
effr
ots
Do
no
t
kn
ow
Ref
use
Mak
e
effr
ots
Do
no
t
kn
ow
Ref
use
Mak
e
effr
ots
Do
no
t
kn
ow
Total 6,3% 86,4% 7,3% 36,6% 48,8% 14,6% 53,9% 21,3% 24,8% 65,4% 18,0% 16,6%
Sex: Male 6,5% 87,2% 6,3% 38,1% 48,1% 13,7% 56,1% 23,4% 20,4% 66,1% 19,7% 14,2%
Female 6,1% 85,8% 8,1% 35,3% 49,3% 15,4% 52,1% 19,5% 28,4% 64,9% 16,6% 18,5%
Age:
18-34 years old 6,3% 83,4% 10,3% 27,0% 58,5% 14,5% 46,1% 26,4% 27,5% 57,7% 23,0% 19,3%
35-49 years old 8,0% 86,0% 6,1% 42,1% 45,0% 12,9% 56,4% 19,0% 24,6% 72,2% 12,2% 15,6%
50+ years old 5,3% 89,4% 5,3% 41,9% 42,4% 15,7% 59,5% 18,0% 22,5% 68,4% 16,9% 14,7%
Level of
education:
Low 5,0% 85,8% 9,2% 34,9% 40,1% 25,0% 51,4% 18,5% 30,1% 61,5% 17,9% 20,6%
Medium 7,0% 86,7% 6,3% 41,5% 47,0% 11,5% 57,3% 20,3% 22,4% 70,3% 17,0% 12,6%
High 6,0% 86,5% 7,4% 30,2% 58,1% 11,7% 50,7% 24,8% 24,5% 60,8% 19,6% 19,6%
Social and
economic
level:
Low 3,6% 87,5% 8,9% 45,3% 34,5% 20,3% 58,6% 14,9% 26,5% 69,4% 12,1% 18,6%
Average 6,9% 85,7% 7,4% 37,3% 47,2% 15,5% 53,8% 21,2% 25,0% 64,3% 18,3% 17,4%
High 7,7% 86,3% 6,0% 29,6% 60,8% 9,6% 50,6% 26,1% 23,4% 63,5% 22,2% 14,4%
Residence: Urban 7,4% 86,2% 6,4% 40,2% 48,8% 11,0% 59,1% 21,4% 19,4% 70,2% 16,3% 13,5%
Rural 5,3% 86,6% 8,1% 33,5% 48,8% 17,7% 49,5% 21,2% 29,3% 61,4% 19,4% 19,2%
Spoken
language:
Romanian 6,2% 85,7% 8,1% 28,7% 56,3% 15,0% 48,2% 25,1% 26,8% 59,9% 21,7% 18,5%
Russian or other 6,6% 88,9% 4,6% 63,7% 22,9% 13,4% 73,8% 8,2% 18,0% 84,6% 5,3% 10,0%
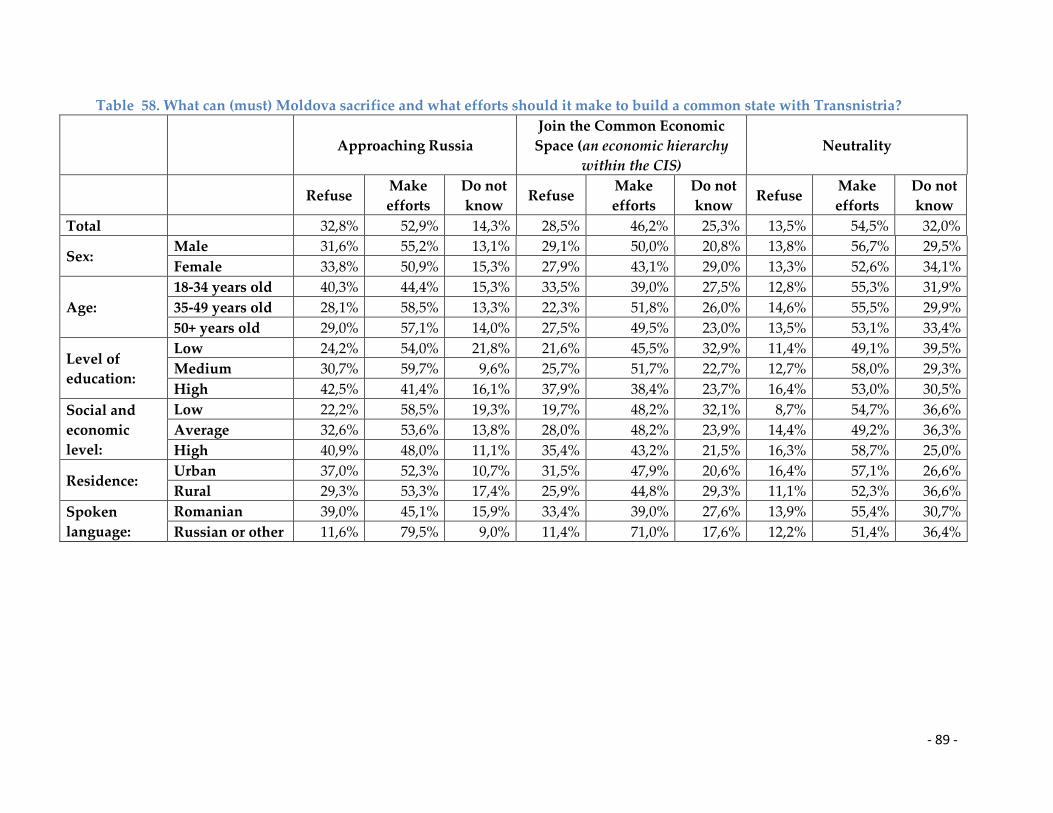
- 89 -
Table 58. What can (must) Moldova sacrifice and what efforts should it make to build a common state with Transnistria?
Approaching Russia
Join the Common Economic
Space (an economic hierarchy
within the CIS)
Neutrality
Refuse
Make
efforts
Do not
know Refuse
Make
efforts
Do not
know Refuse
Make
efforts
Do not
know
Total 32,8% 52,9% 14,3% 28,5% 46,2% 25,3% 13,5% 54,5% 32,0%
Sex: Male 31,6% 55,2% 13,1% 29,1% 50,0% 20,8% 13,8% 56,7% 29,5%
Female 33,8% 50,9% 15,3% 27,9% 43,1% 29,0% 13,3% 52,6% 34,1%
Age:
18-34 years old 40,3% 44,4% 15,3% 33,5% 39,0% 27,5% 12,8% 55,3% 31,9%
35-49 years old 28,1% 58,5% 13,3% 22,3% 51,8% 26,0% 14,6% 55,5% 29,9%
50+ years old 29,0% 57,1% 14,0% 27,5% 49,5% 23,0% 13,5% 53,1% 33,4%
Level of
education:
Low 24,2% 54,0% 21,8% 21,6% 45,5% 32,9% 11,4% 49,1% 39,5%
Medium 30,7% 59,7% 9,6% 25,7% 51,7% 22,7% 12,7% 58,0% 29,3%
High 42,5% 41,4% 16,1% 37,9% 38,4% 23,7% 16,4% 53,0% 30,5%
Social and
economic
level:
Low 22,2% 58,5% 19,3% 19,7% 48,2% 32,1% 8,7% 54,7% 36,6%
Average 32,6% 53,6% 13,8% 28,0% 48,2% 23,9% 14,4% 49,2% 36,3%
High 40,9% 48,0% 11,1% 35,4% 43,2% 21,5% 16,3% 58,7% 25,0%
Residence: Urban 37,0% 52,3% 10,7% 31,5% 47,9% 20,6% 16,4% 57,1% 26,6%
Rural 29,3% 53,3% 17,4% 25,9% 44,8% 29,3% 11,1% 52,3% 36,6%
Spoken
language:
Romanian 39,0% 45,1% 15,9% 33,4% 39,0% 27,6% 13,9% 55,4% 30,7%
Russian or other 11,6% 79,5% 9,0% 11,4% 71,0% 17,6% 12,2% 51,4% 36,4%

- 90 -
Table 59. Tell me please if you agree that Transnistria has the following....
Its own state symbols Constitution
Fully
agree Agree
Do not
quite
agree
Do not
agree at
all
Do not
know/refuse
to answer
Fully
agree Agree
Do not
quite
agree
Do not
agree at all
Do not
know/refuse
to answer
Total 8,9% 23,5% 20,6% 37,6% 9,5% 7,4% 17,4% 23,5% 42,1% 9,6%
Sex: Male 9,0% 25,3% 18,2% 39,0% 8,4% 8,0% 18,2% 21,8% 43,7% 8,2%
Female 8,8% 21,9% 22,6% 36,4% 10,4% 6,9% 16,7% 24,9% 40,8% 10,7%
Age:
18-34 years old 7,6% 25,7% 21,9% 36,0% 8,7% 6,1% 17,1% 26,8% 40,5% 9,4%
35-49 years old 13,3% 23,2% 17,1% 37,8% 8,6% 10,7% 18,5% 20,0% 43,3% 7,5%
50+ years old 7,4% 21,7% 21,4% 38,8% 10,7% 6,6% 17,0% 22,7% 42,7% 10,9%
Level of
education:
Low 8,0% 23,8% 18,5% 35,9% 13,8% 6,8% 18,8% 21,5% 38,9% 14,1%
Medium 10,9% 24,0% 20,7% 37,0% 7,3% 9,0% 17,7% 23,4% 42,2% 7,7%
High 6,4% 22,4% 22,0% 39,6% 9,6% 5,5% 15,9% 25,3% 44,2% 9,1%
Social and
economic
level:
Low 11,9% 20,9% 16,7% 34,0% 16,5% 11,2% 15,2% 19,8% 37,5% 16,2%
Average 9,5% 25,4% 21,7% 37,0% 6,5% 7,4% 22,1% 23,4% 40,7% 6,5%
High 6,2% 23,8% 22,6% 40,7% 6,8% 4,6% 15,1% 26,5% 46,6% 7,2%
Residence: Urban 7,8% 30,7% 20,6% 34,4% 6,5% 6,4% 19,8% 27,3% 39,6% 6,9%
Rural 9,8% 17,3% 20,6% 40,3% 12,0% 8,3% 15,3% 20,4% 44,2% 11,8%
Spoken
language:
Romanian 5,7% 19,5% 20,4% 44,0% 10,3% 4,7% 13,7% 22,5% 48,6% 10,5%
Russian or other 19,8% 37,0% 21,2% 15,3% 6,6% 16,6% 30,1% 27,2% 19,8% 6,4%
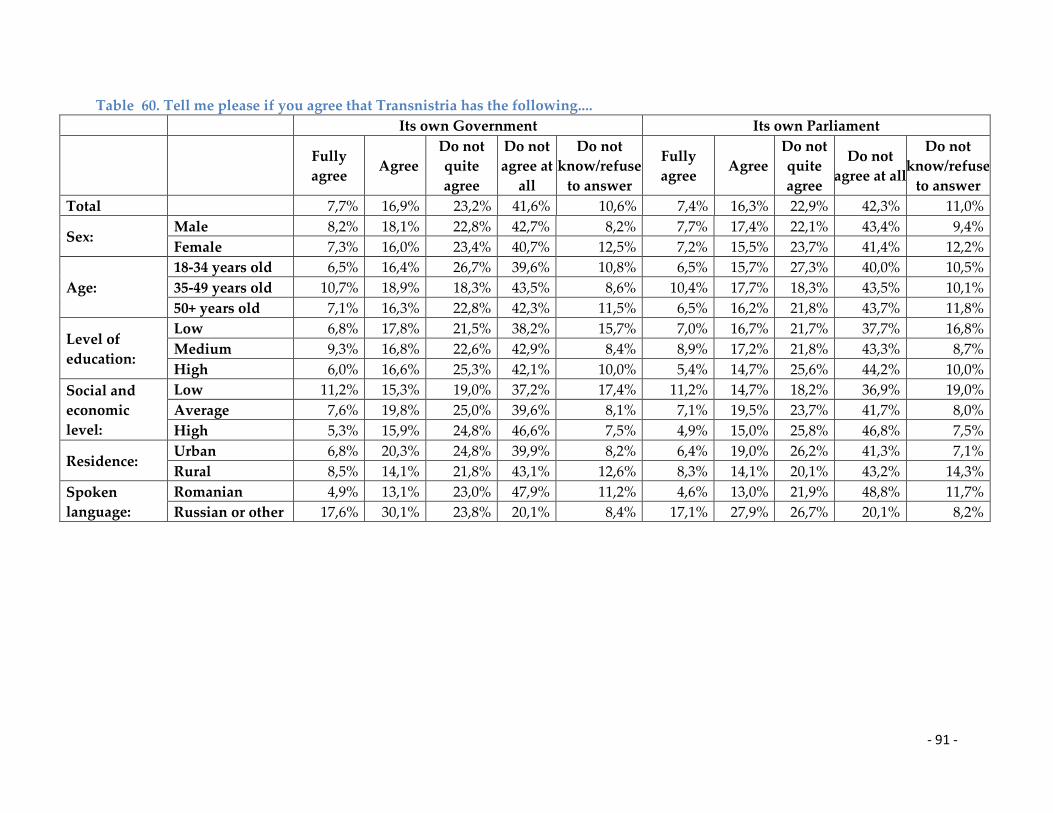
- 91 -
Table 60. Tell me please if you agree that Transnistria has the following....
Its own Government Its own Parliament
Fully
agree Agree
Do not
quite
agree
Do not
agree at
all
Do not
know/refuse
to answer
Fully
agree Agree
Do not
quite
agree
Do not
agree at all
Do not
know/refuse
to answer
Total 7,7% 16,9% 23,2% 41,6% 10,6% 7,4% 16,3% 22,9% 42,3% 11,0%
Sex: Male 8,2% 18,1% 22,8% 42,7% 8,2% 7,7% 17,4% 22,1% 43,4% 9,4%
Female 7,3% 16,0% 23,4% 40,7% 12,5% 7,2% 15,5% 23,7% 41,4% 12,2%
Age:
18-34 years old 6,5% 16,4% 26,7% 39,6% 10,8% 6,5% 15,7% 27,3% 40,0% 10,5%
35-49 years old 10,7% 18,9% 18,3% 43,5% 8,6% 10,4% 17,7% 18,3% 43,5% 10,1%
50+ years old 7,1% 16,3% 22,8% 42,3% 11,5% 6,5% 16,2% 21,8% 43,7% 11,8%
Level of
education:
Low 6,8% 17,8% 21,5% 38,2% 15,7% 7,0% 16,7% 21,7% 37,7% 16,8%
Medium 9,3% 16,8% 22,6% 42,9% 8,4% 8,9% 17,2% 21,8% 43,3% 8,7%
High 6,0% 16,6% 25,3% 42,1% 10,0% 5,4% 14,7% 25,6% 44,2% 10,0%
Social and
economic
level:
Low 11,2% 15,3% 19,0% 37,2% 17,4% 11,2% 14,7% 18,2% 36,9% 19,0%
Average 7,6% 19,8% 25,0% 39,6% 8,1% 7,1% 19,5% 23,7% 41,7% 8,0%
High 5,3% 15,9% 24,8% 46,6% 7,5% 4,9% 15,0% 25,8% 46,8% 7,5%
Residence: Urban 6,8% 20,3% 24,8% 39,9% 8,2% 6,4% 19,0% 26,2% 41,3% 7,1%
Rural 8,5% 14,1% 21,8% 43,1% 12,6% 8,3% 14,1% 20,1% 43,2% 14,3%
Spoken
language:
Romanian 4,9% 13,1% 23,0% 47,9% 11,2% 4,6% 13,0% 21,9% 48,8% 11,7%
Russian or other 17,6% 30,1% 23,8% 20,1% 8,4% 17,1% 27,9% 26,7% 20,1% 8,2%
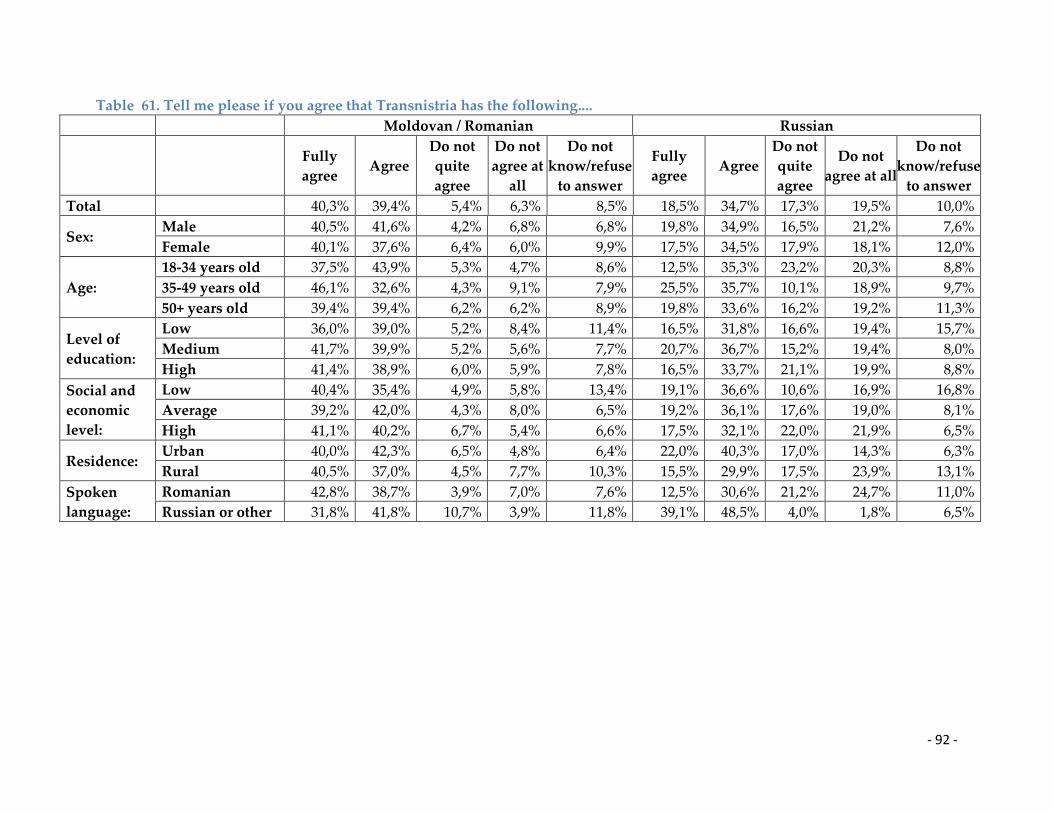
- 92 -
Table 61. Tell me please if you agree that Transnistria has the following....
Moldovan / Romanian Russian
Fully
agree Agree
Do not
quite
agree
Do not
agree at
all
Do not
know/refuse
to answer
Fully
agree Agree
Do not
quite
agree
Do not
agree at all
Do not
know/refuse
to answer
Total 40,3% 39,4% 5,4% 6,3% 8,5% 18,5% 34,7% 17,3% 19,5% 10,0%
Sex: Male 40,5% 41,6% 4,2% 6,8% 6,8% 19,8% 34,9% 16,5% 21,2% 7,6%
Female 40,1% 37,6% 6,4% 6,0% 9,9% 17,5% 34,5% 17,9% 18,1% 12,0%
Age:
18-34 years old 37,5% 43,9% 5,3% 4,7% 8,6% 12,5% 35,3% 23,2% 20,3% 8,8%
35-49 years old 46,1% 32,6% 4,3% 9,1% 7,9% 25,5% 35,7% 10,1% 18,9% 9,7%
50+ years old 39,4% 39,4% 6,2% 6,2% 8,9% 19,8% 33,6% 16,2% 19,2% 11,3%
Level of
education:
Low 36,0% 39,0% 5,2% 8,4% 11,4% 16,5% 31,8% 16,6% 19,4% 15,7%
Medium 41,7% 39,9% 5,2% 5,6% 7,7% 20,7% 36,7% 15,2% 19,4% 8,0%
High 41,4% 38,9% 6,0% 5,9% 7,8% 16,5% 33,7% 21,1% 19,9% 8,8%
Social and
economic
level:
Low 40,4% 35,4% 4,9% 5,8% 13,4% 19,1% 36,6% 10,6% 16,9% 16,8%
Average 39,2% 42,0% 4,3% 8,0% 6,5% 19,2% 36,1% 17,6% 19,0% 8,1%
High 41,1% 40,2% 6,7% 5,4% 6,6% 17,5% 32,1% 22,0% 21,9% 6,5%
Residence: Urban 40,0% 42,3% 6,5% 4,8% 6,4% 22,0% 40,3% 17,0% 14,3% 6,3%
Rural 40,5% 37,0% 4,5% 7,7% 10,3% 15,5% 29,9% 17,5% 23,9% 13,1%
Spoken
language:
Romanian 42,8% 38,7% 3,9% 7,0% 7,6% 12,5% 30,6% 21,2% 24,7% 11,0%
Russian or other 31,8% 41,8% 10,7% 3,9% 11,8% 39,1% 48,5% 4,0% 1,8% 6,5%

- 93 -
Table 62. Tell me please if you agree that Transnistria has the following....
Ukrainian
Fully
agree Agree
Do not
quite
agree
Do not
agree at
all
Do not
know/refuse
to answer
Total 5,1% 11,1% 25,3% 41,2% 17,2%
Sex: Male 5,7% 11,3% 25,6% 42,4% 15,0%
Female 4,7% 11,0% 25,1% 40,3% 18,9%
Age:
18-34 years old 4,6% 11,8% 27,8% 38,8% 17,0%
35-49 years old 4,9% 10,4% 21,8% 46,7% 16,2%
50+ years old 5,7% 11,1% 25,2% 40,2% 17,8%
Level of education:
Low 4,3% 6,4% 23,9% 43,8% 21,5%
Medium 5,8% 12,6% 24,1% 41,2% 16,3%
High 4,7% 12,5% 28,2% 39,4% 15,2%
Social and
economic level:
Low 6,0% 10,0% 19,1% 39,3% 25,6%
Average 4,5% 10,4% 26,6% 44,0% 14,5%
High 5,0% 12,6% 28,9% 40,4% 13,1%
Residence: Urban 6,3% 15,5% 28,0% 36,8% 13,4%
Rural 4,1% 7,5% 23,1% 45,0% 20,3%
Spoken language: Romanian 4,6% 7,7% 25,3% 44,8% 17,4%
Russian or other 6,9% 22,9% 25,2% 28,9% 16,2%

- 94 -
Table 63. Tell me please if you agree that Transnistria should solve its problems related to.... independently, as stipulated in the
Constitution of the Republic of Moldova?
Legal development Economic development
Fully
agree Agree
Do not
quite
agree
Do not
agree at
all
Do not
know/refuse
to answer
Fully
agree Agree
Do not
quite
agree
Do not
agree at all
Do not
know/refuse
to answer
Total 8,4% 27,3% 25,4% 23,7% 15,2% 10,3% 31,0% 21,4% 22,5% 14,8%
Sex: Male 7,1% 28,5% 23,7% 26,7% 14,0% 9,1% 32,0% 21,1% 24,3% 13,5%
Female 9,5% 26,3% 26,8% 21,2% 16,2% 11,3% 30,2% 21,6% 21,0% 15,9%
Age:
18-34 years old 5,2% 32,6% 27,9% 21,5% 12,8% 8,4% 35,6% 24,7% 19,1% 12,2%
35-49 years old 11,5% 21,9% 27,8% 24,8% 14,1% 12,5% 25,2% 22,0% 24,8% 15,5%
50+ years old 9,5% 25,7% 22,0% 24,9% 17,9% 10,7% 30,4% 18,0% 24,2% 16,8%
Level of
education:
Low 5,4% 23,0% 27,2% 23,7% 20,8% 5,9% 22,9% 23,8% 25,3% 22,1%
Medium 10,1% 29,0% 23,9% 22,0% 15,0% 11,6% 34,7% 19,2% 20,6% 13,8%
High 8,2% 27,8% 26,5% 26,3% 11,3% 11,5% 31,4% 22,9% 23,3% 11,0%
Social and
economic
level:
Low 10,8% 21,5% 23,7% 20,4% 23,6% 11,6% 23,2% 19,8% 22,0% 23,4%
Average 7,9% 28,5% 24,8% 25,0% 13,7% 9,8% 33,6% 20,5% 23,0% 13,1%
High 7,1% 30,5% 27,3% 24,9% 10,1% 9,8% 34,7% 23,2% 22,5% 9,8%
Residence: Urban 8,2% 33,4% 23,2% 22,4% 12,7% 11,2% 38,4% 18,6% 19,7% 12,0%
Rural 8,6% 22,0% 27,3% 24,8% 17,2% 9,5% 24,8% 23,7% 24,8% 17,2%
Spoken
language:
Romanian 6,4% 23,1% 26,8% 28,0% 15,8% 8,6% 26,5% 22,4% 26,6% 15,9%
Russian or other 15,6% 41,7% 20,8% 8,9% 12,9% 16,3% 46,4% 17,7% 8,4% 11,2%
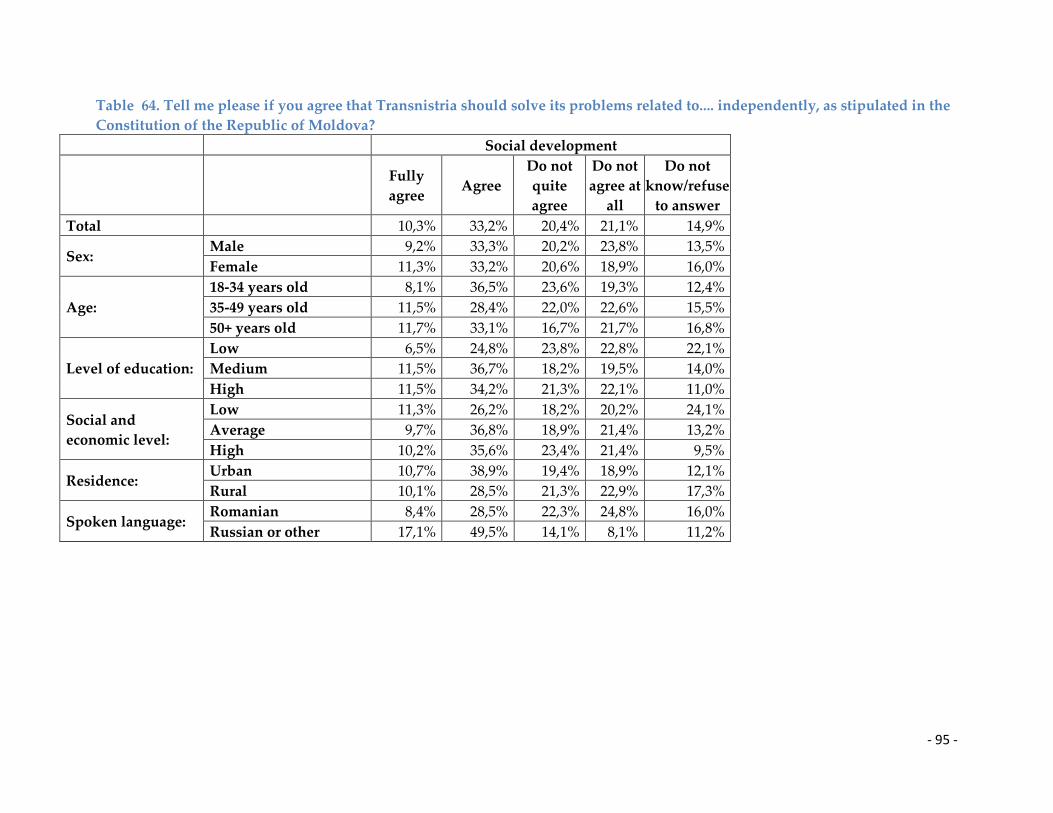
- 95 -
Table 64. Tell me please if you agree that Transnistria should solve its problems related to.... independently, as stipulated in the
Constitution of the Republic of Moldova?
Social development
Fully
agree Agree
Do not
quite
agree
Do not
agree at
all
Do not
know/refuse
to answer
Total 10,3% 33,2% 20,4% 21,1% 14,9%
Sex: Male 9,2% 33,3% 20,2% 23,8% 13,5%
Female 11,3% 33,2% 20,6% 18,9% 16,0%
Age:
18-34 years old 8,1% 36,5% 23,6% 19,3% 12,4%
35-49 years old 11,5% 28,4% 22,0% 22,6% 15,5%
50+ years old 11,7% 33,1% 16,7% 21,7% 16,8%
Level of education:
Low 6,5% 24,8% 23,8% 22,8% 22,1%
Medium 11,5% 36,7% 18,2% 19,5% 14,0%
High 11,5% 34,2% 21,3% 22,1% 11,0%
Social and
economic level:
Low 11,3% 26,2% 18,2% 20,2% 24,1%
Average 9,7% 36,8% 18,9% 21,4% 13,2%
High 10,2% 35,6% 23,4% 21,4% 9,5%
Residence: Urban 10,7% 38,9% 19,4% 18,9% 12,1%
Rural 10,1% 28,5% 21,3% 22,9% 17,3%
Spoken language: Romanian 8,4% 28,5% 22,3% 24,8% 16,0%
Russian or other 17,1% 49,5% 14,1% 8,1% 11,2%
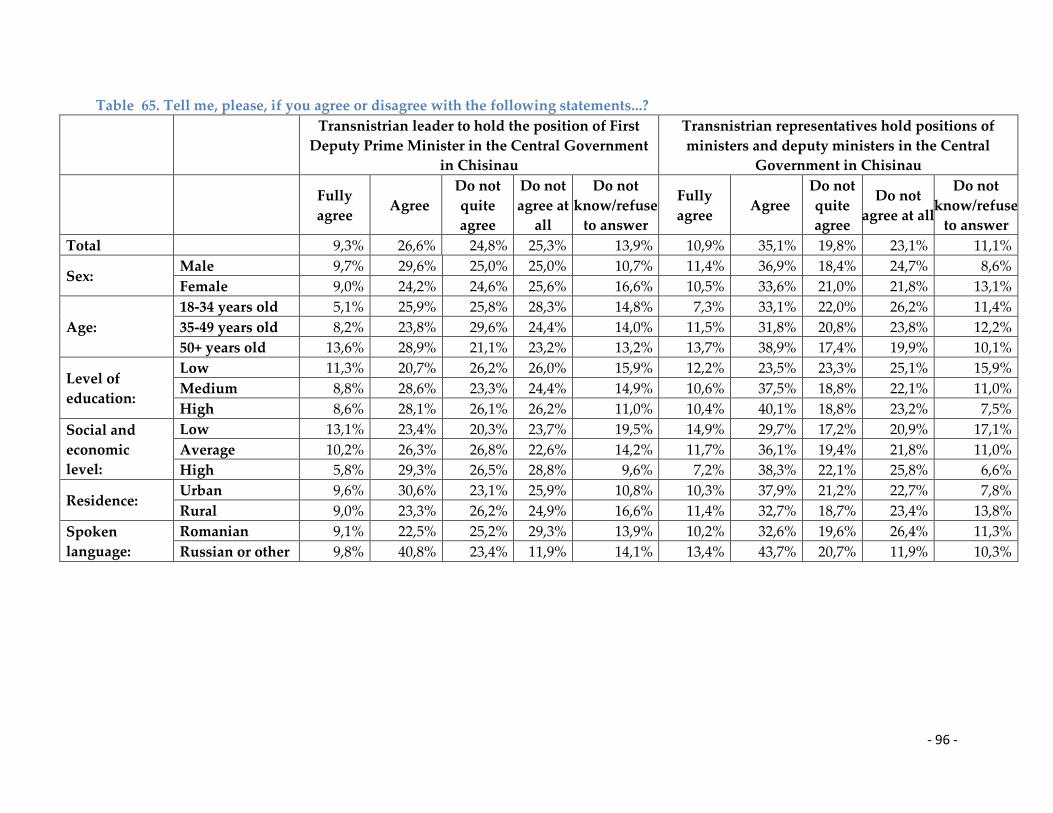
- 96 -
Table 65. Tell me, please, if you agree or disagree with the following statements...?
Transnistrian leader to hold the position of First
Deputy Prime Minister in the Central Government
in Chisinau
Transnistrian representatives hold positions of
ministers and deputy ministers in the Central
Government in Chisinau
Fully
agree Agree
Do not
quite
agree
Do not
agree at
all
Do not
know/refuse
to answer
Fully
agree Agree
Do not
quite
agree
Do not
agree at all
Do not
know/refuse
to answer
Total 9,3% 26,6% 24,8% 25,3% 13,9% 10,9% 35,1% 19,8% 23,1% 11,1%
Sex: Male 9,7% 29,6% 25,0% 25,0% 10,7% 11,4% 36,9% 18,4% 24,7% 8,6%
Female 9,0% 24,2% 24,6% 25,6% 16,6% 10,5% 33,6% 21,0% 21,8% 13,1%
Age:
18-34 years old 5,1% 25,9% 25,8% 28,3% 14,8% 7,3% 33,1% 22,0% 26,2% 11,4%
35-49 years old 8,2% 23,8% 29,6% 24,4% 14,0% 11,5% 31,8% 20,8% 23,8% 12,2%
50+ years old 13,6% 28,9% 21,1% 23,2% 13,2% 13,7% 38,9% 17,4% 19,9% 10,1%
Level of
education:
Low 11,3% 20,7% 26,2% 26,0% 15,9% 12,2% 23,5% 23,3% 25,1% 15,9%
Medium 8,8% 28,6% 23,3% 24,4% 14,9% 10,6% 37,5% 18,8% 22,1% 11,0%
High 8,6% 28,1% 26,1% 26,2% 11,0% 10,4% 40,1% 18,8% 23,2% 7,5%
Social and
economic
level:
Low 13,1% 23,4% 20,3% 23,7% 19,5% 14,9% 29,7% 17,2% 20,9% 17,1%
Average 10,2% 26,3% 26,8% 22,6% 14,2% 11,7% 36,1% 19,4% 21,8% 11,0%
High 5,8% 29,3% 26,5% 28,8% 9,6% 7,2% 38,3% 22,1% 25,8% 6,6%
Residence: Urban 9,6% 30,6% 23,1% 25,9% 10,8% 10,3% 37,9% 21,2% 22,7% 7,8%
Rural 9,0% 23,3% 26,2% 24,9% 16,6% 11,4% 32,7% 18,7% 23,4% 13,8%
Spoken
language:
Romanian 9,1% 22,5% 25,2% 29,3% 13,9% 10,2% 32,6% 19,6% 26,4% 11,3%
Russian or other 9,8% 40,8% 23,4% 11,9% 14,1% 13,4% 43,7% 20,7% 11,9% 10,3%
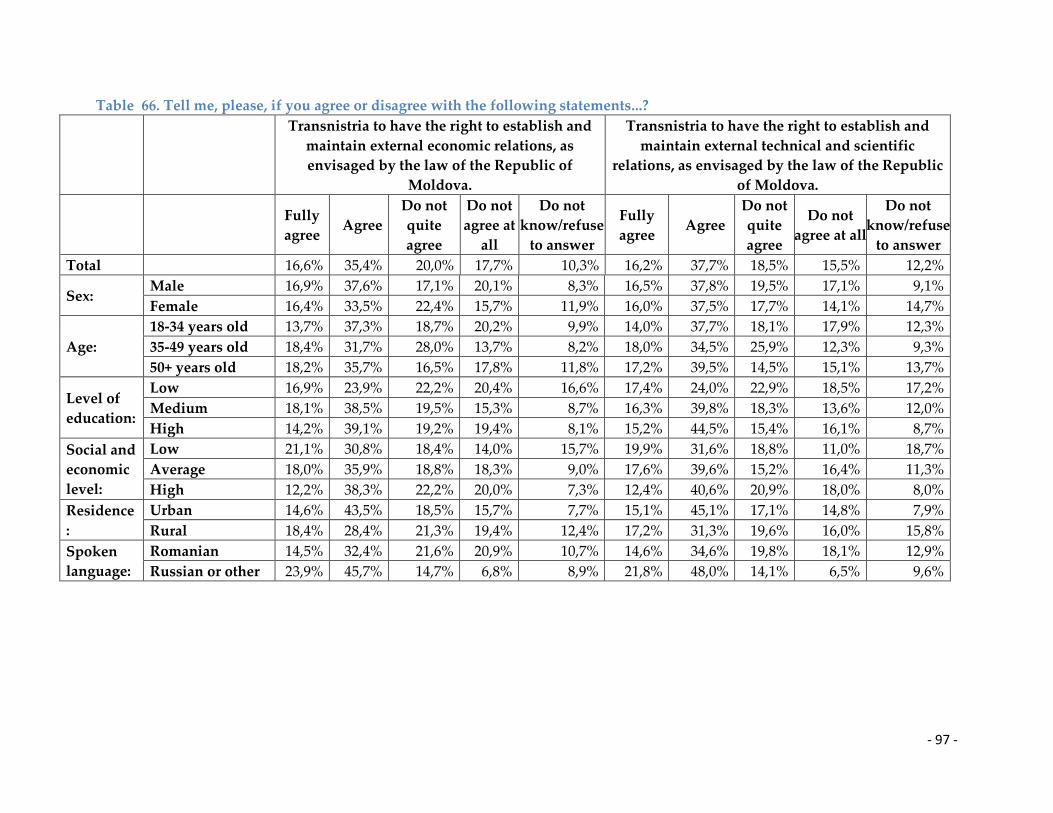
- 97 -
Table 66. Tell me, please, if you agree or disagree with the following statements...?
Transnistria to have the right to establish and
maintain external economic relations, as
envisaged by the law of the Republic of
Moldova.
Transnistria to have the right to establish and
maintain external technical and scientific
relations, as envisaged by the law of the Republic
of Moldova.
Fully
agree Agree
Do not
quite
agree
Do not
agree at
all
Do not
know/refuse
to answer
Fully
agree Agree
Do not
quite
agree
Do not
agree at all
Do not
know/refuse
to answer
Total 16,6% 35,4% 20,0% 17,7% 10,3% 16,2% 37,7% 18,5% 15,5% 12,2%
Sex: Male 16,9% 37,6% 17,1% 20,1% 8,3% 16,5% 37,8% 19,5% 17,1% 9,1%
Female 16,4% 33,5% 22,4% 15,7% 11,9% 16,0% 37,5% 17,7% 14,1% 14,7%
Age:
18-34 years old 13,7% 37,3% 18,7% 20,2% 9,9% 14,0% 37,7% 18,1% 17,9% 12,3%
35-49 years old 18,4% 31,7% 28,0% 13,7% 8,2% 18,0% 34,5% 25,9% 12,3% 9,3%
50+ years old 18,2% 35,7% 16,5% 17,8% 11,8% 17,2% 39,5% 14,5% 15,1% 13,7%
Level of
education:
Low 16,9% 23,9% 22,2% 20,4% 16,6% 17,4% 24,0% 22,9% 18,5% 17,2%
Medium 18,1% 38,5% 19,5% 15,3% 8,7% 16,3% 39,8% 18,3% 13,6% 12,0%
High 14,2% 39,1% 19,2% 19,4% 8,1% 15,2% 44,5% 15,4% 16,1% 8,7%
Social and
economic
level:
Low 21,1% 30,8% 18,4% 14,0% 15,7% 19,9% 31,6% 18,8% 11,0% 18,7%
Average 18,0% 35,9% 18,8% 18,3% 9,0% 17,6% 39,6% 15,2% 16,4% 11,3%
High 12,2% 38,3% 22,2% 20,0% 7,3% 12,4% 40,6% 20,9% 18,0% 8,0%
Residence
:
Urban 14,6% 43,5% 18,5% 15,7% 7,7% 15,1% 45,1% 17,1% 14,8% 7,9%
Rural 18,4% 28,4% 21,3% 19,4% 12,4% 17,2% 31,3% 19,6% 16,0% 15,8%
Spoken
language:
Romanian 14,5% 32,4% 21,6% 20,9% 10,7% 14,6% 34,6% 19,8% 18,1% 12,9%
Russian or other 23,9% 45,7% 14,7% 6,8% 8,9% 21,8% 48,0% 14,1% 6,5% 9,6%
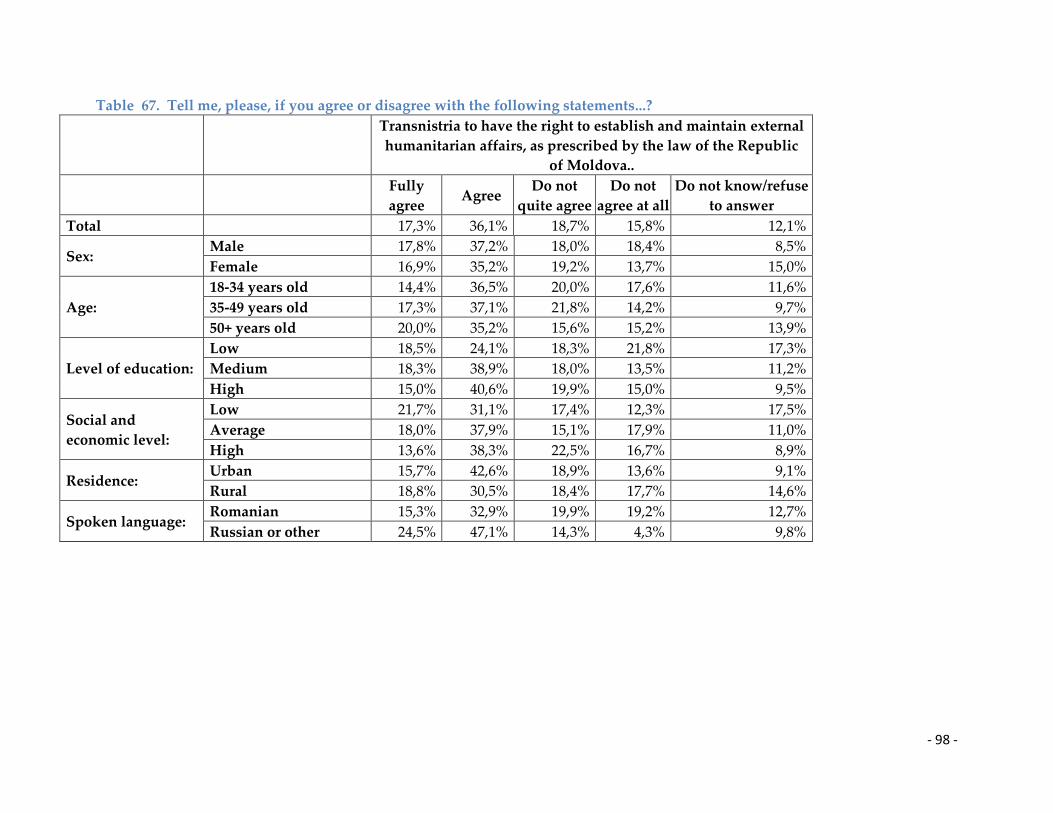
- 98 -
Table 67. Tell me, please, if you agree or disagree with the following statements...?
Transnistria to have the right to establish and maintain external
humanitarian affairs, as prescribed by the law of the Republic
of Moldova..
Fully
agree Agree
Do not
quite agree
Do not
agree at all
Do not know/refuse
to answer
Total 17,3% 36,1% 18,7% 15,8% 12,1%
Sex: Male 17,8% 37,2% 18,0% 18,4% 8,5%
Female 16,9% 35,2% 19,2% 13,7% 15,0%
Age:
18-34 years old 14,4% 36,5% 20,0% 17,6% 11,6%
35-49 years old 17,3% 37,1% 21,8% 14,2% 9,7%
50+ years old 20,0% 35,2% 15,6% 15,2% 13,9%
Level of education:
Low 18,5% 24,1% 18,3% 21,8% 17,3%
Medium 18,3% 38,9% 18,0% 13,5% 11,2%
High 15,0% 40,6% 19,9% 15,0% 9,5%
Social and
economic level:
Low 21,7% 31,1% 17,4% 12,3% 17,5%
Average 18,0% 37,9% 15,1% 17,9% 11,0%
High 13,6% 38,3% 22,5% 16,7% 8,9%
Residence: Urban 15,7% 42,6% 18,9% 13,6% 9,1%
Rural 18,8% 30,5% 18,4% 17,7% 14,6%
Spoken language: Romanian 15,3% 32,9% 19,9% 19,2% 12,7%
Russian or other 24,5% 47,1% 14,3% 4,3% 9,8%
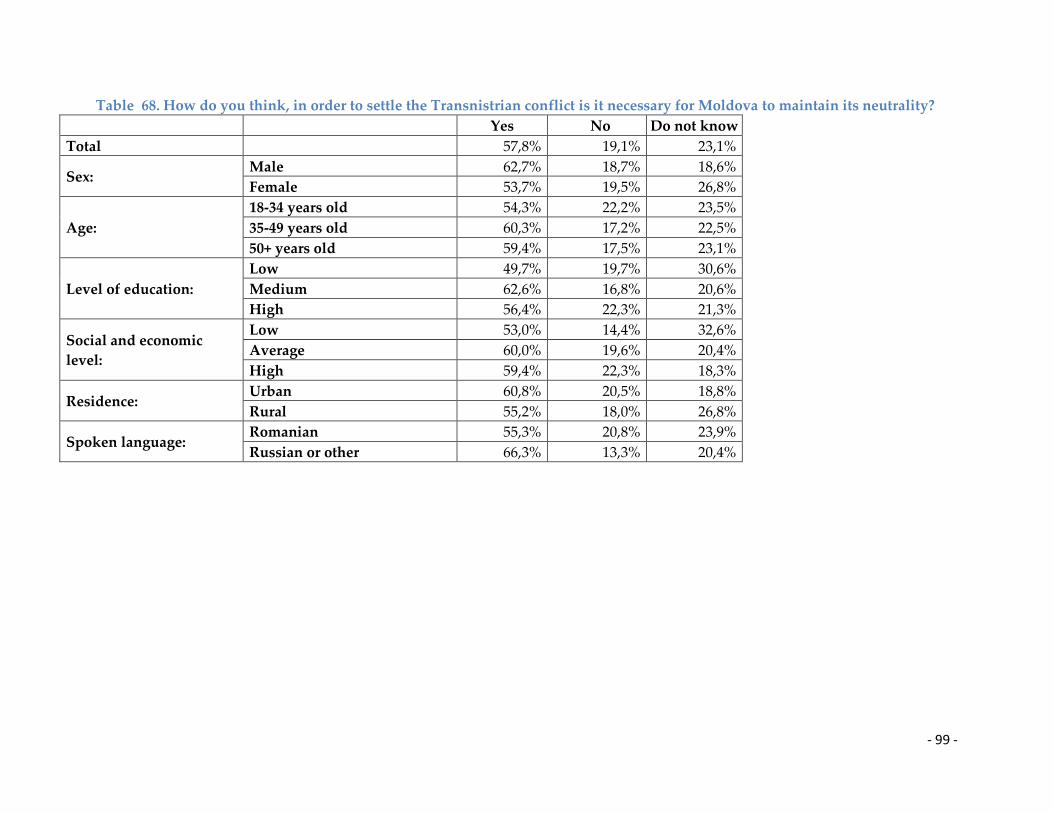
- 99 -
Table 68. How do you think, in order to settle the Transnistrian conflict is it necessary for Moldova to maintain its neutrality?
Yes No Do not know
Total 57,8% 19,1% 23,1%
Sex: Male 62,7% 18,7% 18,6%
Female 53,7% 19,5% 26,8%
Age:
18-34 years old 54,3% 22,2% 23,5%
35-49 years old 60,3% 17,2% 22,5%
50+ years old 59,4% 17,5% 23,1%
Level of education:
Low 49,7% 19,7% 30,6%
Medium 62,6% 16,8% 20,6%
High 56,4% 22,3% 21,3%
Social and economic
level:
Low 53,0% 14,4% 32,6%
Average 60,0% 19,6% 20,4%
High 59,4% 22,3% 18,3%
Residence: Urban 60,8% 20,5% 18,8%
Rural 55,2% 18,0% 26,8%
Spoken language: Romanian 55,3% 20,8% 23,9%
Russian or other 66,3% 13,3% 20,4%
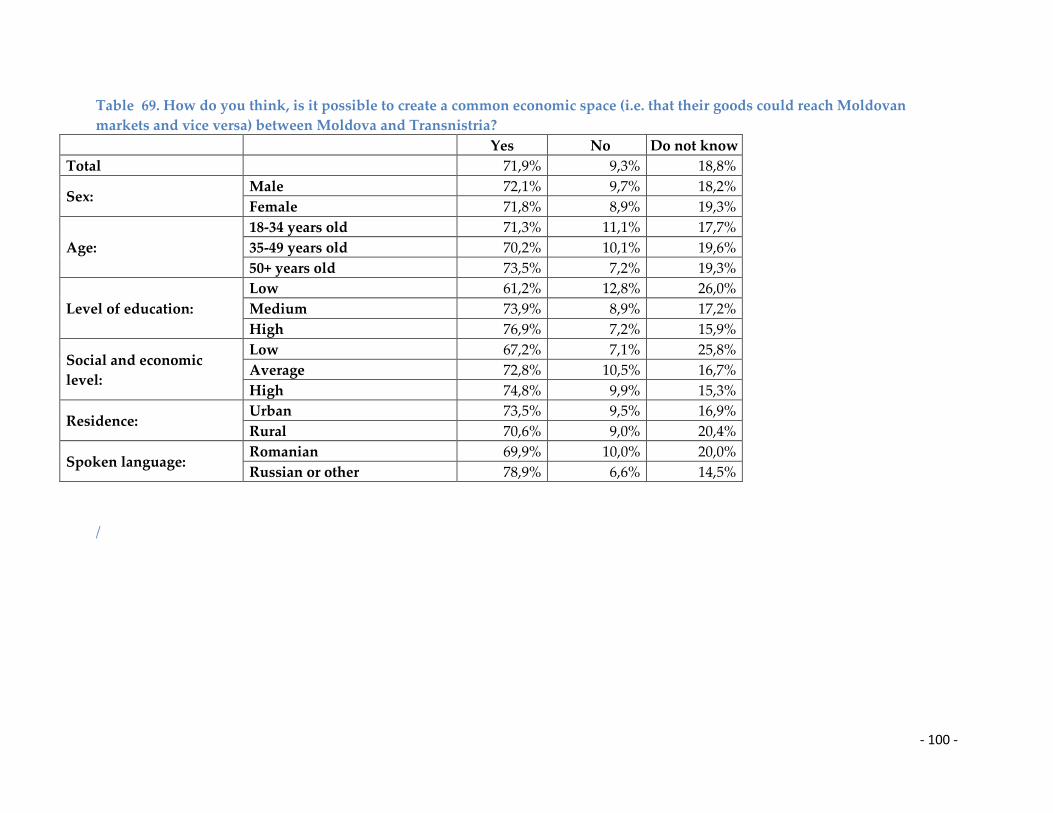
- 100 -
Table 69. How do you think, is it possible to create a common economic space (i.e. that their goods could reach Moldovan
markets and vice versa) between Moldova and Transnistria?
Yes No Do not know
Total 71,9% 9,3% 18,8%
Sex: Male 72,1% 9,7% 18,2%
Female 71,8% 8,9% 19,3%
Age:
18-34 years old 71,3% 11,1% 17,7%
35-49 years old 70,2% 10,1% 19,6%
50+ years old 73,5% 7,2% 19,3%
Level of education:
Low 61,2% 12,8% 26,0%
Medium 73,9% 8,9% 17,2%
High 76,9% 7,2% 15,9%
Social and economic
level:
Low 67,2% 7,1% 25,8%
Average 72,8% 10,5% 16,7%
High 74,8% 9,9% 15,3%
Residence: Urban 73,5% 9,5% 16,9%
Rural 70,6% 9,0% 20,4%
Spoken language: Romanian 69,9% 10,0% 20,0%
Russian or other 78,9% 6,6% 14,5%
/
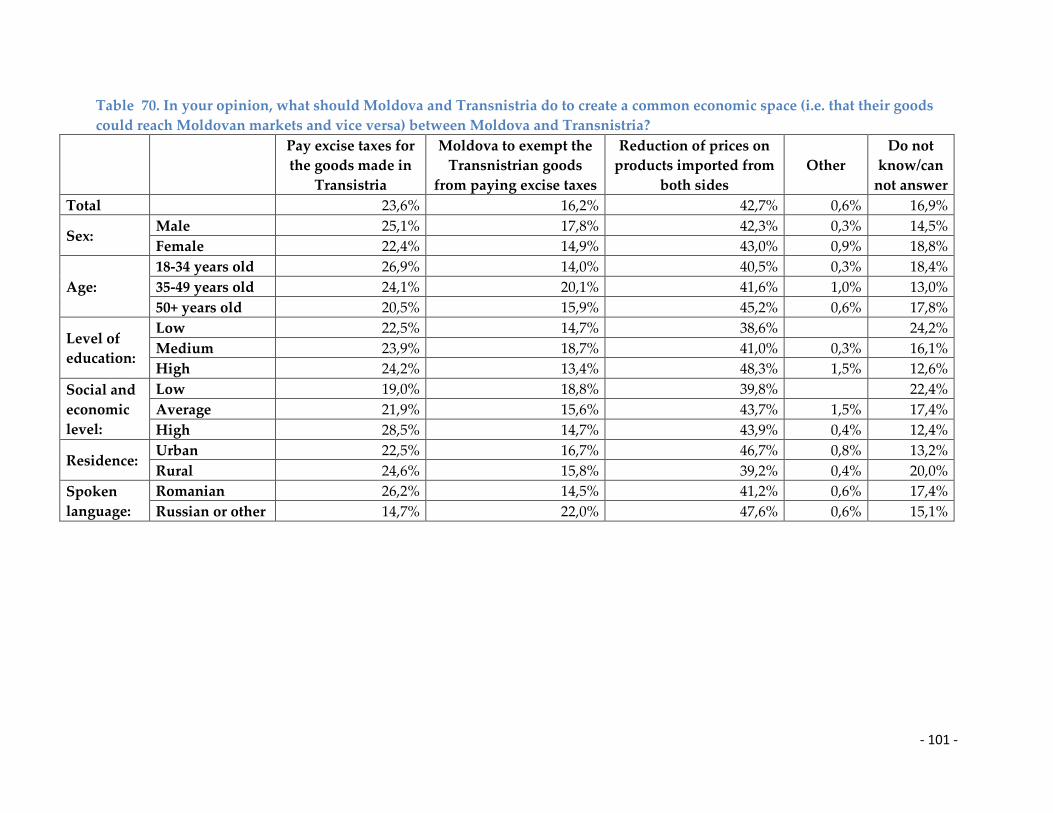
- 101 -
Table 70. In your opinion, what should Moldova and Transnistria do to create a common economic space (i.e. that their goods
could reach Moldovan markets and vice versa) between Moldova and Transnistria?
Pay excise taxes for
the goods made in
Transistria
Moldova to exempt the
Transnistrian goods
from paying excise taxes
Reduction of prices on
products imported from
both sides
Other
Do not
know/can
not answer
Total 23,6% 16,2% 42,7% 0,6% 16,9%
Sex: Male 25,1% 17,8% 42,3% 0,3% 14,5%
Female 22,4% 14,9% 43,0% 0,9% 18,8%
Age:
18-34 years old 26,9% 14,0% 40,5% 0,3% 18,4%
35-49 years old 24,1% 20,1% 41,6% 1,0% 13,0%
50+ years old 20,5% 15,9% 45,2% 0,6% 17,8%
Level of
education:
Low 22,5% 14,7% 38,6% 24,2%
Medium 23,9% 18,7% 41,0% 0,3% 16,1%
High 24,2% 13,4% 48,3% 1,5% 12,6%
Social and
economic
level:
Low 19,0% 18,8% 39,8% 22,4%
Average 21,9% 15,6% 43,7% 1,5% 17,4%
High 28,5% 14,7% 43,9% 0,4% 12,4%
Residence: Urban 22,5% 16,7% 46,7% 0,8% 13,2%
Rural 24,6% 15,8% 39,2% 0,4% 20,0%
Spoken
language:
Romanian 26,2% 14,5% 41,2% 0,6% 17,4%
Russian or other 14,7% 22,0% 47,6% 0,6% 15,1%

- 102 -
Table 71. How do you think, if this common economic space is created (i.e. that their goods could reach Moldovan markets and
vice versa) between Moldova and Transnistria, could it facilitate to find a political compromise to settlement the Transnistrian
conflict?
Yes No Do not know
Total 67,5% 11,0% 21,5%
Sex: Male 67,3% 11,4% 21,3%
Female 67,6% 10,7% 21,7%
Age:
18-34 years old 68,6% 9,3% 22,1%
35-49 years old 62,9% 13,4% 23,6%
50+ years old 69,1% 11,1% 19,8%
Level of education:
Low 58,0% 15,5% 26,5%
Medium 70,3% 9,7% 20,1%
High 70,2% 9,8% 20,1%
Social and economic
level:
Low 62,5% 11,6% 25,9%
Average 71,0% 10,3% 18,7%
High 68,3% 11,2% 20,6%
Residence: Urban 68,2% 11,4% 20,4%
Rural 66,8% 10,7% 22,5%
Spoken language: Romanian 65,8% 11,3% 22,9%
Russian or other 73,1% 10,2% 16,6%
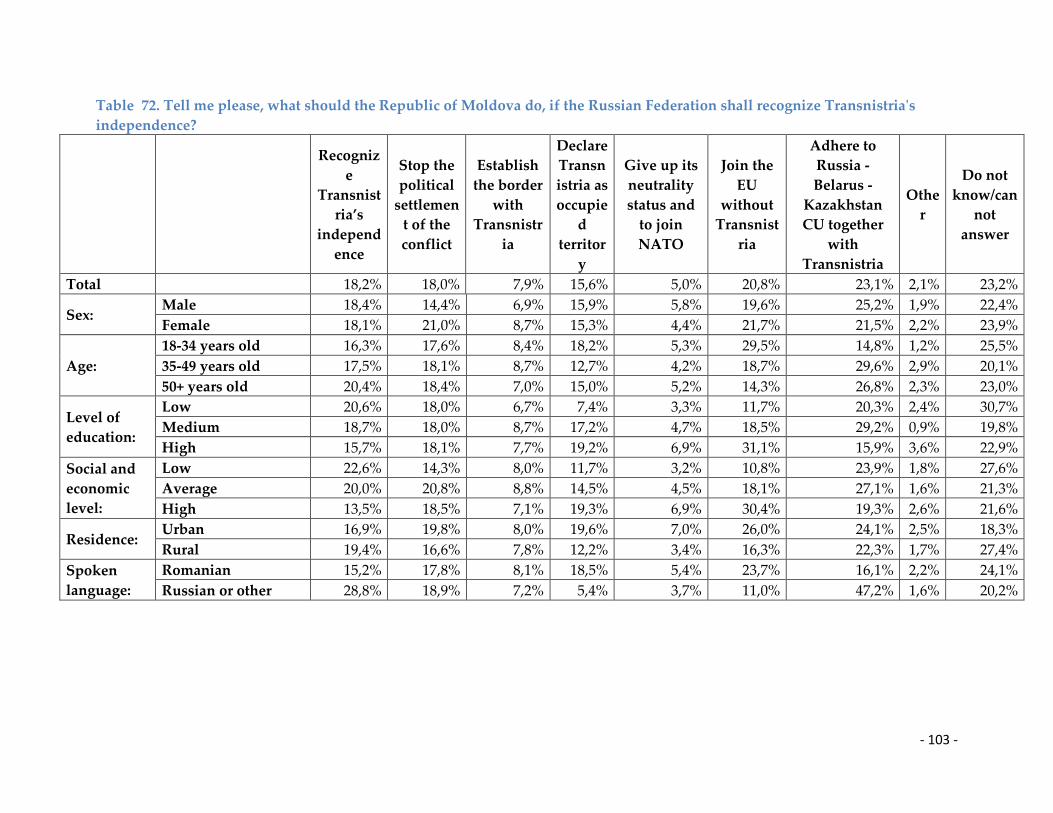
- 103 -
Table 72. Tell me please, what should the Republic of Moldova do, if the Russian Federation shall recognize Transnistria's
independence?
Recogniz
e
Transnist
ria’s
independ
ence
Stop the
political
settlemen
t of the
conflict
Establish
the border
with
Transnistr
ia
Declare
Transn
istria as
occupie
d
territor
y
Give up its
neutrality
status and
to join
NATO
Join the
EU
without
Transnist
ria
Adhere to
Russia -
Belarus -
Kazakhstan
CU together
with
Transnistria
Othe
r
Do not
know/can
not
answer
Total 18,2% 18,0% 7,9% 15,6% 5,0% 20,8% 23,1% 2,1% 23,2%
Sex: Male 18,4% 14,4% 6,9% 15,9% 5,8% 19,6% 25,2% 1,9% 22,4%
Female 18,1% 21,0% 8,7% 15,3% 4,4% 21,7% 21,5% 2,2% 23,9%
Age:
18-34 years old 16,3% 17,6% 8,4% 18,2% 5,3% 29,5% 14,8% 1,2% 25,5%
35-49 years old 17,5% 18,1% 8,7% 12,7% 4,2% 18,7% 29,6% 2,9% 20,1%
50+ years old 20,4% 18,4% 7,0% 15,0% 5,2% 14,3% 26,8% 2,3% 23,0%
Level of
education:
Low 20,6% 18,0% 6,7% 7,4% 3,3% 11,7% 20,3% 2,4% 30,7%
Medium 18,7% 18,0% 8,7% 17,2% 4,7% 18,5% 29,2% 0,9% 19,8%
High 15,7% 18,1% 7,7% 19,2% 6,9% 31,1% 15,9% 3,6% 22,9%
Social and
economic
level:
Low 22,6% 14,3% 8,0% 11,7% 3,2% 10,8% 23,9% 1,8% 27,6%
Average 20,0% 20,8% 8,8% 14,5% 4,5% 18,1% 27,1% 1,6% 21,3%
High 13,5% 18,5% 7,1% 19,3% 6,9% 30,4% 19,3% 2,6% 21,6%
Residence: Urban 16,9% 19,8% 8,0% 19,6% 7,0% 26,0% 24,1% 2,5% 18,3%
Rural 19,4% 16,6% 7,8% 12,2% 3,4% 16,3% 22,3% 1,7% 27,4%
Spoken
language:
Romanian 15,2% 17,8% 8,1% 18,5% 5,4% 23,7% 16,1% 2,2% 24,1%
Russian or other 28,8% 18,9% 7,2% 5,4% 3,7% 11,0% 47,2% 1,6% 20,2%