national student financial aid scheme (nsfas) sefako makgatho ... and national student financial aid...
TRANSCRIPT
Performance and Expenditure Review
National Student Financial Aid Scheme (NSFAS)
Final
February 2016
Research commissioned by the National Treasury
FINAL FEBRUARY 2016
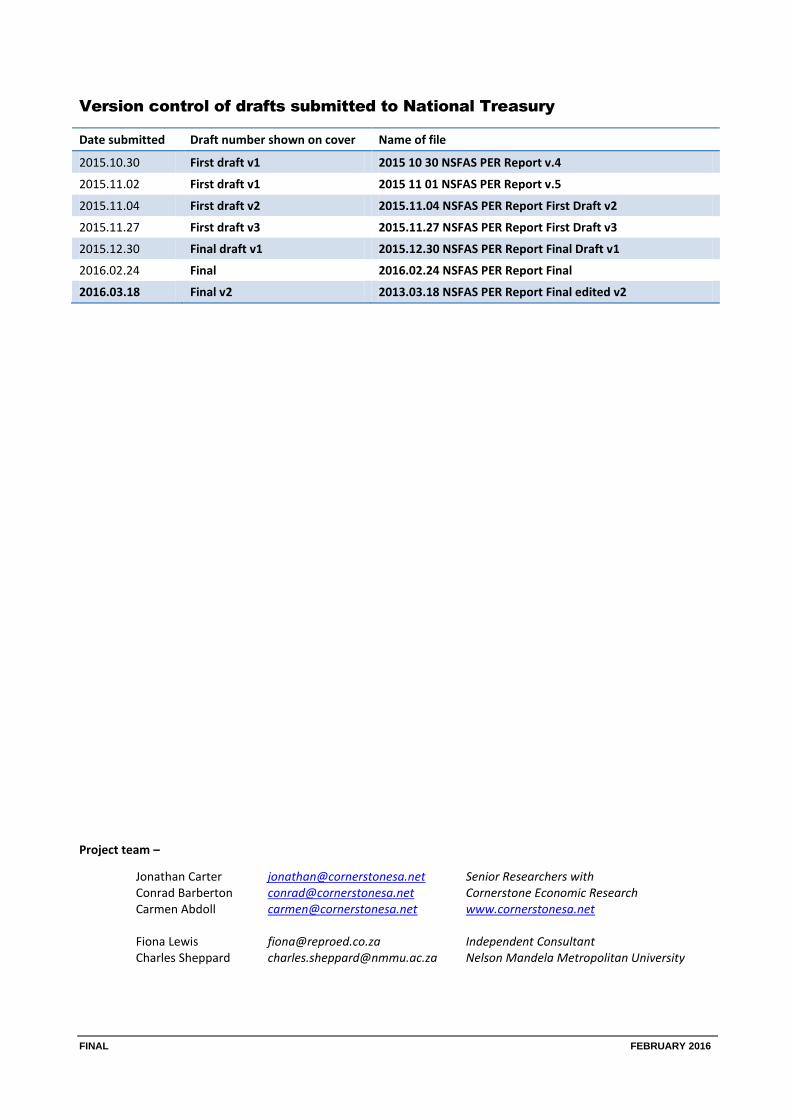
Version control of drafts submitted to National Treasury
Date submitted Draft number shown on cover Name of file
2015.10.30 First draft v1 2015 10 30 NSFAS PER Report v.4
2015.11.02 First draft v1 2015 11 01 NSFAS PER Report v.5
2015.11.04 First draft v2 2015.11.04 NSFAS PER Report First Draft v2
2015.11.27 First draft v3 2015.11.27 NSFAS PER Report First Draft v3
2015.12.30 Final draft v1 2015.12.30 NSFAS PER Report Final Draft v1
2016.02.24 Final 2016.02.24 NSFAS PER Report Final
2016.03.18 Final v2 2013.03.18 NSFAS PER Report Final edited v2
Project team –
Jonathan Carter [email protected] Senior Researchers with Conrad Barberton [email protected] Cornerstone Economic Research Carmen Abdoll [email protected] www.cornerstonesa.net Fiona Lewis [email protected] Independent Consultant Charles Sheppard [email protected] Nelson Mandela Metropolitan University
PER – NSFAS – Key PER Observations ~ A ~
FINAL FEBRUARY 2016
PER – NSFAS
FINAL FEBRUARY 2016
i
Table of Contents LIST OF ABBREVIATIONS ........................................................................................................................................... 1
1. INTRODUCTION ................................................................................................................................................ 3
1.1 TOPIC ................................................................................................................................................................ 3 1.2 PURPOSE AND SCOPE ............................................................................................................................................ 3 1.3 KEY QUESTIONS ................................................................................................................................................... 4 1.4 INFORMATION USED IN CONDUCTING THE REVIEW ...................................................................................................... 4 1.5 LIST OF DOCUMENTS THAT MAKE UP THE REVIEW ........................................................................................................ 4
2. FUNDING FRAMEWORK FOR HIGHER EDUCATION ........................................................................................... 4
2.1 THE IMPORTANCE OF NSFAS FUNDING TO UNIVERSITIES AND TVET COLLEGES ................................................................ 6 2.2 THE ROLE OF NSFAS IN THE HIGHER EDUCATION FUNDING FRAMEWORK ........................................................................ 7
3. OVERVIEW OF NSFAS OPERATIONS .................................................................................................................. 8
3.1 THE NATURE OF NSFAS OPERATIONS ....................................................................................................................... 9 3.1.1 Loans for undergraduate study at university (NSFAS loans) ..................................................................... 10 3.1.2 Grants for study at a TVET college ............................................................................................................ 11 3.1.3 Administration of other bursary/grant schemes ...................................................................................... 12 3.1.4 Shortcomings of the old NSFAS administrative system............................................................................. 13
3.2 THE NEW STUDENT CENTRED MODEL .................................................................................................................... 14 3.3 PROPOSALS AND RECENT POLICY DEVELOPMENTS REGARDING NSFAS .......................................................................... 15
4. NSFAS IN THE HIGHER EDUCATION CONTEXT ................................................................................................. 17
4.1 INCREASING ENROLMENT NUMBERS ....................................................................................................................... 18 4.1.1 University enrolment numbers.................................................................................................................. 18 4.1.2 TVET college enrolment numbers ............................................................................................................. 20
4.2 CHANGING ENROLMENTS IN THE DIFFERENT FIELDS OF STUDY ...................................................................................... 20 4.3 DROPOUT AND GRADUATION RATES ....................................................................................................................... 21
4.3.1 Overall dropout and graduation rates of university students ................................................................... 22 4.3.2 Dropout and graduation rates of university students by race and gender ............................................... 23 4.3.3 Dropout and graduation rates by university ............................................................................................. 24 4.3.4 Cohort studies of university students receiving NSFAS loans .................................................................... 25
4.4 FULL COST OF STUDY ........................................................................................................................................... 28
5. PROGRAMME ANALYSIS OF NSFAS PROCESSES .............................................................................................. 32
5.1 NSFAS MANAGEMENT PROCESSES ........................................................................................................................ 33 5.2 KEY FINDINGS OF THE PROGRAMME ANALYSIS .......................................................................................................... 35
6. FINANCIAL AND PERFORMANCE ANALYSIS OF NSFAS .................................................................................... 36
6.1 THE STRUCTURE OF NSFAS FINANCES AND FINANCIAL REPORTING ............................................................................... 36 6.2 NSFAS FUNDING SOURCES .................................................................................................................................. 39 6.3 NSFAS ADMINISTRATIVE INCOME AND EXPENDITURE ................................................................................................ 40 6.4 NSFAS ALLOCATION OF LOANS AND DISBURSEMENT OF GRANTS AND BURSARIES ............................................................ 42 6.5 FINANCIAL ANALYSIS OF THE NSFAS LOAN SCHEME .................................................................................................. 46
6.5.1 Adequacy of current funding for the NSFAS loan scheme ......................................................................... 47 6.5.2 The conversion of NSFAS loans to bursaries and the final year programme ............................................ 49 6.5.3 Performance of NSFAS loan recoveries ..................................................................................................... 50 6.5.4 The poor quality of NSFAS debt ................................................................................................................ 54
6.6 KEY FINDINGS FROM THE FINANCIAL ANALYSIS .......................................................................................................... 57
7. COSTING MODELS .......................................................................................................................................... 61
7.1 COSTING MODEL FOR NSFAS THE ENTITY ............................................................................................................... 61 7.2 COSTING MODEL OF NSFAS TVET GRANTS............................................................................................................. 63 7.3 COSTING MODEL FOR NSFAS UNIVERSITY LOANS ..................................................................................................... 64
7.3.1 Calibrating the models against reality ...................................................................................................... 65
PER – NSFAS
FINAL FEBRUARY 2016
ii
7.4 THE NSFAS LOAN COSTING MODEL – THE FULL AND COMPLICATED COSTING MODEL ..................................................... 65 7.5 THE NSFAS LOAN COSTING MODEL – CALIBRATING THE NDP SCENARIO ..................................................................... 69
7.5.1 Number of students eligible to receive NSFAS loans ................................................................................. 70 7.5.2 Dropout and graduation rates .................................................................................................................. 71 7.5.3 The value of loans awarded ...................................................................................................................... 71 7.5.4 NSFAS loan-to-bursary conversions .......................................................................................................... 73 7.5.5 NSFAS debtors repaying their loans .......................................................................................................... 73 7.5.6 Income tables for debt repayments .......................................................................................................... 74
7.6 THE NSFAS LOAN COSTING MODEL – NDP SCENARIO COSTING RESULTS ..................................................................... 75 7.7 EXPLORING THE IMPACT OF THREE KEY NSFAS VARIABLES .......................................................................................... 79
7.7.1 Increasing the rate of NSFAS loan repayments ......................................................................................... 80 7.7.2 Reducing NSFAS loan-to-bursary conversions ........................................................................................... 81 7.7.3 Increasing the student throughput rate .................................................................................................... 83
7.8 THE NSFAS LOAN CHOICES MODEL – EASY ACCESS COSTING MODEL ........................................................................... 85 7.9 THE NSFAS LOAN CHOICES MODEL – TESTING SCENARIOS ........................................................................................ 87
7.9.1 Scenario 1 ................................................................................................................................................. 88 7.9.2 Scenario 2 ................................................................................................................................................. 89 7.9.3 Scenario 3 ................................................................................................................................................. 90 7.9.4 Scenario 4 ................................................................................................................................................. 90 7.9.5 Scenario 5 ................................................................................................................................................. 91 7.9.6 Scenario 6 ................................................................................................................................................. 91
7.10 ANALYSIS OF THE DHET NSFAS LOAN SCHEME FUNDING SCENARIOS ........................................................................... 92 7.11 KEY FINDINGS FROM THE COSTING MODELS AND SCENARIOS ....................................................................................... 94
8. CONCLUSIONS ................................................................................................................................................ 98
ANNEXURE A – NSFAS STUDENT COHORT ANALYSIS ............................................................................................ 101
APPROACH TO DATA ANALYSIS USED FOR THIS PER .............................................................................................................. 101 UNIVERSITY OF STELLENBOSCH’S APPROACH TO DATA ANALYSIS ............................................................................................ 102
ANNEXURE B – PROGRAMME ELEMENTS AND INTERMEDIATE OUTPUTS ............................................................ 104
ANNEXURE C – NSFAS’S 2014 STATEMENT OF FINANCIAL PERFORMANCE ........................................................... 108
ANNEXURE D – PEOPLE INTERVIEWED FOR THIS PER............................................................................................ 109
ANNEXURE E – IMPORTANT DOCUMENTS CONSULTED FOR THIS PER .................................................................. 110
ANNEXURE F – UCT’S BURSARY PARAMETERS AND POLICY FOR 2013 .................................................................. 111
PER – NSFAS
FINAL FEBRUARY 2016
1
List of abbreviations
AFS Annual Financial Statement
CESM Classification of Education Subject Material
CPI Consumer Price Index
DBE Department of Basic Education
DHET Department of Higher Education and Training
DSD Department of Social Development
EFC Expected Family Contribution
EFT Electronic Funds Transfer
EMIS Education Management Information System
FCS Full Cost of Study
FTE Full Time Equivalent
HDI Historically Disadvantaged Institutions
HEI Higher Education Institutions
HEMIS Higher Education Management Information System
LAF Loan Agreement Form
MOA Memorandum of Agreement
MOU Memorandum of Understanding
NCV National Certificate Vocational
NDP National Development Plan 2030
NMT National Means Test
NRF National Research Foundation
NSF National Skills Fund
NSFAS National Student Financial Aid Scheme
OVC Orphan and Vulnerable Children
PAYE Pay As You Earn
PER Performance and Expenditure Review
SARS South African Revenue Service
SASSA South African Social Security Agency
SET Science, Engineering and Technology
SETA Sector Education and Training Authority
SOP Schedule of Particulars
TEFSA Tertiary Education Fund of South Africa
TVET Technical Vocational Education and Training (colleges)
WDS Weighted number of Disadvantaged Students
PER – NSFAS
FINAL FEBRUARY 2016
2
List of universities
CPUT Cape Peninsula University of Technology
CUT Central University of Technology
DUT Durban University of Technology
MUT Mangosuthu University of Technology
NMMU Nelson Mandela Metropolitan University
NWU North West University
Rhodes Rhodes University
SMU Sefako Makgatho University
SU Stellenbosch University
TUT Tshwane University of Technology
UCT University of Cape Town
UFH University of Fort Hare
UFS University of the Free State
UJ University of Johannesburg
UKZN University of KwaZulu-Natal
UL University of Limpopo
UNISA University of South Africa
UNIVEN University of Venda
UP University of Pretoria
UWC University of the Western Cape
UZULU University of Zululand
VUT Vaal University of Technology
WITS University of the Witwatersrand
WSU Walter Sisulu University
PER – NSFAS
FINAL FEBRUARY 2016
3
1. Introduction
This Performance and Expenditure Review (PER) was commissioned by the National Treasury, working with the Department of Higher Education and Training (DHET) and National Student Financial Aid Scheme (NSFAS). It forms part of a broader initiative to understand the planning, implementation and financing dynamics of some thirty policy initiatives of government. It is envisaged that PER studies such as this will allow for greater value for money in government expenditure and improved implementation of policy initiatives, taking into consideration the objectives of the National Development Plan 2030 (NDP).
1.1 Topic
NSFAS is a large public entity responsible for administering a range of funding programmes to higher education students.
In analysing NSFAS, it is important to distinguish between the administration of NSFAS the entity, and each of the three main streams of student funding NSFAS the entity manages. These distinctions are often not made, which results in a lack of clarity regarding the finances and performance of NSFAS the entity and the funding programmes it manages.
1.2 Purpose and scope
The purpose of this PER is to develop an approach and tools that will enable National Treasury to:
i. understand the costs of the NSFAS administration; and
ii. estimate the optimal funding level for funding the NSFAS loans and Technical Vocational Education and Training (TVET) grants to achieve specific target outcomes.
The target outcomes were not defined in the project terms of reference, but it is understood that they refer to the higher education and training targets set out in the NDP.1 Among these targets, the most important from a NSFAS perspective are:
Increase the throughput rate for degree programmes to more than 75 per cent. The number of graduates will increase from the combined total of 167 469 for private and public higher education institutions to 425 000 by 2030.
Increase the number of masters and PhD students, including by supporting partnerships for research. By 2030, over 25 per cent of university enrolments should be at postgraduate level.
As part of this target, the number of science, technology, engineering and mathematics graduates should increase significantly.
In terms of scope, this PER aims to provide:
a detailed analysis of the organisational and implementation logic of NSFAS, enabling critical performance measures to be developed across all components of the scheme;
an understanding of the current expenditure and financial performance of the NSFAS entity, and each of the funding streams it manages;
a detailed analysis of the cost elements and expenditure drivers of the NSFAS entity and each of the funding streams it manages; and
1 National Development Plan 2030, page 319.
PER – NSFAS
FINAL FEBRUARY 2016
4
proposed improvements for linking policy intent and programmatic design, based on a better understanding of the causal linkages between the higher education environment and NSFAS, and the funding and cost of each of the funding streams managed by NSFAS.
1.3 Key questions
With the above in mind, this project aims to examine the following key questions:
1. What are the costs of administering NSFAS the entity?
2. What are the costs of the NSFAS loan and TVET grant programmes?
3. What is the optimal funding level of the NSFAS loan and TVET grant programmes required to achieve specific target outcomes?
1.4 Information used in conducting the review
Annexures D and E set out the list of the people interviewed and the documents referenced in the course of conducting this study.
1.5 List of documents that make up the review
The project outputs that comprise the review are:
Step 2 and 3 – 2015 02 03 NSFAS PER Step 3 Logframe – Final.xls – sets out a logical framework of NSFAS and presents additional information on the working of the NSFAS loans programme.
Step 4a – a wide range of financial information was analysed, including NSFAS loan data, trial balance information, information on grants to universities, and information from NSFAS’s annual financial statements.
Step 4b – Three MS Excel workbooks cost the different NSFAS components:
2016.02.19 NSFAS Loan Costing Model Final - NDP Scenario.xls – this workbook contains a cost model of the NSFAS entity (administration) and the NSFAS loan scheme.
2015.11.10 NSFAS Loan Choices Model Final.xls – this workbook contains a dashboard users can use to test the impact of different policy choices on the funding needs and performance of the NSFAS loan scheme.
2015.08.14 TVET Grant Model Final.xls – contains a model that costs the TVET grants programme.
Step 5 – 2016.02.23 NSFAS PER Report Final – this report.
2. Funding framework for higher education
The mechanisms through which governments transfer funds to training institutions are likely to have an important effect on the way in which the funding is used and institutional behaviour.2
2 Ziderman, A. 2001. Financing vocational training to meet policy objectives: sub-Saharan Africa. Human development sector. Africa
Region. World Bank, cited by Sheppard, C. and Ntenga, L. 2013. “Chapter 10: Funding of the South African Further Education and
Training Sector for an Equitable Sharing of National Revenue” in the FFC Submission for 2014/15 Division of Revenue.
PER – NSFAS
FINAL FEBRUARY 2016
5
Consequently, the different components of the higher education funding framework should be designed to serve specific purposes.
The government grants for higher education are structured to achieve particular objectives and incentivise particular behaviours on the part of universities, TVET colleges and students. This is clearly illustrated by the range of earmarked grants, which include the infrastructure grant, clinical training grant, teaching development grant, research development grant, historically disadvantaged institutions (HDI) development grant, and the veterinary sciences grant. It also explains why government funding for NSFAS does not flow directly to universities and TVET colleges: rather it is transferred to NSFAS, which acts as an intermediary to ensure the funding is allocated in line with the objective of expanding access to higher education for academically able students from poor backgrounds.
National Treasury and the DHET have commissioned a separate PER to review the entire funding framework for higher education, which will examine whether the different components of the funding framework are fit for purpose, encouraging internal efficiency, and strengthening demand-driven training and research.
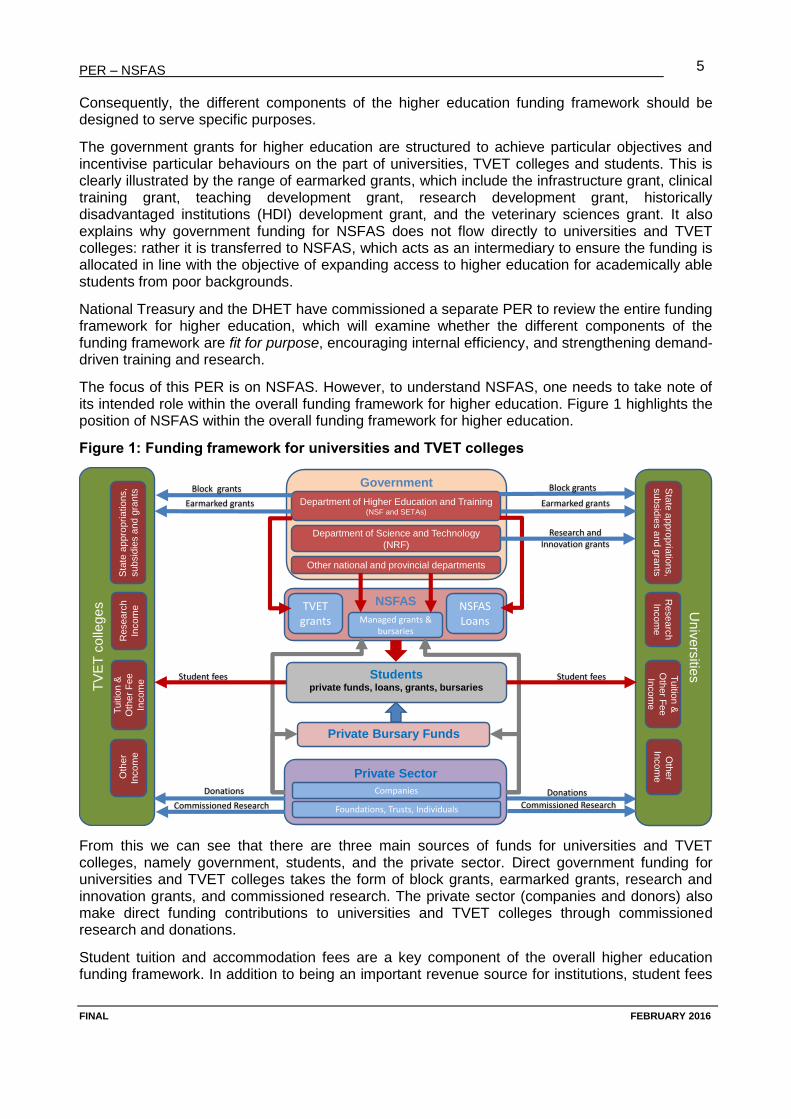
The focus of this PER is on NSFAS. However, to understand NSFAS, one needs to take note of its intended role within the overall funding framework for higher education. Figure 1 highlights the position of NSFAS within the overall funding framework for higher education.
Figure 1: Funding framework for universities and TVET colleges
From this we can see that there are three main sources of funds for universities and TVET colleges, namely government, students, and the private sector. Direct government funding for universities and TVET colleges takes the form of block grants, earmarked grants, research and innovation grants, and commissioned research. The private sector (companies and donors) also make direct funding contributions to universities and TVET colleges through commissioned research and donations.
Student tuition and accommodation fees are a key component of the overall higher education funding framework. In addition to being an important revenue source for institutions, student fees
Un
ive
rsitie
s
Government
Studentsprivate funds, loans, grants, bursaries
Department of Higher Education and Training(NSF and SETAs)
Private Sector
NSFAS
Tuitio
n &
Oth
er F
ee
Incom
e
Sta
te a
ppro
pria
tions,
subsid
ies a
nd g
rants
Researc
h
Incom
e
Department of Science and Technology
(NRF)
Other national and provincial departments
Private Bursary Funds
TVET grants
NSFAS LoansManaged grants &
bursaries
Oth
er
Incom
e
TV
ET
co
lleg
es
Sta
te a
ppro
priations,
subsid
ies a
nd g
rants
Tuitio
n &
Oth
er
Fee
Incom
e
Re
se
arc
h
Incom
e
Oth
er
Incom
e
Earmarked grants
Block grants
Research and Innovation grants
Commissioned Research
Student fees
Donations
Earmarked grants
Block grants
Student fees
Donations
Commissioned Research
Companies
Foundations, Trusts, Individuals
PER – NSFAS
FINAL FEBRUARY 2016
6
serve a number of other purposes. They serve as an incentive for students not to waste their time at university. They are a mechanism for rationing scarce resources – tuition opportunities and student accommodation. They are a type of tax on wealthier families to fund higher education. It is also appropriate that students be expected to pay for tuition and accommodation because of the private benefits they derive – in the short term, their accommodation and tuition for the year, and in the medium term, a qualification that lays the basis for higher future income-earning potential.
However, the downside of tuition and accommodation fees is that they are an obstacle to students from poor and lower middle class backgrounds wishing to access higher education. This undermines government’s efforts to address poverty, inequality and promote economic development. Therefore, to remove or minimise the “obstacle effect” of these fees, government makes funds available for student loans, grants and bursaries, targeting them at academically able students from poor backgrounds. The majority of these funds are DHET grants to NSFAS, but other departments have also set up various bursary programmes – some of which are managed by NSFAS. From the perspective of universities and TVET colleges, the funds that government allocates to NSFAS loans, TVET grants and other bursary programmes are probably best described as indirect earmarked grants, since most of these funds flow to the institutions via students paying their tuition and accommodation fees. DHET refers to these as second stream incomes for the higher education institutions, which is also a useful description.
As shown, the private sector also makes contributions to NSFAS and private bursary funds that fund students’ tuition and accommodation fees, and other study costs.
2.1 The importance of NSFAS funding to universities and TVET colleges
The government and private sector funds that NSFAS manages do not flow directly to universities and TVET colleges, but they are nevertheless an important indirect source of funding as they flow to them via the students that receive the loans, grants and bursaries.
In 2013, NSFAS allocated R6.7 billion in loans and bursaries to university students. Based on the full cost of study (FCS) information presented in section 4.4 below, we can assume that at least 95 per cent, or R6.4 billion, flowed to the universities in the form of registration, tuition, accommodation and meals fees. NSFAS also allocated R1.95 billion in grants to TVET students, all of which flowed to the TVET colleges in registration, tuition and accommodation/meals fees.
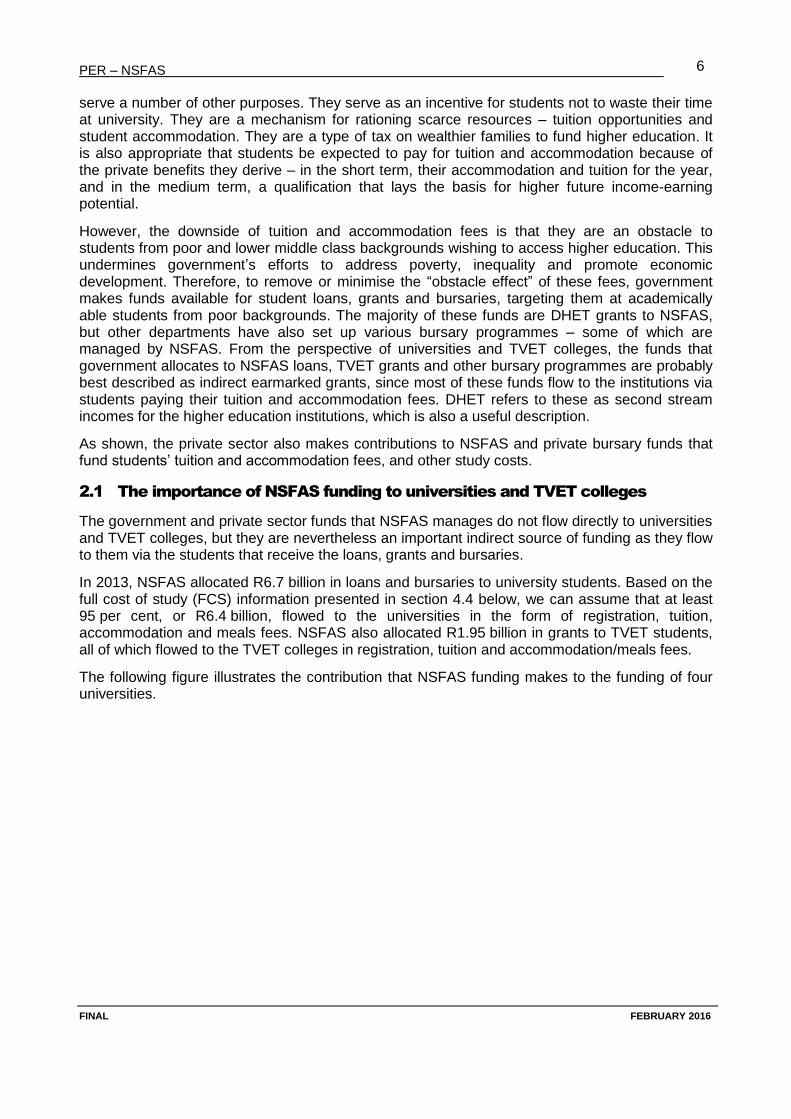
The following figure illustrates the contribution that NSFAS funding makes to the funding of four universities.
PER – NSFAS
FINAL FEBRUARY 2016
7
Figure 2: The contribution NSFAS loan funding makes to university finances
Source: Annual financial statements of the universities and NSFAS data provided for the PER.
Note: 95 per cent of the NSFAS funding allocated to the university is deducted from the tuition and other fee income so as to avoid
double counting. It is assumed that the remaining 5 per cent is paid to students as allowances.
In Figure 2, the NSFAS funding component includes the general, teacher, disability and final year programme allocations to the universities for the relevant years, as reported by NSFAS. It is evident that NSFAS loans are an important indirect source of revenue for the University of Limpopo (UL), contributing 20 per cent of its total income and paying for 60 per cent of the tuition and other fees. By contrast, NSFAS funding contributes only 2.5 per cent to the University of Cape Town’s (UCT) total revenue, paying for slightly less than 9 per cent of the tuition and other fees.
The manner in which NSFAS funding is disbursed means it is likely to be a more important indirect source of revenue for those institutions whose students come from poor backgrounds, and for those institutions that are more reliant on tuition and other fee income as a revenue source. In both instances, this will be the HDIs and, to a lesser extent, the universities of technology.
2.2 The role of NSFAS in the higher education funding framework
The primary purpose of the funds channelled via NSFAS is to expand equitable access to higher education to academically able students from poor backgrounds by removing or minimising the “obstacle effect” that tuition and accommodation fees and other costs of higher education pose. NSFAS allocates loans, grants and bursaries to qualifying students to pay for their tuition fees, accommodation and meals, and in certain instances also transport and study materials. The tuition and accommodation (if the student is in residence) components are paid directly to the university/college, while the other components are paid out to the student either as an EFT or using a cell phone based voucher system.
In addition to this primary purpose, the NSFAS loans, grants and bursaries are also designed to achieve various other policy objectives:
PER – NSFAS
FINAL FEBRUARY 2016
8
Recycle funding by requiring students to repay their NSFAS loans once they get employment and earn above a specified income threshold.
Incentivise students to pass – through the loan-to-bursary conversions;
Incentivise students to complete their degrees – the final year loan-to-bursary conversion;
Subsidise priority fields of study: prioritising the allocation of loans to students studying priority courses, targeting the TVET grants to NCV and Report 191 programmes3, and putting in place bursary programmes for specific professions (e.g. teachers and social workers); and
Target specific categories of students, such as those with disabilities.
It is arguable whether these objectives would be achieved through a block grant, or even a direct earmarked grant, to universities and TVET colleges. It is important that the funding be allocated to individual students so as to create a nexus between the student and the funding mechanism, thus creating incentives for the desired behaviour responses – choosing a priority field of study, or working hard to minimise their debt. NSFAS therefore acts as an agent or intermediary for government to ensure the funding is allocated in line with the objectives.
This needs to be kept in mind when analysing the functioning of NSFAS, and particularly when making proposals regarding how the NSFAS entity and the NSFAS loans, TVET grants and the managed bursaries could be better designed or managed.
3. Overview of NSFAS operations
In 1991, the Independent Development Trust established the Tertiary Education Fund of South Africa (TEFSA) as a not-for-profit company to provide loans to students attending higher education institution. The aim was to provide financial aid to poor students, irrespective of race, so that they could access higher education. Recognising the value of this scheme, the government allocated funds for the establishment of NSFAS in 1995 and, because TEFSA already had the necessary infrastructure in place, the government decided to get it to manage the new scheme.
The Education White Paper 3 (1997) endorsed the NSFAS idea, and processes were put in place to formalise its governance arrangements. In 1999, the NSFAS loan scheme was formally established by an Act of Parliament (Act 56 of 1999) and, in 2000, TEFSA was reconstituted as NSFAS (the organisation) – a public entity managed by an executive officer accountable to a Board representing all major stakeholders in higher education, and appointed by the Minister of Higher Education and Training. In addition, there are a number of other role-players involved in the management of the NSFAS loan scheme. Included amongst these are the higher education institutions, which are responsible for managing the loan application and approval processes, and the government entities that contribute funding.
NSFAS is a large public entity, with an administrative budget of about R149 million in 2014, responsible for administering:
the NSFAS loan scheme for university undergraduate students (referred to as “NSFAS loans”);
grants to students at TVET colleges (referred to as “TVET grants”); and
3 The policy document, Formal technical college instructional programmes in the RSA, Report 191 (2001/08), contains the
programme requirements for current technical college education in the Republic of South Africa.
PER – NSFAS
FINAL FEBRUARY 2016
9
a range of other government and private bursary and grants schemes, including the Funza Lushaka Bursary Programme to train teachers (referred to either as “managed bursary/grant programmes” or by the name of the particular bursary/grant programme).
In 2014, NSFAS managed the disbursement of R8.7 billion in loans, bursaries and grants to 416 365 students.4
A word on terminology: loans vs grants vs bursaries
NSFAS administers a range of financial programmes to assist students. Often the terminology used by the
organisation to describe these products is not clear, and results in misunderstandings regarding the nature
of the products. For this PER, we use the following definitions to guide our use of these terms:
A loan is a sum of money lent to a student who meets prescribed requirements. The student is
required to repay the capital and interest on the capital. NSFAS loans have preferential terms, such
as grace periods before interest accrues, and the rate of interest is kept below market values.
A grant is awarded to students who meet prescribed requirements, such as being from a low
income household and having the necessary academic criteria to register for specific qualifications.
A grant does not have to be repaid.
A bursary is awarded to students for good performance. A bursary does not need to be repaid.
However, some bursaries involve a work obligation. A bursary may be awarded up-front for future
studies or, as is the case with NSFAS, a bursary can be awarded retrospectively by converting a
portion of the student’s loan into a bursary.
In many cases, what NSFAS calls a bursary is in fact a grant. It would greatly facilitate discussions if role-
players in the sector were to adopt a consistent approach to naming financial aid products for students in
line with the above definitions.
3.1 The nature of NSFAS operations
Due to the volume of applications, TEFSA used financial aid officers at higher education institutions as local agents for distributing loans. This practice was carried over to NSFAS, and it continues to be a key component of NSFAS operations. NSFAS allocates funds to the institutions for loans and grants. The institutions receive applications for funding from students, assess eligibility, and allocate the loans and grants. They are also responsible for concluding the written loan or grant agreements between the students and NSFAS, and managing the disbursement of the funds to students. They also report to NSFAS on the progress of the funded students.
NSFAS is in the process of introducing a new model, which will shift the responsibility of administering funding from the universities to NSFAS (see further discussion in section 3.2).
Allocation of funds to higher education institutions5
To ensure that the funds for NSFAS loans are equitably divided between the different higher education institutions, the institutional allocations are based on the number of disadvantaged students at the respective institutions, as well as the costs of study (according to study programme) at each institution. The average FCS for all academic programmes at an institution includes registration, tuition, residence and meals. It is not clear whether NSFAS has extended the FCS to cover books and transport as well.6 The weighted number of disadvantaged students (WDS) at each institution is determined using the following formula:
WDS = (FTE enrolled African students × 3) + (FTE enrolled coloured students × 2) + (FTE enrolled Indian students × 1)
4 NSFAS Annual Financial Statements, 2014:53. 5 This description draws on De Villiers, P. et al. 2013, pages 7 and 8. 6 DHET’s position is that the FCS must cover books as well.
PER – NSFAS
FINAL FEBRUARY 2016
10
The WDS and FCS measures for each institution are used to apportion the total NSFAS allocation for a specific financial year between the higher education institutions. The amount that each institution receives is thus solely determined by the racial composition of the students at that institution. However, when allocating NSFAS loans or grants, the institutions do not take race into account. Rather, grants are allocated on the basis of means tests, in which poverty is the main component.
According to NSFAS the above formula was last used in 2011. However, since then the allocations to each university have increased more or less in proportion to the available funding – so in practice the current allocations are still founded on the above race-based formula.
In the new model there is no need for funds to be allocated to institutions, so this allocation process will progressively fall away as the new model is extended to cover more institutions.
3.1.1 Loans for undergraduate study at university (NSFAS loans)
The NSFAS loan scheme is:
a tool government uses to fund/purchase the higher education outcomes the country requires in order to grow the economy and address the challenges of development and inequality;
a scheme for making means-tested allocations to students who meet certain qualifying criteria in order to fund their first qualification at higher education institutions; and
a performance-linked loan and bursary scheme that rewards students who pass their courses or graduate.
Eligibility criteria and means tests
NSFAS has issued guidelines7 for the allocation of NSFAS loans that higher education institutions are expected to follow. These guidelines include:
non-financial eligibility criteria, which include academic criteria;
a National Means Test (NMT) to determine financial eligibility, and the Expected Family Contribution (EFC), issued annually (the majority of universities order the applications according to the EFC and allocate loans from lowest to highest EFC. This means the effective income threshold varies across universities. Some universities set an income threshold of R160 000 as a guide to students making applications); and
a method for calculating the approved cost of study and the NSFAS award.
Each higher education institution is expected to issue their own financial awards policy that is aligned to the NSFAS guidelines, but tailored to the institution’s specific circumstances. By way of example, UCT’s Bursary Parameters and Policy for 2013 is attached in Annexure F.
In July 2015, DHET gathered the financial aid policies of universities, and Universities South Africa produced a review of them.8 An important finding was that there is “a very significant amount of variation within the country’s university system” when it comes to managing NSFAS loans. The review concludes by recommending that DHET and Universities South Africa should consider the feasibility of developing a good practice manual for managing financial aid, and specifically NSFAS loans.9 This is rather an unusual recommendation given that NSFAS issued a 7 None of these documents are in the public domain. 8 Universities South Africa, 2015. Student financial aid at South African Universities – Financial aid policies, structures and practices
with regards to NSFAS funding. 9 Universities South Africa, 2015, page 9.
PER – NSFAS
FINAL FEBRUARY 2016
11
guideline for managing NSFAS loans in 2011.10 The continuing variation suggests that the NSFAS guideline was either not suited to most universities situations and so is not widely followed, or it is drafted in such a way as to allow for diversity. The rollout of the new model would make this proposal redundant, as it aims to put in place a single, national system for managing NSFAS loans, grants and bursaries.
NSFAS loan-to-bursary conversion
NSFAS rewards students for passing their courses by converting a portion of their loan into a bursary. If a student passes all their courses in a year, then 40 per cent of their loan for that year will be converted into a bursary. A student who passes half their courses will have 20 per cent of their loan converted into a bursary.
In addition, when students qualify, the full loan amount for their final year of study is converted into a bursary. This “final year programme” was launched by the President in 2011. Students may only benefit from the final year programme once.
Recovery of NSFAS loans
The NSFAS loan scheme is intended to recycle recovered NSFAS loans to fund future loans. The scheme uses a set of income tables to calculate what debtors must repay at a given income level; This means the value of loans does not impact on the value of repayments, only on the length of time it takes for a loan holder to complete making payments. Loan holders become liable to start repaying their loans once they are employed and earning in excess of R30 000 per annum. A loan holder with an annual salary of R30 000 is required to pay 3 per cent of his or her gross annual salary. This percentage increases as salaries increase, up to a maximum of 8 per cent for gross annual salaries of R65 000 or higher.
Interest on the capital amount of the loan only starts accruing from a year after the student leaves university. If the loan holder starts repaying during the period before the interest begins accruing, those repayments will be 100 per cent capital repayments. Interest on the loans is charged at 80 per cent of the South African Reserve Bank Repurchase Rate as at 1 April. In 2014, the interest rate was pegged at 4.4 per cent.11
Loan holders are required to continue making repayments, based on their salaries, until all interest and capital has been repaid.
The NSFAS Salary Deduction Table was introduced in July 2001 by way of regulation. Since then the Deduction Table has not been revised. In 2000/1 the minimum tax threshold was R21 111.12 This suggests the threshold in the Deduction Table was broadly aligned to the SARS Personal Income Tax threshold in that year. Since then there has been significant “bracket creep”. As salaries have increased over the last 15 years loan holders have moved up the table and consequently those at the lower end of the income spectrum are being required to repay more than would have been the case if the Deduction Table had been properly adjusted for inflation each year or if the alignment with the SARS tax tables had been maintained. In 2014/15 the minimum personal income tax threshold had increased to R70 700.13
3.1.2 Grants for study at a TVET college
DHET facilitates access to vocational education and training at public TVET colleges for able students from poor backgrounds through the NSFAS TVET grant scheme. These grants are only available for full-time studies. The eligibility criteria for these TVET grants are:
10 NSFAS is apparently supposed to issue these guidelines annually, and has commissioned a new guideline to be issued in 2016. 11 NSFAS, 2015. Annual Report 2014/15, page 73. 12 http://www.sataxguide.co.za/south-african-income-tax-rates-from-1981-to-2007/. Accessed 25 November 2016 at 10:30. 13 http://www.sars.gov.za/Tax-Rates/Income-Tax/Pages/Rates%20of%20Tax%20for%20Individuals.aspx. Accessed 25 November
2016 at 10:30.
PER – NSFAS
FINAL FEBRUARY 2016
12
The student must be a South African citizen.
The student must be enrolled or intending to enrol in one of the following programmes:
o NCV.
o Report 191 courses:
N1 – N3, linked to a registered apprenticeship.
N4 – N6.
The student must be in need of financial assistance as determined by a compulsory means test and an income threshold of R122 000 – which was last reviewed by DHET in 2010.
The student must demonstrate potential for academic success.
The grants are paid directly to the TVET college on behalf of the student; they do not receive any funds directly.14 Students are not required to make any repayments on the grants.
3.1.3 Administration of other bursary/grant schemes
NSFAS manages a range of bursary funds for different government institutions:
The Funza Lushaka Bursary Programme to train teachers:15 a multi-year programme of
the Department of Basic Education (DBE) to promote teaching as a profession. Bursaries
are available to enable eligible students to complete a teaching qualification in an area of
national priority, such as mathematics. Recipients of these bursaries are required to teach
at a public school for the same number of years as they received the bursary.
Bursaries for studying social work:16 a programme introduced by the national Department
of Social Development (DSD) to promote social work as a profession, given the national
shortage of social workers. Bursary holders must complete the qualification within the
minimum period as prescribed by the university, and are not permitted to change fields of
study. Recipients of these bursaries are required to work as social workers in the public
sector for the same number of years as they received the bursary.
Bursaries from the National Skills Fund (NSF) for scarce skills:17 bursaries to students
from poor backgrounds, towards qualifications in identified scarce skills, as well as to
students with disabilities, for all fields of study. The fund covers tuition and resident fees,
study materials, and may also include a travel and general allowance depending on
requirements of the student. Each bursary awarded will depend on the financial need of
the student. Students are also encouraged to apply for other funding. Candidates who
receive a bursary will be required to agree to an obligatory work contract within South
Africa after successfully completing their studies. Students will need to successfully pass
each year of their studies towards their first degree. If they fail, funding will be
discontinued and they must re-do the year at their own cost before funding will be re-
instated the following year.
The bursary programme for students with disabilities:18 This bursary programme was
introduced by DHET. The bursary covers tuition and residence fees, meals, study
14 NSFAS states in its Annual Performance Plan 2014/15 that DHET intends “to publish regulations for determining allowances for
travel, accommodation and meals for TVET college students.” 15 http://www.funzalushaka.doe.gov.za/. 16 http://www.dsd.gov.za. 17 http://bursaries-southafrica.co.za/the-national-skills-fund-bursaries/. 18 http://www.isasaschoolfinder.co.za/info/governments-bursary-programme-for-students/, accessed [Fill in date] at [Fill in time].
PER – NSFAS
FINAL FEBRUARY 2016
13
material, transport and assistive devices and/or human support to the student.
Beneficiaries of the bursary are required to work in South Africa for a specified period
upon completion of their studies.
Other bursary schemes include the Military Veterans’ scheme, the Eastern Cape
Provincial Government scheme and the KwaZulu-Natal Provincial Government scheme.
NSFAS also manages various grant and bursary programmes for private institutions
(e.g.Nedbank) on a fee basis.
3.1.4 Shortcomings of the old NSFAS administrative system
The Report of the Ministerial Committee on the Review of the National Student Financial Aid Scheme (2010) identified various shortcomings with the current institution-based approach to managing NSFAS funding:
the methodology for dividing funding up between institutions is inequitable as it is based
on race rather than socio-economic status19 (see analysis in section 6.5.1);
lack of consistency across institutions with regards to compliance with the norms and
standards for the NSFAS scheme, especially the application of the means test20 and the
requirement to assess the probability of academic success;
certain institutions are spreading the NSFAS allocations very thinly among students (this
practice is referred to as “top slicing”21), meaning the students either have to find top-up
funding or are unable to complete their studies due to lack of funds;22
the processing of NSFAS loan agreements not meeting good governance or audit
requirements;23
administrative inefficiencies resulting in funds not being effectively applied and universities
not being paid on time;24
susceptibility to fraud and corruption; and
difficulties in recovering loans due to the absence of a direct relationship between NSFAS
and the students – often resulting from institutions capturing/students providing inaccurate
personal and contact information of the student being funded.
Addressing administrative and financial management issues is an ongoing process. NSFAS has
made significant progress in many areas since 2010 which has resulted in the institution receiving
unqualified financial audit opinions from the Auditor-General on its Annual Financial Statements
since 2011 through to 2015. This is a significant achievement. However, as the Auditor-General’s
“emphasis of matter” items in each of these years indicate there are still significant issues that
need to be addressed. In addition, an unqualified financial audit opinion does not mean NSFAS is
functioning optimally, that its data management capabilities are what they need to be, or that
there are no policy issues relating to the NSFAS loan scheme that need to be addressed.
19 DHET, 2010. Report of the Ministerial Committee on the Review of the National Student Financial Aid Scheme, page xiv. 20 Universities South Africa, 2015, page 9.
DHET, 2010. Report of the Ministerial Committee on the Review of the National Student Financial Aid Scheme, page xv. 21 DHET, 2010. Report of the Ministerial Committee on the Review of the National Student Financial Aid Scheme, page xiv. 22 HRDC, 2013. Status of the Bursary/Scholarship Landscape in South Africa, Research Report, page 295. 23 DHET, 2010. Report of the Ministerial Committee on the Review of the National Student Financial Aid Scheme, page xiv. 24 DHET, 2010. Report of the Ministerial Committee on the Review of the National Student Financial Aid Scheme, page xvii.
PER – NSFAS
FINAL FEBRUARY 2016
14
3.2 The New Student Centred Model
Partly in response to the above short-comings, in October 2013 NSFAS introduced a new administrative model for managing NSFAS loans, grants and bursaries, the new student centred model (hereafter referred to as the new model). The new model shifts the responsibility of administering funding from universities and TVET colleges to NSFAS.
The new model incorporates a range of innovations aimed at improving administration, including:
Students apply once for funding (not one year of study at a time), and their funding is
sustained in subsequent years for as long as they meet academic requirements for
promotion from one year to the next, easing the administrative burden on institutions and
NSFAS.
The financial means test is automated, and linked to other government databases to verify
personal, family, income and employment data, including:
o a link to the social security system to confirm whether the applicants were
beneficiaries of a Child Support Grant;
o a link to Department of Education’s schools’ database to establish whether the
applicant attended a fee free school or was given school fee exemptions;
o a link to Department of Education’s EMIS database allowing a speedy confirmation
of Grade-12 results, which determine whether a student qualifies for initial financial
assistance.
Funding will be allocated using an “all for some” approach according to a national ordered
eligibility queue based on a means test, academic assessment, and scarce skills.
Tuition and residence fees are paid to the university or TVET college at the start of the
academic year, which assists their cash flow.
Allowances for books, food, private accommodation, transport, electronic and assistive
devices are paid directly to student’s cell phones through the sBux voucher system,
ensuring that spending can be monitored and accounted for.
NSFAS has reviewed the operational processes required to implement the new model, and mapped the associated human resource requirements. Consequent to this review, the NSFAS Board has approved an increase in the entity’s headcount from 163 to 299, with a structured implementation plan based on the most critical needs as well as the funding available on a sustainable basis. The majority of new positions are in the operational areas relating directly to students, i.e. the Loans and Bursaries department and the significantly reorganised Contact Centre, as well as in the Information Technology department.25
NSFAS26 planned the phase-in of the new model over three years as follows:
Phase 1 would see seven universities and five TVET colleges participating, which would
cover some 77 000 students, or 20 per cent of all NSFAS-funded students.
Phase 2, anticipated to begin in 2015, would see 80 per cent of university and TVET
college students shifted to the new model.
25 NSFAS, 2014. Annual Report 2013/14, page 51. 26 NSFAS Annual Performance Plan 2014.
PER – NSFAS
FINAL FEBRUARY 2016
15
Phase 3, to have started from the beginning of 2016, would see all students on the new
model.
However, there have been delays in rolling it out. The NSFAS Annual Performance Plan for 2015/16 states NSFAS aim to increase the coverage of the new model to 30 per cent of students by the end of 2015.27 However, in December 2015, the NSFAS website28 only identified six universities and five TVET colleges as being part of the system. In its 2014/15 Annual Report,29 NSFAS acknowledges the challenges by stating that:
In essence, approximately 85% of the student population remains with the old model. Starting new models that are heavily dependent on Information Technology has its own attendant technical challenges.
The 2014/15 Annual Report notes that the Board has decided to have a longer phased-in approach for implementing the new model, and to use the more gradual process to learn from the glitches instead of going for “a big-bang approach that could potentially quadruple the problems that may be encountered in the implementation phase, and thus paralyse the entire system”.30
Clearly, the new model has much to offer in terms of streamlining administrative processes and improving accountability; consequently, the delays in its rollout are a major concern.
3.3 Proposals and recent policy developments regarding NSFAS
In 2010, the Ministerial Committee on the Review of NSFAS published its report,31 which made a range of findings and recommendations regarding the structure and management of NSFAS, many of which continue to be relevant. In addition, there are ongoing discussions between DHET and NSFAS, and within the higher education sector generally, as to how NSFAS can be strengthened and how the funding of academically able students from poor backgrounds can be improved. This section highlights proposals and recent policy developments in these areas:
1. Fee-free university education for the poor. In line with resolution 44 of the ANC’s 52nd National Conference,32 the Review Committee recommended that the higher education funding model should move progressively towards “free higher education to undergraduate level for students from poor and working class communities”33 This continues to be an objective of government. However, the issue of funding remains the primary challenge. In the interim, a number of steps have been taken to move NSFAS in this direction:
the rapid growth in NSFAS general funding, and the addition of other funding streams;
the introduction and expansion of the TVET grant programme;
elimination of the means test in relation to students who qualified to receive a Child Support Grant;
elimination of the means test in relation to students who matriculated from “fee-free schools” or were granted school fee exemptions while at school; and
the introduction of the final year programme, in addition to the loan-to-bursary conversions, for students who pass their courses.
27 NSFAS Annual Performance Plan for the year 2015/16 page 9. 28 http://www.nsfas.org.za/NSFAS/STUDENTS/APPLY, accessed 30 December 2015 at 11.30. 29 NSFAS, 2015. Annual Report 2014/15, page 12. 30 NSFAS, 2015. Annual Report 2014/15, page 12. 31 DHET, 2010. Report of the Ministerial Committee on the Review of the National Student Financial Aid Scheme. 32 ANC, 2007. 52nd National Conference: Resolutions, 20 December 2007. http://www.anc.org.za/show.php?id=2536. 33 DHET, 2010. Report of the Ministerial Committee on the Review of the National Student Financial Aid Scheme, page 124.
PER – NSFAS
FINAL FEBRUARY 2016
16
2. The means test and the “missing middle”. The Review Committee was very critical of the NSFAS means test because “it excludes children from families who earn above the R122 000 per annum qualification threshold, but who still cannot afford to attend university.”34 The Committee recommended that the higher education funding model should provide student loans on favourable terms to higher education students from lower middle-income families. DHET35 continues to explore this option, as well as other ideas that have been proposed, including:
a graduate tax;
greater contributions from the private sector; and
using the NSFAS grant as collateral to bring national banks and investment corporations (e.g. the Public Investment Corporation) on board to support students.
3. The funding of BTech programmes. According to NSFAS policy, BTech is regarded as a second qualification, and therefore students studying for BTech are not eligible. This leaves a very significant gap in government’s efforts to provide financial assistance to students, especially those studying for qualifications in science, engineering and technology (SET). In February 2015, DHET36 indicated that funding will only be made available for BTech qualifications required for registration with a professional council. Recent information from the Nelson Mandela Metropolitan University (NMMU)37 and the Cape Peninsula University of Technology (CPUT)38 confirms that NSFAS funding will be available for certain BTech qualifications in 2016. However, the lack of funding for the remaining BTech programmes remains a challenge.
4. The FCS and the determination of the approved cost of study. Once a student has been approved for an NSFAS loan, grant or bursary, a process of establishing the approved cost of study relating to that particular student needs to be completed to determine the quantum to be awarded. There are three proposals relating to this issue:
the Review Committee proposed that the practice of top slicing should be eliminated (the full rollout of the new model would achieve this);
the FCS and other approved costs should be extended to cover transport; and
DHET is in the process of preparing regulations for determining allowances for travel, accommodation and meals for TVET college students.39
5. Implementation of the in duplum rule. The Review Committee found that NSFAS was operating on the basis that the in duplum rule, which restricts the amount of interest that may accrue to an amount equal to the original loan, did not apply to it. This was in contravention of both common law and the National Credit Act.40 Consequently, NSFAS has undertaken an extensive exercise to review existing debt and restate the interest on such debt in compliance with the in duplum rule. This has resulted in the value of NSFAS debt being adjusted downwards.
6. Collecting debts that had prescribed. The Review Committee found that NSFAS continued to collect debts that had prescribed.41 It is understood that this practice has been discontinued. However, the broader issue is that NSFAS should manage its debt book in a manner that prevents debts prescribing.
34 DHET, 2010. Report of the Ministerial Committee on the Review of the National Student Financial Aid Scheme, page xv. 35 DHET, 2015. “Annexure 3”, page 9-11. 36 DHET, 2015. Presentation to Parliament‘s Portfolio Committee on Higher Education and Training, 18 February 2015. 37 http://finaid.nmmu.ac.za/NSFAS-Loans, accessed 26 October 2015 at 16.45. 38 http://www.cput.ac.za/research/postgraduate/bursaries, accessed 26 October 2015 at 16.45. 39 NSFAS, 2014. Annual Performance Plan, page 11. 40 DHET, 2010. Report of the Ministerial Committee on the Review of the National Student Financial Aid Scheme, page xvii. 41 DHET, 2010. Report of the Ministerial Committee on the Review of the National Student Financial Aid Scheme, page xviii.
PER – NSFAS
FINAL FEBRUARY 2016
17
7. Blacklisting of NSFAS debtors The NSFAS Act allows NSFAS to blacklist delinquent borrowers after informing them of the intention to do so and giving them an opportunity to settle arrear payments. In August 2011, the Minister of Higher Education and Training instructed NSFAS to discontinue all blacklisting of NSFAS borrowers.42 This closed down an important tool for collecting NSFAS debt, especially from students who are employed but refusing to pay.
8. Extra-judicial emolument attachment orders. Section 23 of the NSFAS Act allowed NSFAS to send a registered letter to the employers of NSFAS borrowers to compel them to deduct repayments at source. This practice does not follow due legal process, and is also contrary to the National Credit Act. Following criticism by the Review Committee, and a legal opinion on the issue, NSFAS discontinued this practice in 2011. However, it would seem that, at the same time, NSFAS decided to discontinue the use of all emolument attachment orders.43 Again, this closed down an important tool for collecting NSFAS debt from students who are employed but refusing to pay.
9. Using SARS to assist with collecting NSFAS debt. A key recommendation of the Review Committee was that government should explore the option of using SARS to collect NSFAS debt by way of a surcharge on the borrower’s PAYE.44 While SARS does provide NSFAS with employer information in terms of the NSFAS Act, there does not appear to have been any further movement in getting SARS to manage NSFAS debt collections.
4. NSFAS in the higher education context
NSFAS is an integral part of the higher education sector; therefore, it is directly affected by key sector trends, namely:
efforts to increase the participation rates in higher education through increasing enrolments;
transformation efforts to ensure equitable access to higher education by academically-able students from poor backgrounds;
efforts to improve the retention and conversion rates (i.e. reducing dropouts and increasing graduation rates);
increasing cost of higher education as represented by the FCS; and
developments in government’s strategy to resource/fund higher education.
For this PER, various data was analysed to get an understanding of these key trends and how they impact upon the different components of NSFAS. The results of this work are presented below and compared with the information from other sources, notably “Annexure 3”45 presented at the Second National Higher Education Summit46 recently hosted by DHET.
42 Timeslive article, “Loan relief for NSFAS students”, 24 August 2011. http://www.timeslive.co.za/local/2011/08/24/loan-relief-for-
nsfas-students accessed 26 October 2015 at 16:45. 43 It is not clear why this decision was taken, and whether it was an instruction by the Board or the Ministers. 44 DHET, 2010. Report of the Ministerial Committee on the Review of the National Student Financial Aid Scheme, page xix. 45 DHET, 2015. “Annexure 3 Are we making progress with systemic structural transformation of resourcing, access, success, staffing
and researching in higher education: What do the data say?” Submission to the Second National Higher Education Summit held in
Durban on 15 to 17 October 2015 are available at http://www.dhet.gov.za/summit/Docs2015.html. Accessed 20 November 2015 at
10:30. 46 Documents presented at the Second National Higher Education Summit held in Durban on 15 to 17 October 2015 are available at
http://www.dhet.gov.za/summit/Docs2015.html. Accessed 20 November 2015 at 10:30.
PER – NSFAS
FINAL FEBRUARY 2016
18
4.1 Increasing enrolment numbers
The National Plan on Higher Education (2001) stated that a participation rate47 in higher education of 20 per cent should be achieved over the following 10-15 years in order to supply the human resources needs of the country. DHET reports that the participation rate has increased from 15.4 per cent in 2003 to 19.5 per cent in 2013. Importantly, the participation rate of African students has increased from 11.1 per cent in 2003 to 16.5 per cent in 2013.48
4.1.1 University enrolment numbers
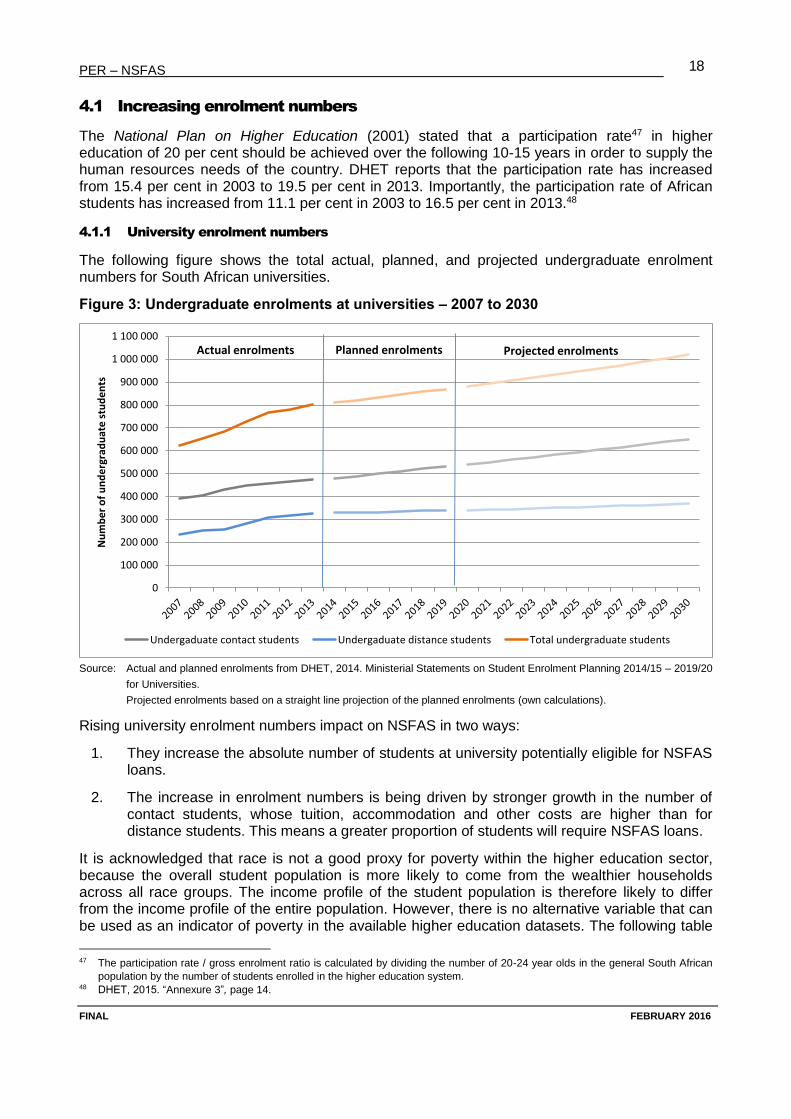
The following figure shows the total actual, planned, and projected undergraduate enrolment numbers for South African universities.
Figure 3: Undergraduate enrolments at universities – 2007 to 2030
Source: Actual and planned enrolments from DHET, 2014. Ministerial Statements on Student Enrolment Planning 2014/15 – 2019/20
for Universities.
Projected enrolments based on a straight line projection of the planned enrolments (own calculations).
Rising university enrolment numbers impact on NSFAS in two ways:
1. They increase the absolute number of students at university potentially eligible for NSFAS loans.
2. The increase in enrolment numbers is being driven by stronger growth in the number of contact students, whose tuition, accommodation and other costs are higher than for distance students. This means a greater proportion of students will require NSFAS loans.
It is acknowledged that race is not a good proxy for poverty within the higher education sector, because the overall student population is more likely to come from the wealthier households across all race groups. The income profile of the student population is therefore likely to differ from the income profile of the entire population. However, there is no alternative variable that can be used as an indicator of poverty in the available higher education datasets. The following table
47 The participation rate / gross enrolment ratio is calculated by dividing the number of 20-24 year olds in the general South African
population by the number of students enrolled in the higher education system. 48 DHET, 2015. “Annexure 3”, page 14.
0
100 000
200 000
300 000
400 000
500 000
600 000
700 000
800 000
900 000
1 000 000
1 100 000
Nu
mb
er
of
un
de
rgra
du
ate
stu
de
nts
Undergaduate contact students Undergaduate distance students Total undergraduate students
Actual enrolments Planned enrolments Projected enrolments
PER – NSFAS
FINAL FEBRUARY 2016
19
shows income quintiles by race, based on the entire South African population. It also shows the population of 20-24 year olds by race.
Table 1: Income quintiles by race based on the entire population
Quintile African Coloured Indian/Asian White Total
5 (highest) 10.1% 20.5% 43.4% 75.8%
4 19.0% 28.1% 37.8% 17.0%
3 22.1% 25.9% 12.6% 4.2%
2 24.0% 16.1% 3.4% 1.1%
1 (lowest) 24.7% 9.4% 2.8% 1.8%
Population 20-24 years 3 544 596 353 661 102 236 294 030 4 294 523
82.5% 8.2% 2.4% 6.8% 100%
Total population 43 333 709 4 771 548 1 341 877 4 554 820 54 001 953
80.2% 8.8% 2.5% 8.4% 100%
Sources: Income quintiles date from Stats SA, 2012. Income and Expenditure of Households 2010/2011, Statistical release P0100.
Population data from Stats SA, 2014. South African Statistics 2014, pages 2.1 and 2.10.
Given the skewed racial distribution of income, and the fact that 82.5 per cent of 20-24 year olds are African, it is very likely that, as more African students enrol in university, there will be a proportionate increase in the number of students coming from poor backgrounds.
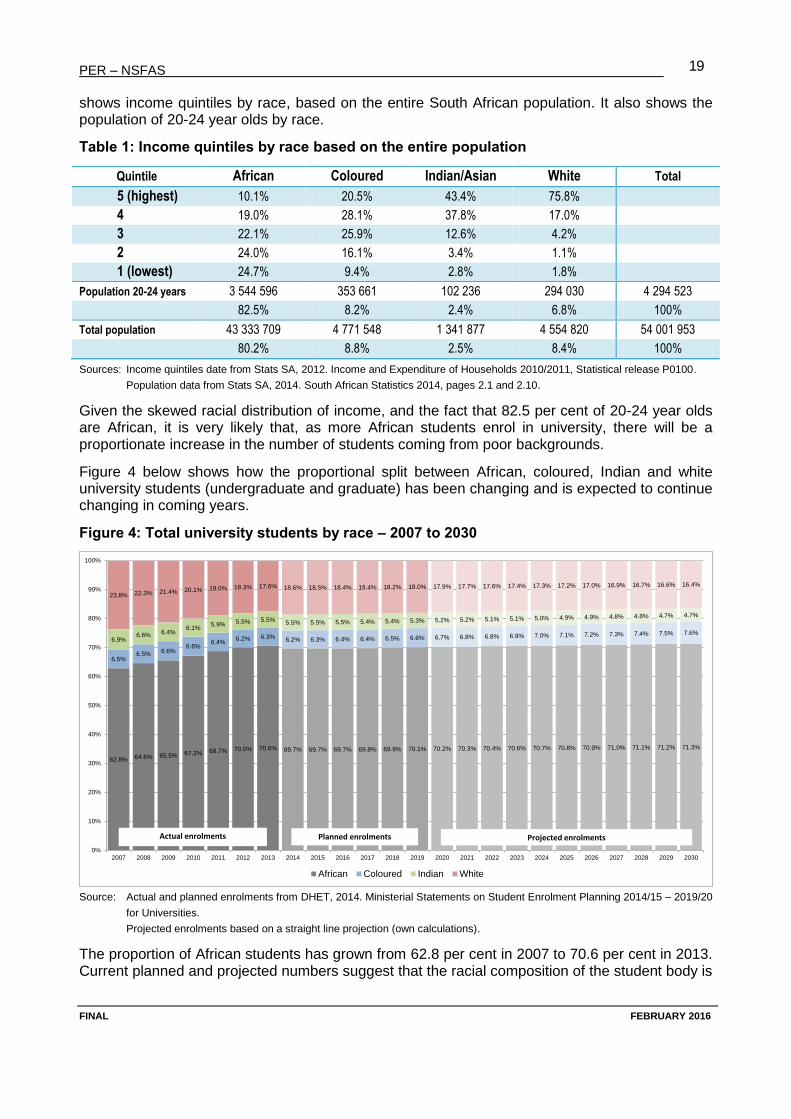
Figure 4 below shows how the proportional split between African, coloured, Indian and white university students (undergraduate and graduate) has been changing and is expected to continue changing in coming years.
Figure 4: Total university students by race – 2007 to 2030
Source: Actual and planned enrolments from DHET, 2014. Ministerial Statements on Student Enrolment Planning 2014/15 – 2019/20
for Universities.
Projected enrolments based on a straight line projection (own calculations).
The proportion of African students has grown from 62.8 per cent in 2007 to 70.6 per cent in 2013. Current planned and projected numbers suggest that the racial composition of the student body is
62.8% 64.6% 65.5% 67.2% 68.7% 70.0% 70.6%
6.5%6.5% 6.6%
6.6%6.4%
6.2% 6.3%6.9%6.6% 6.4%
6.1%5.9% 5.5% 5.5%
23.8% 22.3% 21.4% 20.1% 19.0% 18.3% 17.6%
69.7% 69.7% 69.7% 69.8% 69.9% 70.1%
6.2% 6.3% 6.4% 6.4% 6.5% 6.6%
5.5% 5.5% 5.5% 5.4% 5.4% 5.3%
18.6% 18.5% 18.4% 18.4% 18.2% 18.0%
70.2% 70.3% 70.4% 70.6% 70.7% 70.8% 70.9% 71.0% 71.1% 71.2% 71.3%
6.7% 6.8% 6.8% 6.9% 7.0% 7.1% 7.2% 7.3% 7.4% 7.5% 7.6%
5.2% 5.2% 5.1% 5.1% 5.0% 4.9% 4.9% 4.8% 4.8% 4.7% 4.7%
17.9% 17.7% 17.6% 17.4% 17.3% 17.2% 17.0% 16.9% 16.7% 16.6% 16.4%
0%
10%
20%
30%
40%
50%
60%
70%
80%
90%
100%
2007 2008 2009 2010 2011 2012 2013 2014 2015 2016 2017 2018 2019 2020 2021 2022 2023 2024 2025 2026 2027 2028 2029 2030
African Coloured Indian White
Actual enrolments Planned enrolments Projected enrolments
PER – NSFAS
FINAL FEBRUARY 2016
20
likely to remain fairly stable going forward. Nevertheless, increases in the total participation rate will continue to widen access to students from poor backgrounds. Therefore the proportion of students who will be eligible for NSFAS funding will continue to grow.
4.1.2 TVET college enrolment numbers
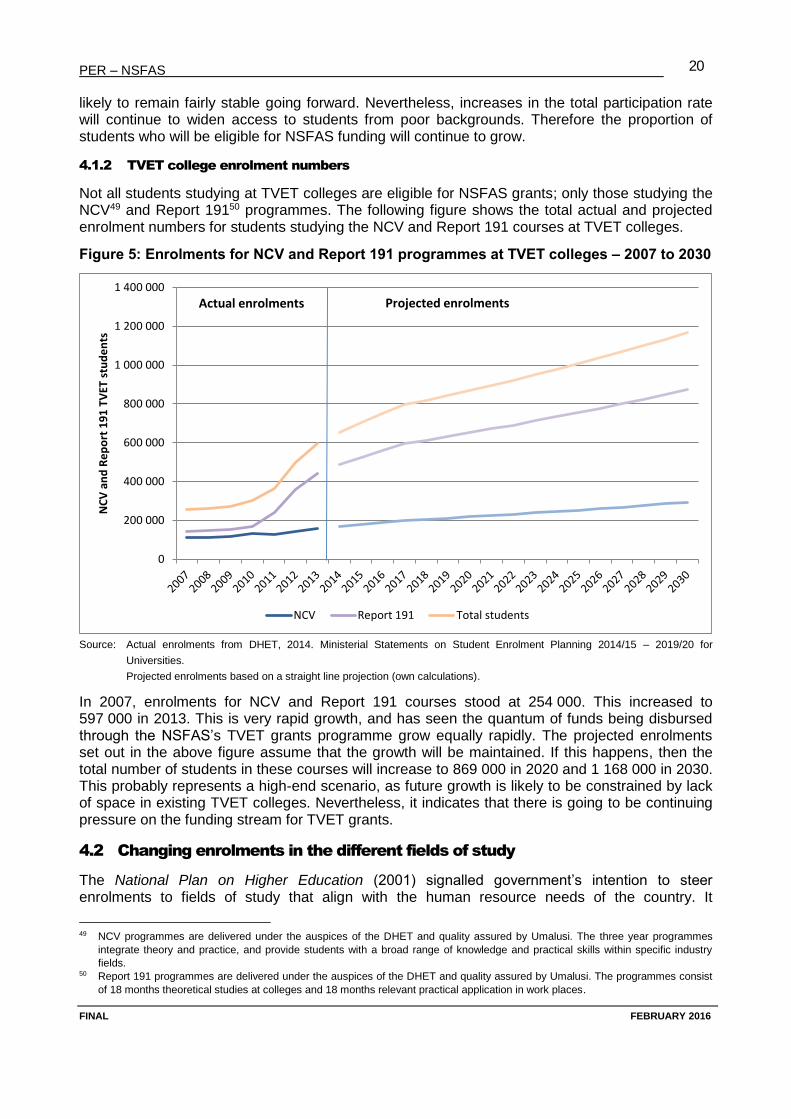
Not all students studying at TVET colleges are eligible for NSFAS grants; only those studying the NCV49 and Report 19150 programmes. The following figure shows the total actual and projected enrolment numbers for students studying the NCV and Report 191 courses at TVET colleges.
Figure 5: Enrolments for NCV and Report 191 programmes at TVET colleges – 2007 to 2030
Source: Actual enrolments from DHET, 2014. Ministerial Statements on Student Enrolment Planning 2014/15 – 2019/20 for
Universities.
Projected enrolments based on a straight line projection (own calculations).
In 2007, enrolments for NCV and Report 191 courses stood at 254 000. This increased to 597 000 in 2013. This is very rapid growth, and has seen the quantum of funds being disbursed through the NSFAS’s TVET grants programme grow equally rapidly. The projected enrolments set out in the above figure assume that the growth will be maintained. If this happens, then the total number of students in these courses will increase to 869 000 in 2020 and 1 168 000 in 2030. This probably represents a high-end scenario, as future growth is likely to be constrained by lack of space in existing TVET colleges. Nevertheless, it indicates that there is going to be continuing pressure on the funding stream for TVET grants.
4.2 Changing enrolments in the different fields of study
The National Plan on Higher Education (2001) signalled government’s intention to steer enrolments to fields of study that align with the human resource needs of the country. It
49 NCV programmes are delivered under the auspices of the DHET and quality assured by Umalusi. The three year programmes
integrate theory and practice, and provide students with a broad range of knowledge and practical skills within specific industry
fields. 50 Report 191 programmes are delivered under the auspices of the DHET and quality assured by Umalusi. The programmes consist
of 18 months theoretical studies at colleges and 18 months relevant practical application in work places.
0
200 000
400 000
600 000
800 000
1 000 000
1 200 000
1 400 000
NC
V a
nd
Re
po
rt 1
91
TV
ET s
tud
en
ts
NCV Report 191 Total students
Actual enrolments Projected enrolments
PER – NSFAS
FINAL FEBRUARY 2016
21
committed government to “shift the balance in enrolments between the humanities, business and commerce and science, engineering and technology (SET) from the 2001 ratio of 49%:26%:25% to a ratio of 40%:30%:30% respectively”51 over the next five to ten years. During the enrolment planning cycle for 2011/12-2013/14, DHET set targets for certain scarce skill areas, namely: engineering sciences; human and animal health; natural and physical sciences; and initial teacher education. These scarce skills fall mainly within the SET field of study.
DHET52 reports that between 2003 and 2013, the SET field of study’s share of total enrolments has increased from 27 per cent to 29 per cent. However, this seemingly small shift has taken place within the context of rapidly growing overall enrolments, meaning that the actual number of students enrolling for SET courses has grown rapidly from 193 864 in 2003 to 283 622 in 2013. Also significant is that the percentage of African enrolments in SET increased from 55 per cent in 2003 to 67 per cent in 2013.
Increasing enrolments in the SET field of study impacts upon NSFAS as follows:
Most SET qualifications require four years regulation time, as opposed to three years for the other two fields of study. Increasing enrolments for SET qualifications means that NSFAS has to fund more students for more years.
Generally, the tuition fees for SET courses are higher than in other fields of study. So if more students who require NSFAS funding enrol for such courses, it will further push up the cost to NSFAS.
There is evidence that the dropout rates in certain SET courses are higher, and graduation rates lower, than in other fields of study.53 If NSFAS funds an increasing number of SET students, the risk of the funds not being effectively spent is greater. Also, if the funding is an NSFAS loan, then a larger number of students will incur debt without obtaining a qualification, which will impact on the recoverability of such debt.
4.3 Dropout and graduation rates
An effective and efficient higher education system is one that minimises the number of dropouts and enables as many students as possible to graduate in regulation time54 or as close to it as possible, obviously without compromising quality.55 The most efficient use of NSFAS funds is to fund students that graduate within regulation time. Therefore the dropout and delayed graduation rates in the higher education system impact directly on the finances of NSFAS in the following ways:
If NSFAS allocates grants or bursaries to students who subsequently dropout, those funds are wasted because they did not purchase the intended qualification.
If NSFAS allocates loans to students that subsequently dropout, it means they will be saddled with NSFAS debt and no qualification. The lack of a qualification reduces their chances of employment and income earning potential, which decreases the likelihood of them being able to repay the NSFAS debt.
If NSFAS funds students who take longer than regulation time to qualify, they will receive more funding from NSFAS than a student who qualifies in regulation time.
51 National Plan on Higher Education, 2001, page 26. 52 DHET, 2015. “Annexure 3”, pages 15 and 16. 53 See the results of the PER cohort study presented in section 4.3.4. 54 For a 3-year contact programme, 3 years would be regulation time, and for a 4-year programme it would be 4 years. 55 DHET, 2015. “Annexure 3”, page 18.
PER – NSFAS
FINAL FEBRUARY 2016
22
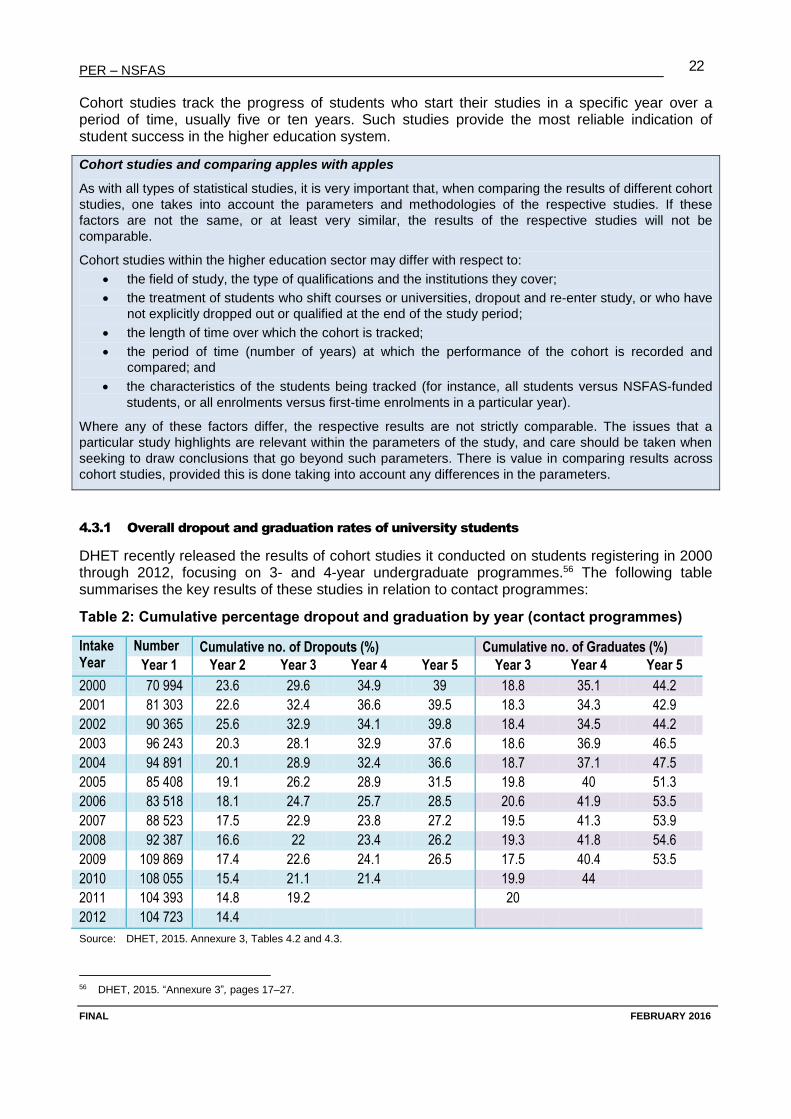
Cohort studies track the progress of students who start their studies in a specific year over a period of time, usually five or ten years. Such studies provide the most reliable indication of student success in the higher education system.
Cohort studies and comparing apples with apples
As with all types of statistical studies, it is very important that, when comparing the results of different cohort
studies, one takes into account the parameters and methodologies of the respective studies. If these
factors are not the same, or at least very similar, the results of the respective studies will not be
comparable.
Cohort studies within the higher education sector may differ with respect to:
the field of study, the type of qualifications and the institutions they cover;
the treatment of students who shift courses or universities, dropout and re-enter study, or who have
not explicitly dropped out or qualified at the end of the study period;
the length of time over which the cohort is tracked;
the period of time (number of years) at which the performance of the cohort is recorded and
compared; and
the characteristics of the students being tracked (for instance, all students versus NSFAS-funded
students, or all enrolments versus first-time enrolments in a particular year).
Where any of these factors differ, the respective results are not strictly comparable. The issues that a
particular study highlights are relevant within the parameters of the study, and care should be taken when
seeking to draw conclusions that go beyond such parameters. There is value in comparing results across
cohort studies, provided this is done taking into account any differences in the parameters.
4.3.1 Overall dropout and graduation rates of university students
DHET recently released the results of cohort studies it conducted on students registering in 2000 through 2012, focusing on 3- and 4-year undergraduate programmes.56 The following table summarises the key results of these studies in relation to contact programmes:
Table 2: Cumulative percentage dropout and graduation by year (contact programmes)
Intake Year
Number Cumulative no. of Dropouts (%) Cumulative no. of Graduates (%)
Year 1 Year 2 Year 3 Year 4 Year 5 Year 3 Year 4 Year 5
2000 70 994 23.6 29.6 34.9 39 18.8 35.1 44.2
2001 81 303 22.6 32.4 36.6 39.5 18.3 34.3 42.9
2002 90 365 25.6 32.9 34.1 39.8 18.4 34.5 44.2
2003 96 243 20.3 28.1 32.9 37.6 18.6 36.9 46.5
2004 94 891 20.1 28.9 32.4 36.6 18.7 37.1 47.5
2005 85 408 19.1 26.2 28.9 31.5 19.8 40 51.3
2006 83 518 18.1 24.7 25.7 28.5 20.6 41.9 53.5
2007 88 523 17.5 22.9 23.8 27.2 19.5 41.3 53.9
2008 92 387 16.6 22 23.4 26.2 19.3 41.8 54.6
2009 109 869 17.4 22.6 24.1 26.5 17.5 40.4 53.5
2010 108 055 15.4 21.1 21.4 19.9 44
2011 104 393 14.8 19.2 20
2012 104 723 14.4
Source: DHET, 2015. Annexure 3, Tables 4.2 and 4.3.
56 DHET, 2015. “Annexure 3”, pages 17–27.
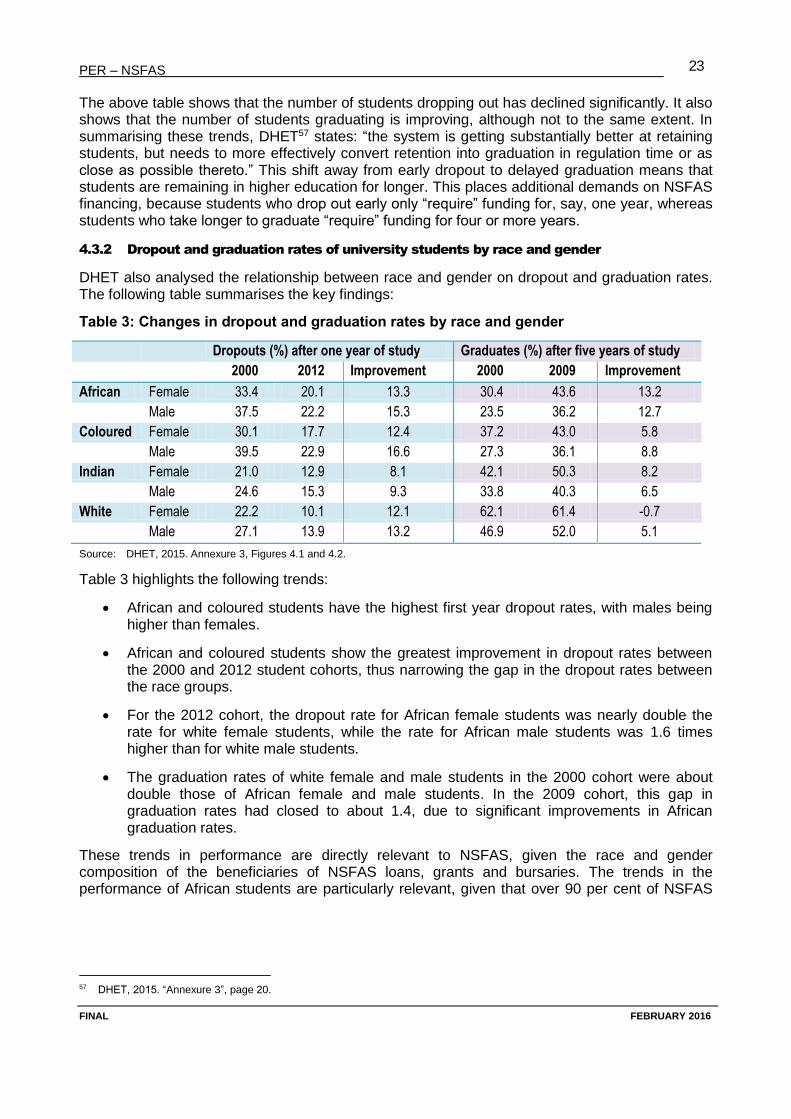
PER – NSFAS
FINAL FEBRUARY 2016
23
The above table shows that the number of students dropping out has declined significantly. It also shows that the number of students graduating is improving, although not to the same extent. In summarising these trends, DHET57 states: “the system is getting substantially better at retaining students, but needs to more effectively convert retention into graduation in regulation time or as close as possible thereto.” This shift away from early dropout to delayed graduation means that students are remaining in higher education for longer. This places additional demands on NSFAS financing, because students who drop out early only “require” funding for, say, one year, whereas students who take longer to graduate “require” funding for four or more years.
4.3.2 Dropout and graduation rates of university students by race and gender
DHET also analysed the relationship between race and gender on dropout and graduation rates. The following table summarises the key findings:
Table 3: Changes in dropout and graduation rates by race and gender
Dropouts (%) after one year of study Graduates (%) after five years of study
2000 2012 Improvement 2000 2009 Improvement
African Female 33.4 20.1 13.3 30.4 43.6 13.2
Male 37.5 22.2 15.3 23.5 36.2 12.7
Coloured Female 30.1 17.7 12.4 37.2 43.0 5.8
Male 39.5 22.9 16.6 27.3 36.1 8.8
Indian Female 21.0 12.9 8.1 42.1 50.3 8.2
Male 24.6 15.3 9.3 33.8 40.3 6.5
White Female 22.2 10.1 12.1 62.1 61.4 -0.7
Male 27.1 13.9 13.2 46.9 52.0 5.1
Source: DHET, 2015. Annexure 3, Figures 4.1 and 4.2.
Table 3 highlights the following trends:
African and coloured students have the highest first year dropout rates, with males being higher than females.
African and coloured students show the greatest improvement in dropout rates between the 2000 and 2012 student cohorts, thus narrowing the gap in the dropout rates between the race groups.
For the 2012 cohort, the dropout rate for African female students was nearly double the rate for white female students, while the rate for African male students was 1.6 times higher than for white male students.
The graduation rates of white female and male students in the 2000 cohort were about double those of African female and male students. In the 2009 cohort, this gap in graduation rates had closed to about 1.4, due to significant improvements in African graduation rates.
These trends in performance are directly relevant to NSFAS, given the race and gender composition of the beneficiaries of NSFAS loans, grants and bursaries. The trends in the performance of African students are particularly relevant, given that over 90 per cent of NSFAS
57 DHET, 2015. “Annexure 3”, page 20.
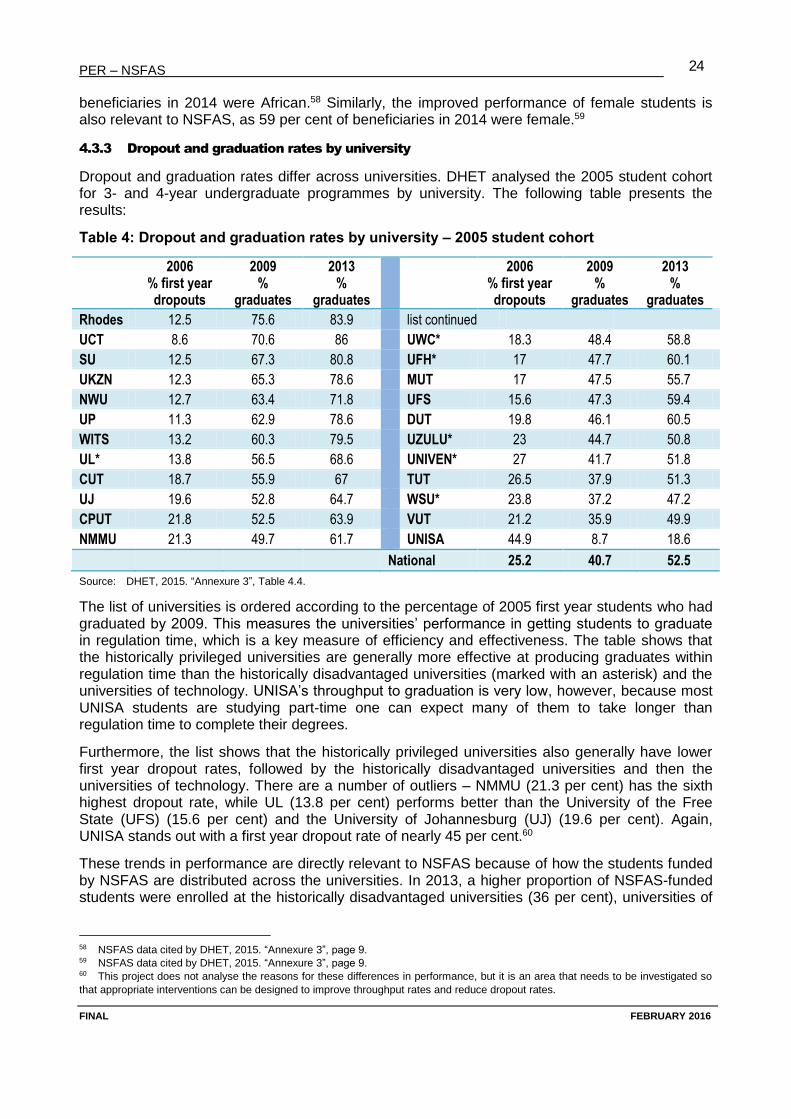
PER – NSFAS
FINAL FEBRUARY 2016
24
beneficiaries in 2014 were African.58 Similarly, the improved performance of female students is also relevant to NSFAS, as 59 per cent of beneficiaries in 2014 were female.59
4.3.3 Dropout and graduation rates by university
Dropout and graduation rates differ across universities. DHET analysed the 2005 student cohort for 3- and 4-year undergraduate programmes by university. The following table presents the results:
Table 4: Dropout and graduation rates by university – 2005 student cohort
2006 % first year dropouts
2009 %
graduates
2013 %
graduates
2006 % first year dropouts
2009 %
graduates
2013 %
graduates
Rhodes 12.5 75.6 83.9
list continued
UCT 8.6 70.6 86
UWC* 18.3 48.4 58.8
SU 12.5 67.3 80.8
UFH* 17 47.7 60.1
UKZN 12.3 65.3 78.6
MUT 17 47.5 55.7
NWU 12.7 63.4 71.8
UFS 15.6 47.3 59.4
UP 11.3 62.9 78.6
DUT 19.8 46.1 60.5
WITS 13.2 60.3 79.5
UZULU* 23 44.7 50.8
UL* 13.8 56.5 68.6
UNIVEN* 27 41.7 51.8
CUT 18.7 55.9 67
TUT 26.5 37.9 51.3
UJ 19.6 52.8 64.7
WSU* 23.8 37.2 47.2
CPUT 21.8 52.5 63.9
VUT 21.2 35.9 49.9
NMMU 21.3 49.7 61.7
UNISA 44.9 8.7 18.6
National 25.2 40.7 52.5
Source: DHET, 2015. “Annexure 3”, Table 4.4.
The list of universities is ordered according to the percentage of 2005 first year students who had graduated by 2009. This measures the universities’ performance in getting students to graduate in regulation time, which is a key measure of efficiency and effectiveness. The table shows that the historically privileged universities are generally more effective at producing graduates within regulation time than the historically disadvantaged universities (marked with an asterisk) and the universities of technology. UNISA’s throughput to graduation is very low, however, because most UNISA students are studying part-time one can expect many of them to take longer than regulation time to complete their degrees.
Furthermore, the list shows that the historically privileged universities also generally have lower first year dropout rates, followed by the historically disadvantaged universities and then the universities of technology. There are a number of outliers – NMMU (21.3 per cent) has the sixth highest dropout rate, while UL (13.8 per cent) performs better than the University of the Free State (UFS) (15.6 per cent) and the University of Johannesburg (UJ) (19.6 per cent). Again, UNISA stands out with a first year dropout rate of nearly 45 per cent.60
These trends in performance are directly relevant to NSFAS because of how the students funded by NSFAS are distributed across the universities. In 2013, a higher proportion of NSFAS-funded students were enrolled at the historically disadvantaged universities (36 per cent), universities of
58 NSFAS data cited by DHET, 2015. “Annexure 3”, page 9. 59 NSFAS data cited by DHET, 2015. “Annexure 3”, page 9. 60 This project does not analyse the reasons for these differences in performance, but it is an area that needs to be investigated so
that appropriate interventions can be designed to improve throughput rates and reduce dropout rates.
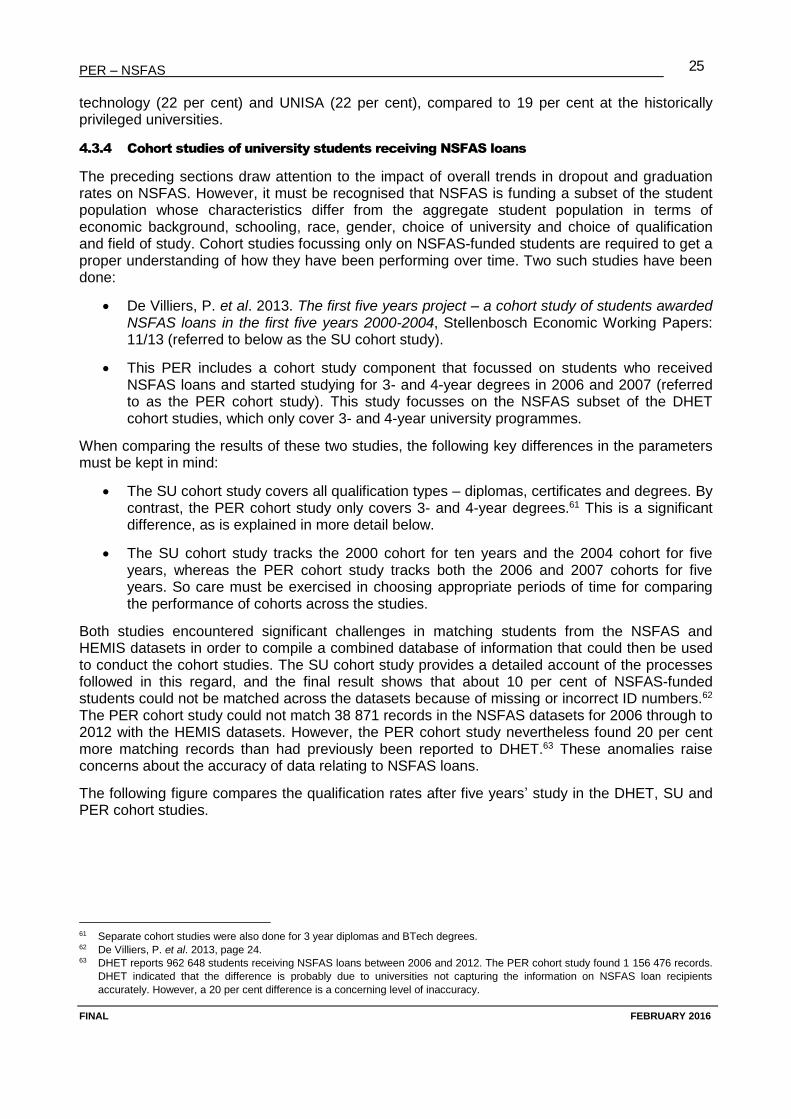
PER – NSFAS
FINAL FEBRUARY 2016
25
technology (22 per cent) and UNISA (22 per cent), compared to 19 per cent at the historically privileged universities.
4.3.4 Cohort studies of university students receiving NSFAS loans
The preceding sections draw attention to the impact of overall trends in dropout and graduation rates on NSFAS. However, it must be recognised that NSFAS is funding a subset of the student population whose characteristics differ from the aggregate student population in terms of economic background, schooling, race, gender, choice of university and choice of qualification and field of study. Cohort studies focussing only on NSFAS-funded students are required to get a proper understanding of how they have been performing over time. Two such studies have been done:
De Villiers, P. et al. 2013. The first five years project – a cohort study of students awarded NSFAS loans in the first five years 2000-2004, Stellenbosch Economic Working Papers: 11/13 (referred to below as the SU cohort study).
This PER includes a cohort study component that focussed on students who received NSFAS loans and started studying for 3- and 4-year degrees in 2006 and 2007 (referred to as the PER cohort study). This study focusses on the NSFAS subset of the DHET cohort studies, which only cover 3- and 4-year university programmes.
When comparing the results of these two studies, the following key differences in the parameters must be kept in mind:
The SU cohort study covers all qualification types – diplomas, certificates and degrees. By contrast, the PER cohort study only covers 3- and 4-year degrees.61 This is a significant difference, as is explained in more detail below.
The SU cohort study tracks the 2000 cohort for ten years and the 2004 cohort for five years, whereas the PER cohort study tracks both the 2006 and 2007 cohorts for five years. So care must be exercised in choosing appropriate periods of time for comparing the performance of cohorts across the studies.
Both studies encountered significant challenges in matching students from the NSFAS and HEMIS datasets in order to compile a combined database of information that could then be used to conduct the cohort studies. The SU cohort study provides a detailed account of the processes followed in this regard, and the final result shows that about 10 per cent of NSFAS-funded students could not be matched across the datasets because of missing or incorrect ID numbers.62 The PER cohort study could not match 38 871 records in the NSFAS datasets for 2006 through to 2012 with the HEMIS datasets. However, the PER cohort study nevertheless found 20 per cent more matching records than had previously been reported to DHET.63 These anomalies raise concerns about the accuracy of data relating to NSFAS loans.
The following figure compares the qualification rates after five years’ study in the DHET, SU and PER cohort studies.
61 Separate cohort studies were also done for 3 year diplomas and BTech degrees. 62 De Villiers, P. et al. 2013, page 24. 63 DHET reports 962 648 students receiving NSFAS loans between 2006 and 2012. The PER cohort study found 1 156 476 records.
DHET indicated that the difference is probably due to universities not capturing the information on NSFAS loan recipients
accurately. However, a 20 per cent difference is a concerning level of inaccuracy.
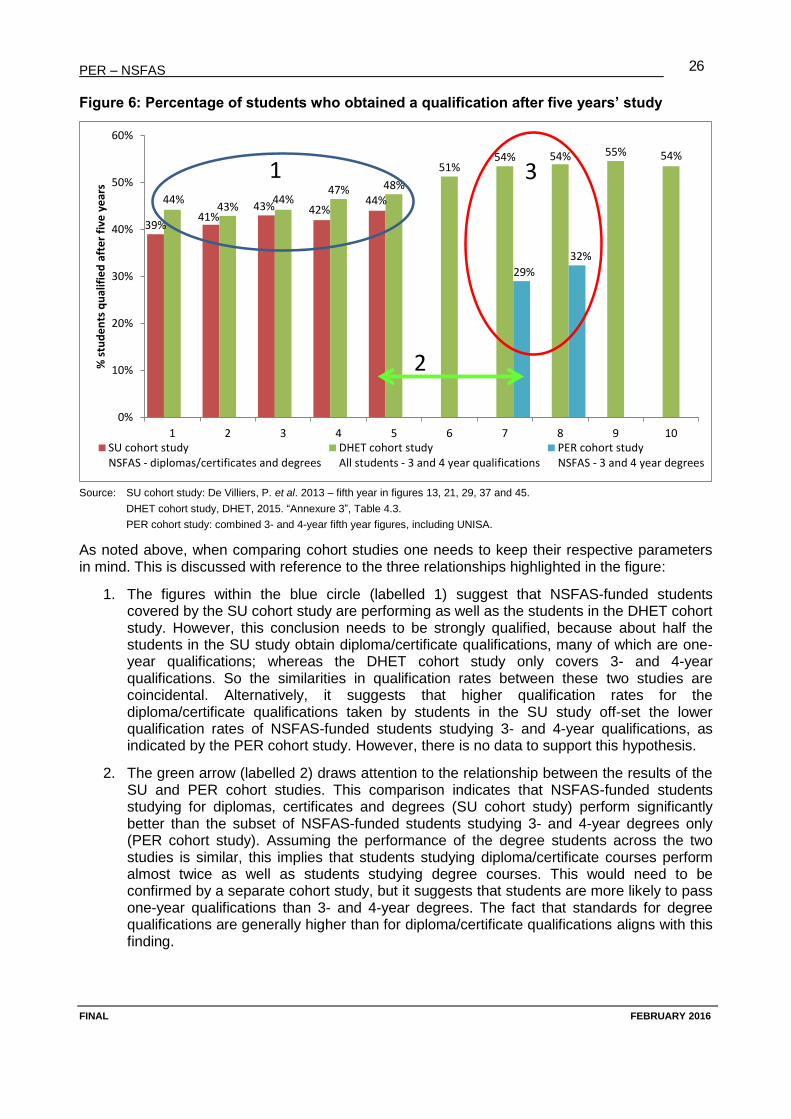
PER – NSFAS
FINAL FEBRUARY 2016
26
Figure 6: Percentage of students who obtained a qualification after five years’ study
Source: SU cohort study: De Villiers, P. et al. 2013 – fifth year in figures 13, 21, 29, 37 and 45.
DHET cohort study, DHET, 2015. “Annexure 3”, Table 4.3.
PER cohort study: combined 3- and 4-year fifth year figures, including UNISA.
As noted above, when comparing cohort studies one needs to keep their respective parameters in mind. This is discussed with reference to the three relationships highlighted in the figure:
1. The figures within the blue circle (labelled 1) suggest that NSFAS-funded students covered by the SU cohort study are performing as well as the students in the DHET cohort study. However, this conclusion needs to be strongly qualified, because about half the students in the SU study obtain diploma/certificate qualifications, many of which are one-year qualifications; whereas the DHET cohort study only covers 3- and 4-year qualifications. So the similarities in qualification rates between these two studies are coincidental. Alternatively, it suggests that higher qualification rates for the diploma/certificate qualifications taken by students in the SU study off-set the lower qualification rates of NSFAS-funded students studying 3- and 4-year qualifications, as indicated by the PER cohort study. However, there is no data to support this hypothesis.
2. The green arrow (labelled 2) draws attention to the relationship between the results of the SU and PER cohort studies. This comparison indicates that NSFAS-funded students studying for diplomas, certificates and degrees (SU cohort study) perform significantly better than the subset of NSFAS-funded students studying 3- and 4-year degrees only (PER cohort study). Assuming the performance of the degree students across the two studies is similar, this implies that students studying diploma/certificate courses perform almost twice as well as students studying degree courses. This would need to be confirmed by a separate cohort study, but it suggests that students are more likely to pass one-year qualifications than 3- and 4-year degrees. The fact that standards for degree qualifications are generally higher than for diploma/certificate qualifications aligns with this finding.
39%41%
43% 42%44%44%
43%44%
47% 48%
51%54% 54% 55% 54%
29%
32%
0%
10%
20%
30%
40%
50%
60%
1 2 3 4 5 6 7 8 9 10
% s
tud
en
ts q
ual
ifie
d a
fte
r fi
ve y
ear
s
SU cohort studyNSFAS - diplomas/certificates and degrees
DHET cohort studyAll students - 3 and 4 year qualifications
PER cohort studyNSFAS - 3 and 4 year degrees
1
2
3
PER – NSFAS
FINAL FEBRUARY 2016
27
3. The figures in the red circle (labelled 3) indicate that the subset of NSFAS-funded students studying 3- and 4-year degrees (PER cohort study) perform worse than all students in the cohort studying 3- and 4-year degrees (DHET cohort study).64
The following figure compares the findings of the DHET and PER studies for the 2007 cohort of students studying 3- and 4-year degrees in greater detail.65
Figure 7: Progress of the 2007 cohort of students studying 3- and 4-year degrees
Source: DHET cohort study, DHET, 2015. Annexure 3, Tables 4.2 and 4.3.
PER cohort study: combined 3- and 4-year fifth year figures, excluding UNISA.
Comparing the above two graphs indicates that, according to the PER cohort study, the NSFAS-funded students studying 3- and 4-year degrees have a dropout rate almost double that recorded by the DHET cohort study of all students studying 3- and 4-year qualifications. Also, the NSFAS-funded students’ graduation rate within regulation time for a 3-year degree is less than half that shown in the DHET cohort study. These are concerning findings, because they suggest a very significant performance gap between NSFAS-funded students and non-NSFAS-funded students. These findings are also concerning because they contradict the core finding of the SU cohort study, namely, that:
The success of the NSFAS performance can be gauged from the fact that NSFAS students outperform non-NSFAS students, according to an analysis of HEMIS datasets for 10 years that were analysed. The better NSFAS performance compared to non-NSFAS students may perhaps be because of smaller drop-out among the former. This appears to be related to the financial support by NSFAS that allows these students to continue their studies even when not fully successful, whereas non-supported students tend to drop out more easily.66
In addition, the findings of the PER cohort study are at odds with the information on “percentage courses passed” that NSFAS publishes in its annual reports. In 2011, NSFAS reported that students passed 74.7 per cent of their courses, a figure that increased to 85.7 per cent in 2015 (even though the 2015 academic year was not complete when this information has published). These very impressive pass rates suggest that the graduation rates of NSFAS-funded students should be around 75 per cent.67 This is not the first time this contradiction between NSFAS’s reported pass rates and the graduation rates of NSFAS-funded students has been noted:
64 For the 2006 cohort, the overall qualification rate of all students studying for 3- and 4-year degrees is 54 per cent. If NSFAS funds
25 per cent of these students and they have a qualification rate of 29 per cent, then it follows that the non-NSFAS-funded students
in the cohort have a qualification rate of around 62 per cent. 65 The PER cohort study treats students that change across institutions as dropouts. The DHET study does not treat these students
as dropouts. 66 De Villiers, P. et al. 2013, page 71. 67 De Villiers, P. et al. 2013, page 13.
83%77%
57%
32%
18%
0%
20%
41%
54%
18%23% 24% 27% 29%
0%
10%
20%
30%
40%
50%
60%
70%
80%
90%
100%
Y1 Y2 Y3 Y4 Y5
DHET 2007 Cohort - All contact students
Continue Graduate Drop out
64%55%
36%
13%4%
8%
26%32%
36%45%
56%61% 63%
0%
10%
20%
30%
40%
50%
60%
70%
80%
90%
100%
Y1 Y2 Y3 Y4 Y5
PER 2007 Cohort - NSFAS students excl. UNISA
Continue Graduate Drop out
PER – NSFAS
FINAL FEBRUARY 2016
28
Over the period 1996-2009, NSFAS reports that students passed on average 74.3% of the courses for which they entered. However, the Ministerial Committee (2010: 69-70) reported that, of all the students NSFAS funded over the years 33% are still studying while the other 67% are not at HEIs anymore. Of these students no longer studying, only 28% had graduated, while the remaining 72% had dropped out or did not complete their studies. If one takes into consideration that on average 28.5% of loans of the maximum of 40% that can be converted were converted into bursaries, this is consistent with an approximately 70% success rate. Thus the NSFAS and Ministerial Committee statistics are contradictory.68
It is crucial to explore this issue by establishing how NSFAS is reporting on performance, and by doing further cohort studies focussing on NSFAS-funded versus non-NSFAS-funded students studying 3- and 4-year degrees.
Whatever the outcome of the above analysis, the dropout and graduation rates for NSFAS are worse than for other bursary schemes that also target students from poor backgrounds.69 This can probably be attributed to the scale at which NSFAS operates, meaning it does not, and cannot, “cherry pick” the applicants who are most likely to succeed. However, there may be areas in the NSFAS scheme that, if addressed, could enhance performance:
Ensuring students are adequately funded by eliminating the practice of top-slicing, and ensuring that NSFAS loans, grants and bursaries are properly aligned to the FCS at the respective institutions.
More attention needs to be given to assessing students’ probability of success in academic studies, as required by the NSFAS Act. Currently, the application of the means test focusses attention almost entirely on financial need.
There is no personal interaction at the application stage, and so no opportunity to assess the student face-to-face, unlike many other bursary schemes. This would be very difficult to implement given the volume of NSFAS applications, but it does point to the importance of getting schools involved in marketing NSFAS and ensuring that all higher education institutions have the capacity to provide career counselling and guidance in support of the NSFAS process.
There is no NSFAS managed system of follow-up for NSFAS-funded students, providing encouragement, advice and psycho-social support. This is an important dimension of the more successful bursary schemes. Again this is a role that higher education institutions need to take up more proactively. However, NSFAS should explore how it can support such activities, e.g. through a student help-line or a referral process.
4.4 Full cost of study
The FCS is a calculated estimate of what it will cost a student to study at a university for one year. Over the years, the definition of FCS has gradually expanded to cover a wider range of the actual costs of study for students. Most universities now recognise that the FCS needs to cover registration and tuition fees, residence/accommodation, meals and books. There is a debate as to whether FCS should take account of transport as well.
Since tuition fees differ by course, each course has its own FCS. Averaging the individual course FCS figures across the courses offered by a university gives the average FCS for that university. The following table presents a breakdown of the average 2015 FCS for each university.
68 De Villiers, P. et al. 2013, page 13. 69 HRDC, 2013. Status of the Bursary/Scholarship Landscape in South Africa, Research Report, page 294-295.
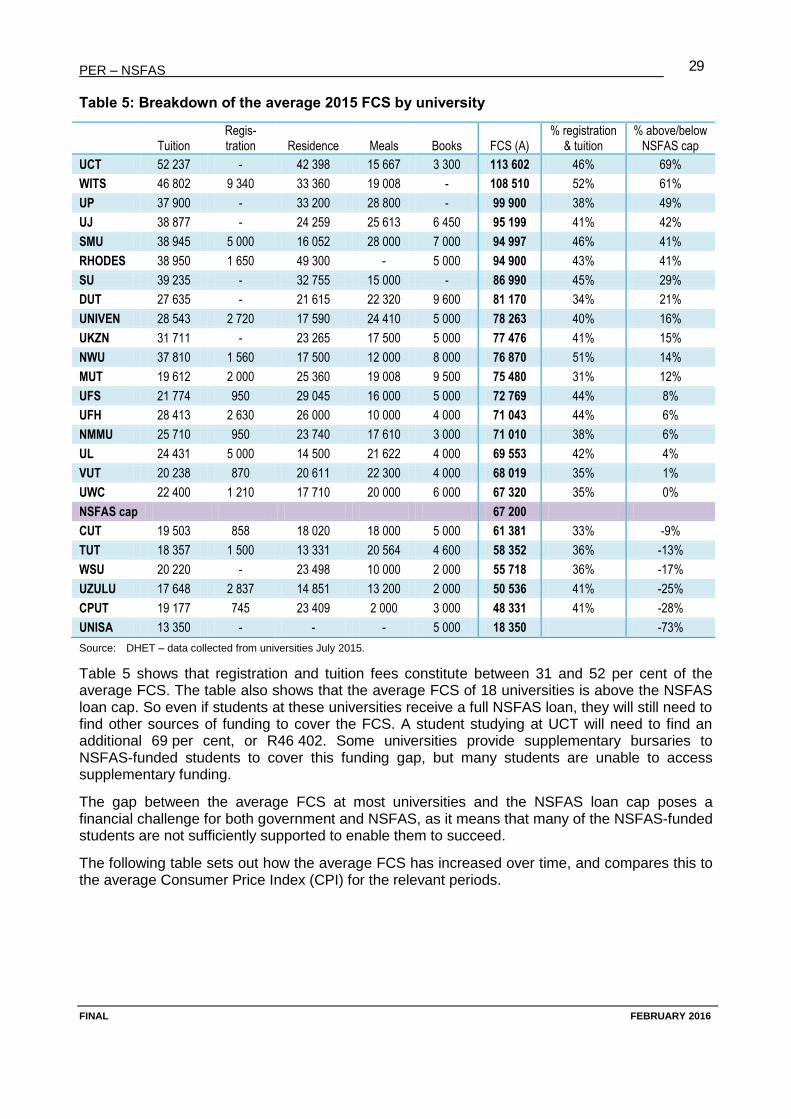
PER – NSFAS
FINAL FEBRUARY 2016
29
Table 5: Breakdown of the average 2015 FCS by university
Tuition
Regis-tration Residence Meals Books FCS (A)
% registration & tuition
% above/below NSFAS cap
UCT 52 237 - 42 398 15 667 3 300 113 602 46% 69%
WITS 46 802 9 340 33 360 19 008 - 108 510 52% 61%
UP 37 900 - 33 200 28 800 - 99 900 38% 49%
UJ 38 877 - 24 259 25 613 6 450 95 199 41% 42%
SMU 38 945 5 000 16 052 28 000 7 000 94 997 46% 41%
RHODES 38 950 1 650 49 300 - 5 000 94 900 43% 41%
SU 39 235 - 32 755 15 000 - 86 990 45% 29%
DUT 27 635 - 21 615 22 320 9 600 81 170 34% 21%
UNIVEN 28 543 2 720 17 590 24 410 5 000 78 263 40% 16%
UKZN 31 711 - 23 265 17 500 5 000 77 476 41% 15%
NWU 37 810 1 560 17 500 12 000 8 000 76 870 51% 14%
MUT 19 612 2 000 25 360 19 008 9 500 75 480 31% 12%
UFS 21 774 950 29 045 16 000 5 000 72 769 44% 8%
UFH 28 413 2 630 26 000 10 000 4 000 71 043 44% 6%
NMMU 25 710 950 23 740 17 610 3 000 71 010 38% 6%
UL 24 431 5 000 14 500 21 622 4 000 69 553 42% 4%
VUT 20 238 870 20 611 22 300 4 000 68 019 35% 1%
UWC 22 400 1 210 17 710 20 000 6 000 67 320 35% 0%
NSFAS cap 67 200
CUT 19 503 858 18 020 18 000 5 000 61 381 33% -9%
TUT 18 357 1 500 13 331 20 564 4 600 58 352 36% -13%
WSU 20 220 - 23 498 10 000 2 000 55 718 36% -17%
UZULU 17 648 2 837 14 851 13 200 2 000 50 536 41% -25%
CPUT 19 177 745 23 409 2 000 3 000 48 331 41% -28%
UNISA 13 350 - - - 5 000 18 350 -73%
Source: DHET – data collected from universities July 2015.
Table 5 shows that registration and tuition fees constitute between 31 and 52 per cent of the average FCS. The table also shows that the average FCS of 18 universities is above the NSFAS loan cap. So even if students at these universities receive a full NSFAS loan, they will still need to find other sources of funding to cover the FCS. A student studying at UCT will need to find an additional 69 per cent, or R46 402. Some universities provide supplementary bursaries to NSFAS-funded students to cover this funding gap, but many students are unable to access supplementary funding.
The gap between the average FCS at most universities and the NSFAS loan cap poses a financial challenge for both government and NSFAS, as it means that many of the NSFAS-funded students are not sufficiently supported to enable them to succeed.
The following table sets out how the average FCS has increased over time, and compares this to the average Consumer Price Index (CPI) for the relevant periods.
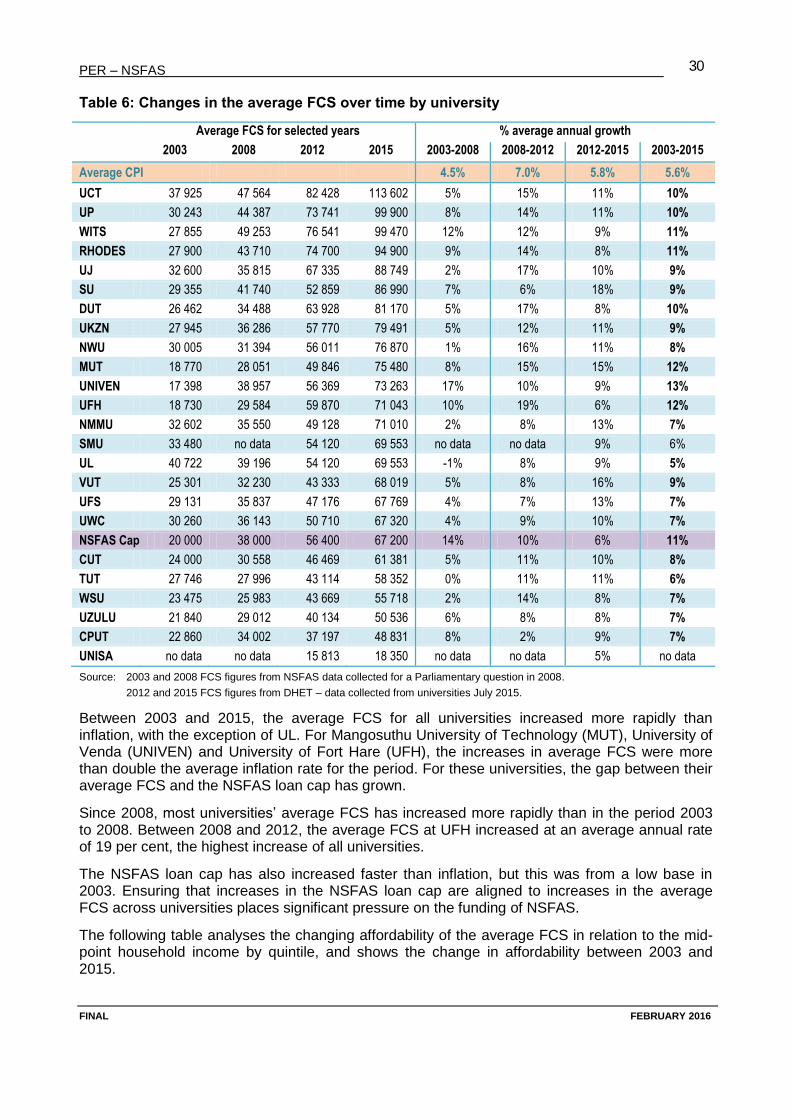
PER – NSFAS
FINAL FEBRUARY 2016
30
Table 6: Changes in the average FCS over time by university
Average FCS for selected years % average annual growth
2003 2008 2012 2015 2003-2008 2008-2012 2012-2015 2003-2015
Average CPI 4.5% 7.0% 5.8% 5.6%
UCT 37 925 47 564 82 428 113 602 5% 15% 11% 10%
UP 30 243 44 387 73 741 99 900 8% 14% 11% 10%
WITS 27 855 49 253 76 541 99 470 12% 12% 9% 11%
RHODES 27 900 43 710 74 700 94 900 9% 14% 8% 11%
UJ 32 600 35 815 67 335 88 749 2% 17% 10% 9%
SU 29 355 41 740 52 859 86 990 7% 6% 18% 9%
DUT 26 462 34 488 63 928 81 170 5% 17% 8% 10%
UKZN 27 945 36 286 57 770 79 491 5% 12% 11% 9%
NWU 30 005 31 394 56 011 76 870 1% 16% 11% 8%
MUT 18 770 28 051 49 846 75 480 8% 15% 15% 12%
UNIVEN 17 398 38 957 56 369 73 263 17% 10% 9% 13%
UFH 18 730 29 584 59 870 71 043 10% 19% 6% 12%
NMMU 32 602 35 550 49 128 71 010 2% 8% 13% 7%
SMU 33 480 no data 54 120 69 553 no data no data 9% 6%
UL 40 722 39 196 54 120 69 553 -1% 8% 9% 5%
VUT 25 301 32 230 43 333 68 019 5% 8% 16% 9%
UFS 29 131 35 837 47 176 67 769 4% 7% 13% 7%
UWC 30 260 36 143 50 710 67 320 4% 9% 10% 7%
NSFAS Cap 20 000 38 000 56 400 67 200 14% 10% 6% 11%
CUT 24 000 30 558 46 469 61 381 5% 11% 10% 8%
TUT 27 746 27 996 43 114 58 352 0% 11% 11% 6%
WSU 23 475 25 983 43 669 55 718 2% 14% 8% 7%
UZULU 21 840 29 012 40 134 50 536 6% 8% 8% 7%
CPUT 22 860 34 002 37 197 48 831 8% 2% 9% 7%
UNISA no data no data 15 813 18 350 no data no data 5% no data
Source: 2003 and 2008 FCS figures from NSFAS data collected for a Parliamentary question in 2008.
2012 and 2015 FCS figures from DHET – data collected from universities July 2015.
Between 2003 and 2015, the average FCS for all universities increased more rapidly than inflation, with the exception of UL. For Mangosuthu University of Technology (MUT), University of Venda (UNIVEN) and University of Fort Hare (UFH), the increases in average FCS were more than double the average inflation rate for the period. For these universities, the gap between their average FCS and the NSFAS loan cap has grown.
Since 2008, most universities’ average FCS has increased more rapidly than in the period 2003 to 2008. Between 2008 and 2012, the average FCS at UFH increased at an average annual rate of 19 per cent, the highest increase of all universities.
The NSFAS loan cap has also increased faster than inflation, but this was from a low base in 2003. Ensuring that increases in the NSFAS loan cap are aligned to increases in the average FCS across universities places significant pressure on the funding of NSFAS.
The following table analyses the changing affordability of the average FCS in relation to the mid-point household income by quintile, and shows the change in affordability between 2003 and 2015.
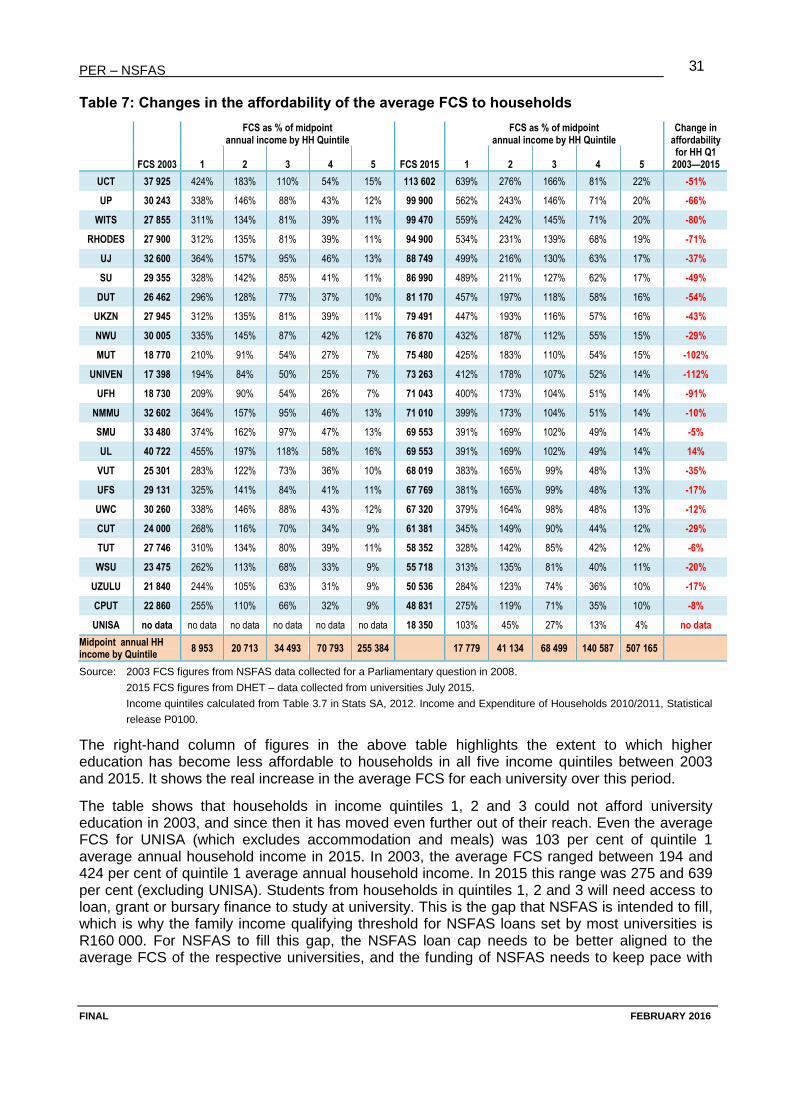
PER – NSFAS
FINAL FEBRUARY 2016
31
Table 7: Changes in the affordability of the average FCS to households
FCS 2003
FCS as % of midpoint annual income by HH Quintile
FCS 2015
FCS as % of midpoint annual income by HH Quintile
Change in affordability for HH Q1
2003—2015 1 2 3 4 5 1 2 3 4 5
UCT 37 925 424% 183% 110% 54% 15% 113 602 639% 276% 166% 81% 22% -51%
UP 30 243 338% 146% 88% 43% 12% 99 900 562% 243% 146% 71% 20% -66%
WITS 27 855 311% 134% 81% 39% 11% 99 470 559% 242% 145% 71% 20% -80%
RHODES 27 900 312% 135% 81% 39% 11% 94 900 534% 231% 139% 68% 19% -71%
UJ 32 600 364% 157% 95% 46% 13% 88 749 499% 216% 130% 63% 17% -37%
SU 29 355 328% 142% 85% 41% 11% 86 990 489% 211% 127% 62% 17% -49%
DUT 26 462 296% 128% 77% 37% 10% 81 170 457% 197% 118% 58% 16% -54%
UKZN 27 945 312% 135% 81% 39% 11% 79 491 447% 193% 116% 57% 16% -43%
NWU 30 005 335% 145% 87% 42% 12% 76 870 432% 187% 112% 55% 15% -29%
MUT 18 770 210% 91% 54% 27% 7% 75 480 425% 183% 110% 54% 15% -102%
UNIVEN 17 398 194% 84% 50% 25% 7% 73 263 412% 178% 107% 52% 14% -112%
UFH 18 730 209% 90% 54% 26% 7% 71 043 400% 173% 104% 51% 14% -91%
NMMU 32 602 364% 157% 95% 46% 13% 71 010 399% 173% 104% 51% 14% -10%
SMU 33 480 374% 162% 97% 47% 13% 69 553 391% 169% 102% 49% 14% -5%
UL 40 722 455% 197% 118% 58% 16% 69 553 391% 169% 102% 49% 14% 14%
VUT 25 301 283% 122% 73% 36% 10% 68 019 383% 165% 99% 48% 13% -35%
UFS 29 131 325% 141% 84% 41% 11% 67 769 381% 165% 99% 48% 13% -17%
UWC 30 260 338% 146% 88% 43% 12% 67 320 379% 164% 98% 48% 13% -12%
CUT 24 000 268% 116% 70% 34% 9% 61 381 345% 149% 90% 44% 12% -29%
TUT 27 746 310% 134% 80% 39% 11% 58 352 328% 142% 85% 42% 12% -6%
WSU 23 475 262% 113% 68% 33% 9% 55 718 313% 135% 81% 40% 11% -20%
UZULU 21 840 244% 105% 63% 31% 9% 50 536 284% 123% 74% 36% 10% -17%
CPUT 22 860 255% 110% 66% 32% 9% 48 831 275% 119% 71% 35% 10% -8%
UNISA no data no data no data no data no data no data 18 350 103% 45% 27% 13% 4% no data
Midpoint annual HH income by Quintile
8 953 20 713 34 493 70 793 255 384 17 779 41 134 68 499 140 587 507 165
Source: 2003 FCS figures from NSFAS data collected for a Parliamentary question in 2008.
2015 FCS figures from DHET – data collected from universities July 2015.
Income quintiles calculated from Table 3.7 in Stats SA, 2012. Income and Expenditure of Households 2010/2011, Statistical
release P0100.
The right-hand column of figures in the above table highlights the extent to which higher education has become less affordable to households in all five income quintiles between 2003 and 2015. It shows the real increase in the average FCS for each university over this period.
The table shows that households in income quintiles 1, 2 and 3 could not afford university education in 2003, and since then it has moved even further out of their reach. Even the average FCS for UNISA (which excludes accommodation and meals) was 103 per cent of quintile 1 average annual household income in 2015. In 2003, the average FCS ranged between 194 and 424 per cent of quintile 1 average annual household income. In 2015 this range was 275 and 639 per cent (excluding UNISA). Students from households in quintiles 1, 2 and 3 will need access to loan, grant or bursary finance to study at university. This is the gap that NSFAS is intended to fill, which is why the family income qualifying threshold for NSFAS loans set by most universities is R160 000. For NSFAS to fill this gap, the NSFAS loan cap needs to be better aligned to the average FCS of the respective universities, and the funding of NSFAS needs to keep pace with
PER – NSFAS
FINAL FEBRUARY 2016
32
increases in the average FCS and the growing number of students coming from quintile 1, 2, and 3 households.
Of concern is that the above table shows that university education is also becoming increasingly unaffordable for households in quintile 4. In 2003, the average FCS was between 25 and 54 per cent of quintile 4 average annual household income. In 2015, this range was 35 and 81 per cent. This growing unaffordability of higher education for quintile 4 households has been referred to as the “missing middle”, i.e. households who earn more than that required to qualify for a NSFAS loan, but less than what is needed to support their children through university studies.70 The need to address this gap places additional pressure on government’s funding of NSFAS.
When it comes to costing the NSFAS loan scheme, assumptions are made regarding the FCS in order to simplify the calculations. Very often a simple average FCS based on the number of institutions is used. In 2014 this simple average FCS was R67 708. This average FCS weights each university the same irrespective of its size, effectively giving greater weight to the smaller, more expensive universities liked Rhodes University, and less weight to a very large low cost university like UNISA. A more accurate average FCS number can be calculated by weighting the respective universities’ FCS by their respective student numbers. In 2014 the weighted average FCS based on student numbers was R48 588 (see calculation on Table 27: Average FCS by category of university in 2014). In 2014 the difference between the simple average FCS and the weighted average FCS is R19 119. So the choice of which average FCS is used for purposes of costing the NSFAS loan scheme has an important impact on the costing outcome. In our view a weighted average FCS based on student numbers is more accurate. Even more accurate for purposes of costing the NSFAS loan scheme would be a weighted average FCS based on the number students eligible for NSFAS loans at each university – if the required data is available.
5. Programme analysis of NSFAS processes
One of the challenges of the PER methodology is that certain outputs are best viewed in MS Excel. This is particularly true of the programme analysis. The detail of the programme analysis of the NSFAS processes is presented in:
2015 02 03 NSFAS PER Step 3 logframe - Final.xls.
The purpose of developing a logframe is to ensure that the costing model is based on a sound understanding of the organisational structure and complexities. Therefore only a high level summary of it is presented in this report.
NSFAS manages loans, grants and bursaries. It uses a single management structure and administrative platform to do so – this is reflected in the structure of the NSFAS budget and organogram. The following figure outlines how NSFAS activities were modelled, and the institutions or role-players involved in each activity group.
70 DHET, 2015. “Annexure 3”, page 9.
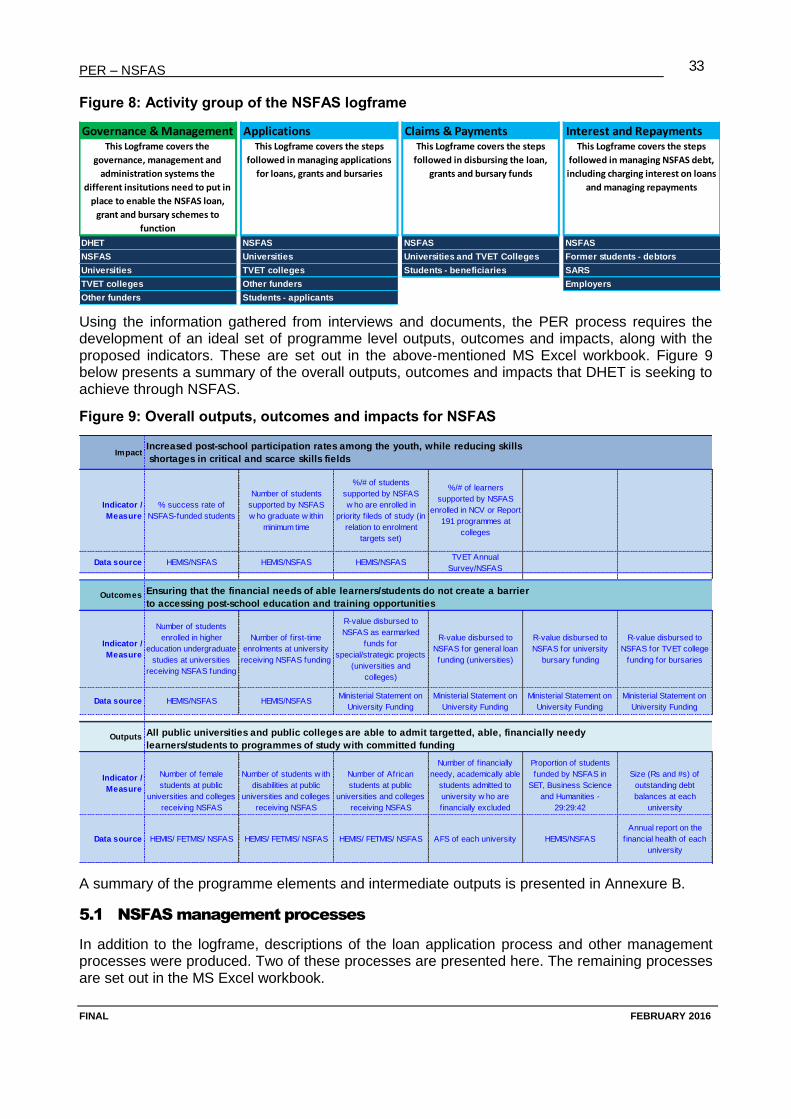
PER – NSFAS
FINAL FEBRUARY 2016
33
Figure 8: Activity group of the NSFAS logframe
Using the information gathered from interviews and documents, the PER process requires the development of an ideal set of programme level outputs, outcomes and impacts, along with the proposed indicators. These are set out in the above-mentioned MS Excel workbook. Figure 9 below presents a summary of the overall outputs, outcomes and impacts that DHET is seeking to achieve through NSFAS.
Figure 9: Overall outputs, outcomes and impacts for NSFAS
A summary of the programme elements and intermediate outputs is presented in Annexure B.
5.1 NSFAS management processes
In addition to the logframe, descriptions of the loan application process and other management processes were produced. Two of these processes are presented here. The remaining processes are set out in the MS Excel workbook.
Governance & Management Applications Claims & Payments Interest and Repayments
DHET NSFAS NSFAS NSFAS
NSFAS Universities Universities and TVET Colleges Former students - debtors
Universities TVET colleges Students - beneficiaries SARS
TVET colleges Other funders Employers
Other funders Students - applicants
This Logframe covers the steps
followed in managing NSFAS debt,
including charging interest on loans
and managing repayments
This Logframe covers the
governance, management and
administration systems the
different insitutions need to put in
place to enable the NSFAS loan,
grant and bursary schemes to
function
This Logframe covers the steps
followed in managing applications
for loans, grants and bursaries
This Logframe covers the steps
followed in disbursing the loan,
grants and bursary funds
Impact
Indicator /
Measure
% success rate of
NSFAS-funded students
Number of students
supported by NSFAS
w ho graduate w ithin
minimum time
%/# of students
supported by NSFAS
w ho are enrolled in
priority f ileds of study (in
relation to enrolment
targets set)
%/# of learners
supported by NSFAS
enrolled in NCV or Report
191 programmes at
colleges
Data source HEMIS/NSFAS HEMIS/NSFAS HEMIS/NSFAS TVET Annual
Survey/NSFAS
Outcomes
Indicator /
Measure
Number of students
enrolled in higher
education undergraduate
studies at universities
receiving NSFAS funding
Number of f irst-time
enrolments at university
receiving NSFAS funding
R-value disbursed to
NSFAS as earmarked
funds for
special/strategic projects
(universities and
colleges)
R-value disbursed to
NSFAS for general loan
funding (universities)
R-value disbursed to
NSFAS for university
bursary funding
R-value disbursed to
NSFAS for TVET college
funding for bursaries
Data source HEMIS/NSFAS HEMIS/NSFAS Ministerial Statement on
University Funding
Ministerial Statement on
University Funding
Ministerial Statement on
University Funding
Ministerial Statement on
University Funding
Outputs
Indicator /
Measure
Number of female
students at public
universities and colleges
receiving NSFAS
Number of students w ith
disabilities at public
universities and colleges
receiving NSFAS
Number of African
students at public
universities and colleges
receiving NSFAS
Number of f inancially
needy, academically able
students admitted to
university w ho are
f inancially excluded
Proportion of students
funded by NSFAS in
SET, Business Science
and Humanities -
29:29:42
Size (Rs and #s) of
outstanding debt
balances at each
university
Data source HEMIS/ FETMIS/ NSFAS HEMIS/ FETMIS/ NSFAS HEMIS/ FETMIS/ NSFAS AFS of each university HEMIS/NSFAS
Annual report on the
f inancial health of each
university
Ensuring that the financial needs of able learners/students do not create a barrier
to accessing post-school education and training opportunities
Increased post-school participation rates among the youth, while reducing skills
shortages in critical and scarce skills fields
All public universities and public colleges are able to admit targetted, able, financially needy
learners/students to programmes of study with committed funding

PER – NSFAS
FINAL FEBRUARY 2016
34
The following figure gives an overall description of the old model NSFAS funding application process and the application process of the new model.
Figure 10: NSFAS funding application processes – old and new
The following figure describes the NSFAS means test process that is applied within the new model application process.
Figure 11: NSFAS means test applied within the new model
The results of the above three assessments should produce a weighted score for each student, which can be used to set up a funding queue. NSFAS should then fund those students with the highest score first, thus ensuring that funding is better allocated according to the government’s funding priorities. However, no evidence could be found that this system is actually being
the current/old model process
all students re-apply for funding annually, through the university/college process
students complete a LAF/SOP annually for that years' cost only, with no guarantee of
future funding
university determines allowances payable and administers through own system
all first-time applicants have to show and provide evidence of full financial need
(means-test waived)
the new model process (new and continuing students)
only first-time applicants apply for funding, returning students will be eligible for funding on the grounds of academic results and the
availability of funding
students complete LAF/SOP once for the duration of the QUALIFICATION, based on a maximum loan size AND maximum number
of years
NSFAS determines allowances payable within a cap and disburses through sBux
(cellphone voucher system)
only Grade 12 learners in quintile 4 and 5 schools (or non-SASSA grant recipients or
continuing students not previously funded) will need to provide evidence of financial
need
University College
University and College
- Year of study- Number of subjects registered for
vs the number of subjects passed.- The average pass mark
RULE 2: ACADEMIC ASSESSMENT
Umalusi results
Admission to
Bachelor's Degree
(Gr 12)
Symbol = B on the
Umalusi output
Admission to
Diploma
(Gr 12)
Symbol = D on the
Umalusi output
(Gr 9 -11)
Fail = Rejected
Average pass
mark
(Gr 9 -11)
Fail = Rejected
Average pass
mark
RULE 3: SCARCE SKILLS
University College
- New Applicants studying towards a scarce skills qualification are ranked higher than other New Applicants
- Universities and Colleges will have their own lists of scarce skills qualifications
- Learners and Students are also on separate lists per University and College
RULE 1: MEANS TEST
University College
New
Applicant
(excluding
learners)
Standard
Application
Learner
Gr 9 - 12
Ranked by highest to
lowest EFC
then Family Income
Ranked by highest to
lowest EFC
then Family Income
Means Test
Waived
Gr 12
from Q1-3 schools
fee exemption, OVC and
SASSA-grant from Q4-5
schools
(Highest possible negative
EFC)
PER – NSFAS
FINAL FEBRUARY 2016
35
implemented within the new model, and a national queuing list will only be possible once the new model is extended to all institutions.
5.2 Key findings of the programme analysis
1. In NSFAS’s old model approach NSFAS allocates funds to higher education institutions and contracts them to act as agents in managing the applications and allocation of funds to students based on a means test. This approach results in:
a. inconsistencies in the management of these processes across institutions;
b. first year students who apply to multiple institutions having to make a separate funding application to each one;
c. students having to apply each year for funding;
d. poor data management – institutions do not capture and upload accurate information related to beneficiaries, financial assistance and academic performance;
e. failure to use other government information to verify means test and qualification-related information; and
f. increased risk of fraud and corruption.
2. Due to the fragmented nature of the old model, the distribution of funding does not effectively target those most in need of financial assistance. So, for instance, a less poor student at WITS could receive funding ahead of a poorer student at UL. The new model aims to ensure a single national queue to ensure funding is better allocated according to the government’s funding priorities.
3. The new model seeks to make better use of technology in managing the application, means test, allocation and disbursement processes.
4. The new model also uses technology to draw information from other government databases to verify the information provided by the students, thus reducing the risk of fraud.
5. The performance indicators tracked by NSFAS through its Annual Performance Plan and Annual Report do not disaggregate information sufficiently to track each area of NSFAS operations: administration, loans, TVET grants and other bursary schemes. Very often performance numbers are conflated, preventing an analysis of specific operational areas.
6. NSFAS debt management capabilities are poor. This needs to be re-examined, and measures taken to ensure it has the necessary procedures in place to:
a. maintain communication with debtors and take appropriate actions to prevent debt prescribing;
b. update employer details so that debtors who gain employment can be required to start making payments; and
c. use the normal tools available (i.e. blacklisting and emolument attachment orders) for proper debt management, fairly and within the bounds of the law.
7. Government needs to explore alternative options for enforcing the repayment of NSFAS loans. Some options that should be considered include employer buy-backs of loans in exchange for work-back in the company, the government making repayment of loans a condition of employment in the public service and using SARS to collect NSFAS debts through the income tax system.
PER – NSFAS
FINAL FEBRUARY 2016
36
6. Financial and performance analysis of NSFAS
As noted in the introduction, it is important to distinguish between the administration of NSFAS the entity and each of the three main streams of student funding NSFAS the entity manages.
This distinction is not made in the annual financial statements (AFSs) of NSFAS. Instead a single set of statements report on all aspects of NSFAS operations, conflating the financial information relating to administration, loans, grants and bursaries. This makes it difficult to analyse the efficiency and effectiveness of NSFAS the entity, the performance of the NSFAS loan scheme and the extent to which grants and bursaries are being disbursed as intended. See Annexure C – NSFAS’s 2014 Statement of Financial Performance for NSFAS’s Statement of Financial Performance for 2014 as an example.
The financial and performance information analysed in this section comes mainly from the NSFAS Annual Reports for 2012 through to 2015, and a set of trial balance and other finance related information provided by NSFAS.
Note that NSFAS prepares its financial statements in accordance with the principals of accrual accounting. This is entirely appropriate. However, it means that certain items on its Statement of Financial Performance do not reflect cash-backed transactions. This needs to be kept in mind, especially by those more familiar with the cash-based accounting applied in government.
A further complication in interpreting NSFAS data is that some of it relates to calendar/academic years (1 January to 31 December) and some of it to financial years (1 April to 31 March). Often this is not clarified, which makes it difficult to reconcile numbers that have the same year heading. Given that NSFAS operates within the higher education sector whose functions are aligned to the calendar, consideration should be given to aligning the NSFAS financial year to the calendar year. This would resolve some of the confusion around NSFAS data.
6.1 The structure of NSFAS finances and financial reporting
The NSFAS practice of presenting a single set of consolidated financial statements is very likely a hangover from when TEFSA was established as a not-for-profit company with an initial grant from the Independent Development Trust, and mandated to provide a student loan product on a sustainable basis. TEFSA had to demonstrate that it was managing its grant and lending activities in a sustainable manner, and hence a single, consolidated set of financial statements was appropriate, as they are for any business, including a not-for-profit company.
Since then, however, it was converted into a public entity. With this conversion, the nature of the entity changed in a fundamental way: instead of being a not-for-profit company, it became an entity that acts as an agent for government (and other funders) in managing different student financial assistance products on their behalf. This is clearly reflected in the way government now finances NSFAS – through a separate administration grant and earmarked grants for the different financial assistance products.
However, this distinction is not clearly reflected in the NSFAS Act, 56 of 1999, probably because at the time the Act was passed the aim was simply to convert TEFSA into a statutory entity. Also, the framework for managing public entities was under-developed at the time, and the “government agent” concept was not current. Since then, government has significantly expanded NSFAS’s responsibilities beyond simply managing the NSFAS loan scheme, which effectively puts a wedge between the entity and the scheme. This points to a need to amend the NSFAS Act to separate the entity from the NSFAS loan scheme, and the other funds it manages.
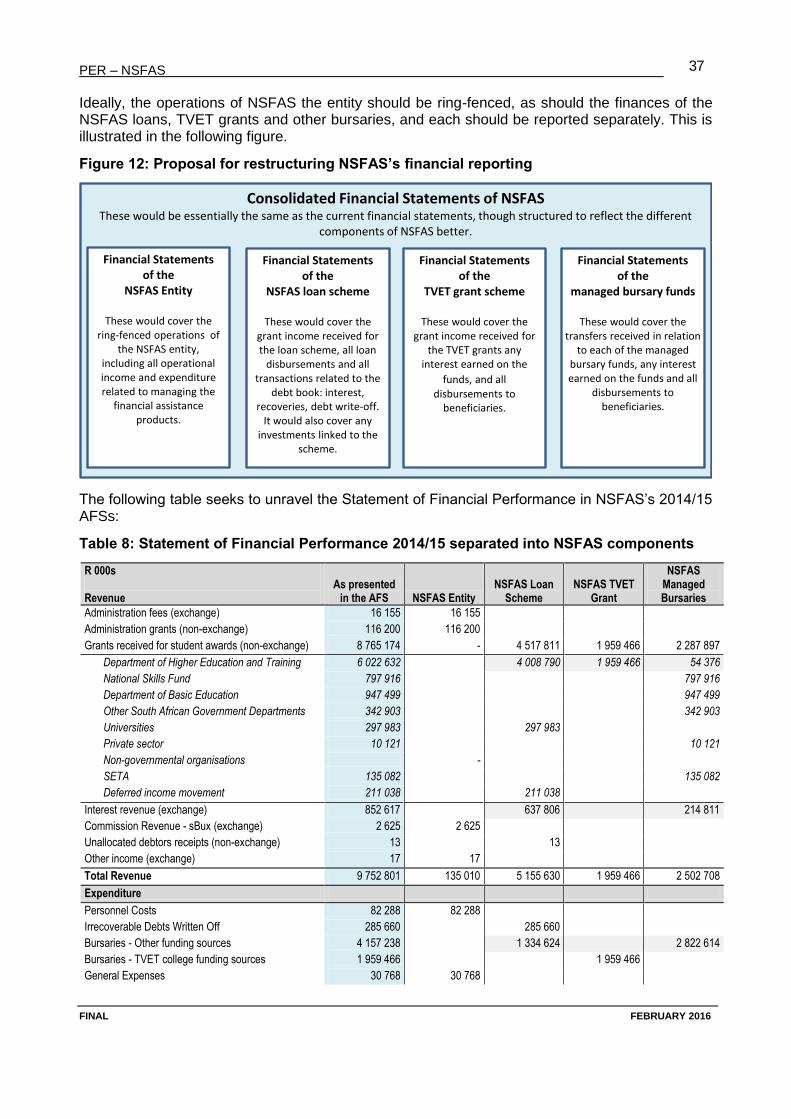
PER – NSFAS
FINAL FEBRUARY 2016
37
Ideally, the operations of NSFAS the entity should be ring-fenced, as should the finances of the NSFAS loans, TVET grants and other bursaries, and each should be reported separately. This is illustrated in the following figure.
Figure 12: Proposal for restructuring NSFAS’s financial reporting
The following table seeks to unravel the Statement of Financial Performance in NSFAS’s 2014/15 AFSs:
Table 8: Statement of Financial Performance 2014/15 separated into NSFAS components
R 000s Revenue
As presented in the AFS NSFAS Entity
NSFAS Loan Scheme
NSFAS TVET Grant
NSFAS Managed Bursaries
Administration fees (exchange) 16 155 16 155
Administration grants (non-exchange) 116 200 116 200
Grants received for student awards (non-exchange) 8 765 174 - 4 517 811 1 959 466 2 287 897
Department of Higher Education and Training 6 022 632 4 008 790 1 959 466 54 376
National Skills Fund 797 916 797 916
Department of Basic Education 947 499 947 499
Other South African Government Departments 342 903 342 903
Universities 297 983 297 983
Private sector 10 121 10 121
Non-governmental organisations -
SETA 135 082 135 082
Deferred income movement 211 038 211 038
Interest revenue (exchange) 852 617 637 806 214 811
Commission Revenue - sBux (exchange) 2 625 2 625
Unallocated debtors receipts (non-exchange) 13 13
Other income (exchange) 17 17
Total Revenue 9 752 801 135 010 5 155 630 1 959 466 2 502 708
Expenditure
Personnel Costs 82 288 82 288
Irrecoverable Debts Written Off 285 660 285 660
Bursaries - Other funding sources 4 157 238 1 334 624 2 822 614
Bursaries - TVET college funding sources 1 959 466 1 959 466
General Expenses 30 768 30 768
Consolidated Financial Statements of NSFASThese would be essentially the same as the current financial statements, though structured to reflect the different
components of NSFAS better.
Financial Statements of the
NSFAS Entity
These would cover the ring-fenced operations of
the NSFAS entity, including all operational income and expenditure related to managing the
financial assistance products.
Financial Statements of the
NSFAS loan scheme
These would cover the grant income received for the loan scheme, all loan
disbursements and all transactions related to the
debt book: interest, recoveries, debt write-off.
It would also cover any investments linked to the
scheme.
Financial Statements of the
TVET grant scheme
These would cover the grant income received for
the TVET grants anyinterest earned on the
funds, and all
disbursements to beneficiaries.
Financial Statements of the
managed bursary funds
These would cover the transfers received in relation
to each of the managed bursary funds, any interest earned on the funds and all
disbursements to beneficiaries.
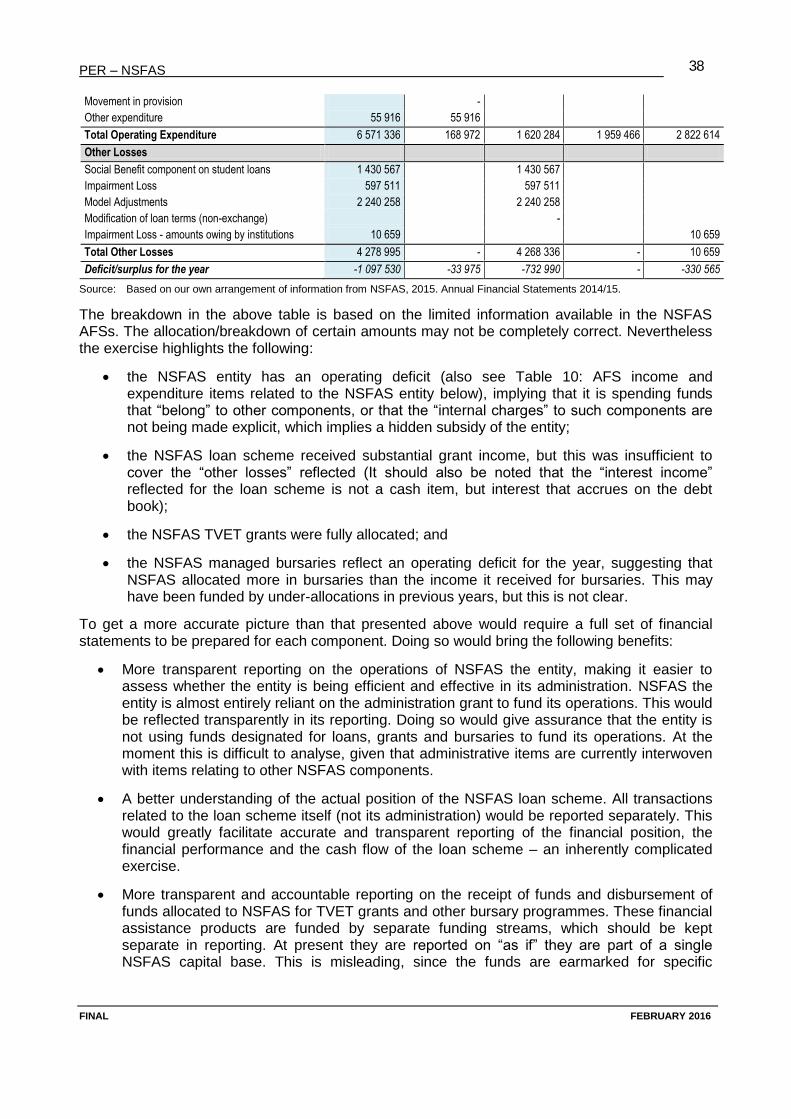
PER – NSFAS
FINAL FEBRUARY 2016
38
Movement in provision -
Other expenditure 55 916 55 916
Total Operating Expenditure 6 571 336 168 972 1 620 284 1 959 466 2 822 614
Other Losses
Social Benefit component on student loans 1 430 567 1 430 567
Impairment Loss 597 511 597 511
Model Adjustments 2 240 258 2 240 258
Modification of loan terms (non-exchange) -
Impairment Loss - amounts owing by institutions 10 659 10 659
Total Other Losses 4 278 995 - 4 268 336 - 10 659
Deficit/surplus for the year -1 097 530 -33 975 -732 990 - -330 565
Source: Based on our own arrangement of information from NSFAS, 2015. Annual Financial Statements 2014/15.
The breakdown in the above table is based on the limited information available in the NSFAS AFSs. The allocation/breakdown of certain amounts may not be completely correct. Nevertheless the exercise highlights the following:
the NSFAS entity has an operating deficit (also see Table 10: AFS income and expenditure items related to the NSFAS entity below), implying that it is spending funds that “belong” to other components, or that the “internal charges” to such components are not being made explicit, which implies a hidden subsidy of the entity;
the NSFAS loan scheme received substantial grant income, but this was insufficient to cover the “other losses” reflected (It should also be noted that the “interest income” reflected for the loan scheme is not a cash item, but interest that accrues on the debt book);
the NSFAS TVET grants were fully allocated; and
the NSFAS managed bursaries reflect an operating deficit for the year, suggesting that NSFAS allocated more in bursaries than the income it received for bursaries. This may have been funded by under-allocations in previous years, but this is not clear.
To get a more accurate picture than that presented above would require a full set of financial statements to be prepared for each component. Doing so would bring the following benefits:
More transparent reporting on the operations of NSFAS the entity, making it easier to assess whether the entity is being efficient and effective in its administration. NSFAS the entity is almost entirely reliant on the administration grant to fund its operations. This would be reflected transparently in its reporting. Doing so would give assurance that the entity is not using funds designated for loans, grants and bursaries to fund its operations. At the moment this is difficult to analyse, given that administrative items are currently interwoven with items relating to other NSFAS components.
A better understanding of the actual position of the NSFAS loan scheme. All transactions related to the loan scheme itself (not its administration) would be reported separately. This would greatly facilitate accurate and transparent reporting of the financial position, the financial performance and the cash flow of the loan scheme – an inherently complicated exercise.
More transparent and accountable reporting on the receipt of funds and disbursement of funds allocated to NSFAS for TVET grants and other bursary programmes. These financial assistance products are funded by separate funding streams, which should be kept separate in reporting. At present they are reported on “as if” they are part of a single NSFAS capital base. This is misleading, since the funds are earmarked for specific
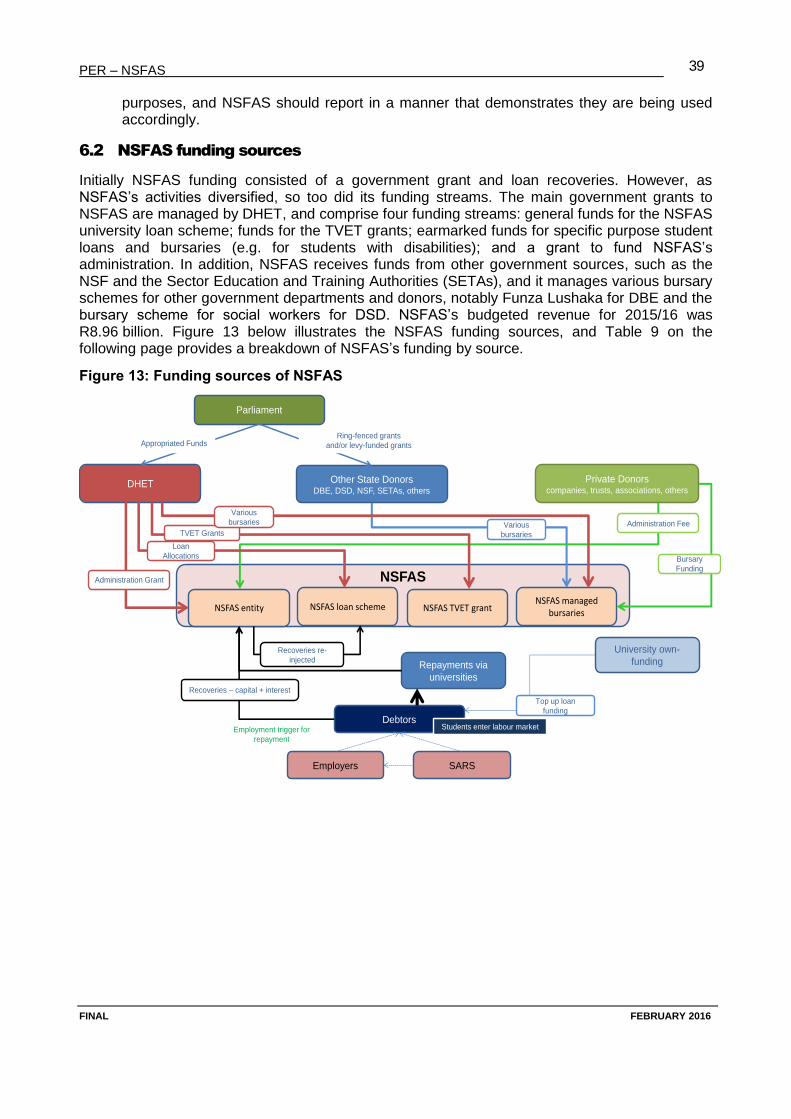
PER – NSFAS
FINAL FEBRUARY 2016
39
purposes, and NSFAS should report in a manner that demonstrates they are being used accordingly.
6.2 NSFAS funding sources
Initially NSFAS funding consisted of a government grant and loan recoveries. However, as NSFAS’s activities diversified, so too did its funding streams. The main government grants to NSFAS are managed by DHET, and comprise four funding streams: general funds for the NSFAS university loan scheme; funds for the TVET grants; earmarked funds for specific purpose student loans and bursaries (e.g. for students with disabilities); and a grant to fund NSFAS’s administration. In addition, NSFAS receives funds from other government sources, such as the NSF and the Sector Education and Training Authorities (SETAs), and it manages various bursary schemes for other government departments and donors, notably Funza Lushaka for DBE and the bursary scheme for social workers for DSD. NSFAS’s budgeted revenue for 2015/16 was R8.96 billion. Figure 13 below illustrates the NSFAS funding sources, and Table 9 on the following page provides a breakdown of NSFAS’s funding by source.
Figure 13: Funding sources of NSFAS
Parliament
DHET Other State Donors DBE, DSD, NSF, SETAs, others
Private Donorscompanies, trusts, associations, others
University own-
funding
NSFAS
Debtors
SARSEmployers
Appropriated FundsRing-fenced grants
and/or levy-funded grants
Repayments via
universities
Students enter labour marketEmployment trigger for
repayment
NSFAS entity NSFAS loan scheme NSFAS TVET grantNSFAS managed
bursaries
Recoveries – capital + interest
Recoveries re-
injected
Administration Grant
Administration Fee
Bursary
Funding
TVET Grants
Loan
Allocations
Various
bursaries
Various
bursaries
Top up loan
funding
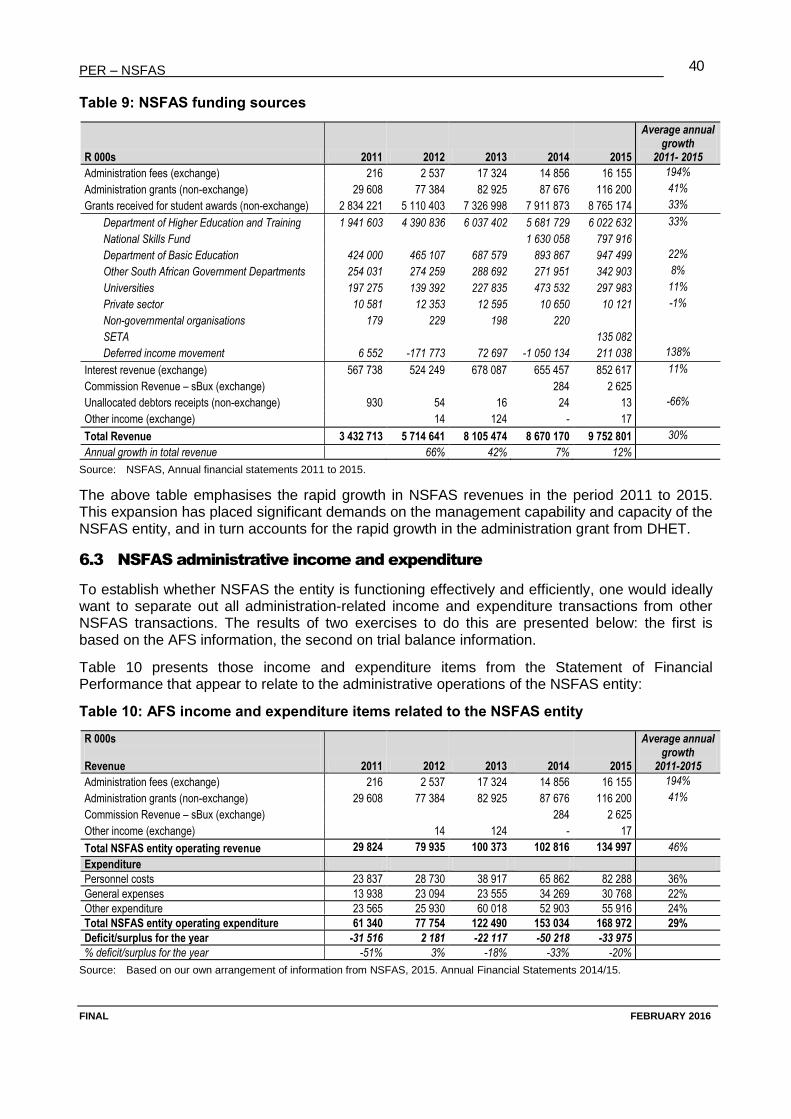
PER – NSFAS
FINAL FEBRUARY 2016
40
Table 9: NSFAS funding sources
R 000s 2011 2012 2013 2014 2015
Average annual growth
2011- 2015
Administration fees (exchange) 216 2 537 17 324 14 856 16 155 194%
Administration grants (non-exchange) 29 608 77 384 82 925 87 676 116 200 41%
Grants received for student awards (non-exchange) 2 834 221 5 110 403 7 326 998 7 911 873 8 765 174 33%
Department of Higher Education and Training 1 941 603 4 390 836 6 037 402 5 681 729 6 022 632 33%
National Skills Fund 1 630 058 797 916
Department of Basic Education 424 000 465 107 687 579 893 867 947 499 22%
Other South African Government Departments 254 031 274 259 288 692 271 951 342 903 8%
Universities 197 275 139 392 227 835 473 532 297 983 11%
Private sector 10 581 12 353 12 595 10 650 10 121 -1%
Non-governmental organisations 179 229 198 220
SETA 135 082
Deferred income movement 6 552 -171 773 72 697 -1 050 134 211 038 138%
Interest revenue (exchange) 567 738 524 249 678 087 655 457 852 617 11%
Commission Revenue – sBux (exchange) 284 2 625
Unallocated debtors receipts (non-exchange) 930 54 16 24 13 -66%
Other income (exchange) 14 124 - 17
Total Revenue 3 432 713 5 714 641 8 105 474 8 670 170 9 752 801 30%
Annual growth in total revenue 66% 42% 7% 12%
Source: NSFAS, Annual financial statements 2011 to 2015.
The above table emphasises the rapid growth in NSFAS revenues in the period 2011 to 2015. This expansion has placed significant demands on the management capability and capacity of the NSFAS entity, and in turn accounts for the rapid growth in the administration grant from DHET.
6.3 NSFAS administrative income and expenditure
To establish whether NSFAS the entity is functioning effectively and efficiently, one would ideally want to separate out all administration-related income and expenditure transactions from other NSFAS transactions. The results of two exercises to do this are presented below: the first is based on the AFS information, the second on trial balance information.
Table 10 presents those income and expenditure items from the Statement of Financial Performance that appear to relate to the administrative operations of the NSFAS entity:
Table 10: AFS income and expenditure items related to the NSFAS entity
R 000s Revenue 2011 2012 2013 2014 2015
Average annual growth
2011-2015
Administration fees (exchange) 216 2 537 17 324 14 856 16 155 194%
Administration grants (non-exchange) 29 608 77 384 82 925 87 676 116 200 41%
Commission Revenue – sBux (exchange) 284 2 625
Other income (exchange) 14 124 - 17
Total NSFAS entity operating revenue 29 824 79 935 100 373 102 816 134 997 46%
Expenditure
Personnel costs 23 837 28 730 38 917 65 862 82 288 36%
General expenses 13 938 23 094 23 555 34 269 30 768 22%
Other expenditure 23 565 25 930 60 018 52 903 55 916 24%
Total NSFAS entity operating expenditure 61 340 77 754 122 490 153 034 168 972 29%
Deficit/surplus for the year -31 516 2 181 -22 117 -50 218 -33 975
% deficit/surplus for the year -51% 3% -18% -33% -20%
Source: Based on our own arrangement of information from NSFAS, 2015. Annual Financial Statements 2014/15.
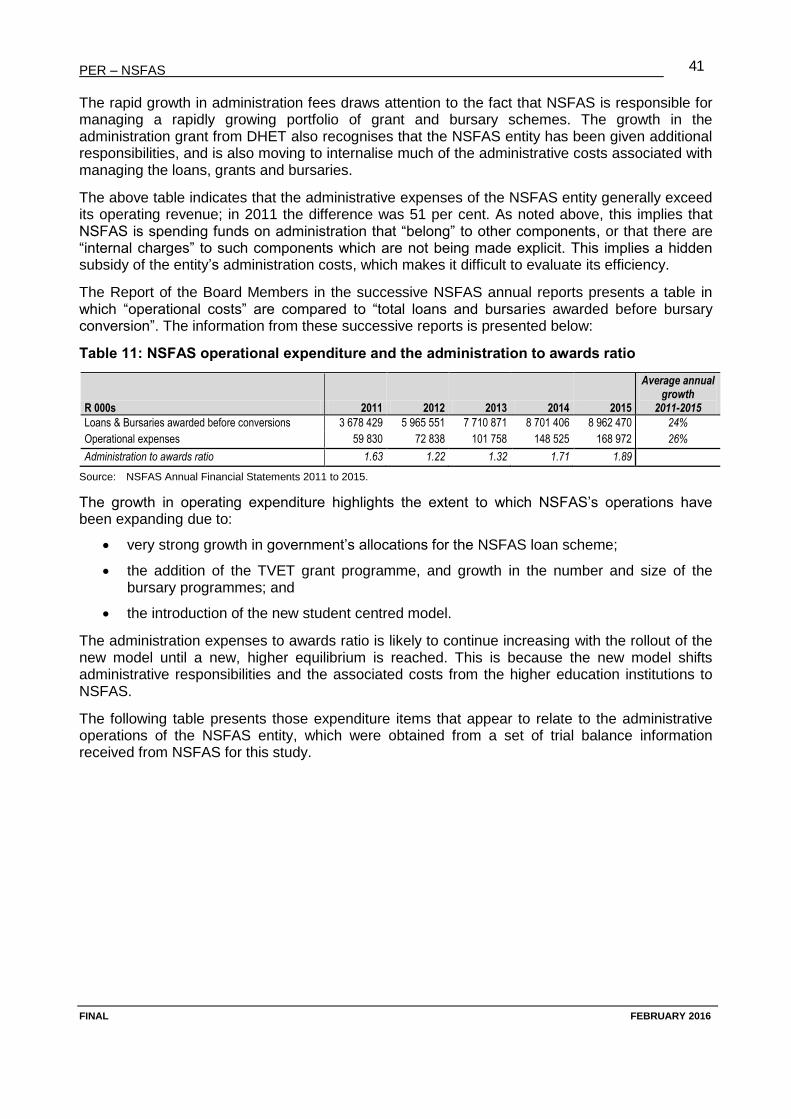
PER – NSFAS
FINAL FEBRUARY 2016
41
The rapid growth in administration fees draws attention to the fact that NSFAS is responsible for managing a rapidly growing portfolio of grant and bursary schemes. The growth in the administration grant from DHET also recognises that the NSFAS entity has been given additional responsibilities, and is also moving to internalise much of the administrative costs associated with managing the loans, grants and bursaries.
The above table indicates that the administrative expenses of the NSFAS entity generally exceed its operating revenue; in 2011 the difference was 51 per cent. As noted above, this implies that NSFAS is spending funds on administration that “belong” to other components, or that there are “internal charges” to such components which are not being made explicit. This implies a hidden subsidy of the entity’s administration costs, which makes it difficult to evaluate its efficiency.
The Report of the Board Members in the successive NSFAS annual reports presents a table in which “operational costs” are compared to “total loans and bursaries awarded before bursary conversion”. The information from these successive reports is presented below:
Table 11: NSFAS operational expenditure and the administration to awards ratio
R 000s 2011 2012 2013 2014 2015
Average annual growth
2011-2015
Loans & Bursaries awarded before conversions 3 678 429 5 965 551 7 710 871 8 701 406 8 962 470 24%
Operational expenses 59 830 72 838 101 758 148 525 168 972 26%
Administration to awards ratio 1.63 1.22 1.32 1.71 1.89
Source: NSFAS Annual Financial Statements 2011 to 2015.
The growth in operating expenditure highlights the extent to which NSFAS’s operations have been expanding due to:
very strong growth in government’s allocations for the NSFAS loan scheme;
the addition of the TVET grant programme, and growth in the number and size of the bursary programmes; and
the introduction of the new student centred model.
The administration expenses to awards ratio is likely to continue increasing with the rollout of the new model until a new, higher equilibrium is reached. This is because the new model shifts administrative responsibilities and the associated costs from the higher education institutions to NSFAS.
The following table presents those expenditure items that appear to relate to the administrative operations of the NSFAS entity, which were obtained from a set of trial balance information received from NSFAS for this study.

PER – NSFAS
FINAL FEBRUARY 2016
42
Table 12: Trial balance expenditure items related to the NSFAS entity
R 000s Expenditure 2012 2013 2014
Average annual growth
% of total expenditure
2012 2013 2014
Total personnel expenditure 33 675 41 134 68 930 43% 46% 40% 48%
Salaries and wages 32 085 38 916 65 872 43% 44% 38% 46%
Recruitment 1 305 1 641 1 894 20% 2% 2% 1%
Staff development 285 577 1 164 102% 0% 1% 1%
Total non-personnel expenditure 40 044 61 081 73 980 43% 54% 60% 52%
Depreciation 2 077 4 539 30 809 285% 3% 4% 22%
Audit fees 9 150 8 938 9 911 4% 12% 9% 7%
Overheads 9 281 8 580 7 332 -11% 13% 8% 5%
IT and related 1 610 2 776 4 824 73% 2% 3% 3%
Travel and subsistence 1 510 1 864 4 657 76% 2% 2% 3%
Transformation strategy 6 061 20 017 4 562 -13% 8% 20% 3%
Debtor tracking - customer care 30 319 3 120 925% 0% 0% 2%
Broader communication 2 095 1 656 2 480 9% 3% 2% 2%
Consultants and advisors 5 332 8 075 2 337 -34% 7% 8% 2%
Legal services 418 1 249 2 228 131% 1% 1% 2%
Adverts and promotions 917 923 534 -24% 1% 1% 0%
Operations workshops 741 1 115 436 -23% 1% 1% 0%
Bank charges 659 557 406 -22% 1% 1% 0%
Entertainment 161 472 342 46% 0% 0% 0%
Fines 1 1 1 7% 0% 0% 0%
Total 73 719 102 215 142 910 39% 100% 100% 100%
Source: Own arrangement of Trial Balance information provided by NSFAS.
With reference to the above table:
The table confirms the strong growth in overall administrative expenditure, driven equally by personnel and non-personnel spending;
The high growth in depreciation is likely to be due to NSFAS’s heavy investment in IT infrastructure and software, in line with its new responsibilities and the implementation of the new student centred model.
There are a number of expenses that can be directly linked to the implementation of the new model: transformation strategy, consultants and advisors, a part of customer care and IT and related expenditures. These are likely to remain high while the new model is being rolled-out, but should moderate thereafter – as some have already done. However, the decline in consultants and advisors has been offset by strong growth in personnel.
The decline in bank charges is notable, especially given that the number of transactions being processed by NSFAS has increased very significantly.
Audit fees are high, but this is necessary as NSFAS seeks to sort out historical problems with its loan book.
6.4 NSFAS allocation of loans and disbursement of grants and bursaries
NSFAS presents information on the number of students awarded loans, grants and bursaries in two formats:71
71 For example, see NSFAS, 2015. Annual Financial Statements 2014/15, pages 75 and 76.
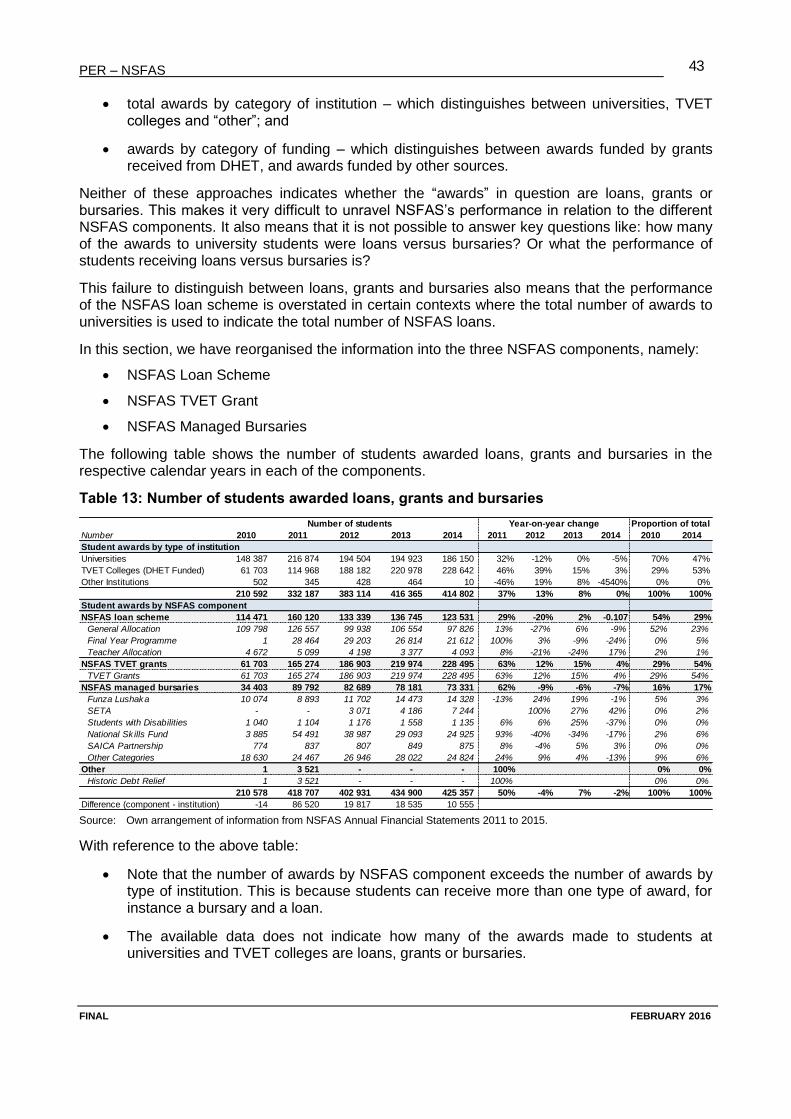
PER – NSFAS
FINAL FEBRUARY 2016
43
total awards by category of institution – which distinguishes between universities, TVET colleges and “other”; and
awards by category of funding – which distinguishes between awards funded by grants received from DHET, and awards funded by other sources.
Neither of these approaches indicates whether the “awards” in question are loans, grants or bursaries. This makes it very difficult to unravel NSFAS’s performance in relation to the different NSFAS components. It also means that it is not possible to answer key questions like: how many of the awards to university students were loans versus bursaries? Or what the performance of students receiving loans versus bursaries is?
This failure to distinguish between loans, grants and bursaries also means that the performance of the NSFAS loan scheme is overstated in certain contexts where the total number of awards to universities is used to indicate the total number of NSFAS loans.
In this section, we have reorganised the information into the three NSFAS components, namely:
NSFAS Loan Scheme
NSFAS TVET Grant
NSFAS Managed Bursaries
The following table shows the number of students awarded loans, grants and bursaries in the respective calendar years in each of the components.
Table 13: Number of students awarded loans, grants and bursaries
Source: Own arrangement of information from NSFAS Annual Financial Statements 2011 to 2015.
With reference to the above table:
Note that the number of awards by NSFAS component exceeds the number of awards by type of institution. This is because students can receive more than one type of award, for instance a bursary and a loan.
The available data does not indicate how many of the awards made to students at universities and TVET colleges are loans, grants or bursaries.
Number of students Year-on-year change Proportion of total
Number 2010 2011 2012 2013 2014 2011 2012 2013 2014 2010 2014
Student awards by type of institution
Universities 148 387 216 874 194 504 194 923 186 150 32% -12% 0% -5% 70% 47%
TVET Colleges (DHET Funded) 61 703 114 968 188 182 220 978 228 642 46% 39% 15% 3% 29% 53%
Other Institutions 502 345 428 464 10 -46% 19% 8% -4540% 0% 0%
210 592 332 187 383 114 416 365 414 802 37% 13% 8% 0% 100% 100%
Student awards by NSFAS component
NSFAS loan scheme 114 471 160 120 133 339 136 745 123 531 29% -20% 2% -0.107 54% 29%
General Allocation 109 798 126 557 99 938 106 554 97 826 13% -27% 6% -9% 52% 23%
Final Year Programme 1 28 464 29 203 26 814 21 612 100% 3% -9% -24% 0% 5%
Teacher Allocation 4 672 5 099 4 198 3 377 4 093 8% -21% -24% 17% 2% 1%
NSFAS TVET grants 61 703 165 274 186 903 219 974 228 495 63% 12% 15% 4% 29% 54%
TVET Grants 61 703 165 274 186 903 219 974 228 495 63% 12% 15% 4% 29% 54%
NSFAS managed bursaries 34 403 89 792 82 689 78 181 73 331 62% -9% -6% -7% 16% 17%
Funza Lushaka 10 074 8 893 11 702 14 473 14 328 -13% 24% 19% -1% 5% 3%
SETA - - 3 071 4 186 7 244 100% 27% 42% 0% 2%
Students with Disabilities 1 040 1 104 1 176 1 558 1 135 6% 6% 25% -37% 0% 0%
National Sk ills Fund 3 885 54 491 38 987 29 093 24 925 93% -40% -34% -17% 2% 6%
SAICA Partnership 774 837 807 849 875 8% -4% 5% 3% 0% 0%
Other Categories 18 630 24 467 26 946 28 022 24 824 24% 9% 4% -13% 9% 6%
Other 1 3 521 - - - 100% 0% 0%
Historic Debt Relief 1 3 521 - - - 100% 0% 0%
210 578 418 707 402 931 434 900 425 357 50% -4% 7% -2% 100% 100%
Difference (component - institution) -14 86 520 19 817 18 535 10 555
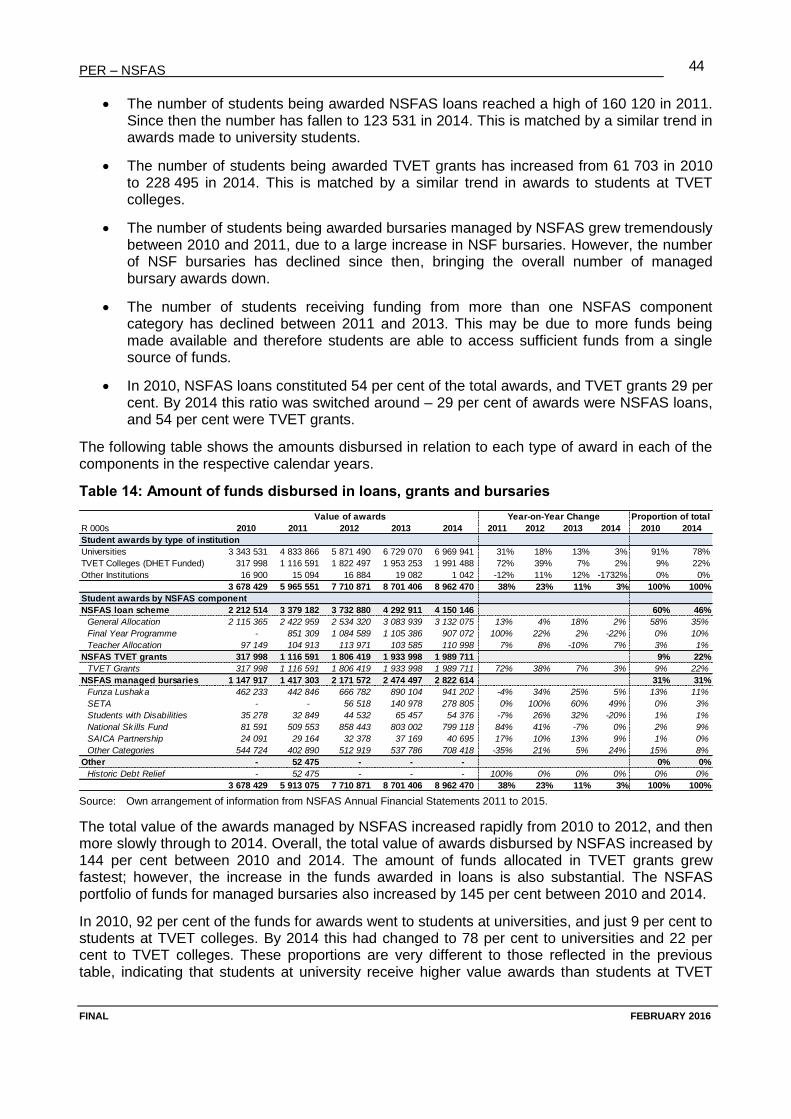
PER – NSFAS
FINAL FEBRUARY 2016
44
The number of students being awarded NSFAS loans reached a high of 160 120 in 2011. Since then the number has fallen to 123 531 in 2014. This is matched by a similar trend in awards made to university students.
The number of students being awarded TVET grants has increased from 61 703 in 2010 to 228 495 in 2014. This is matched by a similar trend in awards to students at TVET colleges.
The number of students being awarded bursaries managed by NSFAS grew tremendously between 2010 and 2011, due to a large increase in NSF bursaries. However, the number of NSF bursaries has declined since then, bringing the overall number of managed bursary awards down.
The number of students receiving funding from more than one NSFAS component category has declined between 2011 and 2013. This may be due to more funds being made available and therefore students are able to access sufficient funds from a single source of funds.
In 2010, NSFAS loans constituted 54 per cent of the total awards, and TVET grants 29 per cent. By 2014 this ratio was switched around – 29 per cent of awards were NSFAS loans, and 54 per cent were TVET grants.
The following table shows the amounts disbursed in relation to each type of award in each of the components in the respective calendar years.
Table 14: Amount of funds disbursed in loans, grants and bursaries
Source: Own arrangement of information from NSFAS Annual Financial Statements 2011 to 2015.
The total value of the awards managed by NSFAS increased rapidly from 2010 to 2012, and then more slowly through to 2014. Overall, the total value of awards disbursed by NSFAS increased by 144 per cent between 2010 and 2014. The amount of funds allocated in TVET grants grew fastest; however, the increase in the funds awarded in loans is also substantial. The NSFAS portfolio of funds for managed bursaries also increased by 145 per cent between 2010 and 2014.
In 2010, 92 per cent of the funds for awards went to students at universities, and just 9 per cent to students at TVET colleges. By 2014 this had changed to 78 per cent to universities and 22 per cent to TVET colleges. These proportions are very different to those reflected in the previous table, indicating that students at university receive higher value awards than students at TVET
Value of awards Year-on-Year Change Proportion of total
R 000s 2010 2011 2012 2013 2014 2011 2012 2013 2014 2010 2014
Student awards by type of institution
Universities 3 343 531 4 833 866 5 871 490 6 729 070 6 969 941 31% 18% 13% 3% 91% 78%
TVET Colleges (DHET Funded) 317 998 1 116 591 1 822 497 1 953 253 1 991 488 72% 39% 7% 2% 9% 22%
Other Institutions 16 900 15 094 16 884 19 082 1 042 -12% 11% 12% -1732% 0% 0%
3 678 429 5 965 551 7 710 871 8 701 406 8 962 470 38% 23% 11% 3% 100% 100%
Student awards by NSFAS component
NSFAS loan scheme 2 212 514 3 379 182 3 732 880 4 292 911 4 150 146 60% 46%
General Allocation 2 115 365 2 422 959 2 534 320 3 083 939 3 132 075 13% 4% 18% 2% 58% 35%
Final Year Programme - 851 309 1 084 589 1 105 386 907 072 100% 22% 2% -22% 0% 10%
Teacher Allocation 97 149 104 913 113 971 103 585 110 998 7% 8% -10% 7% 3% 1%
NSFAS TVET grants 317 998 1 116 591 1 806 419 1 933 998 1 989 711 9% 22%
TVET Grants 317 998 1 116 591 1 806 419 1 933 998 1 989 711 72% 38% 7% 3% 9% 22%
NSFAS managed bursaries 1 147 917 1 417 303 2 171 572 2 474 497 2 822 614 31% 31%
Funza Lushaka 462 233 442 846 666 782 890 104 941 202 -4% 34% 25% 5% 13% 11%
SETA - - 56 518 140 978 278 805 0% 100% 60% 49% 0% 3%
Students with Disabilities 35 278 32 849 44 532 65 457 54 376 -7% 26% 32% -20% 1% 1%
National Sk ills Fund 81 591 509 553 858 443 803 002 799 118 84% 41% -7% 0% 2% 9%
SAICA Partnership 24 091 29 164 32 378 37 169 40 695 17% 10% 13% 9% 1% 0%
Other Categories 544 724 402 890 512 919 537 786 708 418 -35% 21% 5% 24% 15% 8%
Other - 52 475 - - - 0% 0%
Historic Debt Relief - 52 475 - - - 100% 0% 0% 0% 0% 0%
3 678 429 5 913 075 7 710 871 8 701 406 8 962 470 38% 23% 11% 3% 100% 100%
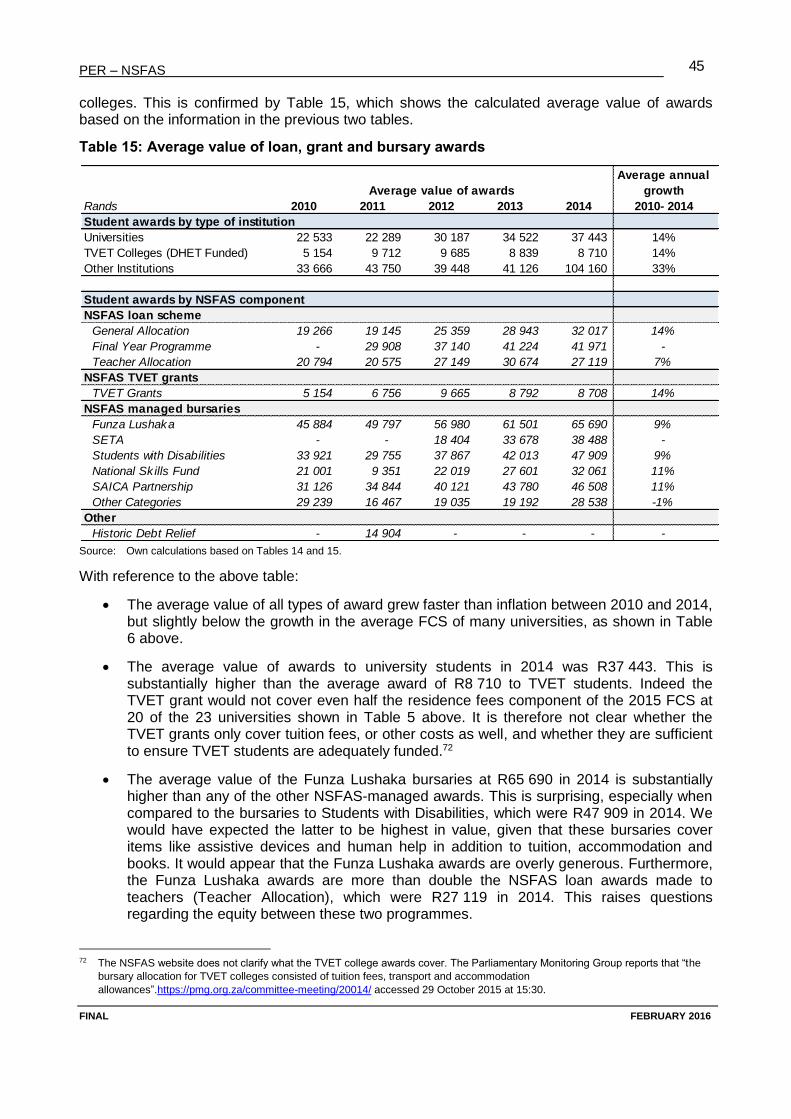
PER – NSFAS
FINAL FEBRUARY 2016
45
colleges. This is confirmed by Table 15, which shows the calculated average value of awards based on the information in the previous two tables.
Table 15: Average value of loan, grant and bursary awards
Source: Own calculations based on Tables 14 and 15.
With reference to the above table:
The average value of all types of award grew faster than inflation between 2010 and 2014, but slightly below the growth in the average FCS of many universities, as shown in Table 6 above.
The average value of awards to university students in 2014 was R37 443. This is substantially higher than the average award of R8 710 to TVET students. Indeed the TVET grant would not cover even half the residence fees component of the 2015 FCS at 20 of the 23 universities shown in Table 5 above. It is therefore not clear whether the TVET grants only cover tuition fees, or other costs as well, and whether they are sufficient to ensure TVET students are adequately funded.72
The average value of the Funza Lushaka bursaries at R65 690 in 2014 is substantially higher than any of the other NSFAS-managed awards. This is surprising, especially when compared to the bursaries to Students with Disabilities, which were R47 909 in 2014. We would have expected the latter to be highest in value, given that these bursaries cover items like assistive devices and human help in addition to tuition, accommodation and books. It would appear that the Funza Lushaka awards are overly generous. Furthermore, the Funza Lushaka awards are more than double the NSFAS loan awards made to teachers (Teacher Allocation), which were R27 119 in 2014. This raises questions regarding the equity between these two programmes.
72 The NSFAS website does not clarify what the TVET college awards cover. The Parliamentary Monitoring Group reports that “the
bursary allocation for TVET colleges consisted of tuition fees, transport and accommodation
allowances”.https://pmg.org.za/committee-meeting/20014/ accessed 29 October 2015 at 15:30.
Average value of awards
Rands 2010 2011 2012 2013 2014 2014
Student awards by type of institution
Universities 22 533 22 289 30 187 34 522 37 443 14%
TVET Colleges (DHET Funded) 5 154 9 712 9 685 8 839 8 710 14%
Other Institutions 33 666 43 750 39 448 41 126 104 160 33%
Student awards by NSFAS component
NSFAS loan scheme
General Allocation 19 266 19 145 25 359 28 943 32 017 14%
Final Year Programme - 29 908 37 140 41 224 41 971 -
Teacher Allocation 20 794 20 575 27 149 30 674 27 119 7%
NSFAS TVET grants
TVET Grants 5 154 6 756 9 665 8 792 8 708 14%
NSFAS managed bursaries
Funza Lushaka 45 884 49 797 56 980 61 501 65 690 9%
SETA - - 18 404 33 678 38 488 -
Students with Disabilities 33 921 29 755 37 867 42 013 47 909 9%
National Sk ills Fund 21 001 9 351 22 019 27 601 32 061 11%
SAICA Partnership 31 126 34 844 40 121 43 780 46 508 11%
Other Categories 29 239 16 467 19 035 19 192 28 538 -1%
Other
Historic Debt Relief - 14 904 - - - -
Average annual
growth
2010- 2014
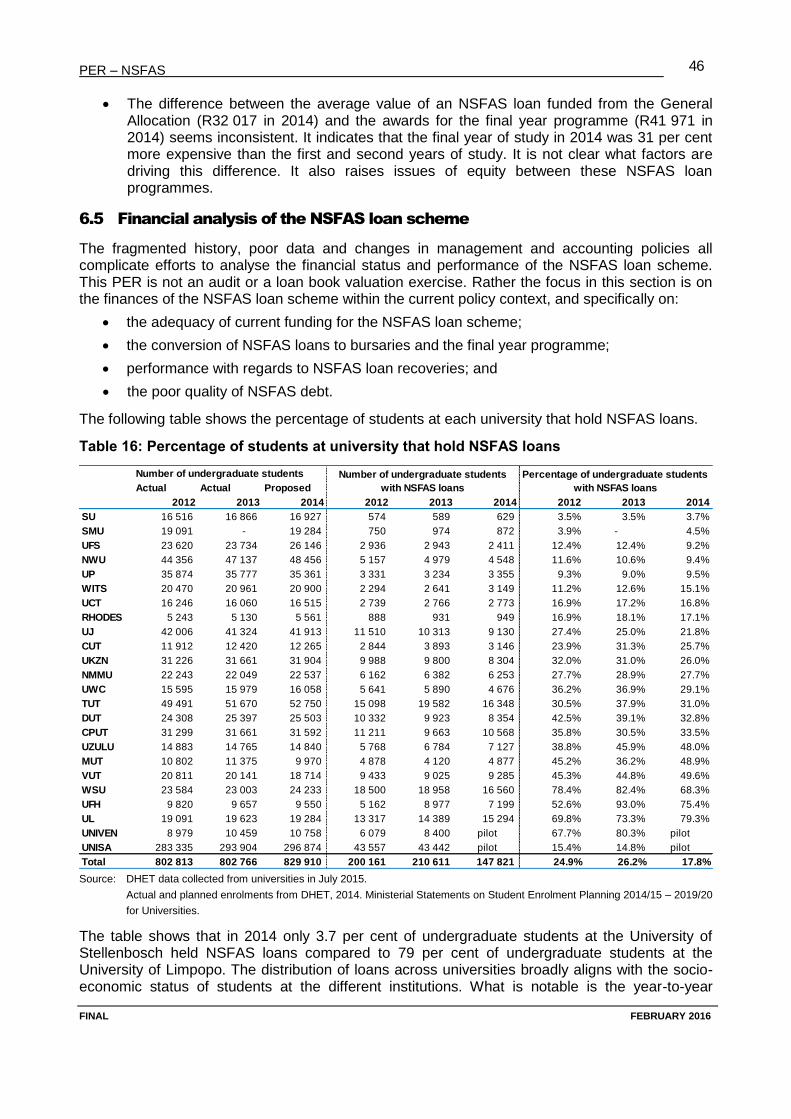
PER – NSFAS
FINAL FEBRUARY 2016
46
The difference between the average value of an NSFAS loan funded from the General Allocation (R32 017 in 2014) and the awards for the final year programme (R41 971 in 2014) seems inconsistent. It indicates that the final year of study in 2014 was 31 per cent more expensive than the first and second years of study. It is not clear what factors are driving this difference. It also raises issues of equity between these NSFAS loan programmes.
6.5 Financial analysis of the NSFAS loan scheme
The fragmented history, poor data and changes in management and accounting policies all complicate efforts to analyse the financial status and performance of the NSFAS loan scheme. This PER is not an audit or a loan book valuation exercise. Rather the focus in this section is on the finances of the NSFAS loan scheme within the current policy context, and specifically on:
the adequacy of current funding for the NSFAS loan scheme;
the conversion of NSFAS loans to bursaries and the final year programme;
performance with regards to NSFAS loan recoveries; and
the poor quality of NSFAS debt.
The following table shows the percentage of students at each university that hold NSFAS loans.
Table 16: Percentage of students at university that hold NSFAS loans
Source: DHET data collected from universities in July 2015.
Actual and planned enrolments from DHET, 2014. Ministerial Statements on Student Enrolment Planning 2014/15 – 2019/20
for Universities.
The table shows that in 2014 only 3.7 per cent of undergraduate students at the University of Stellenbosch held NSFAS loans compared to 79 per cent of undergraduate students at the University of Limpopo. The distribution of loans across universities broadly aligns with the socio-economic status of students at the different institutions. What is notable is the year-to-year
Number of undergraduate students
Actual Actual Proposed
2012 2013 2014 2012 2013 2014 2012 2013 2014
SU 16 516 16 866 16 927 574 589 629 3.5% 3.5% 3.7%
SMU 19 091 - 19 284 750 974 872 3.9% - 4.5%
UFS 23 620 23 734 26 146 2 936 2 943 2 411 12.4% 12.4% 9.2%
NWU 44 356 47 137 48 456 5 157 4 979 4 548 11.6% 10.6% 9.4%
UP 35 874 35 777 35 361 3 331 3 234 3 355 9.3% 9.0% 9.5%
WITS 20 470 20 961 20 900 2 294 2 641 3 149 11.2% 12.6% 15.1%
UCT 16 246 16 060 16 515 2 739 2 766 2 773 16.9% 17.2% 16.8%
RHODES 5 243 5 130 5 561 888 931 949 16.9% 18.1% 17.1%
UJ 42 006 41 324 41 913 11 510 10 313 9 130 27.4% 25.0% 21.8%
CUT 11 912 12 420 12 265 2 844 3 893 3 146 23.9% 31.3% 25.7%
UKZN 31 226 31 661 31 904 9 988 9 800 8 304 32.0% 31.0% 26.0%
NMMU 22 243 22 049 22 537 6 162 6 382 6 253 27.7% 28.9% 27.7%
UWC 15 595 15 979 16 058 5 641 5 890 4 676 36.2% 36.9% 29.1%
TUT 49 491 51 670 52 750 15 098 19 582 16 348 30.5% 37.9% 31.0%
DUT 24 308 25 397 25 503 10 332 9 923 8 354 42.5% 39.1% 32.8%
CPUT 31 299 31 661 31 592 11 211 9 663 10 568 35.8% 30.5% 33.5%
UZULU 14 883 14 765 14 840 5 768 6 784 7 127 38.8% 45.9% 48.0%
MUT 10 802 11 375 9 970 4 878 4 120 4 877 45.2% 36.2% 48.9%
VUT 20 811 20 141 18 714 9 433 9 025 9 285 45.3% 44.8% 49.6%
WSU 23 584 23 003 24 233 18 500 18 958 16 560 78.4% 82.4% 68.3%
UFH 9 820 9 657 9 550 5 162 8 977 7 199 52.6% 93.0% 75.4%
UL 19 091 19 623 19 284 13 317 14 389 15 294 69.8% 73.3% 79.3%
UNIVEN 8 979 10 459 10 758 6 079 8 400 pilot 67.7% 80.3% pilot
UNISA 283 335 293 904 296 874 43 557 43 442 pilot 15.4% 14.8% pilot
Total 802 813 802 766 829 910 200 161 210 611 147 821 24.9% 26.2% 17.8%
Number of undergraduate students
with NSFAS loans
Percentage of undergraduate students
with NSFAS loans
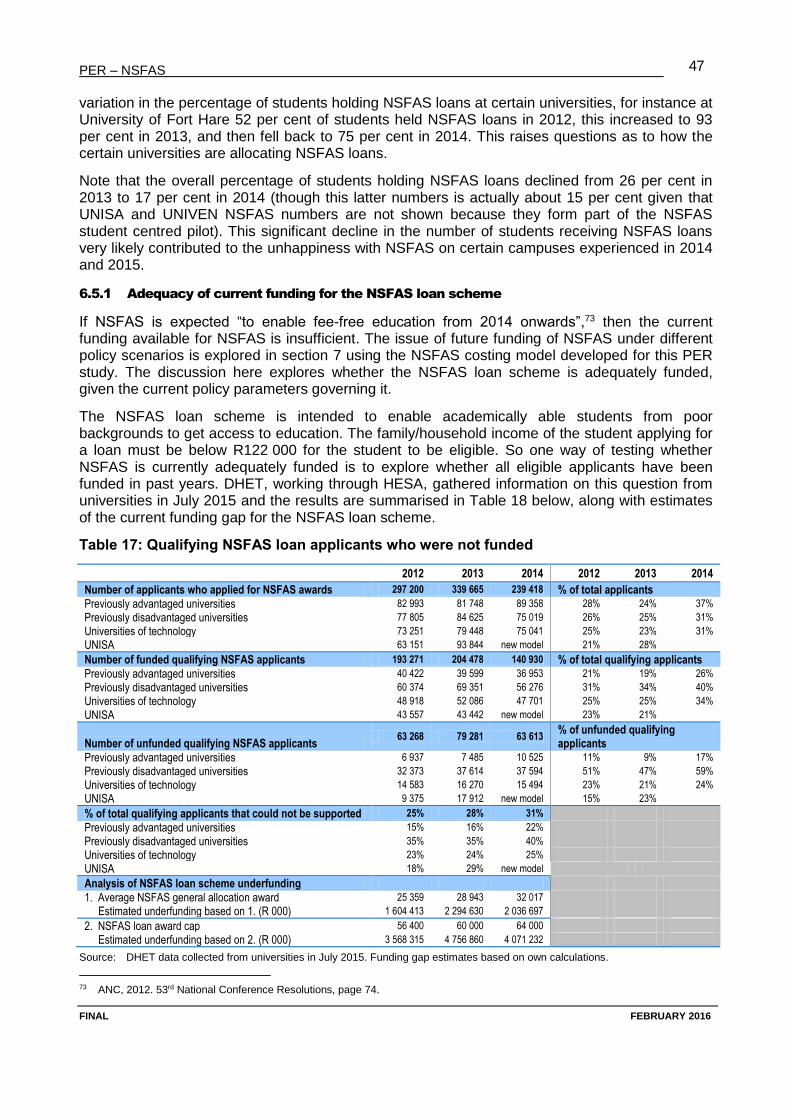
PER – NSFAS
FINAL FEBRUARY 2016
47
variation in the percentage of students holding NSFAS loans at certain universities, for instance at University of Fort Hare 52 per cent of students held NSFAS loans in 2012, this increased to 93 per cent in 2013, and then fell back to 75 per cent in 2014. This raises questions as to how the certain universities are allocating NSFAS loans.
Note that the overall percentage of students holding NSFAS loans declined from 26 per cent in 2013 to 17 per cent in 2014 (though this latter numbers is actually about 15 per cent given that UNISA and UNIVEN NSFAS numbers are not shown because they form part of the NSFAS student centred pilot). This significant decline in the number of students receiving NSFAS loans very likely contributed to the unhappiness with NSFAS on certain campuses experienced in 2014 and 2015.
6.5.1 Adequacy of current funding for the NSFAS loan scheme
If NSFAS is expected “to enable fee-free education from 2014 onwards”,73 then the current funding available for NSFAS is insufficient. The issue of future funding of NSFAS under different policy scenarios is explored in section 7 using the NSFAS costing model developed for this PER study. The discussion here explores whether the NSFAS loan scheme is adequately funded, given the current policy parameters governing it.
The NSFAS loan scheme is intended to enable academically able students from poor backgrounds to get access to education. The family/household income of the student applying for a loan must be below R122 000 for the student to be eligible. So one way of testing whether NSFAS is currently adequately funded is to explore whether all eligible applicants have been funded in past years. DHET, working through HESA, gathered information on this question from universities in July 2015 and the results are summarised in Table 18 below, along with estimates of the current funding gap for the NSFAS loan scheme.
Table 17: Qualifying NSFAS loan applicants who were not funded
2012 2013 2014 2012 2013 2014
Number of applicants who applied for NSFAS awards 297 200 339 665 239 418 % of total applicants
Previously advantaged universities 82 993 81 748 89 358 28% 24% 37%
Previously disadvantaged universities 77 805 84 625 75 019 26% 25% 31%
Universities of technology 73 251 79 448 75 041 25% 23% 31%
UNISA 63 151 93 844 new model 21% 28%
Number of funded qualifying NSFAS applicants 193 271 204 478 140 930 % of total qualifying applicants
Previously advantaged universities 40 422 39 599 36 953 21% 19% 26%
Previously disadvantaged universities 60 374 69 351 56 276 31% 34% 40%
Universities of technology 48 918 52 086 47 701 25% 25% 34%
UNISA 43 557 43 442 new model 23% 21%
Number of unfunded qualifying NSFAS applicants 63 268 79 281 63 613
% of unfunded qualifying applicants
Previously advantaged universities 6 937 7 485 10 525 11% 9% 17%
Previously disadvantaged universities 32 373 37 614 37 594 51% 47% 59%
Universities of technology 14 583 16 270 15 494 23% 21% 24%
UNISA 9 375 17 912 new model 15% 23%
% of total qualifying applicants that could not be supported 25% 28% 31%
Previously advantaged universities 15% 16% 22% Previously disadvantaged universities 35% 35% 40% Universities of technology 23% 24% 25% UNISA 18% 29% new model
Analysis of NSFAS loan scheme underfunding
1. Average NSFAS general allocation award 25 359 28 943 32 017 Estimated underfunding based on 1. (R 000) 1 604 413 2 294 630 2 036 697
2. NSFAS loan award cap 56 400 60 000 64 000 Estimated underfunding based on 2. (R 000) 3 568 315 4 756 860 4 071 232
Source: DHET data collected from universities in July 2015. Funding gap estimates based on own calculations.
73 ANC, 2012. 53rd National Conference Resolutions, page 74.
PER – NSFAS
FINAL FEBRUARY 2016
48
The above table shows that 63 613 (or 31 per cent) qualifying applicants for NSFAS loans in 2014 could not be funded because there were insufficient funds. In that year, the average NSFAS loan award was about R32 000. This means that the funding shortfall for NSFAS loans was slightly more than R2 billion in 2014. If the funding requirement gap is based on the NSFAS loan award cap of R64 000, then the shortfall for NSFAS loans was about R4 billion. Both these estimates are substantially less than the “additional allocation of R10.2 billion” that DHET74 indicated to Parliament would be “required to fully fund all qualifying NSFAS students in the 2015 cohort (all eligible new students)”. These different estimates highlight the need to be fully transparent regarding the assumptions being used to estimate the funding requirements of the NSFAS loan scheme.
Table 17 also shows that the funding shortfall is not evenly spread across universities. In 2014, 40 per cent of the unfunded students were at previously disadvantaged universities, compared to 22 per cent at previously advantaged universities, and 25 per cent at universities of technology. This is strong evidence that the current race-based formula for allocating NSFAS funding between universities is highly inequitable. This confirms a key finding of the Review Committee, which recommended that the race-based formula be replaced by a class-based model using solely socio-economic criteria.75 According to NSFAS the race-based formula was last used in 2011. However, since then the allocations to each university have increased in proportion to the available funding – so in practice the current allocations are still founded on the race-based formula. Full rollout of the new model would make the need to reform the current allocations redundant. However, it has been five years since the Review Committee made this recommendation, and the NSFAS Board has indicated that the rollout of the new model is going to proceed slowly. Either the rollout of the new model needs to be accelerated or the allocations to universities need to be reviewed urgently.
It is clear that the NSFAS loan scheme requires additional funding. However, when estimating the extent of the funding gap, one needs to take into account:
the cap on NSFAS loan awards is significantly less than the average FCS at most universities, and the gap between the cap and the average FCS has been increasing because the average FCS at most universities has been rising faster than the growth of the cap (see Table 17 above).
at least six universities routinely “top-slice” NSFAS loan awards, i.e. they divide up the available funding between all eligible applicants, meaning that all are underfunded to a greater or lesser extent.
Both these factors pose a significant risk to the effectiveness of NSFAS loans, as it means students are only partially funded. As the Review Committee notes:
Underfunding does not enable students to succeed. Some students can overcome the impediment of underfunding by, for example, taking on part-time jobs. Others, especially students at rural institutions, cannot supplement their loans with part-time work as there are few part-time jobs available in rural areas. It is a cruel irony that in this use of NSFAS loans to inadequately fund many students, NSFAS contributes to a high dropout and failure rate among the very group for whom the scheme was set up to provide access to higher education – precisely the “revolving door” outcome against which the White Paper warned in 1997: poor students gaining access to the higher education system, but being unable to complete their studies, so being “revolved” back into poverty – in this case with the additional burden of a student loan
74 DHET, 2015. Presentation to the Portfolio Committee on Higher Education and Training, 18 February 2015. 75 DHET, 2010. Report of the Ministerial Committee on the Review of the National Student Financial Aid Scheme, page 38.
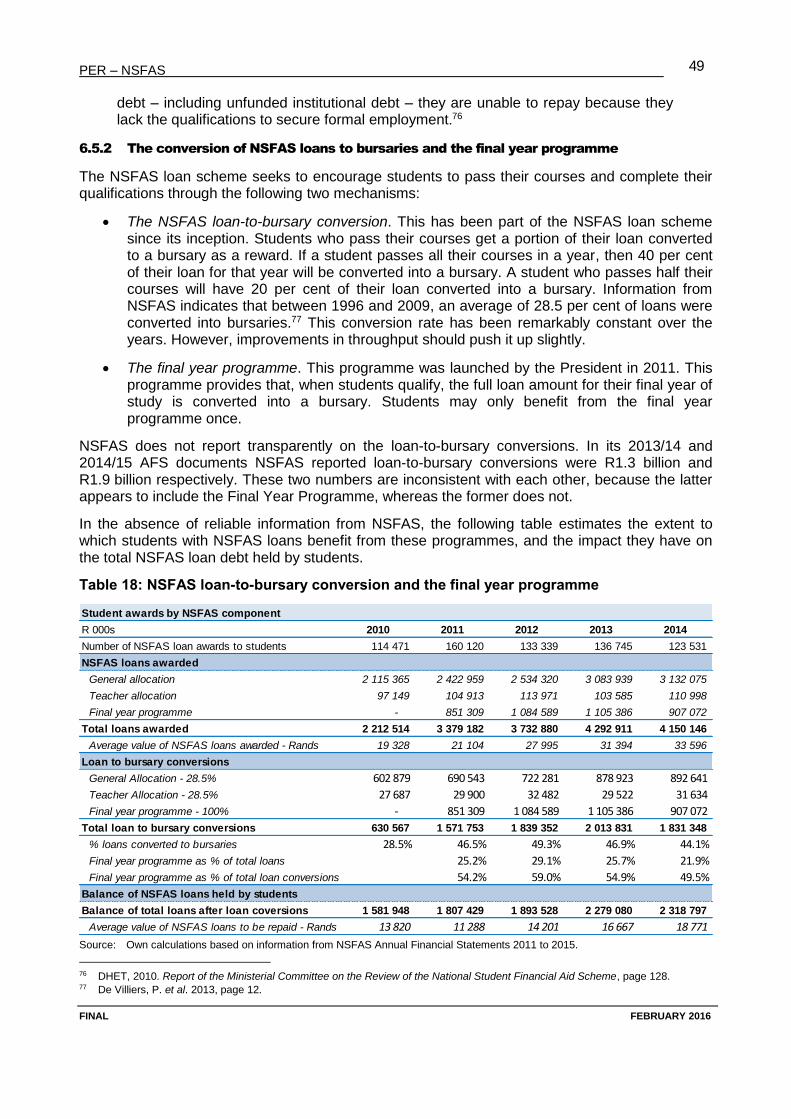
PER – NSFAS
FINAL FEBRUARY 2016
49
debt – including unfunded institutional debt – they are unable to repay because they lack the qualifications to secure formal employment.76
6.5.2 The conversion of NSFAS loans to bursaries and the final year programme
The NSFAS loan scheme seeks to encourage students to pass their courses and complete their qualifications through the following two mechanisms:
The NSFAS loan-to-bursary conversion. This has been part of the NSFAS loan scheme since its inception. Students who pass their courses get a portion of their loan converted to a bursary as a reward. If a student passes all their courses in a year, then 40 per cent of their loan for that year will be converted into a bursary. A student who passes half their courses will have 20 per cent of their loan converted into a bursary. Information from NSFAS indicates that between 1996 and 2009, an average of 28.5 per cent of loans were converted into bursaries.77 This conversion rate has been remarkably constant over the years. However, improvements in throughput should push it up slightly.
The final year programme. This programme was launched by the President in 2011. This programme provides that, when students qualify, the full loan amount for their final year of study is converted into a bursary. Students may only benefit from the final year programme once.
NSFAS does not report transparently on the loan-to-bursary conversions. In its 2013/14 and 2014/15 AFS documents NSFAS reported loan-to-bursary conversions were R1.3 billion and R1.9 billion respectively. These two numbers are inconsistent with each other, because the latter appears to include the Final Year Programme, whereas the former does not.
In the absence of reliable information from NSFAS, the following table estimates the extent to which students with NSFAS loans benefit from these programmes, and the impact they have on the total NSFAS loan debt held by students.
Table 18: NSFAS loan-to-bursary conversion and the final year programme
Source: Own calculations based on information from NSFAS Annual Financial Statements 2011 to 2015.
76 DHET, 2010. Report of the Ministerial Committee on the Review of the National Student Financial Aid Scheme, page 128. 77 De Villiers, P. et al. 2013, page 12.
Student awards by NSFAS component
R 000s 2010 2011 2012 2013 2014
Number of NSFAS loan awards to students 114 471 160 120 133 339 136 745 123 531
NSFAS loans awarded
General allocation 2 115 365 2 422 959 2 534 320 3 083 939 3 132 075
Teacher allocation 97 149 104 913 113 971 103 585 110 998
Final year programme - 851 309 1 084 589 1 105 386 907 072
Total loans awarded 2 212 514 3 379 182 3 732 880 4 292 911 4 150 146
Average value of NSFAS loans awarded - Rands 19 328 21 104 27 995 31 394 33 596
Loan to bursary conversions
General Allocation - 28.5% 602 879 690 543 722 281 878 923 892 641
Teacher Allocation - 28.5% 27 687 29 900 32 482 29 522 31 634
Final year programme - 100% - 851 309 1 084 589 1 105 386 907 072
Total loan to bursary conversions 630 567 1 571 753 1 839 352 2 013 831 1 831 348
% loans converted to bursaries 28.5% 46.5% 49.3% 46.9% 44.1%
Final year programme as % of total loans 25.2% 29.1% 25.7% 21.9%
Final year programme as % of total loan conversions 54.2% 59.0% 54.9% 49.5%
Balance of NSFAS loans held by students
Balance of total loans after loan coversions 1 581 948 1 807 429 1 893 528 2 279 080 2 318 797
Average value of NSFAS loans to be repaid - Rands 13 820 11 288 14 201 16 667 18 771
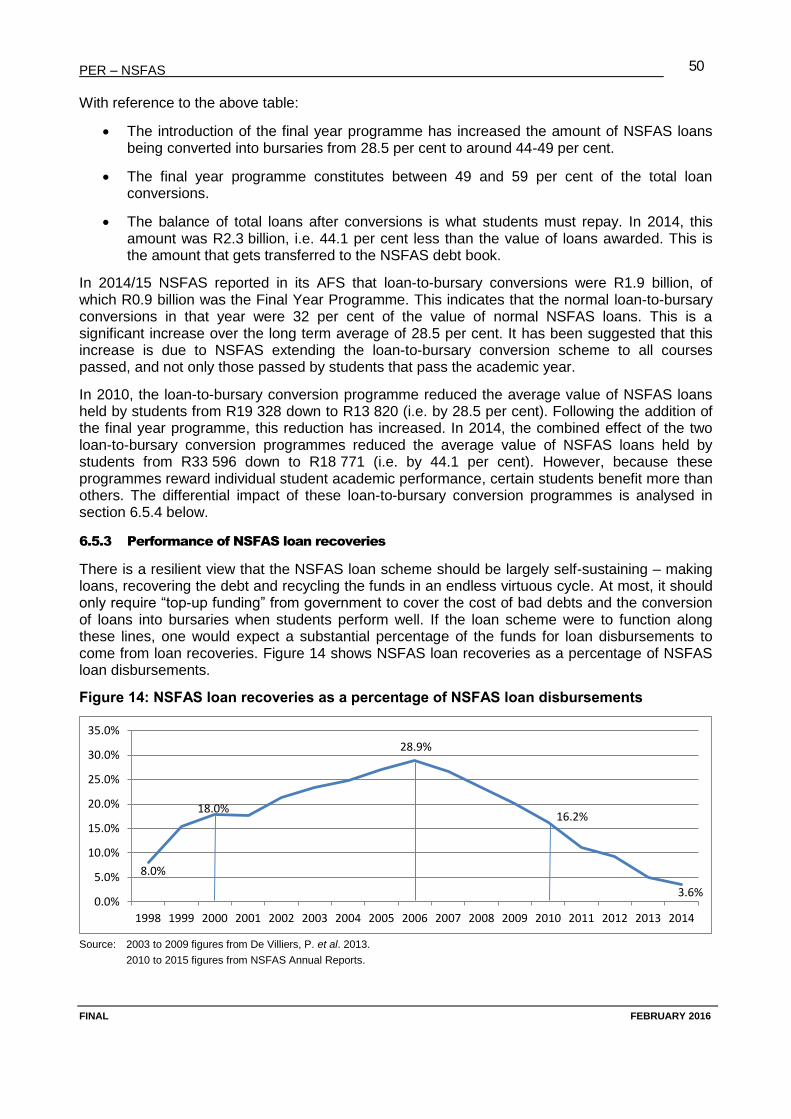
PER – NSFAS
FINAL FEBRUARY 2016
50
With reference to the above table:
The introduction of the final year programme has increased the amount of NSFAS loans being converted into bursaries from 28.5 per cent to around 44-49 per cent.
The final year programme constitutes between 49 and 59 per cent of the total loan conversions.
The balance of total loans after conversions is what students must repay. In 2014, this amount was R2.3 billion, i.e. 44.1 per cent less than the value of loans awarded. This is the amount that gets transferred to the NSFAS debt book.
In 2014/15 NSFAS reported in its AFS that loan-to-bursary conversions were R1.9 billion, of which R0.9 billion was the Final Year Programme. This indicates that the normal loan-to-bursary conversions in that year were 32 per cent of the value of normal NSFAS loans. This is a significant increase over the long term average of 28.5 per cent. It has been suggested that this increase is due to NSFAS extending the loan-to-bursary conversion scheme to all courses passed, and not only those passed by students that pass the academic year.
In 2010, the loan-to-bursary conversion programme reduced the average value of NSFAS loans held by students from R19 328 down to R13 820 (i.e. by 28.5 per cent). Following the addition of the final year programme, this reduction has increased. In 2014, the combined effect of the two loan-to-bursary conversion programmes reduced the average value of NSFAS loans held by students from R33 596 down to R18 771 (i.e. by 44.1 per cent). However, because these programmes reward individual student academic performance, certain students benefit more than others. The differential impact of these loan-to-bursary conversion programmes is analysed in section 6.5.4 below.
6.5.3 Performance of NSFAS loan recoveries
There is a resilient view that the NSFAS loan scheme should be largely self-sustaining – making loans, recovering the debt and recycling the funds in an endless virtuous cycle. At most, it should only require “top-up funding” from government to cover the cost of bad debts and the conversion of loans into bursaries when students perform well. If the loan scheme were to function along these lines, one would expect a substantial percentage of the funds for loan disbursements to come from loan recoveries. Figure 14 shows NSFAS loan recoveries as a percentage of NSFAS loan disbursements.
Figure 14: NSFAS loan recoveries as a percentage of NSFAS loan disbursements
Source: 2003 to 2009 figures from De Villiers, P. et al. 2013.
2010 to 2015 figures from NSFAS Annual Reports.
8.0%
18.0%
28.9%
16.2%
3.6%0.0%
5.0%
10.0%
15.0%
20.0%
25.0%
30.0%
35.0%
1998 1999 2000 2001 2002 2003 2004 2005 2006 2007 2008 2009 2010 2011 2012 2013 2014
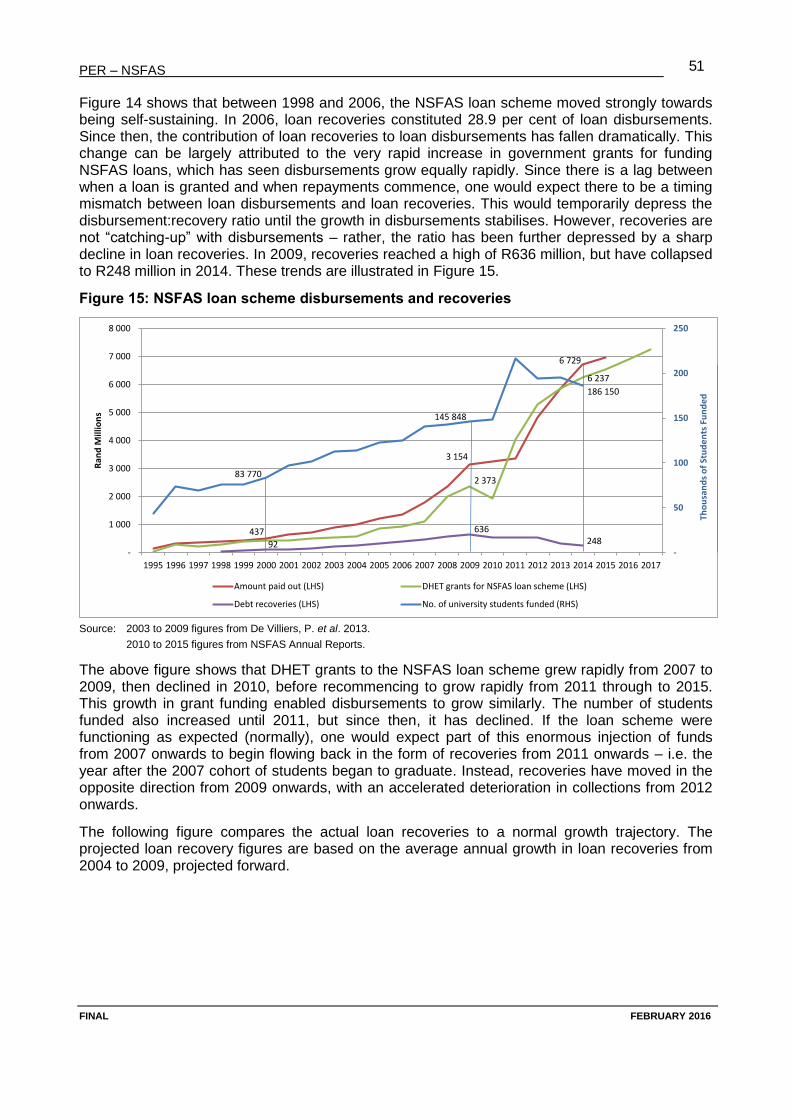
PER – NSFAS
FINAL FEBRUARY 2016
51
Figure 14 shows that between 1998 and 2006, the NSFAS loan scheme moved strongly towards being self-sustaining. In 2006, loan recoveries constituted 28.9 per cent of loan disbursements. Since then, the contribution of loan recoveries to loan disbursements has fallen dramatically. This change can be largely attributed to the very rapid increase in government grants for funding NSFAS loans, which has seen disbursements grow equally rapidly. Since there is a lag between when a loan is granted and when repayments commence, one would expect there to be a timing mismatch between loan disbursements and loan recoveries. This would temporarily depress the disbursement:recovery ratio until the growth in disbursements stabilises. However, recoveries are not “catching-up” with disbursements – rather, the ratio has been further depressed by a sharp decline in loan recoveries. In 2009, recoveries reached a high of R636 million, but have collapsed to R248 million in 2014. These trends are illustrated in Figure 15.
Figure 15: NSFAS loan scheme disbursements and recoveries
Source: 2003 to 2009 figures from De Villiers, P. et al. 2013.
2010 to 2015 figures from NSFAS Annual Reports.
The above figure shows that DHET grants to the NSFAS loan scheme grew rapidly from 2007 to 2009, then declined in 2010, before recommencing to grow rapidly from 2011 through to 2015. This growth in grant funding enabled disbursements to grow similarly. The number of students funded also increased until 2011, but since then, it has declined. If the loan scheme were functioning as expected (normally), one would expect part of this enormous injection of funds from 2007 onwards to begin flowing back in the form of recoveries from 2011 onwards – i.e. the year after the 2007 cohort of students began to graduate. Instead, recoveries have moved in the opposite direction from 2009 onwards, with an accelerated deterioration in collections from 2012 onwards.
The following figure compares the actual loan recoveries to a normal growth trajectory. The projected loan recovery figures are based on the average annual growth in loan recoveries from 2004 to 2009, projected forward.
3 154
6 729
437
2 373
6 237
92
636248
-
50
100
150
200
250
-
1 000
2 000
3 000
4 000
5 000
6 000
7 000
8 000
1995 1996 1997 1998 1999 2000 2001 2002 2003 2004 2005 2006 2007 2008 2009 2010 2011 2012 2013 2014 2015 2016 2017
Th
ou
san
ds
of
Stu
de
nts
Fu
nd
ed
Ra
nd
Mill
ion
s
Amount paid out (LHS) DHET grants for NSFAS loan scheme (LHS)
Debt recoveries (LHS) No. of university students funded (RHS)
83 770
145 848
186 150
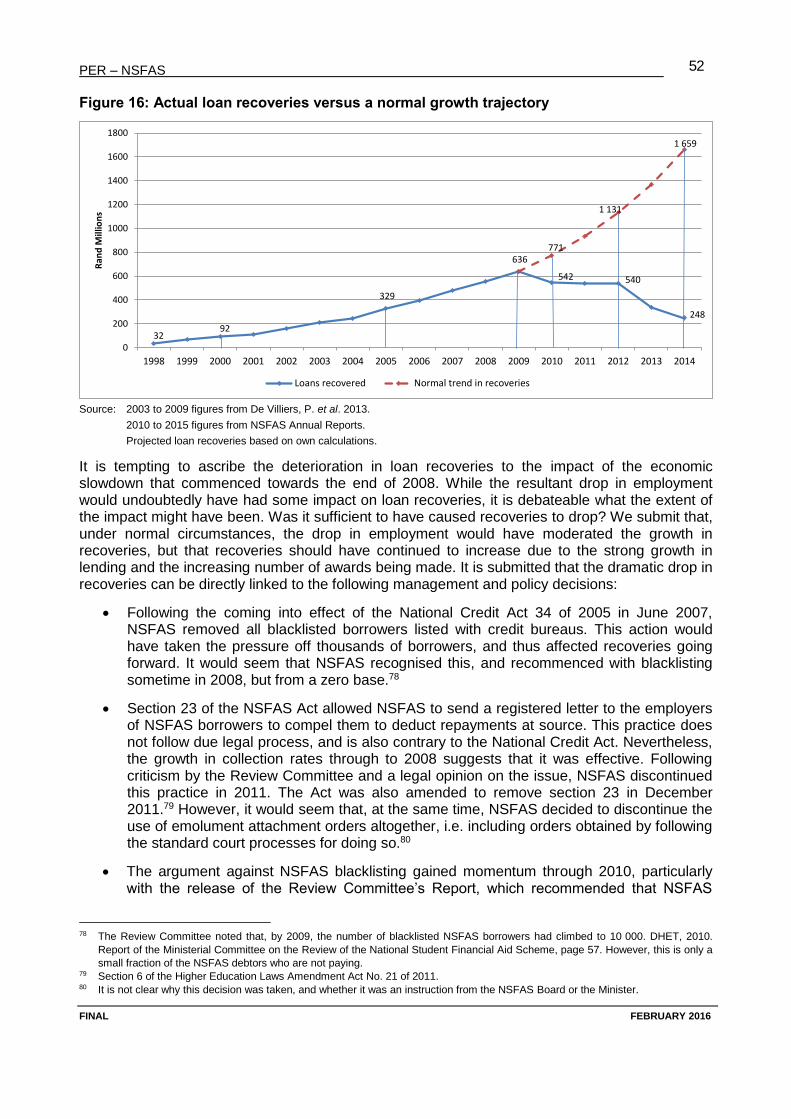
PER – NSFAS
FINAL FEBRUARY 2016
52
Figure 16: Actual loan recoveries versus a normal growth trajectory
Source: 2003 to 2009 figures from De Villiers, P. et al. 2013.
2010 to 2015 figures from NSFAS Annual Reports.
Projected loan recoveries based on own calculations.
It is tempting to ascribe the deterioration in loan recoveries to the impact of the economic slowdown that commenced towards the end of 2008. While the resultant drop in employment would undoubtedly have had some impact on loan recoveries, it is debateable what the extent of the impact might have been. Was it sufficient to have caused recoveries to drop? We submit that, under normal circumstances, the drop in employment would have moderated the growth in recoveries, but that recoveries should have continued to increase due to the strong growth in lending and the increasing number of awards being made. It is submitted that the dramatic drop in recoveries can be directly linked to the following management and policy decisions:
Following the coming into effect of the National Credit Act 34 of 2005 in June 2007, NSFAS removed all blacklisted borrowers listed with credit bureaus. This action would have taken the pressure off thousands of borrowers, and thus affected recoveries going forward. It would seem that NSFAS recognised this, and recommenced with blacklisting sometime in 2008, but from a zero base.78
Section 23 of the NSFAS Act allowed NSFAS to send a registered letter to the employers of NSFAS borrowers to compel them to deduct repayments at source. This practice does not follow due legal process, and is also contrary to the National Credit Act. Nevertheless, the growth in collection rates through to 2008 suggests that it was effective. Following criticism by the Review Committee and a legal opinion on the issue, NSFAS discontinued this practice in 2011. The Act was also amended to remove section 23 in December 2011.79 However, it would seem that, at the same time, NSFAS decided to discontinue the use of emolument attachment orders altogether, i.e. including orders obtained by following the standard court processes for doing so.80
The argument against NSFAS blacklisting gained momentum through 2010, particularly with the release of the Review Committee’s Report, which recommended that NSFAS
78 The Review Committee noted that, by 2009, the number of blacklisted NSFAS borrowers had climbed to 10 000. DHET, 2010.
Report of the Ministerial Committee on the Review of the National Student Financial Aid Scheme, page 57. However, this is only a
small fraction of the NSFAS debtors who are not paying. 79 Section 6 of the Higher Education Laws Amendment Act No. 21 of 2011. 80 It is not clear why this decision was taken, and whether it was an instruction from the NSFAS Board or the Minister.
32 92
329
636
542 540
248
771
1 131
1 659
0
200
400
600
800
1000
1200
1400
1600
1800
1998 1999 2000 2001 2002 2003 2004 2005 2006 2007 2008 2009 2010 2011 2012 2013 2014
Ran
d M
illio
ns
Loans recovered Normal trend in recoveries
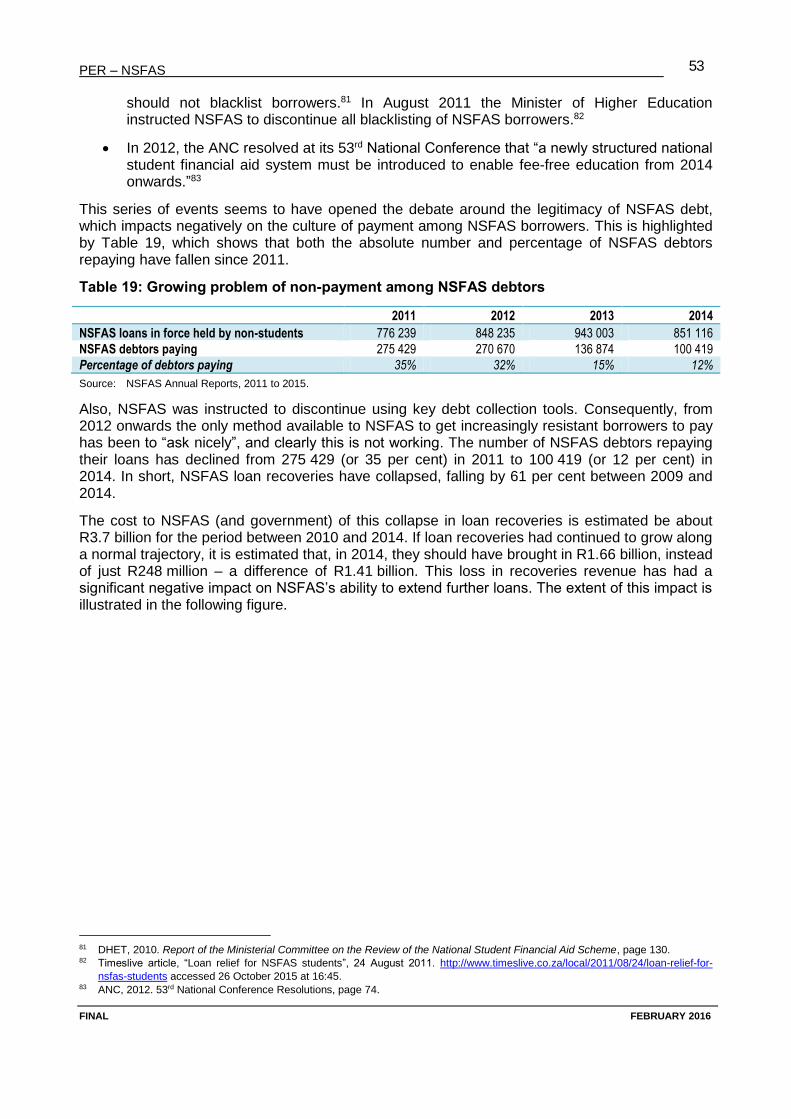
PER – NSFAS
FINAL FEBRUARY 2016
53
should not blacklist borrowers.81 In August 2011 the Minister of Higher Education instructed NSFAS to discontinue all blacklisting of NSFAS borrowers.82
In 2012, the ANC resolved at its 53rd National Conference that “a newly structured national student financial aid system must be introduced to enable fee-free education from 2014 onwards.”83
This series of events seems to have opened the debate around the legitimacy of NSFAS debt, which impacts negatively on the culture of payment among NSFAS borrowers. This is highlighted by Table 19, which shows that both the absolute number and percentage of NSFAS debtors repaying have fallen since 2011.
Table 19: Growing problem of non-payment among NSFAS debtors
2011 2012 2013 2014
NSFAS loans in force held by non-students 776 239 848 235 943 003 851 116
NSFAS debtors paying 275 429 270 670 136 874 100 419
Percentage of debtors paying 35% 32% 15% 12%
Source: NSFAS Annual Reports, 2011 to 2015.
Also, NSFAS was instructed to discontinue using key debt collection tools. Consequently, from 2012 onwards the only method available to NSFAS to get increasingly resistant borrowers to pay has been to “ask nicely”, and clearly this is not working. The number of NSFAS debtors repaying their loans has declined from 275 429 (or 35 per cent) in 2011 to 100 419 (or 12 per cent) in 2014. In short, NSFAS loan recoveries have collapsed, falling by 61 per cent between 2009 and 2014.
The cost to NSFAS (and government) of this collapse in loan recoveries is estimated be about R3.7 billion for the period between 2010 and 2014. If loan recoveries had continued to grow along a normal trajectory, it is estimated that, in 2014, they should have brought in R1.66 billion, instead of just R248 million – a difference of R1.41 billion. This loss in recoveries revenue has had a significant negative impact on NSFAS’s ability to extend further loans. The extent of this impact is illustrated in the following figure.
81 DHET, 2010. Report of the Ministerial Committee on the Review of the National Student Financial Aid Scheme, page 130. 82 Timeslive article, “Loan relief for NSFAS students”, 24 August 2011. http://www.timeslive.co.za/local/2011/08/24/loan-relief-for-
nsfas-students accessed 26 October 2015 at 16:45. 83 ANC, 2012. 53rd National Conference Resolutions, page 74.
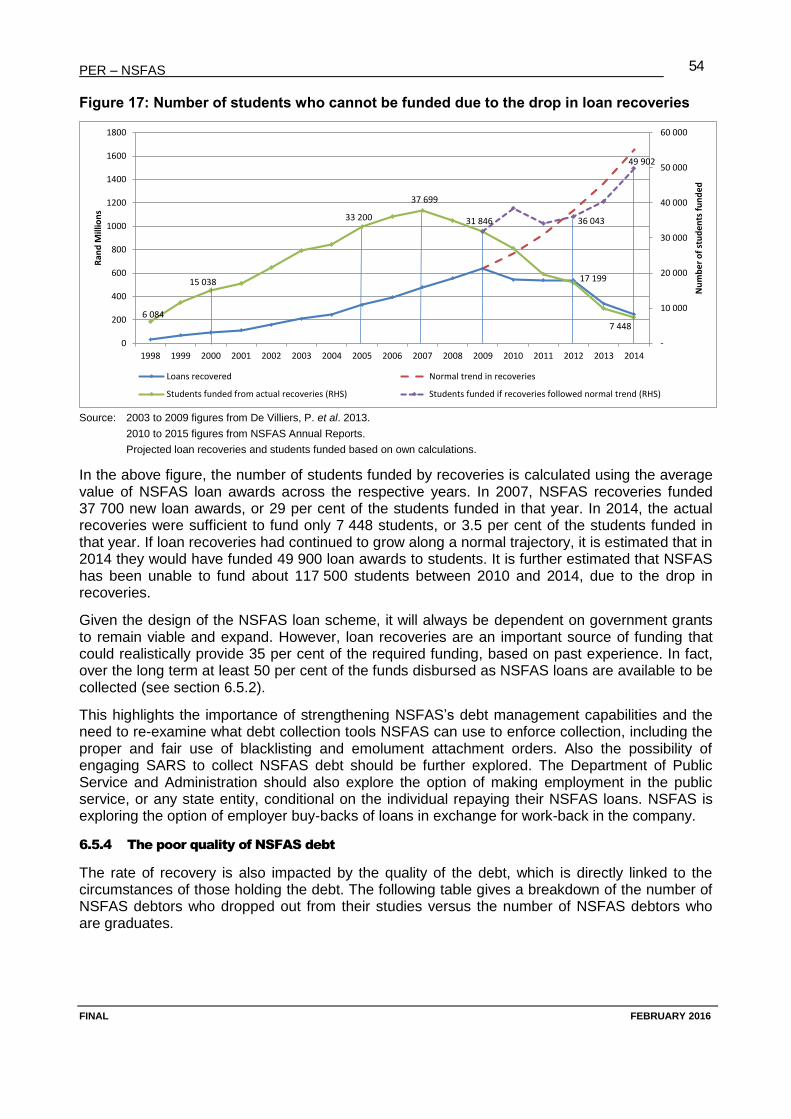
PER – NSFAS
FINAL FEBRUARY 2016
54
Figure 17: Number of students who cannot be funded due to the drop in loan recoveries
Source: 2003 to 2009 figures from De Villiers, P. et al. 2013.
2010 to 2015 figures from NSFAS Annual Reports.
Projected loan recoveries and students funded based on own calculations.
In the above figure, the number of students funded by recoveries is calculated using the average value of NSFAS loan awards across the respective years. In 2007, NSFAS recoveries funded 37 700 new loan awards, or 29 per cent of the students funded in that year. In 2014, the actual recoveries were sufficient to fund only 7 448 students, or 3.5 per cent of the students funded in that year. If loan recoveries had continued to grow along a normal trajectory, it is estimated that in 2014 they would have funded 49 900 loan awards to students. It is further estimated that NSFAS has been unable to fund about 117 500 students between 2010 and 2014, due to the drop in recoveries.
Given the design of the NSFAS loan scheme, it will always be dependent on government grants to remain viable and expand. However, loan recoveries are an important source of funding that could realistically provide 35 per cent of the required funding, based on past experience. In fact, over the long term at least 50 per cent of the funds disbursed as NSFAS loans are available to be collected (see section 6.5.2).
This highlights the importance of strengthening NSFAS’s debt management capabilities and the need to re-examine what debt collection tools NSFAS can use to enforce collection, including the proper and fair use of blacklisting and emolument attachment orders. Also the possibility of engaging SARS to collect NSFAS debt should be further explored. The Department of Public Service and Administration should also explore the option of making employment in the public service, or any state entity, conditional on the individual repaying their NSFAS loans. NSFAS is exploring the option of employer buy-backs of loans in exchange for work-back in the company.
6.5.4 The poor quality of NSFAS debt
The rate of recovery is also impacted by the quality of the debt, which is directly linked to the circumstances of those holding the debt. The following table gives a breakdown of the number of NSFAS debtors who dropped out from their studies versus the number of NSFAS debtors who are graduates.
6 084
15 038
33 200
37 699
17 199
7 448
31 846 36 043
49 902
-
10 000
20 000
30 000
40 000
50 000
60 000
0
200
400
600
800
1000
1200
1400
1600
1800
1998 1999 2000 2001 2002 2003 2004 2005 2006 2007 2008 2009 2010 2011 2012 2013 2014
Nu
mb
er
of
stu
de
nts
fu
nd
ed
Ran
d M
illio
ns
Loans recovered Normal trend in recoveries
Students funded from actual recoveries (RHS) Students funded if recoveries followed normal trend (RHS)
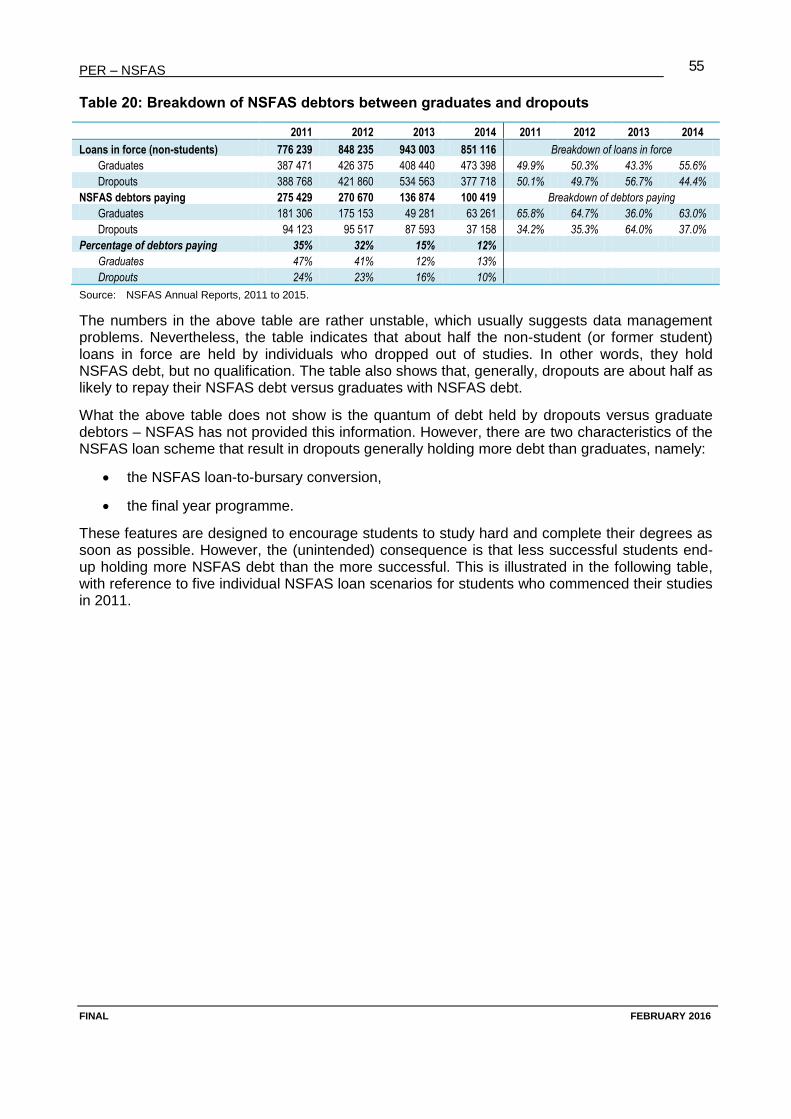
PER – NSFAS
FINAL FEBRUARY 2016
55
Table 20: Breakdown of NSFAS debtors between graduates and dropouts
2011 2012 2013 2014 2011 2012 2013 2014
Loans in force (non-students) 776 239 848 235 943 003 851 116 Breakdown of loans in force
Graduates 387 471 426 375 408 440 473 398 49.9% 50.3% 43.3% 55.6%
Dropouts 388 768 421 860 534 563 377 718 50.1% 49.7% 56.7% 44.4%
NSFAS debtors paying 275 429 270 670 136 874 100 419 Breakdown of debtors paying
Graduates 181 306 175 153 49 281 63 261 65.8% 64.7% 36.0% 63.0%
Dropouts 94 123 95 517 87 593 37 158 34.2% 35.3% 64.0% 37.0%
Percentage of debtors paying 35% 32% 15% 12%
Graduates 47% 41% 12% 13%
Dropouts 24% 23% 16% 10%
Source: NSFAS Annual Reports, 2011 to 2015.
The numbers in the above table are rather unstable, which usually suggests data management problems. Nevertheless, the table indicates that about half the non-student (or former student) loans in force are held by individuals who dropped out of studies. In other words, they hold NSFAS debt, but no qualification. The table also shows that, generally, dropouts are about half as likely to repay their NSFAS debt versus graduates with NSFAS debt.
What the above table does not show is the quantum of debt held by dropouts versus graduate debtors – NSFAS has not provided this information. However, there are two characteristics of the NSFAS loan scheme that result in dropouts generally holding more debt than graduates, namely:
the NSFAS loan-to-bursary conversion,
the final year programme.
These features are designed to encourage students to study hard and complete their degrees as soon as possible. However, the (unintended) consequence is that less successful students end-up holding more NSFAS debt than the more successful. This is illustrated in the following table, with reference to five individual NSFAS loan scenarios for students who commenced their studies in 2011.
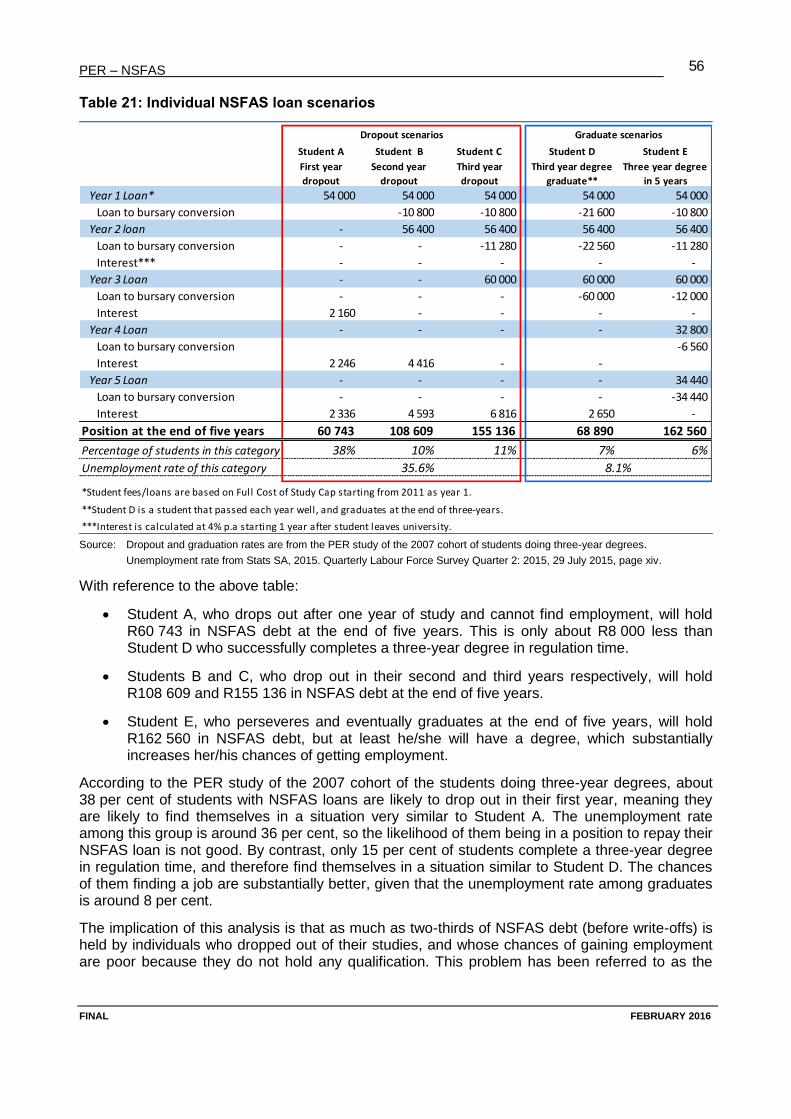
PER – NSFAS
FINAL FEBRUARY 2016
56
Table 21: Individual NSFAS loan scenarios
Source: Dropout and graduation rates are from the PER study of the 2007 cohort of students doing three-year degrees.
Unemployment rate from Stats SA, 2015. Quarterly Labour Force Survey Quarter 2: 2015, 29 July 2015, page xiv.
With reference to the above table:
Student A, who drops out after one year of study and cannot find employment, will hold R60 743 in NSFAS debt at the end of five years. This is only about R8 000 less than Student D who successfully completes a three-year degree in regulation time.
Students B and C, who drop out in their second and third years respectively, will hold R108 609 and R155 136 in NSFAS debt at the end of five years.
Student E, who perseveres and eventually graduates at the end of five years, will hold R162 560 in NSFAS debt, but at least he/she will have a degree, which substantially increases her/his chances of getting employment.
According to the PER study of the 2007 cohort of the students doing three-year degrees, about 38 per cent of students with NSFAS loans are likely to drop out in their first year, meaning they are likely to find themselves in a situation very similar to Student A. The unemployment rate among this group is around 36 per cent, so the likelihood of them being in a position to repay their NSFAS loan is not good. By contrast, only 15 per cent of students complete a three-year degree in regulation time, and therefore find themselves in a situation similar to Student D. The chances of them finding a job are substantially better, given that the unemployment rate among graduates is around 8 per cent.
The implication of this analysis is that as much as two-thirds of NSFAS debt (before write-offs) is held by individuals who dropped out of their studies, and whose chances of gaining employment are poor because they do not hold any qualification. This problem has been referred to as the
Student A Student B Student C Student D Student E
First year
dropout
Second year
dropout
Third year
dropout
Third year degree
graduate**
Three year degree
in 5 years
Year 1 Loan* 54 000 54 000 54 000 54 000 54 000
Loan to bursary conversion -10 800 -10 800 -21 600 -10 800
Year 2 loan - 56 400 56 400 56 400 56 400
Loan to bursary conversion - - -11 280 -22 560 -11 280
Interest*** - - - - -
Year 3 Loan - - 60 000 60 000 60 000
Loan to bursary conversion - - - -60 000 -12 000
Interest 2 160 - - - -
Year 4 Loan - - - - 32 800
Loan to bursary conversion -6 560
Interest 2 246 4 416 - -
Year 5 Loan - - - - 34 440
Loan to bursary conversion - - - - -34 440
Interest 2 336 4 593 6 816 2 650 -
Position at the end of five years 60 743 108 609 155 136 68 890 162 560
Percentage of students in this category 38% 10% 11% 7% 6%
Unemployment rate of this category 35.6%
*Student fees/loans are based on Full Cost of Study Cap starting from 2011 as year 1.
**Student D is a student that passed each year well, and graduates at the end of three-years.
***Interest is calculated at 4% p.a starting 1 year after student leaves university.
Dropout scenarios Graduate scenarios
8.1%
PER – NSFAS
FINAL FEBRUARY 2016
57
revolving door syndrome,84 where students enter university and are revolved back into poverty having accumulated a number of years’ worth of NSFAS debt. So their financial situation after attempting higher education is worse than before doing so.
Given that the sustainability of NSFAS loan scheme is a concern, there is an argument to be made for re-examining the structure of the loan-to-bursary conversion arrangements, and the final year programme, so as to ensure their benefits are less skewed in favour of students who graduate. The idea would be to cut back on the benefits of these programmes so that students who graduate successfully hold slightly more debt. The logic is that such students, because they have a qualification, are in a better position to repay a NSFAS loan, and therefore increasing the value of loans held by them would improve the overall quality of the NSFAS debt book, thus ensuring more recoveries. In line with the public finance benefit principle, the successful students should be expected to pay more back to NSFAS than they currently do. Seen in this light, there are similarities between this line of argument and the idea of a graduate tax being proposed by the Minister of Higher Education and Training85 as a possible source of funding for higher education. Section 7.7.2 below explores these proposals in greater detail in the context of the costing model.
6.6 Key findings from the financial analysis
1. Poor data management complicates efforts to analyse the financial status and performance of the different components of NSFAS, particularly the NSFAS loan scheme. NSFAS is managing very large amounts of funds, and it is therefore critical that its data management and reporting capabilities are improved.
The structure of NSFAS finances and financial reporting
2. The AFSs of NSFAS do not distinguish between the administration of NSFAS the entity and each of the three main streams of student funding that NSFAS the entity manages. This conflates the financial information relating to administration, loans, grants and bursaries, making it very difficult to analyse the financial performance of the different components of NSFAS.
3. Ideally, separate AFSs should be prepared for each of the components of NSFAS. This would result in more transparent and accountable reporting, making it easier to:
a. assess whether the NSFAS entity is being efficient and effective in its administration, and give assurance that it is not using funds designated for loans, grants and bursaries to fund its operations;
b. understand the actual financial position of the NSFAS loan scheme – which is an inherently complicated programme; and
c. give assurance that managed grant and bursary funds are being allocated for their intended purposes.
NSFAS funding sources
4. Between 2011 and 2015, NSFAS total revenues grew at an average annual rate of 30 per cent from R3.4 billion to R9.8 billion. This very rapid expansion has placed enormous demands on the management capability and capacity of the NSFAS entity.
84 DHET, 2010. Report of the Ministerial Committee on the Review of the National Student Financial Aid Scheme, page 107. 85 Speech by the Minister to Parliament, 27 October 2015.
PER – NSFAS
FINAL FEBRUARY 2016
58
NSFAS administrative income and expenditure
5. Recognising the administrative pressure on NSFAS, DHET increased the administration grant for NSFAS from R26 million in 2011 to R116 million in 2015 (average annual growth of 41 per cent).
6. Even so, the NSFAS entity’s operations resulted in deficits in four of the five years from 2011 to 2015. In 2011 the deficit was 51 per cent. This implies that either NSFAS is spending funds on administration that “belong” to other components, or there are “internal charges” to such components that are not being made explicit. This implies a hidden subsidy of the entity’s administration costs, which makes it difficult to evaluate its efficiency.
7. NSFAS’s administration to awards ratio increased from 1.22 in 2012 to 2.71 in 2015. This suggests that NSFAS is becoming less efficient. However, this increase is directly associated with the rollout of the new model, and is likely to continue increasing with its rollout until a new, higher equilibrium is reached. This is because the new model shifts administrative responsibilities, and the associated costs, from the higher education institutions to NSFAS.
NSFAS allocation of loans and disbursement of grants and bursaries
8. Overall, the total value of awards disbursed by NSFAS increased by 144 per cent between 2010 and 2015. The amount of funds allocated in TVET grants grew fastest; however the increase in the funds awarded as loans is also substantial. The NSFAS portfolio of funds for managed bursaries also increased by 145 per cent between 2010 and 2015.
9. The average value of all types of award grew faster than inflation between 2010 and 2014, but slightly below the growth in the average FCS of many universities.
10. The average value of awards to university students in 2015 was R37 443. This is substantially higher than the average award of R8 710 to TVET students. Indeed the TVET grant would not cover even half the residence fees component of the 2015 average FCS at 20 of the 23 universities. It is therefore not clear whether the TVET grants only cover tuition fees, or other costs as well, and whether they are sufficient to ensure TVET students are adequately funded.
11. The average value of the Funza Lushaka bursaries, at R65 690 in 2015, is substantially higher than any of the other NSFAS-managed awards. It would appear that the Funza Lushaka awards are overly generous. Also the Funza Lushaka awards are more than double the NSFAS loan awards made to teachers (Teacher Allocation), which were R27 119 in 2014. This raises questions regarding the equity between these two programmes.
12. The difference between the average value of an NSFAS loan funded from the General Allocation (R32 017 in 2014) and the awards for the final year programme (R41 971 in 2014) seems inconsistent. It indicates that the final year of study in 2014 was 31 per cent more expensive than the first and second years of study. It is not clear what factors are driving this difference. It also raises issues of equity between these NSFAS loan programmes.
Adequacy of current funding for the NSFAS loan scheme
13. Analysis of loan application data from universities shows that 63 613 (or 31 per cent) qualifying applicants for NSFAS loans in 2014 could not be funded because there were insufficient funds. In 2014, the average NSFAS loan award was about R32 000. Therefore the funding shortfall was slightly more than R2 billion. If the funding gap estimate is based
PER – NSFAS
FINAL FEBRUARY 2016
59
on the NSFAS loan award cap of R64 000, however, then the shortfall was about R4 billion. Both estimates are substantially less than the “additional allocation of R10.2 billion” DHET86 indicated to Parliament would be “required to fully fund all qualifying NSFAS students in the 2015 cohort (all eligible new students)”. These different estimates highlight the need to be fully transparent regarding the assumptions being used to estimate the funding requirements of the NSFAS loan scheme.
14. When estimating the funding requirements of the NSFAS loan scheme, one needs to take into account that:
a. the cap on NSFAS loan awards is significantly less than the average FCS at most universities, and the gap between the cap and the FCS has been growing.
b. at least six universities routinely “top-slice” NSFAS loan awards.
15. Both these factors pose a significant risk to the effectiveness of NSFAS loans, as students are only partially funded. The Review Committee noted that underfunding individual students “contributes to a high dropout and failure rate among the very group for whom the scheme was set up to provide access to higher education” and results in the “revolving door” outcome.
16. In 2014, 40 per cent of the unfunded students were at previously disadvantaged universities, compared to 22 per cent at previously advantaged universities, and 25 per cent at universities of technology. This is strong evidence that the current approach being used to allocate NSFAS funding between universities is highly inequitable. This confirms a key finding of the Review Committee, which recommended that the race-based formula be replaced by a class-based model using solely socio-economic criteria. Full rollout of the new model would make the need to reform this allocation formula redundant. However, it has been five-years since the Review Committee made this recommendation, and the NSFAS Board has indicated that the rollout of the new model is going to proceed slowly. Either the rollout of the new model needs to be accelerated or the allocations to universities need to be reviewed urgently.
The conversion of NSFAS loans to bursaries and the final year programme
17. The introduction of the final year programme has increased the amount of NSFAS loans being converted into bursaries from 28.5 per cent to around 44-49 per cent. In 2014, an estimated R1.8 billion of the R4.2 billion NSFAS loans awarded were converted to bursaries.
18. The balance of total loans after conversions is what students must repay. In 2014, this amount was R2.3 billion, i.e. 44.1 per cent less than the value of loans awarded. This is the amount that gets transferred to the NSFAS debt book.
Performance of NSFAS loan recoveries
19. Between 1998 and 2006, the NSFAS loan scheme moved strongly towards being self-sustaining. In 2006, loan recoveries constituted 28.9 per cent of loan disbursements. Since then, the contribution of loan recoveries to loan disbursements has fallen dramatically. This change can be largely attributed to the very rapid increase in government grants for funding NSFAS loans that has seen disbursements grow equally rapidly. However, recoveries are not “catching-up” with disbursements; rather the ratio has been further depressed by a sharp decline in loan recoveries. In 2009, recoveries reached a high of R636 million, but have collapsed to R248 million in 2014.
86 DHET, 2015. Presentation to the Portfolio Committee on Higher Education and Training, 18 February 2015.
PER – NSFAS
FINAL FEBRUARY 2016
60
20. Loan recoveries have deteriorated since 2009, which could be attributed to the impact of the economic slowdown in 2008. While the resultant drop in employment would undoubtedly have had some impact, it is argued that, under normal circumstances, the effect would only have moderated the growth in recoveries, but recoveries should have continued to increase due to the strong growth in disbursements. It is submitted that the dramatic drop in recoveries can be directly linked to the following management and policy decisions:
a. Following the coming into effect of the National Credit Act 34 of 2005 in June 2007, NSFAS removed all blacklisted borrowers listed with credit bureaus. NSFAS recommenced with blacklisting sometime in 2008, but from a zero base.87
b. Section 23 of the NSFAS Act allowed NSFAS to send a registered letter to the employers of NSFAS borrowers to compel them to deduct repayments at source. This practice does not follow due legal process, and is also contrary to the National Credit Act. Nevertheless, the growth in collection rates through to 2008 suggests that it was effective. Following criticism by the Review Committee and a legal opinion on the issue, NSFAS discontinued this practice in 2011. The Act was also amended to remove section 23. However, it would seem that NSFAS decided to discontinue the use of emolument attachment orders altogether, i.e. including orders obtained by following the standard court processes for doing so.88
c. The argument against NSFAS blacklisting gained momentum through 2010, particularly with the release of the Review Committee’s Report, which recommended that NSFAS should not blacklist borrowers.89 In August 2011 the Minister of Higher Education instructed NSFAS to discontinue all blacklisting of NSFAS borrowers.90
d. In 2012, the ANC resolved at its 53rd National Conference that “a newly structured national student financial aid system must be introduced to enable fee-free education from 2014 onwards.”91
21. From 2012 onwards, the only method available to NSFAS to get increasingly resistant borrowers to pay has been to “ask nicely”. This is not working.
22. The cost to NSFAS (and government) of the collapse in loan recoveries is estimated be about R3.7 billion for the period between 2010 and 2014. It is further estimated that NSFAS has been unable to fund about 117 500 students between 2010 and 2014 due to the drop in recoveries.
23. Given the design of the NSFAS loan scheme, it will always be dependent on government grants to remain viable and expand. However, loan recoveries are an important source of funding that could realistically provide 35 per cent of the required funding, based on past experience. In fact over the long term, at least 50 per cent of the funds disbursed as NSFAS loans are available to be collected.
24. NSFAS’s debt management capabilities need to be strengthened, and the debt collection tools NSFAS can use to enforce collection need to be re-examined, including the proper and fair use of blacklisting and emolument attachment orders. Also the possibility of
87 The Review Committee noted that by 2009, the number of blacklisted NSFAS borrowers had climbed to 10 000. DHET, 2010.
Report of the Ministerial Committee on the Review of the National Student Financial Aid Scheme, page 57. 88 It is not clear why this decision was taken, and whether it was an instruction from the NSFAS Board or the Minister. 89 DHET, 2010. Report of the Ministerial Committee on the Review of the National Student Financial Aid Scheme, page 130. 90 Timeslive article, “Loan relief for NSFAS students”, 24 August 2011. http://www.timeslive.co.za/local/2011/08/24/loan-relief-for-
nsfas-students accessed 26 October 2015 at 16:45. 91 ANC, 2012. 53rd National Conference Resolutions, page 74.
PER – NSFAS
FINAL FEBRUARY 2016
61
engaging SARS to collect NSFAS debt should be further explored. The Department of Public Service and Administration should also explore the option of making employment in the public service, or any state entity, conditional on the individual repaying their NSFAS loans.
The poor quality of NSFAS debt
25. The likelihood of recovering NSFAS debt is impacted by the quality of the debt, which is directly linked to the circumstances of those holding the debt. About half the non-student (or former student) loans in force are held by individuals who dropped out of studies. In other words, they hold NSFAS debt, but no qualification. These debtors are about half as likely to repay their NSFAS debt versus graduates with NSFAS debt.
26. The design of the loan-to-bursary conversions result in first year dropouts holding only slightly less debt than a student who graduates after three years.
27. There is an argument to be made for re-examining the structure of the loan-to-bursary conversion arrangements and the final year programme, so as to ensure their benefits are less skewed in favour of students who graduate. The idea would be to cut back on the benefits so that students who graduate successfully hold slightly more debt. In line with the public finance benefit principle, the successful students should be expected to pay more back to NSFAS than they currently do.
7. Costing models
The costing models developed for this PER are designed to allow for a high degree of flexibility in the specification of the different variables. This enables users of the models to explore different options with regards to these variables. The models allow users to test the cost implications of many variables that affect the funding requirements of NSFAS.
As noted in the Introduction, there are three MS Excel workbooks that cost the different NSFAS components.
2015.11.10 NSFAS Loan Costing Model Draft - NDP Scenario.xls – this workbook contains a costing model of the NSFAS entity (administration) and the NSFAS loan scheme.
2015.11.10 NSFAS Loan Choices Model Final.xls – this workbook contains a dashboard users can use to test the impact of different policy choices on the funding needs and performance of the NSFAS loan scheme.
2015.08.14 TVET Grant Model Final.xls – contains a model that costs the TVET grants programme.
7.1 Costing model for NSFAS the entity
The costing of the NSFAS entity (administration) is on a single worksheet in the NSFAS Loan Model workbook. The updated NSFAS organogram has been replicated on this worksheet.
Some staff levels are set at fixed levels, and some are linked to variables that reflect the workload in the organisation, such as:
number of students receiving loans for the first time;
total number of students receiving loans;
number of loan conversions.
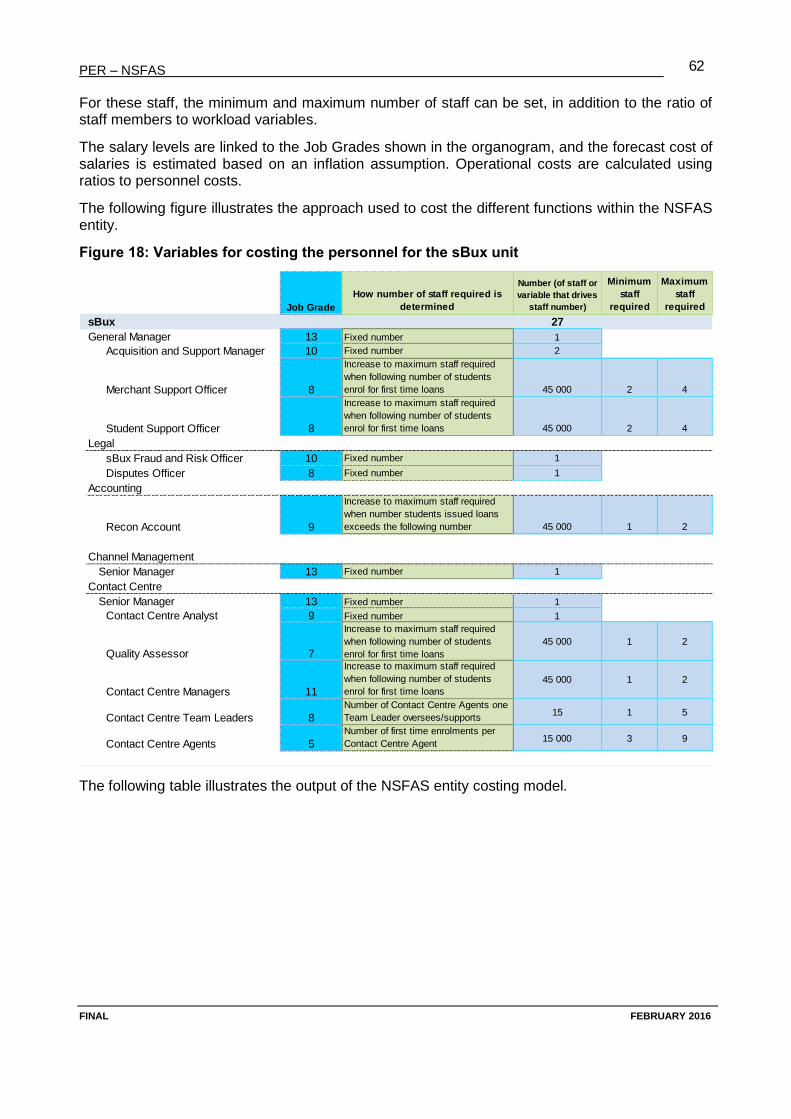
PER – NSFAS
FINAL FEBRUARY 2016
62
For these staff, the minimum and maximum number of staff can be set, in addition to the ratio of staff members to workload variables.
The salary levels are linked to the Job Grades shown in the organogram, and the forecast cost of salaries is estimated based on an inflation assumption. Operational costs are calculated using ratios to personnel costs.
The following figure illustrates the approach used to cost the different functions within the NSFAS entity.
Figure 18: Variables for costing the personnel for the sBux unit
The following table illustrates the output of the NSFAS entity costing model.
Job Grade
How number of staff required is
determined
Number (of staff or
variable that drives
staff number)
Minimum
staff
required
Maximum
staff
required
sBux 27
General Manager 13 Fixed number 1
Acquisition and Support Manager 10 Fixed number 2
Merchant Support Officer 8
Increase to maximum staff required
when following number of students
enrol for first time loans 45 000 2 4
Student Support Officer 8
Increase to maximum staff required
when following number of students
enrol for first time loans 45 000 2 4
Legal
sBux Fraud and Risk Officer 10 Fixed number 1
Disputes Officer 8 Fixed number 1
Accounting
Recon Account 9
Increase to maximum staff required
when number students issued loans
exceeds the following number 45 000 1 2
Channel Management
Senior Manager 13 Fixed number 1
Contact Centre
Senior Manager 13 Fixed number 1
Contact Centre Analyst 9 Fixed number 1
Quality Assessor 7
Increase to maximum staff required
when following number of students
enrol for first time loans
45 000 1 2
Contact Centre Managers 11
Increase to maximum staff required
when following number of students
enrol for first time loans
45 000 1 2
Contact Centre Team Leaders 8
Number of Contact Centre Agents one
Team Leader oversees/supports15 1 5
Contact Centre Agents 5
Number of first time enrolments per
Contact Centre Agent15 000 3 9
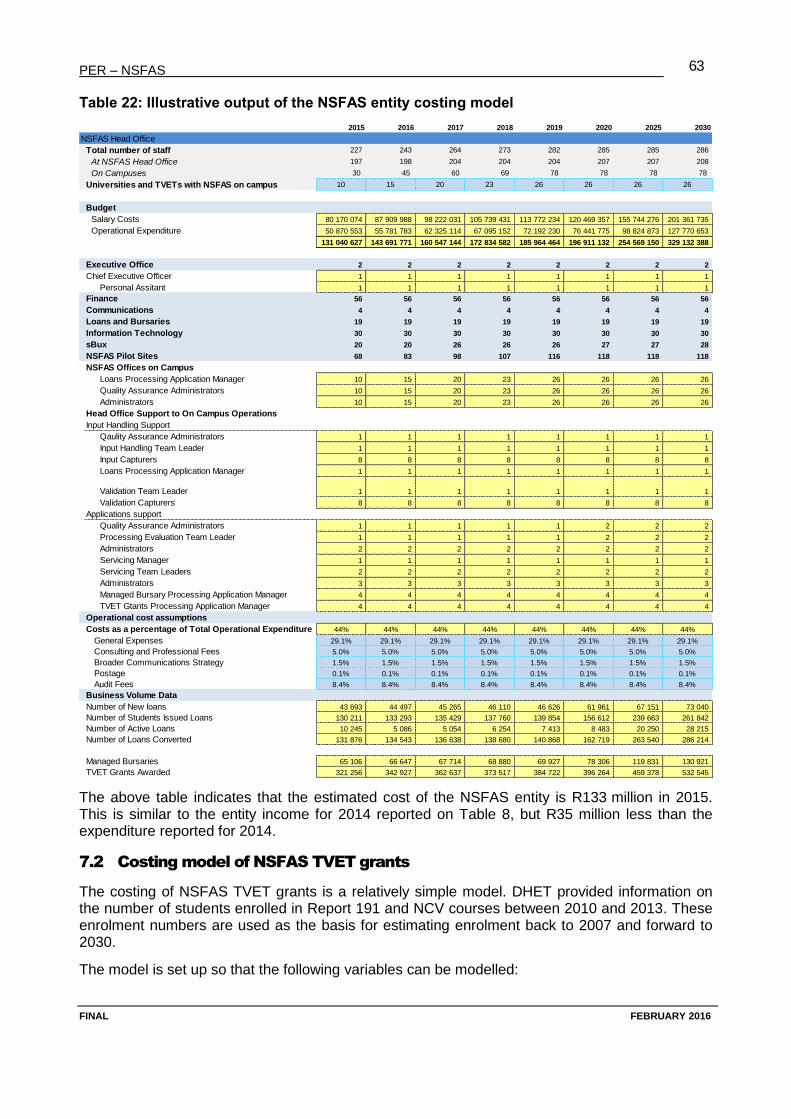
PER – NSFAS
FINAL FEBRUARY 2016
63
Table 22: Illustrative output of the NSFAS entity costing model
The above table indicates that the estimated cost of the NSFAS entity is R133 million in 2015. This is similar to the entity income for 2014 reported on Table 8, but R35 million less than the expenditure reported for 2014.
7.2 Costing model of NSFAS TVET grants
The costing of NSFAS TVET grants is a relatively simple model. DHET provided information on the number of students enrolled in Report 191 and NCV courses between 2010 and 2013. These enrolment numbers are used as the basis for estimating enrolment back to 2007 and forward to 2030.
The model is set up so that the following variables can be modelled:
2015 2016 2017 2018 2019 2020 2025 2030
NSFAS Head Office
Total number of staff 227 243 264 273 282 285 285 286
At NSFAS Head Office 197 198 204 204 204 207 207 208
On Campuses 30 45 60 69 78 78 78 78
Universities and TVETs with NSFAS on campus 10 15 20 23 26 26 26 26
Budget
Salary Costs 80 170 074 87 909 988 98 222 031 105 739 431 113 772 234 120 469 357 155 744 276 201 361 735
Operational Expenditure 50 870 553 55 781 783 62 325 114 67 095 152 72 192 230 76 441 775 98 824 873 127 770 653
131 040 627 143 691 771 160 547 144 172 834 582 185 964 464 196 911 132 254 569 150 329 132 388
Executive Office 2 2 2 2 2 2 2 2
Chief Executive Officer 1 1 1 1 1 1 1 1
Personal Assitant 1 1 1 1 1 1 1 1
Finance 56 56 56 56 56 56 56 56
Communications 4 4 4 4 4 4 4 4
Loans and Bursaries 19 19 19 19 19 19 19 19
Information Technology 30 30 30 30 30 30 30 30
sBux 20 20 26 26 26 27 27 28
NSFAS Pilot Sites 68 83 98 107 116 118 118 118
NSFAS Offices on Campus
Loans Processing Application Manager 10 15 20 23 26 26 26 26
Quality Assurance Administrators 10 15 20 23 26 26 26 26
Administrators 10 15 20 23 26 26 26 26
Head Office Support to On Campus Operations
Input Handling Support
Qaulity Assurance Administrators 1 1 1 1 1 1 1 1
Input Handling Team Leader 1 1 1 1 1 1 1 1
Input Capturers 8 8 8 8 8 8 8 8
Loans Processing Application Manager 1 1 1 1 1 1 1 1
Validation Team Leader 1 1 1 1 1 1 1 1
Validation Capturers 8 8 8 8 8 8 8 8
Applications support
Quality Assurance Administrators 1 1 1 1 1 2 2 2
Processing Evaluation Team Leader 1 1 1 1 1 2 2 2
Administrators 2 2 2 2 2 2 2 2
Servicing Manager 1 1 1 1 1 1 1 1
Servicing Team Leaders 2 2 2 2 2 2 2 2
Administrators 3 3 3 3 3 3 3 3
Managed Bursary Processing Application Manager 4 4 4 4 4 4 4 4
TVET Gtants Processing Application Manager 4 4 4 4 4 4 4 4
Operational cost assumptions
Costs as a percentage of Total Operational Expenditure 44% 44% 44% 44% 44% 44% 44% 44%
General Expenses 29.1% 29.1% 29.1% 29.1% 29.1% 29.1% 29.1% 29.1%
Consulting and Professional Fees 5.0% 5.0% 5.0% 5.0% 5.0% 5.0% 5.0% 5.0%
Broader Communications Strategy 1.5% 1.5% 1.5% 1.5% 1.5% 1.5% 1.5% 1.5%
Postage 0.1% 0.1% 0.1% 0.1% 0.1% 0.1% 0.1% 0.1%
Audit Fees 8.4% 8.4% 8.4% 8.4% 8.4% 8.4% 8.4% 8.4%
Business Volume Data
Number of New loans 43 693 44 497 45 265 46 110 46 626 61 961 67 151 73 040
Number of Students Issued Loans 130 211 133 293 135 429 137 760 139 854 156 612 239 663 261 842
Number of Active Loans 10 245 5 086 5 054 6 254 7 413 8 483 20 250 28 215
Number of Loans Converted 131 876 134 543 136 638 138 680 140 868 162 719 263 540 286 214
Managed Bursaries 65 106 66 647 67 714 68 880 69 927 78 306 119 831 130 921
TVET Grants Awarded 321 256 342 927 362 637 373 517 384 722 396 264 459 378 532 545
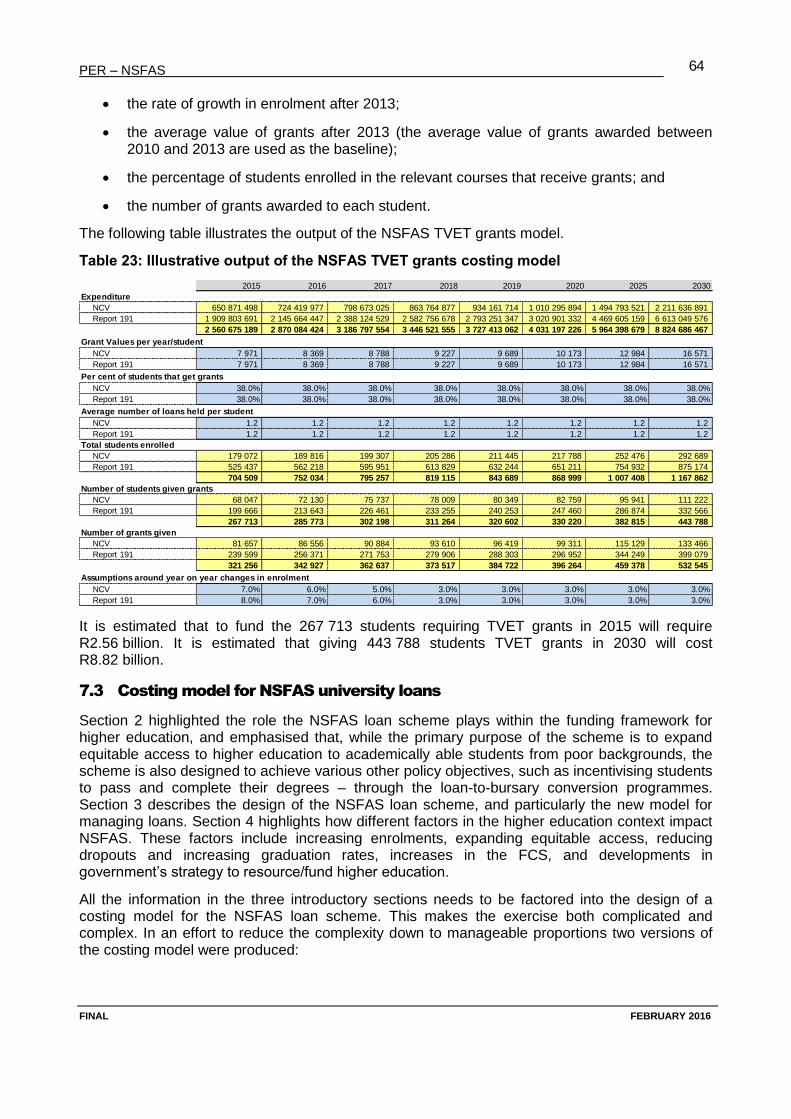
PER – NSFAS
FINAL FEBRUARY 2016
64
the rate of growth in enrolment after 2013;
the average value of grants after 2013 (the average value of grants awarded between 2010 and 2013 are used as the baseline);
the percentage of students enrolled in the relevant courses that receive grants; and
the number of grants awarded to each student.
The following table illustrates the output of the NSFAS TVET grants model.
Table 23: Illustrative output of the NSFAS TVET grants costing model
It is estimated that to fund the 267 713 students requiring TVET grants in 2015 will require R2.56 billion. It is estimated that giving 443 788 students TVET grants in 2030 will cost R8.82 billion.
7.3 Costing model for NSFAS university loans
Section 2 highlighted the role the NSFAS loan scheme plays within the funding framework for higher education, and emphasised that, while the primary purpose of the scheme is to expand equitable access to higher education to academically able students from poor backgrounds, the scheme is also designed to achieve various other policy objectives, such as incentivising students to pass and complete their degrees – through the loan-to-bursary conversion programmes. Section 3 describes the design of the NSFAS loan scheme, and particularly the new model for managing loans. Section 4 highlights how different factors in the higher education context impact NSFAS. These factors include increasing enrolments, expanding equitable access, reducing dropouts and increasing graduation rates, increases in the FCS, and developments in government’s strategy to resource/fund higher education.
All the information in the three introductory sections needs to be factored into the design of a costing model for the NSFAS loan scheme. This makes the exercise both complicated and complex. In an effort to reduce the complexity down to manageable proportions two versions of the costing model were produced:
2015 2016 2017 2018 2019 2020 2025 2030
Expenditure
NCV 650 871 498 724 419 977 798 673 025 863 764 877 934 161 714 1 010 295 894 1 494 793 521 2 211 636 891
Report 191 1 909 803 691 2 145 664 447 2 388 124 529 2 582 756 678 2 793 251 347 3 020 901 332 4 469 605 159 6 613 049 576
2 560 675 189 2 870 084 424 3 186 797 554 3 446 521 555 3 727 413 062 4 031 197 226 5 964 398 679 8 824 686 467
Grant Values per year/student
NCV 7 971 8 369 8 788 9 227 9 689 10 173 12 984 16 571
Report 191 7 971 8 369 8 788 9 227 9 689 10 173 12 984 16 571
Per cent of students that get grants
NCV 38.0% 38.0% 38.0% 38.0% 38.0% 38.0% 38.0% 38.0%
Report 191 38.0% 38.0% 38.0% 38.0% 38.0% 38.0% 38.0% 38.0%
Average number of loans held per student
NCV 1.2 1.2 1.2 1.2 1.2 1.2 1.2 1.2
Report 191 1.2 1.2 1.2 1.2 1.2 1.2 1.2 1.2
Total students enrolled
NCV 179 072 189 816 199 307 205 286 211 445 217 788 252 476 292 689
Report 191 525 437 562 218 595 951 613 829 632 244 651 211 754 932 875 174
704 509 752 034 795 257 819 115 843 689 868 999 1 007 408 1 167 862
Number of students given grants
NCV 68 047 72 130 75 737 78 009 80 349 82 759 95 941 111 222
Report 191 199 666 213 643 226 461 233 255 240 253 247 460 286 874 332 566
267 713 285 773 302 198 311 264 320 602 330 220 382 815 443 788
Number of grants given
NCV 81 657 86 556 90 884 93 610 96 419 99 311 115 129 133 466
Report 191 239 599 256 371 271 753 279 906 288 303 296 952 344 249 399 079
321 256 342 927 362 637 373 517 384 722 396 264 459 378 532 545
Assumptions around year on year changes in enrolment
NCV 7.0% 6.0% 5.0% 3.0% 3.0% 3.0% 3.0% 3.0%
Report 191 8.0% 7.0% 6.0% 3.0% 3.0% 3.0% 3.0% 3.0%
PER – NSFAS
FINAL FEBRUARY 2016
65
the NSFAS Loan Costing Model – this is the full, complicated costing model of the NSFAS entity (administration) and the NSFAS loan scheme.
the NSFAS Loan Choices Model – this model contains only one visible sheet, designed to enable the user to easily test the impact of changes to a limited number of key variables.
These versions of the costing model are described below.
7.3.1 Calibrating the models against reality
At the time the costing model was developed, NSFAS was transitioning from the old fragmented system of managing NSFAS loans (where funds are allocated to universities, which are in turn responsible for managing the applications, allocations and payments) to the more uniform new model. In fact, at the time the costing model was being developed, NSFAS was unable to provide very much information on the functioning of the new model that could be usefully used in the construction of the model and in calibrating the different variables.
The costing model is designed to replicate all aspects of the current policy parameters for the NSFAS loan scheme, with one important exception, namely: the costing model does not aim to replicate the current reality where NSFAS loans are being managed through both the old and the new models. Rather, the costing model is forward looking, and models how NSFAS will do business after transition to the new model is complete. This difference between the costing model and the historic/current reality is most noticeable in relation to the size of the average loan awarded, and the number of loans awarded. In the old model, certain universities have adopted the “some for all” approach to allocating their available NSFAS funds among eligible students. The result is that a large number of students are underfunded – and the number of students receiving NSFAS loans is exaggerated.
One of the aims of the new model is to ensure the implementation of the “all for some” approach – based on allocating a capped award to an ordered eligibility queue. The costing model adopts an “all for all” approach, in that the award provided for is proportional to the FCS at each of the universities, and the full award is allocated to all eligible students within the target group as defined by various policy variables. Both the award and the full funding of all eligible students are core cost drivers of the NSFAS loan scheme, and therefore modelling these variables based on an “all for all” approach differentiates the results of the costing model from the current actual results of the loan scheme as reported by NSFAS.
As far as possible, we have used data from the NSFAS 2012/13, 2013/14 and 2014/15 Annual Reports to calibrate the costing model. However, because the costing model does not replicate the current reality, much of the NSFAS data describing the current reality could not be usefully used for this exercise.
Also, the cost estimates generated by the model should not be viewed as precise forecasts applicable to the old NSFAS approach to managing the loans. Rather, the costing model aims to forecast the cost of a new reality based on the new model, and enables one to assess the effects of different policy choices in terms of the direction and the magnitude of the funding impact within the context of the new model.
7.4 The NSFAS Loan Costing Model – the full and complicated costing model
The NSFAS Loan Costing Model is a complicated costing model due to the complexity of estimating the cost of a loan scheme with many different possible permutations over a number of years. Consequently, the model consists of a large number of worksheets, many of which contain data and calculations users should not change – unless there is a fundamental change in the design of the NSFAS loan scheme that requires the design of the model itself to be altered – as opposed to simply altering variables within the model.
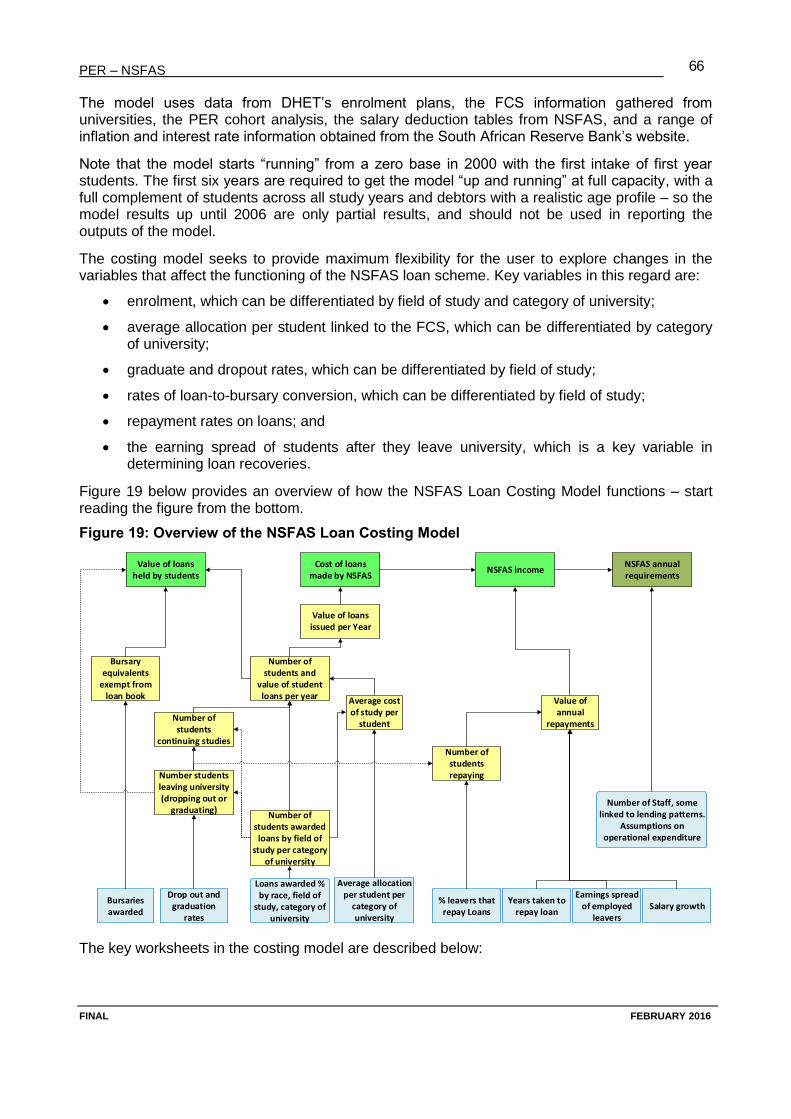
PER – NSFAS
FINAL FEBRUARY 2016
66
The model uses data from DHET’s enrolment plans, the FCS information gathered from universities, the PER cohort analysis, the salary deduction tables from NSFAS, and a range of inflation and interest rate information obtained from the South African Reserve Bank’s website.
Note that the model starts “running” from a zero base in 2000 with the first intake of first year students. The first six years are required to get the model “up and running” at full capacity, with a full complement of students across all study years and debtors with a realistic age profile – so the model results up until 2006 are only partial results, and should not be used in reporting the outputs of the model.
The costing model seeks to provide maximum flexibility for the user to explore changes in the variables that affect the functioning of the NSFAS loan scheme. Key variables in this regard are:
enrolment, which can be differentiated by field of study and category of university;
average allocation per student linked to the FCS, which can be differentiated by category of university;
graduate and dropout rates, which can be differentiated by field of study;
rates of loan-to-bursary conversion, which can be differentiated by field of study;
repayment rates on loans; and
the earning spread of students after they leave university, which is a key variable in determining loan recoveries.
Figure 19 below provides an overview of how the NSFAS Loan Costing Model functions – start reading the figure from the bottom.
Figure 19: Overview of the NSFAS Loan Costing Model
The key worksheets in the costing model are described below:
Cost of loans made by NSFAS
Value of loans held by students
NSFAS incomeNSFAS annual requirements
Number of students awarded loans by field of
study per category of university
Average cost of study per
student
Number students leaving university (dropping out or
graduating)
Number of students repaying
Value of loans issued per Year
Number of students and
value of student loans per year
Bursary equivalents
exempt from loan book
Average allocation per student per
category of university
Drop out and graduation
rates
Bursaries awarded
Loans awarded % by race, field of
study, category of university
Years taken to repay loan
Earnings spread of employed
leavers
% leavers that repay Loans
Salary growth
Value of annual
repaymentsNumber of students
continuing studies
Number of Staff, some linked to lending patterns.
Assumptions on operational expenditure
PER – NSFAS
FINAL FEBRUARY 2016
67
A. Readme: This worksheet contains a list, with hyperlinks to the worksheets with the variables that have the biggest impact on the costing results.
B. NSFAS entity: This worksheet estimates the operational cost of the NSFAS entity (administration). See a more detailed description in section 7.1 above.
C. Enrolment: The enrolment as a percentage of first year students by race of student, category of university and field of study are set on this worksheet. Three periods are provided: 2000-2009; 2010-2019 and 2020-2030. Assumptions entered in this worksheet determine how many students are allocated loans and come into the loan book.
D. DropGradRates: The dropout and graduation rates per field of study, differentiated by 3-year and 4-year degrees, are set on this worksheet. Three periods are provided: 2000-2009; 2010-2019 and 2020-2030. Assumptions entered in this worksheet determine how many students drop out, graduate and get repeat loans.
E. Salaries: The income spread of university leavers is set on this worksheet. There are twenty income categories that are aligned with the Salary Deduction Table currently used by NSFAS. Different income spreads can be set for Dropouts and Graduates. The model allows for three different scenarios of salary spreads to be set, and for the different (or same) scenario to be applied to each of the time periods (2000-2009, 2010-2019 and 2020-2030). The number of years it takes to pay off loans can be set for each income category. Assumptions entered in this worksheet affect the value of repayments – the more the spread is concentrated in the higher income categories, the larger the repayments in any particular year. The longer the time taken to repay loans, the more loans remain active per year, which also drives up the value of repayments per year.
F. Defaulters: The percentage of university leavers who start to repay their loans, then default, can be set here. The year in which the defaulting starts can be set by category of income. Note that the repayment rate in each year can be set in the GenAssumptions worksheet.
G. GenAssumptions: This contains a range of general assumptions that cut across most worksheets in the model. The variables with the most significant influence on costing results are:
i. Average allocation per student (line 10). This is the average value of loan per student, set by category of university. The start values are entered in 2014 (Column R), then are adjusted by inflation factors set lower down on the sheet.
ii. Proportion of students who repay loans (line 39). This is set in each year, and applies to all university leavers.
H. NSFASFundingNeeds: this is the key results worksheet in the model, and includes the following results:
i. No. of loans to first entrants – number of students receiving loans for the first time (usually in their first year).
ii. Value of loans to new enrolments – the total value of loans awarded to first entrants
iii. Number of students issued loans for the year – all students, first entrants and students receiving loans for the second, third or more time, awarded a loan in that particular year.
PER – NSFAS
FINAL FEBRUARY 2016
68
iv. Total value of NSFAS lending per year – total value of loans issued in the year to all students enrolled at university.
v. Average value of loan in calendar year – this is the total value of loans divided by the number of loans issued.
vi. Value of loan conversions – this is the value of loans that are converted into bursaries during the year.
vii. Loan conversions / lending – the value of loan conversions as a percentage of total lending during the year.
viii. NSFAS lending after loan conversion – this is the total value of loans (4) reduced by the total value of loan conversions (bursaries) awarded during the year.
ix. Repayments – the value of repayments made in a year. This amount takes rates of repayments and defaults into account.
x. NSFAS annual requirements – the total value of lending in a year (4) reduced by the total value of repayments in the year (9). This is what the model estimates government needs to provide to the scheme per year, based on the assumptions entered into the various worksheets. It does not include bursaries such as Funza Lushaka and the bursary schemes of other departments.
xi. NSFAS operating expenses – this is the estimated operational budget requirement of NSFAS the entity.
xii. Cumulative funds lent out by NSFAS, less loan conversions – total cumulative lending from 2000, less the cumulative value of loan conversions.
xiii. Cumulative funds lent less repayments and loan conversions – this is the value in (12) reduced by cumulative repayments.
xiv. Provision for bad debts – this is the value of bad debts written off (set by the variable in GenAssumptions)
xv. Net value of loan book – the value of loans on the loan book after taking bad debts and loan conversions into account.
xvi. Average Cost of Loans awarded to each graduate – the average total value of loans awarded to each graduate for each year they studied.
xvii. Average cost of loans awarded to each non-graduate – the average total value loans awarded to each leaver who does not graduate.
xviii. Total cost of loans to get one graduate – the total cost of loans issued to graduates and non-graduates per student that graduates.
xix. Number of graduates – the number of students who graduate in that year (includes students who complete their degree in minimum time as well as students who take the maximum allowed time).
I. Unicategory – Each university is placed into one of five categories in this worksheet, namely: 1. research universities, 2. general universities, 3. universities of technology, 4. historically
PER – NSFAS
FINAL FEBRUARY 2016
69
disadvantaged universities, and 5. UNISA. The categorisation of the universities can be changed on this sheet. The category of university is relevant to assumptions for Enrolment and average loan allocation by student (in GenAssumptions).
J. EnrolUniTotals – This contains the total undergraduate enrolment (i.e. all students that can apply for NSFAS loans) by university. This worksheet uses actual enrolments from 2007 to 2014, planned enrolment from 2015 to 2019. From 2000 to 2006 and 2020 to 2030, the enrolment is projected based on average annual change between 2007 and 2019, and these growth rates can be changed in the GenAssumptions worksheet. Also, the GenAssumption worksheet has a variable in Row 62: Proportion of all undergraduate students that are first time entrants to university. The percentage in this row is the percentage of students in the EnrolUniTotals worksheet that form the pool of students that the assumptions in the Enrolment worksheet are applied to.
K. Year worksheets – for each year from 2000 to 2030, there is a separate worksheet on which the calculations relevant to that year are made. No assumptions are in any of these worksheets.
7.5 The NSFAS Loan Costing Model – calibrating the NDP scenario
When the NSFAS Loan Costing Model is first opened, the variables are set up to reflect the NDP Scenario. This is our best estimate of a realistic path for moving towards the goals for higher education set out in the NDP 2030 (see the Introduction). The starting point in 2014 is calibrated to approximate the performance of the NSFAS loan scheme 2014 as reflected in the NSFAS Annual Reports 2014/15, the PER cohort study and the FCS information from universities. Then assumptions in relation to the key variables are made to move towards achieving the NDP goal most relevant to the NSFAS loan scheme, namely:
Increase the throughput rate for degree programmes to more than 75 per cent. The number of graduates will increase from the combined total of 167 469 for private and public higher education institutions to 425 000 by 2030.92
As noted previously, there are six key cost drivers of the NSFAS loan scheme, namely:
the number of undergraduate students eligible to receive NSFAS loans;
the dropout and graduation rates, or throughput rate;
the average value of loans awarded, linked to the FCS;
the extent of loan-to-bursary conversions;
the number of NSFAS debtors repaying their loans (or the loan repayment rate); and
the income table used to determine how much debtors should repay.
Policy choices in relation to these cost drivers impact significantly on the overall cost of the loan scheme. The following sections describe where these variables are set in the costing model, the issues taken into consideration when calibrating them, and show the levels at which these variables were set in the NDP Scenario.
The following table shows the categories into which the 24 universities are divided for the costing of the NDP scenario. Note that the categorisation of the universities can be changed in the model.
92 National Development Plan 2030, page 319.
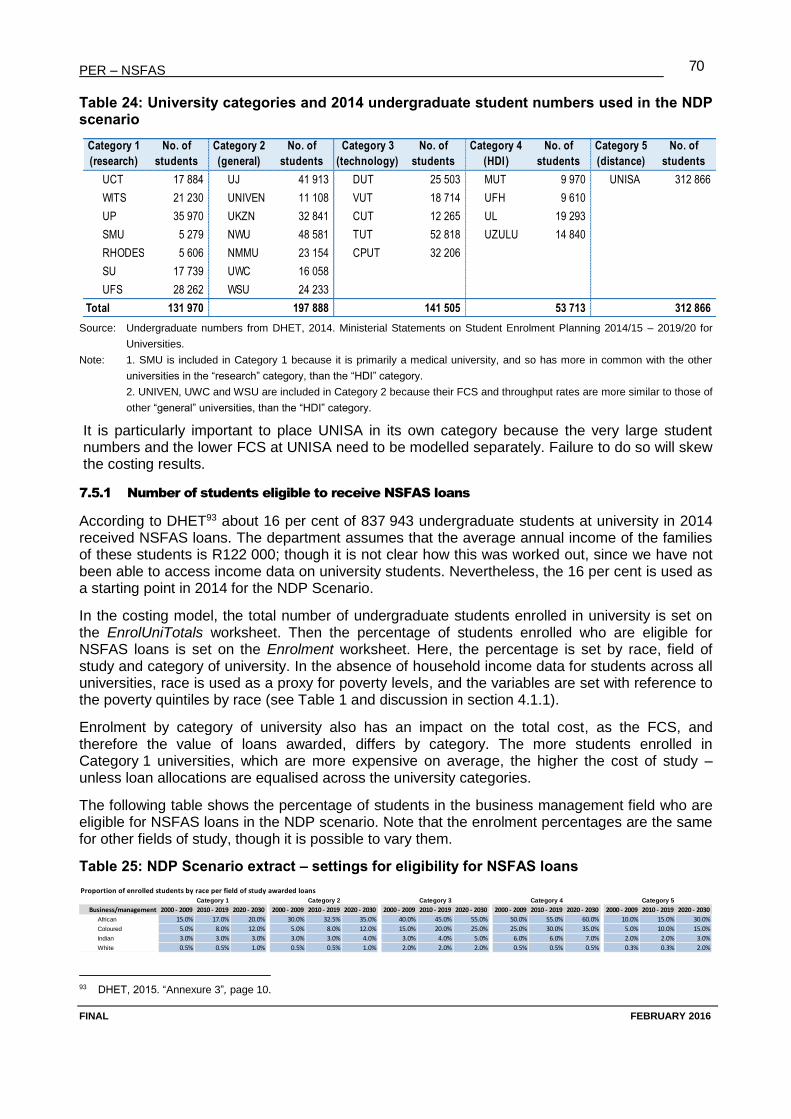
PER – NSFAS
FINAL FEBRUARY 2016
70
Table 24: University categories and 2014 undergraduate student numbers used in the NDP scenario
Source: Undergraduate numbers from DHET, 2014. Ministerial Statements on Student Enrolment Planning 2014/15 – 2019/20 for
Universities.
Note: 1. SMU is included in Category 1 because it is primarily a medical university, and so has more in common with the other
universities in the “research” category, than the “HDI” category.
2. UNIVEN, UWC and WSU are included in Category 2 because their FCS and throughput rates are more similar to those of
other “general” universities, than the “HDI” category.
It is particularly important to place UNISA in its own category because the very large student numbers and the lower FCS at UNISA need to be modelled separately. Failure to do so will skew the costing results.
7.5.1 Number of students eligible to receive NSFAS loans
According to DHET93 about 16 per cent of 837 943 undergraduate students at university in 2014 received NSFAS loans. The department assumes that the average annual income of the families of these students is R122 000; though it is not clear how this was worked out, since we have not been able to access income data on university students. Nevertheless, the 16 per cent is used as a starting point in 2014 for the NDP Scenario.
In the costing model, the total number of undergraduate students enrolled in university is set on the EnrolUniTotals worksheet. Then the percentage of students enrolled who are eligible for NSFAS loans is set on the Enrolment worksheet. Here, the percentage is set by race, field of study and category of university. In the absence of household income data for students across all universities, race is used as a proxy for poverty levels, and the variables are set with reference to the poverty quintiles by race (see Table 1 and discussion in section 4.1.1).
Enrolment by category of university also has an impact on the total cost, as the FCS, and therefore the value of loans awarded, differs by category. The more students enrolled in Category 1 universities, which are more expensive on average, the higher the cost of study – unless loan allocations are equalised across the university categories.
The following table shows the percentage of students in the business management field who are eligible for NSFAS loans in the NDP scenario. Note that the enrolment percentages are the same for other fields of study, though it is possible to vary them.
Table 25: NDP Scenario extract – settings for eligibility for NSFAS loans
93 DHET, 2015. “Annexure 3”, page 10.
Category 1
(research)
No. of
students
Category 2
(general)
No. of
students
Category 3
(technology)
No. of
students
Category 4
(HDI)
No. of
students
Category 5
(distance)
No. of
students
UCT 17 884 UJ 41 913 DUT 25 503 MUT 9 970 UNISA 312 866
WITS 21 230 UNIVEN 11 108 VUT 18 714 UFH 9 610
UP 35 970 UKZN 32 841 CUT 12 265 UL 19 293
SMU 5 279 NWU 48 581 TUT 52 818 UZULU 14 840
RHODES 5 606 NMMU 23 154 CPUT 32 206
SU 17 739 UWC 16 058
UFS 28 262 WSU 24 233
Total 131 970 197 888 141 505 53 713 312 866
Proportion of enrolled students by race per field of study awarded loans
Category 1 Category 2 Category 3 Category 4 Category 5
Business/management 2000 - 2009 2010 - 2019 2020 - 2030 2000 - 2009 2010 - 2019 2020 - 2030 2000 - 2009 2010 - 2019 2020 - 2030 2000 - 2009 2010 - 2019 2020 - 2030 2000 - 2009 2010 - 2019 2020 - 2030
African 15.0% 17.0% 20.0% 30.0% 32.5% 35.0% 40.0% 45.0% 55.0% 50.0% 55.0% 60.0% 10.0% 15.0% 30.0%
Coloured 5.0% 8.0% 12.0% 5.0% 8.0% 12.0% 15.0% 20.0% 25.0% 25.0% 30.0% 35.0% 5.0% 10.0% 15.0%
Indian 3.0% 3.0% 3.0% 3.0% 3.0% 4.0% 3.0% 4.0% 5.0% 6.0% 6.0% 7.0% 2.0% 2.0% 3.0%
White 0.5% 0.5% 1.0% 0.5% 0.5% 1.0% 2.0% 2.0% 2.0% 0.5% 0.5% 0.5% 0.3% 0.3% 2.0%
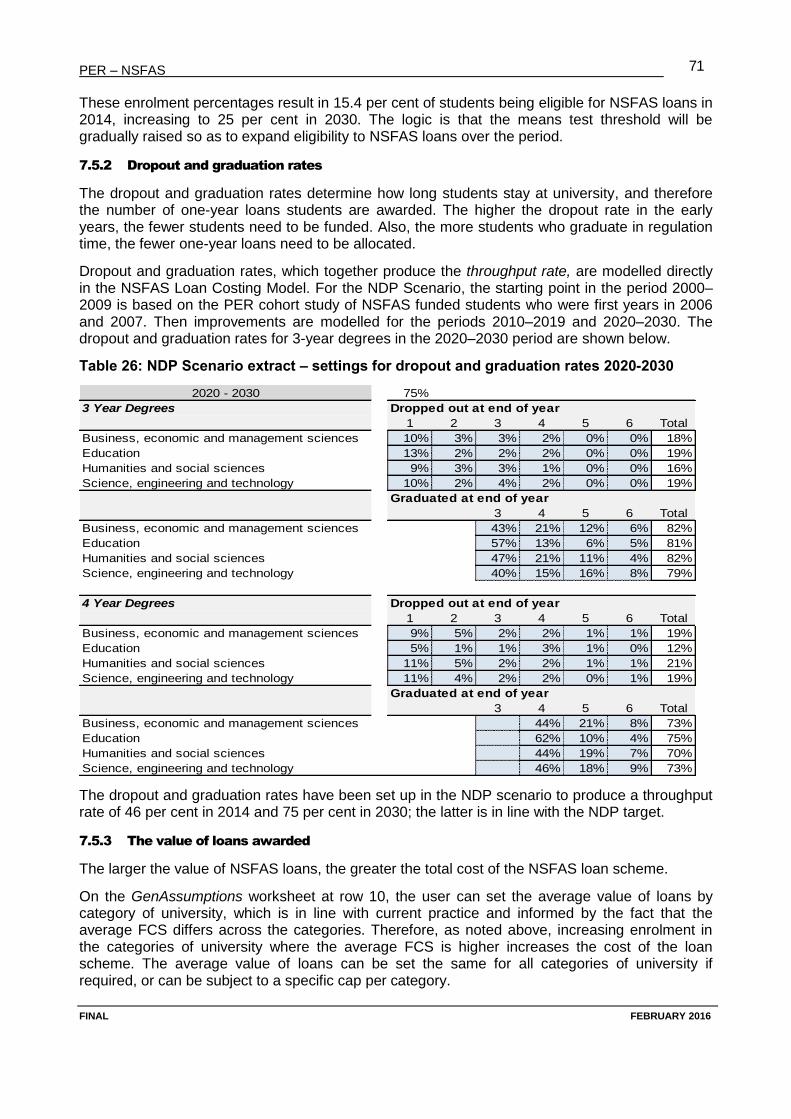
PER – NSFAS
FINAL FEBRUARY 2016
71
These enrolment percentages result in 15.4 per cent of students being eligible for NSFAS loans in 2014, increasing to 25 per cent in 2030. The logic is that the means test threshold will be gradually raised so as to expand eligibility to NSFAS loans over the period.
7.5.2 Dropout and graduation rates
The dropout and graduation rates determine how long students stay at university, and therefore the number of one-year loans students are awarded. The higher the dropout rate in the early years, the fewer students need to be funded. Also, the more students who graduate in regulation time, the fewer one-year loans need to be allocated.
Dropout and graduation rates, which together produce the throughput rate, are modelled directly in the NSFAS Loan Costing Model. For the NDP Scenario, the starting point in the period 2000–2009 is based on the PER cohort study of NSFAS funded students who were first years in 2006 and 2007. Then improvements are modelled for the periods 2010–2019 and 2020–2030. The dropout and graduation rates for 3-year degrees in the 2020–2030 period are shown below.
Table 26: NDP Scenario extract – settings for dropout and graduation rates 2020-2030
The dropout and graduation rates have been set up in the NDP scenario to produce a throughput rate of 46 per cent in 2014 and 75 per cent in 2030; the latter is in line with the NDP target.
7.5.3 The value of loans awarded
The larger the value of NSFAS loans, the greater the total cost of the NSFAS loan scheme.
On the GenAssumptions worksheet at row 10, the user can set the average value of loans by category of university, which is in line with current practice and informed by the fact that the average FCS differs across the categories. Therefore, as noted above, increasing enrolment in the categories of university where the average FCS is higher increases the cost of the loan scheme. The average value of loans can be set the same for all categories of university if required, or can be subject to a specific cap per category.
2020 - 2030 75%
3 Year Degrees Dropped out at end of year
1 2 3 4 5 6 Total
Business, economic and management sciences 10% 3% 3% 2% 0% 0% 18%
Education 13% 2% 2% 2% 0% 0% 19%
Humanities and social sciences 9% 3% 3% 1% 0% 0% 16%
Science, engineering and technology 10% 2% 4% 2% 0% 0% 19%
Graduated at end of year
3 4 5 6 Total
Business, economic and management sciences 43% 21% 12% 6% 82%
Education 57% 13% 6% 5% 81%
Humanities and social sciences 47% 21% 11% 4% 82%
Science, engineering and technology 40% 15% 16% 8% 79%
4 Year Degrees Dropped out at end of year
1 2 3 4 5 6 Total
Business, economic and management sciences 9% 5% 2% 2% 1% 1% 19%
Education 5% 1% 1% 3% 1% 0% 12%
Humanities and social sciences 11% 5% 2% 2% 1% 1% 21%
Science, engineering and technology 11% 4% 2% 2% 0% 1% 19%
Graduated at end of year
3 4 5 6 Total
Business, economic and management sciences 44% 21% 8% 73%
Education 62% 10% 4% 75%
Humanities and social sciences 44% 19% 7% 70%
Science, engineering and technology 46% 18% 9% 73%
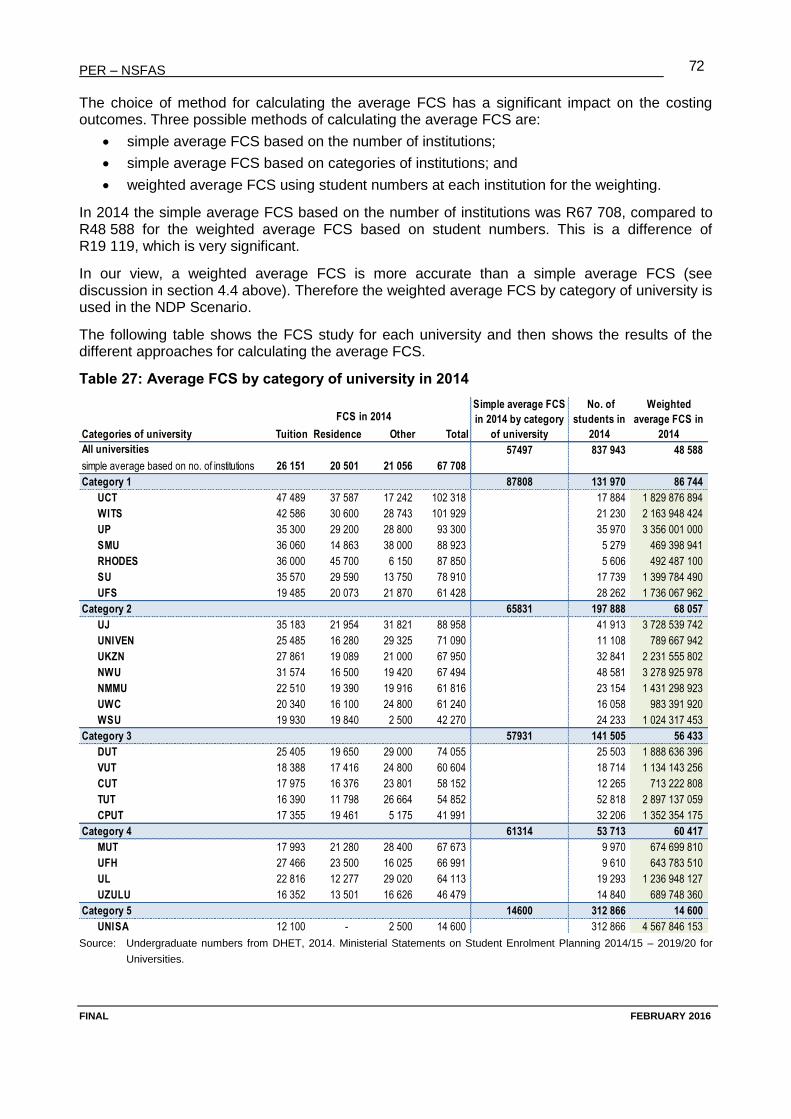
PER – NSFAS
FINAL FEBRUARY 2016
72
The choice of method for calculating the average FCS has a significant impact on the costing outcomes. Three possible methods of calculating the average FCS are:
simple average FCS based on the number of institutions;
simple average FCS based on categories of institutions; and
weighted average FCS using student numbers at each institution for the weighting.
In 2014 the simple average FCS based on the number of institutions was R67 708, compared to R48 588 for the weighted average FCS based on student numbers. This is a difference of R19 119, which is very significant.
In our view, a weighted average FCS is more accurate than a simple average FCS (see discussion in section 4.4 above). Therefore the weighted average FCS by category of university is used in the NDP Scenario.
The following table shows the FCS study for each university and then shows the results of the different approaches for calculating the average FCS.
Table 27: Average FCS by category of university in 2014
Source: Undergraduate numbers from DHET, 2014. Ministerial Statements on Student Enrolment Planning 2014/15 – 2019/20 for
Universities.
Tuition Residence Other Total
All universities 57497 837 943 48 588
simple average based on no. of institutions 26 151 20 501 21 056 67 708
Category 1 87808 131 970 86 744
UCT 47 489 37 587 17 242 102 318 17 884 1 829 876 894
WITS 42 586 30 600 28 743 101 929 21 230 2 163 948 424
UP 35 300 29 200 28 800 93 300 35 970 3 356 001 000
SMU 36 060 14 863 38 000 88 923 5 279 469 398 941
RHODES 36 000 45 700 6 150 87 850 5 606 492 487 100
SU 35 570 29 590 13 750 78 910 17 739 1 399 784 490
UFS 19 485 20 073 21 870 61 428 28 262 1 736 067 962
Category 2 65831 197 888 68 057
UJ 35 183 21 954 31 821 88 958 41 913 3 728 539 742
UNIVEN 25 485 16 280 29 325 71 090 11 108 789 667 942
UKZN 27 861 19 089 21 000 67 950 32 841 2 231 555 802
NWU 31 574 16 500 19 420 67 494 48 581 3 278 925 978
NMMU 22 510 19 390 19 916 61 816 23 154 1 431 298 923
UWC 20 340 16 100 24 800 61 240 16 058 983 391 920
WSU 19 930 19 840 2 500 42 270 24 233 1 024 317 453
Category 3 57931 141 505 56 433
DUT 25 405 19 650 29 000 74 055 25 503 1 888 636 396
VUT 18 388 17 416 24 800 60 604 18 714 1 134 143 256
CUT 17 975 16 376 23 801 58 152 12 265 713 222 808
TUT 16 390 11 798 26 664 54 852 52 818 2 897 137 059
CPUT 17 355 19 461 5 175 41 991 32 206 1 352 354 175
Category 4 61314 53 713 60 417
MUT 17 993 21 280 28 400 67 673 9 970 674 699 810
UFH 27 466 23 500 16 025 66 991 9 610 643 783 510
UL 22 816 12 277 29 020 64 113 19 293 1 236 948 127
UZULU 16 352 13 501 16 626 46 479 14 840 689 748 360
Category 5 14600 312 866 14 600
UNISA 12 100 - 2 500 14 600 312 866 4 567 846 153
40 713 782 225
Categories of university
FCS in 2014Simple average FCS
in 2014 by category
of university
No. of
students in
2014
Weighted
average FCS in
2014

PER – NSFAS
FINAL FEBRUARY 2016
73
In the NDP Scenario, the average value of loans awarded is set at 80 per cent of the 2014 weighted average FCS value for each category of university, and then increased by a CPI assumption set at 4.3 per cent per annum for the period. This is shown below:
Table 28: NDP Scenario extract – settings for the average loan value
The 80 per cent of the FCS accommodates an assumed EFC of 20 per cent per student or alternatively top-up funding from some of the universities in line with current practice.
The rate of increase is low compared to the historical growth in the FCS. However, in the wake of the #FeesMustFall campaign, it is unlikely that the government/universities are going to be able to increase the FCS by more than the average inflation rate going forward – and even this is doubtful, given government conceding to a zero increase in 2016.
7.5.4 NSFAS loan-to-bursary conversions
The costing model replicates the NSFAS loan scheme’s loan-to-bursary arrangements. So students who pass all their subjects have 40 per cent of their loan converted to a bursary, and the final year programme converts 100 per cent of their loan to a bursary in the year they graduate.
In practice, the total value of loans converted to bursaries reduces the value of debt held by students, and therefore the value of the NSFAS loan book and the amount of funds available to be recovered. This means these programmes reduce potential income. Note that the change to loan conversions takes a few years to impact repayments. The second year student who has her loan from first year converted will start repaying her loan two to six years later. If these loan-to-bursary programmes were to become even more generous, this would reduce the potential income from the loan book, and vice versa.
In the NDP Scenario, the percentage of students who benefit from loan-to-bursary conversions are set so that, in 2014, about 43 per cent of the total value of loans granted are converted to bursaries (see Table 18 and section 6.5.2). As throughput improves across the period, the loan-to-bursary conversions increase to 50 per cent in 2030 – even though the proportions shown below remain the same across the period.
Table 29: NDP Scenario extract – settings for loan-to-bursary conversions
7.5.5 NSFAS debtors repaying their loans
The number of NSFAS debtors repaying their loans has a direct impact on NSFAS loan recoveries. Generally, dropouts are half as likely to repay compared to graduates. However, as
2014 2015 2016 2017 2018 2019 2020 2025 2030
Average allocation per student
set it in 2014 Weighted FCS in 2014 2014 2015 2016 2017 2018 2019 2020 2025 2030
Category 1 86 744 69 395 72 351 75 433 78 647 81 997 85 490 89 132 109 805 135 273
Category 2 68 057 54 446 56 765 59 183 61 704 64 333 67 074 69 931 86 151 106 132
Category 3 56 433 45 146 47 069 49 074 51 165 53 345 55 617 57 986 71 436 88 004
Category 4 60 417 48 333 50 392 52 539 54 777 57 111 59 544 62 080 76 479 94 217
Category 5 14 600 11 680 12 178 12 696 13 237 13 801 14 389 15 002 18 482 22 768
Consumer Price Index 6% 4% 4.3% 4.3% 4.3% 4.3% 4.3% 4.3% 4.3%
Average % Full Cost of Study Awarded 80.0%
3 Year Degrees 20% loan converted to bursaries at start of year 40% loan converted to bursaries at start of year 100% graduate loan converted to bursaries at start of year
1 2 3 4 5 1 2 3 4 5 1 2 3 4 5
Business, economic and management sciences 30% 30% 30% 30% 30% 65% 65% 65% 65% 65% 100% 100% 100%
Health sciences 30% 30% 30% 30% 30% 65% 65% 65% 65% 65% 100% 100% 100%
Humanities and social sciences 30% 30% 30% 30% 30% 65% 65% 65% 65% 65% 100% 100% 100%
Natural sciences 30% 30% 30% 30% 30% 65% 65% 65% 65% 65% 100% 100% 100%
4 Year Degrees 20% loan converted to bursaries at start of year 40% loan converted to bursaries at start of year 100% graduate loan converted to bursaries at start of year
1 2 3 4 5 6 1 2 3 4 5 6 1 2 3 4 5 6
Business, economic and management sciences 30% 30% 30% 30% 30% 30% 65% 65% 65% 65% 65% 65% 100% 100% 100%
Health sciences 30% 30% 30% 30% 30% 30% 65% 65% 65% 65% 65% 65% 100% 100% 100%
Humanities and social sciences 30% 30% 30% 30% 30% 30% 65% 65% 65% 65% 65% 65% 100% 100% 100%
Natural sciences 30% 30% 30% 30% 30% 30% 65% 65% 65% 65% 65% 65% 100% 100% 100%
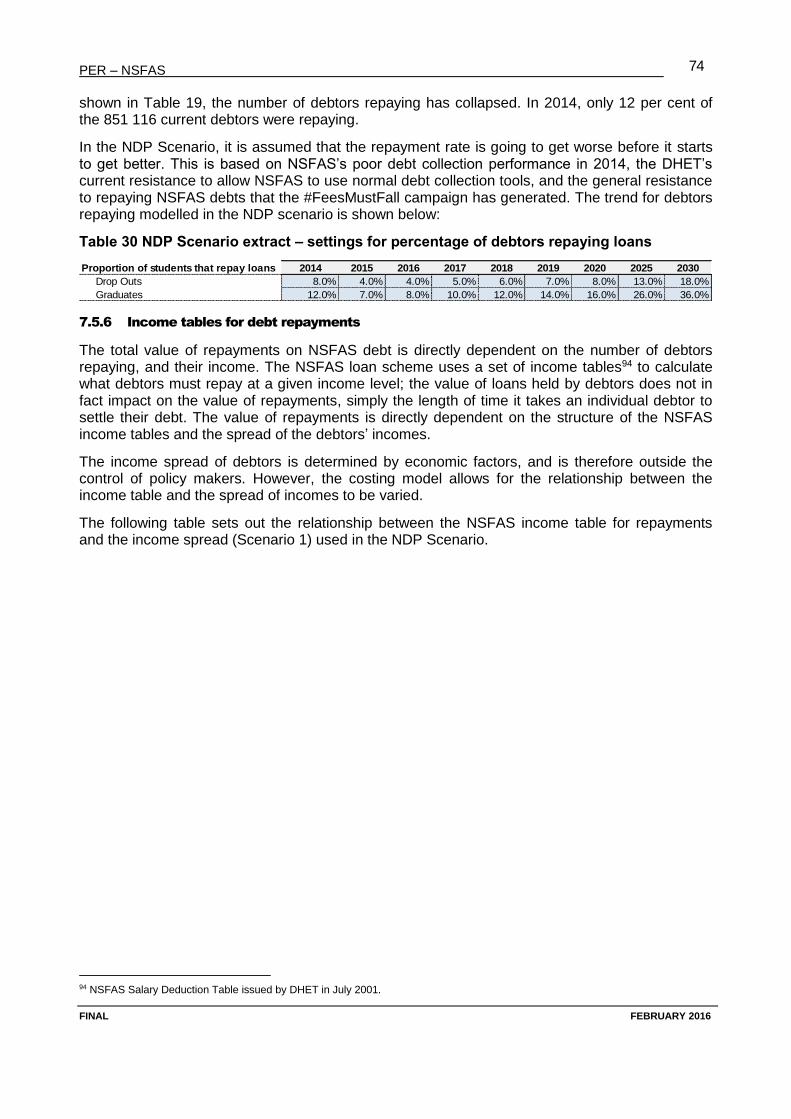
PER – NSFAS
FINAL FEBRUARY 2016
74
shown in Table 19, the number of debtors repaying has collapsed. In 2014, only 12 per cent of the 851 116 current debtors were repaying.
In the NDP Scenario, it is assumed that the repayment rate is going to get worse before it starts to get better. This is based on NSFAS’s poor debt collection performance in 2014, the DHET’s current resistance to allow NSFAS to use normal debt collection tools, and the general resistance to repaying NSFAS debts that the #FeesMustFall campaign has generated. The trend for debtors repaying modelled in the NDP scenario is shown below:
Table 30 NDP Scenario extract – settings for percentage of debtors repaying loans
7.5.6 Income tables for debt repayments
The total value of repayments on NSFAS debt is directly dependent on the number of debtors repaying, and their income. The NSFAS loan scheme uses a set of income tables94 to calculate what debtors must repay at a given income level; the value of loans held by debtors does not in fact impact on the value of repayments, simply the length of time it takes an individual debtor to settle their debt. The value of repayments is directly dependent on the structure of the NSFAS income tables and the spread of the debtors’ incomes.
The income spread of debtors is determined by economic factors, and is therefore outside the control of policy makers. However, the costing model allows for the relationship between the income table and the spread of incomes to be varied.
The following table sets out the relationship between the NSFAS income table for repayments and the income spread (Scenario 1) used in the NDP Scenario.
94 NSFAS Salary Deduction Table issued by DHET in July 2001.
Proportion of students that repay loans 2014 2015 2016 2017 2018 2019 2020 2025 2030
Drop Outs 8.0% 4.0% 4.0% 5.0% 6.0% 7.0% 8.0% 13.0% 18.0%
Graduates 12.0% 7.0% 8.0% 10.0% 12.0% 14.0% 16.0% 26.0% 36.0%
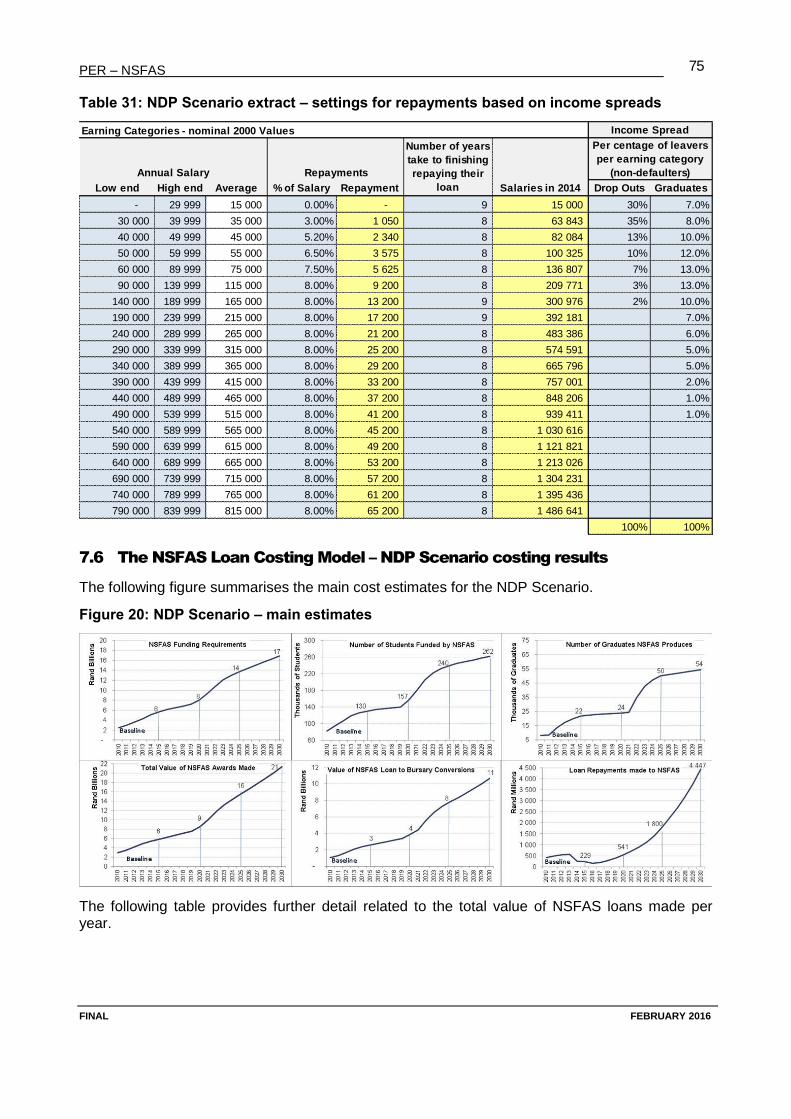
PER – NSFAS
FINAL FEBRUARY 2016
75
Table 31: NDP Scenario extract – settings for repayments based on income spreads
7.6 The NSFAS Loan Costing Model – NDP Scenario costing results
The following figure summarises the main cost estimates for the NDP Scenario.
Figure 20: NDP Scenario – main estimates
The following table provides further detail related to the total value of NSFAS loans made per year.
Earning Categories - nominal 2000 Values Income Spread Scenario 2
Annual Salary Repayments
Low end High end Average % of Salary
Annual
Repayment Salaries in 2014 Drop Outs Graduates
- 29 999 15 000 0.00% - 9 15 000 30% 7.0%
30 000 39 999 35 000 3.00% 1 050 8 63 843 35% 8.0%
40 000 49 999 45 000 5.20% 2 340 8 82 084 13% 10.0%
50 000 59 999 55 000 6.50% 3 575 8 100 325 10% 12.0%
60 000 89 999 75 000 7.50% 5 625 8 136 807 7% 13.0%
90 000 139 999 115 000 8.00% 9 200 8 209 771 3% 13.0%
140 000 189 999 165 000 8.00% 13 200 9 300 976 2% 10.0%
190 000 239 999 215 000 8.00% 17 200 9 392 181 7.0%
240 000 289 999 265 000 8.00% 21 200 8 483 386 6.0%
290 000 339 999 315 000 8.00% 25 200 8 574 591 5.0%
340 000 389 999 365 000 8.00% 29 200 8 665 796 5.0%
390 000 439 999 415 000 8.00% 33 200 8 757 001 2.0%
440 000 489 999 465 000 8.00% 37 200 8 848 206 1.0%
490 000 539 999 515 000 8.00% 41 200 8 939 411 1.0%
540 000 589 999 565 000 8.00% 45 200 8 1 030 616
590 000 639 999 615 000 8.00% 49 200 8 1 121 821
640 000 689 999 665 000 8.00% 53 200 8 1 213 026
690 000 739 999 715 000 8.00% 57 200 8 1 304 231
740 000 789 999 765 000 8.00% 61 200 8 1 395 436
790 000 839 999 815 000 8.00% 65 200 8 1 486 641
100% 100%
Per centage of leavers
per earning category
(non-defaulters)
Number of years
take to finishing
repaying their
loan
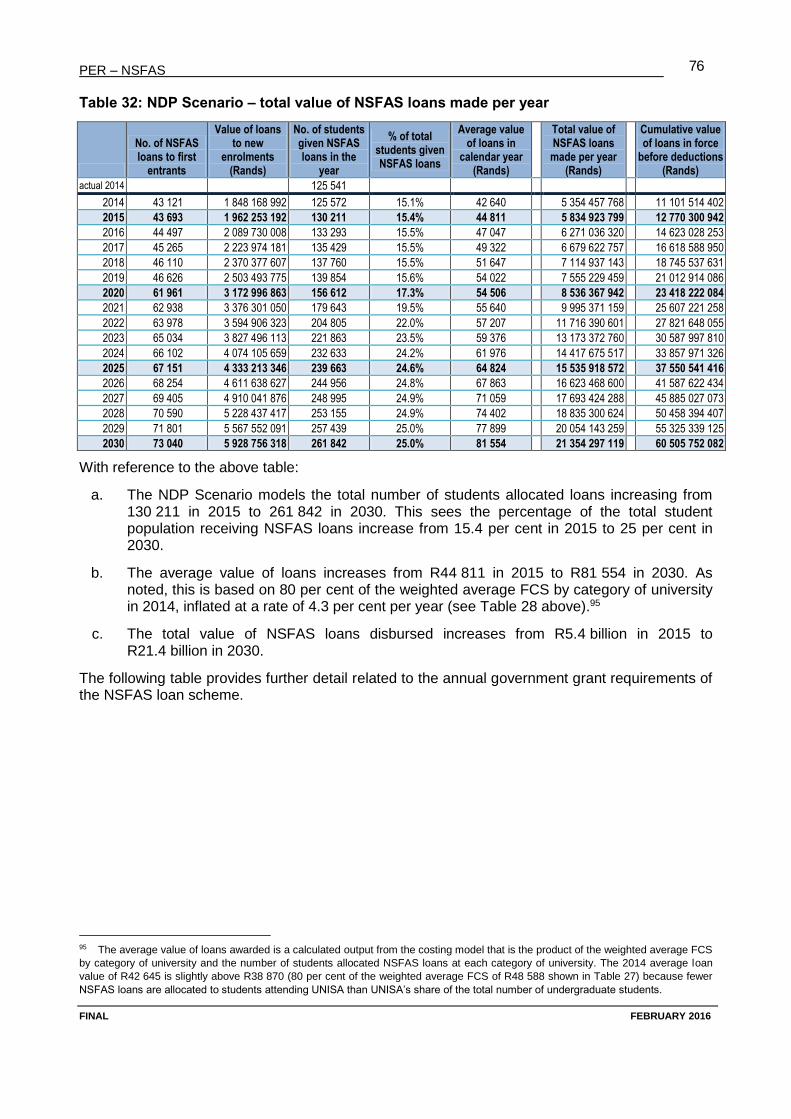
PER – NSFAS
FINAL FEBRUARY 2016
76
Table 32: NDP Scenario – total value of NSFAS loans made per year
No. of NSFAS loans to first
entrants
Value of loans to new
enrolments (Rands)
No. of students given NSFAS loans in the
year
% of total students given NSFAS loans
Average value of loans in
calendar year (Rands)
Total value of NSFAS loans made per year
(Rands)
Cumulative value of loans in force
before deductions (Rands)
actual 2014 125 541
2014 43 121 1 848 168 992 125 572 15.1% 42 640 5 354 457 768 11 101 514 402
2015 43 693 1 962 253 192 130 211 15.4% 44 811 5 834 923 799 12 770 300 942
2016 44 497 2 089 730 008 133 293 15.5% 47 047 6 271 036 320 14 623 028 253
2017 45 265 2 223 974 181 135 429 15.5% 49 322 6 679 622 757 16 618 588 950
2018 46 110 2 370 377 607 137 760 15.5% 51 647 7 114 937 143 18 745 537 631
2019 46 626 2 503 493 775 139 854 15.6% 54 022 7 555 229 459 21 012 914 086
2020 61 961 3 172 996 863 156 612 17.3% 54 506 8 536 367 942 23 418 222 084
2021 62 938 3 376 301 050 179 643 19.5% 55 640 9 995 371 159 25 607 221 258
2022 63 978 3 594 906 323 204 805 22.0% 57 207 11 716 390 601 27 821 648 055
2023 65 034 3 827 496 113 221 863 23.5% 59 376 13 173 372 760 30 587 997 810
2024 66 102 4 074 105 659 232 633 24.2% 61 976 14 417 675 517 33 857 971 326
2025 67 151 4 333 213 346 239 663 24.6% 64 824 15 535 918 572 37 550 541 416
2026 68 254 4 611 638 627 244 956 24.8% 67 863 16 623 468 600 41 587 622 434
2027 69 405 4 910 041 876 248 995 24.9% 71 059 17 693 424 288 45 885 027 073
2028 70 590 5 228 437 417 253 155 24.9% 74 402 18 835 300 624 50 458 394 407
2029 71 801 5 567 552 091 257 439 25.0% 77 899 20 054 143 259 55 325 339 125
2030 73 040 5 928 756 318 261 842 25.0% 81 554 21 354 297 119 60 505 752 082
With reference to the above table:
a. The NDP Scenario models the total number of students allocated loans increasing from 130 211 in 2015 to 261 842 in 2030. This sees the percentage of the total student population receiving NSFAS loans increase from 15.4 per cent in 2015 to 25 per cent in 2030.
b. The average value of loans increases from R44 811 in 2015 to R81 554 in 2030. As noted, this is based on 80 per cent of the weighted average FCS by category of university in 2014, inflated at a rate of 4.3 per cent per year (see Table 28 above).95
c. The total value of NSFAS loans disbursed increases from R5.4 billion in 2015 to R21.4 billion in 2030.
The following table provides further detail related to the annual government grant requirements of the NSFAS loan scheme.
95 The average value of loans awarded is a calculated output from the costing model that is the product of the weighted average FCS
by category of university and the number of students allocated NSFAS loans at each category of university. The 2014 average loan
value of R42 645 is slightly above R38 870 (80 per cent of the weighted average FCS of R48 588 shown in Table 27) because fewer
NSFAS loans are allocated to students attending UNISA than UNISA’s share of the total number of undergraduate students.
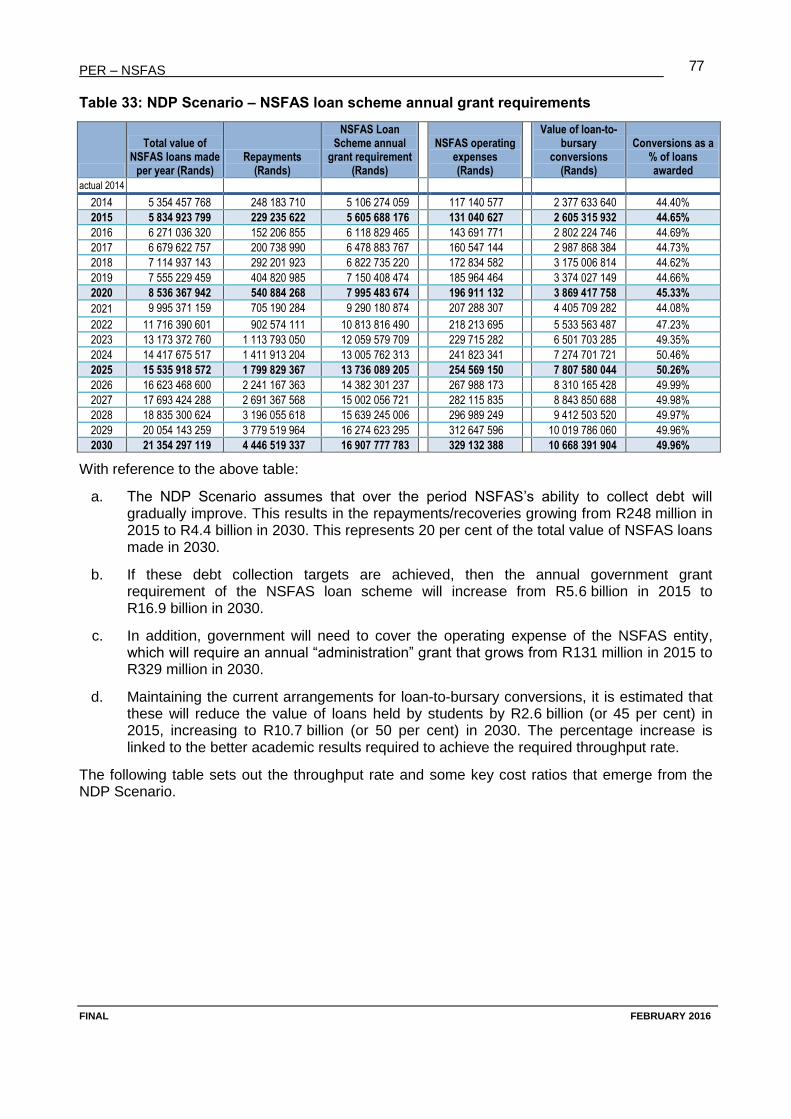
PER – NSFAS
FINAL FEBRUARY 2016
77
Table 33: NDP Scenario – NSFAS loan scheme annual grant requirements
Total value of NSFAS loans made
per year (Rands) Repayments
(Rands)
NSFAS Loan Scheme annual
grant requirement (Rands)
NSFAS operating expenses (Rands)
Value of loan-to-bursary
conversions (Rands)
Conversions as a % of loans awarded
actual 2014
2014 5 354 457 768 248 183 710 5 106 274 059 117 140 577 2 377 633 640 44.40%
2015 5 834 923 799 229 235 622 5 605 688 176 131 040 627 2 605 315 932 44.65%
2016 6 271 036 320 152 206 855 6 118 829 465 143 691 771 2 802 224 746 44.69%
2017 6 679 622 757 200 738 990 6 478 883 767 160 547 144 2 987 868 384 44.73%
2018 7 114 937 143 292 201 923 6 822 735 220 172 834 582 3 175 006 814 44.62%
2019 7 555 229 459 404 820 985 7 150 408 474 185 964 464 3 374 027 149 44.66%
2020 8 536 367 942 540 884 268 7 995 483 674 196 911 132 3 869 417 758 45.33%
2021 9 995 371 159 705 190 284 9 290 180 874 207 288 307 4 405 709 282 44.08%
2022 11 716 390 601 902 574 111 10 813 816 490 218 213 695 5 533 563 487 47.23%
2023 13 173 372 760 1 113 793 050 12 059 579 709 229 715 282 6 501 703 285 49.35%
2024 14 417 675 517 1 411 913 204 13 005 762 313 241 823 341 7 274 701 721 50.46%
2025 15 535 918 572 1 799 829 367 13 736 089 205 254 569 150 7 807 580 044 50.26%
2026 16 623 468 600 2 241 167 363 14 382 301 237 267 988 173 8 310 165 428 49.99%
2027 17 693 424 288 2 691 367 568 15 002 056 721 282 115 835 8 843 850 688 49.98%
2028 18 835 300 624 3 196 055 618 15 639 245 006 296 989 249 9 412 503 520 49.97%
2029 20 054 143 259 3 779 519 964 16 274 623 295 312 647 596 10 019 786 060 49.96%
2030 21 354 297 119 4 446 519 337 16 907 777 783 329 132 388 10 668 391 904 49.96%
With reference to the above table:
a. The NDP Scenario assumes that over the period NSFAS’s ability to collect debt will gradually improve. This results in the repayments/recoveries growing from R248 million in 2015 to R4.4 billion in 2030. This represents 20 per cent of the total value of NSFAS loans made in 2030.
b. If these debt collection targets are achieved, then the annual government grant requirement of the NSFAS loan scheme will increase from R5.6 billion in 2015 to R16.9 billion in 2030.
c. In addition, government will need to cover the operating expense of the NSFAS entity, which will require an annual “administration” grant that grows from R131 million in 2015 to R329 million in 2030.
d. Maintaining the current arrangements for loan-to-bursary conversions, it is estimated that these will reduce the value of loans held by students by R2.6 billion (or 45 per cent) in 2015, increasing to R10.7 billion (or 50 per cent) in 2030. The percentage increase is linked to the better academic results required to achieve the required throughput rate.
The following table sets out the throughput rate and some key cost ratios that emerge from the NDP Scenario.
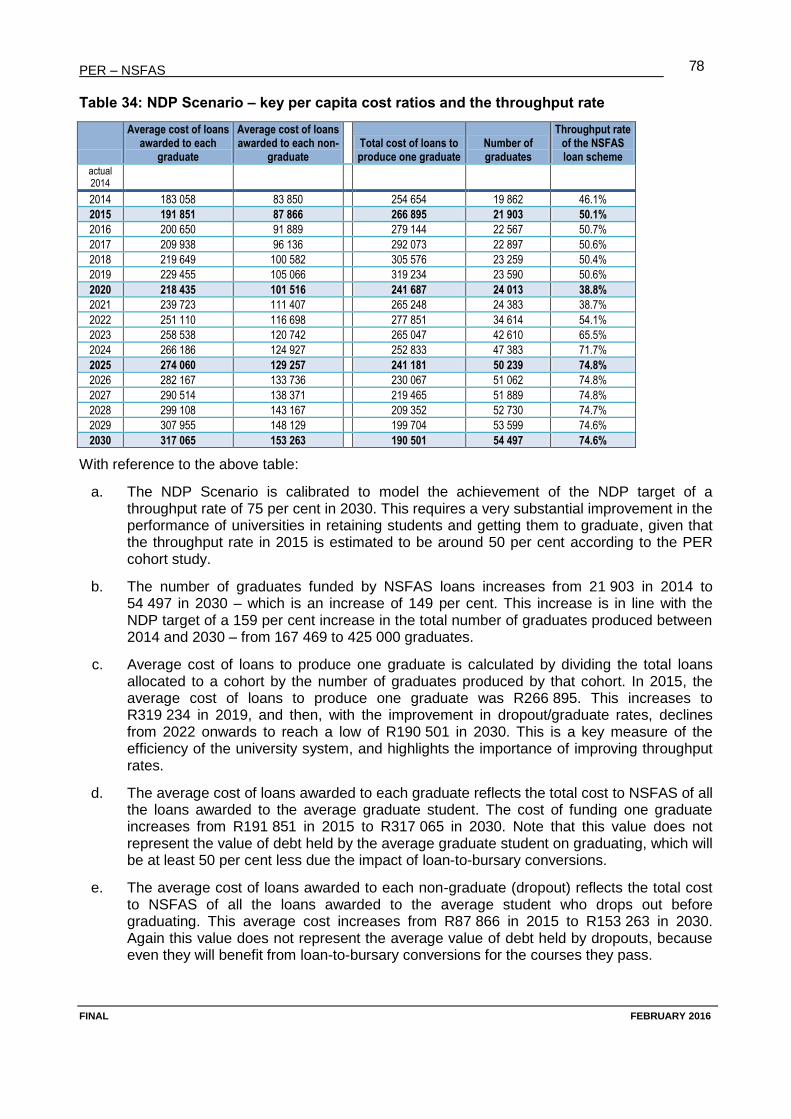
PER – NSFAS
FINAL FEBRUARY 2016
78
Table 34: NDP Scenario – key per capita cost ratios and the throughput rate
Average cost of loans awarded to each
graduate
Average cost of loans awarded to each non-
graduate Total cost of loans to produce one graduate
Number of graduates
Throughput rate of the NSFAS loan scheme
actual 2014
2014 183 058 83 850 254 654 19 862 46.1%
2015 191 851 87 866 266 895 21 903 50.1%
2016 200 650 91 889 279 144 22 567 50.7%
2017 209 938 96 136 292 073 22 897 50.6%
2018 219 649 100 582 305 576 23 259 50.4%
2019 229 455 105 066 319 234 23 590 50.6%
2020 218 435 101 516 241 687 24 013 38.8%
2021 239 723 111 407 265 248 24 383 38.7%
2022 251 110 116 698 277 851 34 614 54.1%
2023 258 538 120 742 265 047 42 610 65.5%
2024 266 186 124 927 252 833 47 383 71.7%
2025 274 060 129 257 241 181 50 239 74.8%
2026 282 167 133 736 230 067 51 062 74.8%
2027 290 514 138 371 219 465 51 889 74.8%
2028 299 108 143 167 209 352 52 730 74.7%
2029 307 955 148 129 199 704 53 599 74.6%
2030 317 065 153 263 190 501 54 497 74.6%
With reference to the above table:
a. The NDP Scenario is calibrated to model the achievement of the NDP target of a throughput rate of 75 per cent in 2030. This requires a very substantial improvement in the performance of universities in retaining students and getting them to graduate, given that the throughput rate in 2015 is estimated to be around 50 per cent according to the PER cohort study.
b. The number of graduates funded by NSFAS loans increases from 21 903 in 2014 to 54 497 in 2030 – which is an increase of 149 per cent. This increase is in line with the NDP target of a 159 per cent increase in the total number of graduates produced between 2014 and 2030 – from 167 469 to 425 000 graduates.
c. Average cost of loans to produce one graduate is calculated by dividing the total loans allocated to a cohort by the number of graduates produced by that cohort. In 2015, the average cost of loans to produce one graduate was R266 895. This increases to R319 234 in 2019, and then, with the improvement in dropout/graduate rates, declines from 2022 onwards to reach a low of R190 501 in 2030. This is a key measure of the efficiency of the university system, and highlights the importance of improving throughput rates.
d. The average cost of loans awarded to each graduate reflects the total cost to NSFAS of all the loans awarded to the average graduate student. The cost of funding one graduate increases from R191 851 in 2015 to R317 065 in 2030. Note that this value does not represent the value of debt held by the average graduate student on graduating, which will be at least 50 per cent less due the impact of loan-to-bursary conversions.
e. The average cost of loans awarded to each non-graduate (dropout) reflects the total cost to NSFAS of all the loans awarded to the average student who drops out before graduating. This average cost increases from R87 866 in 2015 to R153 263 in 2030. Again this value does not represent the average value of debt held by dropouts, because even they will benefit from loan-to-bursary conversions for the courses they pass.
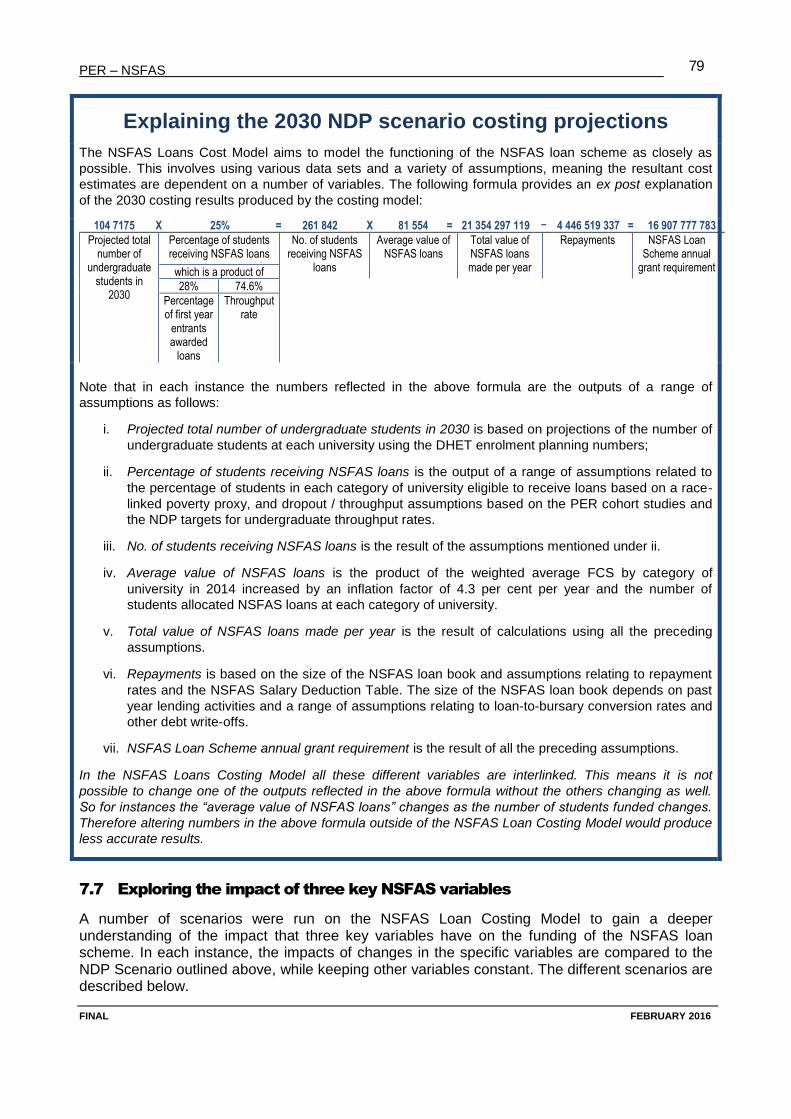
PER – NSFAS
FINAL FEBRUARY 2016
79
Explaining the 2030 NDP scenario costing projections
The NSFAS Loans Cost Model aims to model the functioning of the NSFAS loan scheme as closely as
possible. This involves using various data sets and a variety of assumptions, meaning the resultant cost
estimates are dependent on a number of variables. The following formula provides an ex post explanation
of the 2030 costing results produced by the costing model:
104 7175 X 25% = 261 842 X 81 554 = 21 354 297 119 4 446 519 337 = 16 907 777 783
Projected total number of
undergraduate students in
2030
Percentage of students receiving NSFAS loans
No. of students receiving NSFAS
loans
Average value of NSFAS loans
Total value of NSFAS loans made per year
Repayments NSFAS Loan Scheme annual
grant requirement which is a product of
28% 74.6%
Percentage of first year
entrants awarded
loans
Throughput rate
Note that in each instance the numbers reflected in the above formula are the outputs of a range of
assumptions as follows:
i. Projected total number of undergraduate students in 2030 is based on projections of the number of
undergraduate students at each university using the DHET enrolment planning numbers;
ii. Percentage of students receiving NSFAS loans is the output of a range of assumptions related to
the percentage of students in each category of university eligible to receive loans based on a race-
linked poverty proxy, and dropout / throughput assumptions based on the PER cohort studies and
the NDP targets for undergraduate throughput rates.
iii. No. of students receiving NSFAS loans is the result of the assumptions mentioned under ii.
iv. Average value of NSFAS loans is the product of the weighted average FCS by category of
university in 2014 increased by an inflation factor of 4.3 per cent per year and the number of
students allocated NSFAS loans at each category of university.
v. Total value of NSFAS loans made per year is the result of calculations using all the preceding
assumptions.
vi. Repayments is based on the size of the NSFAS loan book and assumptions relating to repayment
rates and the NSFAS Salary Deduction Table. The size of the NSFAS loan book depends on past
year lending activities and a range of assumptions relating to loan-to-bursary conversion rates and
other debt write-offs.
vii. NSFAS Loan Scheme annual grant requirement is the result of all the preceding assumptions.
In the NSFAS Loans Costing Model all these different variables are interlinked. This means it is not
possible to change one of the outputs reflected in the above formula without the others changing as well.
So for instances the “average value of NSFAS loans” changes as the number of students funded changes.
Therefore altering numbers in the above formula outside of the NSFAS Loan Costing Model would produce
less accurate results.
7.7 Exploring the impact of three key NSFAS variables
A number of scenarios were run on the NSFAS Loan Costing Model to gain a deeper understanding of the impact that three key variables have on the funding of the NSFAS loan scheme. In each instance, the impacts of changes in the specific variables are compared to the NDP Scenario outlined above, while keeping other variables constant. The different scenarios are described below.
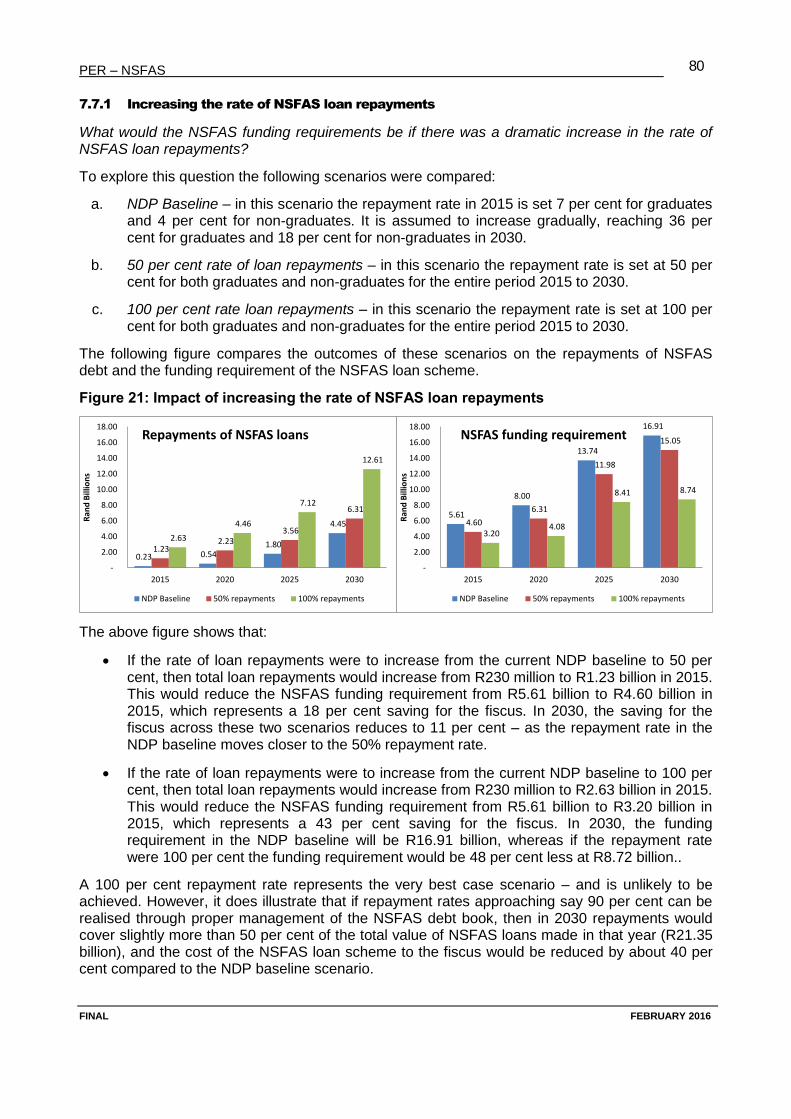
PER – NSFAS
FINAL FEBRUARY 2016
80
7.7.1 Increasing the rate of NSFAS loan repayments
What would the NSFAS funding requirements be if there was a dramatic increase in the rate of NSFAS loan repayments?
To explore this question the following scenarios were compared:
a. NDP Baseline – in this scenario the repayment rate in 2015 is set 7 per cent for graduates and 4 per cent for non-graduates. It is assumed to increase gradually, reaching 36 per cent for graduates and 18 per cent for non-graduates in 2030.
b. 50 per cent rate of loan repayments – in this scenario the repayment rate is set at 50 per cent for both graduates and non-graduates for the entire period 2015 to 2030.
c. 100 per cent rate loan repayments – in this scenario the repayment rate is set at 100 per cent for both graduates and non-graduates for the entire period 2015 to 2030.
The following figure compares the outcomes of these scenarios on the repayments of NSFAS debt and the funding requirement of the NSFAS loan scheme.
Figure 21: Impact of increasing the rate of NSFAS loan repayments
The above figure shows that:
If the rate of loan repayments were to increase from the current NDP baseline to 50 per cent, then total loan repayments would increase from R230 million to R1.23 billion in 2015. This would reduce the NSFAS funding requirement from R5.61 billion to R4.60 billion in 2015, which represents a 18 per cent saving for the fiscus. In 2030, the saving for the fiscus across these two scenarios reduces to 11 per cent – as the repayment rate in the NDP baseline moves closer to the 50% repayment rate.
If the rate of loan repayments were to increase from the current NDP baseline to 100 per cent, then total loan repayments would increase from R230 million to R2.63 billion in 2015. This would reduce the NSFAS funding requirement from R5.61 billion to R3.20 billion in 2015, which represents a 43 per cent saving for the fiscus. In 2030, the funding requirement in the NDP baseline will be R16.91 billion, whereas if the repayment rate were 100 per cent the funding requirement would be 48 per cent less at R8.72 billion..
A 100 per cent repayment rate represents the very best case scenario – and is unlikely to be achieved. However, it does illustrate that if repayment rates approaching say 90 per cent can be realised through proper management of the NSFAS debt book, then in 2030 repayments would cover slightly more than 50 per cent of the total value of NSFAS loans made in that year (R21.35 billion), and the cost of the NSFAS loan scheme to the fiscus would be reduced by about 40 per cent compared to the NDP baseline scenario.
0.23 0.54 1.80
4.45
1.23 2.23
3.56
6.31
2.63
4.46
7.12
12.61
-
2.00
4.00
6.00
8.00
10.00
12.00
14.00
16.00
18.00
2015 2020 2025 2030
Ran
d B
illio
ns
Repayments of NSFAS loans
NDP Baseline 50% repayments 100% repayments
5.61
8.00
13.74
16.91
4.60
6.31
11.98
15.05
3.20 4.08
8.41 8.74
-
2.00
4.00
6.00
8.00
10.00
12.00
14.00
16.00
18.00
2015 2020 2025 2030
Ran
d B
illio
ns
NSFAS funding requirement
NDP Baseline 50% repayments 100% repayments

PER – NSFAS
FINAL FEBRUARY 2016
81
In other words, strong improvements in the rate of repayment of NSFAS loans would greatly improve the fiscal sustainability of the NSFAS loan scheme.
7.7.2 Reducing NSFAS loan-to-bursary conversions
What would the impact be of making the NSFAS loan-to-bursary conversions less generous?
To explore this question the following scenarios were compared:
a. NDP Baseline – in this scenario the NSFAS loan-to-bursary conversions are set at: o 20 per cent conversion for 30 per cent of students – excluding final year students. o 40 per cent conversion for 65 per cent of students – excluding final year students. o 100 per cent conversion for final year students.
b. 30 per cent conversion for final year students – o 20 per cent conversion for 30 per cent of students – excluding final year students. o 40 per cent conversion for 65 per cent of students – excluding final year students. o 30 per cent conversion for final year students.
c. Reduce undergraduate conversion by 50 per cent – o 10 per cent conversion for 30 per cent of students – excluding final year students. o 20 per cent conversion for 65 per cent of students – excluding final year students. o 100 per cent conversion for final year students.
d. Combined b and c – o 10 per cent conversion for 30 per cent of students – excluding final year students. o 20 per cent conversion for 65 per cent of students – excluding final year students. o 30 per cent conversion for final year students.
The following figure compares the outcomes of these scenarios on the loan-to-bursary conversions and the value of the NSFAS debt book.
Figure 22: Impact of reducing the NSFAS loan-to-bursary conversions
The previous figure shows that:
If the loan-to-bursary conversion rate for final year students were reduced from 100 per cent to 30 per cent, it would reduce the cost of loan conversions associated with the final year programme by R700 million in 2015. The saving would be R3 billion in 2030.
If the loan-to-bursary conversion rate for undergraduate students were reduced by 50 per cent, it would reduce the cost of conversions by R800 million in 2015. The saving would be R3.2 billion in 2030.
2.6 3.9
7.8
10.7
2.0
3.0
5.6
7.7
1.8 2.6
5.5
7.4
1.1 1.7
3.3 4.5
-
5.0
10.0
15.0
20.0
2015 2020 2025 2030
Ran
d B
illio
ns
NSFAS loan to bursary conversions
NPD baseline Reduce final year conversion to 30%
Reduce u/grad by 50% Combined
14.9
29.4
43.2
70.6
15.9
30.9
46.5
75.3
16.2
31.4
46.9
75.7
16.4
31.6
47.7
76.8
-
10.0
20.0
30.0
40.0
50.0
60.0
70.0
80.0
2015 2020 2025 2030
Ran
d B
illio
ns
Size of the NSFAS loanbook
NPD baseline Reduce final year conversion to 30%
Reduce u/grad by 50% Combined

PER – NSFAS
FINAL FEBRUARY 2016
82
The combined effect of these changes would result in a saving of R1.5 billion in 2015 and R6.2 billion in 2030.
Because the loan-to-bursary conversions involve writing off NSFAS loan debt, these changes will increase the value of the NSFAS debt book as shown in the right-hand graph. This means that there is more debt available to be collected. However, because NSFAS loan repayments are fixed according to the income of debtors – and not according to the amount of debt held – repayments increase only marginally due to the fact that debtors will take longer to pay-off their NSFAS debt.
Reducing the generosity of the loan-to-bursary conversion arrangements and the final year programme will also change the quality of NSFAS debt. As noted in section 6.5.4 above, it is estimated that under the current arrangements as much as two-thirds of NSFAS debt (before write-offs) is held by individuals who dropped out of their studies, and whose chances of gaining employment are poor because they do not hold any qualification. The following table reproduces Table 21, but shows the impact of reducing the loan-to-bursary arrangements in line with scenario d above:
Table 35: Individual NSFAS loan scenarios – with revised loan-to-bursary conversions
With reference to the above table:
The changes to the loan-to-bursary arrangements do not change the amount of debt held by Student A. However, they will result in Students B and C holding slightly more debt than under the baseline scenario.
By contrast, the combined impact of the proposed changes to the loan-to-bursary arrangements and the final year programme will result in Students D and E holding
Student A Student B Student C Student D Student E
First year
dropout
Second year
dropout
Third year
dropout
Third year degree
graduate**
Three year degree
in 5 years
Year 1 Loan* 54 000 54 000 54 000 54 000 54 000
Loan to bursary conversion -5 400 -5 400 -10 800 -5 400
Year 2 loan - 56 400 56 400 56 400 56 400
Loan to bursary conversion - - -5 640 -11 280 -5 640
Interest*** - - - - -
Year 3 Loan - - 60 000 60 000 60 000
Loan to bursary conversion - - - -18 000 -6 000
Interest 2 160 - - - -
Year 4 Loan - - - - 32 800
Loan to bursary conversion -3 280
Interest 2 246 4 416 - -
Year 5 Loan - - - - 34 440
Loan to bursary conversion - - - - -10 332
Interest 2 336 4 593 6 816 3 533 -
Position at the end of five years 60 743 114 009 166 176 133 853 206 988
Baseline scenario before changes 60 743 108 609 155 136 68 890 162 560
difference - 5 400 11 040 64 963 44 428
Percentage of students in this category 38% 10% 11% 7% 6%
Unemployment rate of this category 35.6%
*Student fees/loans are based on Full Cost of Study Cap starting from 2011 as year 1.
**Student D is a student that passed each year well, and graduates at the end of three-years.
***Interest is calculated at 4% p.a starting 1 year after students leave university.
8.1%
Dropout scenarios Graduate scenarios
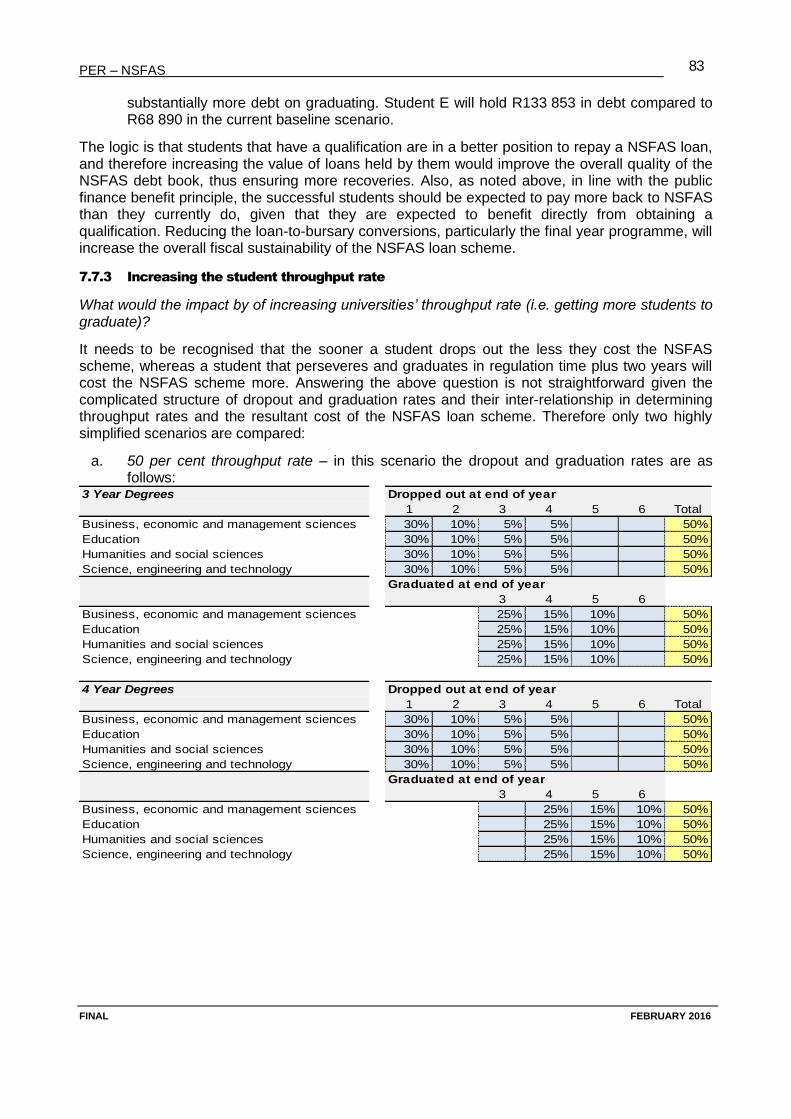
PER – NSFAS
FINAL FEBRUARY 2016
83
substantially more debt on graduating. Student E will hold R133 853 in debt compared to R68 890 in the current baseline scenario.
The logic is that students that have a qualification are in a better position to repay a NSFAS loan, and therefore increasing the value of loans held by them would improve the overall quality of the NSFAS debt book, thus ensuring more recoveries. Also, as noted above, in line with the public finance benefit principle, the successful students should be expected to pay more back to NSFAS than they currently do, given that they are expected to benefit directly from obtaining a qualification. Reducing the loan-to-bursary conversions, particularly the final year programme, will increase the overall fiscal sustainability of the NSFAS loan scheme.
7.7.3 Increasing the student throughput rate
What would the impact by of increasing universities’ throughput rate (i.e. getting more students to graduate)?
It needs to be recognised that the sooner a student drops out the less they cost the NSFAS scheme, whereas a student that perseveres and graduates in regulation time plus two years will cost the NSFAS scheme more. Answering the above question is not straightforward given the complicated structure of dropout and graduation rates and their inter-relationship in determining throughput rates and the resultant cost of the NSFAS loan scheme. Therefore only two highly simplified scenarios are compared:
a. 50 per cent throughput rate – in this scenario the dropout and graduation rates are as follows:
3 Year Degrees Dropped out at end of year
1 2 3 4 5 6 Total
Business, economic and management sciences 30% 10% 5% 5% 50%
Education 30% 10% 5% 5% 50%
Humanities and social sciences 30% 10% 5% 5% 50%
Science, engineering and technology 30% 10% 5% 5% 50%
Graduated at end of year
3 4 5 6
Business, economic and management sciences 25% 15% 10% 50%
Education 25% 15% 10% 50%
Humanities and social sciences 25% 15% 10% 50%
Science, engineering and technology 25% 15% 10% 50%
4 Year Degrees Dropped out at end of year
1 2 3 4 5 6 Total
Business, economic and management sciences 30% 10% 5% 5% 50%
Education 30% 10% 5% 5% 50%
Humanities and social sciences 30% 10% 5% 5% 50%
Science, engineering and technology 30% 10% 5% 5% 50%
Graduated at end of year
3 4 5 6
Business, economic and management sciences 25% 15% 10% 50%
Education 25% 15% 10% 50%
Humanities and social sciences 25% 15% 10% 50%
Science, engineering and technology 25% 15% 10% 50%

PER – NSFAS
FINAL FEBRUARY 2016
84
b. 75 per cent throughput rate – in this scenario the dropout and graduation rates are as follows:
The following figure shows the impact that the above two sets of dropout and graduation rates have on the number of students receiving NSFAS loans, and the number of graduates produced each year.
Figure 23: Impact of increasing throughput rates on students funded and graduates
With reference to the above figure:
Increasing the throughput rate from 50 to 75 per cent results in a decrease in the dropout rate, thus pushing up the number of students staying at university. This drives up the total number of students receiving NSFAS loans – even though the number of first years receiving NSFAS loans remains constant across the two scenarios.
Increasing the throughput rate from 50 to 75 per cent results in a 50 per cent increase in the number of students graduating as shown in the graph on the right.
3 Year Degrees Dropped out at end of year
1 2 3 4 5 6 Total
Business, economic and management sciences 15% 5% 5% 25%
Education 15% 5% 5% 25%
Humanities and social sciences 15% 5% 5% 25%
Science, engineering and technology 15% 5% 5% 25%
Graduated at end of year
3 4 5 6
Business, economic and management sciences 50% 20% 5% 75%
Education 50% 20% 5% 75%
Humanities and social sciences 50% 20% 5% 75%
Science, engineering and technology 50% 20% 5% 75%
4 Year Degrees Dropped out at end of year
1 2 3 4 5 6 Total
Business, economic and management sciences 15% 5% 5% 25%
Education 15% 5% 5% 25%
Humanities and social sciences 15% 5% 5% 25%
Science, engineering and technology 15% 5% 5% 25%
Graduated at end of year
3 4 5 6
Business, economic and management sciences 50% 20% 5% 75%
Education 50% 20% 5% 75%
Humanities and social sciences 50% 20% 5% 75%
Science, engineering and technology 50% 20% 5% 75%
122
147
187 204
136
162
209 227
-
50
100
150
200
250
2015 2020 2025 2030
Tho
usa
nd
s o
f st
ud
en
ts
NSFAS students funded
50% throughput rate 75% throughput rate
21 23 32 35 31 34
48 52
-
50
100
150
200
250
2015 2020 2025 2030
Tho
usa
nd
s o
f st
ud
en
ts
NSFAS students graduating
50% throughput rate 75% throughput rate
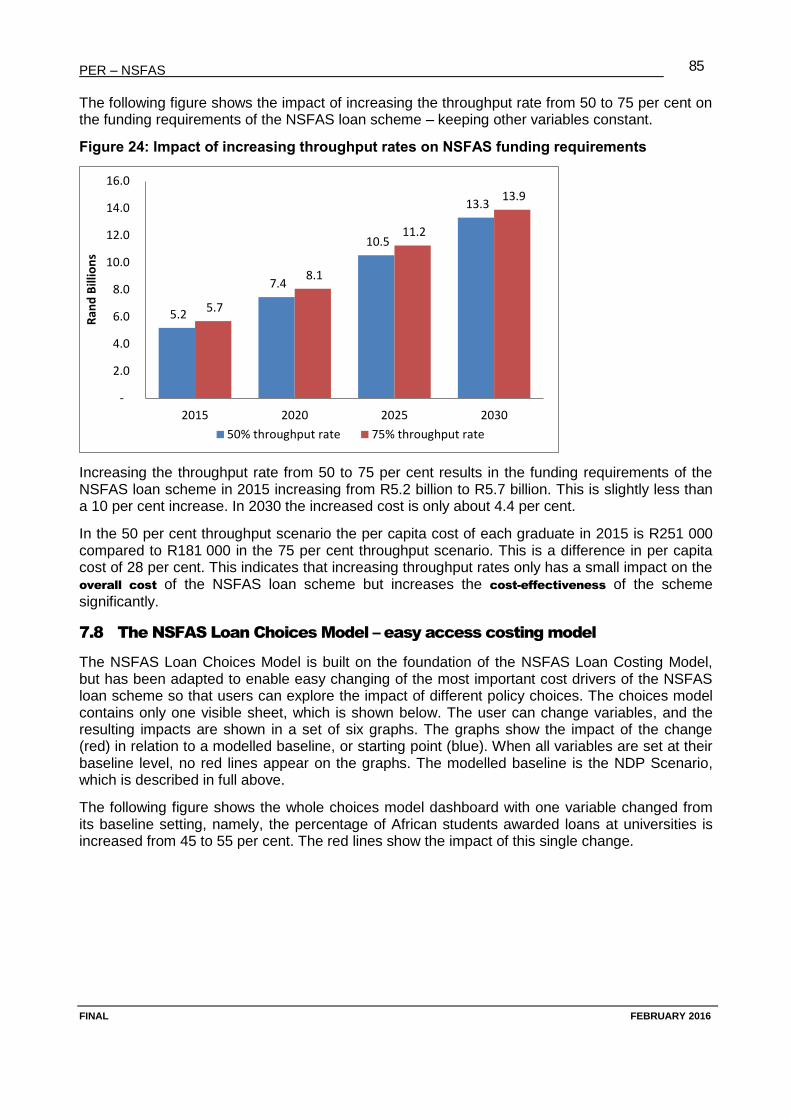
PER – NSFAS
FINAL FEBRUARY 2016
85
The following figure shows the impact of increasing the throughput rate from 50 to 75 per cent on the funding requirements of the NSFAS loan scheme – keeping other variables constant.
Figure 24: Impact of increasing throughput rates on NSFAS funding requirements
Increasing the throughput rate from 50 to 75 per cent results in the funding requirements of the NSFAS loan scheme in 2015 increasing from R5.2 billion to R5.7 billion. This is slightly less than a 10 per cent increase. In 2030 the increased cost is only about 4.4 per cent.
In the 50 per cent throughput scenario the per capita cost of each graduate in 2015 is R251 000 compared to R181 000 in the 75 per cent throughput scenario. This is a difference in per capita cost of 28 per cent. This indicates that increasing throughput rates only has a small impact on the overall cost of the NSFAS loan scheme but increases the cost-effectiveness of the scheme
significantly.
7.8 The NSFAS Loan Choices Model – easy access costing model
The NSFAS Loan Choices Model is built on the foundation of the NSFAS Loan Costing Model, but has been adapted to enable easy changing of the most important cost drivers of the NSFAS loan scheme so that users can explore the impact of different policy choices. The choices model contains only one visible sheet, which is shown below. The user can change variables, and the resulting impacts are shown in a set of six graphs. The graphs show the impact of the change (red) in relation to a modelled baseline, or starting point (blue). When all variables are set at their baseline level, no red lines appear on the graphs. The modelled baseline is the NDP Scenario, which is described in full above.
The following figure shows the whole choices model dashboard with one variable changed from its baseline setting, namely, the percentage of African students awarded loans at universities is increased from 45 to 55 per cent. The red lines show the impact of this single change.
5.2
7.4
10.5
13.3
5.7
8.1
11.2
13.9
-
2.0
4.0
6.0
8.0
10.0
12.0
14.0
16.0
2015 2020 2025 2030
Ran
d B
illio
ns
50% throughput rate 75% throughput rate
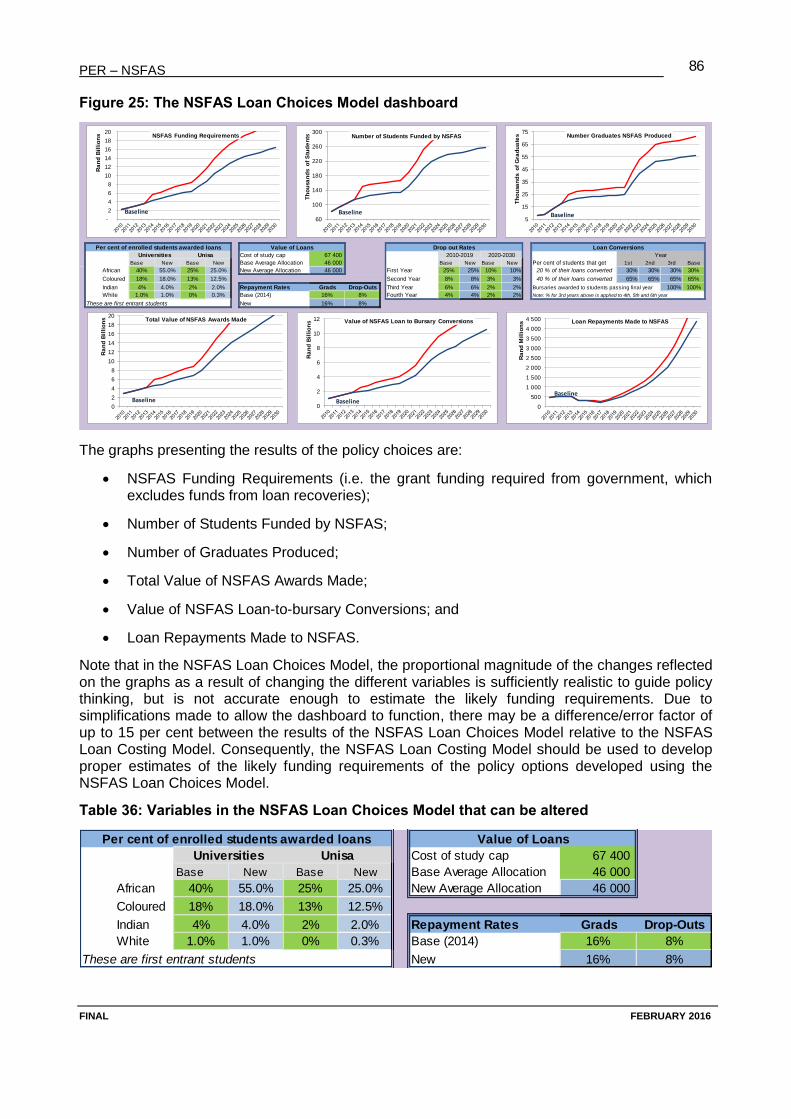
PER – NSFAS
FINAL FEBRUARY 2016
86
Figure 25: The NSFAS Loan Choices Model dashboard
The graphs presenting the results of the policy choices are:
NSFAS Funding Requirements (i.e. the grant funding required from government, which excludes funds from loan recoveries);
Number of Students Funded by NSFAS;
Number of Graduates Produced;
Total Value of NSFAS Awards Made;
Value of NSFAS Loan-to-bursary Conversions; and
Loan Repayments Made to NSFAS.
Note that in the NSFAS Loan Choices Model, the proportional magnitude of the changes reflected on the graphs as a result of changing the different variables is sufficiently realistic to guide policy thinking, but is not accurate enough to estimate the likely funding requirements. Due to simplifications made to allow the dashboard to function, there may be a difference/error factor of up to 15 per cent between the results of the NSFAS Loan Choices Model relative to the NSFAS Loan Costing Model. Consequently, the NSFAS Loan Costing Model should be used to develop proper estimates of the likely funding requirements of the policy options developed using the NSFAS Loan Choices Model.
Table 36: Variables in the NSFAS Loan Choices Model that can be altered
Per cent of enrolled students awarded loans Value of Loans Drop out Rates Loan Conversions
Universities Unisa Cost of study cap 67 400 2010-2019 2020-2030 Year
Base New Base New Base Average Allocation 46 000 Base New Base New Per cent of students that get 1st 2nd 3rd Base
African 40% 55.0% 25% 25.0% New Average Allocation 46 000 First Year 25% 25% 10% 10% 20 % of their loans converted 30% 30% 30% 30%
Coloured 18% 18.0% 13% 12.5% Second Year 8% 8% 3% 3% 40 % of their loans converted 65% 65% 65% 65%
Indian 4% 4.0% 2% 2.0% Repayment Rates Grads Drop-Outs Third Year 6% 6% 2% 2% Bursaries awarded to students passing final year 100% 100%
White 1.0% 1.0% 0% 0.3% Base (2014) 16% 8% Fourth Year 4% 4% 2% 2% Note: % for 3rd years above is applied to 4th, 5th and 6th year
These are first entrant students New 16% 8%
5
15
25
35
45
55
65
75
Th
ou
san
ds
of
Gra
du
ate
s Number Graduates NSFAS Produced
Baseline
0
2
4
6
8
10
12
14
16
18
20
Ra
nd
Bil
lio
ns Total Value of NSFAS Awards Made
Baseline0
2
4
6
8
10
12
Ra
nd
Bil
lio
ns Value of NSFAS Loan to Bursary Conversions
Baseline0
500
1 000
1 500
2 000
2 500
3 000
3 500
4 000
4 500
Ra
nd
Mil
lio
ns Loan Repayments Made to NSFAS
Baseline
-
2
4
6
8
10
12
14
16
18
20
Ra
nd
Bil
lio
ns NSFAS Funding Requirements
Baseline60
100
140
180
220
260
300
Th
ou
san
ds
of
Stu
de
nts Number of Students Funded by NSFAS
Baseline
Per cent of enrolled students awarded loans Value of Loans Drop out Rates
Universities Unisa Cost of study cap 67 400
Base New Base New Base Average Allocation 46 000
African 40% 55.0% 25% 25.0% New Average Allocation 46 000
Coloured 18% 18.0% 13% 12.5%
Indian 4% 4.0% 2% 2.0% Repayment Rates Grads Drop-Outs
White 1.0% 1.0% 0% 0.3% Base (2014) 16% 8%
These are first entrant students New 16% 8%
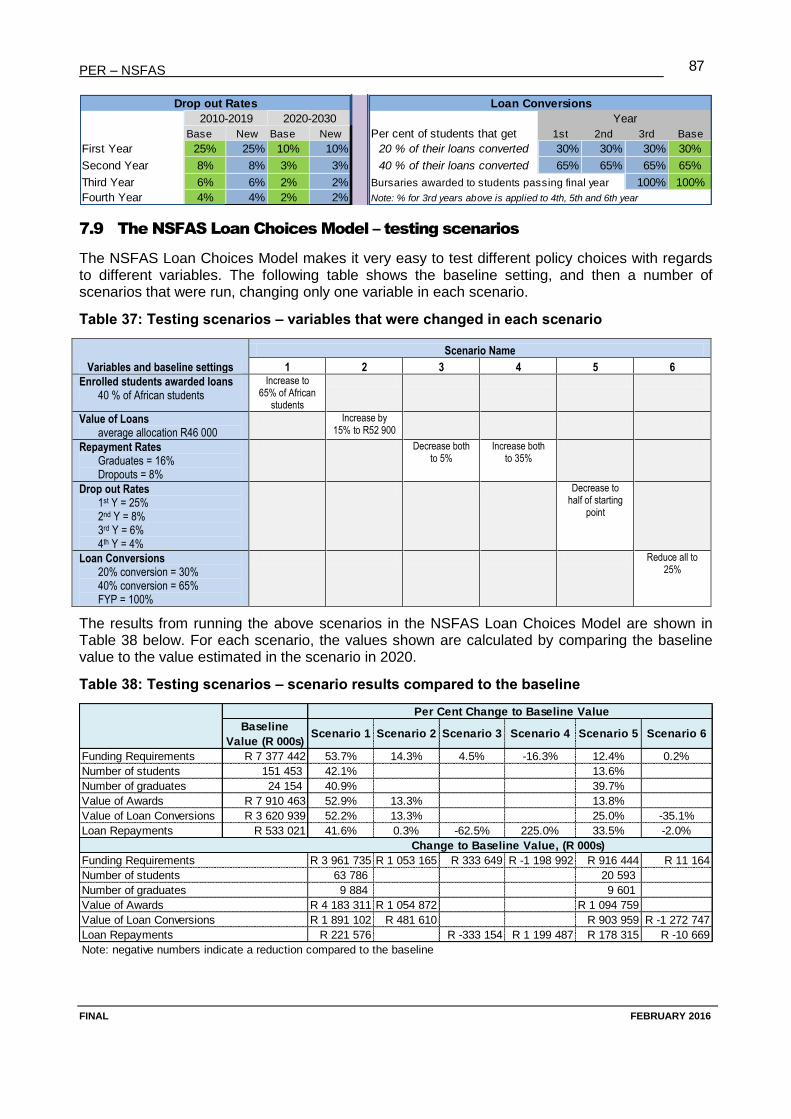
PER – NSFAS
FINAL FEBRUARY 2016
87
7.9 The NSFAS Loan Choices Model – testing scenarios
The NSFAS Loan Choices Model makes it very easy to test different policy choices with regards to different variables. The following table shows the baseline setting, and then a number of scenarios that were run, changing only one variable in each scenario.
Table 37: Testing scenarios – variables that were changed in each scenario
Variables and baseline settings
Scenario Name
1 2 3 4 5 6
Enrolled students awarded loans 40 % of African students
Increase to 65% of African
students
Value of Loans average allocation R46 000
Increase by 15% to R52 900
Repayment Rates Graduates = 16% Dropouts = 8%
Decrease both to 5%
Increase both to 35%
Drop out Rates 1st Y = 25% 2nd Y = 8% 3rd Y = 6% 4th Y = 4%
Decrease to half of starting
point
Loan Conversions 20% conversion = 30% 40% conversion = 65% FYP = 100%
Reduce all to 25%
The results from running the above scenarios in the NSFAS Loan Choices Model are shown in Table 38 below. For each scenario, the values shown are calculated by comparing the baseline value to the value estimated in the scenario in 2020.
Table 38: Testing scenarios – scenario results compared to the baseline
Drop out Rates Loan Conversions
2010-2019 2020-2030 Year
Base New Base New Per cent of students that get 1st 2nd 3rd Base
First Year 25% 25% 10% 10% 20 % of their loans converted 30% 30% 30% 30%
Second Year 8% 8% 3% 3% 40 % of their loans converted 65% 65% 65% 65%
Third Year 6% 6% 2% 2% Bursaries awarded to students passing final year 100% 100%
Fourth Year 4% 4% 2% 2% Note: % for 3rd years above is applied to 4th, 5th and 6th year
Per Cent Change to Baseline Value
Baseline
Value (R 000s)Scenario 1 Scenario 2 Scenario 3 Scenario 4 Scenario 5 Scenario 6
Funding Requirements R 7 377 442 53.7% 14.3% 4.5% -16.3% 12.4% 0.2%
Number of students 151 453 42.1% 13.6%
Number of graduates 24 154 40.9% 39.7%
Value of Awards R 7 910 463 52.9% 13.3% 13.8%
Value of Loan Conversions R 3 620 939 52.2% 13.3% 25.0% -35.1%
Loan Repayments R 533 021 41.6% 0.3% -62.5% 225.0% 33.5% -2.0%
Change to Baseline Value, (R 000s)
Funding Requirements R 3 961 735 R 1 053 165 R 333 649 R -1 198 992 R 916 444 R 11 164
Number of students 63 786 20 593
Number of graduates 9 884 9 601
Value of Awards R 4 183 311 R 1 054 872 R 1 094 759
Value of Loan Conversions R 1 891 102 R 481 610 R 903 959 R -1 272 747
Loan Repayments R 221 576 R -333 154 R 1 199 487 R 178 315 R -10 669
Note: negative numbers indicate a reduction compared to the baseline
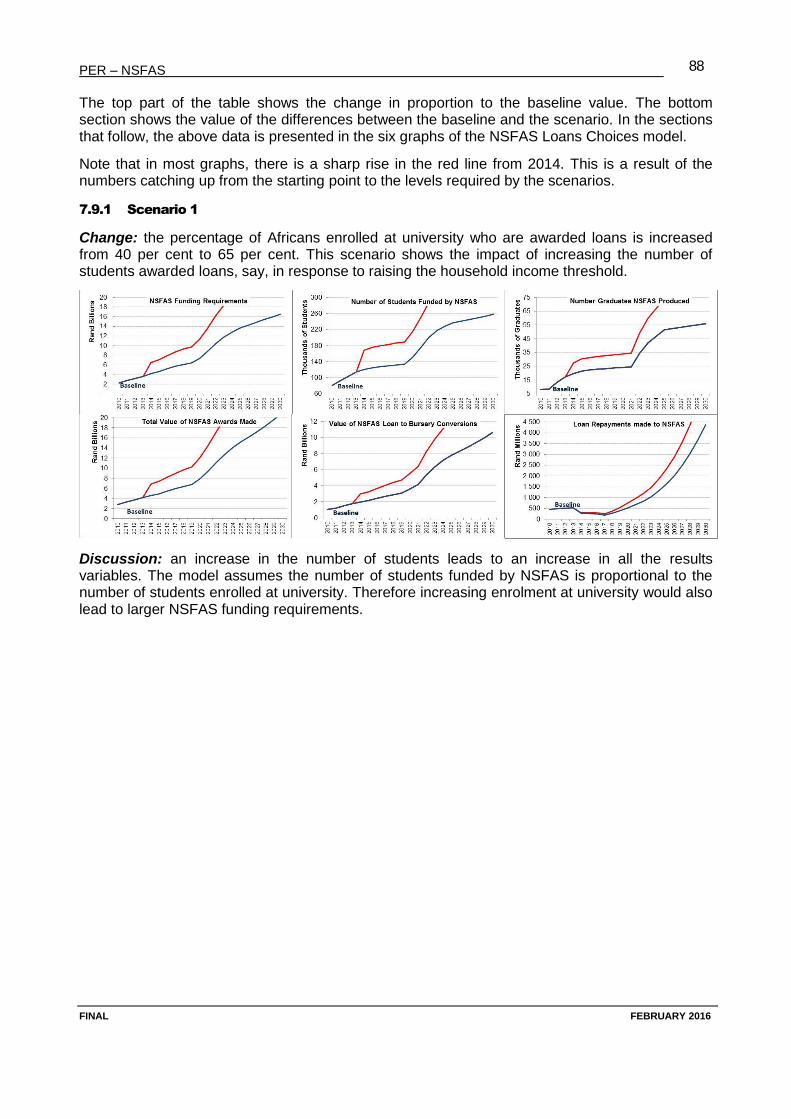
PER – NSFAS
FINAL FEBRUARY 2016
88
The top part of the table shows the change in proportion to the baseline value. The bottom section shows the value of the differences between the baseline and the scenario. In the sections that follow, the above data is presented in the six graphs of the NSFAS Loans Choices model.
Note that in most graphs, there is a sharp rise in the red line from 2014. This is a result of the numbers catching up from the starting point to the levels required by the scenarios.
7.9.1 Scenario 1
Change: the percentage of Africans enrolled at university who are awarded loans is increased from 40 per cent to 65 per cent. This scenario shows the impact of increasing the number of students awarded loans, say, in response to raising the household income threshold.
Discussion: an increase in the number of students leads to an increase in all the results variables. The model assumes the number of students funded by NSFAS is proportional to the number of students enrolled at university. Therefore increasing enrolment at university would also lead to larger NSFAS funding requirements.
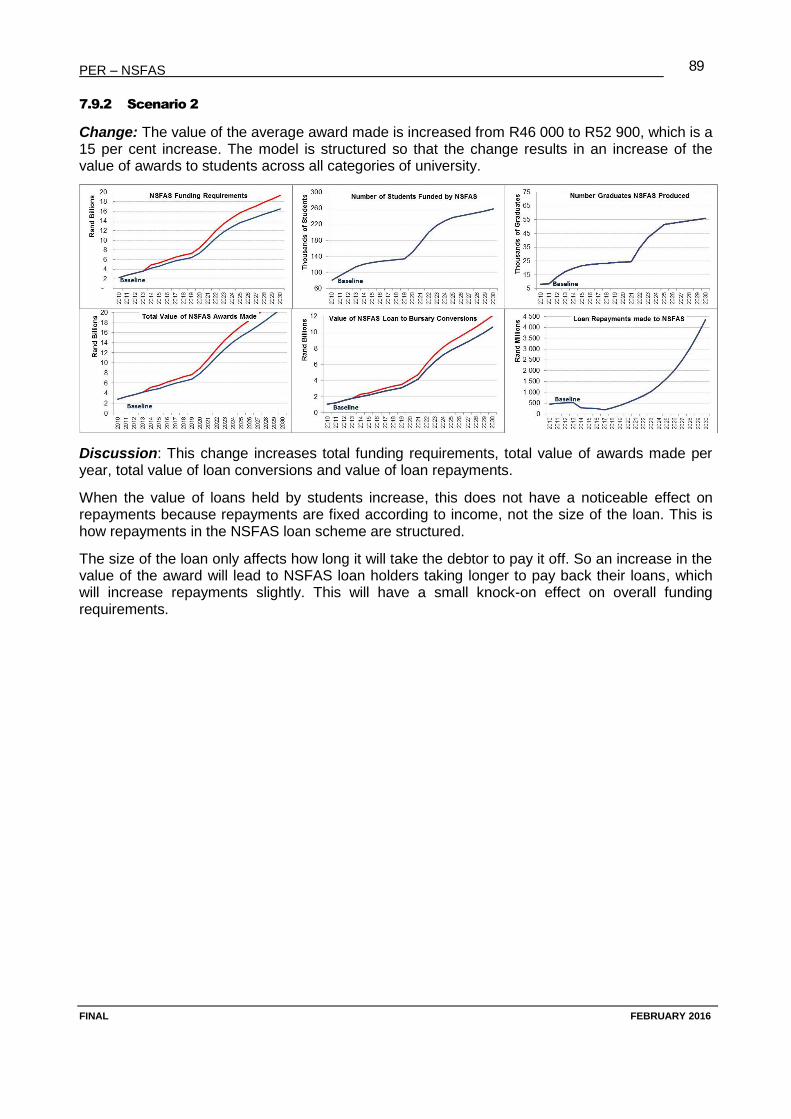
PER – NSFAS
FINAL FEBRUARY 2016
89
7.9.2 Scenario 2
Change: The value of the average award made is increased from R46 000 to R52 900, which is a 15 per cent increase. The model is structured so that the change results in an increase of the value of awards to students across all categories of university.
Discussion: This change increases total funding requirements, total value of awards made per year, total value of loan conversions and value of loan repayments.
When the value of loans held by students increase, this does not have a noticeable effect on repayments because repayments are fixed according to income, not the size of the loan. This is how repayments in the NSFAS loan scheme are structured.
The size of the loan only affects how long it will take the debtor to pay it off. So an increase in the value of the award will lead to NSFAS loan holders taking longer to pay back their loans, which will increase repayments slightly. This will have a small knock-on effect on overall funding requirements.
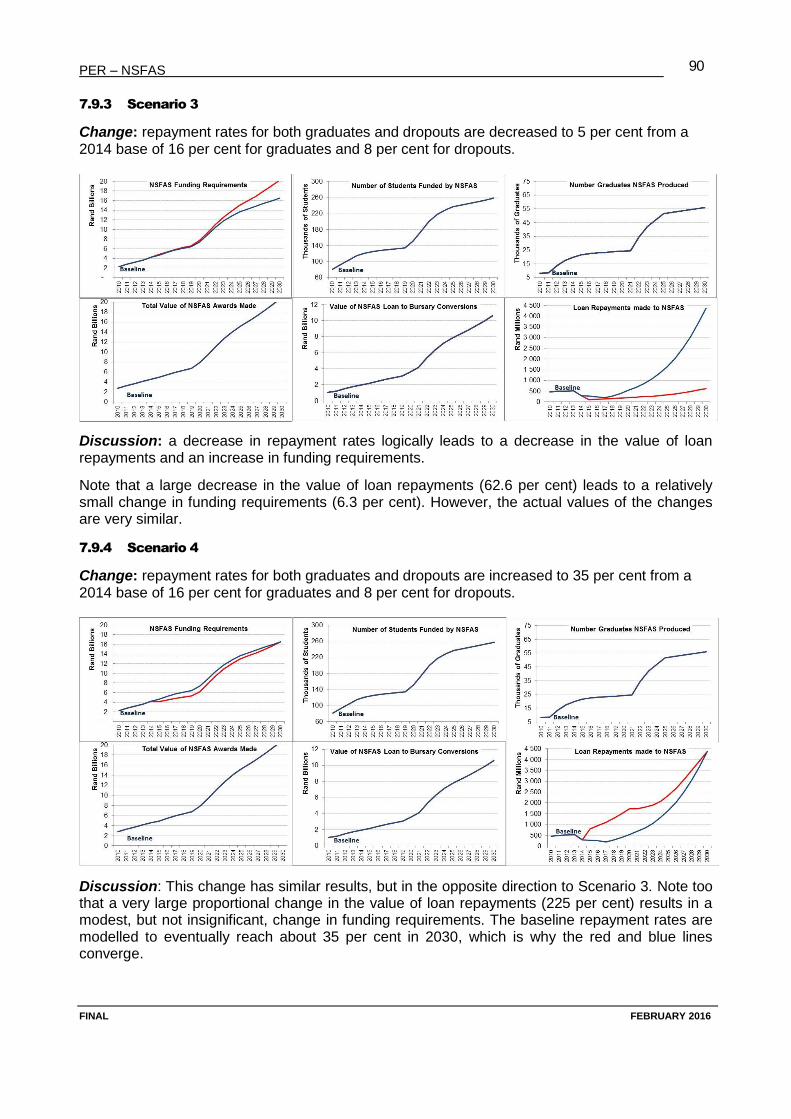
PER – NSFAS
FINAL FEBRUARY 2016
90
7.9.3 Scenario 3
Change: repayment rates for both graduates and dropouts are decreased to 5 per cent from a 2014 base of 16 per cent for graduates and 8 per cent for dropouts.
Discussion: a decrease in repayment rates logically leads to a decrease in the value of loan repayments and an increase in funding requirements.
Note that a large decrease in the value of loan repayments (62.6 per cent) leads to a relatively small change in funding requirements (6.3 per cent). However, the actual values of the changes are very similar.
7.9.4 Scenario 4
Change: repayment rates for both graduates and dropouts are increased to 35 per cent from a 2014 base of 16 per cent for graduates and 8 per cent for dropouts.
Discussion: This change has similar results, but in the opposite direction to Scenario 3. Note too that a very large proportional change in the value of loan repayments (225 per cent) results in a modest, but not insignificant, change in funding requirements. The baseline repayment rates are modelled to eventually reach about 35 per cent in 2030, which is why the red and blue lines converge.
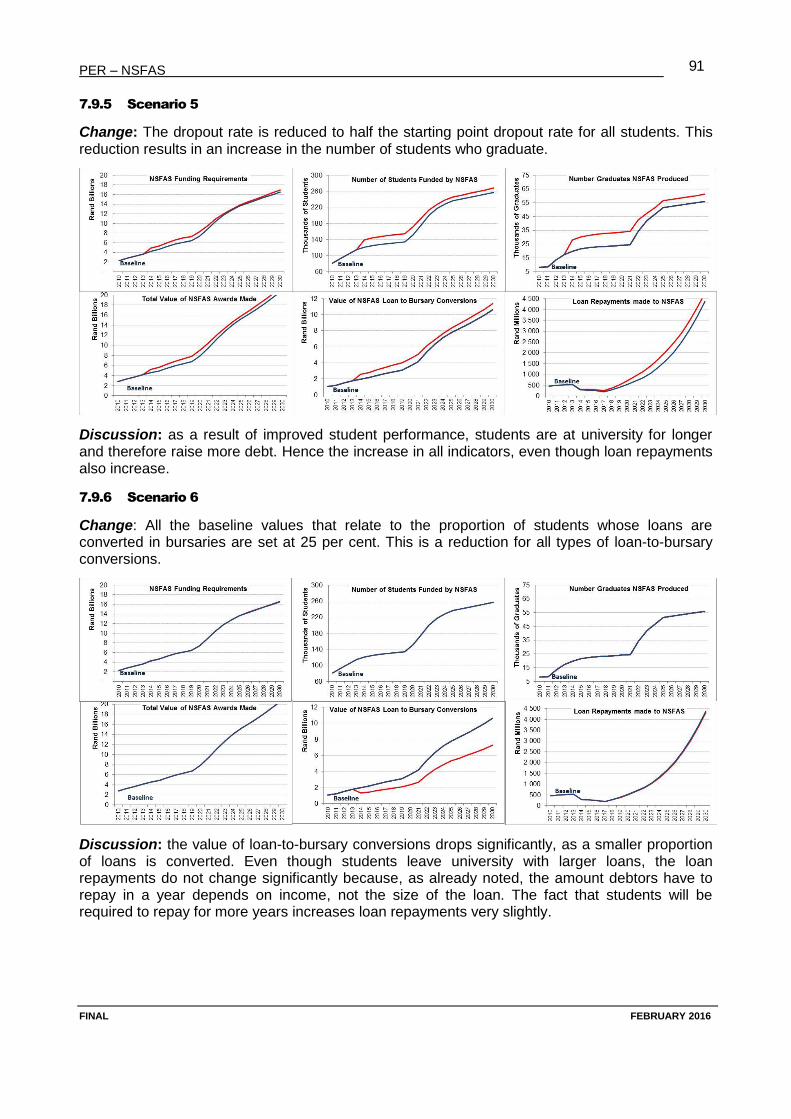
PER – NSFAS
FINAL FEBRUARY 2016
91
7.9.5 Scenario 5
Change: The dropout rate is reduced to half the starting point dropout rate for all students. This reduction results in an increase in the number of students who graduate.
Discussion: as a result of improved student performance, students are at university for longer and therefore raise more debt. Hence the increase in all indicators, even though loan repayments also increase.
7.9.6 Scenario 6
Change: All the baseline values that relate to the proportion of students whose loans are converted in bursaries are set at 25 per cent. This is a reduction for all types of loan-to-bursary conversions.
Discussion: the value of loan-to-bursary conversions drops significantly, as a smaller proportion of loans is converted. Even though students leave university with larger loans, the loan repayments do not change significantly because, as already noted, the amount debtors have to repay in a year depends on income, not the size of the loan. The fact that students will be required to repay for more years increases loan repayments very slightly.
PER – NSFAS
FINAL FEBRUARY 2016
92
7.10 Analysis of the DHET NSFAS loan scheme funding scenarios
At the Higher Education Summit held 15-17 October 2015, DHET released four scenarios on the funding of the NSFAS loan scheme over the period 2016/17 to 2018/19.96 This provides an ideal opportunity to compare DHET’s costing for the NSFAS loan scheme with results estimated using the NSFAS Loan Costing Model.
Note that both the DHET scenarios and the NSFAS Loan Costing Model use the National Enrolment Plan97 as the basis for the number of students enrolling at university over the period. This means that both estimates use the same information for one of the major cost drivers.
For each scenario, DHET states the amount of funding that will be required “over and above the MTEF baseline allocation and what could be re-injected through recoveries.” However, DHET does not state what the MTEF allocation is, or what can be re-injected through recoveries. So in its Education Summit document DHET does not indicate what the total cost of funding the NSFAS loan scheme over the period is. This is essential information for any comparison with the estimates produced by the NSFAS Loan Costing Model to be meaningful.
To fill this information gap, a request was sent to DHET who kindly provided the spreadsheet used to calculate the four scenarios. Using the information from this spreadsheet, Table 39 shows the total cost of funding the NSFAS loan scheme in DHETs four scenarios.
Table 39: DHET scenarios – estimated total cost of the NSFAS loan scheme
R billions
MTEF allocation +
recoveries
DHET estimated funding
gap
Total cost of funding the
NSFAS loan scheme
DHET Scenario 1 14.909 3.1 17.96
DHET Scenario 2 14.909 17.6 32.51
DHET Scenario 3 16.660 12.0 28.63
DHET Scenario 4 15.231 36.6 51.81
Note: In Scenario 3 the higher MTEF allocation and recoveries arises from a different increase being used to project the MTEF
forward, and in Scenario 4 a different level of repayments from the previous three scenarios was used.
The following table sets out DHET’s description of each of the scenarios, and indicates how the scenario was costed within the NSFAS Loan Costing Model.
96 DHET, 2015. “Annexure 3”, page 9-11. 97 DHET, 2014. Ministerial Statements on Student Enrolment Planning 2014/15 – 2019/20 for Universities.
PER – NSFAS
FINAL FEBRUARY 2016
93
Table 40: DHET scenarios and comparative scenarios in the NSFAS Loan Costing Model
DHET Scenario NSFAS Loan Costing Model
Scenario 1
Maintaining the family income qualifying threshold at R122 000. The proxy for this is the proportion of undergraduates enrolled with NSFAS loans – so no change made to this.
Continuing to fund the current proportion of 16% of the total undergraduate headcount enrolments.
In the model this is 16% in 2014.
Maintaining an average NSFAS award (estimated to be R40 827 in 2016/17) escalating at 9.8% over the period.
The baseline estimated average award in 2016/17 is R40 872. Only change was to increase the average annual growth from 5.2% to 9.8% over the period.
Scenario 2
Maintaining the family income qualifying threshold at R122 000. No change in model.
Continuing to fund the current proportion of 16% of the total undergraduate headcount enrolments.
No change to enrolment as this is 16% in 2014.
Providing an average FCS award (estimated to be R73 786 in 2016/17) escalating at 9.8% over the period.
Awards to all universities except UNISA were increased to R73 700 in 2016. UNISA award was increased to R15 870, which is 100% of the estimated FCS for UNISA in 2016. These allocations are grown at 9.8% over the period.
Scenario 3
Increasing the family income qualifying threshold to R217 000. This is captured by the increase in enrolments reflected below.
Providing support to 25.5% of the total undergraduate headcount enrolments.
Enrolment rates increased until enrolment in 2014 was 25.48% of undergraduate headcount.
Maintaining an average NSFAS 2014/15 award (estimated to be R40 827 in 2016/17) escalating at 9.8% over the period.
Same as for scenario 1.
Scenario 4
Increasing the family income qualifying threshold to R217 000. This is captured in the increased enrolment.
Providing support to 25.5% of the total undergraduate headcount enrolments.
Same as for scenario 3.
Providing an average full cost of study award (estimated to be R73 786 in 2016/17) escalating at 9.8% over the period.
Same as for scenario 2.
The following table shows the total cost of funding the NSFAS loan scheme as estimated by DHET and by the NSFAS Loan Costing Model.
Table 41: DHET scenarios compared to NSFAS Loan Costing Model estimates
R billions
Estimated
MTEF
allocation +
recoveries
DHET Scenarios NSFAS Loan Costing Model
Estimated NSFAS
Funding
Requirement Funding Gap
%
funding
gap
Estimated NSFAS
Funding
Requirement Funding Gap
%
funding
gap
Scenario 1 14.909 17.96 3.1 20% 18.20 3.3 22%
Scenario 2 14.909 32.51 17.6 118% 28.18 13.3 89%
Scenario 3 16.660 28.63 12.0 72% 29.02 12.4 74%
Scenario 4 15.231 51.81 36.6 240% 44.92 29.7 195%
The above table shows that the DHET estimates for scenarios 1 and 3 are slightly lower than the estimates produced by the NSFAS Loan Costing Model. By contrast, the DHET estimates in scenarios 2 and 4 are significantly higher than the Costing Model estimates, based on what appear to be the same parameters. This requires investigation and explanation, especially since both models are using the same university enrolment information.
With reference to Scenario 1, the following table provides an alternative approach to estimating
the future funding requirements of the NSFAS loan scheme, based on information taken from the
NSFAS Annual Report 2014/15.
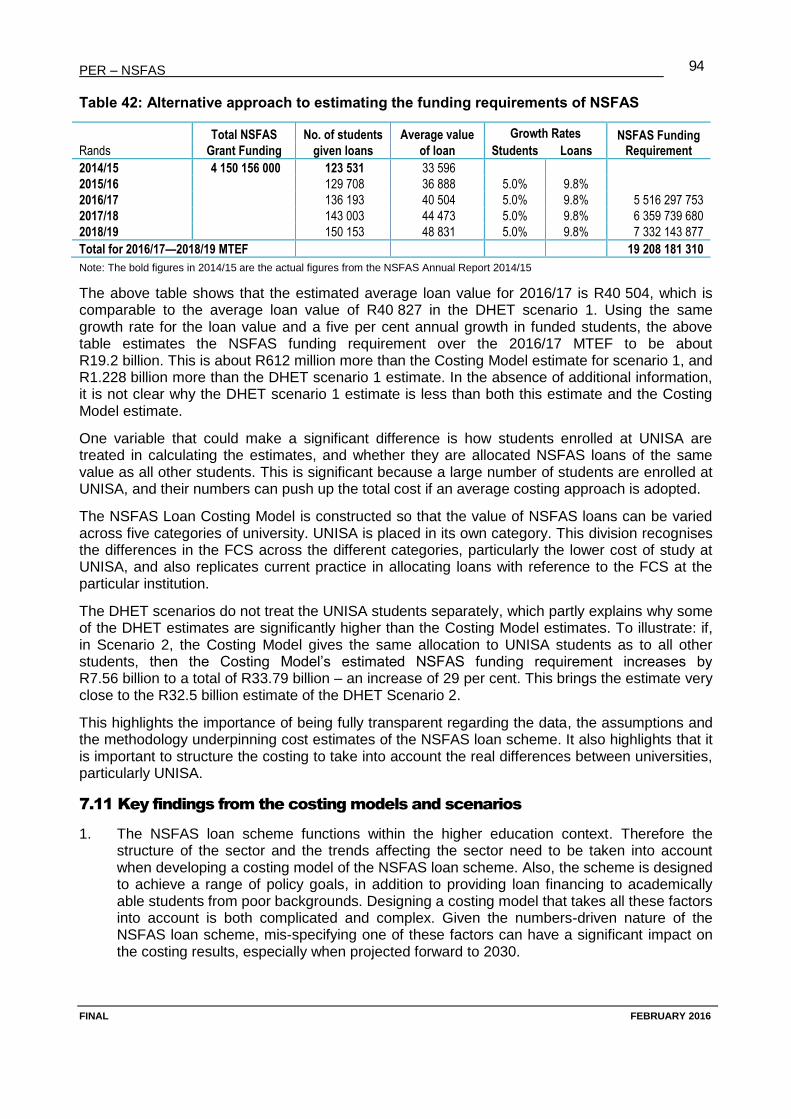
PER – NSFAS
FINAL FEBRUARY 2016
94
Table 42: Alternative approach to estimating the funding requirements of NSFAS
Rands
Total NSFAS
Grant Funding
No. of students
given loans
Average value
of loan
Growth Rates NSFAS Funding Requirement Students Loans
2014/15 4 150 156 000 123 531 33 596
2015/16 129 708 36 888 5.0% 9.8%
2016/17 136 193 40 504 5.0% 9.8% 5 516 297 753
2017/18 143 003 44 473 5.0% 9.8% 6 359 739 680
2018/19 150 153 48 831 5.0% 9.8% 7 332 143 877
Total for 2016/17—2018/19 MTEF 19 208 181 310
Note: The bold figures in 2014/15 are the actual figures from the NSFAS Annual Report 2014/15
The above table shows that the estimated average loan value for 2016/17 is R40 504, which is comparable to the average loan value of R40 827 in the DHET scenario 1. Using the same growth rate for the loan value and a five per cent annual growth in funded students, the above table estimates the NSFAS funding requirement over the 2016/17 MTEF to be about R19.2 billion. This is about R612 million more than the Costing Model estimate for scenario 1, and R1.228 billion more than the DHET scenario 1 estimate. In the absence of additional information, it is not clear why the DHET scenario 1 estimate is less than both this estimate and the Costing Model estimate.
One variable that could make a significant difference is how students enrolled at UNISA are treated in calculating the estimates, and whether they are allocated NSFAS loans of the same value as all other students. This is significant because a large number of students are enrolled at UNISA, and their numbers can push up the total cost if an average costing approach is adopted.
The NSFAS Loan Costing Model is constructed so that the value of NSFAS loans can be varied across five categories of university. UNISA is placed in its own category. This division recognises the differences in the FCS across the different categories, particularly the lower cost of study at UNISA, and also replicates current practice in allocating loans with reference to the FCS at the particular institution.
The DHET scenarios do not treat the UNISA students separately, which partly explains why some of the DHET estimates are significantly higher than the Costing Model estimates. To illustrate: if, in Scenario 2, the Costing Model gives the same allocation to UNISA students as to all other students, then the Costing Model’s estimated NSFAS funding requirement increases by R7.56 billion to a total of R33.79 billion – an increase of 29 per cent. This brings the estimate very close to the R32.5 billion estimate of the DHET Scenario 2.
This highlights the importance of being fully transparent regarding the data, the assumptions and the methodology underpinning cost estimates of the NSFAS loan scheme. It also highlights that it is important to structure the costing to take into account the real differences between universities, particularly UNISA.
7.11 Key findings from the costing models and scenarios
1. The NSFAS loan scheme functions within the higher education context. Therefore the structure of the sector and the trends affecting the sector need to be taken into account when developing a costing model of the NSFAS loan scheme. Also, the scheme is designed to achieve a range of policy goals, in addition to providing loan financing to academically able students from poor backgrounds. Designing a costing model that takes all these factors into account is both complicated and complex. Given the numbers-driven nature of the NSFAS loan scheme, mis-specifying one of these factors can have a significant impact on the costing results, especially when projected forward to 2030.

PER – NSFAS
FINAL FEBRUARY 2016
95
2. The NSFAS Loan Costing Model does not replicate the old model of managing NSFAS loans through the universities. Rather, it is forward-looking, and models how NSFAS will do business after the transition to the new model is complete. Therefore the cost estimates generated by the NSFAS Loan Costing Model should not be viewed as precise forecasts applicable to the old model.
3. The difference between the NSFAS Loan Costing Model and the old model is most noticeable in relation to the size of the average loan awarded and the number of loans awarded. The costing model adopts an “all for all” approach, in that the average award provided is proportional to the FCS at all universities, and the full average award is allocated to all eligible students within the target group as defined by various policy variables. Both the average award and the full funding of all eligible students are core cost drivers of the NSFAS loan scheme, and therefore modelling these variables based on an “all for all” approach differentiates the results of the costing model from the current actual results of the loan scheme as reported by NSFAS.
Key cost drivers in the NSFAS Loan Costing Model
4. There are six key cost drivers of the NSFAS loan scheme, namely:
the number of undergraduate students eligible to receive NSFAS loans;
the dropout and graduation rates, or throughput rate;
the average value of loans awarded, linked to the FCS;
the extent of the loan-to-bursary conversions;
the number of NSFAS debtors repaying their loans (or the loan repayment rate); and
the income table used to determine how much debtors should repay.
Policy choices in relation to these cost drivers impact significantly on the overall cost of the NSFAS loan scheme.
Cost estimates of the NDP Scenario
5. When the NSFAS Loan Costing Model is first opened, the variables are set up to reflect the NDP Scenario. This scenario represents our best estimate of a realistic path for moving the NSFAS loan scheme towards contributing meaningfully to the goals for higher education as set out in the NDP 2030, namely:
Increase the throughput rate for degree programmes to more than 75 per cent. The number of graduates will increase from the combined total of 167 469 for private and public higher education institutions to 425 000 by 2030.98
6. Based on the NDP Scenario, the main cost estimates for the NSFAS loan scheme are:
a. The total number of students allocated loans increases from 130 211 in 2015 to 261 842 in 2030. This sees the percentage of the total number of students enrolled at university receiving NSFAS loans increase from 15.4 per cent in 2015 to 25 per cent in 2030.
b. The average value of loans increases from R44 811 in 2015 to R81 554 in 2030. This is based on 80 per cent of the weighted average FCS by category of university in 2014, inflated at a rate of 4.3 per cent per year. Although the growth in the FCS has been around 9.8 per cent in the past, it is anticipated that an important consequence of the #FeesMustFall campaign will be a more moderate growth in the FCS.
98 National Development Plan 2030, page 319.

PER – NSFAS
FINAL FEBRUARY 2016
96
c. The estimated total value of NSFAS loans disbursed increases from R5.4 billion in 2015 to R21.4 billion in 2030.
d. If it is assumed that NSFAS’s ability to collect debt will gradually improve over the period, then the costing model estimates that repayments/recoveries will grow from R248 million in 2015 to R4.4 billion in 2030. This represents 20 per cent of the total value of NSFAS loans made in 2030.
e. If NSFAS achieves these debt collection targets, then the annual government grant required to fund the NSFAS loan scheme will increase from R5.6 billion in 2015 to R16.9 billion in 2030. In addition, the funding requirement for the TVET grants will grow from R2.6 billion in 2015 to R8.8 billion in 2030.
f. Government will need to cover the operating expense of the NSFAS entity, which will require an additional annual “administration” grant that grows from R131 million in 2015 to R329 million in 2030.
g. Maintaining the current arrangements for loan-to-bursary conversions, it is estimated that these will reduce the value of loans held by students by R2.6 billion (or 45 per cent) in 2015, increasing to R10.7 billion (or 50 per cent) in 2030. The percentage increase is linked to academic results improving over the period.
Throughput estimates of the NDP Scenario
7. The NDP Scenario is calibrated to model the achievement of the NDP target of a throughput rate of 75 per cent in 2030. This requires a very substantial improvement in the performance of universities in retaining students and getting them to graduate, given that the throughput rate in 2015 is estimated to be around 50 per cent according to the PER cohort study.
8. The number of graduates funded by NSFAS loans increases from 21 903 in 2014 to 54 497 in 2030 – an increase of 149 per cent. This increase is in line with the NDP target of a 159 per cent increase in the total number of graduates produced between 2014 and 2030 – from 167 469 to 425 000 graduates.
9. Average cost of loans to produce one graduate is calculated by dividing the total loans allocated to a cohort by the number of graduates produced by that cohort. In 2015, the average cost of loans to produce one graduate was R266 895. This increases to R319 234 in 2019 and then, with the improvement in dropout/graduate rates, declines from 2020 onwards to reach a low of R190 501 in 2030. This is a key measure of the efficiency of the university system, and highlights the importance of improving throughput rates.
Exploring the impact of three key NSFAS variables
10. If NSFAS loan repayment rates approaching say 90 per cent can be realised through proper management of the NSFAS debt book, then in 2030 repayments would cover slightly more than 50 per cent of the total value of NSFAS loans made in that year (R21.35 billion), and the cost of the NSFAS loan scheme to the fiscus would be reduced by about 40 per cent compared to the NDP baseline scenario. In other words, strong improvements in the rate of repayment of NSFAS loans would greatly improve the fiscal sustainability of the NSFAS loan scheme.
11. Reducing the generosity of the loan-to-bursary conversion arrangements and the final year programme will increase the value of the NSFAS debt book, which means that there will be more debt available to be collected. However, because NSFAS loan repayments are fixed according to the income of debtors – and not according to the amount of debt held – repayments increase only marginally.
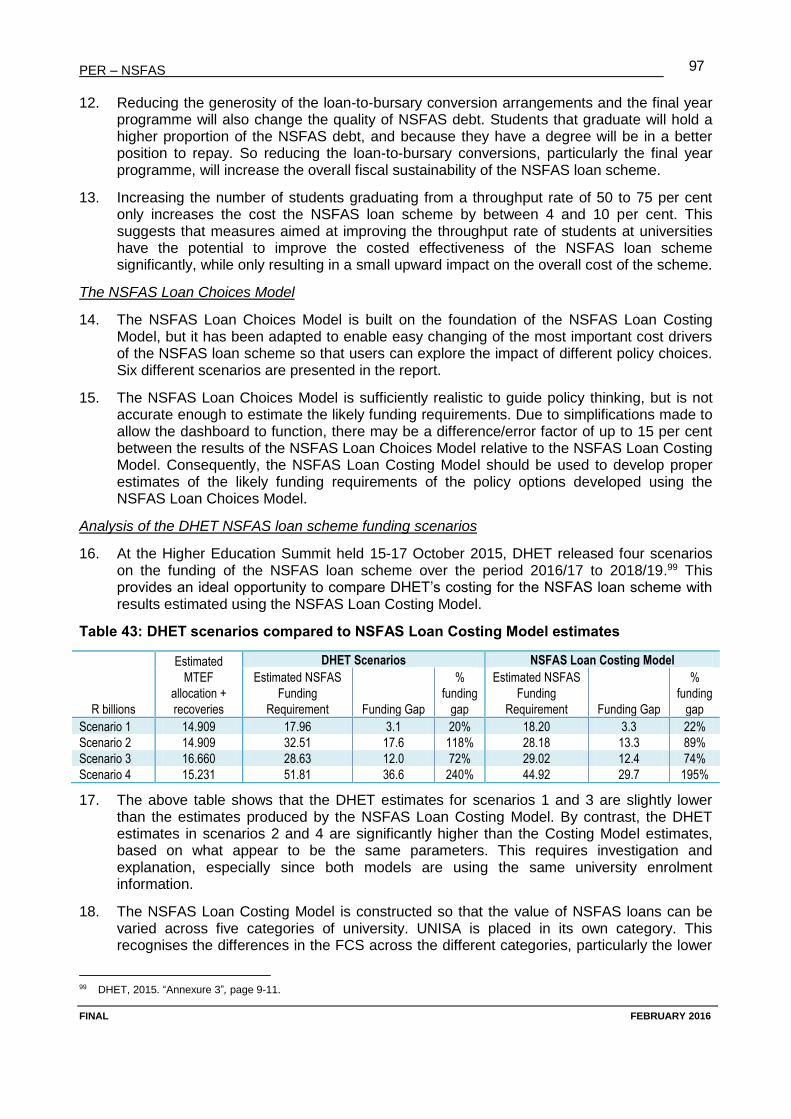
PER – NSFAS
FINAL FEBRUARY 2016
97
12. Reducing the generosity of the loan-to-bursary conversion arrangements and the final year programme will also change the quality of NSFAS debt. Students that graduate will hold a higher proportion of the NSFAS debt, and because they have a degree will be in a better position to repay. So reducing the loan-to-bursary conversions, particularly the final year programme, will increase the overall fiscal sustainability of the NSFAS loan scheme.
13. Increasing the number of students graduating from a throughput rate of 50 to 75 per cent only increases the cost the NSFAS loan scheme by between 4 and 10 per cent. This suggests that measures aimed at improving the throughput rate of students at universities have the potential to improve the costed effectiveness of the NSFAS loan scheme significantly, while only resulting in a small upward impact on the overall cost of the scheme.
The NSFAS Loan Choices Model
14. The NSFAS Loan Choices Model is built on the foundation of the NSFAS Loan Costing Model, but it has been adapted to enable easy changing of the most important cost drivers of the NSFAS loan scheme so that users can explore the impact of different policy choices. Six different scenarios are presented in the report.
15. The NSFAS Loan Choices Model is sufficiently realistic to guide policy thinking, but is not accurate enough to estimate the likely funding requirements. Due to simplifications made to allow the dashboard to function, there may be a difference/error factor of up to 15 per cent between the results of the NSFAS Loan Choices Model relative to the NSFAS Loan Costing Model. Consequently, the NSFAS Loan Costing Model should be used to develop proper estimates of the likely funding requirements of the policy options developed using the NSFAS Loan Choices Model.
Analysis of the DHET NSFAS loan scheme funding scenarios
16. At the Higher Education Summit held 15-17 October 2015, DHET released four scenarios on the funding of the NSFAS loan scheme over the period 2016/17 to 2018/19.99 This provides an ideal opportunity to compare DHET’s costing for the NSFAS loan scheme with results estimated using the NSFAS Loan Costing Model.
Table 43: DHET scenarios compared to NSFAS Loan Costing Model estimates
R billions
Estimated
MTEF
allocation +
recoveries
DHET Scenarios NSFAS Loan Costing Model
Estimated NSFAS
Funding
Requirement Funding Gap
%
funding
gap
Estimated NSFAS
Funding
Requirement Funding Gap
%
funding
gap
Scenario 1 14.909 17.96 3.1 20% 18.20 3.3 22%
Scenario 2 14.909 32.51 17.6 118% 28.18 13.3 89%
Scenario 3 16.660 28.63 12.0 72% 29.02 12.4 74%
Scenario 4 15.231 51.81 36.6 240% 44.92 29.7 195%
17. The above table shows that the DHET estimates for scenarios 1 and 3 are slightly lower than the estimates produced by the NSFAS Loan Costing Model. By contrast, the DHET estimates in scenarios 2 and 4 are significantly higher than the Costing Model estimates, based on what appear to be the same parameters. This requires investigation and explanation, especially since both models are using the same university enrolment information.
18. The NSFAS Loan Costing Model is constructed so that the value of NSFAS loans can be varied across five categories of university. UNISA is placed in its own category. This recognises the differences in the FCS across the different categories, particularly the lower
99 DHET, 2015. “Annexure 3”, page 9-11.
PER – NSFAS
FINAL FEBRUARY 2016
98
cost of study at UNISA, and also replicates current practice in allocating loans with reference to the FCS at the particular institution.
19. The DHET scenarios do not treat the UNISA students separately, which partly explains why the DHET estimates in scenarios 2 and 4 are significantly higher.
20. This analysis highlights the importance of being fully transparent regarding the data, the assumptions and the methodology underpinning cost estimates of the NSFAS loan scheme. It also highlights that it is important to structure the costing to take into account the real differences between universities, particularly UNISA.
8. Conclusions
It needs to be recognised that the primary purpose of the NSFAS loan scheme is to expand equitable access to higher education to academically able students from poor backgrounds by removing or minimising the “obstacle effect” that tuition, accommodation and other costs of higher education pose. In addition, the NSFAS loans, grants and bursaries are designed to achieve various other policy objectives:
Recycle funding by requiring students to repay their NSFAS loans once they get employment and earn above a specified income threshold;
Incentivise students to pass – through the loan-to-bursary conversions;
Incentivise students to complete their degrees – the final year loan-to-bursary conversion;
Subsidise priority fields of study, prioritising the allocation of loans to students studying priority courses (e.g. teachers); and
Target specific categories of students, such as those with disabilities;
The challenge is to ensure that all these different policy objectives are promoted in a balanced way, with an emphasis on the link between the recycling of funds and expanding access to higher education.
The importance of recycling funding
For a range of reasons, NSFAS’s debt management capabilities are poor, and have been further undermined by various decisions limiting NSFAS’s scope to use normal tools for managing debt. This has led to a collapse in NSFAS debt recoveries, which cost NSFAS (and government) an estimated R3.7 billion between 2010 and 2014. This loss in recoveries revenue has meant that NSFAS was unable to fund about 117 500 students during the same period.
Given the design of the NSFAS loan scheme, it will always be dependent on government grants to remain viable and expand. However, loan repayments are an important potential source of funding that could realistically provide 35 per cent of the required funding, based on past experience. In fact, if NSFAS loan repayment rates approaching say 90 per cent can be realised through proper management of the NSFAS debt book, then in 2030 repayments would cover slightly more than 50 per cent of the total value of NSFAS loans made in that year (R21.35 billion), and the cost of the NSFAS loan scheme to the fiscus would be reduced by about 40 per cent compared to the NDP baseline scenario.
Measures need to be taken to ensure NSFAS has the necessary procedures in place to:
a. maintain communication with debtors and take appropriate actions to prevent debt prescribing;
PER – NSFAS
FINAL FEBRUARY 2016
99
b. update employer details so that debtors who gain employment can be required to start making payments; and
c. use the normal tools available (i.e. blacklisting and emolument attachment orders) for proper debt management fairly and within the bounds of the law.
The importance of improving throughput rates
NSFAS is funding a subset of the student population whose characteristics differ from the aggregate student population in terms of economic background, schooling, race, gender and choice of university. Cohort studies focussing only on NSFAS-funded students studying 3- and 4-year degrees show that they have a dropout rate that is almost double the dropout rate recorded for all students. Also, the NSFAS-funded student’s graduation rate within regulation time is less than half that for all students. These are concerning findings, because they suggest that there is a very significant performance gap between NSFAS-funded students and non-NSFAS-funded students.
They are also concerning because they are at odds with the information on “percentage courses passed” that NSFAS publishes in its annual reports. NSFAS reported that in 2011, students passed 74.7 per cent of their courses. This very impressive pass rate suggests that the graduation rates of NSAFS students should be around 75 per cent. However, the cohort studies indicate graduation rates of around 35 per cent. This issue requires further analysis.
Whatever the outcome of such analysis, the dropout and graduation rates for NSFAS are worse than for other bursary schemes that target students from poor backgrounds. This can probably be attributed to the scale at which NSFAS operates; meaning it does not and cannot “cherry pick” the applicants who are most likely to succeed. However, there may be areas in the NSFAS scheme that, if addressed, could enhance performance:
ensuring students are adequately funded by eliminating the practice of top-slicing and ensuring NSFAS loans, grants and bursaries are properly aligned to the FCS;
giving more attention to assessing students’ probability of success in academic studies, as required by the NSFAS Act;
improving personal interaction at the application stage by ensuring that all higher education institutions have the capacity to provide career counselling and guidance in support of the NSFAS process;
improving follow-up for NSFAS-funded students – providing them with encouragement, advice and psycho-social support. Again, this is a role that the higher education institutions need to take up more proactively. However, NSFAS should explore how it can support such activities, e.g. through a student help-line or a referral process.
The NDP Scenario run in the NSFAS Loan Costing Model shows that, if throughput rates improve from 50 per cent in 2015 to 75 per cent in 2030, the nominal average cost of loans to produce one graduate will decrease from R266 926 in 2015 to R190 525 in 2030. This is a key measure of the efficiency of the university system, and highlights the importance of improving throughput rates.
The importance of ring-fencing the accounts of NSFAS.
It is important to distinguish between the “administration” of NSFAS the entity and each of the three main streams of student funding that NSFAS the entity manages. This distinction is not made in the AFSs of NSFAS. Instead, a single set of statements report on all aspects of NSFAS operations, conflating the financial information relating to administration, loans, grants and bursaries. This makes it difficult to analyse the efficiency and effectiveness of NSFAS the entity, the performance of the NSFAS loan scheme, and the extent to which grants and bursaries are being disbursed as intended.
PER – NSFAS
FINAL FEBRUARY 2016
100
Ideally, the operations of NSFAS the entity should be ring-fenced, as should the finances of the NSFAS loans, TVET grants and other bursaries, and each should be reported separately. Doing so would:
make it easier to assess whether the NSFAS entity is being efficient and effective in its administration, and give assurance that it is not using funds designated for loans, grants and bursaries to fund its operations.
provide a better understanding of the actual position of the NSFAS loan scheme – which is an inherently complicated exercise.
give assurance that the funds allocated for specific grants and bursaries are being allocated accordingly.
The importance of rigorous costing of NSFAS’s funding requirements
The NSFAS Loan Costing Model enables different policy scenarios to be modelled transparently. Using the NDP Scenario, it is estimated that the total value of NSFAS loans disbursed will increase from R5.8 billion in 2015 to R21.4 billion in 2030.
If it is assumed that NSFAS’s ability to collect debt will gradually improve through to 2030, then the costing model estimates that repayments/recoveries will grow from R248 million in 2014 to R4.3 billion in 2030. This represents 20 per cent of the total value of NSFAS loans made in 2030. If NSFAS achieves these debt collection targets, then the annual government grant required to fund the NSFAS loan scheme will increase from R5.6 billion in 2015 to R17.0 billion in 2030.
However, these costing results depend directly on the set of assumptions that underpin them.
A comparison with a set of DHET scenarios of the NSFAS funding gap for the 2016/17 MTEF shows that the DHET estimates are significantly higher than the NSFAS Loan Costing Model estimates, based on what appear to be the same parameters. However, the DHET scenarios do not treat the UNISA students separately, which partly explains why the DHET are significantly higher. This highlights the importance of being fully transparent regarding the data, the assumptions and the methodology underpinning cost estimates of the NSFAS loan scheme.
PER – NSFAS
FINAL FEBRUARY 2016
101
Annexure A – NSFAS student cohort analysis
In the course of the PER, Cornerstone performed a cohort analysis on NSFAS-funded students. The analysis was applied to students entering university for the first time in 2006 and 2007, and provided a basis for estimating student throughput in the costing model. It also feeds into estimates of the number of bursaries awarded to students at university. The approach taken for the purposes of this PER are discussed next.
In May 2013 Professors De Villiers and Van Der Berg, and Dr Van Wyk from the University of Stellenbosch published a cohort analysis of students entering NSFAS in the period 2000 to 2004. Their approach is briefly described further below.
Approach to data analysis used for this PER
Cohort analyses for the 2006 and 2007 NSFAS-funded first-time entering enrolled students for the 3-year National Diplomas, 3-year B degrees, 4-year degrees and BTech qualifications were done for the period 2006 to 2013.
Individual student records for all students for all the years from 2006 to 2013 were obtained from the audited datasets of the Higher Education Management Information System (HEMIS), maintained by the Department of Higher Education and Training (DHET).
The data for the analysis was extracted from the student and qualification files. In the HEMIS data, the entrance category variable gives an indication as to whether a student was a first-time entering student or had previously been registered at a university.
Once identified as a first-time entering student, the study records of the student for all years of analysis were linked to determine whether the student had completed and graduated, or dropped out. If a student dropped out but returned to continue his/her studies, the student was not considered a dropout anymore, and was discounted against the dropout rates. NSFAS-funded students were identified from datasets provided by NSFAS that could be linked to the individual HEMIS unit records.
For the purposes of this study, throughput/completion rates are defined as the percentage of students that graduated within the period of analysis. Dropout rates are the percentage of students that did not graduate within the period of analysis, including students who discontinued their studies. Since each cohort was analysed until the year 2013, dropouts were defined as students who had not graduated by 2013. Those who were still registered in 2013, but did not graduate, were counted as dropouts since the 2014 data were not available at the time of the analysis to determine how many reregistered in 2014.
To calculate throughput/completion rates, one needs to look at data from several years, select a cohort of new entrants of a reasonable size, and follow their graduation trends over a number of years. In essence, throughput/completion rates give an indication as to how successful the universities were in graduating new entrants into the qualification in a particular year (cohort) over the period of analysis. It also provides information on dropouts: students who do not reregister after dropping out for the period of analysis, and who thus do not obtain the qualification.
The data contains a record for each year of registration for each student. A student’s enrolment and graduation history therefore had to be constructed from several enrolment records for each student. Each student record contains at least one, or at the most four, Classification of Education Subject Material (CESM) code/s. HEMIS data element 81 – Institution Programme Name – is a very valuable data field which, together with the CESM categories, assisted with the classification of students into a field of study.
PER – NSFAS
FINAL FEBRUARY 2016
102
The CESM code was used to classify the student enrolment into the major fields of study. The CESM category for first area of specialization was used to classify the student record into the major field of study. The major field of study was classified for each qualification type that the student was enrolled for separately, due to the fact that the student does not necessarily continue further studies in the same field of study. Due to the fact that students change their fields of study often for the same qualification type, the field of study of the last enrolment of the student for the particular qualification type was used for the classification of the major field of study. Where the CESM category for first area of specialisation was not completed, the CESM category for the second area of specialisation was used for the classification of the major field of study. The second and third order CESMs were trimmed to first order CESM categories. The CESM categories changed in 2010.
University of Stellenbosch’s Approach to Data Analysis
In the analysis performed by the University of Stellenbosch, the following data was provided (see page 15):
Various data from the NSFAS from their Loan Management System
HEMIS tables from 2000 to 2009
Data from SARS
The NSFAS datasets on their own are not comprehensive enough to conduct a cohort analysis of the students who received an award. There is also not one file in the NSFAS database containing all the relevant information to profile award recipients. Therefore the relevant information has to be extracted from different files before it is compiled into a single master file. In the same vein, the HEMIS datasets are stored separately per year, and should be integrated through a unique identifier to create a longitudinal student unit-record information system. Such a system facilitates the process to track the movement of students throughout the higher education system.
Salient characteristics of these data sources include the following:
Unique identifier
In all these databases, the identity number is a core data element and makes it possible to link these datasets and analyse institutional longitudinal data. A unique student identifier (identity number) is used to link all these datasets, and makes it possible to follow a student‘s Progress through the system using this identifier in longitudinal data (data gathered on the same student from year to year).
Key data elements
Core Data Elements in the longitudinal student unit-record HEMIS and NSFAS datasets, such as the entrance category, requirements, CESM codes and qualification codes, enable a more detailed analysis that is not possible with aggregated data. This requires experience with linking databases, and is a challenging exercise because a set of linked databases can eventually contain more than 20 million records.
In the combined dataset, students’ identity numbers were used as a unique identity to link the different data sources.
[On pages 19-21, a detailed step by step of the data analysis methodology is explained]. The basic principle of this method is that one can determine the flow of an entrance cohort of students using the HEMIS longitudinal dataset, and calculate the eventual outcomes at the end of the cycle.
Four basic transition rates are necessary to determine the flow through of a cohort of students through a cycle, namely the rates of those:
PER – NSFAS
FINAL FEBRUARY 2016
103
progressing through the system (progression rate)
exiting the system without any qualification (dropping out)
re-entering the system (after previously dropped out )
receiving a qualification (certificate, diploma or degree)
Students progressing through the system
The progression rate is calculated by comparing the master list of the specific cohort with the HEMIS longitudinal student unit-records to determine how many students are progressing (remain in the system) from year-to-year as indicated in Figure 4 of the US cohort study. The HEMIS datasets are used because it is the official student unit-record system.
Students exiting the system without any qualification
Those who exited without any success can be determined by using enrolment from year one minus enrolment (progression) from year two and subtracting all those who graduated at the end of year one. However, these students can re-enter the system in the future, with a different study field or at another institution. In the discussion of the analysis, these students will be referred to as dropouts, meaning that they left the system without any qualifications.
Students receiving a first qualification
The students who obtained a first qualification are calculated by using the requirement qualification field in the HEMIS dataset and comparing it with the HEMIS longitudinal student unit-records for each student. A student is counted only once, irrespective of how many qualifications are obtained over time. In the discussion of the analysis, these students will be referred to as those who qualified, meaning that they received at least one qualification. With this cohort analysis method, one can thus determine exactly how many students of a specific cohort dropped out without any qualification, how many graduated, and how many are still in the system who have not received any qualifications.
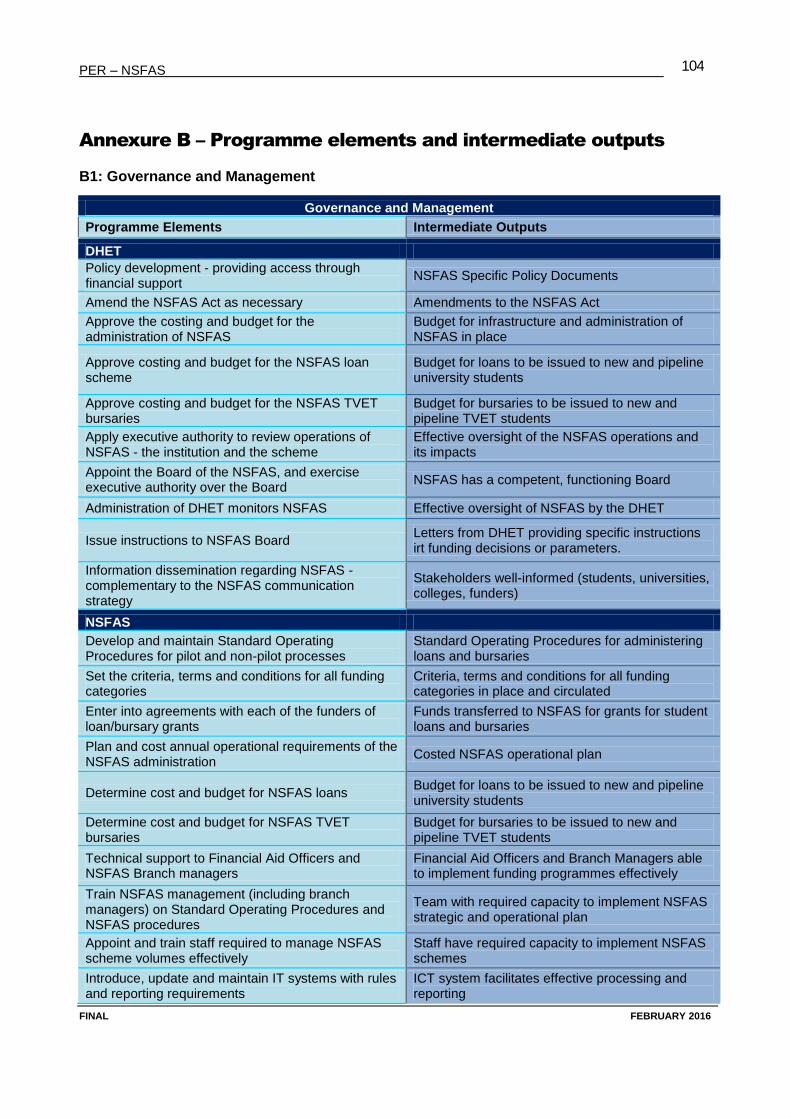
PER – NSFAS
FINAL FEBRUARY 2016
104
Annexure B – Programme elements and intermediate outputs
B1: Governance and Management
Governance and Management
Programme Elements Intermediate Outputs
DHET
Policy development - providing access through financial support
NSFAS Specific Policy Documents
Amend the NSFAS Act as necessary Amendments to the NSFAS Act
Approve the costing and budget for the administration of NSFAS
Budget for infrastructure and administration of NSFAS in place
Approve costing and budget for the NSFAS loan scheme
Budget for loans to be issued to new and pipeline university students
Approve costing and budget for the NSFAS TVET bursaries
Budget for bursaries to be issued to new and pipeline TVET students
Apply executive authority to review operations of NSFAS - the institution and the scheme
Effective oversight of the NSFAS operations and its impacts
Appoint the Board of the NSFAS, and exercise executive authority over the Board
NSFAS has a competent, functioning Board
Administration of DHET monitors NSFAS Effective oversight of NSFAS by the DHET
Issue instructions to NSFAS Board Letters from DHET providing specific instructions irt funding decisions or parameters.
Information dissemination regarding NSFAS - complementary to the NSFAS communication strategy
Stakeholders well-informed (students, universities, colleges, funders)
NSFAS
Develop and maintain Standard Operating Procedures for pilot and non-pilot processes
Standard Operating Procedures for administering loans and bursaries
Set the criteria, terms and conditions for all funding categories
Criteria, terms and conditions for all funding categories in place and circulated
Enter into agreements with each of the funders of loan/bursary grants
Funds transferred to NSFAS for grants for student loans and bursaries
Plan and cost annual operational requirements of the NSFAS administration
Costed NSFAS operational plan
Determine cost and budget for NSFAS loans Budget for loans to be issued to new and pipeline university students
Determine cost and budget for NSFAS TVET bursaries
Budget for bursaries to be issued to new and pipeline TVET students
Technical support to Financial Aid Officers and NSFAS Branch managers
Financial Aid Officers and Branch Managers able to implement funding programmes effectively
Train NSFAS management (including branch managers) on Standard Operating Procedures and NSFAS procedures
Team with required capacity to implement NSFAS strategic and operational plan
Appoint and train staff required to manage NSFAS scheme volumes effectively
Staff have required capacity to implement NSFAS schemes
Introduce, update and maintain IT systems with rules and reporting requirements
ICT system facilitates effective processing and reporting
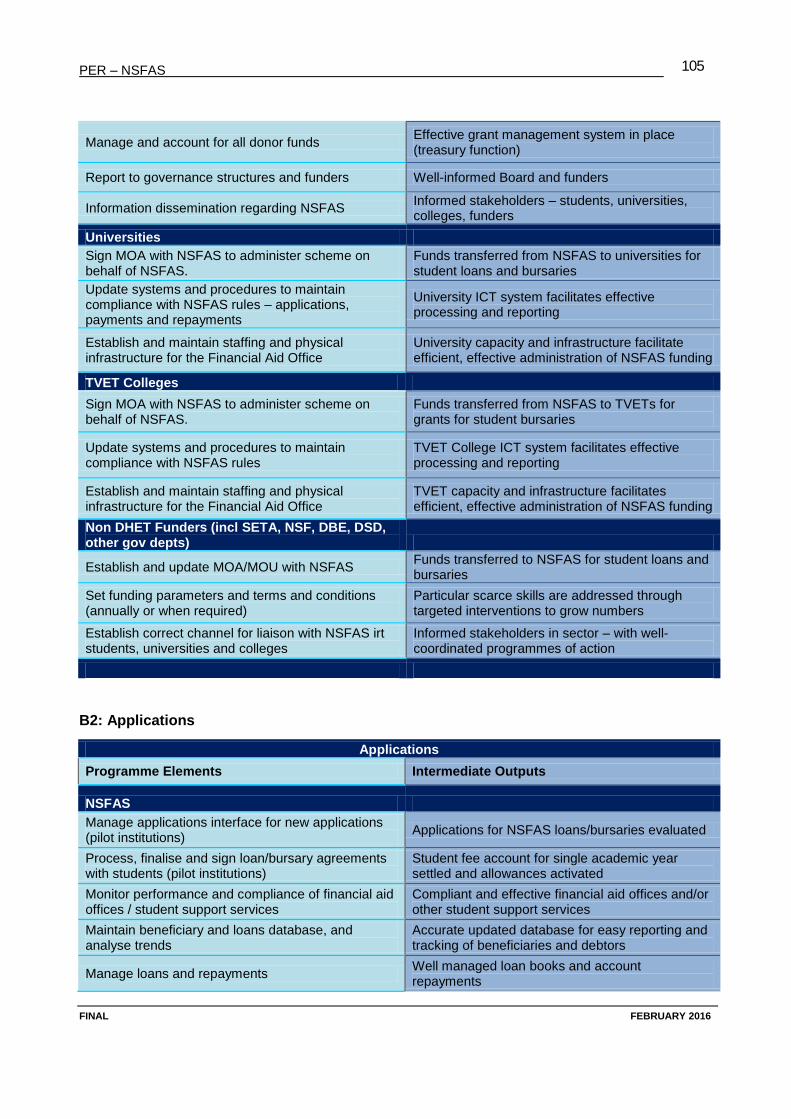
PER – NSFAS
FINAL FEBRUARY 2016
105
Manage and account for all donor funds Effective grant management system in place (treasury function)
Report to governance structures and funders Well-informed Board and funders
Information dissemination regarding NSFAS Informed stakeholders – students, universities, colleges, funders
Universities
Sign MOA with NSFAS to administer scheme on behalf of NSFAS.
Funds transferred from NSFAS to universities for student loans and bursaries
Update systems and procedures to maintain compliance with NSFAS rules – applications, payments and repayments
University ICT system facilitates effective processing and reporting
Establish and maintain staffing and physical infrastructure for the Financial Aid Office
University capacity and infrastructure facilitate efficient, effective administration of NSFAS funding
TVET Colleges
Sign MOA with NSFAS to administer scheme on behalf of NSFAS.
Funds transferred from NSFAS to TVETs for grants for student bursaries
Update systems and procedures to maintain compliance with NSFAS rules
TVET College ICT system facilitates effective processing and reporting
Establish and maintain staffing and physical infrastructure for the Financial Aid Office
TVET capacity and infrastructure facilitates efficient, effective administration of NSFAS funding
Non DHET Funders (incl SETA, NSF, DBE, DSD, other gov depts)
Establish and update MOA/MOU with NSFAS Funds transferred to NSFAS for student loans and bursaries
Set funding parameters and terms and conditions (annually or when required)
Particular scarce skills are addressed through targeted interventions to grow numbers
Establish correct channel for liaison with NSFAS irt students, universities and colleges
Informed stakeholders in sector – with well-coordinated programmes of action
B2: Applications
Applications
Programme Elements Intermediate Outputs
NSFAS
Manage applications interface for new applications (pilot institutions)
Applications for NSFAS loans/bursaries evaluated
Process, finalise and sign loan/bursary agreements with students (pilot institutions)
Student fee account for single academic year settled and allowances activated
Monitor performance and compliance of financial aid offices / student support services
Compliant and effective financial aid offices and/or other student support services
Maintain beneficiary and loans database, and analyse trends
Accurate updated database for easy reporting and tracking of beneficiaries and debtors
Manage loans and repayments Well managed loan books and account repayments
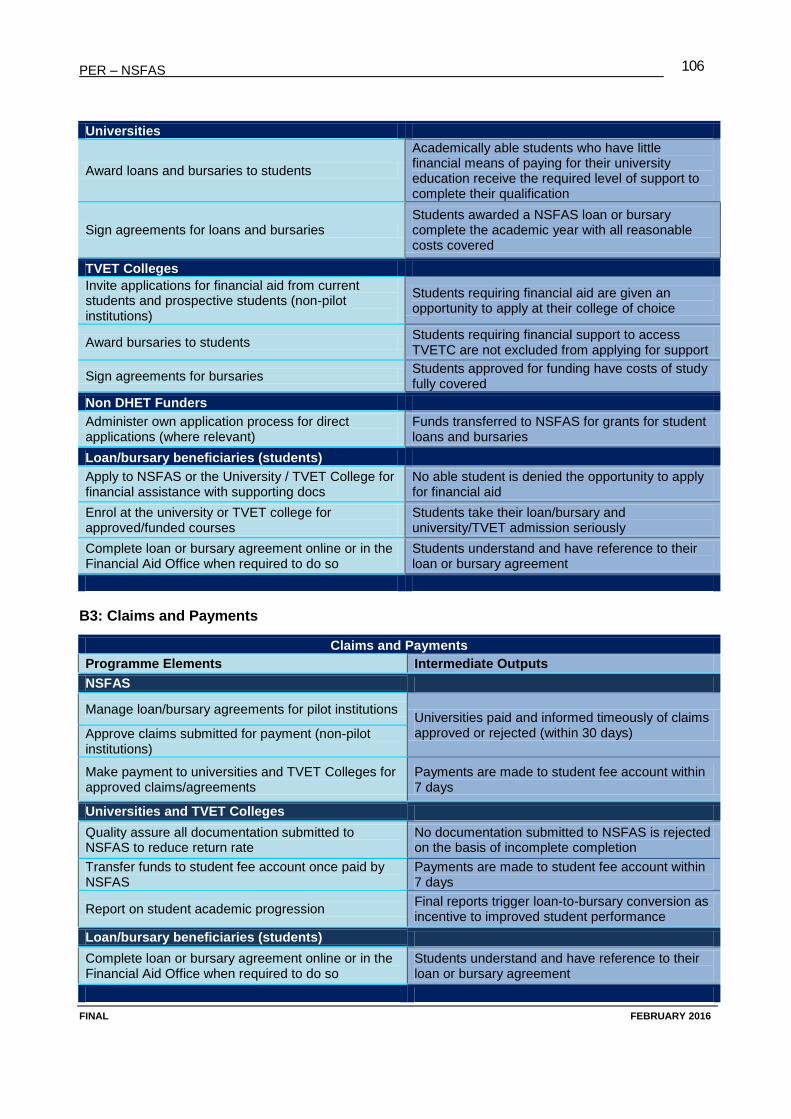
PER – NSFAS
FINAL FEBRUARY 2016
106
Universities
Award loans and bursaries to students
Academically able students who have little financial means of paying for their university education receive the required level of support to complete their qualification
Sign agreements for loans and bursaries Students awarded a NSFAS loan or bursary complete the academic year with all reasonable costs covered
TVET Colleges
Invite applications for financial aid from current students and prospective students (non-pilot institutions)
Students requiring financial aid are given an opportunity to apply at their college of choice
Award bursaries to students Students requiring financial support to access TVETC are not excluded from applying for support
Sign agreements for bursaries Students approved for funding have costs of study fully covered
Non DHET Funders
Administer own application process for direct applications (where relevant)
Funds transferred to NSFAS for grants for student loans and bursaries
Loan/bursary beneficiaries (students)
Apply to NSFAS or the University / TVET College for financial assistance with supporting docs
No able student is denied the opportunity to apply for financial aid
Enrol at the university or TVET college for approved/funded courses
Students take their loan/bursary and university/TVET admission seriously
Complete loan or bursary agreement online or in the Financial Aid Office when required to do so
Students understand and have reference to their loan or bursary agreement
B3: Claims and Payments
Claims and Payments
Programme Elements Intermediate Outputs
NSFAS
Manage loan/bursary agreements for pilot institutions Universities paid and informed timeously of claims approved or rejected (within 30 days) Approve claims submitted for payment (non-pilot
institutions)
Make payment to universities and TVET Colleges for approved claims/agreements
Payments are made to student fee account within 7 days
Universities and TVET Colleges
Quality assure all documentation submitted to NSFAS to reduce return rate
No documentation submitted to NSFAS is rejected on the basis of incomplete completion
Transfer funds to student fee account once paid by NSFAS
Payments are made to student fee account within 7 days
Report on student academic progression Final reports trigger loan-to-bursary conversion as incentive to improved student performance
Loan/bursary beneficiaries (students)
Complete loan or bursary agreement online or in the Financial Aid Office when required to do so
Students understand and have reference to their loan or bursary agreement
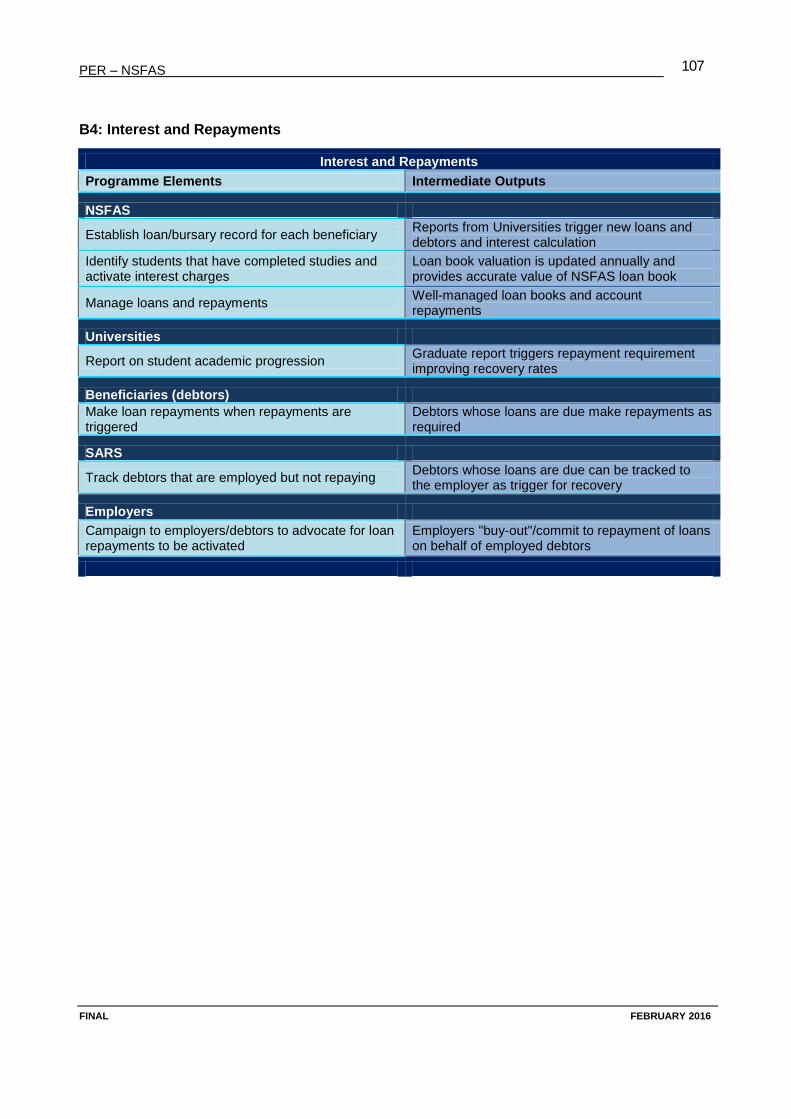
PER – NSFAS
FINAL FEBRUARY 2016
107
B4: Interest and Repayments
Interest and Repayments
Programme Elements Intermediate Outputs
NSFAS
Establish loan/bursary record for each beneficiary Reports from Universities trigger new loans and debtors and interest calculation
Identify students that have completed studies and activate interest charges
Loan book valuation is updated annually and provides accurate value of NSFAS loan book
Manage loans and repayments Well-managed loan books and account repayments
Universities
Report on student academic progression Graduate report triggers repayment requirement improving recovery rates
Beneficiaries (debtors)
Make loan repayments when repayments are triggered
Debtors whose loans are due make repayments as required
SARS
Track debtors that are employed but not repaying Debtors whose loans are due can be tracked to the employer as trigger for recovery
Employers
Campaign to employers/debtors to advocate for loan repayments to be activated
Employers "buy-out"/commit to repayment of loans on behalf of employed debtors
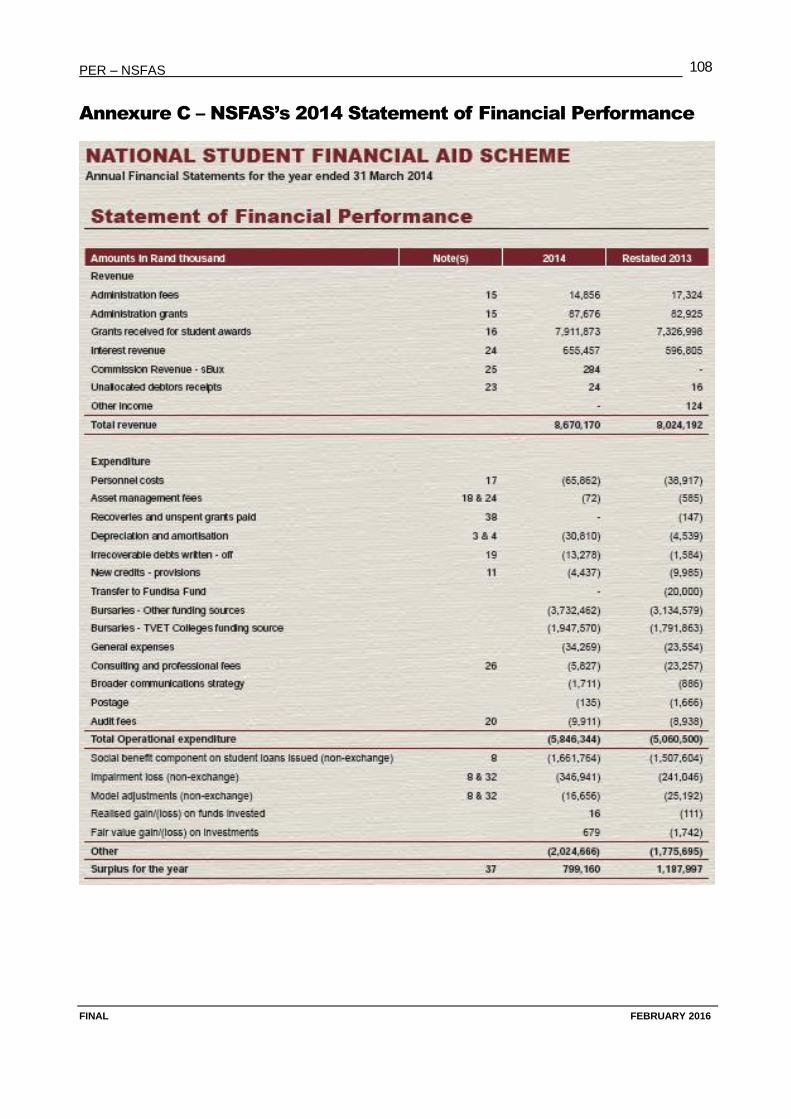
PER – NSFAS
FINAL FEBRUARY 2016
108
Annexure C – NSFAS’s 2014 Statement of Financial Performance
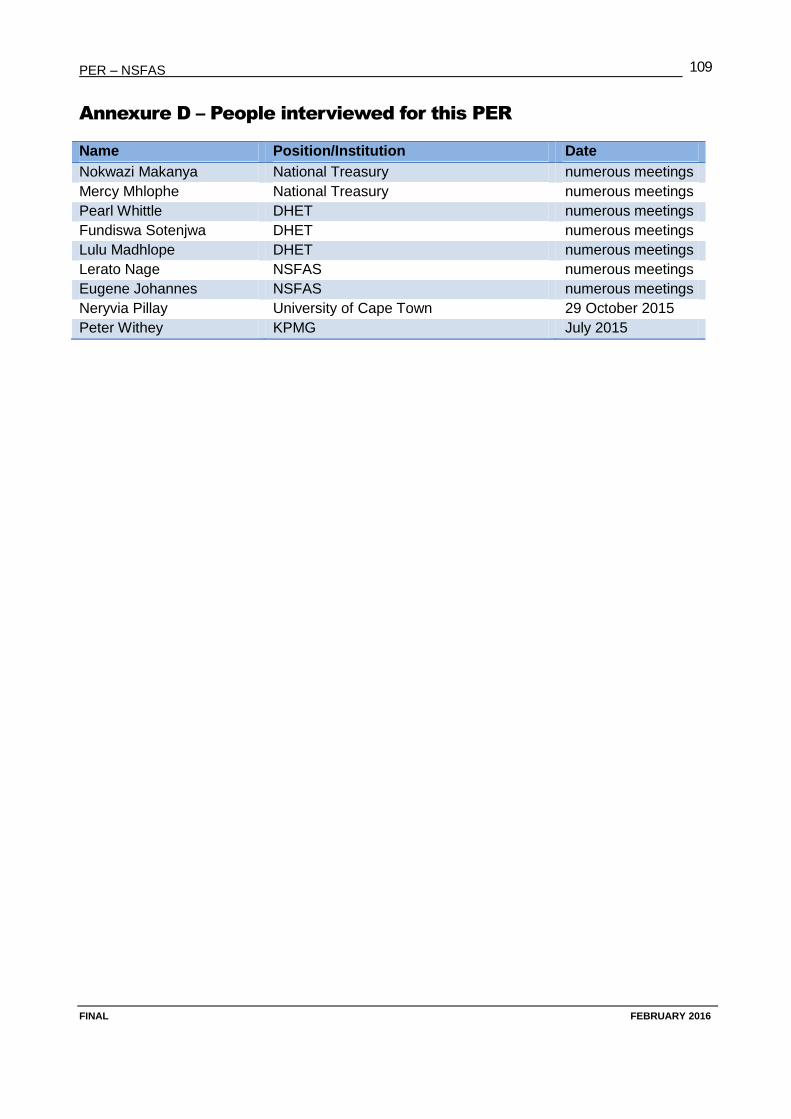
PER – NSFAS
FINAL FEBRUARY 2016
109
Annexure D – People interviewed for this PER
Name Position/Institution Date
Nokwazi Makanya National Treasury numerous meetings
Mercy Mhlophe National Treasury numerous meetings
Pearl Whittle DHET numerous meetings
Fundiswa Sotenjwa DHET numerous meetings
Lulu Madhlope DHET numerous meetings
Lerato Nage NSFAS numerous meetings
Eugene Johannes NSFAS numerous meetings
Neryvia Pillay University of Cape Town 29 October 2015
Peter Withey KPMG July 2015
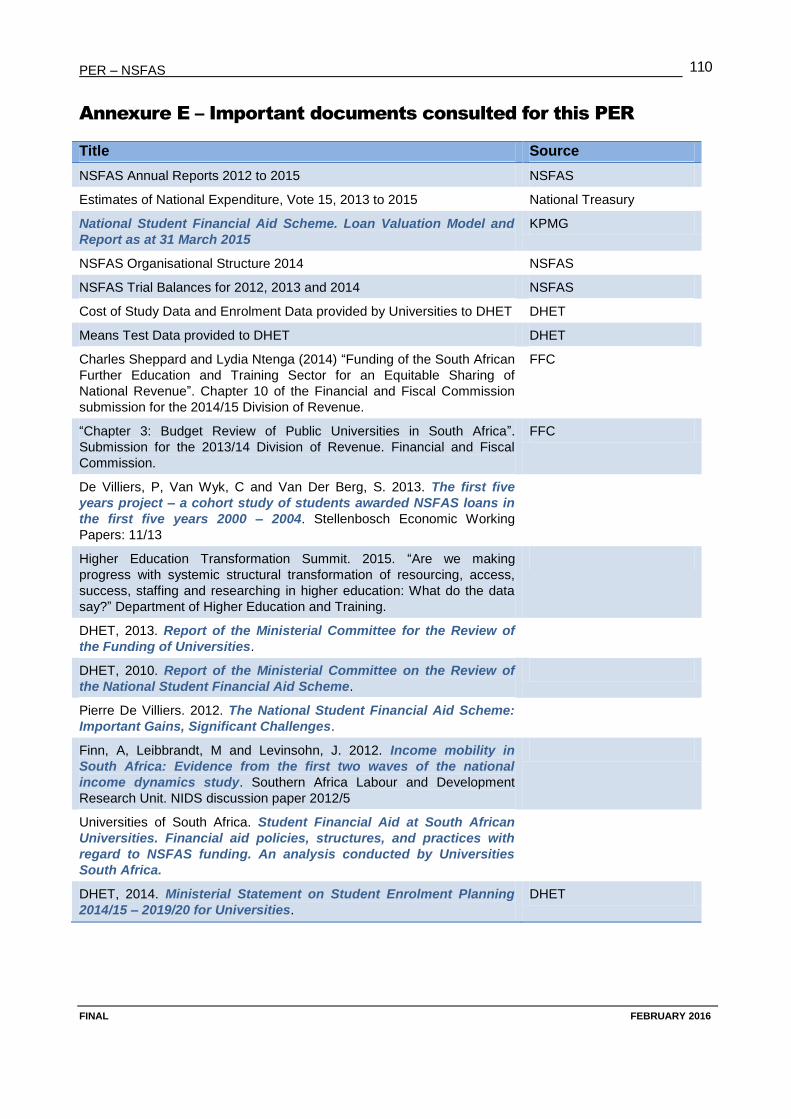
PER – NSFAS
FINAL FEBRUARY 2016
110
Annexure E – Important documents consulted for this PER
Title Source
NSFAS Annual Reports 2012 to 2015 NSFAS
Estimates of National Expenditure, Vote 15, 2013 to 2015 National Treasury
National Student Financial Aid Scheme. Loan Valuation Model and
Report as at 31 March 2015
KPMG
NSFAS Organisational Structure 2014 NSFAS
NSFAS Trial Balances for 2012, 2013 and 2014 NSFAS
Cost of Study Data and Enrolment Data provided by Universities to DHET DHET
Means Test Data provided to DHET DHET
Charles Sheppard and Lydia Ntenga (2014) “Funding of the South African
Further Education and Training Sector for an Equitable Sharing of
National Revenue”. Chapter 10 of the Financial and Fiscal Commission
submission for the 2014/15 Division of Revenue.
FFC
“Chapter 3: Budget Review of Public Universities in South Africa”.
Submission for the 2013/14 Division of Revenue. Financial and Fiscal
Commission.
FFC
De Villiers, P, Van Wyk, C and Van Der Berg, S. 2013. The first five
years project – a cohort study of students awarded NSFAS loans in
the first five years 2000 – 2004. Stellenbosch Economic Working
Papers: 11/13
Higher Education Transformation Summit. 2015. “Are we making
progress with systemic structural transformation of resourcing, access,
success, staffing and researching in higher education: What do the data
say?” Department of Higher Education and Training.
DHET, 2013. Report of the Ministerial Committee for the Review of
the Funding of Universities.
DHET, 2010. Report of the Ministerial Committee on the Review of
the National Student Financial Aid Scheme.
Pierre De Villiers. 2012. The National Student Financial Aid Scheme:
Important Gains, Significant Challenges.
Finn, A, Leibbrandt, M and Levinsohn, J. 2012. Income mobility in
South Africa: Evidence from the first two waves of the national
income dynamics study. Southern Africa Labour and Development
Research Unit. NIDS discussion paper 2012/5
Universities of South Africa. Student Financial Aid at South African
Universities. Financial aid policies, structures, and practices with
regard to NSFAS funding. An analysis conducted by Universities
South Africa.
DHET, 2014. Ministerial Statement on Student Enrolment Planning
2014/15 – 2019/20 for Universities.
DHET
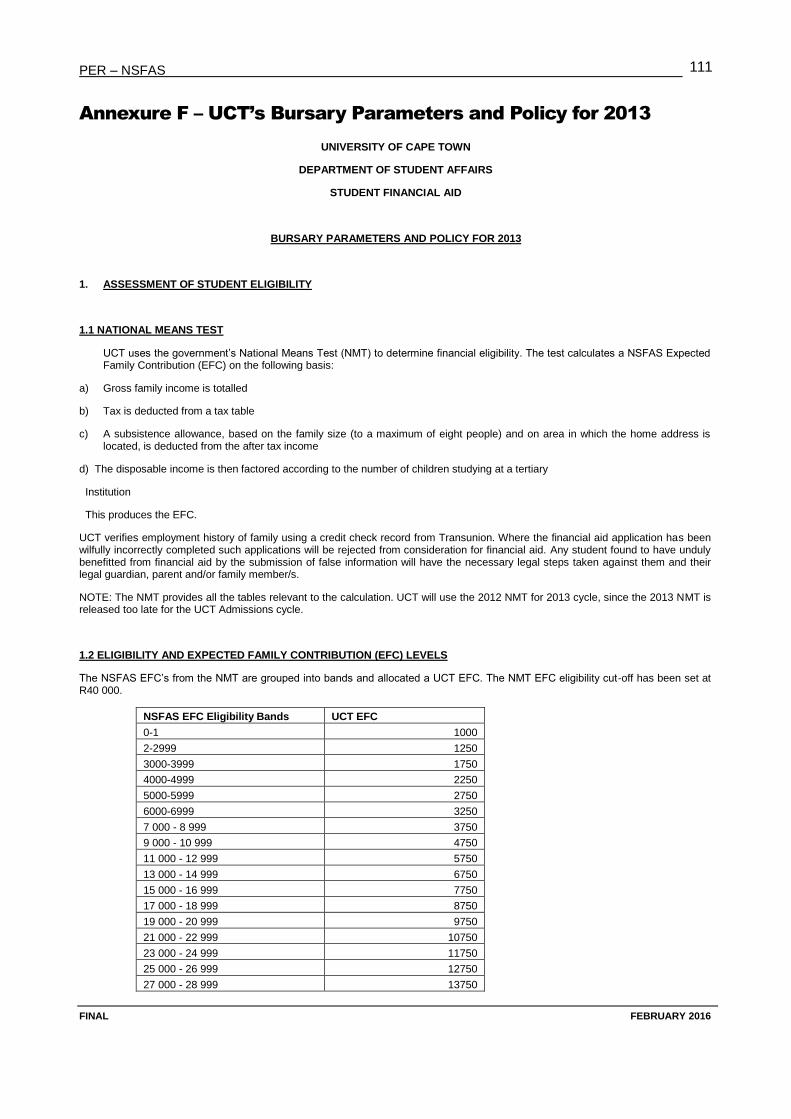
PER – NSFAS
FINAL FEBRUARY 2016
111
Annexure F – UCT’s Bursary Parameters and Policy for 2013
UNIVERSITY OF CAPE TOWN
DEPARTMENT OF STUDENT AFFAIRS
STUDENT FINANCIAL AID
BURSARY PARAMETERS AND POLICY FOR 2013
1. ASSESSMENT OF STUDENT ELIGIBILITY
1.1 NATIONAL MEANS TEST
UCT uses the government’s National Means Test (NMT) to determine financial eligibility. The test calculates a NSFAS Expected Family Contribution (EFC) on the following basis:
a) Gross family income is totalled
b) Tax is deducted from a tax table
c) A subsistence allowance, based on the family size (to a maximum of eight people) and on area in which the home address is located, is deducted from the after tax income
d) The disposable income is then factored according to the number of children studying at a tertiary
Institution
This produces the EFC.
UCT verifies employment history of family using a credit check record from Transunion. Where the financial aid application has been wilfully incorrectly completed such applications will be rejected from consideration for financial aid. Any student found to have unduly benefitted from financial aid by the submission of false information will have the necessary legal steps taken against them and their legal guardian, parent and/or family member/s.
NOTE: The NMT provides all the tables relevant to the calculation. UCT will use the 2012 NMT for 2013 cycle, since the 2013 NMT is released too late for the UCT Admissions cycle.
1.2 ELIGIBILITY AND EXPECTED FAMILY CONTRIBUTION (EFC) LEVELS
The NSFAS EFC’s from the NMT are grouped into bands and allocated a UCT EFC. The NMT EFC eligibility cut-off has been set at R40 000.
NSFAS EFC Eligibility Bands UCT EFC
0-1 1000
2-2999 1250
3000-3999 1750
4000-4999 2250
5000-5999 2750
6000-6999 3250
7 000 - 8 999 3750
9 000 - 10 999 4750
11 000 - 12 999 5750
13 000 - 14 999 6750
15 000 - 16 999 7750
17 000 - 18 999 8750
19 000 - 20 999 9750
21 000 - 22 999 10750
23 000 - 24 999 11750
25 000 - 26 999 12750
27 000 - 28 999 13750

PER – NSFAS
FINAL FEBRUARY 2016
112
29 000 - 30 999 14750
31 000 - 32 999 15750
33 000 - 34 999 16750
35 000 - 36 999 17750
37 000 – 40 000 18750
GAP Funding to a gross income of between R230 000 to R480 000
See point 7 for funding parameters
Students that are have a gross income of under R230 000 but are ineligible accordingly to the Means Test will be made FA eligible on the UCT EFC of R R18 750.
1.3 NON-FINANCIAL ELIGIBILTIY CRITERIA
a) Be a South African citizen or permanent resident. However, students with other citizenship and SA permanent residency and previously funded by their country of origin will not be considered.
b) Be studying towards a first degree /diploma or approved postgraduate diploma qualification. However, students with a BSc intending to study MBChB will be considered for FA, as approved by NSFAS.
c) Not exceed N+2 years of study for the undergraduate degree or diploma. d) Only students that completed their degree/diploma in less than N+2 will be considered for funding for a postgraduate
diploma. e) Approved postgraduate diploma studies will only be funded for the minimum duration of the course. f) Students that change study direction mid-stream will have the initial degree taken for the N+2 funding formula. The
exception is MBCHB students.. g) The Student must not be under Administrative order h) Not be in possession of other non-FA funding that covers their full cost of study. i) Students that cancel registration before writing the mid-year exam will have their full funding withdrawn. The Appeals
Committee will consider any appeals received. *N = minimum duration of the course/programme
2. DETERMINATION OF APPROVED COST OF STUDY
The funding is for the 10 months of the academic year, except medical students from 2nd year receive 11 months of funding due to early registration. Allowances are subject to student’s accommodation type.
Course fees As charged
Catering Residence incl levies As charged & R50/mth incidentals allowance
Self Catering Residence incl levies As charged and R1 200/mth food/incidentals allowance
Private ‘Digs’ R2 240/mth rent, R1 200/mth food/incidentals & R660 local travel allowances
Living at Home R650/mth home & R660/mth local travel allowances
Book Allowance R3 000/annum
Sundry R500/annum
Academic Vacation Accommodation As charged - if valid academic reasons
Special Costs Spectacles to the max. of R450
Students whose home address is in the greater Cape Town area are required to submit a motivation to SFA for living either in a UCT residence or in private lodgings. If no valid reason is supplied, residence or lodgings costs will not be covered. Students granted permission to reside in Residence or private B&L need not re-apply in subsequent years.
3. BURSARY FUNDING
Guaranteed set value bursaries apply as follows:
R35 000 minimum bursary to away students (not from Cape Town) across all years of study on a full course load. These
include local students approved for residence.
R20 000 minimum bursary for a local student living at home, across all years of study on a full course load.
However, students with costs greater than their set bursary, EFC and maximum loan, will receive a top up bursary. No student is required to contribute more than their EFC on approved cost of study charges.
4. LOAN OFFER COMPONENT
R56 000 maximum NSFAS and NSFAS/UCT loan offers. Actual Loan offer is subject to approved cost of study less EFC and less set value bursary.
PER – NSFAS
FINAL FEBRUARY 2016
113
5. EFFECT OF EXTERNAL AWARDS AND SCHOLARSHIPS ON FINANCIAL AID PACKAGE
5.1 Students in receipt of external bursaries that cover academic fee, residence and book costs will be eligible for loans only; and
5.2 Other students will be allowed to hold outside awards in conjunction with UCT awards provided that the total of all awards does not exceed the student’s assessed ‘full costs’ as determined by the UCT formula. External awards will firstly reduce EFC, thereafter UCT top up bursaries, then the loan value offered, and finally the set value bursary if necessary.
5.3 Entrance Scholarships (ES) are awarded by the Faculty. Students will be allowed to hold outside awards in conjunction with their ES. If the student is also granted a UCT financial assistance package, the ES will be used to cover the EFC, and thereafter reduce the loan and, finally, the bursary, if necessary.
5.4 Students that receive full cost external funding will not be eligible for FA, and the allocated FA will be withdrawn.
5.5 Financial aid funding will be adjusted for any payments made direct to students by external sponsors. No financial aid student is permitted to be funded more the approved financial aid Cost of Study.
6. EXTERNAL LOANS AT NO OR LOW INTEREST
No or low interest external loans will not be considered as external bursaries. External loans will firstly be used to reduce the EFC, thereafter the loan offer, and lastly the UCT administered bursaries depending on the value of the loan.
7. GAP FUNDING PARAMETERS
7.1 Course Fees Bursary Assistance
Gross Income Band Percentage Bursary towards total
course fee costs
R230 001 - R329 999 50%
R330 000 – R429 999 40%
R430 000 – R480 000 30%
7.2 Loan Offer
R25 000 National NSFAS/UCT loan offer to students in residence and private accommodation, including local students approved by SFA.
R10 000 NSFAS/UCT loan offer to local students.
7.3 GAP Students with siblings at UCT
GAP Students with siblings at UCT – the 2nd and subsequent siblings will receive a 50% course fees bursary.
7.4 Funding Rules
Students will be required to submit a financial aid application form and meet the normal documentation requirements of the National Means Test;
Only students that meet the gross income cut-off will be considered for GAP funding;
Only students registered in the year the funding applies to will be considered. This presupposes that all prior year debt has been settled;
Unless specifically requested, external funding and scholarships will be applied to reduce a student’s shortfall before the loan and bursary value is reduced.
Students that have paid all their fees will have funding withdrawn pro rata to the credit in their account.
8. WINTER AND SUMMER TERM FUNDING RULES
Note: NSFAS does not fund summer and winter term registrations
Only fully completed applications for funding will be considered, incomplete applications will be rejected
FA students in their final year of study is automatically eligible for funding
Funding is only provided to FA students that will reduce the tenure of their studies through winter and/or summer term registration, therefore;
o FA students in their first year will not be considered o Students must show reasonable academic progress on their transcript o Students facing academic exclusion will not be considered o Winter and summer term vacation accommodation will be covered until residences open at an academic rate
charge