national research council of italy institute of...
TRANSCRIPT

NATIONAL RESEARCH COUNCIL OF ITALYINSTITUTE OF MARINE SCIENCES MARINE
GEOLOGY SECTION (BOLOGNA)
JOINT RESEARCH PROJECT ”EUROMARGINS”
GEOPHYSICAL, GEOLOGICAL AND OCEANOGRAPHICSURVEYS
IN THE NORTHERN RED SEA
REPORT ON THE MORPHOBATHYMETRIC, MAGNETOMETRIC,OCEANOGRAPHIC, CORING AND DREDGING
INVESTIGATIONS DURING CRUISERS05 ABOARD R/V URANIA
ISMAR-CNR, BolognaDSC, University of Rome ”La Sapienza”
LDEO, New YorkIFREMER, Brest
IFG, University of KielDES, University of Cardiff
SGS, Saudi Geological SurveySCU, Suez Canal University
GEI and SO.PRO.MAR.and Egyptian and S.Arabian Observers
ISMAR Bologna TECHNICAL REPORT N. 94
Bologna, March 2005

Many of the designations used by the manufacturers and sellers to promote their products areclaimed as trademarks. Where those designation appear in the Report and ISMAR-CNR wasaware of a trademark claim the designations have been printed in all caps. In addition, we havereported some of them in the Production Notes below in this page and in the ACRONYM tablethereinafter.
Nothing in this document is meant to imply any endorsement or recommendation, positive ornegative, concerning any systems or programs mentioned herein.
The data presented hereafter is the property of CNR and of the Joint Research Program. Unau-thorized use of the data would be considered unfair.
Many of the systems and programs used to generate data are ’free’ because either they are in the’public domain’ or the licences are roughly equivalent to the GNU Public License. Some programsare either commercial or have more restrictive licenses and may require payment. Where known,programs and systems that are not ‘free’ are acknowledged.
ISMAR-CNR Cataloging-In-Publication data: ISMAR Bologna TECHNICAL REPORT N. 94
Geophysical, geological and oceanographic surveys in the Northern Red Sea. Report on the mor-phobathymetric, magnetometric, oceanographic, coring and dredging investigations during cruiseRS05 aboard R/V Urania.
by Bonatti E., Bortoluzzi G., Calafato A., Cipriani A., Ferrante V., Ligi M., Lopez Correa M.,Redini F., Barabino G., Carminati E., Mitchell N., Sichler B., Schmidt M., Schmitt, Rasul N., AlNomani S., Bahareth F., Khalil S., Farawati R., Gitto D. and Raspagliosi M.
Includes bibliographical reference and index.1.Red Sea 2.Seafloor spreading 3.Continental Rift 4. Tectonics 5. Petrology 6. Geochemistry 7.Oceanography
Abstract - A summary of methodologies, technical details and ship-board results of a swathbathymetry, geophysical, geological and oceanographical survey in the Northern Red Sea is pre-sented. The cruise utilized the CNR’s R/V Urania and investigated the Deeps north of 22N. Duringthe 14 days in the area, detailed, full coverage bathymetry, multichannel and SBP reflection seis-mic, magnetometric lines, bottom sediment sampling were carried out in the Thetis Deep Area.In addition, multibeam bathymetry, SBP and brine sampling in the Nereus, Oceanographer andConrad Deeps were accomplished. The samples and data collected in the transitional area of theNorthern Red Sea will give an insight on the processes that occured during the transition from acontinental to an oceanic rift.
Sommario - Vengono presentati le metodologie e l’insieme dei risultati ottenuti durante unacampagna di rilievi batimetrici e geofisici nella zona Nord del M.Rosso. E’ stata utilizzata la naveda ricerca R/V Urania del CNR, per indagini nella zona di depressione Thetis e a N del 22N. Si e’ottenuta una mappa batimetrica dettagliata con sistema ’multibeam’, sono state fatte indagini disismica a riflessione multicanale e SBP ad alta risoluzione, sono stati raccolti dati magnetometricied e’ stato campionato il fondo marino (Thetis) e le brine (Nereus, Oceanographer e Conrad).
Reproduced by ISMAR-CNR from camera-ready proofs supplied by the authors.Published in the WWW at doc.bo.ismar.cnr.it and www.bo.ismar.cnr.itAvailable in the HTML and PDF formats.Available also in other formats, upon request.Hereafter a link to verbatim copy of this document (LATEX).
Copyright�
2005 by ISMAR-CNR - Via Gobetti 101 40129 Bologna, Italy.Production Notes - The document was edited with standard text editors, typeset with L.Lamport’s LATEX,
translated to PostScript with dvips and printed with an A4 laser printer. The full production was done
on a GNU Linux box with GNU-GPL software. Converted to HTML by N.Drakos’s LATEX2HTML and to PDF
by Alladin Ghostscripts’s ps2pdf. Most of the maps included were produced by Wessel and Smith’s GMT
package. Some drawings were produced by xfig (www.xfig.org). Non PostScript images were converted
by John Bradley’s xv or other public-domain packages, among them convert.

ACRONYMS
ACRONYM DESCRIPTION URL-email
CNR Consiglio Nazionale Delle Ricerche www.cnr.itISMAR Istituto di Scienze Marine www.bo.ismar.cnr.itLDEO Lamont-Doherty Earth Observatory www.ldeo.columbia.eduIFREMER Inst.Francaise Exploitation Mer www.ifremer.frIFG Institute for Geosciences Kiel University www.gpi.uni-kiel.deDES Dept.Earth Sciences Cardiff University www.earth.cardiff.ac.uk/DSC Dipartimento Scienze della Terra www.uniroma1.itSGS Saudi Geological Survey www.sgs.org.sa/SCU Suez Canal Univ., Geol.Dept. www.suez.edu.eg
IAGA Int.Ass.of Geomagnetism and Aeronomy www.iugg.org/IAGA/IGRF Int.Geomagnetic Reference Field www.ngdc.noaa.gov/IAGA/vmod/INTERMAGNET INTErn.Real-time MAGnetic Obs.NETwork www.intermagnet.orgSEG Soc. of Exploration Geophysicists www.seg.orgUNESCO United Nations Scient. and cultural org. www.unesco.org
GPS-DGPS-RTK Global Positioning System samadhi.jpl.nasa.govDTM Digital Terrain Model en.wikipedia.orgGEBCO General Bathym.Chart Oceans www.ngdc.noaa.gov/mgg/gebcoSRTM Shuttle Radar Topogr.Mission www2.jpl.nasa.gov/srtm/
DIC Dissolved Inorganic carbonETAAS Electrothermal Atomic Absorption Spectropho-
tometerFEP Fluorinated ethylene polypropyleneICPAES Inductively-Coupled Plasma Atomic Emission
SpectrometerICPMS Inductively Coupled Plasma - Mass SpectrometryHDPE High density polyethyleneMBES MULTIBEAM ECHOSOUNDER SYSTEMMCS Multichannel SeismicREE Rare Earth ElementsRSDW Red Sea Deep WaterSBP Sub Bottom ProfilingXBT Expendable BathyTermograph www.sippican.com
RESON Reson www.reson.itCOMM-TECH Communication Technology www.comm-tec.comNEPTUNE Simrad MBES Software www.kongsberg-simrad.comCARAIBES Traiment Cartographique Batimetrie www.ifremer.fr/dnis esiMB-SYSTEM MB-SYSTEM www.ldgo.columbia.edu/MB-
SystemGMT Generic Mapping Tool gmt.soest.hawaii.edu/gmtGNU,GPL GNU is not Unix,General Pub. License www.gnu.org
Table 1: Acronyms of Organizations, Manufacturers and Products

HOW TO READ THIS REPORT
Sections 1 and 2 give the introductory and background information, including some technologicaland scientific issues of the organization and execution of tasks, whereas section 3 summarizes thecruise operations. Section 4 provides the technical aspects that were involved in the data acquisitionand processing. Sections 5 and 6 discuss the initial results, the on-going data processing and usage,and give concluding remarks. Some data processing procedures that were used in the productionof this report along with additional technical details and data are presented in the Appendix.
ACKNOWLEDGMENTS
Many people contributed to the success of the research cruuise (RS05 R/V Urania ). Firstly,we wish to thank Captain Emanuele Gentile, the Chief Engineer, the officers and crew membersof R/V Urania for their professionalism and efforts in assuring the success of the cruise. Theproject was mainly funded by EU’s EUROMARGINS projects, with a substancial amount providedby the Italian CNR for ship time. We are indebted to the ISMAR of Bologna (Dr.M.Ravaioliand P.Dall’Olio), for the continuous effort in resolving the financial and technical problems. Dr.M.Borghini of ISMAR at La Spezia kindly provided the SIPPICAN launcher, while Dr. Manzellaof ENEA provided some of the XBT. We thank you both. We also wish to acknowledge ItalianEmbassies in Egypt and Saudi Arabia for their assistance.

Contents
1 INTRODUCTION 1
2 GEOLOGICAL AND OCEANOGRAPHICAL SETTINGS 4
3 CRUISE SUMMARY 6
4 MATERIALS AND METHODS 124.1 NAVIGATION AND DATA ACQUISITION . . . . . . . . . . . . . . . . . . . . . . 124.2 CTD, WATER SAMPLING AND SOUND VELOCITY DATA . . . . . . . . . . . 14
4.2.1 WATER SAMPLING . . . . . . . . . . . . . . . . . . . . . . . . . . . . . . 144.2.2 CONTINUOUS SURFACE C/T PROFILING . . . . . . . . . . . . . . . . 18
4.3 MULTIBEAM BATHYMETRY . . . . . . . . . . . . . . . . . . . . . . . . . . . . . 194.4 MAGNETOMETRY . . . . . . . . . . . . . . . . . . . . . . . . . . . . . . . . . . . 194.5 CHIRP SBP . . . . . . . . . . . . . . . . . . . . . . . . . . . . . . . . . . . . . . . . 194.6 SEABED SAMPLING . . . . . . . . . . . . . . . . . . . . . . . . . . . . . . . . . . 194.7 MULTICHANNEL SEISMIC . . . . . . . . . . . . . . . . . . . . . . . . . . . . . . 204.8 MISCELLANEOUS . . . . . . . . . . . . . . . . . . . . . . . . . . . . . . . . . . . 22
5 INITIAL RESULTS 235.1 BATHYMETRY . . . . . . . . . . . . . . . . . . . . . . . . . . . . . . . . . . . . . 235.2 SEABED SAMPLING . . . . . . . . . . . . . . . . . . . . . . . . . . . . . . . . . . 265.3 MAGNETOMETRY . . . . . . . . . . . . . . . . . . . . . . . . . . . . . . . . . . . 285.4 SBP . . . . . . . . . . . . . . . . . . . . . . . . . . . . . . . . . . . . . . . . . . . . 295.5 OCEANOGRAPHY . . . . . . . . . . . . . . . . . . . . . . . . . . . . . . . . . . . 30
5.5.1 SURFACE TEMPERATURE AND SALINITY . . . . . . . . . . . . . . . . 305.5.2 WATER SAMPLING . . . . . . . . . . . . . . . . . . . . . . . . . . . . . . 31
6 CONCLUSIONS 32
List of Figures
1 Geographical area setting, Red Sea. Bathymetry and topography from [GEBCO (2003)]. 22 Geographical area setting, Northern Red Sea. Bathymetry and Topography from
[GEBCO (2003)]. . . . . . . . . . . . . . . . . . . . . . . . . . . . . . . . . . . . . . 33 Ship track during Cruise RS05. The red dots are XBT stations. . . . . . . . . . . . 64 Ship tracks (Ship tracks, general: Multibeam, SBP, Magnetics lines (black), Multi-
channel lines (blue) . . . . . . . . . . . . . . . . . . . . . . . . . . . . . . . . . . . . 75 Ship tracks, Thetis Deep Area: Multibeam, SBP, Magnetics lines (black), Multi-
channel lines (blue). . . . . . . . . . . . . . . . . . . . . . . . . . . . . . . . . . . . 86 Samples taken in the Thetis Deep Area. DR* = dredges, GR* = grabs, CR* =
cores, BR* = Brine sampling, CTD* = CTD. . . . . . . . . . . . . . . . . . . . . 97 Samples taken in the Northern Area. DR* = dredges, GR* = grabs, CR* = cores,
BR* = Brine sampling, CTD* = CTD. . . . . . . . . . . . . . . . . . . . . . . . . 108 R/V Urania . . . . . . . . . . . . . . . . . . . . . . . . . . . . . . . . . . . . . . . . 119 Cruise RS05. Instrumental Offsets on R/V Urania . . . . . . . . . . . . . . . . . . 1410 Hydrobios Rosette sampler. . . . . . . . . . . . . . . . . . . . . . . . . . . . . . . . 1711 Degassing system. . . . . . . . . . . . . . . . . . . . . . . . . . . . . . . . . . . . . 1812 Dredge. . . . . . . . . . . . . . . . . . . . . . . . . . . . . . . . . . . . . . . . . . . 2013 GI-GUN Array. . . . . . . . . . . . . . . . . . . . . . . . . . . . . . . . . . . . . . . 2114 GI-GUN Array Synchronizer. . . . . . . . . . . . . . . . . . . . . . . . . . . . . . . 2115 Multichannel streamer. . . . . . . . . . . . . . . . . . . . . . . . . . . . . . . . . . . 2216 The Conrad Deep. Bathymetry from PDS-2000 DTM 25m. . . . . . . . . . . . . . 2417 The Oceanographer Deep. Bathymetry from PDS-2000 DTM 25m. . . . . . . . . . 2518 The Nereus Deep. Compilation with the data of [Pautot (1983)] and present survey. 25
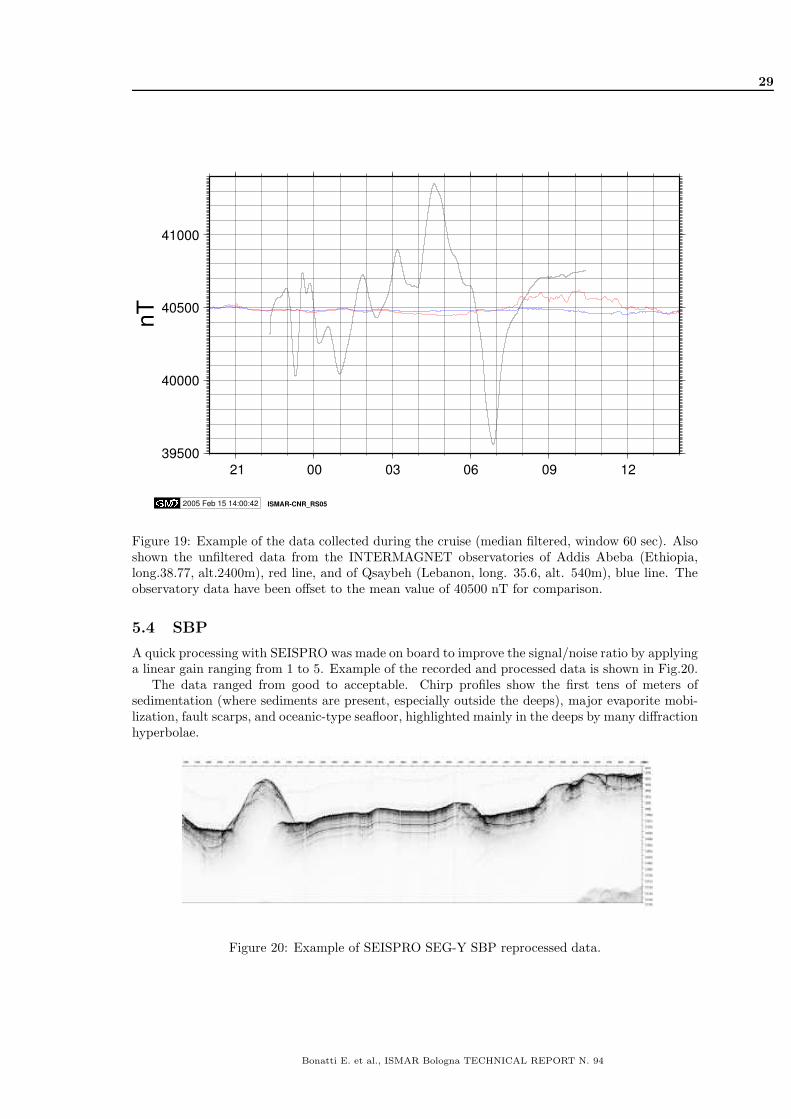
19 Example of the data collected during the cruise (median filtered, window 60 sec).Also shown the unfiltered data from the INTERMAGNET observatories of AddisAbeba (Ethiopia, long.38.77, alt.2400m), red line, and of Qsaybeh (Lebanon, long.35.6, alt. 540m), blue line. The observatory data have been offset to the mean valueof 40500 nT for comparison. . . . . . . . . . . . . . . . . . . . . . . . . . . . . . . . 29
20 Example of SEISPRO SEG-Y SBP reprocessed data. . . . . . . . . . . . . . . . . . 2921 Temperature and Salinity plot of CTD (red, blue) and XBT (green) casts. . . . . . 3022 Surface temperature and salinity in the Thetis Deep. From 2005-01-07 to 2005-01-15.
Salinity data corrected with the procedure explained in 4.2.2 . . . . . . . . . . . . 31
List of Tables
1 Acronyms of Organizations, Manufacturers and Products . . . . . . . . . . . . . . i2 Scientific and technical parties . . . . . . . . . . . . . . . . . . . . . . . . . . . . . 113 Instrumental Offsets on Ship Urania. Point (VESSEL(0,0)) is located on the axis
of the mast just behind the Command Bridge. The main GPS antenna (primarypositioning system) is located on point POS1. . . . . . . . . . . . . . . . . . . . . . 13
4 RS05 CTD Stations location and description. P=Profile, S or B Water or BrineSampling. TRE=Trace elements, NUT=Nutrient, GAS=Gas analyses. . . . . . . . 15
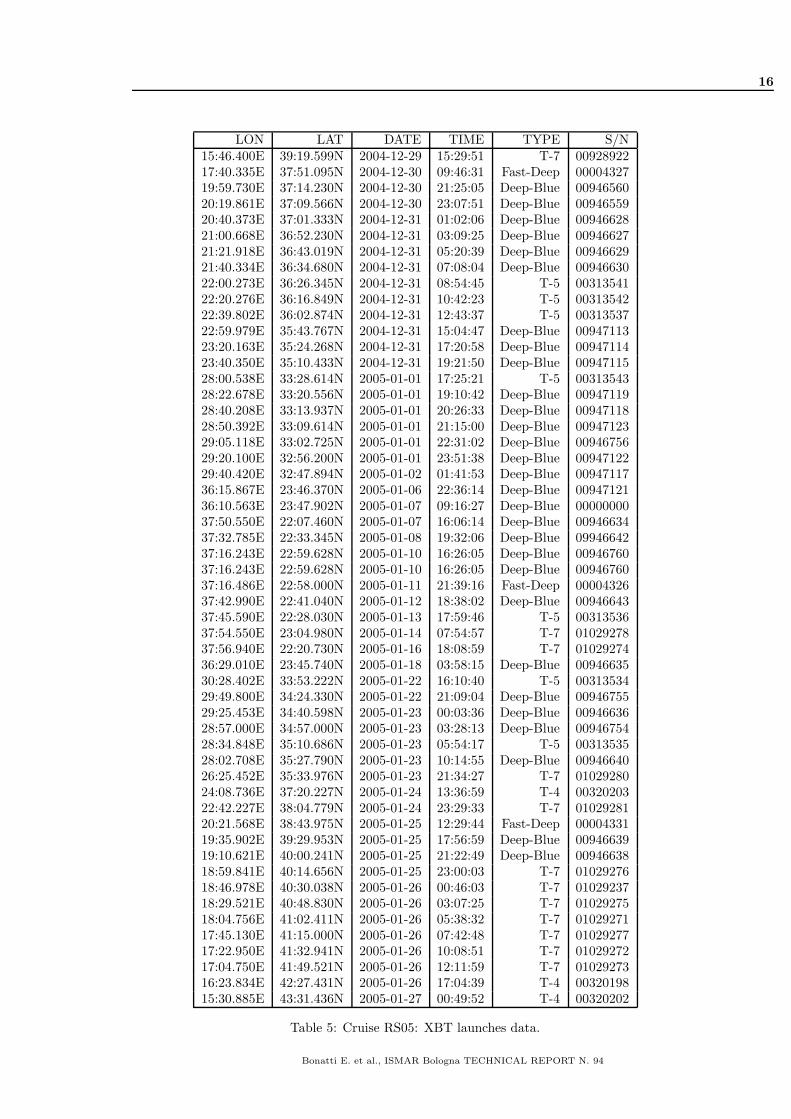
5 Cruise RS05: XBT launches data. . . . . . . . . . . . . . . . . . . . . . . . . . . . 166 RESON 8160 Multibeam calibration results. . . . . . . . . . . . . . . . . . . . . . . 197 Samples location. DR*=dredges(start,end),GR*=grabs, CR*=core. CCR=Carbonate
Crust, VG=Volcanic Glass, BAS=Basalt, DSC=Deep Sea Coral, VS=Volcanic Sco-ria, CM=Carbonate Mud. . . . . . . . . . . . . . . . . . . . . . . . . . . . . . . . . 27
8 Rock description, subsampling and destination. CCR=Carbonate Crust, VG=VolcanicGlass, BAS=Basalt, DSC=Deep Sea Coral, VS=Volcanic Scoria. . . . . . . . . . . 28

1
1 INTRODUCTION
It is generally accepted that the Red Sea and the Gulf Aden rift systems (Fig.1) provide the closestmodern anologs to the rifting and rupturing of continental lithoshere that formed the continentalpassive margins of the Atlantic, Indian and Arctic Oceans. The Red Sea spreading center is believedto have developed within a continental rift following an extended period of rifting, that started inthe late Oligocene (30 Ma). The Red Sea continental rift has been mostly extensional and is charac-terized by the rotation of large crustal blocks such as those exposed in the Gulf of Suez, which initi-ated as the northern end of the Red Sea during the Late Oligocene-Early Miocene. Most of the ex-tension along the Red Sea was accommodated by sinistral movement along the Gulf of Aqaba-DeadSea transform that was established in the Middle Miocene, with a second, currently active, phaseof movement initiated in the Pliocene ([Bosworth and McClay(2001), Khalil and McClay (2001)].
The development of the spreading centers in the Red Sea varies in magnitude and style along therift axis. The transition to seafloor spreading is more advanced to the south where the spreadingcenter nucleated near 17N about 5 Ma and propagated both north and south from that location[Cochran (1983), Ghebreab (1998), Bonatti (1985)]. The spreading center axis is continuous southof 21N and it becomes discontinuous northward upto a series of discrete localized centers of intrusionmarking where seafloor spreading is nucleating. Thus, the Red Sea shows along-strike all stagesinvolved in the transition from a continental to an oceanic rift.
The project, funded by the EU within the ”Euromargins” framework, aimed (a) to clarifytectonic and petrological aspects of the transition from a continental to an oceanic rift and theformation of passive margins, and (b) to address problems of sedimentation in an embryonic oceanand bio-geochemistry in the axial hydrothermal cells. The work at sea would include multibeam,magnetic, gravimetric and seismic reflection surveys, rock and sediment sampling, and water sam-pling of the axial hydrothermal vents. In addition to processing and interpreting of the geophysicaldata obtained at sea, a comprehensive analytical program on the geochemistry of igneous rocksand hydrothermal fluids would be undertaken.
The objectives were to study: (1) the northernmost (presumably youngest) troughs with truly”oceanic” crust, and their transition to thinned/stretched continental crust; (2) a fracture zoneintersecting the Red Sea (Zabargad Fracture Zone), where the earliest stages in the development ofthe large oceanic transforms could be observed, and where the north-propagating Red Sea oceanicrift appears to impact at present; (3) the origin and nature of segmentation of the rift axes andoffset of the deeps; and (4) the structural architecture of the deeps and the control on localizationof the transition zones.
The project also aims to integrate the onshore and offshore data to model the tectonic evolutionof the Red Sea rift system. The activities and initial results of the research cruise RS05 in theNorthern Red Sea aboard CNR’s R/V Urania are presented.
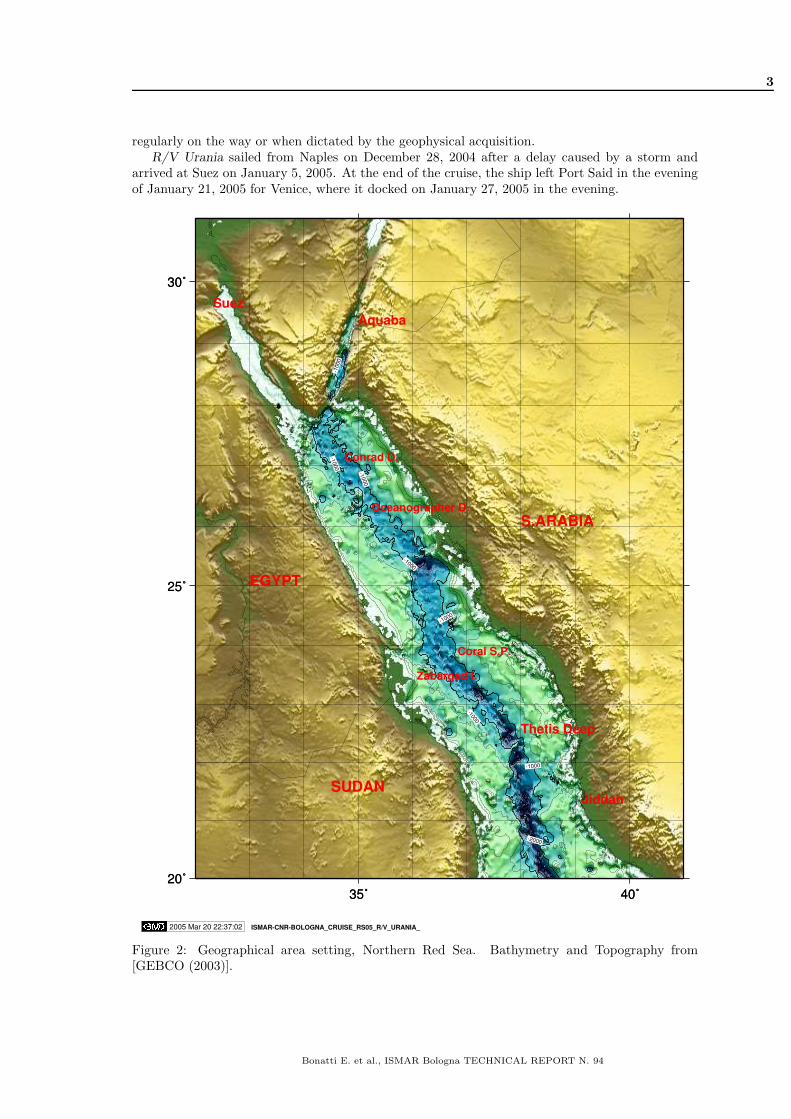
To tackle the above specific topics, we decided to focus our field work on the Northern andtransitional regions (Fig.2) trying to obtain high resolution morphobathymetric, magnetometric,SBP and Multi Channel Seismic reflection data, other than bottom rock dredges and brine samplesfor mineralogical, petrographical and geochemical analysis. In order to achieve our objectives focuswas placed on the Northern and transitional areas in the Red Sea (Fig.2). A multi-parameter dataacquisition scheme was applied in order to optimize the understanding of the rift system. Highresolution morphobathymetric, magnetometric, SBP and Multichannel seismic reflection data wereobtained, including rock and sediment samples, brine and water samples to carry-out mineralogical,petrographical and geochemical analyses. Time constraints and permission restrictions restrainedthe research objectives, and therefore focus was placed on Thetis Deep and its transition to NereusDeep, a zone previously almost uninvestigated, to test the hypotheses of the evolution from con-tinental to oceanic rifting and the northern propagation of the oceanization process. During thetransits we also investigated two of the northernmost Red Sea Deeps, the Conrad Deep and theOceanographer Deep to sample brines, and the Coral Seapeak, a small seamount of probable ig-neous origin, looking for deep sea corals.
Bonatti E. et al., ISMAR Bologna TECHNICAL REPORT N. 94

2
2005 Mar 20 22:33:02 ISMAR-CNR-BOLOGNA_CRUISE_RS05_R/V_URANIA_
35˚ 40˚ 45˚10˚
15˚
20˚
25˚
30˚
35˚ 40˚ 45˚10˚
15˚
20˚
25˚
30˚
EGYPT
S.ARABIA
SUDAN
YEMEN
ERITREA
Bab al Mandab
Gulf of Aden
Suez
Jiddah
Aquaba
Figure 1: Geographical area setting, Red Sea. Bathymetry and topography from [GEBCO (2003)].
During the 17 days in the area, including the three days of transit, multibeam bathymetry,magnetics, oceanographic measurements, dredging, coring, surficial sediment sampling and brinewater sampling were carried out. The work areas were (a) the Thetis Deep, that was intensivelyinvestigated (full coverage multibeam, magnetics, bottom rocks and brine sampling, SBP and MCSseismic), (b) the Coral Sea Peak, that was dredged and mapped, (c) the Nereus, Oceanographerand Conrad Deeps (multibeam, SBP, brine sampling). The Arabian Shelf was sampled by grab andcorer. Other activities, e.g. CTD-XBT casts, ADCP and METEO measurements were performed
Bonatti E. et al., ISMAR Bologna TECHNICAL REPORT N. 94
3
regularly on the way or when dictated by the geophysical acquisition.R/V Urania sailed from Naples on December 28, 2004 after a delay caused by a storm and
arrived at Suez on January 5, 2005. At the end of the cruise, the ship left Port Said in the eveningof January 21, 2005 for Venice, where it docked on January 27, 2005 in the evening.
2005 Mar 20 22:37:02 ISMAR-CNR-BOLOGNA_CRUISE_RS05_R/V_URANIA_
35˚ 40˚20˚
25˚
30˚
-2000
-1000
-1000
-1000
-1000
-1000
-1000
-100
0
35˚ 40˚20˚
25˚
30˚
EGYPT
S.ARABIA
SUDAN
Suez
Jiddah
Aquaba
Thetis Deep
Oceanographer D.
Conrad D.
Coral S.P.
Zabargad I.
Figure 2: Geographical area setting, Northern Red Sea. Bathymetry and Topography from[GEBCO (2003)].
Bonatti E. et al., ISMAR Bologna TECHNICAL REPORT N. 94

4
CRUISE PLANNING AND STRATEGY
A research cruise for 40 days in the Red Sea were initially requested but due to the demandingschedule of the research ship R/V Urania only 29 days of ship time was granted.
Since the study area in the Red Sea is located in the Egyptian, Saudi and Sudanese Waters itwas mandatory to acquire permission to work, from the respective governments. These permissionswere granted by Egypt, under the clause of having observers on board and with restriction for workinside the territorial and contiguous waters. The Saudi Arabian Government gave the permissionsunder an agreement with the Saudi Geological Survey. Sudanese authorities released permissions,under the clause of having two Sudanese scientists onboard.
Geophysical equipment for e.g. Multibeam Echosounder was rented from Reson, whereas mul-tichannel systems was provided by ISMAR. Water samplers for brine sampling and analyticalequipment were provided by the University of Kiel. Geological equipment, e.g. rock cutters andrelated gadgets were provided by ISMAR, in addition to computing devices for multibeam, seismicand general-purpose processing.
2 GEOLOGICAL AND OCEANOGRAPHICAL SETTINGS
Two research cruises were conducted by CNR (formerly Institute of Marine Geology, now ISMAR,Bologna) in 1979 (R/V Salernum) and 1983 (R/V Bannock), in the Red Sea transitional region,between 22.5N and 24.5N. These cruises gave insights into four closely spaced deeps (from southto north: Thetis, Nereus, Bannock and Vema) that seem to be younger and less evolved fromsouth to north. From these observations, it was proposed that transition from a continental to anoceanic rift occurs in the Red Sea by initial emplacement of oceanic crust in regularly spaced cellsor deeps, which serve as nuclei for axial propagation into segments of oceanic crust accretion andfor initiation of seafloor spreading [Bonatti (1985)]. This segmentation could be derived either fromregularly spaced diapirs of upwelling astenosphere [Bonatti (1985)], or from an initial structuralsegmentation of the rift in the continental stage, with transfer zones probably exploiting pre-existing structural discontinuities as observed in East African Rift [Rosendahl (1987)] and in theGulf of Suez [Younes and McClay (2002), Khalil and McClay (2002)]. The northward propagationof the oceanization seems to end at the intersection with a major fracture zone (Zabargad FractureZone [Bonatti et al.(1984)], striking almost N-S and offsetting the axial valley in the Red Sea. Theisland of Zabargad, an uplifted block of sub-Red Sea lithosphere, lies along this important structure[Bonatti et al.(1981), Bonatti et al.(1984)]. It is hypothesized that the Zabargad Fracture Zone isa ’prototransform’ that, if the Red Sea would continue its opening trend, might develop into an’initial’ major oceanic transform, similar to those offsetting today the equatorial Mid AtlanticRidge.
The above cited ’Deeps’ of the Red Sea, other than being peculiar geological structures reflectingand providing insights into the tectonic processes, present bottom water stratification with brinesthat are warmer, saltier, acidic and nearly saturated with respect to NaCl and highly enrichedover normal RSDW composition. Moreover, they are strictly anaerobe and Fe and Mn oxides areprecipitated above the chemocline of metal-rich brines [Schmidt et al.(2003)].
The salty brines are mainly formed by seawater dissolving Miocene evaporites which build upto several kilometers thick deposits under the normal pelagic/terrigeneous sediments. They areseparated from normal RSDW by several meters thick interfaces, and transport across the brine-seawater interface is mainly controlled by diffusion [Anschutz and Blanc (1996), Schmidt et al.(2003)].
High gas concentrations (CO2, hydrocarbons) were determined in the brines reaching saturationconditions in the Kebrit Deep brine [Faber (1998)]. Stable carbon and hydrogen isotope analysesof dissolved hydrocarbons in Red Sea water and brines clearly indicated a thermogenic origin ofthe gases due to locally high heat flows and the presence of sedimentary organic matter in thesubsurface of the Red Sea deeps [Faber (1998)]. The brine/seawater interface, however, representsa zone of complex biogeochemical reactions causing highly effective methane oxidation (indicatedby strong secondary isotope fractionation of residual methane having most positive δ 13C valuesup to +47 % PDB; [Faber (1998)]) while methane is diffusing upwards from the brine into RedSea bottom water. There is geochemical evidence that the biogeochemical methane oxidation
Bonatti E. et al., ISMAR Bologna TECHNICAL REPORT N. 94

5
process which increases brine-seawater methane fluxes most likely are combined with a reductionof Mn-oxides/ hydroxides [Schmidt et al.(2003)].
The Red Sea water is controlled by high evaporation rates, low rainfall and low runoff watersfrom wadis (seasonal streams), which yields to an average salinity of 40.5 PSU and temperaturesranging between 23-32 � C in surface waters. Strong currents and atmospheric pressure gradientscontrol the influx of less saline and colder water from the Gulf of Aden through the Strait of Bab alMandeb during winter. The north-heading current mixes with a south-heading wind-driven surfacecurrent from the northern Red Sea. A thermocline at a water depth of about 200-400m separatesthe mixing water zone from Red Sea Deep Water at relatively stable temperature and salinityconditions. The nutrient distribution in the Red Sea is not well known and surface waters aregenerally depleted in nutrients [Ross (1983)]. As waters from the Gulf of Aden are also depletedin nutrients a possible scenario of nutrient supply in winter is the turbulent mixing of the abovedescribed currents and an uplift of nutrient-enriched deeper waters. The maximum turbulentmixing zone is probably in the central Red Sea.
Bonatti E. et al., ISMAR Bologna TECHNICAL REPORT N. 94

6
3 CRUISE SUMMARY
SHIP: R/V UraniaSTART: 2004-12-28 PORT: NAPLESEND: 2005-01-28 PORT: VENICESEA/OCEAN: Red SeaLIMITS: NORTH 28:00.0 SOUTH: 22:00.0 WEST: 33:00.0 EAST: 38:30.0OBJECTIVE: MORPHOBATHYMETRIC, GEOPHYSICAL, GEOLOGICAL ANDOCEANOGRAPHICAL INVESTIGATIONS IN THE NORTHERN RED SEACOORDINATING BODIES: ISMAR-Bologna BOLOGNA (ITALY)CHIEF OF EXPEDITION: Enrico Bonatti (ISMAR-CNR)PARTY CHIEF ISMAR: Marco Ligi (ISMAR-CNR)CONTACT: [email protected]: MORPHOBATHYMETRY, MAGNETICS,SBP, MCS, OCEANOGRAPHY, WATER SAMPLING, SEABED SAMPLINGWORK DONE: 6500 KM2 SURVEY + 2000 KM2 TRANSIT MULTIBEAM,2460 KM MAGNETICS, 2900 KM SBP, 345 KM MCS40 XBT, 12 CTD CASTS, 4 ROSETTE SAMPLES12 DREDGES, 5 GRABS, 1 GRAVITY CORE,ADCP, METEO, SURFACE TEMPERATURE/SALINITY
LOCALIZATION:
2005 Jan 27 14:18:13 ISMAR-CNR-BOLOGNA_CRUISE_RS05_R/V_URANIA_
15˚ 20˚ 25˚ 30˚ 35˚ 40˚20˚
25˚
30˚
35˚
40˚
45˚
Figure 3: Ship track during Cruise RS05. The red dots are XBT stations.
Bonatti E. et al., ISMAR Bologna TECHNICAL REPORT N. 94
7
2005 Jan 26 20:02:39 ISMAR-CNR-BOLOGNA_CRUISE_RS05_R/V_URANIA_Wed Jan 26 20:02:39 CET 2005
34˚ 35˚ 36˚ 37˚ 38˚22˚
23˚
24˚
25˚
26˚
27˚
28˚
EGYPT
S.ARABIA
Thetis Deep
Oceanographer D.
Conrad D.
Coral S.P.
Zabargad I.
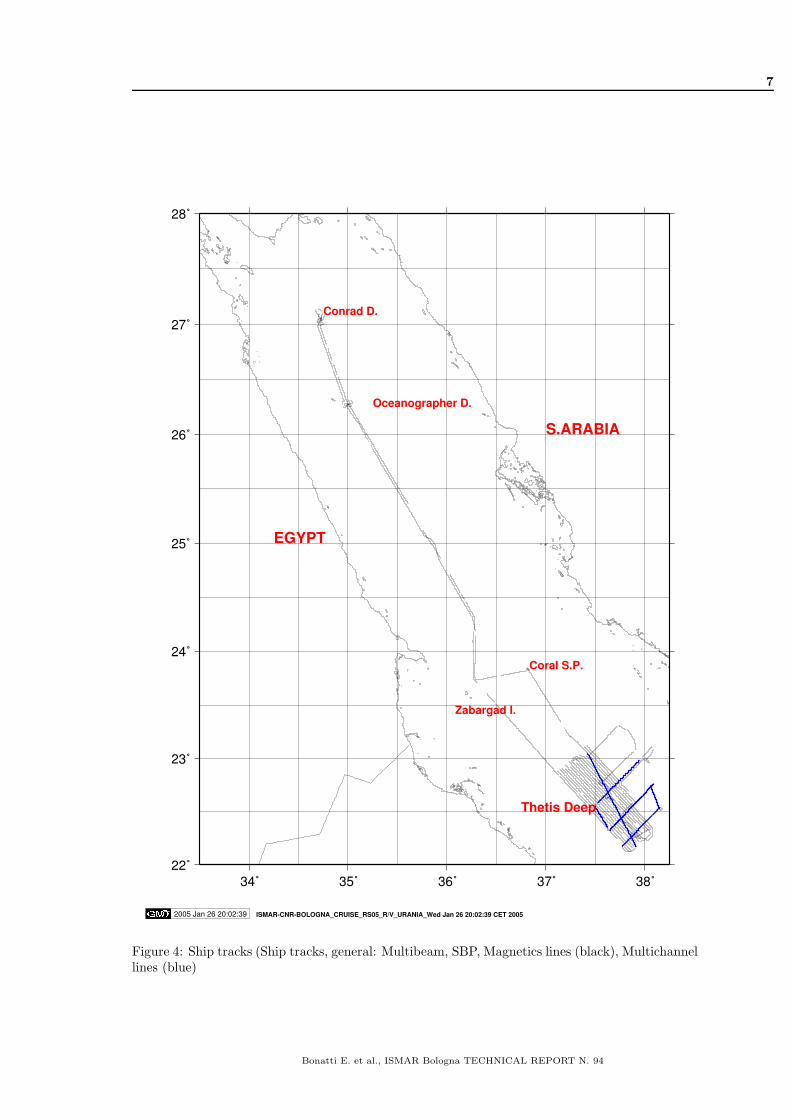
Figure 4: Ship tracks (Ship tracks, general: Multibeam, SBP, Magnetics lines (black), Multichannellines (blue)
Bonatti E. et al., ISMAR Bologna TECHNICAL REPORT N. 94

8
2005 Jan 22 15:10:58 ISMAR−CNR−BOLOGNA_CRUISE_RS05_R/V_URANIA_Sat Jan 22 15:10:58 EET 2005
37˚00' 37˚30' 38˚00'22˚00'
22˚30'
23˚00'
23˚30'
08 00:00:00
10 00:00:00
12 00:00:00
08 18:00:00
10 18:00:00
07 12:00:00
09 06:00:00
17 12:00:00
16 00:00:00
14 00:00:00
15 00:00:00
09 12:00:00
08 06:00:00
14 12:00:00
08 12:00:00
14 18:00:00
11 12:00:0010 12:00:00
14 06:00:00
07 18:00:00
15 06:00:00
11 06:00:00
15 18:00:00
10 06:00:00
12 18:00:0012 06:00:00
11 00:00:00
09 00:00:00
17 00:00:00
13 06:00:00
13 12:00:00
15 12:00:00
16 12:00:00
Figure 5: Ship tracks, Thetis Deep Area: Multibeam, SBP, Magnetics lines (black), Multichannellines (blue).
Bonatti E. et al., ISMAR Bologna TECHNICAL REPORT N. 94
9
2005 Jan 27 12:46:32 ISMAR-CNR-BOLOGNA_CRUISE_RS05_R/V_URANIA_
37˚00' 37˚30' 38˚00'
22˚30'
23˚00'
23˚30'
24˚00'
-2000
-2000-1000
-1000
-1000
-1000
-1000
-1000
-1000
-1000
DR01DR02DR03
DR04DR05DR06
DR07DR08
DR09DR10
DR11
G1G2
G3
G4
C1
B1
CTD-07
CTD-08
CTD-09CTD-10
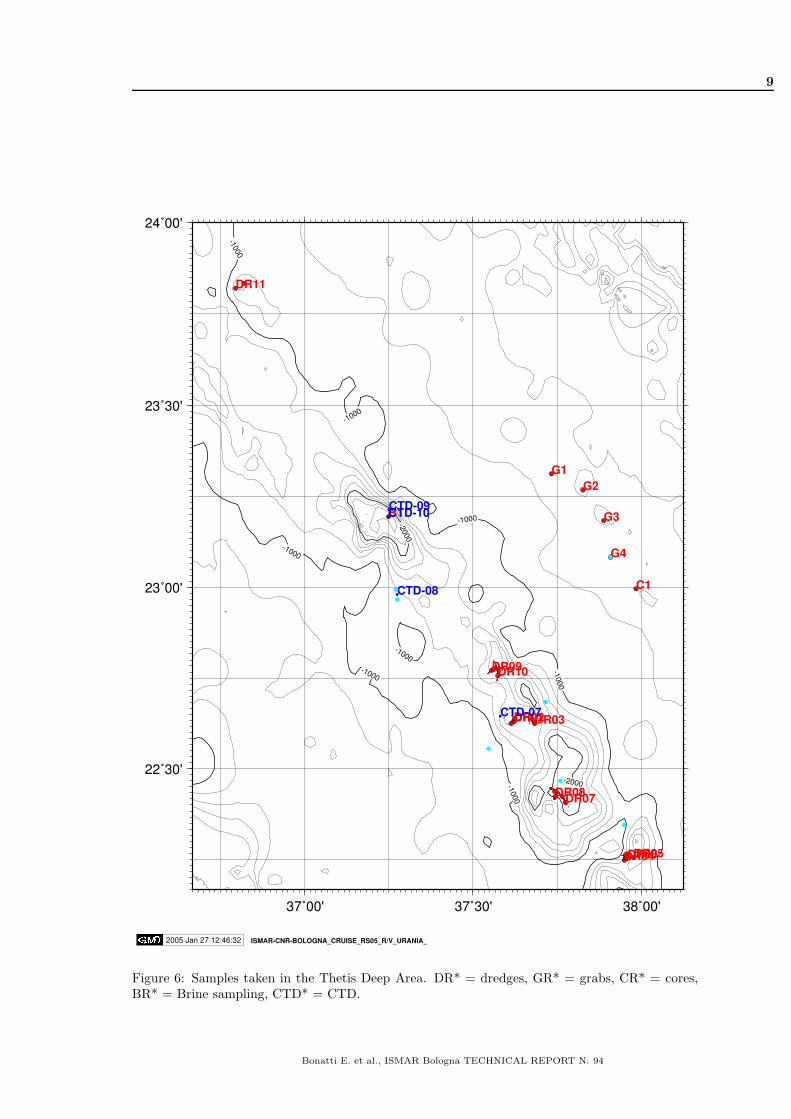
Figure 6: Samples taken in the Thetis Deep Area. DR* = dredges, GR* = grabs, CR* = cores,BR* = Brine sampling, CTD* = CTD.
Bonatti E. et al., ISMAR Bologna TECHNICAL REPORT N. 94

10
2005 Jan 27 12:43:11 ISMAR-CNR-BOLOGNA_CRUISE_RS05_R/V_URANIA_
34˚ 35˚26˚
27˚
-1000
-1000
-100
0
-1000
-1000
-1000
-1000
-1000
-1000
-1000 -1000
-1000
B2
B3
G5CTD-03
CTD-04CTD-05
CTD-06ACTD-06BCTD-11
CTD-12
Figure 7: Samples taken in the Northern Area. DR* = dredges, GR* = grabs, CR* = cores, BR*= Brine sampling, CTD* = CTD.
Bonatti E. et al., ISMAR Bologna TECHNICAL REPORT N. 94

11
SCIENTIFIC AND TECHNICAL PARTIES
PARTICIPANTS ORGANIZATION EXPERTISE tel & email & www
Enrico BONATTI ISMAR Chief Scientist [email protected] LIGI ISMAR Geophysicist [email protected] BORTOLUZZI ISMAR Technician [email protected] LOPEZ CORREA ISMAR Sedimentologist [email protected] FERRANTE ISMAR Geophysicist [email protected] REDINI ISMAR Structural Geologist [email protected] CALAFATO ISMAR Geophysicist [email protected] CIPRIANI LDEO Petrologist [email protected] BARABINO Univ. Roma Petrologist [email protected] CARMINATI Univ. Roma Structural Geologist [email protected] C. MITCHELL Univ.Cardiff Structural Geologist [email protected] SICHLER IFREMER Geophysicist [email protected] SCHMIDT Univ.Kiel Geochemist [email protected] SCHMITT GCA Geochemist [email protected] M. RASUL SGS Marine Geologist [email protected] Mohsen AL-NOMANI SGS Marine Science [email protected] BAHARETH SGS Marine Science [email protected] M. KHALIL Univ.Suez Structural Geologist S [email protected] K. FARAWATI Univ.Jeddah Oceanographer [email protected] GITTO GEI Technician [email protected] www.geitaliana.comMario RASPAGLIOSI SOPROMAR Technician [email protected] SHAWKY Egyptian Navy Observer [email protected] M. AL-HAZMI S.Arabian Navy Observer [email protected]
Table 2: Scientific and technical parties
Figure 8: R/V Urania .
Bonatti E. et al., ISMAR Bologna TECHNICAL REPORT N. 94

12
4 MATERIALS AND METHODS
The research cruise was carried out by the 61 meter R/V Urania (Fig.8), owned and operated bySO.PRO.MAR. and on long-term lease to CNR.
The boat is normally used for geological, geophysical and oceanographical work in the Mediter-ranean Sea and adjoining waters, including but not limited to, the Atlantic Ocean, the Red Sea,and the Black Sea.
R/V Urania is equipped with DGPS positioning system, single-beam bathymetry and integratedgeophysical and oceanographical data acquisition systems, including ADCP, CHIRP SBP and otherSonar Equipment. Additional equipment such as MBES systems can be accommodated on the keelby sub work.
The survey was planned to carry out the following tasks
� MBES with a high resolution multibeam, capable of investigating the sea bottom down todepths between 2300 and 2500 m,
� SV measurements either by CTD probe or XBTs,
� Magnetic investigations,
� SBP investigation
� Multichannel reflection Seismic
� Water and brine sampling from the Deeps
� Dredging and sediment sampling (core and grab)
In addition to these main operational activities, routine on-the-way measurements (ADCP,meteo, surface C/T, etc) were acquired.
The areas to investigate were :
A the Conrad Deep
B the Oceanographer Deep
C the Thetis Deep
D the Coral Sea Peak
4.1 NAVIGATION AND DATA ACQUISITION
The vessel was set-up for data acquisition and navigation with RESON PDS-2000 and COMM-TECH NAVPRO softwares. Two workstations were used for
� multibeam, interfacing by a multiserial and Ethernet link a RESON 8160 P1 processor, anOctans MRU and gyrocompass, DGPS receiver;
� magnetics, meteorological station, conductivity/temperature sensors at the keel,DESO echosounders,dredging cable tension and the DGPS receiver.
The latter workstation also collected the navigational data every minute and at different sam-pling rates.
The Positioning system NAVPRO V5.6 provided by Communication Technology (Cesena, Italy)was used. The integrated system used a Microtecnica Gyrocompass, and a Trimble 4000 DifferentialLocator, with a DGPS Satellite link by FUGRO. Instruments were interfaced by a Digiboard MultiSerial I/O.
The datum WGS84 and the UTM projection on 39E (zone 37) were chosen for navigation anddisplay purposes. Timing was set to UTC whereas the acquisition rate was set to 10 secs. TheSBP-CHIRP workstation received the ’VESSEL(0,0)’ positions by the NAVPRO serial output. The
Bonatti E. et al., ISMAR Bologna TECHNICAL REPORT N. 94

13
positions were therefore recorded on the SEGY trace headers. The speed of sound for echosouderATLAS-KRUPP DESO 25 (33Khz) was set at 1535m/sec, with a transducer immersion of 3.8m.
The NAVPRO computer also interfaced an ANDERAA metereological station and a conduc-tivity/temperature sensor at the keel (depth of 3.5m), and the data were collected at the same rateas above.
The navigation system PDS-2000 V2.3.4.35 by RESON was used for Multibeam data acquisi-tion. The system interfaced the RESON 8160 Operator’s console, an OCTANS gyrocompass andMRU, and the Trimble 4000 DGPS receiver.
The RESON 8160 MBES sonar head was positioned by sub on the ship’s keel using a V-shaped steel frame, and the cable’s dry end passed trough a pipe after water-proofness. The soundvelocity probe at the Sonar Head went out of service immediately after departure from Naples.We therefore were bound to use the Conductivity/Temperature data at the keel provided by theANDERAA Metereological Data Logger. The data obtained were converted to speed of sound andinput manually into the Multibeam Console.
An RDI ADCP @300Khz was in operation throughout the research cruise in the Red Sea. Thepositioning and attitude data were provided by a 4 antenna Ashtec GPS.
A Geometrics G811 Magnetometer tow fish was towed 200m astern, on the port side.A seismic source Array was towed 25 m astern, and the first active section of the 48 Ch. seismic
streamer was towed 150 m astern.The instrumental offsets are presented in Fig. 9 and in Tab. 3.
POSITION ALONG ACROSS HEIGHTANTENNA (POS 1) 5.70 1.40 15.0
VESSEL (POS 2) 0 0 0MBEAM 3.00 0.0 -5.00OCTANS 3.35 0.0 -3.40
ECHO SOUNDER 33 5.50 -1.85 -3.80CHIRP -5.50 -0.95 -3.80
CORER -15.10 7.0STERN -47.5 -1.40
GI-GUN ARRAY -65.0 5.0FIRST ACTIVE 48CH -190.0 0.0
MAG -220.0 -3.90
Table 3: Instrumental Offsets on Ship Urania. Point (VESSEL(0,0)) is located on the axis of themast just behind the Command Bridge. The main GPS antenna (primary positioning system) islocated on point POS1.
Bonatti E. et al., ISMAR Bologna TECHNICAL REPORT N. 94

14
ZERO OFFSET −−−−−−−−−−−− VESSEL 0.00 0.00 0.00 ANTENNA GPS −−−−−−−−−−− POS 1 +1.40 +5.70 +15.00 RESON 8160 −−−−−−−−−−−− MBEAM +1.40 +5.70 −5.00 OCTANS −−−−−−−−−−−−−−−−−− MRU 0.00 +3.35 −3.40 OCTANS −−−−−−−−−−−−−−−−− GYRO 0.00 +3.35 −3.40 DESO25 −−−−−−−−−−−−−−−−−− ECHO −1.85 +5.50 −3.80 BENTHOS −−−−−−−−−−−−−−− CHIRP −0.95 −5.50 −3.80 −−−−−−−−−−−−−−−−−−−−−−−− STERN 0.00 −47.50 0.00 −−−−−−−−−−−−−−−−−−−−−−−− CORER +7.00 −15.10 0.00 GEOMETRICS −−−−−−−−−−−−− MAG −3.90 −220.00 0.00 2xGI−GUN −−−−−−−−−−−−−− ARRAY +4.50 −65.00 0.00 STREAMER 48CH −−−−− 1ST ACTIVE 0.00 −190.00 0.00
POS 1MBEAM
ARRAY
1ST ACTIVE
ECHO
CHIRP
OCTANS
MAG
X
Y
____________________________________________
CRUISE RS05 − R/V URANIAX Y Z
CORER
Figure 9: Cruise RS05. Instrumental Offsets on R/V Urania
4.2 CTD, WATER SAMPLING AND SOUND VELOCITY DATA
CTD casts were taken for sound velocity from different sites and from brine and water samplingstations.
The sound velocity profiles were calculated from CTD data obtained data by an SBE Mod.19Plusand ME probes, and by XBT launches data collected by a Sippican Mod. MK21 profiler.
In addition, conductivity/temperature data at the keel were measured continuously on-the-way,while the speed of sound was calculated by the UNESCO/WHOI routine procedures and loggedinto the Multibeam 8160 RESON console. The data was cross-checked against the Sea Bird probe,for compatibility and accuracy.
The position of the CTD and XBT stations are shown in Fig. 6 and 7, and are reported inTable 4 and 5.
The Sound Velocity profiles were used for real-time acquisition and post-processing.
4.2.1 WATER SAMPLING
Water and brine sampling was performed with a Hydrobios-rosette equipped with 12x10 L Niskinbottles and a CTD (SeaSunTechnology, Trappenkamp)(Fig.10). The CTD records temperature,sound velocity, transmission, and water depth (pressure given in dbar). Based on past experience,contamination of water samples was avoided by slowly approaching the brine from the top andsampling the upper part of brine-seawater interface before sampling the lower part. The samplinginterval was 1-2 m (Tab.4) using Niskin bottles and a relative error of 0.5 m was estimated bypressure change during release of the bottles.
Bonatti E. et al., ISMAR Bologna TECHNICAL REPORT N. 94

15
Station Area Longitude Latitude Btl Depth Depth Temp Depth Remarks
(E) (N) (db) RL(m) ( C) Max(m)
CTD-4 Conrad 34 43.764’ 27 03.743’ ProfileCTD-5 Conrad 34 43.764’ 27 03.743’ 1 25 25 23.7 1500 ProfileCTD-6a Oceanographer 35 00.306’ 26 16.65’ 1 200 1475 P/S NUT/TRE
2 1503 97.5 100 22.094 72.5 75 22.595 48.3 50 22.96 23.5 25 23.757 9.5 10 23.358 5 5
CTD-6b Oceanographer 35 00.310’ 26 16.661’ 9 999 1000 21.63 1535 P/S NUT/TRE10 1347 1350 21.711 1364 1365 21.7312 1388 1390 21.77
CTD-7 Thetis-I 37 34.862’ 22 38.730’ 1 1967 1965 21.8 1965 P/S NUT/TRE/GAS2 994 1000 21.593 697 700 21.564 496 500 21.555 245 250 21.746 193.5 200 227 124.5 130 23.038 95 100 25.29 86 90 25.610 46 50 25.2511 21 25 25.2412 6.2 10 25.23
CTD-8 Thetis-II 37 16.30’ 22 58.51’ 1185 PCTD-9 Nereus Deep 37 15.00’ 23 12.82’ 1 494 500 21.58 P/S NUT/TRE/GAS
2 244 250 22.173 195 200 23.194 144 150 24.135 95 100 24.246 84 90 24.237 45 50 24.228 20 25 24.319 5 10 24.72
CTD-10 Nereus Deep 37 14.93’ 23 11.63’ 1 2440 2423 22.59 2460 P/B TRE/GAS2 2440 2423 22.593 2443 2426 22.94 2445 2429 24.15 2452 2432 26.16 2463 2442 30.257 2471 2453 29.968 2471 2453 29.969 2469 2451 29.2311 2410 2392 21.9212 1007 1000 21.6
CTD-11 Oceanographer 35 00.259’ 26 16.724’ 1 1429 1420 21.86 1560 P/B TRE/GAS2 1434 1425 21.913 1437 1428 21.944 1444 1435 22.715 1448 1438 23.746 1450 1440 24.27 1474 1460 24.868 1497 1480 24.889 1520 1500 24.8810 1544 1520 24.8911 1555 1530 24.912 1570 1555 26.46
CTD-12 Conrad Deep 34 43.790’ 27 03.757’ 1 1000 1000 21.62 1505 P/B TRE/GAS2 1478 1475 21.73 1480 1477 21.74 1486 1483 21.895 1488 1485 22.666 1493 1488 22.967 1494 1490 22.978 1506 1500 23.029 1506 1500 23.0210 1500 1495 22.9711 1484 1480 21.712 18 20 22.55
Table 4: RS05 CTD Stations location and description. P=Profile, S or B Water or Brine Sampling.TRE=Trace elements, NUT=Nutrient, GAS=Gas analyses.
Bonatti E. et al., ISMAR Bologna TECHNICAL REPORT N. 94
16
LON LAT DATE TIME TYPE S/N15:46.400E 39:19.599N 2004-12-29 15:29:51 T-7 0092892217:40.335E 37:51.095N 2004-12-30 09:46:31 Fast-Deep 0000432719:59.730E 37:14.230N 2004-12-30 21:25:05 Deep-Blue 0094656020:19.861E 37:09.566N 2004-12-30 23:07:51 Deep-Blue 0094655920:40.373E 37:01.333N 2004-12-31 01:02:06 Deep-Blue 0094662821:00.668E 36:52.230N 2004-12-31 03:09:25 Deep-Blue 0094662721:21.918E 36:43.019N 2004-12-31 05:20:39 Deep-Blue 0094662921:40.334E 36:34.680N 2004-12-31 07:08:04 Deep-Blue 0094663022:00.273E 36:26.345N 2004-12-31 08:54:45 T-5 0031354122:20.276E 36:16.849N 2004-12-31 10:42:23 T-5 0031354222:39.802E 36:02.874N 2004-12-31 12:43:37 T-5 0031353722:59.979E 35:43.767N 2004-12-31 15:04:47 Deep-Blue 0094711323:20.163E 35:24.268N 2004-12-31 17:20:58 Deep-Blue 0094711423:40.350E 35:10.433N 2004-12-31 19:21:50 Deep-Blue 0094711528:00.538E 33:28.614N 2005-01-01 17:25:21 T-5 0031354328:22.678E 33:20.556N 2005-01-01 19:10:42 Deep-Blue 0094711928:40.208E 33:13.937N 2005-01-01 20:26:33 Deep-Blue 0094711828:50.392E 33:09.614N 2005-01-01 21:15:00 Deep-Blue 0094712329:05.118E 33:02.725N 2005-01-01 22:31:02 Deep-Blue 0094675629:20.100E 32:56.200N 2005-01-01 23:51:38 Deep-Blue 0094712229:40.420E 32:47.894N 2005-01-02 01:41:53 Deep-Blue 0094711736:15.867E 23:46.370N 2005-01-06 22:36:14 Deep-Blue 0094712136:10.563E 23:47.902N 2005-01-07 09:16:27 Deep-Blue 0000000037:50.550E 22:07.460N 2005-01-07 16:06:14 Deep-Blue 0094663437:32.785E 22:33.345N 2005-01-08 19:32:06 Deep-Blue 0994664237:16.243E 22:59.628N 2005-01-10 16:26:05 Deep-Blue 0094676037:16.243E 22:59.628N 2005-01-10 16:26:05 Deep-Blue 0094676037:16.486E 22:58.000N 2005-01-11 21:39:16 Fast-Deep 0000432637:42.990E 22:41.040N 2005-01-12 18:38:02 Deep-Blue 0094664337:45.590E 22:28.030N 2005-01-13 17:59:46 T-5 0031353637:54.550E 23:04.980N 2005-01-14 07:54:57 T-7 0102927837:56.940E 22:20.730N 2005-01-16 18:08:59 T-7 0102927436:29.010E 23:45.740N 2005-01-18 03:58:15 Deep-Blue 0094663530:28.402E 33:53.222N 2005-01-22 16:10:40 T-5 0031353429:49.800E 34:24.330N 2005-01-22 21:09:04 Deep-Blue 0094675529:25.453E 34:40.598N 2005-01-23 00:03:36 Deep-Blue 0094663628:57.000E 34:57.000N 2005-01-23 03:28:13 Deep-Blue 0094675428:34.848E 35:10.686N 2005-01-23 05:54:17 T-5 0031353528:02.708E 35:27.790N 2005-01-23 10:14:55 Deep-Blue 0094664026:25.452E 35:33.976N 2005-01-23 21:34:27 T-7 0102928024:08.736E 37:20.227N 2005-01-24 13:36:59 T-4 0032020322:42.227E 38:04.779N 2005-01-24 23:29:33 T-7 0102928120:21.568E 38:43.975N 2005-01-25 12:29:44 Fast-Deep 0000433119:35.902E 39:29.953N 2005-01-25 17:56:59 Deep-Blue 0094663919:10.621E 40:00.241N 2005-01-25 21:22:49 Deep-Blue 0094663818:59.841E 40:14.656N 2005-01-25 23:00:03 T-7 0102927618:46.978E 40:30.038N 2005-01-26 00:46:03 T-7 0102923718:29.521E 40:48.830N 2005-01-26 03:07:25 T-7 0102927518:04.756E 41:02.411N 2005-01-26 05:38:32 T-7 0102927117:45.130E 41:15.000N 2005-01-26 07:42:48 T-7 0102927717:22.950E 41:32.941N 2005-01-26 10:08:51 T-7 0102927217:04.750E 41:49.521N 2005-01-26 12:11:59 T-7 0102927316:23.834E 42:27.431N 2005-01-26 17:04:39 T-4 0032019815:30.885E 43:31.436N 2005-01-27 00:49:52 T-4 00320202
Table 5: Cruise RS05: XBT launches data.
Bonatti E. et al., ISMAR Bologna TECHNICAL REPORT N. 94

17
Hydrocarbon gas concentrations and isotope measurements
Water and brine samples were taken for CH4 concentration measurements. Immediately afterthe water rosette was on deck the water was transferred into 1 liter glass bottles which subse-quently were degassed onboard using an ultrasonic vacuum system [Schmitt et al.(1991)], Fig.11.The dissolved gas is stored in gas-tight 25 ml glass vials for land-based analyses of hydrocarbonconcentrations using a gas chromatographic system followed by mass spectrometric analyses ofstable carbon and hydrogen isotope compositions [Faber (1998)]. The results will be used to quan-titatively describe CH4 exchange across the brine seawater interface and recognize hydrocarbonoxidation processes. A parallel brine sample of selected depths was degassed and the gas was storedto measure the 14C activity of methane at the Leibniz Institute for Age Dating, Kiel.
Figure 10: Hydrobios Rosette sampler.
Dissolved inorganic carbon and oxygen isotope compositions of brines and seawater
Immediately after recovery of the Niskin bottles water was sampled in 100 ml sample vessels. 0.2 mlof mercury chloride solution was added to each sample in order to prevent further bacterial activity.The samples were then sealed and stored for later land-based analyses. Carbon and oxygen isotopeanalyses of water and DIC will be performed at the Leibniz Institute for Age Dating in Kiel (H.Erlenkeuser).
Bonatti E. et al., ISMAR Bologna TECHNICAL REPORT N. 94

18
Figure 11: Degassing system.
Inorganic trace elements and nutrients
Water and brine samples were filled into 60 ml FEP teflon bottles, pre-washed with HNO3 andwere stored at -20 � C for further analyses (bulk composition and anions) at the Institute ofGeosciences, Kiel. Any contact of the water sample with ambient air was avoided. 500 ml of brinesamples were filtered immediately after sampling (Sartorius filtration device) by using water jetpumps. The samples were filtrated through a 0.2 µ m polycarbonate membrane filter (Nuclepore).The remaining filtrate (125 ml) will be used for the determination of dissolved major (Na, K, Ca,Mg, Si) and trace elemental composition (Li, Rb, Cs, V, Cr, Mn, Fe, Co, Ni, Cu, Zn, As, Sr, Y,Mo, Ag, Cd, In, Sn, Sb, Ba, REE, W, Tl, Pb, Bi, TH, and U) by ETAAS, ICPAES, ICPMS. Afterfiltration of the brine membrane filters were recovered and stored in pre-cleaned polycarbonatepetri-dishes for the determination of particulate elemental composition. A second set of watersamples for nutrient and trace metal analyses was collected in 500 ml acid cleaned HDPE-bottles(cleaned with 1M HCl acid) and stored at -20 � C after collection. These samples will be analyzedat the laboratories of Marine Chemistry Department at King Abdulaziz University, Saudi Arabia.Nutrients will be analyzed using spectrophotometric methods whereas trace metals will be analyzedusing cathodic stripping voltammetry.
4.2.2 CONTINUOUS SURFACE C/T PROFILING
The ship continuously measured the Conductivity and Temperature of the sea water at the keellevel (3.50m) by pumping it to the recording room to ANDERAA sensors and recorded on theNAVPRO navigation software at the selected sampling rate (minimum 1 sample/minute). Theconductivity data were transformed to salinity by the WHOI/UNESCO Oceanographical routines.A rough control with some CTD data evidenced offsets, that were summed to the values used forthe calculation of the speed of sound at the Multibeam Sonar (0.6 PSU).
A better analysis was done later during the survey, taking into account previous cruise data(MEDGOOS9, Oct. 2004, 60 CTD stations). A marked offset was evidenced for the Conductivityvalue, whilst the Temperature values fitted well on the curve. The regression statistics led to theequation Ca = 0.9244 Cc + 3.1056, where Ca is the value read from the ANDERAA, and Cc isthe reference.
Bonatti E. et al., ISMAR Bologna TECHNICAL REPORT N. 94
19
4.3 MULTIBEAM BATHYMETRY
The MBES was the 50 Khz, 126 1.5 � beams, 150 � aperture RESON 8160, capable to acquire dataat a range of 3000 m depth. The sonar data were collected and recorded in realtime on HD bydirect interfacing of the sonar processor P1 to the PDS-2000 software. In addition two data setswere generated and stored on separate computer for backup on HD and CD/DVD. The PDS-2000was able to build a 25 m DTM during the acquisition of the entire surveyed area.
CALIBRATION
The MBES was calibrated in the Thyrrhenian Sea during the previous cruise. The data is presentedin Tab.6. Several lines were acquired during the survey, that will be used as further calibrationcontrol.
8160 RS05roll offset 0.5 �pitch offset 2.0 �heading offset -2.0 �time delay 0.0 s
Table 6: RESON 8160 Multibeam calibration results.
4.4 MAGNETOMETRY
The Geometrics Mod. G-811 was used. The towfish was kept 180 m off the stern. The data wascollected by the NAVPRO workstation on NS lines 2.0-2.5 km apart, including some diagonal lines,as dictated by multibeam coverage and multichannel seismic line patterns.
The following data processing steps were applied:
� extraction of the navigation and total field ASCII data from the NAVPRO data files
� polar transport (220 m distance, angle (hdg-180)) to get the towfish position
� application of the IGRF 2005 to every point
� production of grids in geographical/metric coordinates for QC and analysis (step 0.75 nm/0.5nm and 100 m)
4.5 CHIRP SBP
SBP data was acquired by the 16 transducers, hull mounted BENTHOS (DATASONICS) Mod.CAP-6600 CHIRP-II profiler, with operating frequencies ranging between 2 and 7 Khz. The pulse lengthwas mantained at 20 ms while the trigger rates varied from 0.5 to 4 seconds according to waterdepth. The signal penetration was up to 45 m below the sea floor. Some analog sections wereprinted in real time on a 22” EPC recorder. Digital data were recorded in the SEG-Y format onMagneto-Optical removable disks and hard disk. Backups were loaded on DAT tapes, DVD andCD-ROM. The navigation data was made available to the system by NAVPRO as VESSEL (0,0)at a rate of aproximately 0.5 hz. The position data were recovered from routines developed atISMAR (read_segy) that read the SEGY header to check data integrity and retrieve positioningand recording data. The latter were for producing the navigation map. SEG-Y header and tracedata were also checked with the ISMAR’s software SEISPRO [Gasperini and Stanghellini(2005)].
4.6 SEABED SAMPLING
The sea bottom samples were taken by cylindrical dredges, Van-Veen grab and 1.2 Ton gravitycorer (Fig.12).
Bonatti E. et al., ISMAR Bologna TECHNICAL REPORT N. 94

20
Rocks and sediments collected by dredging were described on board, logged, sub-sampled andstored away as archive and working samples. Some rocks were cut and polished for further anal-yses (thin-sections, microscopic observations, etc.). The sediment from the five grab samplingstations were described, logged, sub-sampled for bulk mineralogy, bulk biology, clay mineralogy,petrographic analysis and sedimentology. Sediment colour, based on the Munsell Rock Chart waspredominantly 7.5 YR 7/3 Pink and occasionally 10 YR 6/1 Gray. The PVC-liner of the gravitycore was subsequently cut into 1 meter sections and labelled. The core liners will be split for de-talied analysis at the shore-based laboratories. Detailed sedimentological and geochemical studieswill be carried-out at the Saudi Geological Survey, Saudi Arabia and at the Istituto Di ScienzeMarina, Bologna, Italy.
The sample locations are shown in Figg.6 and 7.
Figure 12: Dredge.
4.7 MULTICHANNEL SEISMIC
High resolution multichannel seismic were performed using an array of two synchronized SERCEL(formerly SODERA-SSI) GI-GUN (Fig.13), (in the 105+105 c.i. Harmonic configuration) pneu-matic sources, powered by a 2500 L/Min, electrically driven, Mod. I28 air compressor by BAUER.The pressure to the gun was set to 140 Bar (2500 psi), actually ranging between 125 and 145 Bars.The seismic data were collected by a MOD.29500 TELEDYNE 48 channel streamer (Fig.15), digi-tized and recorded on DDS-1 and DDS-2 DAT tapes by a OYO-GEOMETRICS’s STRATAVISORseismograph in the SEG-D 8048 Revision.0 format, with sampling rate of 1 msec and record lenghtsof 12 secs. The group interval was 12.5m for a total active length of 600 m. The 150 m tow leaderand two 50 m stretch sections made up the streamer to a total length of 850 m. The seismic sourcewas fired by IGM’s gun-control equipment [Masini and Ligi (1995)] (14), that introduced a fixeddelay of 10 msec from the time break, where the injector delay floated around 44.5 msec. Shotdistances were of 50 m, thus achieving coverages of 600%. The time break was provided by theseismic module in the NAVPRO software, with the DISTANCE FROM PREVIOUS SHOT setting,in order to maximize the survey flexibility allowing the SHOT NOW capability when enroute. Thedepth of the source ranged between 5 and 6 m. The streamer was kept at 10-12 m depth withSYNTRON RCL-2 cable-levelers, using a Teledyne Mod. 28951 depth control system.
The data were processed onboard using the DISCO/FOCUS packages by PARADIGM, up tothe time-migration of some sections, using a standard processing sequence.
Bonatti E. et al., ISMAR Bologna TECHNICAL REPORT N. 94

21
Figure 13: GI-GUN Array.
Figure 14: GI-GUN Array Synchronizer.
Bonatti E. et al., ISMAR Bologna TECHNICAL REPORT N. 94

22
Figure 15: Multichannel streamer.
4.8 MISCELLANEOUS
The datum was set to WGS84 and the UTM projection (zone 37) was chosen for navigation anddisplay, and data acquisition. The time zone was set to the local time (UTC+2) for the whole dataacquisition process, except for the SBP data that was recorded in UTC.
The positioning maps and bathymetric images were done with GMT [Wessel and Smith (1995)].The multibeam data were pre processed on board by the PDS-2000, CARAIBES, NEPTUNE andMB-SYSTEM softwares.
Bathymetric data were complimented by the GEBCO data. On-land SRTM topography datawas used for structural analysis, after conversion to NETCDF GMT grid files.
The computing center used three INTEL based PC running the SUSE GNU-Linux and theMicrosoft Windows 2000 O.S., and two SUN workstations running Solaris 8, in addition to someportable computer for data acquisition and efficient data processing.
Photographs were taken by digital cameras.The Linux machines were used as data repositories using the SAMBA software. A WWW
server on a Linux machine was used to share ongoing information and results.
Bonatti E. et al., ISMAR Bologna TECHNICAL REPORT N. 94

23
5 INITIAL RESULTS
Initial results are presented, in order to address the importance of the preliminary findings andprocessing sequence of the data acquired. As explained in Chapter 4, during the cruise we acquired:
� multibeam bathymetric data
� CTD and SVP casts ranging from 0 to 1800 m water depth.
� magnetometric data
� MCS
� SBP
� Current meter data
� water samples
� bottom samples (dredges, grabs, cores)
5.1 BATHYMETRY
Pattern of the multibeam lines during the 12 days of operation in the study area are presented inFig.4. A surface of approximately 8500 Km2 was covered in the Thetis, Conrad, OceanographerDeeps and Coral Sea Peak areas. A partial processing of the acquired data by the RESON 8160was carried-out during the cruise with the Caraibes and Neptune softwares. The quality of thedata acquired varied from very good to acceptable, excluding a few lines obtained in bad weatherconditions because of the rough seas. A detailed survey was carried-out in the Thetis Deep areaextending the survey to the south in the transition zone to the Hadarba Deep and to north in thetransition zone to the Nereus Deep, where the eastern margin was also mapped during the watersampling operations and transit to the Coral Seapeak.
The DTM and maps were produced by (a) filtering the UTM-37 25m PDS-2000 DTM data witha batch ISMAR procedure (filter_bat) to eliminate spikes and high-frequency noise, (b) creatingNETCDF grids with the GMT nearneighbor or surface algorithms or straight to with xyz2grd,(c) gaussian filtering, when required, and (d) plotting the maps in the UTM and geographicaldomains (GMT routines complemented by ISMAR routines).
The bathymetry of the Thetis deep shows three asymmetric ”subdeeps” which are smaller andshallower from north to south. The ”subdeeps” are separated by transition zones and are char-acterised by several volcanoes and evaporite-mobilization structures. The structural architectureof the deep is generally formed by a series of fault segments with dominant NW orientation, sub-parallel to the rift axis. These are linked by relay ramps, some of which are breached by localtransfer faults.
The Conrad Deep (Fig.16) shows an elongate shape, oriented parallel to the Aqaba-Dead Seafault, and the Oceanographer Deep (Fig.17), seems to be in some way connected to the Brothersislands, localized and very close right west of the deep.
We have also produced a map of the Nereus Deep by merging the SEABEM data publishedby [Pautot (1983)] with the swaths we collected on the eastern flanks during the station approach,the brine sampling and the transit to N (Fig.(18). Since the SEABEAM data were apparentlycollected with a constant speed of sound of 1500 m/s, we tried to produce the best fit and applyingthe new function to the digitized contours, by
� converting the digitized data to msec (1500 m/sec)
� integrating on the depth interval the sound velocity profile measured during the CTD cast,to obtain an average value
� converting back to depth by applying the above average velocity function
Bonatti E. et al., ISMAR Bologna TECHNICAL REPORT N. 94

24
2005 Jan 10 23:08:12 ISMAR−CNR_−Ju37/1:100000
−1400
−140
0 −130
0
−1300
−1300
−1300
34˚40' 34˚45'
27˚00'
27˚05'
Figure 16: The Conrad Deep. Bathymetry from PDS-2000 DTM 25m.
Bonatti E. et al., ISMAR Bologna TECHNICAL REPORT N. 94

25
2005 Jan 10 00:31:53 ISMAR−CNR_−Ju37/1:75000
−1500−1400 −13
00
−1300
−1200
−1200
−120
0
−1100
−1100
−1100
−1000
−1000
35˚00'
26˚15'
26˚20'
Figure 17: The Oceanographer Deep. Bathymetry from PDS-2000 DTM 25m.
Figure 18: The Nereus Deep. Compilation with the data of [Pautot (1983)] and present survey.
Bonatti E. et al., ISMAR Bologna TECHNICAL REPORT N. 94

26
5.2 SEABED SAMPLING
We focused mainly on dredging, with the aim to recover basalts and fresh volcanic materials.Additional sampling was performed by grab and gravity corer. The location and description of thesamples are located in Tab.7.
Eleven sites were dredged for rock samples from submarine slopes and escarpments in andaround the Thetis Deep. Two dredgers were lost during the operation. Four dredge samplescontained basalts, while practically all other dredges contained abundant carbonate crusts. Thecarbonate crusts consist mostly of pteropods and foraminifera with little or no evidence for cal-careous benthic organisms.
The basalts will be subjected to intense geochemical (major and trace elements, Nd, Sr, Osand other isotopes, water content, melt inclusions) and geochronological analyses, especially on theglasses of the pillows.
Some of the basalt samples show a thick crust of laminated authigenic carbonates, which willbe analysed by isotopic methods and radiometric dating to provide an insight into the processesresponsible for basalt emplacement.
Table 8 gives details on the rock description, subsampling and delivery. These samples will beanalysed for standard geochemical and petrographic analysis.
Grab samples (GR01 to GR04) in the Main Trough to the west (outside) of the Thetys Deep,at depths between 700 and 800 m, revealed carbonate ooze and sands, rich in foraminifera andpteropods, with only little associated macrofauna (Argonauta argo, Cuspidaria sp., etc.).
Grab GR05 at 1196 m water depth at the margin of the main Red Sea trough towards the 1600m deep Conrad Basin reavealed very similar foram/pteropod ooze, pointing to a widely uniformsedimentation in the Main Trough above the axial valley and the aligned central deeps.
The gravity core at 750 m revealed a 3.3 m sequence of carbonate ooze, containing carbonatecrusts. Further analyses (clay mineralogy, micropaleontology and geochemistry) will be taken outafter cutting of the PVC-liner.
Bonatti E. et al., ISMAR Bologna TECHNICAL REPORT N. 94

27
CRUISE RS05 R/V URANIA
ID DATE LON LAT RECOVERY LITHOLOGY
ddmm.xxxx(E) ddmm.xxxx(N) Kg
DR-01 2005-01-11 3737.2507 2237.8982 Bottom
DR-01 2005-01-11 3736.8137 2237.5009 0.01 CCR-100%
DR-02 2005-01-11 3737.3711 2237.8701 Bottom
DR-02 2005-01-11 3737.4949 2238.3749 200 CCR1̃00%;VG
DR-03 2005-01-11 3740.9743 2237.4635 Bottom
DR-03 2005-01-11 3740.4707 2238.2590 80 BAS-100%
DR-04 2005-01-12 3756.9860 2214.8418 Bottom
DR-04 2005-01-12 3756.8966 2215.0812 lost -
DR-05 2005-01-13 3758.6531 2215.3196 Bottom
DR-05 2005-01-13 3757.0000 2215.6667 0.1 CCR-100%
DR-06 2005-01-13 3757.6376 2215.1408 Bottom
DR-06 2005-01-13 3757.5254 2215.7036 1.5 CCR-100%;DSC
DR-07 2005-01-13 3746.4602 2224.4240 Bottom
DR-07 2005-01-13 3745.8987 2225.4049 100 CCR-99%;VG-1%
DR-08 2005-01-13 3744.6801 2225.4528 Bottom
DR-08 2005-01-13 3744.5807 2226.3536 100 CCR-99%;BAS+VG-1%
DR-09 2005-01-13 3733.3787 2246.2928 Bottom
DR-09 2005-01-14 3733.9083 2246.6215 lost -
DR-10 2005-01-14 3734.4479 2245.4369 Bottom
DR-10 2005-01-14 3734.4956 2246.4705 100 CCR-40%;BAS-60%
DR-11 2005-01-19 3649.7052 2349.2532 Bottom
DR-11 2005-01-19 3649.1850 2350.0249 200 CM1̃00%;CCR+VS(?)
GR-01 2005-01-14 3743.9979 2318.7070 full CM
GR-02 2005-01-14 3749.6070 2316.0934 full CM
GR-03 2005-01-14 3753.3277 2310.9918 full CM
GR-04 2005-01-14 3754.5438 2304.9869 full CM
GR-05 2005-01-14 3443.7108 2707.3094 full CM
CR-01 2005-01- 3759.0667 2259.7504 3.3m CM-CCR(bottom)
Table 7: Samples location. DR*=dredges(start,end),GR*=grabs, CR*=core. CCR=CarbonateCrust, VG=Volcanic Glass, BAS=Basalt, DSC=Deep Sea Coral, VS=Volcanic Scoria,CM=Carbonate Mud.
Bonatti E. et al., ISMAR Bologna TECHNICAL REPORT N. 94

28
Sample Type Size(cm) Description subsamples to
DR01-01 CCR 4x3x0.3 consolidated carbonate enriched in pteropods and forams.Layered.
ISMAR
DR02-01 VG very small fragments fresh basaltic glass ISMARDR02-02 CCR various size consolidated carbonate enriched in pteropods and forams. ISMAR-UR-SGSDR03-01 BAS 30x15x20 moderately vesicular pillow basalt. Rare Plagioclase phe-
nocrysts (1%) up to 1 cm in size. Vesicles are empty andup to 4mm in diameter. Fresh glassy crust up to 3 cm inthickness. Outer glassy surface of pillow is coated with thinFe-Mn film. Interiorior fractures of pillow show a concentricalteration and are partly coated with Fe-Mn film.
ISMAR-UR-SGS-SCU
DR03-02 BAS 30x26x6 vesicular basalt (vesicles are empty and up to 0.5 cm in di-ameter), sheet flow. Very rare plagioclase phenocryst (up to3mm). 1 cm thick glassy crust coated with thin Fe-Mn film.Outer surface is then coated with soft light-brown carbonaticsediment.
ISMAR-UR-SGS-SCU
DR03-03 BAS 25x24x9 vesicular basalt (vesicles are empty and 0.1-3 mm in diame-ter), sheet flow slightly fractured. Very rare plagioclase phe-nocryst (up to 3mm). 1 cm thick glassy crust. Thin Fe-Mncoat.
ISMAR-UR-SGS-SCU
DR03-04 BAS 20x20x5 same as 03-03, not fractured ISMAR-UR-SGS-SCUDR03-05 BAS 18x17x4 same as 03-04 ISMAR-URDR03-06 BAS 12x7x6 same as 03-04, but thin glassy crust ISMAR-UR-SGS-SCUDR03-07 BAS 10x7x4 same as 03-02 but 2 cm thick glassy crust ISMAR-URDR03-08 BAS 4 pieces about 10x5x3 vesicular basalt similar to 03-02 with thin glassy crust and
soft sediment encrusting the outer surfaceISMAR-UR-SGS-SCU
DR03-09 BAS 10x7x4 same as 03-07 ISMAR-URDR03-10 BAS 9x6x6 same as 03-06 ISMAR-UR-SGS-SCUDR03-11 BAS 17x11x3 same as 03-02 but no fresh glass URDR03-12 BAS 9 centimetric pieces several pieces of lava flow, tabular with fresh glassy crust.
Samples have been named with progressive letter A to I. A toISMAR, B and C to UR, D to SGS, E to Egypt
ISMAR-UR-SGS-SCU
DR03-13 BAS bag of several small pcs. several pieces of lava flow, tabular with fresh glassy crustDR05-01 CCR 3 pieces small fragments of pteropods-rich carbonate crusts ISMAR-UR-SGSDR06-01 CCR various size ISMAR-UR-SGS-SCUDR07-01 VG very small fragments few small fragments of fresh basaltic glass ISMARDR07-02 CCR various size ISMAR-UR-SGSDR08-01 BS 15x10x8 slightly vesicular basalt with a 1 cm thick fresh glassy crust.
The outer surface is covered by a 1 cm thick layered carbonatecrust.
ISMAR-UR
DR08-02 VG very small fragments several small fragments of fresh basaltic glass ISMARDR08-03 CCR various size ISMAR-UR-SGSDR10-01 BAS 30x30x30 porphyric pillow basalt. Phenocrysts of Olivine up to 0.7 cm
and Plagioclase up to 0.5 cm. Visible melt inclusions in bothOl and Plg. 1 to 2 cm. Rare very small vesicles. Thick glassycrust partly coated with a thin Fe-Mn crust.
ISMAR
DR10-02 BAS 22x16x11 slightly vesicular basalt with 0.5 to 1 cm thick fresh glassycrust. The basalt is moderately altered. The outer surface iscovered with a thick carbonatic layer which looked crystallizedcalcite or aragonite. The carbonatic layer is itself covered witha < 1 mm thick Fe-Mn crust. a smaller similar piece has beennamed 10-02b
ISMAR-UR
DR10-03 BAS 17x13x6 Plg-Ol poprhyric glassy basalt similar to 10-01 but tabular,either a sheet flow or the outer thick crust of a pillow .
ISMAR-UR-SGS-SCU
DR10-04 BAS 14x10x4 same as 10-03 ISMAR-UR-SGS-SCUDR10-05 BAS 8x6x5 same as 10-01 ISMAR-URDR10-06 BAS 7x4x4 same as 10-01 ISMAR-URDR10-07 BAS 6x6x1.5 same as 10-03 ISMAR-URDR10-08 CCR various size ISMAR-UR-SGSDR11-01 VS(?) very small fragments ISMARDR11-02 CCR various size ISMAR-UR-SGS
Table 8: Rock description, subsampling and destination. CCR=Carbonate Crust, VG=VolcanicGlass, BAS=Basalt, DSC=Deep Sea Coral, VS=Volcanic Scoria.
5.3 MAGNETOMETRY
The data were processed on board. The IGRF reduced data ranged from -900 to slightly above1000 nT. Further processing will require the analysis of the closest observatory data. Figure 19shows one day of data collected against the data of two INTERMAGNET observatories.
Bonatti E. et al., ISMAR Bologna TECHNICAL REPORT N. 94
29
2005 Feb 15 14:00:42 ISMAR-CNR_RS05
39500
40000
40500
41000
nT
21 00 03 06 09 12
Figure 19: Example of the data collected during the cruise (median filtered, window 60 sec). Alsoshown the unfiltered data from the INTERMAGNET observatories of Addis Abeba (Ethiopia,long.38.77, alt.2400m), red line, and of Qsaybeh (Lebanon, long. 35.6, alt. 540m), blue line. Theobservatory data have been offset to the mean value of 40500 nT for comparison.
5.4 SBP
A quick processing with SEISPRO was made on board to improve the signal/noise ratio by applyinga linear gain ranging from 1 to 5. Example of the recorded and processed data is shown in Fig.20.
The data ranged from good to acceptable. Chirp profiles show the first tens of meters ofsedimentation (where sediments are present, especially outside the deeps), major evaporite mobi-lization, fault scarps, and oceanic-type seafloor, highlighted mainly in the deeps by many diffractionhyperbolae.
Figure 20: Example of SEISPRO SEG-Y SBP reprocessed data.
Bonatti E. et al., ISMAR Bologna TECHNICAL REPORT N. 94

30
5.5 OCEANOGRAPHY
The CTD station descriptions are presented in Tab.4, whilst the more interesting CTD/XBT dataare presented in Fig. 21.
-2500
-2400
-2300
-2200
-2100
-2000
-1900
-1800
-1700
-1600
-1500
-1400
-1300
-1200
-1100
-1000
-900
-800
-700
-600
-500
-400
-300
-200
-100
0D
epth
(m)
21 22 23 24 25 26
T(Celsius)
-2500
-2400
-2300
-2200
-2100
-2000
-1900
-1800
-1700
-1600
-1500
-1400
-1300
-1200
-1100
-1000
-900
-800
-700
-600
-500
-400
-300
-200
-100
0D
epth
(m)
40 41 42S(PSU)
Figure 21: Temperature and Salinity plot of CTD (red, blue) and XBT (green) casts.
5.5.1 SURFACE TEMPERATURE AND SALINITY
The data recorded by the NAVPRO navigation system were used to produce maps of the surfacetemperature and salinity (at 3.5 m below the sea level). Figure 22 shows the results in the ThetisDeep area. These results, though at a low level of spatial and temporal synopticity, may be usefulfor oceanographic studies and for the reprocessing of the multibeam data set.
Bonatti E. et al., ISMAR Bologna TECHNICAL REPORT N. 94

31
24.024.525.025.526.026.527.0
T
39.5039.50
39.50
39.50 39.50
39.5039.50
39.50
39.5
0
39.50
39.50
39.50
39.5
0
39.50
39.50
39.5039.50
39.50
39.50
39.50
39.5
0
39.50
39.5
0
37˚00' 37˚30' 38˚00'22˚00'
22˚30'
23˚00'
Figure 22: Surface temperature and salinity in the Thetis Deep. From 2005-01-07 to 2005-01-15.Salinity data corrected with the procedure explained in 4.2.2
5.5.2 WATER SAMPLING
Brine detection
A brine pool in the Conrad Deep (27N), first discovered by [Ehrhardt and Hubscher (2002)], wasproven and could be identified by CTD-data (Stations 4, 5, and 12 in Tab.4). The brine pool islocated at the center of the Conrad Deep with a maximum thickness of about 30 m (Fig.16). Thesound velocity increases at 1485 m water depth from 1540 to 1780 m/s within a small interface of1-2m (21). The temperature of the brine is 23.5 � C. Light transmission signal is scattered withinthe brine/seawater interface of about 4 m probably reflecting particles precipitated or settled atthe density and redox gradients.
The brine pool in the Oceanographer Deep is also located in the center of a depression at about26N, E of the Brothers Islets. The thickness of the brine is about 100m and the brine/seawaterinterface is between 1432 and 1436m water depth. A temperature of 24.9 � C and a sound velocityof 1803m/s were measured in the brine and the scattered light transmission was detected at thebrine/seawater interface (CTD-6 and 11). A second small bottom near 26.5 � C warm brine layercould be detected in the temperature and transmission profiles from CTD station 11.
Nereus Deep brine was detected at the north-east flank of a depression at stations CTD-9and -10. The small brine pool shows less dense characteristics (Sound velocity 1780 m/s) andtemperatures of 30 � C are comparable to those found about 30 years before [Bignell and Ali (1976)].
The water column was investigated by CTD-measurements at two isolated depressions whichare separated from the main basin in the Thetis Deep. No brine could be detected by CTD-measurement (CTD-7 and 8).
Bonatti E. et al., ISMAR Bologna TECHNICAL REPORT N. 94

32
Hydrographic profiles
Hydrographic parameters of the water column in the central and northern Red Sea were deter-mined during four hydrocast stations (Tab.4). Sound velocity (m/s), temperature ( � C ), and lighttransmission (%) were recorded with depth (pressure in dbar) from sea surface down to the seafloorwith bottom contact (Fig.21). Northern Red Sea waters show a general decrease in temperaturesfrom surface water temperatures (23.3-25.3 � C ) down to 21.7 � C at about 200 m water depth. Themeasured temperature of 21.7 � C of the Red Sea Deep Water is uniform down to the seafloor.However, if brines are present in depressions at the seafloor the temperature rises within a thinbrine/seawater interface to higher temperatures in the brine. Surface waters are slightly warmer(24.3 � C ) in the central Red Sea at 22- 23N than in the Northern Red Sea between 26 and 27N(23.4-24 � C ). A prominent thick layer of less saline and cold water compared to the underlyingwater mass was detected in the Central Red Sea Area. The upper water mass is possibly derivedfrom the north-heading current with waters from the Strait of Bab el Mandeb.
6 CONCLUSIONS
During a 14 days (of total 29 including transits) cruise in the Northern Red Sea we obtained:
1 high resolution bathymetric images and DTMs of the area
2 a detailed grid of high resolution CHIRP-SBP profiles to examine fault traces and sedimentaryprocesses
3 across and along basin multichannel reflection seismic lines
4 bottom samples (dredges, grab, cores)
5 oceanographic data and water sampling, including brines
The data is under detail processing and analysis, and we expect to have new insights into theRed Sea geology and geochemistry.
No problem have to be reported about people and environment.
Bonatti E. et al., ISMAR Bologna TECHNICAL REPORT N. 94

REFERENCES 33
References
[Anschutz and Blanc (1996)] Anschutz P. and Blanc G. , Heat and salt fluxes in the Atlantis IIDeep (Red Sea), 1996, Earth Planet. Sci. Lett. 142, 147-159.
[Bignell and Ali (1976)] Bignell R.D. and Ali S.S. Geochemistry and Stratigraphy of Nereus Deep,Red Sea, 1976, Geol. Jb. D17, 173-186.
[Bonatti (1985)] Bonatti E., Punctiform initiation of seafloor spreading in the Red Sea duringtransition from a continental to an oceanic rift, 1985, Nature, 316, 33-37.
[Bonatti et al.(1981)] Bonatti E., Hamlyn P. and Ottonello G., Upper mantle beneath a youngoceanic rift: Peridotites from the island of Zabargad (Red Sea), 1981, Geology, 9. 474-479.
[Bonatti et al.(1984)] Bonatti E, Colantoni P, Della Vedova B, Taviani M., Geology of the Red Seatransitional region (22N-25N), 1984, Oceanologica Acta, 7,4, 385-398.
[Bosworth and McClay(2001)] Bosworth W. and McClay K., Structural and stratigraphic evolu-tion of the Gulf of Suez rift: A review, In: Ziegler P.A., Cavazza W., Robertson A.H.F. andCrasquin-Soleau S. (Eds), 2001. Peri-Tethys memoir 6: Peri-Tethyan Rift/Wrench Basins andPassive Margins. Memoirs du Meuseum National d’Histoire Naturelle de Paris, 186, 567-606.
[Cochran (1983)] Cochran, J.R., A model for development of the Red Sea, 1983, American Asso-ciation of Petroleum Geologists Bulletin, v. 67, p. 41-69.
[Ehrhardt and Hubscher (2002)] Ehrhardt A. and Hubscher C. Geophysics, 2002, in: Meteor-Berichte 03-2 (Eds. Ptzold et al.), 7-18.
[Faber (1998)] Faber E., Botz R., Poggenburg J., Schmidt M., Stoffers P., and Hartmann M.Methane in Red Sea brines, 1998, Organic Geochemistry, 29(1-3), 363- 379.
[Gasperini and Stanghellini(2005)] L.Gasperini, G.Stanghellini, SEISPRO, a processing softwarefor high resolution seismic data, 2005, ISMAR Tecnical Report, N. , in preparation.
[GEBCO (2003)] IHO-UNESCO, General Bathymetric Chart of the Oceans, Digital Edition, 2003,www.ngdc.noaa.gov/mgg/gebco.
[Ghebreab (1998)] Ghebreab W., Tectonics of the Red Sea reassesed, 1998, Earth Science Reviews,45,1-44.
[Khalil and McClay (2001)] Khalil S. and McClay N., Tectonic evolution of the Northwestern RedSea - Gulf of Suez Rift system, 2001, In: Wilson R.C.L., Whitmarsh, R.B., Taylor, B., andFroitzheim (Eds), Non-Volcanic Rifting of Continental Margins: A comparison of evidencefrom land and sea. Special Publication, Geological Society of London, 187, 453-473.
[Khalil and McClay (2002)] Khalil S.M. and McClay K.R., Extensional fault-related folding,northwestern Red Sea, Egypt, 2002, Journal os Structural Geology, 24, 743-762.
[Masini and Ligi (1995)] Masini L. and Ligi M., Sistema di controllo e sincronizzazione cannonisismici ad aria compressa, 1995, Rapporto Tecnico IGM N.37, 126pp.
[McClay et al.(2001)] K.R. McClay, T. Dooley, R. Gloaguen, P. Whitehouse and S. Khalil 2001.Analogue modelling of extensional fault architectures: comparison with natural rift fault sys-tem, 2005, In: Hill, KC. and Bernecker, T., (Eds), East Australian Basins Symposium, TheAustralian Institution of Mining and Metallurgy, 573-584.
[Pautot (1983)] Pautot G. , Red Sea Deeps, a geomorphological study by Seabeam, OceanologicaActa, 6,3,235-244, 1983.
[Rosendahl (1987)] Rosendahl B.R., Architecture of continental rift with special reference to EastAfrica, 1987, Ann. Rev. Earth Planet. Sci, 15, 445-503.
Bonatti E. et al., ISMAR Bologna TECHNICAL REPORT N. 94

REFERENCES 34
[Ross (1983)] Ross D.A. The Red Sea, 1983, in: Estuaries and Enclosed Seas (ed. Ketchum B.H.).Elsevier Scientific Pub., Amsterdam, 293-307.
[Schmidt et al.(2003)] Schmidt M., Botz R., Faber E., Schmitt M., Poggenburg J., Garbe-SchnbergD., and Stoffers P., High-resolution methane profiles across anoxic brine-seawater boundariesin the Atlantis-II, Discovery, and Kebrit deeps (Red Sea), 2003, Chemical Geology 200, 359-376.
[Schmitt et al.(1991)] Schmitt M., Faber E., Botz R., and Stoffers P.Extraction of methane fromseawater using ultrasonic vaccum degassing, 1991, Anal. Chem. 63, 529-532.
[Wessel and Smith (1995)] Wessel P. and Smith W.H.F., New version of the Generic Mapping Toolreleased, EOS Trans. AGU, p.329, 1995, see also URL: gmt.soest.hawaii.edu.
[Younes and McClay (2002)] Younes A.I. and McClay K, Development of accomodation zones inthe Gulf of Suez-Red Sea rift, Egypt, 2002, AAPG Bull., 86 (6), 1003-1026.
Bonatti E. et al., ISMAR Bologna TECHNICAL REPORT N. 94