national neonatal-perinatal database
TRANSCRIPT

NNPD 2002-03
Nodal Centre : AIIMS, New Delhi 1
NNNaaatttiiiooonnnaaalll NNNeeeooonnnaaatttaaalll---PPPeeerrriiinnnaaatttaaalll
DDDaaatttaaabbbaaassseee
Report 2002-2003
NNNNPPDD NNEETTWWOORRKK Supported by
Indian Council of Medical Research New Delhi

NNPD 2002-03
Nodal Centre : AIIMS, New Delhi 2
January 2005 Compiled & Published by
NNPD Nodal Center at Department of Pediatrics, WHO Collaborating Centre Newborn Training & Research, All India Institute of Medical Sciences, New Delhi for National Neonatology Forum NNPD Network, India. The publication is supported with funds provided by Indian Council of Medical Research. Its contents are solely the responsibility of the authors and do not necessarily reflect the views of ICMR. The document is for general distribution. All rights are reserved. Subject to due acknowledgement, this document may, however, be reviewed, abstracted, reproduced or translated in part or in whole. For more information
Contact Dr A K Deorari, Department of Pediatrics, WHO Collaborating Centre Newborn Training & Research, All India Institute of Medical Sciences, Ansari Nagar, New Delhi-110029. Tel:(011) 26593619, Fax:(011) 26588641; email: [email protected]. Printed by
Chetna (The Complete Business Solution) 9818889018

NNPD 2002-03
Nodal Centre : AIIMS, New Delhi 3
Participating Centers, Investigators and Nodal Center
The List of participating centers and the Coordinator and investigators from
these centers who participated in the NNPD data collection for the year
2002-03, in alphabetical orders are as follows:
Center Investigator All India Institute of Medical Sciences New Delhi
Dr A K Deorari Dr V K Paul Dr Rajiv Aggarwal Dr Ramesh Agarwal
Baroda Medical College & SSG Hospital Vadodara
Dr D J Gandhi Dr Uma S Nayak Dr Sheila Aiyer Dr Mukesh Singh Dr Bakulesh Chauhan Dr Divya Dave
Christian Medical College & Hospital Ludhiana
Dr Manorma Verma Dr Betty Chacko Dr Varughese P V
Christian Medical College & Hospital Vellore
Dr A Jana Dr A Kuruvilla
Government Medical College & Hosptial Chandigarh
Dr. Veena R Parmar
Dr. Chandrika Azad Dr. Suksham Jain Dr. Sunny Narula Dr. Srikant Basu.
Indian Council of Medical Research New Delhi
Dr N C Saxena Dr Reeta Rasailey
Indira Gandhi Medical College Nagpur
Dr D N Balpande Dr Kirtish
Institute of Obstetrics & Gynecology Dr N Saraswathi

NNPD 2002-03
Nodal Centre : AIIMS, New Delhi 4
Chennai Dr A T Arasar Seeralar Dr Rema Chandra Mohan
JIPMER Pondicherry
Dr Vishnu Bhat Dr S Habeebullah Dr S Srinivasan
KEM Mumbai
Dr Rekha Udani Dr Ruchi Nanavati Dr A V Mauskar Dr Naveen Bajaj
KEM Hospital Pune
Dr Anand Pandit Dr Umesh Vaidya Ms Anjali Biswas
KGMC Lucknow
Dr G K Malik
KMC Manipal
Dr.K.K.Diwakar Dr.Ramesh Bhat.Y Ms Yashodamma H S
LTMG, Sion Mumbai
Dr Jayashree A Mondkar Dr Laxman Basani Dr Sreenivas Karnati Dr Manbir Chauhan Dr Amit Jagtap Dr Arjit Mohapatra Dr K Shankarnarayan
Maulana Azad Medical College New Delhi
Dr Siddarth Ramji Dr N B Mathur Dr Ajay Kumar
MS Ramaiah Medical College Hospital Bangalore
Dr.P.P.Maiya Dr. Prashanth. S Dr.Anandababu. M. N.
PGIMER Chandigarh
Dr Anil Narang Dr Praveen Kumar Dr Sourabh Dutta

NNPD 2002-03
Nodal Centre : AIIMS, New Delhi 5
Dr Kanya Mukhopadhyay
St. Johns Medical College & Hospital Bangalore
Dr Swarna Rekha Dr Patricia Lewis Dr Abhay Kumar
SVICH Chennai
Dr S Jayam Dr Kumari Menon Dr Sujatha Dr Shanti Rangarajan Dr Kumar Dr J Kumutha
Experts Clinical Epidemiologist Bio-Statistician
Dr N K Arora Dr V Sreenivas
Nodal Center Department of Pediatrics,
All India Institute of Medical Sciences, Ansari Nagar, New Delhi – 110 029
Faculty Dr. Ashok Deorari Dr. Vinod K Paul Dr. Rajiv Aggarwal Dr. Ramesh Agarwal Dr. Amit Upadhyay Dr. Deepak Chawla Dr. G Girish
Data System Mr Sanjeev Negi
Mr Narender Singhal

NNPD 2002-03
Nodal Centre : AIIMS, New Delhi 6
CONTENTS
Preface …………………………………………………………..i Rational …..……………………………………………………….1 Aim Objectives …………………………………………………..3 Methodology ……………………………………………………..4 Report of 2002-2003 : Salient findings …………………………6 Report on Intramural (Inborn) births ……...…………………14
1.1 Intramural Live births …………………………………..19 1.2 Intramural Still births …………………………………..33
Report on Extramural neonates ………………………………38 NNPD Working Definition ...…………………………………...53 Annexure …...……………………………………………………62

NNPD 2002-03
Nodal Centre : AIIMS, New Delhi 7
PREFACE The National Neonatal-Perinatal Database (NNPD) report for the year 2002-03 is another milestone in the development of Neonatal Health care services in India. The National Neonatology Forum (NNF) first launched this initiative in 1995. This is first time when detailed information on individual babies from all centres was gathered prospectively over two full calendar years. The report will be of considerable help to planners, researchers and healthcare providers, who are committed to improve neonatal health care services in the country.
For the participating institutions, it has been a educative and rewarding experience. A systematic approach for collection of data and team-work has been the hallmark of this effort and we are sure that you will see these reflected in the report.
In the present phase, the NNPD network has functioned with generous funding from Indian Council of Medical Research, New Delhi and this venture has taught us many lessons. In comparison to previous non-funded initiatives, we were able to ensure a much wider coverage with more centers joining the Network. We were also able to ensure that data collection from each centre was fully computerized and there was a qualitative improvement as compared to previous initiatives. We hope that in the coming years, this initiative of networking all the centres that care for newborns in the country would continue and multi-centric studies on priority research issues relevant to our country would be addressed through this Network. We invite your valuable suggestions and constructive criticisms on the report as well as suggestions for future funding.
On behalf of the Faculty of Investigators of the NNPD institutions, we wish to thank each and every consultant, nurse, resident doctor and data entry staff without whose help this mammoth national task of data collection would not have been possible. We would also like to thank all the secretarial staff who has helped in this effort with their secretarial skills.
Editors

NNPD 2002-03
Nodal Centre : AIIMS, New Delhi 8
RATIONALE
1. Improvement in neonatal-perinatal survival is a priority health agenda
in India. Over 1 million newborn infants die every year before
completing first four weeks of life, amounting to the highest burden of
newborn deaths for any country in the world. The current neonatal
mortality rate of 44 per 1000 live births accounts for two thirds of the
infant mortality in India. Likewise, perinatal mortality continues to be
unacceptably high due to maternal undernutrition, anemia and
hypertension; lack of basic antenatal care and deliveries by untrained
personnel.
2. Recognizing the key importance of neonatal-perinatal health, the
Government of India introduced Essential Newborn Care in the Child
Survival and Safe Motherhood and Reproductive and Child Health
programmes. It is an important responsibility of the professionals
engaged in newborn care to provide research inputs that strengthen and
support government efforts.
3. A fundamental pre-requisite for planning, implementing and
monitoring the health care programmes is to ensure an accurate and
ongoing assessment of the morbidity and mortality derived from a
reliable database.
4. Realizing this the National Neonatology Forum developed tools and
protocols for data collection on neonatal-perinatal morbidity and
mortality through workshops supported by the Government of India.
This lead to the establishment of the National Neonatal-Perinatal

NNPD 2002-03
Nodal Centre : AIIMS, New Delhi 9
Database Network in 1995 with the Nodal Centre at AIIMS. A total of
16 centres from all over the country joined hands to provide detailed
information on over 38,000 intramural deliveries in that year. In 2000,
the second cycle of data collection was undertaken. This time 2002-03,
in addition to 18 centres providing data on 151,436 intramural
deliveries, 17 extramural units provided data on 11,026 outborn
admissions.
5. The comprehensive generic data on neonatal morbidity and mortality
was a unique achievement because this was based on the largest
neonatal population representing various states of the country. It also
provided a successful model of multi-centre collaboration on a health
agenda of national importance steered by a professional body.
6. The initiative of the National Neonatology Forum in establishing a
multi-centre Database has been widely acclaimed. The information
generated has been put to academic and operational use.
7. The present report is presented to carry forward this much-appreciated
initiative of the NNF by channeling the Network for providing
programme-relevant insights into the current status of neonatal-
perinatal health.

NNPD 2002-03
Nodal Centre : AIIMS, New Delhi 10
AIM
To strengthen the National Neonatal-Perinatal Database (NNPD) Network for
providing programme-relevant insights into the current status of neonatal-
perinatal health.
OBJECTIVES
The objectives of the present phase of the National Neonatal Perinatal
Database Network are:
1. To generate and disseminate prospective data on neonatal-perinatal
morbidity and mortality among intramural deliveries at the Network
institutions, with focus on :
• Causes of maternal, perinatal and neonatal deaths
• Incidence of LBW and prematurity
• Incidence and outcome of birth asphyxia
• Organisms causing infections in neonates
• Antibiotic resistance pattern of neonatal infections
• Incidence of other morbidity : hypothermia, respiratory distress, hyperbilirubinemia, intraventricular hemorrhage etc.
• Incidence and profile of birth defects
2. To describe the profile of morbidity and mortality of extramural neonatal
admissions at the Network institutions.

NNPD 2002-03
Nodal Centre : AIIMS, New Delhi 11
METHODOLOGY
The members of the NNF Database and other institutions of expertise in
neonatal-perinatal care in the country were approached for their willingness to
be part of this phase of the Network. A total of 18 centres in different states
were identified for the Network.
Preparatory phase (August – December 2001)
During this phase, preparations for computerized data entry on a standardized
performa were made. In August 2001, a meeting of investigators was held to
finalize the methodology for data collection from all the units. In this meeting
the following were decided:
• Data collection forms for intramural births, still births and extramural
births These forms were labeled as Performa A, B and C (see Annexure I,
II, III).
• Standard definitions for common morbidities were finalised. (see Annexure
IV)
• Computerized data entry on individual babies at each centre.
• Computerised data was sent to the nodal center on a monthly basis.
• The software for data collection was composed at the Nodal Center using
MS Access.
• A pilot study using these forms and the software was done at all the
centres and suggestions included.

NNPD 2002-03
Nodal Centre : AIIMS, New Delhi 12
• A document outlining detailed steps for sending computerized data was
also sent to all the centers.
By the last week of December, Data collection forms, MS Access program,
Instruction Manual, Definitions and Report Sending Manual were sent to all
the participating centers.
Data collection phase (January2002 – March 2004) All centers started data collection from 1st January 2002 and sent monthly
data to the nodal centre. This was either sent on floppy diskettes or by e-mail
to the Nodal Center at the All India Institute of Medical Sciences, New Delhi.
At the Nodal Center, quality checks were conducted on the data received and
feedback was sent to the individual centres. After due corrections, data from
all the centres was amalgamated.
The data thus collated was analysed using the Stata 7 statistical software and
Microsoft Excel 97. The database has taken into consideration over about 300
variables while still retaining ease of data collection.
Analysis and report
The results obtained were scrutinized by the Coordinators of the participating
centers and any discrepancy noted was submitted to re-analyses. Part of the
results were presented at a meeting of the investigators held at the ICMR
headquarters on September 23-24, 2004. The final report is being presented
after all the inconsistencies that were noted have been resolved.
NNPD 2002-03
Nodal Centre : AIIMS, New Delhi 13
REPORT FOR THE YEAR 2002-2003: SALIENT FINDINGS Intramural Live-births – Salient Findings
1. Data from a total of 151,436 deliveries are included in this report from
18 centres over a period of two years.
2. There were 145,623 live births, 5,813 stillbirths, and 3,680 neonatal
deaths.
3. Males constituted 52.9% of all live births, females 47.0 %
4. Amongst livebirths, there were 889 females per 1000 males.
5. Majority of livebirths were full-term infants (84.5%); 14.5% were
preterms and a minority (1.0%) were post-term infants.
6. Of the 145,623 livebirths, 31.3% were low-birth-weight infants.
7. Small for gestational age infants formed 9.65% of all livebirths, large
for gestational age 4.92% while 85.4% of infants were appropriate for
gestational age.
8. There were 97.1% singleton births. The remaining 2.9% were multiple
gestations which consisted of 3987 twins, 256 triplets and 2 set of
quadruplets..
9. While 96.5% of infants were discharged home, 2.5% died and 1.0% left
against medical advice.
10. There were 3680 neonatal deaths amongst the 145,623 live-borns, thus
the Neonatal Mortality Rate (NMR) was 25.3 per 1000 live births.

NNPD 2002-03
Nodal Centre : AIIMS, New Delhi 14
11. Of those who died in the neonatal period, 33 % died within 24 hours of
birth, 54.8 % died after 24 hrs but before 7 days of life and 12.2% died
beyond the first week in the neonatal period.
12. Early neonatal deaths accounted for 87.8 % of all neonatal deaths.
13. The percentage of infants delivered by caesarean section was 28.7%.
14. Meconium stained liquor complicated 8.4% of all livebirths while fetal
distress was detected in 4.2%. Prolonged rupture of membranes was
reported in 4.0 %.
15. Of the 145,623 live births for whom data on Apgar scores was
available, scores of <7 at 1 minute were documented in 8.4% while 2.4
% continued to have scores of <7 at 5 minutes of life.
16. Administration of oxygen was the most commonly used resuscitative
measure in 9.5%, followed by bag and mask ventilation in 6.3%.
Intubation for meconium was resorted to in 2.4% while intubation for
indications other than meconium was needed in 1.6%. Chest
compressions were used to resuscitate 0.8% while use of medications
was resorted to in 0.5%.
17. Amongst birth trauma reported, cephalhematoma was the commonest
(0.3 %) followed by cuts (0.1%).
18. Respiratory system morbidity figures indicate the incidence of
respiratory distress syndrome 1.2% and meconium aspiration to be
1.3%, while transient tachypnea was seen in 3.2%.

NNPD 2002-03
Nodal Centre : AIIMS, New Delhi 15
19. Amongst disorders of the central nervous system. Hypoxic ischemic
encephalopathy accounted for 1.4%; seizures 1.0% and Intraventricular
Hemorrhage 0.3 %.
20. The commonest congenital malformations were cardiac in nature
(0.5%) followed by limb defects in 0.3 %.
21. Hyperbilirubinemia was detected in 3.3 % neonates; hypoglycemia in
0.9 %; Retinopathy of Prematurity in 0.1 % while polycythemia was
seen in 0.2 %.
22. Conjunctivitis was the most common superficial infection, affecting
0.9%.
23. The incidence of systemic infection was 3.0 %
24. Of the 1248 isolates, Klebsiella pneumoniae was the most frequently
isolated pathogen (32.5%), followed by Staphylococcus aureus (13.6
%) and Escherchia coli (10.6%).
25. Most strains of Klebsiella pneumoniae showed poor sensitivity to
antibiotics including amikacin (114/365, 31.23%), ceftazidime (24/303,
7.9%), ciprofloxacin (102/381, 26.8%), cefotaxime (88/366, 24.0%)
and gentamicin (82/363, 22.6%). Among the Staphylococcus aureus
isolates, most were sensitive to vancomycin (28/44, 63.6%), and
amikacin (48/121, 39.7%), but not to penicillin (10/110, 9.1%).
26. Antibiotics were used in 12.9%, and oxygen therapy in 8.2% while
phototherapy was given to 5.7% of neonates. Assisted ventilation was
provided to 2.2% and TPN to 0.2% of all neonates.

NNPD 2002-03
Nodal Centre : AIIMS, New Delhi 16
27. The commonest primary cause of neonatal death was perinatal asphyxia
(28.8%). Other major causes were Septicemia /meningitis (18.6%),
Extreme prematurity (26.3%) and congenital malformations (9.2%)
Intramural Still-births – Salient Findings
1. Data from 5813 still-births is presented in this report.
2. Males formed 52.2% of all still-births and females 47.3%
3. Majority of still-births were pre-term (62.7%); 36.5% were term and
0.8% were post-term.
4. Of the 5813 still-births, 76.4% were low-birth-weight.
5. Appropriate for gestational age still-births formed 65.2%, small for
gestational age 31.0% and large for gestational age 3.8% of all still-
births.
6. Normal vaginal delivery accounted for 76.8% of all still-born infants;
2.5% were forceps extractions; 0.6% needed ventouse application while
13.3% were delivered following cesarean sections.
7. The still-birth rate was 38.4 per 1000 births.
8. The Perinatal Mortality Rate was 59.7 per 1000 births.
9. Of all still-births, 60.4% were detected before onset of labour, 35.3%
during labour and 4.3% of still-births were detected only upon delivery.
10. Fresh still-births contributed to 64.3% while macerated ones formed
33.8% of all still-births.

NNPD 2002-03
Nodal Centre : AIIMS, New Delhi 17
11. Asphyxia was the single most important cause of still-births,
accounting for 45.1% of all cases, followed by congenital
malformations seen in 7.9% and infections in 2.7%. The cause of still-
birth could not be established in 43.0% cases.
Extramural Admissions – Salient Findings
A total of 11,026 neonates were admitted to the 17 centers of the Network.
1. The sex distribution was as follows: males 67.2%; females 32.7%, thus
there were only 487 females per 1000 males.
2. At admission, 37.4% of all neonates were < 24 hours of age, 27.9%
were 1 to 2 days of age; 15.9% were between 3 to 6 days of age, 8.8%
were 7 to 13 days of age; 5.8% were 14 to 20 days and 4.4% were 21
days or more of age.
3. In 81.4%, delivery was in a hospital; 16.9% were born at home, 0.7%
elsewhere and in 0.9% cases, the place of delivery was not known.
4. In majority of cases (81.9%) delivery was attended by a doctor. A nurse
or auxillary nurse midwife delivered 1.5% of them, while a Dai
delivered 11.2% of them. Information regarding person conducting the
delivery was not available in 5.4% of cases.
5. Birth weight was less than 2500 g in 52.1% infants, 2500g or more in
39.9% while in 7.9%, birth weight was not available.
6. At birth, 67.7% were assessed to be full term, 31.5% preterm, and
0.8%, post-term.

NNPD 2002-03
Nodal Centre : AIIMS, New Delhi 18
7. Of the different types of birth trauma, cephalhematoma was the
commonest (1.4 %), followed by cuts, seen in 0.2 %.
8. The predominant morbidities among these babies included were:
systemic sepsis (39.7%); hyperbilirubinemia (22.1%); hypothermia
(18.4%); neonatal seizures (18.1%); hypoxic ischemic encephalopathy
(16.0%); hypoglycemia (9.3%); meconium aspiration syndrome (7.9%)
and hyaline membrane disease (6.4%).
9. Conjunctivitis was the most common superficial infection seen in 3.1%
neonates, followed by umbilical sepsis in 2.1 %.
10. Septicemia (88.1%) was the most common clinical category of
systemic infection, while pneumonia was diagnosed in 32.8% of infants
with systemic sepsis. There were 40 cases of tetanus neonatorum.
11. Of the 645 isolates culture positive infants, Klebsiella pneumonia was
the commonest (30.1%), followed by Staphylococcus. aureus (16.2%),
E coli (13%) and Pseudomonas species (9.3%).
12. Most strains of Klebsiella pneumoniae showed poor sensitivity to
antibiotics including amikacin (32/166, 19.3%), ceftizoxime (0/129,
0.0%), ciprofloxacin (43/180, 23.4%), cefotaxime (10/125, 8.0%) and
gentamicin (12/174, 6.7%). Among the Staphylococcus aureus isolates,
most were sensitive to vancomycin (11/28, 32.3%), ciprofloxacin
(27/85, 31.8% ) and amikacin (32/93, 34.4%), but not to penicillin
(1/77, 1.3%).

NNPD 2002-03
Nodal Centre : AIIMS, New Delhi 19
13. The most common therapeutic intervention used for admitted babies
was the administration of antibiotics (84.2%) followed by IV fluid
administration (82%) and oxygen administration (45.3%). Assisted
ventilation was given to 23.6% while 32.9% received phototherapy.
14. The mortality rate of extramural neonates was 16.9 % , while 0.7% left
against medical advice and 13.1% were referred to other
centers/Departments.
15. Admission to time of death was < 24 hours in 10.4%, between 24 and
48 hours in 26.8%, day 3 to 6 in 29.9%, and 7 days or more in 30.7% of
the 1878 infants who died.
16. The commonest primary cause of death was sepsis (37.6 %), followed
by prematurity and related complications in 19.3 % and birth asphyxia
in 18.5%.

NNPD 2002-03
Nodal Centre : AIIMS, New Delhi 20
����������������������� ��
2002-2003
TABLES OF DATA
PART – 1 REPORT ON INTRAMURAL BIRTHS
PART – 2 REPORT ON EXTRAMURAL ADMISSIONS

NNPD 2002-03
Nodal Centre : AIIMS, New Delhi 21
PART – 1 REPORT ON INTRAMURAL BIRTHS
1.1 Intramural Live Birth
1.2 Intramural Still Birth

NNPD 2002-03
Nodal Centre : AIIMS, New Delhi 22
PART - 1 REPORT ON INTRAMURAL BIRTHS
Following 18 centres contributed data on intramural births CENTERS
All India Institute of Medical Sciences New Delhi
Baroda Medical College & SSG Hospital Vadodara
Christian Medical College & Hospital Ludhiana
Christian Medical College & Hospital Vellore
Government Medical College & Hosptial Chandigarh
Indira Gandhi Medical College Nagpur
Institute of Obstetrics & Gynecology Chennai
JIPMER Pondicherry
KEM Mumbai
KEM Hospital Pune
KGMC Lucknow
KMC Manipal

NNPD 2002-03
Nodal Centre : AIIMS, New Delhi 23
LTMG, Sion Mumbai Maulana Azad Medical College New Delhi
MS Ramaiah Medical College Hospital Bangalore
PGIMER Chandigarh
St. Johns Medical College & Hospital Bangalore
SVICH Chennai

NNPD 2002-03
Nodal Centre : AIIMS, New Delhi 24
Panel 1
Major neonatal and maternal outcomes (All -- centres provided data for these indices)
Total births 151,436
Total live births 145,623
Total neonatal deaths 3680 Early neonatal deaths 3230 (87.8%) Late neonatal deaths 426 (11.6%) Post-neonatal deaths (but before discharge)
24 (0.7%)
Neonatal Mortality Rate (NMR) 25.3 per 1000 live births Early Neonatal Mortality Rate – 22.2 per 1000 live births Late Neonatal Mortality Rate – 2.9 per 1000 live births Maternal deaths 93 Obstetric causes 60 Non-obstetric causes 33
Maternal Mortality Ratio 63.8 per 100,000 live births

NNPD 2002-03
Nodal Centre : AIIMS, New Delhi 25
Panel 2 Perinatal outcomes
Total births 151,436
Live births 145,623
Still births 5,813
Early neonatal deaths 3,230
Perinatal deaths 9,043
Still birth rate 38.4 per 1000 births
Perinatal mortality rate 59.7 per 1000 live births
NNPD 2002-03
Nodal Centre : AIIMS, New Delhi 26
1.1 INTRAMURAL LIVE BIRTHS

NNPD 2002-03
Nodal Centre : AIIMS, New Delhi 27
1.1 REPORT ON INTRAMURAL LIVE BIRTHS Table 1 : Sex distribution and gestation group details
Category Number of infants (n = 145623)
Proportion (%)
Sex distribution Males 77034 52.9 Females 68493 47.0 Ambiguous 96 0.1 Gestation groups Preterm (<37 weeks) 21125 14.5 Term 123108 84.5 Post term (>41 weeks) 1390 1.0
Table 2 : Birth weight and Intrauterine growth categories
Category Number of infants (n = 145623)
Proportion (%)
A. Birth weight* Total LBW 45523 31.3
Very low birth weight# 5018 3.4 Extremely low birth weight$ 973 0.7 Neonates <2000 gm
12664 8.7 B Intrauterine growth Small for dates 14054 9.6 Appropriate for dates 124403 85.4 Large for dates 7166 4.9
Table 32 Low birth weight: (<2500 gm) # Very low birth weight: (< 1500 gm) $ Extremely low birth weight: (< 1000 gm)

NNPD 2002-03
Nodal Centre : AIIMS, New Delhi 28
Tables 3 : Details of singletons and multiple live births Category Number of infants
(n = 145623) Proportion
(%) Singletons 141372 97.1 Twins 3987 2.7 Triplets 256 0.2 Quadruplets 8 0.0
Tables 4 : Details of labour and fetal distress
Category Number of infants (n = 145623)
Proportion (%)
Oxytocin use 25314 17.4 Prolonged rupture of membranes 5853 4.0 Meconium stained liquor 12156 8.4 Foul smelling liquor 538 0.4 Fetal distress detected
(a) Fetal bradycardia (b) Fetal tachycardia
4858 1300
3.3 0.9
Tables 5 : Mode of delivery
Category Number of infants (n = 145623)
Proportion (%)
Vaginal delivery 95112 65.3 Cesarean section 41720 28.6 Forceps extraction 5443 3.7 Vaccum extraction 2079 1.4 Others 1269 0.9

NNPD 2002-03
Nodal Centre : AIIMS, New Delhi 29
Table 6 : Apgar scores
Apgar score
At 1 minute No of infants (n = 145623)
At 5 minutes No of infants (n = 145623)
0-3 4100(02.8) 996(00.7)
4-6 8126(05.6) 3291(02.3)
7 or more 133397(91.6) 141336(97.0)
Table 7 : Resuscitation measures used*
Resuscitation measure Number of infants (n = 145623)
Proportion (%)
Free flow oxygen 13878 9.5 Bag-mask ventilation 9111 6.3 Chest compressions 1121 0.8 Overall Intubations
(a) Intubation for meconium (b) Intubation otherwise
5825 3468
2357
4.0 2.4 1.6
Drug(s) 707 0.5
*Resuscitation measures are not mutually exclusive, hence more than one measure may have been used on a given infant.

NNPD 2002-03
Nodal Centre : AIIMS, New Delhi 30
Table 8 : Birth trauma Type of trauma Number of infants
(n = 145623) Proportion
(%) Cephalhematoma 489 0.3 Cuts 197 0.1 Nerve palsies 139 0.1 Subgaleal bleed 240 0.2 Fractures 81 0.1 Intracranial trauma 42 0.0
Table 9 : Respiratory morbidity
Type of morbidity Number of infants (n = 145623)
Proportion (%)
Hyaline membrane disease 1674 1.2 Transient tachypnea 4685 3.2 Meconium aspiration 1896 1.3 Air-leak syndromes 146 0.1
Table 10 : Central nervous system morbidity Type of morbidity Number of infants
(n = 145623) Proportion
(%) Hypoxic ischemic encephalopathy 2075 1.4 Seizures 1501 1.0 Intraventricular hemorrhage 413 0.3

NNPD 2002-03
Nodal Centre : AIIMS, New Delhi 31
Intracranial bleed other than intraventricular 128 0.1
Table 11 : Congenital malformations
Type of malformation Number of infants (n = 145623)
Proportion (%)
Cardiac 715 0.5 Meningomyelocele 207 0.1 Other neural tube defect 90 0.1 Limb defects 472 0.3 Gastro-intestinal 272 0.2 Genito-urinary 360 0.3 Cleft lip/palate 167 0.1 Down syndrome 102 0.1
Table 12 : Miscellaneous morbidity* Morbidity Number of infants
(n = 145623) Proportion
(%) Hyperbilirubinemia 4813 3.3 Hypoglycemia 1306 0.9 Apnea 1026 0.7 Polycythemia 280 0.2 Anemia 768 0.5 Hypocalcemia 396 0.3 Hypothermia 1289 0.9 Rh-isoimmunization 388 0.3 Retinopathy of prematurity 96 0.1

NNPD 2002-03
Nodal Centre : AIIMS, New Delhi 32
PDA 263 0.2 Hemorrhagic disease 124 0.1
Table 32 Not mutually exclusive Table 13 : Superficial infections
Type of infection Number of infants (n = 145623)
Proportion (%)
Conjunctivitis 1346 0.9 Pyoderma 465 0.3 Umbilical sepsis 269 0.2 Thrush 448 0.3
Table 14 : Systemic infections
Category Number of infants (n = 145623)
Proportion (%)
Overall incidence 4360 3.0 Time of onset (n = 3308) Early onset 2219 67.0 Late onset 1046 31.6 Not Specified 43 1.3
Clinical category* Septicemia 3308 2.3 Pneumonia 1578 1.1 Meningitis 463 0.3 Bone/Joint Infection 20 0.0 UTI 24 0.0
Infective diarrhea 24 0.0
Tetanus neonatorum 0 0.0

NNPD 2002-03
Nodal Centre : AIIMS, New Delhi 33
NEC 285 0.2
Table 32 Not mutually exclusive

NNPD 2002-03
Nodal Centre : AIIMS, New Delhi 34
Table 15 : Indicators of conditions of care
Category Number of infants (n = 145623)
Proportion (%)
Outcome Discharged 140572 96.5 Died* 3680 2.5
Neonatal period 3656 2.5 Post-neonatal period (but before discharge) 24 0.0
Left against advise 1232 0.9 Referred 139 0.10
Therapy given# IV Fluids 16001 10.9
Antibiotics 18722 12.9 Oxygen 11925 8.2 Phototherapy 8244 5.7 Assisted ventilation 3223 2.2 Blood/plasma transfusion 1776 1.2 Parenteral nutrition 302 0.2 Exchange transfusion 900 0.6 Surgery 204 0.1 Cryotherapy/laser for ROP 22 0.0
Table 32 This includes 24 infants who died beyond 28 days and before discharge. # Not mutually exclusive

NNPD 2002-03
Nodal Centre : AIIMS, New Delhi 35
Table 16 : Neonatal Mortality – major indices (live births = 145623)
Index Number of infants
(n = 145623) Proportion
(%) Neonatal deaths 3680 - Early neonatal deaths 3230 87.8 Deaths < 24 hrs Deaths 1 to 7 days
1215 2015
37.6 62.4
Late neonatal deaths (7-28 days) 426 11.6 Post neonatal deaths 24 0.7 Neonatal mortality rate - 25.3 per 1000 live births Early neonatal mortality rate - 22.2 per 1000 live births Late neonatal mortality rate - 02.9 per 1000 live births
Table 17 : Neonatal mortality in selected categories
Category No of infants (n1 =145623)
No of deaths (n2=3680)
Mortality rate (%)
Low birth weight neonates 45523 2778 6.1 Preterm neonates 21125 2285 10.8 VLBW neonates 5018 1490 29.7 ELBW neonates 973 535 55.0

NNPD 2002-03
Nodal Centre : AIIMS, New Delhi 36
Table 18 : Neonatal mortality in different birth weight groups
Birth weight (gms) No of infants (n = 145623)
No of deaths (n =3680)
Mortality rate (%)
<1000 973 535 55.0 1000-1249 1662 520 31.3 1250-1499 2383 435 18.3 1500-1749 4174 432 10.4 1750-1999 5691 297 5.2 2000-2249 12319 298 2.4 2250-2499 18321 261 1.4 2500-2999 59558 579 1.0 3000-3449 32615 261 0.8 3500 and above 7927 62 0.8
Table 19 : Primary causes of mortality
Cause Number of deaths (n = 3680)*
Proportion (%)
Perinatal asphyxia 1060 28.8 Septicemia/meningitis 590 16.0 Other causes 508 13.8 Hyaline membrane disease 495 13.5 Congenital malformation 337 9.2 Extreme Prematurity 324 8.8 Intraventricular hemorrhage 149 4.1 Birth trauma 5 0.1 Pneumonia 93 2.5 Not established 119 3.2
Table 32 Total deaths include 24 deaths beyond 28 days in patients still admitted to the nursery

NNPD 2002-03
Nodal Centre : AIIMS, New Delhi 37
Table 20 : Primary cause of death by broad categories
Cause Number of deaths (n = 3680)*
Proportion (%)
Perinatal hypoxia 1060 28.8 Prematurity 968 26.3 Infection 683 18.6 Malformation 337 9.2 Other causes 632 17.2
Total deaths include 24 deaths beyond 28 days in patients still admitted to the nursery Table 21 : Bacterial isolates (intramural data)
Organisms No. of isolates
(n=1158) (+ve culture =1248)
Proportion (%)
Klebsiella pneumoniae 406 32.5 S. aureus 170 13.6 E. coli 132 10.6 Pseudomonas 70 5.6 S. albus 74 5.9 Enterobacter 47 3.8 Acenetobacter 34 2.7 S. viridans 34 2.7 GBS 13 1.0 Citrobacter 8 0.6 Others 260 20.8 Total 1248 100.0

NNPD 2002-03
Nodal Centre : AIIMS, New Delhi 38

NNPD 2002-03
Nodal Centre : AIIMS, New Delhi 39
Perinatal hypoxia28.8%
Prematurity26.3%
Infection18.6%
Malformation9.2%
Other causes 17.2%
Perinatal hypoxia28.8%
Prematurity26.3%
Infection18.6%
Malformation9.2%
Other causes 17.2%
Primary causes of death (n = 3680)
Pseudo6%
GBS1%
Acineto3%
Citro1%
Kleb32%
Others20%
S. aureus13%
S. albus6%
S. viridens0.3%
E. coli11%
Entero4%
Bacterial isolates causing sepsis intramural neonates (n=1248)

NNPD 2002-03
Nodal Centre : AIIMS, New Delhi 40
Table 22 : Antibiotic sensitivity pattern Klebsiella (%) S. aureus (%) E. coli (%) Pseudomonas (%) S. albus (%)
Peni 5/296 (1.7) 10/110 (9.1) 34/87 (39.1) 1/16 (6.3) 6/22 (27.3)
Ampi 49/354 (13.8) 17/102 (16.6) 11/78 (14.1) 17/45 (37.8) 44/61 (72.1)
Clox 8/303 (2.6) 15/93 (16.1) 0/50 (0.0) 0/15 (0.0) 13/27 (48.2)
Gen 82/363 (22.6) 38/111 (34.2) 38/88 (43.2) 22/51 (43.1) 27/52 (51.9)
Ami 114/365 (31.2) 48/121 (39.7) 92/120 (76.7) 39/53 (73.6) 24/37 (64.9)
Neti 9/306 (2.9) 16/92 (17.4) 14/60 (23.3) 11/31 (35.5) 38/54 (70.4)
Cefa 7/299 (2.3) 16/91 (17.6) 3/51 (5.9) 0/14 (0.0) 35/51 (68.6)
Ceph 6/302 (2.0) 9/87 (10.3) 6/57 (10.5) 5/28 (17.9) 7/25 (28.0)
Cefti 32/326 (9.8) 5/79 (6.3) 41/86 (47.7) 6/22 (27.3) 3/27 (11.1)
Cefo 88/366 (24.0) 49/118 (41.5) 43/95 (45.3) 33/50 (66.0) 14/26 (53.9)
Ceftri 31/334 (9.3) 18/92 (19.6) 29/77 (37.6) 21/40 (52.5) 9/28 (32.1)
Cefap 33/161 (20.5) 19/43 (44.2) 23/54 (42.6) 16/22 (72.7) 43/43 (100.0)
Cefta 24/303 (7.9) 11/87 (12.6) 51/99 (51.5) 16/34 (47.1) 1/18 (5.6)
Piper 18/287 (6.3) 2/72 (2.8) 2/48 (4.2) 5/19 (26.3) 3/43 (7.0)
Vanco 6/54 (11.1) 28/44 (63.6) 1/10 (10.0) 5/8 (62.5) 7/17 (41.2)
Cipro 102/381 (26.7) 37/115 (32.2) 75/112 (66.9) 38/58 (65.5) 21/46 (45.7)
Nodal C
entre : AIIM
S, New
Delhi 30
NN
PD
2002-03

NNPD 2002-03
Nodal Centre : AIIMS, New Delhi 41
Table 23 : Antibiotic sensitivity pattern Enterobacter S.viridans GBS Citrobacter Others
Peni 4/15 (26.7) 1/1 (100) 9/9 (100) 0/1 (0) 9/82 (11.0)
Ampi 12/30 (40.0) 0/0 4/4 (100) 2/4 (50) 42/80 (52.5)
Clox 4/10 (40.0) 0/0 1/1 (100) 0/2 (0) 13/46 (28.3)
Gen 29/39 (74.4) 33/33 (100) 4/5 (80.0) 2/5 (40) 71/129 (55.0)
Ami 24/28 (85.7) 1/1 (100) 4/4 (100) 1/6 (16.7) 77/127 (60.6)
Neti 4/9 (44.4) 0/0 0/0 (0) 0/1 (0) 40/89 (44.9)
Cefa 6/7 (85.7) 0/0 0/0 (0) 0/1 (0) 11/44 (25.0)
Ceph 6/10 (60.0) 33/33 (100) 1/1 (100) 0/1 (0) 7/41 (17.1)
Cefti 18/23 (78.3) 0/0 3/3 (100) ½ (50) 4/32 (12.5)
Cefo 10/27 (37.0) 0/1 (0.0) 9/9 (100) 3/7 (42.8) 59/122 (48.4)
Ceftri 5/13 (38.5) 0/0 2/2 (100) 2/6 (33.3) 7/43 (16.3)
Cefap 13/18 (72.2) 33/33 (100) 4/4 (100) ½ (50) 2/18 (11.1)
Cefta 4/10 (40.0) 0/0 0/1 (0) 0/1 (0) 12/42 (28.6)
Piper 2/7 (28.6) 0/0 0/0 (0) 0/1 (0) 5/48 (10.4)
Vanco 6/13 (46.2) 2/2 (100) 3/3 (100) 0/1 (0) 47/59 (79.7)
Cipro 25/30 (83.3) 33/33 (100) 2/2 (100) 1/6 (16.7) 94/125 (75.2)
Nodal C
entre : AIIM
S, New
Delhi 31
NN
PD
2002-03

NNPD 2002-03
Nodal Centre : AIIMS, New Delhi 42
1.2 STILL BIRTHS

NNPD 2002-03
Nodal Centre : AIIMS, New Delhi 43
1.2 REPORT ON INTRAMURAL STILL BIRTHS
Table 1 : Sex distribution and gestation group details
Category Number of infants (n = 5813)
Proportion (%)
Sex distribution Males 3037 52.2 Females 2749 47.3 Ambiguous 27 0.5
Preterm (<37weeks) 3642 62.7 Term 2122 36.5 Post-term (>41weeks) 49 0.8
Table 2 : Birth weight and Intrauterine growth categories
Category Number of infants (n = 5813)
Proportion (%)
Birth weight Total LBW* Preterm LBW Term LBW Post term LBW
4444
3454 974
16
76.4 77.7 21.9 0.4
Very low birth weight# 2398 41.3 Extremely low birth weight$ 1215 20.9
Intrauterine growth Small for dates 1800 31.0 Appropriate for dates 3790 65.2 Large for dates 223 3.8
Table 32 Low birth weight (<2500 gm) # Very low birth weight < 1500 gm $ Extremely low birth weight < 1000 gm

NNPD 2002-03
Nodal Centre : AIIMS, New Delhi 44
Tables 3 : Details of singletons and multiple still births
Category Number of infants (n = 5813)
Proportion (%)
Singletons 5499 94.6 Twins 296 5.1 Triplets 18 0.3
Tables 4 : Mode of delivery
Category Number of infants (n = 5813)
Proportion (%)
Vaginal delivery 4464 76.8 Cesarean section 770 13.3 Forceps extraction 143 2.5 Vaccum extraction 32 0.6 Other 404 7.0
Table 5: Time of detection of still birth
Category Still births (n = 5813)
Proportion (%)
Detected before labor 3508 60.4 Detected during labor 2055 35.3 Not known 250 4.3

NNPD 2002-03
Nodal Centre : AIIMS, New Delhi 45
Table 6 : Types of still birth
Category Still births (n = 5813)
Proportion (%)
Fresh 3739 64.3 Macerated 1963 33.8 Not Known 111 1.9
Table 7 : Birth weight distribution of still births
Birth weight group (gm) No of still births (n = 5813)
Proportion (%)
<1000 1215 20.9 1000-1249 735 12.6 1250-1499 448 7.7 1500-1749 640 11.0 1750-1999 428 7.4 2000-2249 620 10.7 2250-2499 358 6.2 2500-2999 910 15.7 3000-3499 341 5.9 >3500 118 2.0

NNPD 2002-03
Nodal Centre : AIIMS, New Delhi 46
Table 8 : Gestational age distribution of still births
Gestational group (weeks) No of still births (n = 5813)
Proportion (%)
<28 1117 19.2 29-30 579 10.0 31-32 686 11.8 33-34 669 11.5 35-36 591 10.2 37-41 2122 36.5 >42 49 0.8
Table 9 : Primary causes of still births
Causes No of still births (n = 5813)
Proportion (%)
Asphyxia 2622 45.1 Congenital malformations 457 7.9 Infection 156 2.7 Trauma 40 0.7 Rh-isoimmunization 40 0.7 Others / Not established 2498 43.0

NNPD 2002-03
Nodal Centre : AIIMS, New Delhi 47
�
�
PART – 2 REPORT ON EXTRAMURAL ADMISSIONS

NNPD 2002-03
Nodal Centre : AIIMS, New Delhi 48
PART – 2
REPORT ON EXTRAMURAL INFANTS
The following 18 centers provided data on extramural admissions
CENTERS All India Institute of Medical Sciences New Delhi
Baroda Medical College & SSG Hospital Vadodara
Christian Medical College & Hospital Ludhiana
Christian Medical College & Hospital Vellore
Government Medical College & Hosptial Chandigarh
Indira Gandhi Medical College Nagpur
Institute of Obstetrics & Gynecology Chennai
JIPMER Pondicherry
KEM Mumbai
KEM Hospital Pune
KGMC Lucknow

NNPD 2002-03
Nodal Centre : AIIMS, New Delhi 49
KMC Manipal
LTMG, Sion Mumbai
Maulana Azad Medical College New Delhi
MS Ramaiah Medical College Hospital Bangalore
PGIMER Chandigarh
St. Johns Medical College & Hospital Bangalore
SVICH Chennai
NNPD 2002-03
Nodal Centre : AIIMS, New Delhi 50
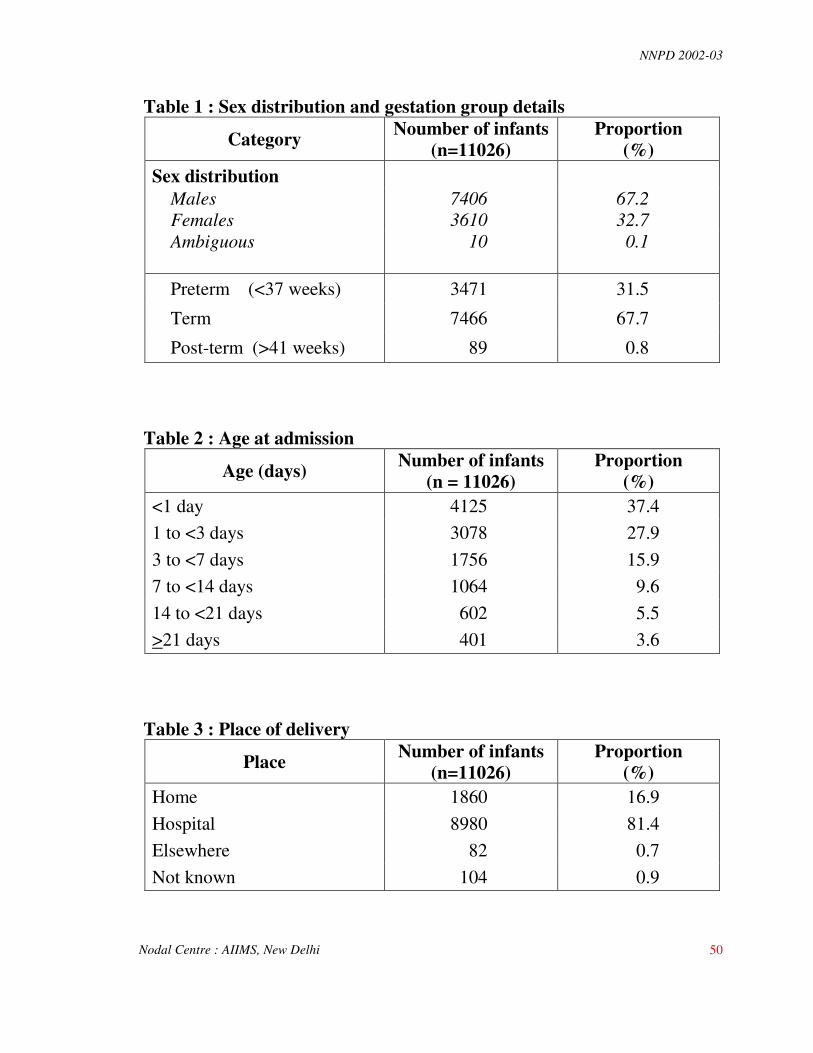
Table 1 : Sex distribution and gestation group details
Category Noumber of infants (n=11026)
Proportion (%)
Sex distribution Males 7406 67.2 Females 3610 32.7 Ambiguous 10 0.1 Preterm (<37 weeks) 3471 31.5
Term 7466 67.7
Post-term (>41 weeks) 89 0.8 Table 2 : Age at admission
Age (days) Number of infants (n = 11026)
Proportion (%)
<1 day 4125 37.4 1 to <3 days 3078 27.9 3 to <7 days 1756 15.9 7 to <14 days 1064 9.6 14 to <21 days 602 5.5 >21 days 401 3.6
Table 3 : Place of delivery
Place Number of infants (n=11026)
Proportion (%)
Home 1860 16.9 Hospital 8980 81.4 Elsewhere 82 0.7 Not known 104 0.9

NNPD 2002-03
Nodal Centre : AIIMS, New Delhi 51
Table 4 : Person conducting delivery
Person Number of infants (n=11026)
Proportion (%)
Doctor 9033 81.9 Nurse/ANM* 168 1.5 Trained Dai 593 5.4 Untrained Dai 634 5.8 Other 192 1.7 Not known 406 3.7
Table 32 ANM = Auxillary Nurse Midwife Table 5 : Birth weight category of admitted neonates
Category Number of infants (n=11026)
Proportion (%)
Low birth weight (<2500 gm)
5748 52.1
Normal birth weight (>2500 gm)
4402 39.9
Not known 876 7.9 Table 6 : Birth trauma
Trauma Number of infants (n = 11026)
Proportion (%)
Cephalhematoma 149 1.4 Cuts 22 0.2 Nerve palsy 26 0.2 Subgaleal bleed 37 0.3 Fracture(s) 18 0.2 Intracranial trauma 10 0.1

NNPD 2002-03
Nodal Centre : AIIMS, New Delhi 52
Table 7 : Respiratory morbidity
Morbidity Number of infants (n=11026)
Proportion (%)
Hyaline membrane disease 709 6.4
Pneumonia 1468 13.3
Meconium aspiration syndrome
871 7.9
Transient tachypnea 617 5.6
Air-leak syndrome 181 1.6 Table 8 : Central nervous system morbidity
Morbidity Number of infants (n=11026)
Proportion (%)
Seizures 1992 18.1
Hypoxic-Ischemic Encephalopathy
1767 16.0
Intraventricular Hemorrhage 248 2.2
Intracranial bleed other than IVH
93 0.8

NNPD 2002-03
Nodal Centre : AIIMS, New Delhi 53
Table 9 : Congenital malformation
Malformation Number of infants (n=11026)
Proportion (%)
Cardiac 520 4.7 Gastrointestinal 323 2.9 Genito-urinary 144 1.3 Neural tube defect 37 0.3 Limb defects 103 0.9 Hydrocephalus 85 0.8 Cleft lip/palate 72 0.7 Down syndrome 47 0.4
Table 10 : Miscellaneous morbidity
Morbidity* Number of infants (n = 11026)
Proportion (%)
Hyperbilirubinemia 2437 22.1 Hypothermia 2029 18.4 Hypoglycemia 1020 9.3 Anemia 955 8.7 Apneic spells 869 7.9 Hypocalcemia 627 5.7 HDN 362 3.3 Rh isoimmunization 229 2.1 PDA 168 1.5 Polycythemia 124 1.1 Retinopathy of prematurity 28 0.3
Table 32 Morbidity figures are not mutually exclusive.

NNPD 2002-03
Nodal Centre : AIIMS, New Delhi 54
Table 11 : Superficial infections
Infection Number of infants (n=11026)
Proportion (%)
Conjunctivitis 345 3.1 Umbilical sepsis 235 2.1 Thrush 209 1.9 Pyoderma 134 1.2
Table 12 : Systemic infections
Category Number of infants (n=11026)
Proportion (%)
Overall incidence 4378 39.7
Culture status (n = 4378) Culture positive Culture negative (Clinical sepsis)
1410 2968
32.2 67.8
Time of onset (n=4378) Early onset Late onset
2457 1984
56.1 45.3
Clinical category# (not mutually exclusive) Pneumonia Meningitis Infective diarrhoea Bone/joint infection UTI Tetanus neonatorum NEC
1628 856 62 47 38 40
226
37.2 19.6 1.4 1.1 0.9 0.9 5.2

NNPD 2002-03
Nodal Centre : AIIMS, New Delhi 55
Table 13 : Report on extramural data 2002-2003
Organisms No. of isolates (n=1410)
Proportion (%)
Klebsiella pneumoniae 388 27.52 S. aureus 210 14.89 E. coli 163 11.56 Pseudomonas 183 12.98 S. albus 53 3.76 Enterobacter 84 5.96 Acenetobacter 48 3.40 S. viridans 11 0.78 GBS 0 0.00 Citrobacter 28 1.99 Others 242 17.16 Total 1410 100.00

NNPD 2002-03
Nodal Centre : AIIMS, New Delhi 56
Table 14: Antibiotic sensitivity pattern Klebsiella S. aureus E. coli Pseudomonas S. albus
Peni 1/227 (0.44) 4/126 (3.17) 8/60 (13.33) 0/11 (0.0) 5/24 (20.83)
Ampi 5/316 (1.58) 14/130 (10.7) 2/96 (2.08) 29/155 (18.71) 15/35 (42.86)
Clox 3/229 (1.31) 15/117 (12.82) 1/39 (2.56) 1/7 (14.29) 15/29 (51.72)
Gen 23/339 (6.78) 28/149 (18.79) 28/102 (27.45) 1/134 (8.21) 19/30 (63.33)
Ami 77/339 (22.71) 82/181 (45.3) 84/134 (62.69) 107/142 (75.35) 36/40 (90.0)
Neti 11/239 (4.60) 23/117 (19.66) 16/60 (26.67) 30/108 (27.78) 20/25 (80.0)
Cefa 1/223 (0.45) 3/91 (3.30) 1/36 (2.78) 0/10 (0.0) 11/15 (73.33)
Ceph 4/278 (1.44) 13/105 (12.38) 3/46 (6.52) 2/108 (20.37) 5/10 (50.0)
Cefti 4/230 (1.74) 0/88 (0.0) 9/46 (19.57) 3/10 (30.0) 0/4 (0.0)
Cefo 38/301 (12.62) 44/160 (27.50) 28/115 (24.35) 124/141 (87.94) 7/17 (41.18)
Ceftri 13/271 (4.80) 32/134 (23.8) 25/7 (32.47) 125/136 (91.91) 1/7 (14.28)
Cefap 23/123 (18.70) 24/62 (38.71) 18/50 (36.00) 121/124 (97.58) 11/11 (100.0)
Cefta 13/259 (5.01) 19/113 (16.81) 30/76 (39.47) 109/125 (87.20) 4/10 (40.0)
Piper 4/230 (1.74) 3/91 (3.30) 5/43 (11.63) 12/21 (57.14) 2/6 (33.3)
Vanco 2/27 (7.41) 50/68 (73.53) 1/6 (16.67) 0/1 (0.0) 11/11 (100.0)
Cipro 94/347 (27.09) 56/151 (37.09) 62/119 (52.10) 116/126 (92.06) 18/31 (58.06)
Nodal C
entre : AIIM
S, New
Delhi 47
NN
PD
2002-03

NNPD 2002-03
Nodal Centre : AIIMS, New Delhi 57
Table 15: Antibiotic sensitivity pattern Enterobacter Acinetobacter S.viridans GBS Citrobacter Others
Peni 0/3 (0.0) 0/3 (0.0) 0/0 - 0/0 11/93 (11.83)
Ampi 4/36 (11.11) 10/32 (31.25) 0/0 - 0/5 (0.0) 10/144 (6.94)
Clox 0/1 (0.0) 0/1 (0.0) 0/0 - 0/0 13/79 (16.46)
Gen 11/47 (23.40) 17/36 (47.22) 11/11 (100.0) - 3/14 (21.43) 54/170 (31.76)
Ami 40/62 (64.52) 27/38 (71.05) 1/1 (100.0) - 11/23 (47.83) 10/173 (57.80)
Neti 4/7 (57.14) 5/12 (41.67) 0/0 - 3/7 (42.86) 11/64 (17.19)
Cefa 0/3 (0.0) 0/1 (0.0) 2/2 (100.0) - 0/0 5/54 (9.26)
Ceph 3/6 (50.0) 6/15 (40.0) 9/9 (100.0) - 0/2 (0.0) 8/63 (12.7)
Cefti 0/11 (0.0) 3/4 (75.0) 0/0 - 2/2 (100.0) 0/51 (0.0)
Cefo 6/50 (12.0) 23/45 (51.11) 0/0 - 4/18 (22.22) 39/153 (25.49)
Ceftri 1/17 (5.88) 16/23 (69.57) 0/0 - 1/14 (7.14) 13/86 (15.12)
Cefap 23/25 (92.0) 17/19 (89.47) 11/11 (100.0) - 8/15 (53.33) 16/63 (25.40)
Cefta 5/12 (41.67) 7/9 (77.78) 0/0 - 2/6 (33.33) 11/65 (16.92)
Piper 0/3 (0.0) 0/0 0/0 - 1/2 (50.0) 3/53 (5.6)
Vanco 1/2 (50.0) 0/0 0/0 - 0/0 56/92 (60.87)
Cipro 33/49 (67.35) 22/32 (68.75) 11/11 (100.0) - 15/19 (78.95) 73/163 (44.79)
Nodal C
entre : AIIM
S, New
Delhi 48
NN
PD
2002-03

NNPD 2002-03
Nodal Centre : AIIMS, New Delhi 58
Organism causing sepsis in extramural neonates at 18 centres (n=1410)
Pseudo13%
GBS0%
Aceneto3%
Citro2%
Kleb27%
O thers17%
S. aureus15%
S. albus4%
S. viridens0.3%
E. coli12%
Entero6%

NNPD 2002-03
Table 16 : Therapies given
Therapy given* Number of infants (n = 11026)
Proportion (%)
Antibiotics 9182 84.2 IV Fluids 9055 82.1 Oxygen 6476 58.7 Phototherapy 3623 32.9 Assisted ventilation 2602 25.6 Blood/plasma transfusion 2500 22.7 Parenteral nutrition 351 3.2 Exchange transfusion 660 6.0 Surgery 355 3.2 Cryotherapy/laser for ROP# 14 0.1
* Therapies provided are not mutually exclusive. # ROP = Retinopathy of prematurity.
Table 17 : Outcomes of admitted neonates
Outcomes Number of infants (n=11026)
Proportion (%)
Discharged 7638 69.3 Expired 1860 16.9 Left against medical advice 76 0.7 Referred 1447 13.1 Not known 5 0.0
NNPD 2002-03
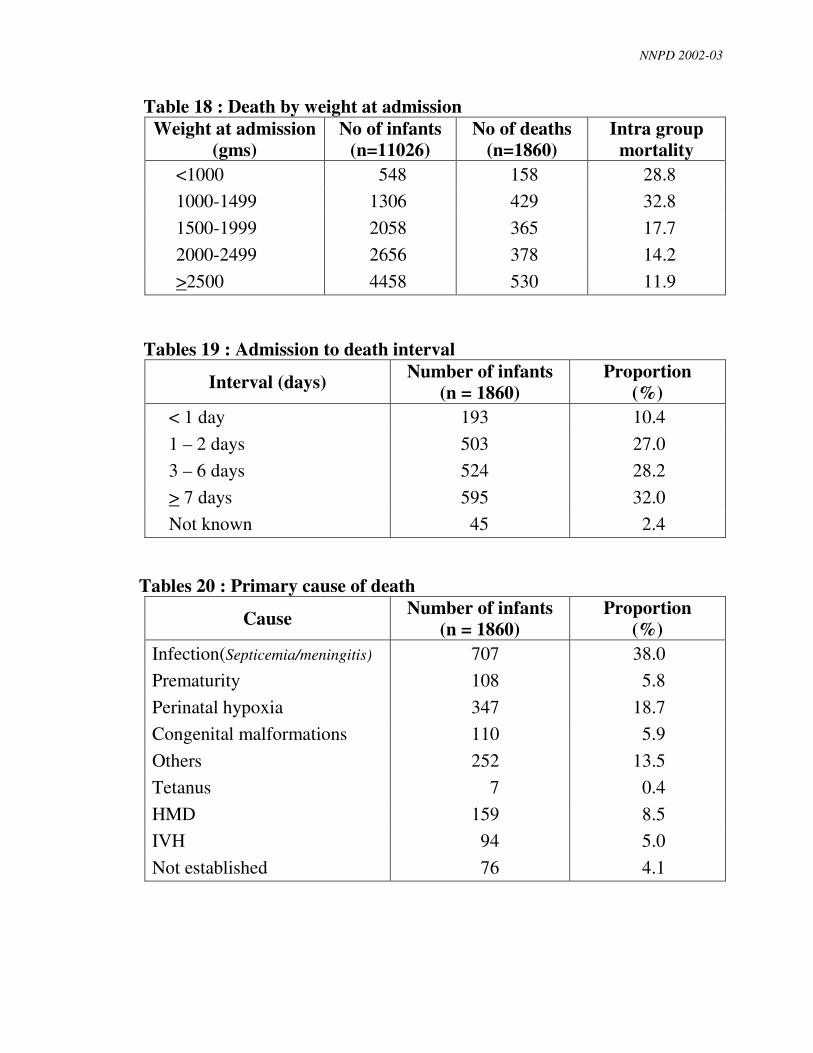
Table 18 : Death by weight at admission Weight at admission
(gms) No of infants
(n=11026) No of deaths
(n=1860) Intra group
mortality <1000 548 158 28.8 1000-1499 1306 429 32.8 1500-1999 2058 365 17.7 2000-2499 2656 378 14.2 >2500 4458 530 11.9
Tables 19 : Admission to death interval
Interval (days) Number of infants (n = 1860)
Proportion (%)
< 1 day 193 10.4 1 – 2 days 503 27.0 3 – 6 days 524 28.2 > 7 days 595 32.0 Not known 45 2.4
Tables 20 : Primary cause of death
Cause Number of infants (n = 1860)
Proportion (%)
Infection(Septicemia/meningitis) 707 38.0 Prematurity 108 5.8 Perinatal hypoxia 347 18.7 Congenital malformations 110 5.9 Others 252 13.5 Tetanus 7 0.4 HMD 159 8.5 IVH 94 5.0 Not established 76 4.1

NNPD 2002-03
Infection39%
Prematurity6%Perinatal hypoxia
19%
Congenital malformation6%
Others14%
Tetanus0%
HMD9%
Not established2%
IVH5%
Causes of deaths among extramural neonates at 18 centers

NNPD 2002-03
NNPD
WORKING DEFINITIONS
I. GENERAL
INTRAMURAL BABY
A baby born in your center
EXTRAMURAL BABY
Baby not born in your center
FETUS
Fetus is a product of conception, irrespective of the duration of pregnancy, which is not
completely expelled or extracted from its mother.
BIRTH
Birth is the process of complete expulsion or extraction of a product of conception from its
mother.
LIVE BIRTH
A live birth is complete expulsion or extraction from its mother of a product of conception,
irrespective of duration of pregnancy, which after separation, breathes or shows any other
evidence of life, such as beating of the heart, pulsation of the umbilical cord, or definite
movements of voluntary muscles. This is irrespective of whether the umbilical cord has
been cut or the placenta is attached. [Include all live births >500 grams birth weight or 22
weeks of gestation or a crown heel length of 25 cm]
STILL BIRTH
Death of a fetus having birth weight >500 g (or gestation 22 weeks or crown heel length 25
cm) or more.
BIRTH WEIGHT
Birth weight is the first weight of a live or dead product of conception, taken after
complete expulsion or extraction from its mother. This weight should be measured within

NNPD 2002-03
24 hours of birth, preferably within its first hour of live itself before significant postnatal
weight loss has occurred.
LOW BIRTH WEIGHT (LBW)
Birth weight of less than 2500 g.
VERY LOW BIRTH WEIGHT (VLBW)
Birth weight of less than 1500 g.
EXTREMEY LOW BIRTH WEIGHT (ELBW)
Birth weight of less than 1000 g.
GESTATIONAL AGE (BEST ESTIMATE)
The duration of gestation is measured from the first day of the last normal menstrual
period. Gestational age is expressed in completed days or completed weeks. PLEASE
PROVIDE THE BEST ESTIMATE OF GESTATION. IT MEANS THAT, IN YOUR
JUDGEMENT, BASED ON ALL THE HISTORICAL, ULTRASOUND AND BABY
EXAMINATION DATA, THE ESTIMATE AS ENTERED IN THE DATABASE IS
MOST ACURATE.
PRETERM
Gestational age of less than 37 completed weeks (i.e. less than 259 days)
TERM
Gestational age of 37 to less than 42 completed weeks (i.e. 259 to 293 days)
POST TERM
Gestational age of 42 completed weeks or more (i.e. 294 days or more).
FETAL GROWTH CATEGORIES (Use AIIMS chart in Dr. Meharban Singh’s book)
• SMALL FOR DATES (SFD)
Neonate with a birth weight less than 10th centile for the period of gestation.
• APPROPRIATE FOR DATES (AFD)
Neonate with birth weight between 10th to 90th centile for the period of gestation.
• LARGE FOR DATES
Neonate with birth weight over 90th centre for the period of gestation.

NNPD 2002-03
PERINATAL PERIOD
Commences from 22 weeks (154 days) of gestation (the time when the birth weight is 500
g), and ends at 7 completed days after birth.
NEONATAL PERIOD
It refers to the period of less than 28 days after birth. Early neonatal period refers to the
period before 7 days of age. Late neonatal period refers to the period from completion of 7
days upto 28 days of life.
MATERNAL DEATH
A maternal death is the death of a woman known to be pregnant within 42 days of
termination of pregnancy, irrespective of the duration or site of the pregnancy from any
cause related to or aggravated by the pregnancy or its management, but not from accident
or incidental causes.
PROLONGED RUPTURE OF MEMBRANES
Rupture of membranes or leaking for more than 24 hours.
ANTEPARTUM HEMORPHAGE
Bleeding per vaginum after 20 weeks of gestation.
MATERNAL ANEMIA
Clinical pallor should be chosen if pallor is present and hemoglobin has not been done.
FETAL BRADYCARDIA
Fetal heart rate of less than 120 per minute.
FETAL TACHYCARDIA
Fetal heart rate of more than 160 per minute.
II. NEONATAL DETAILS
BIRTH ASPHYXIA
Definition I
Moderate birth asphyxia : Slow gasping breathing at 1-minute of age.
Severe birth asphyxia : No breathing at 1-minute of age.
Definition II

NNPD 2002-03
Birth asphyxia : Apgar score of less than 7 at 1 minute of age
Moderate birth asphyxia : Apgar score between 4 to 6 at 1-minute of age
Severe birth asphyxia : Apgar score of 3 or less at 1-minute of age.
For HRRC sites:
Cry after 5 minutes of age or no cry at all
RESPIRATORY DISTRESS
Presence of at least 2 of the following criteria:
Respiratory rare > 60/minute
Subcostal/intercostal recessions
Expiratory grunt/groaning
Note: The baby should be evaluated in between the feeds and in a quiet state. Respiratory rate should be recorded for at least 1 minute.
TRANSIENT TECHYPNEA/DELAYED ADAPTATION
Respiratory distress in a term or borderline term or preterm neonate starting within 6 hours
after birth, often requiring supplemental oxygen, but recovering spontaneously within 3-4
days and showing characteristic x-ray changes (linear streaking at hila and interlobar
fluid).
HYALINE MEMBRANE DISEASE
A. Presence of all of the following three criteria
• Pre-term neonate
• Respiratory distress having onset within 6 hours of birth
• Amniotic fluid L/S ratio of <1.5, or negative gastric aspirate shake test, or
skiagram of chest showing poor expansion with air bronchogram/ reticulo-
granular pattern/ ground glass opacity.
B. Autopsy evidence of HMD
MECONIUM ASPIRATION SYNDROME

NNPD 2002-03
Presence of two of the following:
• Meconium staining of liquor or staining of nails or umbilical cord or skin.
• Respiratory distress soon after birth, within one hour of birth
• Radiological evidence of aspiration pneumonitis (atelectasis and or hyperinflation)
PNEUMONIA
In a neonate with respiratory distress, pneumonia is diagnosed in the presence of a positive
blood culture or if any two one of the following are present.
• Existing or predisposing factors: maternal fever, foul smelling liquor, prolonged
rupture of membranes or gastric polymorphs more than 5 per high power field
• Clinical picture of septicemia (poor feeding, lethargy, poor reflexes, hypo,
hyperthermia, abdominal distension etc.)
• X-ray picture suggestive of pneumonia
• Positive septic screen (see septicemia)
For HRRC centres, sepsis screen and x-ray may not be necessary for the diagnosis
SEPTICEMIA (SYSTEMIC BACTERIAL INFECTION)
CULTURE NEGATIVE (CLINICAL)
In an infant having clinical picture suggestive of septicemia, the presence of any one of the
following criteria is enough for assigning probable diagnosis of infection:
• Existence of predisposing factors: maternal fever or foul smelling liquor or prolonged
rupture of membranes (>24 hrs) or gastric polymorphs (>5 per high power field).
• Positive septic screen (two of the four parameters (namely, TLC (<5000/mm, band to
total polymorph ratio of > 0.2, absolute neutrophil count less than 1800 / cmm, C-
reactive protein >1mg/dl and micro ESR>10 mm 1st hour).
• Radiological evidences of pneumonia.
For HRRCs clinical diagnosis will suffice
CULTURE POSITIVE SEPSIS

NNPD 2002-03
In an infant having clinical picture suggestive of septicemia, pneumonia or meningitis
along with either of the following.
• Isolation of pathogens from blood or CSF or urine or abscess(es)
• Pathological evidence of sepsis on autopsy.
EARLY/ LATE ONSET SEPSIS (Pneumonia, septicemia, Meningitis, NEC, UTI etc.)
Early onset : Onset <72 hours
Late onset : Onset >72 hours
MENINGITIS
In the setting of septicemia, if CSF culture is positive; or CSF microcopy and biochemistry
are suggestive of meningitis.
NECROTISING ENTEROCOLITIS (NEC)
In a baby at risk for NEC (pre-maturity, sepsis, umbilical venous/arterial catheterization,
birth asphyxia, extreme pre-maturity, formula feeding) presence of any two of the
following:
• Pre feed gastric aspirate of >50% of previous feed or abdominal distension
• Bloody stools or occult blood in the stools
• Radiological evidence of pneumatosis intestinalis/portal air/free air under the
diaphragm
HYPERBILIRUBINEMIA
Serum bilirubin of >15 mg/dl
HYPOTHERMIA
Skin temperature <36 C
HYPOGLYCEMIA
Whole blood glucose of less than 40 mg/dl
HYPOCALCEMIA
Any one of the following.
• Serum total calcium <7 mg/dl. or
• Serum ionized calcium <4 mg/dl.
• QOTC >0.2 seconds on ECG which normalizes after calcium therapy.

NNPD 2002-03
INTRAVENTRICULAR HEMORRHAGE (IVH)
CLINICALLY SUSPECT if at least 3 clinical criteria in a pre-term infant in whom
hypoglycemia and pyogenic meningitis have been excluded:
• Onset of symptoms within 0-72 hours of age
• Apneic attacks or seizures
• Sudden pallor or falling hematocrit
• Gross hypotonia
• Flat or bulging fontanel
CONFIRMED if corroborated by ultrasound or CT or autopsy findings
ANEMIA
Hemoglobin <13 g/dl or PCV <40 per cent.
HEMORRHAGIC DISEASE OF THE NEWBORN
Bleeding from any site especially from the gastrointestinal tract
Onset 2nd to 5th day of postnatal life
Prolonged pro-thrombin time and thrombin time, with normal platelet count.
APNEIC SPELL
Period of respiratory arrest of a duration of more than 20 seconds: or of less than 20
seconds if accompanied by bradycardia (<100/minute) and/or cyanosis.
POLYCYTHEMIA
Capillary hematocrit of more than 70% or venous hematocrit more than 65% after 24 hours
of age
MAJOR CONGENITAL MALFORMATION
A malformation that is life threatening or requires surgical correction.

NNPD 2002-03
III. CAUSES OF NEONATAL DEATH
(This entry should be verified by the PI)
Important Note:
You will be first asked the cause(s) of death and you would choose from the
following 11 causes of death. You may assign more than one cause of death at this
stage.
You will then be asked to identify the single most important cause of death. Here
you will choose only one cause. This is the primary or underlying cause of death,
which is defined as disease or injury, which initiated the train of morbid events
leading directly to death. You will exercise your judgement to assign this cause
keeping in mind this definition
1. Perinatal asphyxia: Death of a neonate in the setting of and with features of
perinatal hypoxia and / or birth asphyxia followed by manifestations of or hypoxic
ischemic injury of brain (hypoxic ischemic encephalopathy) or other organs.
2. Birth trauma : Death due to birth trauma.
3. Extreme prematurity: Extreme prematurity as a cause of death is assigned to
infants having birth weight of less than 750g
4. Hyaline membrane disease: Death in a neonate attributable to hyaline membrane
disease
5. Intraventricular hemorrhage : Death in a neonate attributable to Intraventricular
hemorrhage
6. Pneumonia : Death in a neonate attributable to pneumonia
7. Septicemia : .Death in a neonate attributable to septicemia or meningitis
8. Tetanus neonatorum : Death due to tetanus neonatorum
9. Congenital malformations: Death due to lethal congenital malformation.
10. Others: Mention the cause not classified by above
11. Not established : Cause of death not established
IV. CAUSES OF STILLBIRTHS

NNPD 2002-03
(This entry should be verified by the PI)
Important Note:
You will be first asked the cause(s) of stillbirth and you would choose from the
following 11 causes of death. You may assign more than one cause of stillbirth at
this stage.
You will then be asked to identify the single most important cause of stillbirth. Here
you will choose only one cause. This is the primary or underlying cause of death
which is defined as disease or injury, which initiated the train of morbid events
leading directly to death. You will exercise your judgement to assign this cause
keeping in mind this definition
1. Aspyhxia: Death of a fetus in the setting of preeclampsia, hypertension, eclampsia,
fetal growth retrdation, oligihydramnios, prolonged / obstructed / precipitate labor,
meconium passage, cord around the neck , fetal heart slowing or instrumentation.
2. Trauma : Death of a fetus in the setting of cephalopelvic disproportion or obstructed
labor or instrumentation with obvious evidence of traumatic lesions.
3. Infection: Death of a fetus in the setting of intrauterine infections (TORCH group)
or chorioamnionitis (maternal fever, abdominal tenderness, foul smelling liquor)
4. Congenital malformations: Death of a fetus due to lethal congenital malformation.
5. Rh Isoimmunization : Death of a fetus attributable to erythroblastosis fetalis
6. Others: Mention the cause not classified by above
7. Not established : Cause of death not established