national medical care statistics 2012 - crc...national medical care survey 2012 project team...
TRANSCRIPT


� � � � � � � � � � � � � � � � � � � � � � � � � � � �
�
National Medical Care Statistics 2012March 2014
©Ministry of Health Malaysia
Published by
The National Healthcare Statistics Initiative (NHSI)
National Clinical Research Centre
National Institutes of Health
3rd Floor, MMA House
124, Jalan Pahang
53000 Kuala Lumpur
Malaysia
Tel : (603) 4043 9300/9400
Fax : (603) 4043 9500
Email : [email protected]
Website : http://www.crc.gov.my/nhsi
This report is copyrighted. Reproduction and dissemination of this report in part or in whole for
research, educational or non-commercial purposes is authorised without any prior written permission
from the copyright holders provided that the source is fully acknowledged.
Suggested citation:
Sivasampu S, Yvonne Lim, Norazida AR, Hwong WY, Goh PP, Hisham AN. National Clinical Research
Centre. National Medical Care Statistics (NMCS) 2012. Kuala Lumpur 2014.
This report is also available electronically on the website of the National Healthcare Statistics Initiative
at http://www.crc.gov.my/nhsi
Funding:
The National Healthcare Statistics Initiative was funded by a grant from Ministry of Health Malaysia
(MRG Grant No. NMRR-09-842-4718)� � � � � � � � � � � � �� � � � � � � � � � � � �Please note that there is potential for minor corrections of data in this report.
Please check the online version at http://www.crc.gov.my/nhsi/ for any amendments. Thank you.

� � � � � � � � � � � � � � � � � � � � � � � � � � � �
� �
LIST OF TABLES iv
LIST OF FIGURES vi
ACKNOWLEDGEMENTS vii
NATIONAL MEDICAL CARE SURVEY 2012 PROJECT TEAM viii
ABBREVIATIONS ix
SYMBOLS x
EXECUTIVE SUMMARY 1
CHAPTER 1 : INTRODUCTION 5
1.1 Background 6
1.2 Objectives 6
1.4 Research questions 7
CHAPTER 2 : METHODOLOGY 9
2.1 Sampling frame and sample size calculation 10
2.2 Survey dates 12
2.3 Data collection and follow-up 12
2.4 Research pack and questionnaire 13
2.5 Data management 13
2.6 Data analysis 17
2.7 Ethical issues 18
2.8 Limitations 18
CHAPTER 3 : RESPONSE RATE 19
3.1 The encounters 21
CHAPTER 4 : THE DOCTORS 23
4.1 Characteristics of the doctors 24
CHAPTER 5 : THE PATIENTS 27
5.1 Age-gender distribution of patients 28
5.2 Patient socio-demographic characteristics 28
5.3 Mode of payment 30
CHAPTER 6 : REASONS FOR ENCOUNTER 33
6.1 Number of reasons for encounter per visit 34
6.2 Reasons for encounter by ICPC-2 components 34
6.3 Reasons for encounter by ICPC-2 chapters 36
6.4 Most common reasons for encounter in public and private clinics 38
TABLE OF CONTENTS

� � � � � � � � � � � � � � � � � � � � � � � � � � � �
� � �
CHAPTER 7 : DIAGNOSES 41
7.1 Number of diagnoses per encounter 42
7.2 Diagnoses by ICPC-2 component 43
7.3 Diagnoses by ICPC-2 chapter 44
7.4 Most common diagnoses managed in public and private clinics 46
CHAPTER 8 : MEDICATIONS 49
8.1 Number of medications prescribed per encounter 50
8.2 Type of medications prescribed 52
8.3 Most frequently prescribed medications in public and private clinics 58
CHAPTER 9 : INVESTIGATIONS 61
9.1 Number of investigations per encounter 62
9.2 Types of investigations 63
9.3 Investigations most frequently ordered in public and private clinics 67
9.4 Diagnoses with investigations ordered 69
CHAPTER 10: ADVICE/COUNSELLING AND PROCEDURES 71
10.1 Number of advice/counselling and procedures 72
10.2 Types of advice and counselling 72
10.3 Most common advice/counselling provided in public and
private clinics 74
10.4 Types of procedures 75
10.5 Most common procedures performed in public and private clinics 76
10.6 Diagnoses with advice/counselling and procedures 77
CHAPTER 11: FOLLOW-UPS AND REFERRALS 79
11.1 Number of follow-ups and referrals 80
11.2 Types of referrals 81
11.3 Diagnoses most frequently referred to hospital 82
11.4 Diagnoses most frequently referred to a specialist 83
APPENDICES
Appendix 1: NMCS 2012 Survey Form 86
Appendix 2: ICPC-2 and ICPC-2 PLUS Groups 88
Appendix 3: Participants of NMCS 2012 92
� � � � � � � � � � � � � � � � � � � � � � � � � � � �
� �
LIST OF TABLES
Table 2.1 Sample size for NMCS 2012 11
Table 2.2 Data entry error rate for NMCS 2012 14
Table 3.1 Total clinics sampled and responded for NMCS 2012 20
Table 3.2 Response rate for NMCS 2012 20
Table 3.3 Observed and weighted dataset for NMCS 2012 21
Table 4.1 Characteristics of doctors for NMCS 2012 24
Table 5.1 Characteristics of patient encounters in primary care clinics in 2012 29
Table 5.2 Duration of sick leave issued in primary care clinics in 2012 31
Table 6.1 Reasons for encounter by ICPC-2 components in primary care clinics in 2012 35
Table 6.2 Reasons for encounter by ICPC-2 components and sector 35
Table 6.3 Reasons for encounter by ICPC-2 chapters and common individual reasons
for encounter within chapter in primary care clinics in 2012 36
Table 7.1 Diagnoses by ICPC-2 components in primary care clinics in 2012 43
Table 7.2 Diagnoses by ICPC-2 chapters and common individual diagnoses
within chapter managed in primary care clinics in 2012 44
Table 7.3 Thirty most common diagnoses managed in public clinics in 2012 47
Table 7.4 Thirty most common diagnoses managed in private clinics in 2012 48
Table 8.1 Number of encounters for which medication was prescribed 50
Table 8.2 Prescribed medications by ATC level 1, 3 and 5 in primary care clinics in 2012 52
Table 8.3 Prescribed medications by ATC level 1 and sector in primary care clinics in 2012 57
Table 8.4 Thirty most frequently prescribed medications in public clinics in 2012 59
Table 8.5 Thirty most frequently prescribed medications in private clinics in 2012 60
Table 9.1 Types of investigations by ICPC-2 chapters and common individual test
within chapter in primary care clinics in 2012 63
Table 9.2 Top 10 diagnoses for which investigation was most frequently ordered
in primary care clinics in 2012 69
Table 10.1 Advice/counselling and procedures in primary care clinics in 2012 72
Table 10.2 Types of advice/counseling provided in primary care clinics in 2012 73

� � � � � � � � � � � � � � � � � � � � � � � � � � � �
�
Table 10.3 Types of procedures performed in primary care clinics in 2012 74
Table 10.4 Ten most common diagnoses with advice/counseling
in primary care clinics in 2012 77
Table 10.5 Ten most common diagnoses with procedures in primary care clinics in 2012 78
Table 11.1 Follow-up and referrals in primary care clinics in 2012 80
Table 11.2 Types of referrals in public clinics in 2012 81
Table 11.3 Types of referrals in private clinics in 2012 82
Table 11.4 Diagnoses most frequently referred to hospital in 2012 83
Table 11.5 Diagnoses most frequently referred to specialist in 2012 84

� � � � � � � � � � � � � � � � � � � � � � � � � � � �
� �
Figure 5.1 Age-gender distribution of patients in primary care clinics in 2012 28
Figure 5.2 Mode of payment in primary care clinics in 2012 30
Figure 5.3
Figure 6.1 Number of patient reasons for encounter in primary care clinics in 2012 34
Figure 6.2 Top 10 reasons for encounter in public clinics in 2012 38
Figure 6.3 Top 10 reasons for encounter in private clinics in 2012 39
Figure 7.1 Number of diagnoses managed per encounter in primary care clinics in 2012 42
Figure 7.2
by sector in 2012 43
Figure 8.1 Number of medications prescribed per encounter in primary care clinics in 2012 50
Figure 8.2
Figure 9.1 Number of investigations ordered per encounter in primary care clinics in 2012 62
Figure 9.2 Top 10 investigations ordered in public clinics in 2012 68
Figure 9.3 Top 10 investigations ordered in private clinics in 2012 68
Figure 10.1 Ten most common advice/counseling provided in public clinics in 2012 74
Figure 10.2 Ten most common advice/counseling provided in private clinics in 2012 74
Figure 10.3 Ten most common procedures performed in public clinics in 2012 76
Figure 10.4 Ten most common procedures performed in private clinics in 2012 76
LIST OF FIGURES

� � � � � � � � � � � � � � � � � � � � � � � � � � � �
� � �
Acknowledgements
The National Healthcare Statistics Initiative team would like to thank the Director-General of Health,
Malaysia for his continuous support for this survey and permission to publish this report.
Also, our sincere appreciation goes to the following for their participation, assistance, support and
contribution:
Swasta, CKAPS)
UKAPS).
Malaysia.
We thank the 392 medical doctors from both the public and private primary healthcare clinics who
participated in the National Medical Care Survey (NMCS) between August and November 2012. This
report would not have been possible without their support and contribution from these dedicated
professionals.
Last but not least, our greatest appreciation to all those who have supported or contributed to the success
of the National Medical Care Survey 2012 and the publication of this report.
Thank you.
National Healthcare Statistics Initiative (NHSI) Primary Care Team
Healthcare Statistics Unit
National Clinical Research Centre
Ministry of Health, Malaysia

� � � � � � � � � � � � � � � � � � � � � � � � � � � �
� � � �
NATIONAL MEDICAL CARE SURVEY 2012 PROJECT TEAM
Principal Investigator Datuk Dr. Noor Hisham Abdullah
Principal Co-InvestigatorDr. Sheamini Sivasampu
Dr. Goh Pik Pin
Research Evaluation Committee (REC)
Dr. Kamaliah Mohd. Noh
Professor Dr. Khoo Ee Ming
Associate Professor Dr. Ng Chirk Jenn
Dr. Kaviyarasan Sailin
Associate Professor Dr. Jamaluddin Abdul Rahman
Ms. Siti Fauziah Abu
Project Managers
Mr. Lim Ka Keat (September 2011 – September 2012)
Ms. Yvonne Lim Mei Fong
Dr. Hwong Wen Yea, Amy
Survey Coordinators Ms. Aisyah Ali
Ms. Sharmini Chandran
Mr. Shantha Kumar Chandrasekaran
Ms. Kasturi Manoharan
Ms. Siti Aminah Ismail
Ms. Hanan Hamimi Wahid
Ms. Maryam Nazeera Suhaimi
Mr. Poovanesva Rao Yang Ketter Rahman
Data AnalysisMs. Norazida Ab. Rahman
Ms. Yvonne Lim Mei Fong
Database Developers/Administrators Altus Solutions Sdn. Bhd.
� � � � � � � � � � � � � � � � � � � � � � � � � � � �
� �
ACE Angiotensin converting enzyme
ATC
BEACH Bettering the Evaluation and Care of Health
CI
CKAPS Cawangan Kawalan Amalan Perubatan Swasta
DG Director General of Health, Ministry of Health, Malaysia
FMS Family Medicine Specialist
GP General Practice or Practitioner
HbA1c Haemoglobin, type A1c
ICPC
IQR Interquartile range
KK Klinik Kesihatan
LCL
MOH Ministry of Health, Malaysia
MREC Medical Research and Ethics Committee, Ministry of Health Malaysia
NCD Non-communicable disease
NCRC National Clinical Research Centre
NHEWS National Healthcare Establishment & Workforce Survey (Primary Care)
NHSI National Healthcare Statistics Initiative
NIH National Institutes of Health
NMCS National Medical Care Survey
NMUS National Medicines Use Survey
NOS
REC Research Evaluation Committee
RFEs Reasons for encounter
SOCSO Social Security Organisation
UCL
UKAPS Unit Kawalan Amalan Perubatan Swasta
WHO World Health Organisation
WONCAWorld Organization of National Colleges, Academies and Academic Associations
of General Practitioners/Family Physicians
WP Wilayah Persekutuan
ABBREVIATIONS

� � � � � � � � � � � � � � � � � � � � � � � � � � � �
�
- Not applicable
> More than
More than or equal to
< Less than
% Percentage
SYMBOLS

� � � � � � � � � � � � � � � � � � � � � � � � � � � �
�
EXECUTIVE SUMMARY
The National Medical Care Survey (NMCS) is a provider-based survey, which aims to study the
characteristics and morbidity pattern of patients, as well as healthcare activities in terms of investigations,
procedures, counselling and visit disposition provided at primary care level in Malaysia.
to region and sector, and selected through random sampling. Doctors from these clinics were asked to
November 2012.
This report presents data collected from 69 public clinics and 120 private clinics.
Doctors working at primary care clinics
A total of 408 doctors participated in NMCS 2012; 259 (63.5%) from public clinics and 149 (36.5%) from
private clinics. Of these, 350 doctors provided their socio-demographic details (229 public doctors and 121
private doctors).
clinics (76.4%; 175/229) as compared to private clinics (39.7%; 48/121).
39 years old. On the contrary, 62.8% of the doctors in private clinics and 6.9% in public clinics were
over 50 years old.
Patients seen at primary care clinics
There were 141,593 patient encounters recorded for NMCS 2012; 42,340 encounters (29.9%) were from
public clinics and 99,253 encounters (70.1%) from private clinics.
(11.5%).
percentage of older patients were seen in public clinics where 20.7% of patients in public clinics and
others (5.6%).
such as insurance. Visits to public clinics were all subsidised by government with a minimal charge
of RM1 per encounter and is free for patients older than 60 years.
The duration of sick leave ranged from half day to 21 days.
Reasons for seeking treatment at primary care clinics
Reason for seeking treatment is also otherwise known as reasons for encounter (RFEs). From the 141,593
patient encounters, 233,326 RFEs were recorded; 73,616 (31.5%) in public clinics and 159,710 (68.5%) in
private clinics. Overall, there were 165 RFEs for every 100 patient encounters.

� � � � � � � � � � � � � � � � � � � � � � � � � � � �
�
made up 17.7% (13,028) of all RFEs (31 per 100 encounters). This was followed by diabetes (20 per
100 encounters) and lipid disorder (19 per 100 encounters).
of 25 per 100 encounters. Abdominal pain was the third highest and seen in 10 out of 100 encounters.
Types of diagnosis
Of the 141,593 patient encounters at primary care clinics, 188,944 diagnoses were made with average 133
diagnoses made per 100 patient encounters. In public clinics, there were 68,877 diagnoses (36.5%) at a
rate of 163 diagnoses per 100 encounters. Private clinics managed 120,067 diagnoses (63.5%) at a rate of
121 diagnoses per 100 encounters.
100 patient encounters, 33 had the diagnosis of hypertension and it was the commonest diagnosis.
This was followed by lipid disorder (22 per 100 encounters) and diabetes (24 per 100 encounters). In
private clinics however, hypertension diagnosis was made in only 5 out of 100 encounters, diabetes
in 3 per 100 encounters and lipid disorder in 2 per 100 encounters.
illnesses. The most common diagnosis in private clinics was upper respiratory infection that
contributed to 21.5% of all diagnoses in private clinics and diagnosed in 26 out of 100 encounters.
Gastrointestinal infection was the second most common diagnosis, though it only constituted 5.0%
of diagnoses (6 per 100 encounters).
Medications prescribed
A total of 479,856 medications were recorded, at an average of 254 medications per 100 encounters and
190 medications per 100 diagnoses. Public clinics prescribed a total of 130,484 medications (244 per
100 encounters; 150 per 100 diagnoses) and private clinics prescribed 255,788 medications (258 per 100
encounters; 213 per 100 diagnoses).
and 90.3% in private clinics.
metformin (17 per 100 encounters), amlodipine (16 per 100 encounters), lovastatin (15 per 100
encounters), and perindopril (13 per 100 encounters).
diphenhydramine (10 per 100 encounters), diclofenac (9 per 100 encounters), chlorphenamine (8 per
100 encounters), and butylscopolamine (8 per 100 encounters).
Investigations ordered
There were 53,028 investigations recorded, of which 64.4% was ordered by doctors at public clinics. The
average rate of investigation ordered was 38 per 100 encounters; public clinics had 81 investigations per
100 encounters and private clinics had 19 investigations per 100 encounters.
test constituted 21.4% of all investigations.
In private clinics, urine test was most common (4 per 100 encounters).
were ordered.
� � � � � � � � � � � � � � � � � � � � � � � � � � � �
�
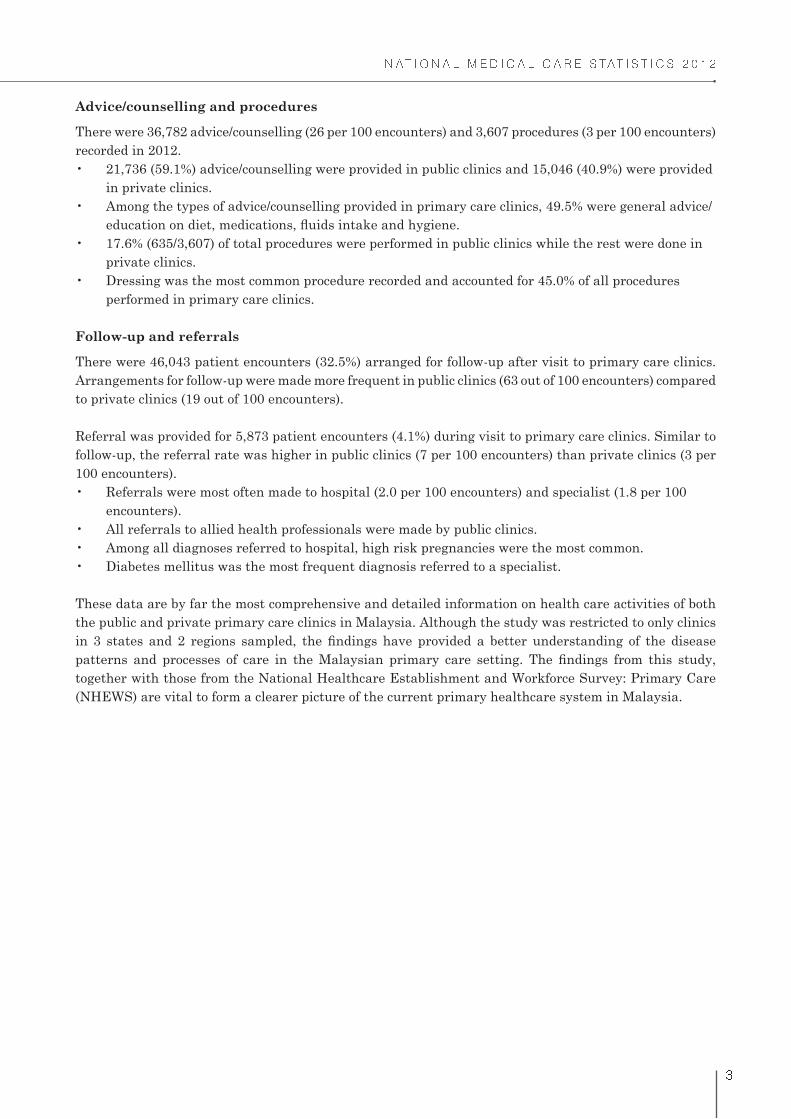
Advice/counselling and procedures
There were 36,782 advice/counselling (26 per 100 encounters) and 3,607 procedures (3 per 100 encounters)
recorded in 2012.
in private clinics.
private clinics.
performed in primary care clinics.
Follow-up and referrals
There were 46,043 patient encounters (32.5%) arranged for follow-up after visit to primary care clinics.
Arrangements for follow-up were made more frequent in public clinics (63 out of 100 encounters) compared
to private clinics (19 out of 100 encounters).
Referral was provided for 5,873 patient encounters (4.1%) during visit to primary care clinics. Similar to
follow-up, the referral rate was higher in public clinics (7 per 100 encounters) than private clinics (3 per
100 encounters).
encounters).
These data are by far the most comprehensive and detailed information on health care activities of both
the public and private primary care clinics in Malaysia. Although the study was restricted to only clinics
together with those from the National Healthcare Establishment and Workforce Survey: Primary Care
(NHEWS) are vital to form a clearer picture of the current primary healthcare system in Malaysia.


Chapter 1Introduction

� � � � � � � � � � � � � � � � � � � � � � � � � � � �
�
CHAPTER 1: INTRODUCTION
1.1 BACKGROUND
The National Healthcare Statistics Initiative (NHSI) is a family of surveys which aims to support
evidence-based health policy-making and research in Malaysia. It was initiated in 2009 by the Healthcare
Statistics Unit (HSU) in National Clinical Research Centre (NCRC) Kuala Lumpur in collaborations with
various stakeholders. Over the past 4 years, the NHSI has grown and managed to gain recognition due to
launched in 2010 and have met with numerous challenges which have led to the suspension of the project
consultation with local and international researchers as well as stakeholders during the year of suspension.
With more staff and support from the stakeholders, the management team of NMCS managed to publish
a short report based on NMCS 2010 data for public consumption.
In 2012, the survey was re-initiated with a revised methodology. A Research Evaluation Committee
(REC) comprising of respected academicians from the universities, representatives from Family Health
Division and Academy of Family Physician Malaysia as well as Pharmaceutical Services Division and a
statistician has been set up to discuss and advise the NMCS team with regards to the planned objectives
and methodology. The team has also managed to get good support from the Bettering the Evaluation and
Care of Health (BEACH) management team, a Family Medicine Research Centre team from University
of Sydney Australia1 who has given permission for NMCS 2012 questionnaire to be adapted from theirs.
NMCS 2012 is hoped to bring about more valuable data to all.
1.2 OBJECTIVES
General Objectives
1. To collect reliable and valid data in primary care setting.
2. To assess patient characteristics and morbidity pattern and the relationship these factors have
with health service activity.
3. To provide accurate and timely data to various stakeholders including government bodies, primary
care practitioners, consumers, researchers, and the pharmaceutical industry.
4. To establish an ongoing database of doctor/patient encounter information.
To collect information on clinical activities in primary care setting in Malaysia including:
o Pharmacological treatment prescribed, including the dose and frequency;
o Non-pharmacological treatment provided, including the procedures and counselling;
o Investigations ordered, including pathology and imaging;
o Follow up in primary care and referrals to secondary or tertiary care;
� � � � � � � � � � � � � � � � � � � � � � � � � � � �
The study also aims to provide more evidence on the prevalence of non-communicable diseases (NCDs)
in primary care settings and their process of care, in line with the National Strategic Plan for Non-
Communicable Disease (NSP-NCD) 2010 – 2014. In the National Strategic Plan, research has been
management.2
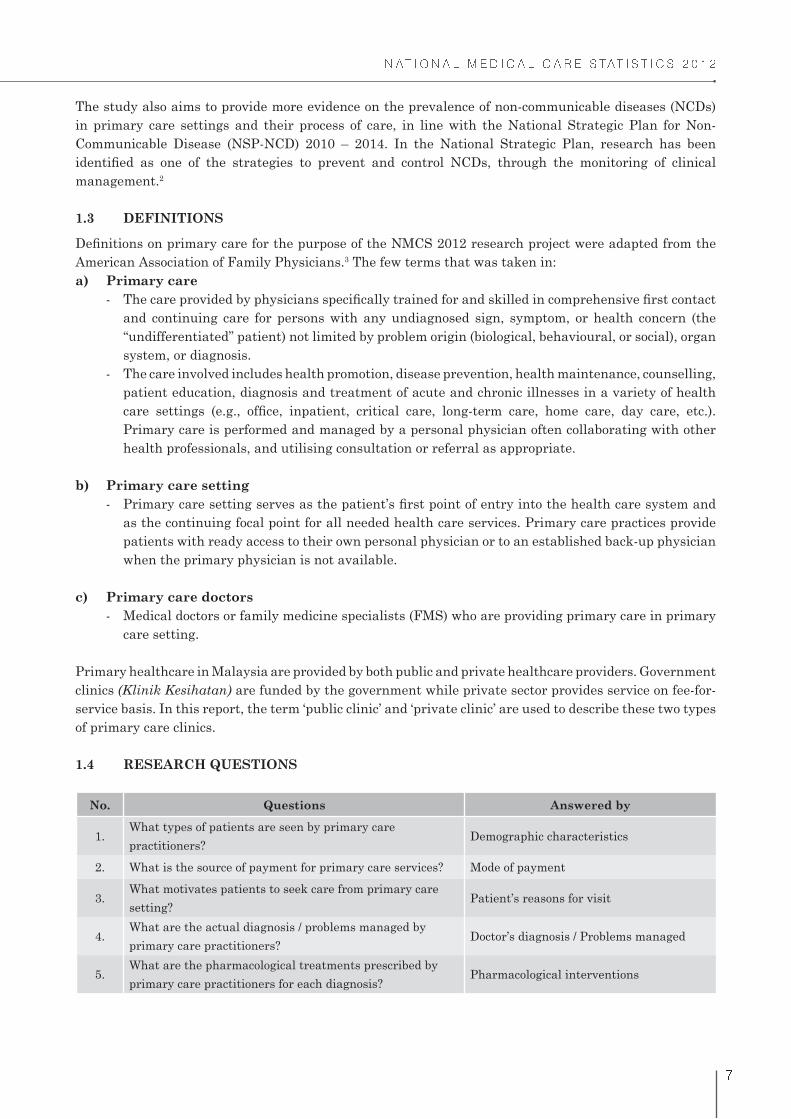
1.3 DEFINITIONS
American Association of Family Physicians.3 The few terms that was taken in:
a) Primary care
and continuing care for persons with any undiagnosed sign, symptom, or health concern (the
“undifferentiated” patient) not limited by problem origin (biological, behavioural, or social), organ
system, or diagnosis.
- The care involved includes health promotion, disease prevention, health maintenance, counselling,
patient education, diagnosis and treatment of acute and chronic illnesses in a variety of health
Primary care is performed and managed by a personal physician often collaborating with other
health professionals, and utilising consultation or referral as appropriate.
b) Primary care setting
as the continuing focal point for all needed health care services. Primary care practices provide
patients with ready access to their own personal physician or to an established back-up physician
when the primary physician is not available.
c) Primary care doctors
- Medical doctors or family medicine specialists (FMS) who are providing primary care in primary
care setting.
Primary healthcare in Malaysia are provided by both public and private healthcare providers. Government
clinics (Klinik Kesihatan) are funded by the government while private sector provides service on fee-for-
service basis. In this report, the term ‘public clinic’ and ‘private clinic’ are used to describe these two types
of primary care clinics.
1.4 RESEARCH QUESTIONS
No. Questions Answered by
1.What types of patients are seen by primary care
practitioners?Demographic characteristics
2. What is the source of payment for primary care services? Mode of payment
3.What motivates patients to seek care from primary care
setting?Patient’s reasons for visit
4.What are the actual diagnosis / problems managed by
primary care practitioners?Doctor’s diagnosis / Problems managed
5.What are the pharmacological treatments prescribed by
primary care practitioners for each diagnosis?Pharmacological interventions

� � � � � � � � � � � � � � � � � � � � � � � � � � � �
!
No. Questions Answered by
6.What are the procedures and imaging ordered by primary
care practitioners for the diagnosis / problems?Non-pharmacological interventions
7.What types of counselling are offered by primary care
practitioners for the diagnosis / problems?Non-pharmacological interventions
8. Is there any continuity of care in primary care setting? Referrals / Follow Up
9.What is the extent of the loss of productivity for the
morbidities in primary care setting? sick leave
Each research question is described in separate chapter in this report. However, patients’ mode of payment
characteristics.
REFERENCES
1. The University of Sydney, Family Medicine Research Centre. Bettering the Evaluation and Care
of Health (BEACH). [Viewed January 2014]. Available from: http://sydney.edu.au/medicine/fmrc/
beach/index.php
2. National Strategic Plan for Non-Communicable Disease 2010 – 2014. Ministry of Health Malaysia
(2010).
3. American Association of Family Physicians (AAFP). Primary Care. [Viewed January 2014].
Available from: http://www.aafp.org/online/en/home/policy/policies/p/primarycare.html

Chapter 2Methodology

� � � � � � � � � � � � � � � � � � � � � � � � � � � �
� "
CHAPTER 2: METHODOLOGY
The 2012 National Medical Care Survey (NMCS) is a prospective cross-sectional study. The observation
unit was the patient encounters. As it was not possible to randomly select the encounters from all the
study location, random sampling was done on the primary care clinics in the 5 selected regions instead.
The chosen regions were
Wilayah Persekutuan
region of Peninsular Malaysia
A total period of 4 months was allocated for data collection from August 1st till November 30th 2012
where all sampled clinics were randomly allocated one day for data recording in their respective clinics.
2.1 SAMPLING FRAME AND SAMPLE SIZE CALCULATION
The sampling frame of public and private clinics was generated by matching the list of clinics from
National Healthcare Establishments and Workforce Survey (NHEWS) 2010 with several sources:
Malaysia.
Malaysia (often referred to as Cawangan/Unit Kawalan Amalan Perubatan Swasta (CKAPS/
UKAPS).
Both lists were updated as of 31st December 2011 and these were the most recent lists of clinics at the
point of survey.
determine the existence or current operational status of the establishments. Those that were found to be
closed were removed from the sampling frame.
Inclusion and exclusion criteria for the clinics sampled in the survey were as follow:
Inclusion
criteria
MOH Health Clinics (Klinik Kesihatan) providing primary care services by medical doctors
Private medical clinics registered with CKAPS and providing primary care services
Exclusion
criteria
Outpatient departments within hospital or maternity homes
Public clinics with the following criteria:
- Klinik Kesihatan without medical doctors
- Clinics providing maternal and child health services only (Klinik Kesihatan Ibu dan Anak)
- Rural clinics (Klinik Desa)
- 1 Malaysia Clinics
- Primary care clinics in universities
Private clinics with the following criteria:
- In-house clinics/company clinics
- Clinics providing specialised care/specialist clinics e.g. paediatric, cardiology, occupational
therapy
- Diagnostic centres
- Aesthetic clinics
- Charity clinics
� � � � � � � � � � � � � � � � � � � � � � � � � � � �
� �
encounters needed.
Stage 1: Selection of sampling regions (convenience/purposive sampling)
Stage 3: Sampling of clinics
and exclusion criteria were taken into account during sampling process.
Stage 4: Sampling of doctors
Stage 5: Sampling of encounters
public clinics and minimum of 20 encounters per private clinic.
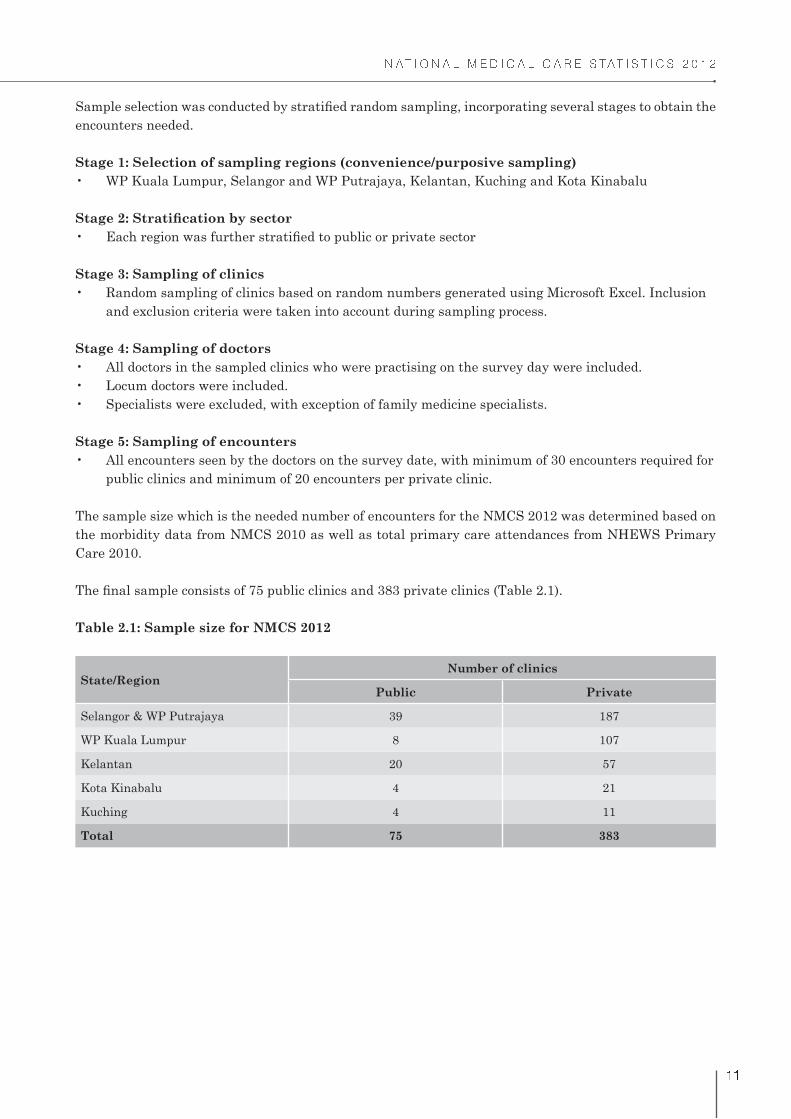
The sample size which is the needed number of encounters for the NMCS 2012 was determined based on
the morbidity data from NMCS 2010 as well as total primary care attendances from NHEWS Primary
Care 2010.
Table 2.1: Sample size for NMCS 2012
State/RegionNumber of clinics
Public Private
Selangor & WP Putrajaya 39 187
WP Kuala Lumpur 8 107
Kelantan 20 57
Kota Kinabalu 4 21
Kuching 4 11
Total 75 383

� � � � � � � � � � � � � � � � � � � � � � � � � � � �
� �
2.2 SURVEY DATES
All sampled clinics were given one randomly assigned date for data collection, which was a working day
for all. The following days were excluded:
If the clinic was closed on the survey date, the doctor had the option to change the survey date to the next
available working day. The research team however was informed of the new survey date.
2.3 DATA COLLECTION AND FOLLOW-UP
for doctors in the public clinics were held on weekdays whereas for private doctors, it was during the
weekends from June to July 2012. A research pack which contained the survey forms and instructions
If the doctor refused to participate in the survey, the team did not pursue further. However, if they agree
to participate the research pack would be sent either
would be done over the phone to explain about the survey form.
would be given to the doctor/nurse in-charge
Two weeks and one day before the survey date, a reminder via telephone was made to the clinic about
the project and to answer any questions pertaining to the survey. Instructions would be repeated when
necessary. After the survey date, follow-up phone call(s) were made if the research pack was not returned
after 3 weeks, and subsequently at 5 weeks.
Various approaches were also taken to increase the acceptance and response rate of private clinics. This
included the following:
a) Approaching the manager/senior management of the chain clinics/group practices
activities
c) Getting support and assistance from Malaysian Medical Association (MMA) at the state level
claim for continuing professional development (CPD) points. An individualised feedback, questionnaire
on primary care prescribers, and a copy of the National Medical Care Statistics 2012 report were also sent
to all participants.

� � � � � � � � � � � � � � � � � � � � � � � � � � � �
� �
2.4 RESEARCH PACK AND QUESTIONNAIRE
A pre-testing session of the questionnaire was carried out by requesting a convenience sample of doctors
from public and private clinics to complete the forms. A total of 32 encounters were recorded, and
Survey Pads Each pad has
- 40 forms
- One set of instructions
- One case study
- One example of a completed form
Survey date and day
Project Summary Purpose and objective of NMCS 2012
Public NoticeNotice to be displayed in the participating clinic to inform patient that the
clinic is currently undertaking a MOH survey
Data Dictionary One-page description of variables in the survey form
ICPC-2-code List ICPC-2-Code list
Also included in the research pack:
Call LetterLetter signed by State Health Directors to inform the participating clinics of
the survey
Prepaid Envelope Two sets (1 for National Healthcare and Establishment Survey (NHEWS)
and 1 for NMCS). The one for NHEWS contains a NHEWS survey form and
a small envelope containing the user ID and password for those who prefer
online questionnaire for NHEWS.
*NHEWS Primary Care is a 4-pages questionnaire focusing on services and
workforce in the primary care setting
Report NHEWS 2010 Primary Care Report
2.5 DATA MANAGEMENT
2.5.1 Data entry
All data entry was done through the use of data entry web application and performed by trained data
entry personnel.
Prior to the start of data entry, data entry personnel were given reading materials containing the detailed
regulations. This was followed by two sessions of data entry training which lasted for 2 hours each.
Session 1: Demonstration

� � � � � � � � � � � � � � � � � � � � � � � � � � � �
� #
Session 2: Question and answer
2.5.2 Quality check on data entry
Double data entry was incorporated as part of the quality check on data. This form of quality check has
been recommended and known to correct data entry errors from the original entry.1
Double data entry was done for approximately 10.0% of the total entries in two batches where batch 1 was
completed in November 2012 and batch 2 in February 2013. The selection of clinics for the double entry
was random and data entry personnel were blinded towards the double data entry process.
Type of entry Number of forms
Single data entry 11,220
Double data entry 1,377
for each available variable was then calculated. The maximum data entry error percentage from each
batch was then compared.
Table 2.2: Data entry error rate for NMCS 2012
Variable Data entry error (%)
Batch 1 Batch 2
Coded variables
ICPC code 5.85 8.96
ATC code 0.23 5.28
Non-coded variables
Visit disposition 7.63 0.87
Gender 5.02 1.84
The two variables for the non-coding section were the variables with the highest data entry error rate
for batch 1. There was marked improvement in error rate for these variables from batch 1 to batch 2.
Increase of data entry error rate for the coded variables can be attributed to recruitment of new data
entry personnel, resulting in more variation in coding. Most of the coding errors were systematic errors;
data entry personnel had a misconception of the way a certain disease/medication is coded, thus making
a repetitive error of the same nature.
There does not appear to be a general consensus of acceptable data entry error rate worldwide. Previous
study has shown that error rates detected by double-entry method for clinical databases were 2.3 to 5.2%
(demographic data) and 10.0 to 26.9% (treatment data).2 Similarly, Fontaine P et al. reported an overall
rate of 7.3% for data entry strategies used in clinical trial.3
� � � � � � � � � � � � � � � � � � � � � � � � � � � �
� $
All the errors which were detected (coded and non-coded) were corrected by referring to the original forms
and by discussion among the investigators and the Research Evaluation Committee. Further systematic
checks were also conducted during data cleaning to ensure validity and reliability of the data. A protocol
with validation rules for cleaning as well as data inconsistency rules was created for data cleaning.
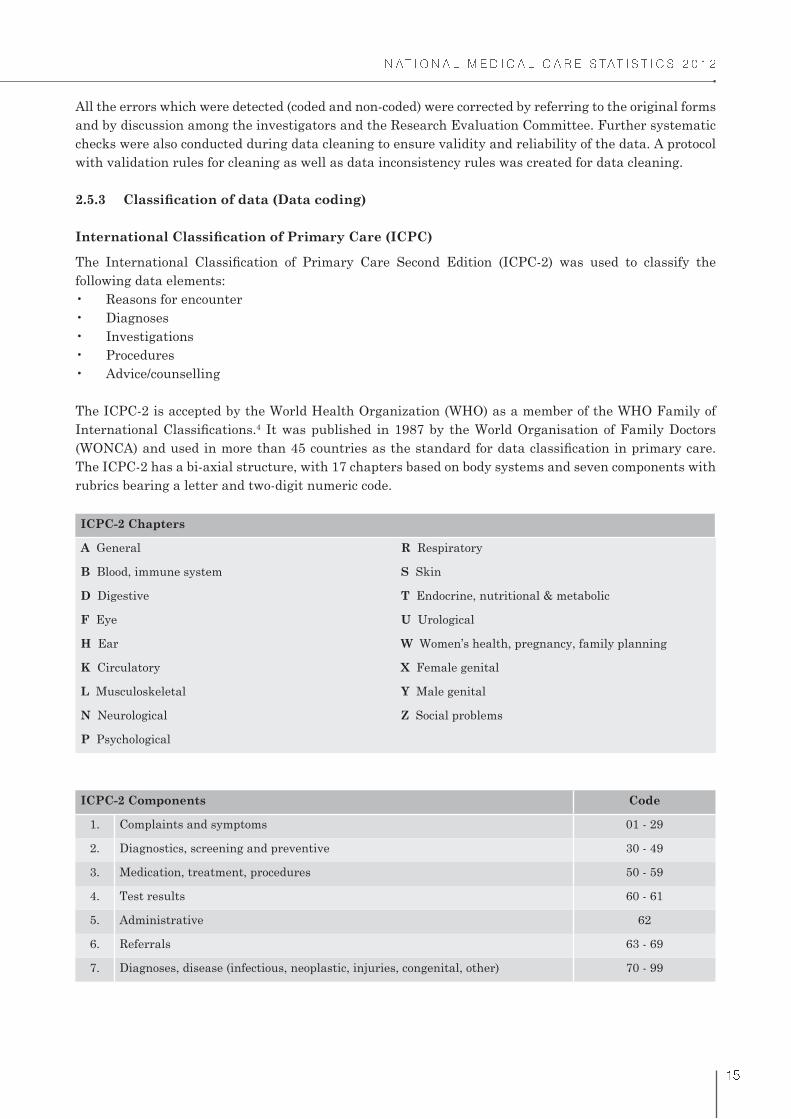
following data elements:
The ICPC-2 is accepted by the World Health Organization (WHO) as a member of the WHO Family of 4 It was published in 1987 by the World Organisation of Family Doctors
The ICPC-2 has a bi-axial structure, with 17 chapters based on body systems and seven components with
rubrics bearing a letter and two-digit numeric code.
ICPC-2 Chapters
A General R Respiratory
B Blood, immune system S Skin
D Digestive T Endocrine, nutritional & metabolic
F Eye U Urological
H Ear W Women’s health, pregnancy, family planning
K Circulatory X Female genital
L Musculoskeletal Y Male genital
N Neurological Z Social problems
P Psychological
ICPC-2 Components Code
1. Complaints and symptoms 01 - 29
2. Diagnostics, screening and preventive 30 - 49
3. Medication, treatment, procedures 50 - 59
4. Test results 60 - 61
5. Administrative 62
6. Referrals 63 - 69
7. Diagnoses, disease (infectious, neoplastic, injuries, congenital, other) 70 - 99
� � � � � � � � � � � � � � � � � � � � � � � � � � � �
� �
according to ICPC-2. ICPC-2 PLUS coding system contains extended terms commonly used in general
ICPC-2 PLUS was developed in 1995, and is maintained and regularly updated by the Family Medicine
Research Centre (FMRC) of the University of Sydney.5 Also known as BEACH coding system, ICPC-2
PLUS is primarily used in Australia especially for the national study of general practice activity, the
BEACH program.
The National Clinical Research Centre has been granted a free research licence from WONCA for the
usage of ICPC-2 codes which is valid from February 2011 till end of 2014 whereas the ICPC-2 PLUS was
obtained under a free licence from the University of Sydney.
endo/metabolic). Hence, results for Chapter 9: Investigations were presented as ICPC-2 PLUS.
Anatomical Therapeutic Chemical (ATC)
system. ATC has been recommended by the WHO and used in many countries including Malaysia, as
a global standard for classifying medications for drug utilisation research, evaluating trend of drug
consumption and for international comparisons.6,7
levels, with the following example:
The ATC licence was purchased from the WHO Collaborating Centre for Drug Statistics Methodology.
Medications were entered as free text in generic (non-proprietary) or brand name, and coded by trained 6 In
certain cases, the doctors might not specify the medications to the generic level hence it could only be
coded to ATC level 3 or 4.

� � � � � � � � � � � � � � � � � � � � � � � � � � � �
�
2.6 DATA ANALYSIS
2.6.1 Weighting
The data presented in this report were weighted to adjust for over and under representativeness of any
the study population, by state/region and sector. The components incorporated in the estimation of total
weights are described below.
Sampling weight
The sampling weight of each stratum calculated as follow:
Wj = N
j/n
j
where
N is the total encounters for primary care clinics per day in the state/region (population), and n is the total
encounters expected (sample) for strata j.
j = strata according to sector and state/region
Strata according to state/region and sector
State/Region Sector Stratum
Selangor & WP PutrajayaPublic 1
Private 2
WP Kuala LumpurPublic 3
Private 4
KelantanPublic 5
Private 6
Kota KinabaluPublic 7
Private 8
KuchingPublic 9
Private 10
To account for less than 100% response rate, adjustment for the non-response is required. The non-
response adjustment weight was calculated as a ratio of number of expected encounters as the numerator
and number of responding encounters as the denominator.
Total weights
2.6.2 Statistical Analysis
STATA Version 11 (StataCorp. 2009. Stata Statistical Software: Release 11. College Station, TX; StataCorp
LP.) and IBM SPSS Statistics for Windows (Version 20.0. Armonk, NY: IBM Corp) were used for data
analysis. Results were presented as number of observations, proportions, and rate per 100 encounters

� � � � � � � � � � � � � � � � � � � � � � � � � � � �
� !
occur at more than once per diagnosis.
2.7 ETHICAL ISSUES
The study was approved by the Medical Research and Ethics Committee (MREC), MOH. As per previous
study, a public notice was placed at each participating clinic to inform patients that their data would
be collected for research purposes. Patients had the right to decline to participate at any point of time
throughout the study period.
2.8 LIMITATIONS
1. Only 3 states (Selangor and WP Putrajaya, WP Kuala Lumpur, and Kelantan) and 2 regions
prescription pattern in these state and regions and cannot be projected to represent the entire nation.
2. The survey is self-administered and therefore precision of data depends largely on the completeness
setting rather than the prevalence of disease in the community.
There may be co-morbidity in the same patient which was not expected to be managed during the
encounter and hence was not recorded.
5. The survey is a cross-sectional study. Therefore, no conclusions may be generated on the outcomes
of management of acute and chronic diseases in the primary care setting. Prescriptions, procedures,
imaging and referrals reported were those provided at the present point of encounter and did not
necessarily indicate that the patient has not already received them in a previous encounter.
REFERENCES
1. Atkinson I. Accuracy of data transfer: double data entry and estimating levels of error. J Clin Nurs.
2012; 21(19-20):2730-5.
2. Goldberg SI, Niemierko A, Turchin A. Analysis of Data Errors in Clinical Research Databases. AMIA
Annu Symp Proc. 2008;2008:242-246.
3. Fontaine P, Mendenhall TJ, Peterson K, Speedie SM. The “Measuring Outcomes of Clinical
Connectivity” (MOCC) Trial: Investigating Data Entry Errors in the Electronic Primary Care
Research Network (ePCRN) J Am Board Fam Med. 2007;20(2):151-9.
of Primary Care. [Viewed January 2014]. Available from: http://sydney.edu.au/medicine/fmrc/icpc-2/
index.php
DDD Assignment 2012. Oslo 2011. [Viewed February 2014]. Available from: www.whocc.no
7. Pharmaceutical Services Division and Clinical Research Centre, Ministry of Health Malaysia.
Malaysian Statistics on Medicine 2008. Kuala Lumpur 2013.

Chapter 3Response Rate

� � � � � � � � � � � � � � � � � � � � � � � � � � � �
� "
CHAPTER 3: RESPONSE RATE
This chapter describes the survey sample and response rate for NMCS 2012. Table 3.1 shows the number
of clinics sampled and number of clinics responded to the survey. A total of 69 public clinics and 120 private
clinics participated in NMCS 2012, and listed in Appendix 3. The response rates were then calculated
as the number of encounters that were recorded for NMCS 2012 divided by the expected number of
encounters in the sample (Table 3.2).
Table 3.1: Total clinics sampled and responded for NMCS 2012
State/Region SectorNumber of clinics
sampled
Number of clinics
responded
Percentage of clinics
responded (%)
Selangor & WP
Putrajaya
Public 39 34 87.2
Private 187 53 28.3
WP Kuala LumpurPublic 8 8 100.0
Private 107 30 28.0
KelantanPublic 20 19 95.0
Private 57 24 42.1
Kota KinabaluPublic 4 4 100.0
Private 21 9 42.9
KuchingPublic 4 4 100.0
Private 11 4 36.4
TotalPublic 75 69 92.0
Private 383 120 31.3
Table 3.2: Response rate for NMCS 2012
State/Region SectorTotal encounters
expected
Total encounters
responded
Response rate
(%)
Selangor & WP
Putrajaya
Public 1,777 4,172 100.0
Private 5,375 1,766 32.9
WP Kuala LumpurPublic 384 698 100.0
Private 3,040 717 23.6
KelantanPublic 931 979 100.0
Private 1,636 892 54.5
Kota KinabaluPublic 253 1,255 100.0
Private 595 218 36.6
KuchingPublic 566 1,753 100.0
Private 327 147 45.0
TotalPublic 3,911 8,857 100.0
Private 10,973 3,740 34.1

� � � � � � � � � � � � � � � � � � � � � � � � � � � �
� �
100.0%. However, the maximum response rate was reported as 100.0% as in Table 3.2. As for private
sector, despite our fervent attempts to persuade the private GPs to participate the response rate for WP
Kuala Lumpur was only 23.6%, bringing down the overall response rate for private sector to 34.0%.
The low response rate however, has already been anticipated and accounted for. When calculating sample
size, the sampling matrix had included an estimation of a 30.0% drop-out rate from the public and a 70.0%
drop-out rate from the private sector. This huge estimated rate of drop-out from the private sector was
expected based on previous studies conducted comparing public and private health sectors in Malaysia.
The reported response rate from private clinics in these studies was between 26.0% to 33.0%.1, 2
3.1 THE ENCOUNTERS
A total of 12,597 encounters were collected for NMCS 2012. Of these, 28 encounters were excluded from
12,569; 8,837 from public and 3,732 from private. The dataset were weighted to adjust for over and under
representativeness of data (see section 2.6.1). Table 3.3 shows the observed and weighted total for each
describe the results in this report.
Table 3.3: Observed and weighted dataset for NMCS 2012
VariableObserved Weighted
Overall Public Private Overall Public Private
Encounters 12,569 8,837 3,732 141,593 42,340 99,253
Reasons for encounter 21,359 15,452 5,907 233,326 73,616 159,710
Diagnoses 18,904 14,429 4,475 188,944 68,877 120,067
Medications 31,377 21,709 9,668 359,272 103,484 255,788
Investigations 7,687 6,983 704 53,028 34,139 18,889
Advice/counselling and
procedures
5,540 4,831 709 40,389 22,372 18,017
Follow-up and referrals 10,935 9,951 984 73,672 47,652 26,020
REFERENCES
1. Teng CL, Tong SF, Khoo EM, Lee V, Zailinawati AH, Mimi O et al. Antibiotics for URTI and UTI
-- prescribing in Malaysian primary care settings. Australian Family Physician. 2011; 40(5):325-9.
2. Mimi O, Tong SF, Nordin S, Teng CL, Khoo EM, A Abdul-Rahman et al. A comparison of morbidity
patterns in public and private primary care clinics in Malaysia. Malaysian Family Physician. 2011;
6(1):19-25.


Chapter 4The Doctors
� � � � � � � � � � � � � � � � � � � � � � � � � � � �
� #
CHAPTER 4: THE DOCTORS
This chapter reports the characteristics of doctors who participated and recorded the primary care visits
for NMCS 2012. Data for these doctors were obtained through linkage with National Healthcare and
Establishments Workforce Survey: Primary Care (NHEWS) database which captured information on
services and workforce in primary care setting, including the doctors’ socio-demographic details. NHEWS
questionnaire. Details on NHEWS Primary Care were described elsewhere.1
A total of 408 doctors from public and private clinics participated in the NMCS 2012. The data for the
doctors were not weighted and extrapolated due to scarcity of national sample frame of doctors practising
in primary care clinics in Malaysia.
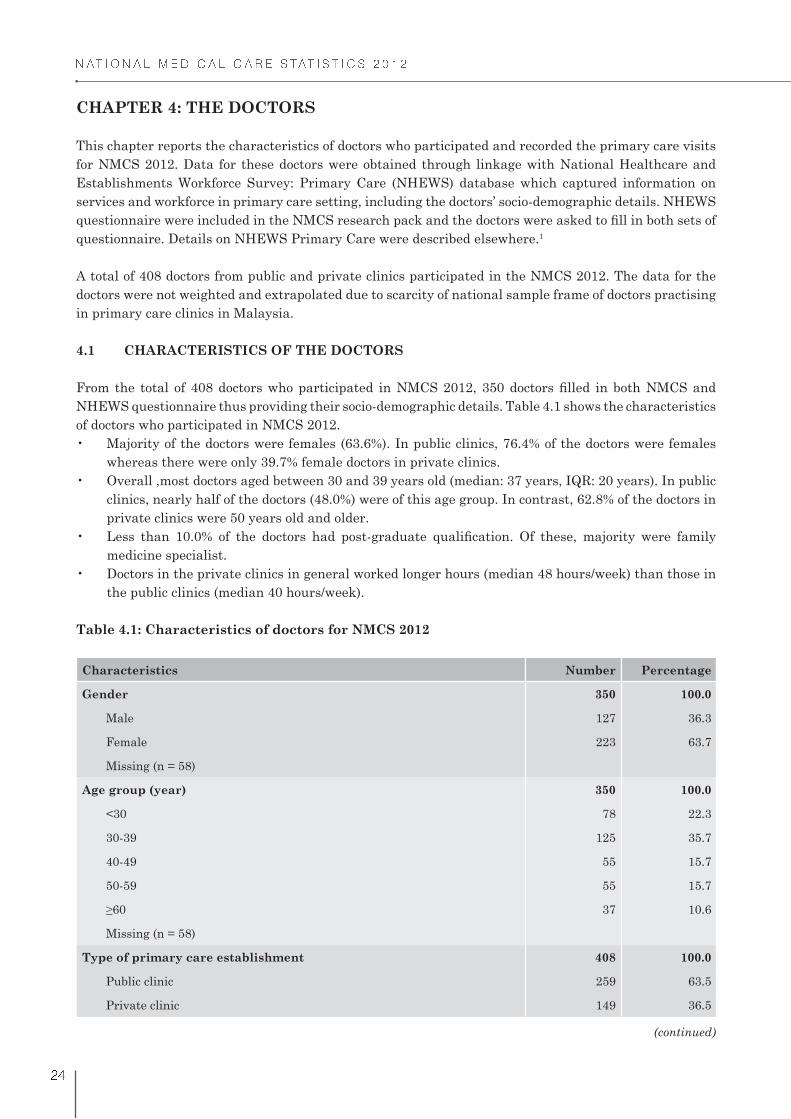
4.1 CHARACTERISTICS OF THE DOCTORS
NHEWS questionnaire thus providing their socio-demographic details. Table 4.1 shows the characteristics
of doctors who participated in NMCS 2012.
whereas there were only 39.7% female doctors in private clinics.
clinics, nearly half of the doctors (48.0%) were of this age group. In contrast, 62.8% of the doctors in
private clinics were 50 years old and older.
medicine specialist.
the public clinics (median 40 hours/week).
Table 4.1: Characteristics of doctors for NMCS 2012
Characteristics Number Percentage
Gender 350 100.0
Male 127 36.3
Female 223 63.7
Missing (n = 58)
Age group (year) 350 100.0
<30 78 22.3
30-39 125 35.7
40-49 55 15.7
50-59 55 15.7
37 10.6
Missing (n = 58)
Type of primary care establishment 408 100.0
Public clinic 259 63.5
Private clinic 149 36.5
(continued)

� � � � � � � � � � � � � � � � � � � � � � � � � � � �
� $
Characteristics Number Percentage
350 100.0
Family Medicine 16 4.6
Others: public health, occupational medicine, health services management 6 1.7
None 328 93.7
Missing (n = 58)
Working hours per doctor per week (hours)(a) 42 (40-45)
Public 40 (40-45)
Private 48 (42-60)
(a) displayed as median (interquartile range)
REFERENCE
1. Hwong WY, Sivasampu S, Aisyah A, Shantha Kumar C, Goh PP, Hisham AN. National Clinical
Research Centre. National Healthcare Establishment and Workforce Statistics (Primary Care)
2012. Kuala Lumpur 2014.
Table 4.1 (continued): Characteristics of doctors for NMCS 2012


Chapter 5The Patients

� � � � � � � � � � � � � � � � � � � � � � � � � � � �
� !
CHAPTER 5: THE PATIENTS
This chapter reports the socio-demographic characteristics of the patient encounters. Mode of payment
visits are also discussed in this chapter.
5.1 AGE-GENDER DISTRIBUTION OF PATIENTS
The overall distribution of patients at the point of encounter by age and gender was presented in Figure
5.1.
years and declined as the age increased.
numbers of antenatal visits within this female reproductive age group and the greater likelihood of
delay in seeking help during illness among the males.1
Figure 5.1: Age-gender distribution of patients in primary care clinics in 2012
5.2 PATIENT SOCIO-DEMOGRAPHIC CHARACTERISTICS
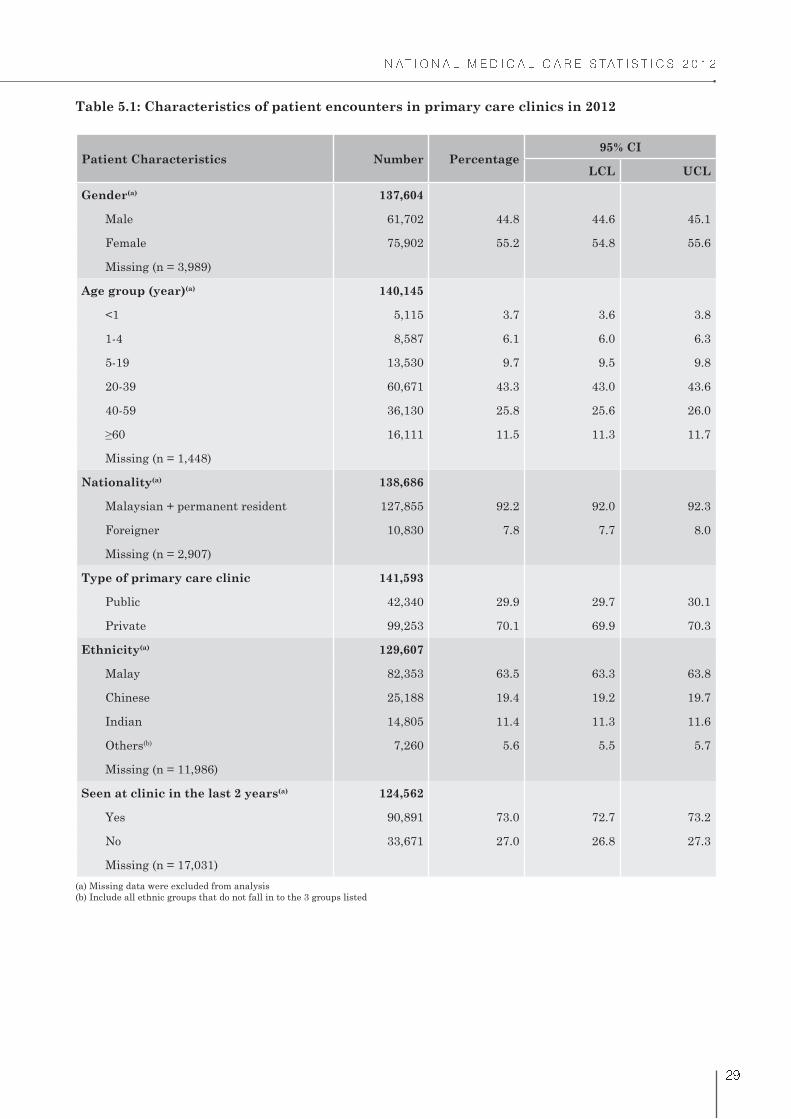
Table 5.1 shows the socio-demographic characteristics of the patients.
encounters by non-Malaysians (7.8%) corresponds to the reported 8.2% of non-citizens from the total
general population.2
ethnicity reported for NMCS 2012 were similar to general population data as reported by the
Department of Statistics Malaysia.2
years) currently make up 5.3% of the Malaysian population and this number is projected to reach
7.3% by 2021.3 Thus, the proportion of attendances by patients of this age group and complexity of
morbidities in primary care is anticipated to increase as the population ages.
Male
Percent
Age Group (years)
Female
<1 1-4 5-19 20-39 40-59 >60
1.9
30
25
20
15
10
5
0
3.0 5.0 16.9 12.7 5.1
1.7 3.0 4.5 26.1 13.3 6.6
Note: Missing data removed
� � � � � � � � � � � � � � � � � � � � � � � � � � � �
� %
Table 5.1: Characteristics of patient encounters in primary care clinics in 2012
Patient Characteristics Number Percentage95% CI
LCL UCL
Gender(a) 137,604
Male 61,702 44.8 44.6 45.1
Female 75,902 55.2 54.8 55.6
Missing (n = 3,989)
Age group (year)(a) 140,145
<1 5,115 3.7 3.6 3.8
1-4 8,587 6.1 6.0 6.3
5-19 13,530 9.7 9.5 9.8
20-39 60,671 43.3 43.0 43.6
40-59 36,130 25.8 25.6 26.0
16,111 11.5 11.3 11.7
Missing (n = 1,448)
Nationality(a) 138,686
Malaysian + permanent resident 127,855 92.2 92.0 92.3
Foreigner 10,830 7.8 7.7 8.0
Missing (n = 2,907)
Type of primary care clinic 141,593
Public 42,340 29.9 29.7 30.1
Private 99,253 70.1 69.9 70.3
Ethnicity(a) 129,607
Malay 82,353 63.5 63.3 63.8
Chinese 25,188 19.4 19.2 19.7
Indian 14,805 11.4 11.3 11.6
Others(b) 7,260 5.6 5.5 5.7
Missing (n = 11,986)
Seen at clinic in the last 2 years(a) 124,562
Yes 90,891 73.0 72.7 73.2
No 33,671 27.0 26.8 27.3
Missing (n = 17,031)
(a) Missing data were excluded from analysis
(b) Include all ethnic groups that do not fall in to the 3 groups listed

� � � � � � � � � � � � � � � � � � � � � � � � � � � �
� "
5.3 MODE OF PAYMENT
Figure 5.2 describes the mode of payment for encounters in primary care clinics.
of visits to public clinics.
were either fully or partially paid by third party payers. Third party payer payments include those
by private insurance, employer and managed care organisations.
party payers.
Figure 5.2: Mode of payment in primary care clinics in 2012
5.4 MEDICAL CERTIFICATE AND DURATION OF SICK LEAVE
visiting public clinics and 34.9% of patients at private clinics. The number of days of sick leave that were
documented ranged from half day to 21 days (Table 5.2).
Ra
te p
er 1
00 e
nco
un
ters
36.4
31.8 31.5
0.2 0.2
40
35
30
25
20
15
10
5
0
Out - of -pocket Out - of -pocket +
Third party
prayer
Government
subsidy
Third party
prayer
No
payment

� � � � � � � � � � � � � � � � � � � � � � � � � � � �
� �
Table 5.2: Duration of sick leave issued in primary care clinics in 2012
Duration of sick leave (day) NumberRate per 100
encounters
95% CI
LCL UCL
0.5 - 1 27,844 83.0 82.6 83.4
1.5 - 2 5,045 15.0 14.7 15.4
3 - 7 637 1.9 1.8 2.1
>7 21 0.1 0.0 0.1
Subtotal(a) 33,547 100.0 100.0 100.0
REFERENCES
1. Galdas PM, Cheater F, Marshall P. Men and health help-seeking behaviour: literature review. J Adv
Nurs. 2005;49(6):616-23.
2. Department of Statistics, Malaysia. Population distribution and basic demographic characteristics
2010. [Viewed January 2014]. Available from: http://www.statistics.gov.my/portal/download_
3. Department of Statistics, Malaysia. Population projections 2010-2040. Nov 2012. [Viewed January
projections/Population_Projection_2010-2040.pdf
Yes
No
28.7%
71.3%


Chapter 6Reasons For Encounter

� � � � � � � � � � � � � � � � � � � � � � � � � � � �
� #
CHAPTER 6: REASONS FOR ENCOUNTER
Reasons for encounter (RFE) or patients’ presenting complaint refers to the reasons why a patient
seeks health care; whether due to a symptom or complaint, follow-up on a known problem, request for
screening or diagnostic investigations, request for medical management or administrative procedures.
The documentation of RFE is important in the patient-centred approach as it takes into consideration
the patient’s perspective of why he or she seeks health services. The RFE also serves as the basis for 1
This chapter reports the RFE of the patients. Doctors were allowed to record RFEs based on three major
types of complaints; symptoms, a follow-up on a known diagnosis or a procedure or administrative request.
6.1 NUMBER OF REASONS FOR ENCOUNTER PER VISIT
Figure 6.1 shows the number of RFEs at encounter. There were 233,326 RFEs recorded for NMCS 2012.
Approximately 50.0% of encounters in both public and private clinics had only one RFE. Majority of
patients had between one to three RFEs at the point of visit. There were 3,201 encounters (2.3%) with no
known RFEs and recorded as not available (nil).
Figure 6.1: Number of patient reasons for encounter in primary care clinics in 2012
6.2 REASONS FOR ENCOUNTER BY ICPC-2 COMPONENTS
Table 6.1 shows the distribution of RFEs by ICPC-2 components.
‘other diagnoses, diseases’ which
congenital anomalies.
These include diagnostic and preventive procedures, request for medications, test results, medical
Nil One Two Three >Four
Public 1.1 49.2 29.1 16.7 3.8
Private 2.8 51.9 30.8 11.6 2.9
0
10
20
30
40
50
60
Percen
t o
f en
co
un
ters (
%)
Number of patient RFEs

� � � � � � � � � � � � � � � � � � � � � � � � � � � �
� $
Table 6.1: Reasons for encounter by ICPC-2 components in primary care clinics in 2012
ICPC-2 component Number
Percentage of
all RFEs
(n = 233,326)
Rate per 100
encounters
(n = 141,593)
95% CI
LCL UCL
Symptoms & complaints 138,664 59.43 97.93 97.86 98.00
Diagnosis, diseases 71,580 30.68 50.55 50.29 50.81
Infectious diseases 10,439 4.47 7.37 7.24 7.51
Neoplasms 100 0.04 0.07 0.06 0.09
Injuries 2,298 0.98 1.62 1.56 1.69
Congenital anomalies 68 0.03 0.05 0.04 0.06
Other diagnoses, diseases 58,675 25.15 41.44 41.18 41.70
Diagnostic and preventive
procedures19,899 8.53 14.05 13.87 14.24
Treatment procedures, medication 2,474 1.06 1.75 1.68 1.82
Test results 538 0.23 0.38 0.35 0.41
Administrative 114 0.05 0.08 0.07 0.10
Referral and other reasons for
encounter57 0.02 0.04 0.03 0.05
Total 233,326 100.00 164.78 - -
between RFEs recorded in public and private clinics (Table 6.2). Interestingly, majority of the RFEs
presented in public clinics were described as diseases (50.4%) whereas 70.6% of RFEs at private clinics
were of symptoms and complaints.
Table 6.2: Reasons for encounter by ICPC-2 components and sector
ICPC-2 Component
Public Private
NumberPercentage
of all RFEsNumber
Percentage
of all RFEs
Symptoms & complaints 25,951 35.25 112,713 70.57
Diagnosis, diseases 37,122 50.43 34,458 21.58
Infectious diseases 1,161 1.58 9,277 5.81
Neoplasms 18 0.02 82 0.05
Injuries 344 0.47 1,955 1.22
Congenital anomalies 31 0.04 37 0.02
35,568 48.32 23,107 14.47
Diagnostic and preventive procedures 9,887 13.43 10,011 6.27
Treatment procedures, medication 339 0.46 2,135 1.34
Test results 211 0.29 328 0.21
Administrative 77 0.10 37 0.02
Referral and other reasons for encounter 29 0.04 28 0.02
Total 73,616 100.00 159,710 100.00

� � � � � � � � � � � � � � � � � � � � � � � � � � � �
� �
6.3 REASONS FOR ENCOUNTER BY ICPC-2 CHAPTERS
Table 6.3 shows the distribution of patients’ RFE by ICPC-2 chapters and the most common RFEs within
each chapter (constituting at least 0.5% of all RFEs).
encounters. Cough formed the majority and seen in 22 out of 100 encounters.
chapter, fever was most frequently recorded.
chronic diseases.
Table 6.3: Reasons for encounter by ICPC-2 chapters and common individual reasons for
encounter within chapter in primary care clinics in 2012
Reasons for encounter Number
Percentage of
all RFEs
(n = 233,326)
Rate per 100
encounters
(n = 141,5 93)
95% CI
LCL UCL
Respiratory 53,742 23.0 38.0 37.7 38.2
Cough 30,937 13.3 21.8 21.6 22.1
Sneezing/nasal congestion 5,308 2.3 3.8 3.7 3.8
Throat symptom/complaint 5,198 2.2 3.7 3.6 3.8
3,708 1.6 2.6 2.5 2.7
Asthma 2,883 1.2 2.0 2.0 2.1
Upper respiratory infection,
acute2,494 1.1 1.8 1.7 1.8
46,742 20.0 33.0 32.8 33.3
Fever 29,355 12.6 20.7 20.5 20.9
Medical examination - general* 5,358 2.3 3.8 3.7 3.9
Dressing/pressure/compress/
tamponade1,629 0.7 1.2 1.1 1.2
Diagnostic radiology/imaging 1,485 0.6 1.0 1.0 1.1
Pain general/multiple sites 1,358 0.6 1.0 0.9 1.0
Trauma/injury NOS 1,193 0.5 0.8 0.8 0.9
Digestive 32,101 13.8 22.7 22.5 22.9
Abdominal pain* 11,870 5.1 8.4 8.2 8.5
Diarrhoea 8,093 3.5 5.7 5.6 5.8
Vomiting 5,157 2.2 3.6 3.5 3.7
Dyspepsia/indigestion 1,318 0.6 0.9 0.9 1.0
(continued)

� � � � � � � � � � � � � � � � � � � � � � � � � � � �
�
Reasons for encounter Number
Percentage of
all RFEs
(n = 233,326)
Rate per 100
encounters
(n = 141,593)
95% CI
LCL UCL
Endocrine/metabolic and
nutritional23,947 10.3 16.9 16.7 17.1
Diabetes* 11,408 4.9 8.1 7.9 8.2
Diabetes, non-insulin
dependent11,071 4.7 7.8 7.7 8.0
Diabetes, insulin dependent 337 0.1 0.2 0.2 0.3
Lipid disorder 10,423 4.5 7.4 7.2 7.5
Cardiovascular 20,790 8.9 14.7 14.5 14.9
Hypertension* 18,173 7.8 12.8 12.7 13.0
Musculoskeletal 12,764 5.5 9.0 8.9 9.2
Musculoskeletal symptom/
complaint*7,496 3.2 5.3 5.2 5.4
Back problem* 3,440 1.5 2.4 2.4 2.5
Pregnancy, childbearing, family
planning10,935 4.7 7.7 7.6 7.9
Medical examination -
pregnancy*9,259 4.0 6.5 6.4 6.7
Skin 9,848 4.2 7.0 6.8 7.1
Rash* 2,668 1.1 1.9 1.8 2.0
Pruritus 1,929 0.8 1.4 1.3 1.4
Neurological 8,784 3.8 6.2 6.1 6.3
Headache 5,428 2.3 3.8 3.7 3.9
Vertigo/dizziness 2,054 0.9 1.5 1.4 1.5
Eye 4,455 1.9 3.1 3.1 3.2
Red eye 1,057 0.5 0.7 0.7 0.8
Female genital 3,140 1.3 2.2 2.1 2.3
Menstrual problems* 1,829 0.8 1.3 1.2 1.4
Urological 2,241 1.0 1.6 1.5 1.6
Ear 1,603 0.7 1.1 1.1 1.2
Psychological 1,286 0.6 0.9 0.9 1.0
Blood, blood forming organs and
immune mechanism534 0.2 0.4 0.3 0.4
Male genital 380 0.2 0.3 0.2 0.3
Social problems 34 0.0 0.0 0.0 0.0
*Multiple ICPC-2 codes (see Appendix 2)
Table 6.3 (continued): Reasons for encounter by ICPC-2 chapters and common individual
reasons for encounter within chapter in primary care clinics in 2012

� � � � � � � � � � � � � � � � � � � � � � � � � � � �
� !
6.4 MOST COMMON REASONS FOR ENCOUNTER IN PUBLIC AND PRIVATE CLINICS
Figure 6.2 and Figure 6.3 show the 10 most common reasons for encounter in public and private clinics,
in decreasing order irrespective of ICPC-2 chapter or components.
encounters) than those seen in private clinics (161 per 100 encounters).
top three RFEs reported in public clinics were for chronic diseases whereas in private clinics most
RFEs were for acute complaints.
among 10 commonest RFEs. However, the proportion of patient who visited private clinics for
pregnancy examination was smaller (1.6 per 100 encounters).
Figure 6.2 Top 10 reasons for encounter in public clinics in 2012
2.6
3.3
3.6
4.1
11.6
15.7
18.0
19.4
20.0
30.8
0 5 10 15 20 25 30 35
Medical exam - general*
Musculoskeletal symptom/complaint*
Sneezing/nasal congestion
Abdominal pain*
Fever
Cough
Medical exam - pregnancy*
Lipid disorder
Diabetes*
Hypertension*
Rate per 100 encounters
*Multiple ICPC-2 code (see Appendix 2)

� � � � � � � � � � � � � � � � � � � � � � � � � � � �
� %
REFERENCE
1. Solera JK, Okkes I. Reasons for encounter and symptom diagnoses: a superior description of patients’
problems in contrast to medically unexplained symptoms (MUS). Family Practice. 2012; 29(3):272-
82.
Figure 6.3 Top 10 reasons for encounter in private clinics in 2012
*Multiple ICPC-2 code (see Appendix 2)
4.3
4.4
4.6
4.6
5.2
6.1
7.2
10.2
24.5
24.6
0 5 10 15 20 25 30
Medical exam - general*
Vomiting
Headache
Throat symptom/complaint
Hypertension*
Musculoskeletal symptom/complaint*
Diarrhoea
Abdominal pain*
Cough
Fever
Rate per 100 encounters


Chapter 7Diagnoses

� � � � � � � � � � � � � � � � � � � � � � � � � � � �
# �
CHAPTER 7: DIAGNOSES
This chapter highlights the diagnoses recorded by the doctors during patient visit to primary care clinics.
The doctors could record up to six diagnoses per encounter. However the diagnoses reported are limited
to disease/condition managed at the time of visit.
7.1 NUMBER OF DIAGNOSES PER ENCOUNTER
Number of diagnoses per visit in public and private clinics is presented in Figure 7.1. Overall, 90.0% of
the encounters have a range of one to two diagnoses per encounter. Majority of the visits were associated
with a single diagnosis, especially in private clinics and there were relatively fewer patients presented
with three or more diagnoses.
Figure 7.1 Number of diagnoses managed per encounter in primary care clinics in 2012
There were 188,944 diagnoses in total, at a rate of 133.4 per 100 encounters. Distributions of total
diagnoses according to sectors were as follow:
in public clinics.
genders aged 20 years onwards, where patients in public clinics were associated with a notably
higher rate of diagnoses.
their male counterparts. As for patients under 5 years old, the diagnosis rates for males were higher.
compared in each age group.
One Two Three
59.5 22.3 14.9 3.3
82.8 14.3 2.4 0.6
Percen
t o
f en
co
un
ters (
%)
0
10
20
30
40
50
60
70
80
90
Number of diagnoses per encounter

� � � � � � � � � � � � � � � � � � � � � � � � � � � �
# �
2012
7.2 DIAGNOSES BY ICPC-2 COMPONENT
The diagnoses were categorised by ICPC-2 components to describe the distribution of diagnoses managed
in primary care, as listed in Table 7.1. Diseases were used as diagnosis in 72.6% of all cases; majority
were for ‘other diagnoses’ (41.7%), followed by infections (29.5%), injuries (1.2%), neoplasm (0.1%) and
congenital anomalies (0.1%). Symptoms or complaints were used as diagnosis in 19.8% of all diagnoses
while diagnostic and preventive procedures (e.g. immunisations, medical examination) accounted for
7.2%.
Table 7.1: Diagnoses by ICPC-2 components in primary care clinics in 2012
ICPC-2 Component Number
Percentage of
all diagnoses
(n = 188,844)
Rate per 100
encounters
(n = 141,593)
95% CI
LCL UCL
Diagnosis, diseases 137,134 72.58 96.85 96.76 96.94
Infections 55,792 29.53 39.40 39.15 39.66
Injuries 2,278 1.21 1.61 1.54 1.68
Neoplasms 190 0.10 0.14 0.12 0.15
Congenital anomalies 139 0.07 0.10 0.08 0.12
Other diagnoses, diseases 78,736 41.67 55.61 55.35 55.87
Symptoms and complaints 37,328 19.76 26.36 26.13 26.59
Diagnostics and preventive procedures 13,620 7.21 9.62 9.47 9.77
Medications, treatments and therapeutics 613 0.32 0.43 0.40 0.47
Results 123 0.06 0.09 0.07 0.10
Referrals and other RFEs 93 0.05 0.07 0.05 0.08
Administrative 33 0.02 0.03 0.02 0.03
217.0
229.2
160.9
157.3
0
50
100
200
250
<1 year 1-4 years 5-19 years 20-39 years 40-59 years >60 years
Ra
te p
er 1
00 e
nco
un
ters
Age group (years)
Public, male
Public, female
Private, male
Private, female
Note: Missing data removed

� � � � � � � � � � � � � � � � � � � � � � � � � � � �
# #
7.3 DIAGNOSES BY ICPC-2 CHAPTER
Table 7.2 shows the distribution of diagnoses by ICPC-2 chapter, and most frequent diagnoses within
each chapter in an order of decreasing frequency. Only individual diagnoses constituting at least 0.5% of
all diagnoses were listed in Table 7.2.
diagnoses and 32.2% of patient encounters. Of these, upper respiratory infection was the commonest
(22.7 per 100 encounters).
patient encounters. Lipid disorder and diabetes were the most common diagnoses within this
chapter.
Hypertension was most frequently cited and formed the majority of diagnoses within cardiovascular
chapter.
Minor differences were noted between public and private clinics in relation to the distribution of diagnoses
by ICPC-2 chapter. For instance, endocrine/metabolic and cardiovascular problems were more frequently
managed in public clinics and accounted for higher proportion of all diagnoses in public compared to
private clinics. On the other hand, respiratory and digestive problems were more commonly managed at
private clinics. Nearly all chronic diseases were less frequently reported at private clinics and comprised
a lower percentage of all diagnoses managed in private clinics.
Table 7.2: Diagnoses by ICPC-2 chapters and common individual diagnoses within chapter
managed in primary care clinics in 2012
Diagnosis Number
Percentage of
all diagnoses
(n = 188,944)
Rate per 100
encounters
(n = 41,593)
95% CI
LCL UCL
Respiratory 45,614 24.14 32.22 31.97 32.46
Upper respiratory infection, acute 32,126 17.00 22.69 22.47 22.91
Asthma 3,881 2.05 2.74 2.66 2.83
Tonsillitis* 2,333 1.23 1.65 1.58 1.72
Cough 1,942 1.03 1.37 1.31 1.43
Acute bronchitis/bronchiolitis 1,168 0.62 0.83 0.78 0.87
Sinusitis acute/chronic 879 0.47 0.62 0.58 0.66
Endocrine/metabolic and nutritional 26,545 14.05 18.75 18.55 18.95
Lipid disorder 11,746 6.22 8.30 8.15 8.44
Diabetes* 11,757 6.22 8.30 8.6 8.45
Diabetes, non-insulin dependent 11,445 6.06 8.08 7.94 8.23
Diabetes, insulin dependent 312 0.17 0.22 0.20 0.25
Gout 1,124 0.59 0.80 0.75 0.84
(continued)

� � � � � � � � � � � � � � � � � � � � � � � � � � � �
# $
Diagnosis Number
Percentage of
all diagnoses
(n = 188,944)
Rate per 100
encounters
(n = 41,593)
95% CI
LCL UCL
Cardiovascular 21,997 11.64 15.54 15.35 15.73
Hypertension* 18,903 10.00 13.35 13.17 13.53
Ischaemic heart disease* 1,097 0.58 0.78 0.73 0.82
Digestive 20,195 10.69 14.26 14.08 14.45
Gastrointestinal infection* 6,959 3.68 4.92 4.80 5.03
Stomach function disorder 4,190 2.22 2.96 2.87 3.05
Abdominal pain* 1,635 0.87 1.16 1.10 1.21
Diarrhoea 1,493 0.79 1.06 1.00 1.11
Constipation 892 0.47 0.63 0.59 0.67
18,755 9.93 13.25 13.07 13.42
Medical examination - general* 5,223 2.76 3.69 3.59 3.79
Fever 4,350 2.30 3.07 2.98 3.16
site1,379 0.73 0.98 0.92 1.03
Infectious disease, other/NOS 1,311 0.69 0.93 0.88 0.98
Preventive immunisations/medications 1,241 0.66 0.88 0.83 0.93
Perinatal morbidity, other 674 0.36 0.48 0.44 0.51
Pregnancy, childbearing, family
planning11,820 6.26 8.35 8.20 8.49
Medical examination - pregnancy* 5,451 2.88 3.85 3.75 3.95
Pregnancy high risk 1,972 1.04 1.39 1.33 1.46
Gestational diabetes 1,450 0.77 1.03 0.97 1.08
Musculoskeletal 11,649 6.17 8.23 8.09 8.37
Musculoskeletal symptom/complaint* 4,574 2.42 3.23 3.14 3.32
Back problems* 2,779 1.47 1.96 1.89 2.04
Arthritis - all* 1,636 0.87 1.16 1.10 1.21
Osteoarthritis* 1,143 0.60 0.81 0.76 0.86
Dermatitis* 2,657 1.41 1.88 1.81 1.95
Dermatitis, contact/allergic 2,503 1.32 1.77 1.70 1.84
Dermatitis, seborrhoeic 103 0.05 0.07 0.06 0.09
Dermatitis, atopic eczema 51 0.03 0.04 0.03 0.05
Dermatophytosis 1,066 0.56 0.75 0.71 0.80
Skin injury, other 888 0.47 0.63 0.59 0.67
Urticaria 878 0.46 0.62 0.58 0.66
(continued)
Table 7.2 (continued): Diagnoses by ICPC-2 chapters and common individual diagnoses
within chapter managed in primary care clinics in 2012
� � � � � � � � � � � � � � � � � � � � � � � � � � � �
# �
Diagnosis Number
Percentage of
all diagnoses
(n = 188,944)
Rate per 100
encounters
(n = 41,593)
95% CI
LCL UCL
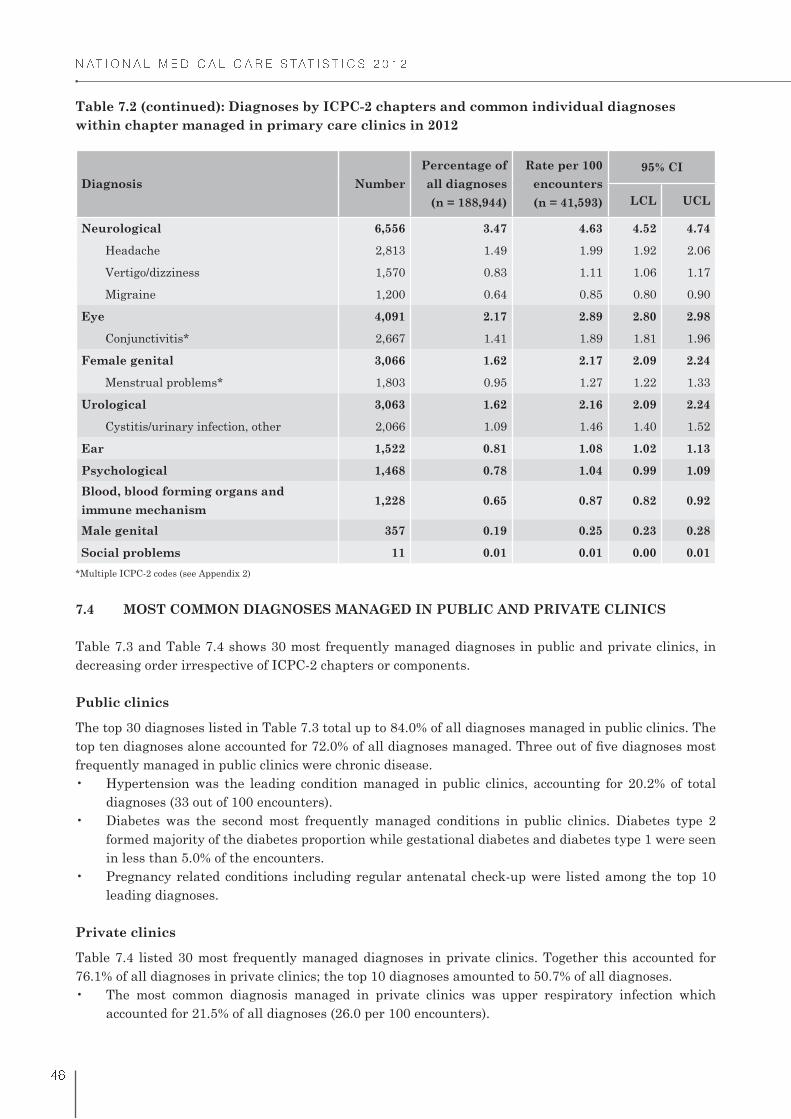
Neurological 6,556 3.47 4.63 4.52 4.74
Headache 2,813 1.49 1.99 1.92 2.06
Vertigo/dizziness 1,570 0.83 1.11 1.06 1.17
Migraine 1,200 0.64 0.85 0.80 0.90
Eye 4,091 2.17 2.89 2.80 2.98
Conjunctivitis* 2,667 1.41 1.89 1.81 1.96
Female genital 3,066 1.62 2.17 2.09 2.24
Menstrual problems* 1,803 0.95 1.27 1.22 1.33
Urological 3,063 1.62 2.16 2.09 2.24
Cystitis/urinary infection, other 2,066 1.09 1.46 1.40 1.52
Ear 1,522 0.81 1.08 1.02 1.13
Psychological 1,468 0.78 1.04 0.99 1.09
Blood, blood forming organs and
immune mechanism1,228 0.65 0.87 0.82 0.92
Male genital 357 0.19 0.25 0.23 0.28
Social problems 11 0.01 0.01 0.00 0.01
*Multiple ICPC-2 codes (see Appendix 2)
7.4 MOST COMMON DIAGNOSES MANAGED IN PUBLIC AND PRIVATE CLINICS
Table 7.3 and Table 7.4 shows 30 most frequently managed diagnoses in public and private clinics, in
decreasing order irrespective of ICPC-2 chapters or components.
Public clinics
The top 30 diagnoses listed in Table 7.3 total up to 84.0% of all diagnoses managed in public clinics. The
frequently managed in public clinics were chronic disease.
diagnoses (33 out of 100 encounters).
formed majority of the diabetes proportion while gestational diabetes and diabetes type 1 were seen
in less than 5.0% of the encounters.
leading diagnoses.
Private clinics
Table 7.4 listed 30 most frequently managed diagnoses in private clinics. Together this accounted for
76.1% of all diagnoses in private clinics; the top 10 diagnoses amounted to 50.7% of all diagnoses.
accounted for 21.5% of all diagnoses (26.0 per 100 encounters).
Table 7.2 (continued): Diagnoses by ICPC-2 chapters and common individual diagnoses
within chapter managed in primary care clinics in 2012
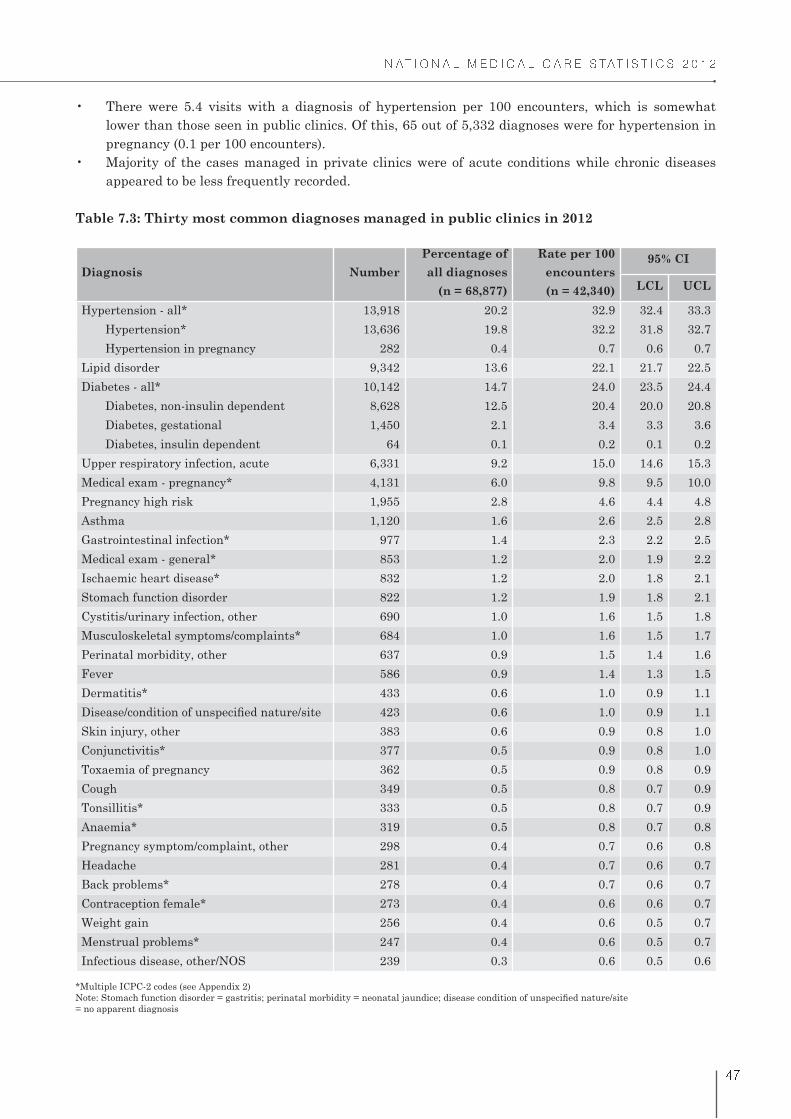
� � � � � � � � � � � � � � � � � � � � � � � � � � � �
#
lower than those seen in public clinics. Of this, 65 out of 5,332 diagnoses were for hypertension in
pregnancy (0.1 per 100 encounters).
appeared to be less frequently recorded.
Table 7.3: Thirty most common diagnoses managed in public clinics in 2012
Diagnosis Number
Percentage of
all diagnoses
(n = 68,877)
Rate per 100
encounters
(n = 42,340)
95% CI
LCL UCL
Hypertension - all* 13,918 20.2 32.9 32.4 33.3
Hypertension* 13,636 19.8 32.2 31.8 32.7
Hypertension in pregnancy 282 0.4 0.7 0.6 0.7
Lipid disorder 9,342 13.6 22.1 21.7 22.5
Diabetes - all* 10,142 14.7 24.0 23.5 24.4
Diabetes, non-insulin dependent 8,628 12.5 20.4 20.0 20.8
Diabetes, gestational 1,450 2.1 3.4 3.3 3.6
Diabetes, insulin dependent 64 0.1 0.2 0.1 0.2
Upper respiratory infection, acute 6,331 9.2 15.0 14.6 15.3
Medical exam - pregnancy* 4,131 6.0 9.8 9.5 10.0
Pregnancy high risk 1,955 2.8 4.6 4.4 4.8
Asthma 1,120 1.6 2.6 2.5 2.8
Gastrointestinal infection* 977 1.4 2.3 2.2 2.5
Medical exam - general* 853 1.2 2.0 1.9 2.2
Ischaemic heart disease* 832 1.2 2.0 1.8 2.1
Stomach function disorder 822 1.2 1.9 1.8 2.1
Cystitis/urinary infection, other 690 1.0 1.6 1.5 1.8
Musculoskeletal symptoms/complaints* 684 1.0 1.6 1.5 1.7
Perinatal morbidity, other 637 0.9 1.5 1.4 1.6
Fever 586 0.9 1.4 1.3 1.5
Dermatitis* 433 0.6 1.0 0.9 1.1
423 0.6 1.0 0.9 1.1
Skin injury, other 383 0.6 0.9 0.8 1.0
Conjunctivitis* 377 0.5 0.9 0.8 1.0
Toxaemia of pregnancy 362 0.5 0.9 0.8 0.9
Cough 349 0.5 0.8 0.7 0.9
Tonsillitis* 333 0.5 0.8 0.7 0.9
Anaemia* 319 0.5 0.8 0.7 0.8
Pregnancy symptom/complaint, other 298 0.4 0.7 0.6 0.8
Headache 281 0.4 0.7 0.6 0.7
Back problems* 278 0.4 0.7 0.6 0.7
Contraception female* 273 0.4 0.6 0.6 0.7
Weight gain 256 0.4 0.6 0.5 0.7
Menstrual problems* 247 0.4 0.6 0.5 0.7
Infectious disease, other/NOS 239 0.3 0.6 0.5 0.6
*Multiple ICPC-2 codes (see Appendix 2)
= no apparent diagnosis

� � � � � � � � � � � � � � � � � � � � � � � � � � � �
# !
Table 7.4: Thirty most common diagnoses managed in private clinics in 2012
Diagnosis Number
Percentage of
all diagnoses
(n =120,067)
Rate per 100
encounters
(n = 99,253)
95% CI
LCL UCL
Upper respiratory infection, acute 25,796 21.5 26.0 25.7 26.3
Gastrointestinal infection* 5,982 5.0 6.0 5.9 6.2
Hypertension - all* 5,332 4.4 5.4 5.2 5.5
Hypertension* 5,267 4.4 5.3 5.2 5.4
Hypertension in pregnancy 65 0.1 0.1 0.1 0.1
Medical examination - general* 4,370 3.6 4.4 4.3 4.5
Musculoskeletal symptom/complaint* 3,890 3.2 3.9 3.8 4.0
Fever 3,765 3.1 3.8 3.7 3.9
Stomach function disorder 3,368 2.8 3.4 3.3 3.5
Diabetes - all* 3,065 2.6 3.1 3.0 3.2
Diabetes, non-insulin dependent 2,817 2.3 2.8 2.7 2.9
Diabetes, insulin dependent 248 0.2 0.3 0.2 0.3
Asthma 2,761 2.3 2.8 2.7 2.9
Headache 2,532 2.1 2.6 2.5 2.7
Back problems* 2,501 2.1 2.5 2.4 2.6
Lipid disorder 2,404 2.0 2.4 2.3 2.5
Conjunctivitis* 2,290 1.9 2.3 2.2 2.4
Dermatitis* 2,224 1.9 2.2 2.2 2.3
Tonsillitis* 1,999 1.7 2.0 1.9 2.1
Cough 1,593 1.3 1.6 1.5 1.7
Menstrual problems* 1,556 1.3 1.6 1.5 1.6
Abdominal pain* 1,555 1.3 1.6 1.5 1.6
Immunisation/vaccination - all* 1,539 1.3 1.6 1.5 1.6
Vertigo/dizziness 1,468 1.2 1.5 1.4 1.6
Arthritis - all* 1,393 1.2 1.4 1.3 1.5
Osteoarthritis* 928 0.8 0.9 0.9 1.0
Cystitis/urinary infection, other 1,376 1.1 1.4 1.3 1.5
Diarrhoea 1,374 1.1 1.4 1.3 1.5
Medical examination - pregnancy* 1,320 1.1 1.3 1.3 1.4
Infectious disease, other/NOS 1,072 0.9 1.1 1.0 1.1
Migraine 1,068 0.9 1.1 1.0 1.1
Acute bronchitis/bronchiolitis 1,050 0.9 1.1 1.0 1.1
site956 0.8 1.0 0.9 1.0
Gout 899 0.7 0.9 0.8 1.0
Dermatophytosis 881 0.7 0.9 0.8 0.9
*Multiple ICPC-2 codes (see Appendix 2)

Chapter 8Medications

� � � � � � � � � � � � � � � � � � � � � � � � � � � �
$ "
CHAPTER 8: MEDICATIONS
This chapter describes the medications prescribed in primary care. For each encounter, doctors could
record up to four medications per diagnosis, with maximum of 24 medications per encounter. The doctors
were asked to record the medications in generic or brand name, including the dosage form, route of
administration, dose, frequency, duration of therapy and total quantity.
Overall results combining total medications from public and private clinics were presented by ATC level
1, 3 and 5. Comparison of the most frequently prescribed medications between public and private clinics
were reported at ATC level 5 (or equivalent).
8.1 NUMBER OF MEDICATIONS PRESCRIBED PER ENCOUNTER
The distributions of primary care encounters with and without medications are presented in Table 8.1.
Table 8.1 Number of encounters for which medication was prescribed
Variable Overall, n (%) Public, n (%) Private, n (%)
Encounters without medication 16,168 (11.4) 6,511 (15.4) 9,657 (9.7)
Encounters with medication 125,425 (88.6) 35,829 (84.6) 89,596 (90.3)
A total of 479,856 medications were recorded; 223,977 medications (46.7%) from public clinics and 255,878
medications (53.3%) from private clinics. Figure 8.1 shows the number of medications prescribed per
encounter in public and private clinics.
private clinics. This group of patients mainly came for medical examination or health screening and
presented with no underlying disease.
total encounters in both sectors.
clinic).
Figure 8.1: Number of medications prescribed per encounter in primary care clinics in 2012
Number of medications prescribed per encounter
Nil One Two Three >Four
Public 15.4 20.0 20.0 18.7 25.0
Private 9.7 15.0 20.6 27.2 27.5
Percen
t o
f e
nco
un
ters (
%)
0
5
10
15
20
25
30

� � � � � � � � � � � � � � � � � � � � � � � � � � � �
$ �
in Figure 8.2.
encounter than those in private clinics. By contrast, the prescribing rate for older patients (over 40
years) was higher in public clinics compared to private clinics.
(<1 year), 5-19 years, and 20-39 years. Male patients of these age groups in public clinics received
more medications than females. On the contrary, in private clinics females of these age groups had
higher prescribing rates per encounter than males.
infants in private clinics was about two times higher than in public clinics.
(377 per 100 encounters).
o Prescription rates gradually increased with age. This observation can be attributed to increase of
incidence of chronic disease which often resulted in more medications per visit.
o The differences in prescribing rates between gender was most prominent in 20-39 age group where
females had relatively fewer medications per encounter (152 per 100 encounters) compared to
their male counterparts (213 per 100 encounters). This may partly be explained by high number
of female encounters presenting for antenatal check-up.
o Prescription rates peak in the 1-4 years and 5-19 years age groups and becomes relatively similar
after the age of 20 years.
o Both males and females exhibited similar prescription rates across age groups. However, the
largest differences were observed for patients aged <1 year and 5-19 years as females had higher
prescribing rates than males.
91.6
347.6
76.5
376.7
178.4
269.9
202.4
273.6
0
50
100
150
200
250
300
350
400
<1 1-4 5-19 20-39 40-59 >60
Ra
te p
er 1
00 e
nco
un
ters
Age group (years)
Public Male
Public Female
Private Male
Private Female
Note: Missing data removed

� � � � � � � � � � � � � � � � � � � � � � � � � � � �
$ �
8.2 TYPES OF MEDICATIONS PRESCRIBED
the overall results combining medications from both public and private clinics. Medications constituting
at least 0.5% of all prescribed medications are included in the table, and presented by ATC levels in
decreasing order of frequency.
of all medications and prescribed to 60 out of 100 encounters. Antihistamines were the predominant
agent and contributed to half of the respiratory medications.
The prescription rate of these agents was slightly lower than respiratory medications, at 55 per 100
encounters.
32 per 100 encounters.
Table 8.2: Prescribed medications by ATC level 1, 3 and 5 in primary care clinics in 2012
ATC Level 1
Number
Percentage
of all
medications
(n = 359,272)
Rate per 100
encounters
(95% CI)
(n = 141,593)
Rate per 100
diagnoses
(95% CI)
(n = 188,944)
ATC Level 3
ATC Level 5
Respiratory system 85,063 23.7 60.1 (59.8 - 60.3) 45.0 (44.8 - 45.2)
Antihistamines for systemic use 45,882 12.8 32.4 (32.2 - 32.6) 24.3 (24.1 - 24.5)
Diphenhydramine,
combinations12,956 3.6 9.2 (9.0 - 9.3) 6.9 (6.7 - 7.0)
Chlorphenamine 10,993 3.1 7.8 (7.6 - 7.9) 5.8 (5.7 - 5.9)
Loratadine 5,596 1.6 4.0 (3.9 - 4.1) 3.0 (2.9 - 3.0)
Cetirizine 5,508 1.5 3.9 (3.8 - 4.0) 2.9 (2.8 - 3.0)
Dexchlorpheniramine 4,556 1.3 3.2 (3.1 - 3.3) 2.4 (2.3 - 2.5)
Diphenhydramine 3,398 0.9 2.4 (2.3 - 2.5) 1.8 (1.7 - 1.9)
Expectorants, excl. combinations
with cough suppressants7,468 2.1 5.3 (5.2 - 5.4) 4.0 (3.9 - 4.0)
Bromhexine 4,606 1.3 3.3 (3.2 - 3.3) 2.4 (2.4 -2.5)
Nasal decongestants for systemic
use6,841 1.9 4.8 (4.7 - 4.9) 3.6 (3.5 - 3.7)
Pseudoephedrine, combinations 6,405 1.8 4.5 (4.4 - 4.6) 3.4 (3.3 - 3.5)
Cough suppressants, excl.
combinations with expectorants5,575 1.6 3.9 (3.8 - 4.0) 3.0 (2.9 - 3.0)
Combinations 2,350 0.7 1.7 (1.6 - 1.7) 1.2 (1.2 - 1.3)
Dextromethorphan 1,897 0.5 1.3 (1.3 - 1.4) 1.0 (1.0 - 1.1)
Throat preparations 4,331 1.2 3.1 (3.0 - 3.1) 2.3 (2.2 - 2.4)
(continued)

� � � � � � � � � � � � � � � � � � � � � � � � � � � �
$ �
ATC Level 1
Number
Percentage
of all
medications
(n = 359,272)
Rate per 100
encounters
(95% CI)
(n = 141,593)
Rate per 100
diagnoses
(95% CI)
(n = 188,944)
ATC Level 3
ATC Level 5
Adrenergics for systemic use 3,975 1.1 2.8 (2.7 - 2.9) 2.1 (2.0 - 2.2)
Salbutamol 3,498 1.0 2.5 (2.4 - 2.6) 1.9 (1.8 - 1.9)
Adrenergics, inhalants 3,364 0.9 2.4 (2.3 - 2.5) 1.8 (1.7 - 1.8)
Salbutamol 2,212 0.6 1.6 (1.5 - 1.6) 1.2 (1.1 - 1.2)
Other cold preparations 3,318 0.9 2.3 (2.3 - 2.4) 1.8 (1.7 - 1.8)
Decongestants and other nasal
preparations for topical use1,821 0.5 1.3 (1.2 - 1.3) 1.0 (0.9 - 1.0)
Alimentary tract and metabolism 77,137 21.5 54.5 (54.2 - 54.7) 40.8 (40.6 - 41.0)
Blood glucose lowering drugs, excl.
insulins16,610 4.6 11.7 (11.6 - 11.9) 8.8 (8.7 - 8.9)
Metformin 8,839 2.5 6.2 (6.1 - 6.4) 4.7 (4.6 - 4.8)
Gliclazide 4,187 1.2 3.0 (2.9 - 3.0) 2.2 (2.2 - 2.3)
Glibenclamide 2,334 0.6 1.6 (1.6 - 1.7) 1.2 (1.2 - 1.3)
Belladona and derivatives, plain 8,072 2.2 5.7 (5.6 - 5.8) 4.3 (4.2 - 4.4)
Butylscopolamine 8,029 2.2 5.7 (5.6 - 5.8) 4.3 (4.2 - 4.3)
Antipropulsives 5,816 1.6 4.1 (4.0 - 4.2) 3.1 (3.0 - 3.2)
Loperamide 3,314 0.9 2.3 (2.3 - 2.4) 1.8 (1.7 - 1.8)
Diphenoxylate 2,502 0.7 1.8 (1.7 - 1.8) 1.3 (1.3 - 1.4)
Antacids 5,617 1.6 4.0 (3.9 - 4.1) 3.0 (2.9 - 3.1)
Magnesium silicate 2,662 0.7 1.9 (1.8 - 2.0) 1.4 (1.4 - 1.5)
Ordinary salt combinations 1,660 0.5 1.2 (1.1 - 1.2) 0.9 (0.8 - 0.9)
Electrolytes with carbohydrates 5,270 1.5 3.7 (3.6 - 3.8) 2.8 (2.7 - 2.9)
Drugs for peptic ulcer and gastro-5,017 1.4 3.5 (3.4 - 3.6) 2.7 (2.6 - 2.7)
Ranitidine 2,160 0.6 1.5 (1.5 - 1.6) 1.1 (1.1 - 1.2)
Intestinal adsorbents 4,563 1.3 3.2 (3.1 - 3.3) 2.4 (2.3 - 2.5)
Medicinal charcoal 3,113 0.9 2.2 (2.1 - 2.3) 1.6 (1.6 - 1.7)
Propulsives 4,441 1.2 3.1 (3.0 - 3.2) 2.4 (2.3 - 2.4)
Metoclopramide 2,717 0.8 1.9 (1.8 - 2.0) 1.4 (1.4 - 1.5)
Domperidone 1,684 0.5 1.2 (1.1 - 1.2) 0.9 (0.9 - 0.9)
(continued)
Table 8.2 (continued): Prescribed medications by ATC level 1, 3 and 5 in primary care clinics
in 2012

� � � � � � � � � � � � � � � � � � � � � � � � � � � �
$ #
ATC Level 1
Number
Percentage
of all
medications
(n = 359,272)
Rate per 100
encounters
(95% CI)
(n = 141,593)
Rate per 100
diagnoses
(95% CI)
(n = 188,944)
ATC Level 3
ATC Level 5
Drugs for functional
gastrointestinal disorders3,021 0.8 2.1 (2.1 - 2.2) 1.6 (1.5 - 1.7)
Silicones 2,152 0.6 1.5 (1.5 - 1.6) 1.1 (1.1 - 1.2)
Insulins and analogues 3,010 0.8 2.1 (2.1 - 2.2) 1.6 (1.5 - 1.7)
Insulin (human) - intermediate
acting1,718 0.5 1.2 (1.2 - 1.3) 0.9 (0.9 - 1.0)
Stomatological preparations 2,909 0.8 2.1 (2.0 - 2.1) 1.5 (1.5 - 1.6)
Various 1,643 0.5 1.2 (1.1 - 1.2) 0.9 (0.8 - 0.9)
Vitamin B-complex, incl.
combinations2,521 0.7 1.8 (1.7 - 1.9) 1.3 (1.3 - 1.4)
Ascorbic acid (vitamin C), incl.
combinations1,736 0.5 1.2 (1.2 - 1.3) 0.9 (0.9 - 1.0)
Ascorbic acid (vit C) 1,702 0.5 1.2 (1.1 - 1.3) 0.9 (0.9 - 0.9)
Drugs for constipation 1,692 0.5 1.2 (1.1 - 1.3) 0.9 (0.9 - 0.9)
Cardiovascular system 45,019 12.5 31.8 (31.6 - 32.0) 23.8 (23.6 - 24.0)
Lipid modifying agents, plain 12,091 3.4 8.5 (8.4 - 8.7) 6.4 (6.3 - 6.5)
Lovastatin 6,417 1.8 4.5 (4.4 - 4.6) 3.4 (3.3 - 3.5)
Simvastatin 3,773 1.1 2.7 (2.6 - 2.7) 2.0 (1.9 - 2.1)
Selective calcium channel blockers
with mainly vascular effects10,065 2.8 7.1 (7.0 - 7.2) 5.3 (5.2 - 5.4)
Amlodipine 8,503 2.4 6.0 (5.9 - 6.1) 4.5 (4.4 - 4.6)
ACE inhibitors, plain 7,697 2.1 5.4 (5.3 - 5.6) 4.1 (4.0 - 4.2)
Perindopril 5,714 1.6 4.0 (3.9 - 4.1) 3.0 (2.9 - 3.1)
Beta blocking agents 5,364 1.5 3.8 (3.7 - 3.9) 2.8 (2.8 - 2.9)
Atenolol 3,288 0.9 2.3 (2.2 - 2.4) 1.7 (1.7 - 1.8)
Low-ceiling diuretics, thiazides 2,996 0.8 2.1 (2.0 - 2.2) 1.6 (1.5 - 1.6)
Hydrochlorothiazide 2,967 0.8 2.1 (2.0 - 2.2) 1.6 (1.5 - 1.6)
Nervous system 41,728 11.6 29.5 (29.2 - 29.7) 22.1 (21.9 - 22.3)
Other analgesics and antipyretics 35,037 9.8 24.7 (24.5 - 25.0) 18.5 (18.4 - 18.7)
Paracetamol 33,958 9.5 24.0 (23.8 - 24.2) 18.0 (17.8 - 18.1)
Antipsychotics 1,665 0.5 1.2 (1.1 - 1.2) 0.9 (0.8 - 0.9)
Table 8.2 (continued): Prescribed medications by ATC level 1, 3 and 5 in primary care clinics
in 2012
(continued)

� � � � � � � � � � � � � � � � � � � � � � � � � � � �
$ $
ATC Level 1
Number
Percentage
of all
medications
(n = 359,272)
Rate per 100
encounters
(95% CI)
(n = 141,593)
Rate per 100
diagnoses
(95% CI)
(n = 188,944)
ATC Level 3
ATC Level 5
Musculo-skeletal system 39,348 11.0 27.8 (27.6 - 28.0) 20.8 (20.6 - 21.0)
antirheumatic products, non-
steroids
26,339 7.3 18.6 (18.4 - 18.8) 13.9 (13.8 - 14.1)
Diclofenac 9,375 2.6 6.6 (6.5 - 6.8) 5.0 (4.9 - 5.1)
Mefenamic acid 7,470 2.1 5.3 (5.2 - 5.4) 4.0 (3.9 - 4.0)
Ibuprofen 2,474 0.7 1.7 (1.7 - 1.8) 1.3 (1.3 - 1.4)
Naproxen 1,949 0.5 1.4 (1.3 - 1.4) 1.0 (1.0 - 1.1)
Topical products for joint and
muscular pain4,959 1.4 3.5 (3.4 - 3.6) 2.6 (2.6 - 2.7)
Muscle relaxants, centrally acting
agents4,153 1.2 2.9 (2.8 - 3.0) 2.2 (2.1 - 2.3)
Orphenadrine, combinations 3,873 1.1 2.7 (2.7 - 2.8) 2.1 (2.0 - 2.1)
Other drugs for disorders of the
musculo-skeletal system2,863 0.8 2.0 (2.0 - 2.1) 1.5 (1.5 - 1.6)
Antiinfectives for systemic use 33,584 9.3 23.7 (23.5 - 23.9) 17.8 (17.6 - 17.9)
Beta-lactam antibacterials,
penicillins15,070 4.2 10.6 (10.5 - 10.8) 8.0 (7.9 - 8.1)
Amoxicillin 8,291 2.3 5.9 (5.7 - 6.0) 4.4 (4.3 - 4.5)
Amoxicillin and enzyme
inhibitor3,418 1.0 2.4 (2.3 - 2.5) 1.8 (1.7 - 1.9)
Cloxacillin 1,966 0.5 1.4 (1.3 - 1.5) 1.0 (1.0 - 1.1)
Macrolides, lincosamides and
streptogramins6,516 1.8 4.6 (4.5 - 4.7) 3.4 (3.4 - 3.5)
Erythromycin 3,997 1.1 2.8 (2.7 - 2.9) 2.1 (2.1 - 2.2)
Other beta-lactam antibacterials 4,688 1.3 3.3 (3.2 - 3.4) 2.5 (2.4 - 2.6)
Cefalexin 2,845 0.8 2.0 (1.9 - 2.1) 1.5 (1.5 - 1.6)
Quinolone antibacterials 1,776 0.5 1.3 (1.2 - 1.3) 0.9 (0.9 - 1.0)
Dermatologicals 10,467 2.9 7.4 (7.3 - 7.5) 5.5 (5.4 - 5.6)
Antifungals for topical use 2,343 0.7 1.7 (1.6 - 1.7) 1.2 (1.2 - 1.3)
Emollients and protectives 2,246 0.6 1.6 (1.5 - 1.7) 1.2 (1.1 - 1.2)
Corticosteroids, plain 2,084 0.6 1.5 (1.4 - 1.5) 1.1 (1.1 - 1.2)
Table 8.2 (continued): Prescribed medications by ATC level 1, 3 and 5 in primary care clinics
in 2012
(continued)
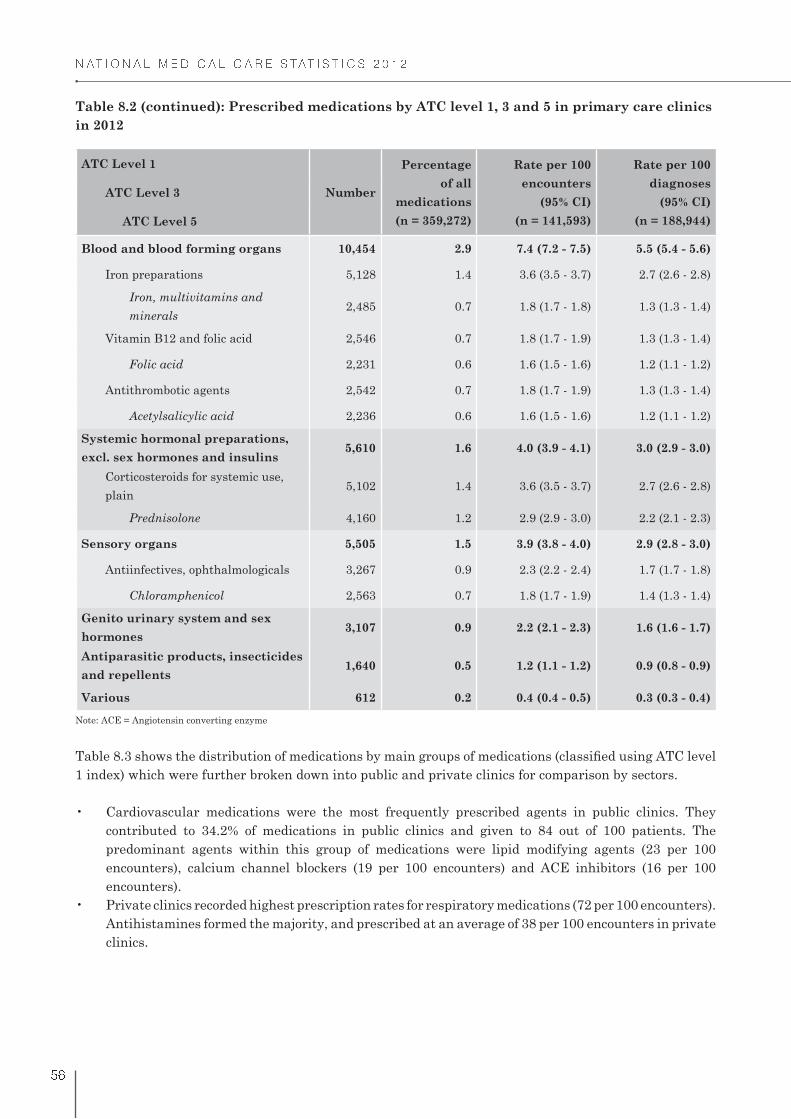
� � � � � � � � � � � � � � � � � � � � � � � � � � � �
$ �
ATC Level 1
Number
Percentage
of all
medications
(n = 359,272)
Rate per 100
encounters
(95% CI)
(n = 141,593)
Rate per 100
diagnoses
(95% CI)
(n = 188,944)
ATC Level 3
ATC Level 5
Blood and blood forming organs 10,454 2.9 7.4 (7.2 - 7.5) 5.5 (5.4 - 5.6)
Iron preparations 5,128 1.4 3.6 (3.5 - 3.7) 2.7 (2.6 - 2.8)
Iron, multivitamins and
minerals2,485 0.7 1.8 (1.7 - 1.8) 1.3 (1.3 - 1.4)
Vitamin B12 and folic acid 2,546 0.7 1.8 (1.7 - 1.9) 1.3 (1.3 - 1.4)
Folic acid 2,231 0.6 1.6 (1.5 - 1.6) 1.2 (1.1 - 1.2)
Antithrombotic agents 2,542 0.7 1.8 (1.7 - 1.9) 1.3 (1.3 - 1.4)
Acetylsalicylic acid 2,236 0.6 1.6 (1.5 - 1.6) 1.2 (1.1 - 1.2)
Systemic hormonal preparations,
excl. sex hormones and insulins5,610 1.6 4.0 (3.9 - 4.1) 3.0 (2.9 - 3.0)
Corticosteroids for systemic use,
plain5,102 1.4 3.6 (3.5 - 3.7) 2.7 (2.6 - 2.8)
Prednisolone 4,160 1.2 2.9 (2.9 - 3.0) 2.2 (2.1 - 2.3)
Sensory organs 5,505 1.5 3.9 (3.8 - 4.0) 2.9 (2.8 - 3.0)
Antiinfectives, ophthalmologicals 3,267 0.9 2.3 (2.2 - 2.4) 1.7 (1.7 - 1.8)
Chloramphenicol 2,563 0.7 1.8 (1.7 - 1.9) 1.4 (1.3 - 1.4)
Genito urinary system and sex
hormones3,107 0.9 2.2 (2.1 - 2.3) 1.6 (1.6 - 1.7)
Antiparasitic products, insecticides
and repellents1,640 0.5 1.2 (1.1 - 1.2) 0.9 (0.8 - 0.9)
Various 612 0.2 0.4 (0.4 - 0.5) 0.3 (0.3 - 0.4)
Note: ACE = Angiotensin converting enzyme
1 index) which were further broken down into public and private clinics for comparison by sectors.
contributed to 34.2% of medications in public clinics and given to 84 out of 100 patients. The
predominant agents within this group of medications were lipid modifying agents (23 per 100
encounters), calcium channel blockers (19 per 100 encounters) and ACE inhibitors (16 per 100
encounters).
Antihistamines formed the majority, and prescribed at an average of 38 per 100 encounters in private
clinics.
Table 8.2 (continued): Prescribed medications by ATC level 1, 3 and 5 in primary care clinics
in 2012

� � � � � � � � � � � � � � � � � � � � � � � � � � � �
$
Table 8.3: Prescribed medications by ATC level 1 and sector in primary care clinics in 2012
ATC Level 1 Number
Percentage
of all
medications
Rate per 100
encounters
(95% CI)
Rate per 100
diagnoses
(95% CI)
Public clinics n = 103,484 n = 42,340 n = 68,877
Cardiovascular system 35,342 34.2 83.5 (83.1 - 83.8) 51.3 (50.9 - 51.7)
Alimentary tract and metabolism 25,904 25.0 61.2 (60.7 - 61.6) 37.6 (37.2 - 38.0)
Respiratory system 13,540 13.1 32.0 (31.5 - 32.4) 19.7 (19.4 - 20.0)
Nervous system 8,604 8.3 20.3 (19.9 - 20.7) 12.5 (12.2 - 12.7)
Blood and blood forming organs 8,070 7.8 19.1 (18.7 - 19.4) 11.7 (11.5 - 12.0)
Musculo-skeletal system 3,859 3.7 9.1 (8.8 - 9.4) 5.6 (5.4 - 5.8)
Antiinfectives for systemic use 3,851 3.7 9.1 (8.8 - 9.4) 5.6 (5.4 - 5.8)
Dermatologicals 2,136 2.1 5.0 (4.8 - 5.3) 3.1 (3.0 - 3.2)
Sensory organs 894 0.9 2.1 (2.0 - 2.3) 1.3 (1.2 - 1.4)
Systemic hormonal preparations,
excl. sex hormones and insulins
573 0.6 1.4 (1.2 - 1.5) 0.8 (0.8 - 0.9)
Genito urinary system and sex
hormones
547 0.5 1.3 (1.2 - 1.4) 0.8 (0.7 - 0.9)
Antiparasitic products, insecticides
and repellents
114 0.1 0.3 (0.2 - 0.3) 0.2 (0.1 - 0.2)
Various 50 0.1 0.1 (0.1 - 0.2) 0.1 (0.1 - 0.1)
Private clinics n = 255,788 n = 99,253 n = 120,067
Respiratory system 71,523 28.0 72.1 (71.8 - 72.3) 59.6 (59.3 - 59.8)
Alimentary tract and metabolism 51,233 20.0 51.6 (51.3 - 51.9) 42.7 (42.4 - 43.0)
Musculo-skeletal system 35,488 13.9 35.8 (35.5 - 36.1) 29.6 (29.3 - 29.8)
Nervous system 33,123 12.9 33.4 (33.1 - 33.7) 27.6 (27.3 - 27.8)
Antiinfectives for systemic use 29,733 11.6 30.0 (29.7 - 30.2) 24.8 (24.5 - 25.0)
Cardiovascular system 9,677 3.8 9.8 (9.6 - 9.9) 8.1 (7.9 - 8.2)
Dermatologicals 8,331 3.3 8.4 (8.2 - 8.6) 6.9 (6.8 - 7.1)
Systemic hormonal preparations,
excl. sex hormones and insulins
5,038 2.0 5.1 (4.9 - 5.2) 4.2 (4.1 - 4.3)
Sensory organs 4,611 1.8 4.6 (4.5 - 4.8) 3.8 (3.7 - 4.0)
Genito urinary system and sex
hormones
2,560 1.0 2.6 (2.5 - 2.7) 2.1 (2.1 - 2.2)
Blood and blood forming organs 2,383 0.9 2.4 (2.3 - 2.5) 2.0 (1.9 - 2.1)
Antiparasitic products, insecticides
and repellents
1,525 0.6 1.5 (1.5 - 1.6) 1.3 (1.2 - 1.3)
Various 562 0.2 0.6 (0.5 - 0.6) 0.5 (0.4 - 0.5)
� � � � � � � � � � � � � � � � � � � � � � � � � � � �
$ !
8.3 MOST FREQUENTLY PRESCRIBED MEDICATIONS IN PUBLIC AND PRIVATE
CLINICS
Table 8.4 and Table 8.5 shows 30 most frequently prescribed medications in public and private clinic,
reported at ATC level 5 or equivalent. In both sectors, paracetamol was consistently the most common
medication prescribed.
In public clinics (Table 8.4):
and cardiovascular disease. Together these four medications amounted to one quarter of total
prescriptions in public clinics (24.9%). The high usages of these medications are explained by a
bigger proportion of diabetes and cardiovascular cases managed in public clinics.
antiinfectives group.
fumarate, and vitamin C) were frequently prescribed in public clinics and listed among top 30
In private clinics (Table 8.5):
clinics.
symptomatic relief.
and constitutes less than 5.0% of prescribed medications individually.
highest (2.9%), followed by amoxicillin and enzyme inhibitor combination (1.3%), and erythromycin
(1.2%).

� � � � � � � � � � � � � � � � � � � � � � � � � � � �
$ %
Table 8.4: Thirty most frequently prescribed medications in public clinics in 2012
Medication Number
Percentage
of all
medications
(n = 103,484)
Rate per 100
encounters
(95% CI)
(n = 42,340)
Rate per 100
diagnoses
(95% CI)
(n = 68,877)
Paracetamol 7,751 7.5 18.3 (17.9 - 18.7) 11.3 (11.0 - 11.5)
Metformin 7,259 7.0 17.1 (16.8 - 17.5) 10.5 (10.3 - 10.8)
Amlodipine 6,721 6.5 15.9 (15.5 - 16.2) 9.8 (9.5 - 10.0)
Lovastatin 6,262 6.1 14.8 (14.5 - 15.1) 9.1 (8.9 - 9.3)
Perindopril 5,513 5.3 13.0 (12.7 - 13.3) 8.0 (7.8 - 8.2)
Diphenhydramine, combinations 3,495 3.4 8.3 (8.0 - 8.5) 5.1 (4.9 - 5.2)
Gliclazide 3,234 3.1 7.6 (7.4 - 7.9) 4.7 (4.5 - 4.9)
Chlorphenamine 2,933 2.8 6.9 (6.7 - 7.2) 4.3 (4.1 - 4.4)
Hydrochlorothiazide 2,903 2.8 6.9 (6.6 - 7.1) 4.2 (4.1 - 4.4)
Simvastatin 2,860 2.8 6.8 (6.5 - 7.0) 4.2 (4.0 - 4.3)
Atenolol 2,679 2.6 6.3 (6.1 - 6.6) 3.9 (3.7 - 4.0)
Glibenclamide 2,092 2.0 4.9 (4.7 - 5.2) 3.0 (2.9 - 3.2)
Iron, multivitamins and minerals 1,891 1.8 4.5 (4.3 - 4.7) 2.7 (2.6 - 2.9)
Acetylsalicylic acid 1,880 1.8 4.4 (4.2 - 4.6) 2.7 (2.6 - 2.9)
Vitamin B-complex, plain 1,728 1.7 4.1 (3.9 - 4.3) 2.5 (2.4 - 2.6)
Insulin (human) - intermediate
acting1,718 1.7 4.1 (3.9 - 4.2) 2.5 (2.4 - 2.6)
Folic acid 1,659 1.6 3.9 (3.7 - 4.1) 2.4 (2.3 - 2.5)
Bromhexine 1,531 1.5 3.6 (3.4 - 3.8) 2.2 (2.1 - 2.3)
Metoprolol 1,395 1.3 3.3 (3.1 - 3.5) 2.0 (1.9 - 2.1)
Ferrous fumarate 1,272 1.2 3.0 (2.8 - 3.2) 1.8 (1.7 - 1.9)
Nifedipine 1,186 1.1 2.8 (2.6 - 3.0) 1.7 (1.6 - 1.8)
Enalapril 1,170 1.1 2.8 (2.6 - 2.9) 1.7 (1.6 - 1.8)
Salbutamol 1,083 1.0 2.6 (2.4 - 2.7) 1.6 (1.5 - 1.7)
Erythromycin 1,033 1.0 2.4 (2.3 - 2.6) 1.5 (1.4 - 1.6)
Oral rehydration salt formulations* 990 1.0 2.3 (2.2 - 2.5) 1.4 (1.4 - 1.5)
Mefenamic acid 986 1.0 2.3 (2.2 - 2.5) 1.4 (1.3 - 1.5)
Amoxicillin 952 0.9 2.3 (2.1 - 2.4) 1.4 (1.3 - 1.5)
Ascorbic acid (vit C) 943 0.9 2.2 (2.1 - 2.4) 1.4 (1.3 - 1.5)
Diclofenac 911 0.9 2.2 (2.0 - 2.3) 1.3 (1.2 - 1.4)
Pseudoephedrine, combinations 875 0.8 2.1 (1.9 - 2.2) 1.3 (1.2 - 1.4)
*ATC Level 4
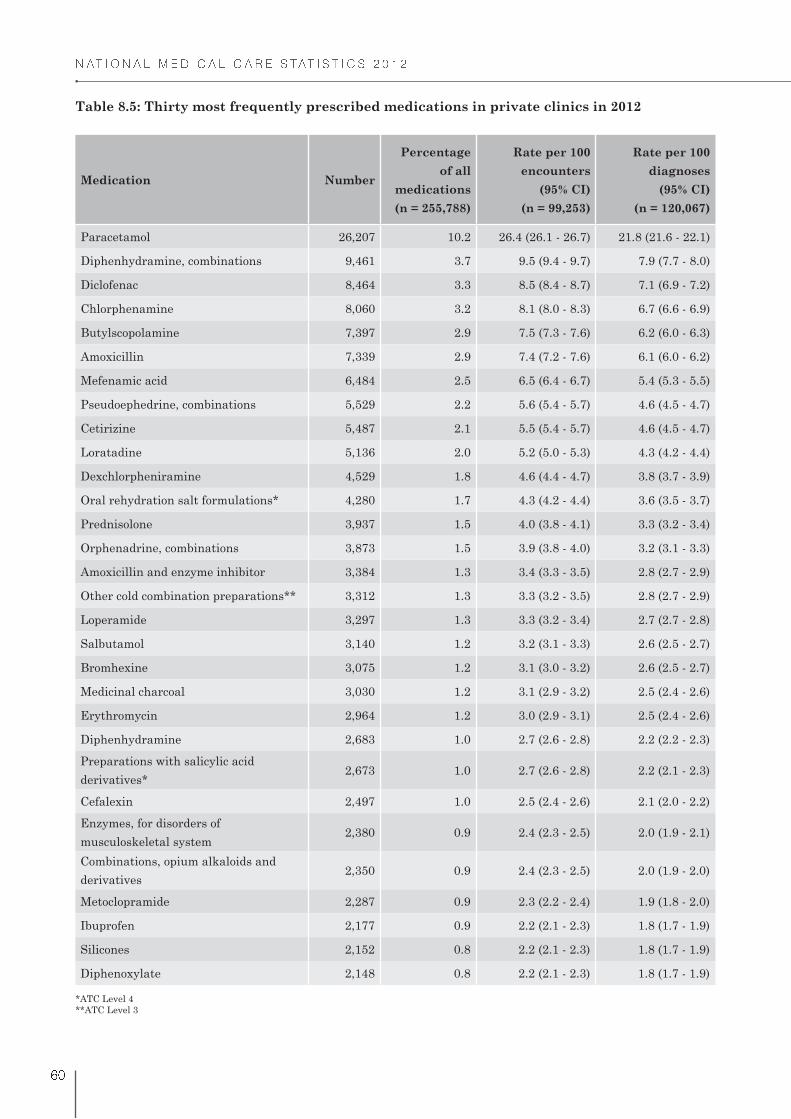
� � � � � � � � � � � � � � � � � � � � � � � � � � � �
� "
Table 8.5: Thirty most frequently prescribed medications in private clinics in 2012
Medication Number
Percentage
of all
medications
(n = 255,788)
Rate per 100
encounters
(95% CI)
(n = 99,253)
Rate per 100
diagnoses
(95% CI)
(n = 120,067)
Paracetamol 26,207 10.2 26.4 (26.1 - 26.7) 21.8 (21.6 - 22.1)
Diphenhydramine, combinations 9,461 3.7 9.5 (9.4 - 9.7) 7.9 (7.7 - 8.0)
Diclofenac 8,464 3.3 8.5 (8.4 - 8.7) 7.1 (6.9 - 7.2)
Chlorphenamine 8,060 3.2 8.1 (8.0 - 8.3) 6.7 (6.6 - 6.9)
Butylscopolamine 7,397 2.9 7.5 (7.3 - 7.6) 6.2 (6.0 - 6.3)
Amoxicillin 7,339 2.9 7.4 (7.2 - 7.6) 6.1 (6.0 - 6.2)
Mefenamic acid 6,484 2.5 6.5 (6.4 - 6.7) 5.4 (5.3 - 5.5)
Pseudoephedrine, combinations 5,529 2.2 5.6 (5.4 - 5.7) 4.6 (4.5 - 4.7)
Cetirizine 5,487 2.1 5.5 (5.4 - 5.7) 4.6 (4.5 - 4.7)
Loratadine 5,136 2.0 5.2 (5.0 - 5.3) 4.3 (4.2 - 4.4)
Dexchlorpheniramine 4,529 1.8 4.6 (4.4 - 4.7) 3.8 (3.7 - 3.9)
Oral rehydration salt formulations* 4,280 1.7 4.3 (4.2 - 4.4) 3.6 (3.5 - 3.7)
Prednisolone 3,937 1.5 4.0 (3.8 - 4.1) 3.3 (3.2 - 3.4)
Orphenadrine, combinations 3,873 1.5 3.9 (3.8 - 4.0) 3.2 (3.1 - 3.3)
Amoxicillin and enzyme inhibitor 3,384 1.3 3.4 (3.3 - 3.5) 2.8 (2.7 - 2.9)
Other cold combination preparations** 3,312 1.3 3.3 (3.2 - 3.5) 2.8 (2.7 - 2.9)
Loperamide 3,297 1.3 3.3 (3.2 - 3.4) 2.7 (2.7 - 2.8)
Salbutamol 3,140 1.2 3.2 (3.1 - 3.3) 2.6 (2.5 - 2.7)
Bromhexine 3,075 1.2 3.1 (3.0 - 3.2) 2.6 (2.5 - 2.7)
Medicinal charcoal 3,030 1.2 3.1 (2.9 - 3.2) 2.5 (2.4 - 2.6)
Erythromycin 2,964 1.2 3.0 (2.9 - 3.1) 2.5 (2.4 - 2.6)
Diphenhydramine 2,683 1.0 2.7 (2.6 - 2.8) 2.2 (2.2 - 2.3)
Preparations with salicylic acid
derivatives*2,673 1.0 2.7 (2.6 - 2.8) 2.2 (2.1 - 2.3)
Cefalexin 2,497 1.0 2.5 (2.4 - 2.6) 2.1 (2.0 - 2.2)
Enzymes, for disorders of
musculoskeletal system2,380 0.9 2.4 (2.3 - 2.5) 2.0 (1.9 - 2.1)
Combinations, opium alkaloids and
derivatives2,350 0.9 2.4 (2.3 - 2.5) 2.0 (1.9 - 2.0)
Metoclopramide 2,287 0.9 2.3 (2.2 - 2.4) 1.9 (1.8 - 2.0)
Ibuprofen 2,177 0.9 2.2 (2.1 - 2.3) 1.8 (1.7 - 1.9)
Silicones 2,152 0.8 2.2 (2.1 - 2.3) 1.8 (1.7 - 1.9)
Diphenoxylate 2,148 0.8 2.2 (2.1 - 2.3) 1.8 (1.7 - 1.9)
*ATC Level 4
**ATC Level 3

Chapter 9Investigations

� � � � � � � � � � � � � � � � � � � � � � � � � � � �
� �
CHAPTER 9: INVESTIGATIONS
Investigations are important tools to screen for, diagnose, assess severity, monitor and determine
treatment options. Medical investigations are essential to the processes of medical care but having more
investigations done do not necessarily result in better health outcomes and may increase healthcare
expenditure. The rate at which investigations are ordered per condition or per patient affects the overall
cost-effectiveness of healthcare delivery.
This chapter reports the investigations, including all pathology, imaging or other diagnostic tests which
were undertaken for the patients at the point of encounter. The primary care doctors were requested to
document all medical investigations ordered and indicate for which diagnoses were the investigations
ordered for. More than one investigation may be ordered for each diagnosis and one investigation may be
9.1 NUMBERS OF INVESTIGATIONS PER ENCOUNTER
From the total encounters, only 19.6% of the patients had investigations ordered or provided as part of
management process during visit to primary care clinics. Figure 9.1 displays the number of investigations
ordered per encounter in public and private clinics. Among those with investigations, majority had only
one investigation ordered or provided per encounter. The maximum number of investigations ordered per
encounter was nine (public clinic) and eight (private clinic).
Figure 9.1 Number of investigations ordered per encounter in primary care clinics in 2012
Number of investigations ordered per encounter
0
20
40
60
80
100
Nil One Two Three > Four
Public 59.8 21.9 7.1 4.5 6.8
Private 89.2 7.0 1.8 1.0 1.0
Percen
tag
e o
f en
co
un
ters (
%)

� � � � � � � � � � � � � � � � � � � � � � � � � � � �
� �
9.2 TYPES OF INVESTIGATIONS
A total of 53,028 investigations were ordered, at a rate of 37.5 per 100 encounters and 28.1 per 100
diagnoses. Table 9.1 shows the distribution of investigations by ICPC-2 chapters and most common test
within each chapter in an order of decreasing frequency. Each ICPC-2 chapter represents a group of
investigations and only top 20 ICPC-2 chapters were reported in Table 9.1.
radiology/imaging tests.
Within this group, approximately two-third of the investigations involved tests for diabetes mellitus
(glucose, glucose tolerance, HbA1c, fasting, and random glucose tests).
in primary care clinics.
Table 9.1: Types of investigations by ICPC-2 chapters and common individual test within
chapter in primary care clinics in 2012
Investigation Number
Percentage
of all
investigations
(n = 53,028)
Rate per 100
encounters
(95% CI)
(n = 141,593)
Rate per 100
diagnoses
(95% CI)
(n = 188,944)
Blood test; endocrine/
metabolic14,771 27.86 10.43 (10.27 - 10.59) 7.82 (7.70 - 7.94)
Test;glucose & glucose
tolerance7,755 14.62 5.48 (5.36 - 5.60) 4.11 (4.02 - 4.19)
3,896 7.35 2.75 (2.67 - 2.84) 2.06 (2.00 - 2.13)
Test;HbA1c 2,473 4.66 1.75 (1.68 - 1.82) 1.31 (1.26 - 1.36)
Test;thyroid function 510 0.96 0.36 (0.33 - 0.39) 0.27 (0.25 - 0.29)
Test;cholesterol 128 0.24 0.09 (0.08 - 0.11) 0.07 (0.06 - 0.08)
Test;cholesterol/
triglycerides8 0.02 0.01 (0.00 - 0.01) 0.01 (0.00 - 0.01)
Urine test 7,150 13.48 5.05 (4.94 - 5.17) 3.79 (3.70 - 3.87)
Test;urine 5,260 9.92 3.72 (3.62 - 3.81) 2.78 (2.71 - 2.86)
Test;urine;albumin 1,696 3.20 1.20 (1.14 - 1.26) 0.90 (0.86 - 0.94)
Urine drug screen 193 0.36 0.14 (0.12 - 0.16) 0.10 (0.09 - 0.12)
Test;albumin creatine
ratio2 0.00 0.00 (0.00 - 0.01) 0.00 (0.00 - 0.00)
Blood test 5,535 10.44 3.91 (3.81 - 4.01) 2.93 (2.85 - 3.01)
Test;full blood count 2,857 5.39 2.02 (1.95 - 2.09) 1.51 (1.46 - 1.57)
Test;blood 2,151 4.06 1.52 (1.46 - 1.58) 1.14 (1.09 - 1.19)
178 0.33 0.13 (0.11 - 0.15) 0.10 (0.08 - 0.11)
132 0.25 0.09 (0.08 - 0.11) 0.07 (0.06 - 0.08)
Test;ESR 113 0.21 0.08 (0.07 - 0.10) 0.06 (0.05 - 0.07)
Blood screen 53 0.10 0.04 (0.03 - 0.05) 0.03 (0.02 - 0.04)
(continued)Note: ESR - erythrocyte sedimentation rate

� � � � � � � � � � � � � � � � � � � � � � � � � � � �
� #
Investigation Number
Percentage
of all
investigations
(n = 53,028)
Rate per 100
encounters
(95% CI)
(n = 141,593)
Rate per 100
diagnoses
(95% CI)
(n = 188,944)
Test;prolactin 40 0.08 0.03 (0.02 - 0.04) 0.02 (0.02 - 0.03)
Test;albumin 6 0.01 0.01 (0.00 - 0.01) 0.00 (0.00 - 0.01)
Test;electrolytes 5 0.01 0.00 (0.00 - 0.01) 0.00 (0.00 - 0.01)
Test;calcium/magnesium/
phosphate2 0.00 0.00 (0.00 - 0.0.1) 0.00 (0.00 - 0.00)
Diagnostic radiology/
imaging; pregnancy4,831 9.11 3.41 (3.32 - 3.51) 2.56 (2.49 - 2.63)
Ultrasound;obstetric 4,831 9.11 3.41 (3.32 - 3.51) 2.56 (2.49 - 2.63)
Other laboratory test NEC;
urinary4,020 7.58 2.84 (2.75 - 2.93) 2.13 (2.06 - 2.19)
Test;renal function 4,020 7.58 2.84 (2.75 - 2.93) 2.13 (2.06 - 2.19)
Diagnostic radiology/
imaging3,543 6.68 2.50 (2.42 - 2.58) 1.88 (1.81 - 1.94)
X-ray;chest 2,920 5.51 2.06 (1.99 - 2.14) 1.55 (1.49 - 1.60)
Ultrasound 378 0.71 0.27 (0.24 - 0.30) 0.20 (0.18 - 0.22)
Ultrasound;abdomen 104 0.20 0.07 (0.06 - 0.09) 0.06 (0.05 - 0.07)
Ultrasound;pelvis 93 0.18 0.07 (0.05 - 0.08) 0.05 (0.04 - 0.06)
X-ray;abdomen 47 0.09 0.03 (0.03 - 0.04) 0.03 (0.02 - 0.03)
Blood test digestive 3,002 5.66 2.12 (2.05 - 2.20) 1.59 (1.53 - 1.65)
Test;liver function 2,485 4.69 1.76 (1.69 - 1.82) 1.32 (1.26 - 1.37)
Test;bilirubin 516 0.97 0.37 (0.33 - 0.40) 0.27 (0.25 - 0.30)
Test;gGT 2 0.00 0.00 (0.00 - 0.01) 0.00 (0.00 - 0.00)
Electrical tracing;
cardiovascular1,268 2.39 0.90 (0.85 - 0.95) 0.67 (0.64 - 0.71)
Electrocardiogram 1,260 2.38 0.89 (0.84 - 0.94) 0.67 (0.63 - 0.70)
Electrocardiogram; stress
test6 0.01 0.01 (0.00 - 0.01) 0.00 (0.00 - 0.01)
Holter monitor 1 0.00 0.00 (0.00 - 0.00) 0.00 (0.00 - 0.00)
Blood test; blood/lymph 943 1.78 0.67 (0.62 - 0.71) 0.50 (0.47 - 0.53)
Test;haemoglobin 689 1.30 0.49 (0.45 - 0.52) 0.37 (0.34 - 0.39)
Test;iron studies 69 0.13 0.05 (0.04 - 0.06) 0.04 (0.03 - 0.05)
Test;INR 52 0.10 0.04 (0.03 - 0.05) 0.03 (0.02 - 0.04)
Test;ferritin 49 0.09 0.04 (0.03 - 0.05) 0.03 (0.02 - 0.03)
Test;haemoglobin epg 44 0.08 0.03 (0.02 - 0.04) 0.02 (0.02 - 0.03)
Test;prothrombin time 21 0.04 0.02 (0.01 - 0.02) 0.01 (0.01 - 0.02)
Table 9.1 (continued): Types of investigations by ICPC-2 chapters and common individual
test within chapter in primary care clinics in 2012
(continued) Haemoglobin EPG = haemoglobin electrophoresis

� � � � � � � � � � � � � � � � � � � � � � � � � � � �
� $
Investigation Number
Percentage
of all
investigations
(n = 53,028)
Rate per 100
encounters
(95% CI)
(n = 141,593)
Rate per 100
diagnoses
(95% CI)
(n = 188,944)
Test;APTT 15 0.03 0.01 (0.01 - 0.02) 0.01 (0.00 - 0.01)
Test;reticulocyte count 2 0.00 0.00 (0.00 - 0.01) 0.00 (0.00 - 0.00)
Test;blood;platelets 1 0.00 0.00 (0.00 - 0.00) 0.00 (0.00 - 0.00)
Urine test; endocrine/
metabolic873 1.65 0.62 (0.58 - 0.66) 0.46 (0.43 - 0.49)
Test;urine;endocrine/
metabolic873 1.65 0.62 (0.58 - 0.66) 0.46 (0.43 - 0.49)
Urine test; pregnancy 664 1.25 0.47 (0.43 - 0.51) 0.35 (0.33 - 0.38)
Test;urine;pregnancy 664 1.25 0.47 (0.43 - 0.51) 0.35 (0.33 - 0.38)
Microbiological/
immunological test;
digestive
636 1.20 0.45 (0.42 - 0.49) 0.34 (0.31 - 0.36)
Test;hepatitis B antigen 379 0.72 0.27 (0.24 - 0.30) 0.20 (0.18 - 0.22)
Test;hepatitis B antibody 148 0.28 0.11 (0.09 - 0.12) 0.08 (0.07 - 0.09)
Test;hepatitis C antigen 50 0.10 0.04 (0.03 - 0.05) 0.03 (0.02 - 0.04)
Test;blood;H Pylori 28 0.05 0.02 (0.01 - 0.03) 0.02 (0.01 - 0.02)
Test;hepatitis C antibody 17 0.03 0.01 (0.01 - 0.02) 0.01 (0.01 - 0.01)
Test;faeces;MC&S 11 0.02 0.01 (0.00 - 0.01) 0.01 (0.00 - 0.01)
Test;hepatitis E antibody 1 0.00 0.00 (0.00 - 0.00) 0.00 (0.00 - 0.00)
Test;hepatitis E antigen 1 0.00 0.00 (0.00 - 0.00) 0.00 (0.00 - 0.00)
Microbiological/
immunological test; blood/
lymph
552 1.04 0.39 (0.36 - 0.42) 0.29 (0.27 - 0.32)
Test;HIV 469 0.88 0.33 (0.30 - 0.36) 0.25 (0.23 - 0.27)
Test;blood group 83 0.16 0.06 (0.05 - 0.07) 0.04 (0.04 - 0.05)
Blood test; urinary 545 1.03 0.39 (0.35 - 0.42) 0.29 (0.27 - 0.31)
Test;urate/uric acid 393 0.74 0.28 (0.25 - 0.31) 0.21 (0.19 - 0.23)
Test;creatinine 152 0.29 0.11 (0.09 - 0.13) 0.08 (0.07 - 0.09)
Diagnostic radiology/
imaging; musculoskeletal518 0.98 0.37 (0.34 - 0.39) 0.28 (0.26 - 0.30)
X-ray;foot/feet 87 0.16 0.06 (0.05 - 0.07) 0.05 (0.04 - 0.06)
X-ray;elbow 76 0.14 0.06 (0.04 - 0.07) 0.04 (0.03 - 0.05)
X-ray;hand 54 0.10 0.04 (0.03 - 0.05) 0.03 (0.02 - 0.04)
38 0.07 0.03 (0.02 - 0.04) 0.02 (0.02 - 0.03)
X-ray;toe(s) 37 0.07 0.03 (0.02 - 0.03) 0.02 (0.02 - 0.03)
Table 9.1 (continued): Types of investigations by ICPC-2 chapters and common individual
test within chapter in primary care clinics in 2012
(continued)Note: APTT - activated partial thromboplastin time; MC&S - microscopy, culture and sensitivity;

� � � � � � � � � � � � � � � � � � � � � � � � � � � �
� �
Investigation Number
Percentage
of all
investigations
(n = 53,028)
Rate per 100
encounters
(95% CI)
(n = 141,593)
Rate per 100
diagnoses
(95% CI)
(n = 188,944)
X-ray;spine;lumbosacral 36 0.07 0.03 (0.02 - 0.03) 0.02 (0.01 - 0.03)
X-ray;knee 30 0.06 0.02 (0.01 - 0.03) 0.02 (0.01 - 0.02)
X-ray;heel 28 0.05 0.02 (0.01 - 0.03) 0.02 (0.01 - 0.02)
X-ray;spine;cervical 22 0.04 0.02 (0.01 - 0.02) 0.01 (0.01 - 0.02)
Plain X-ray;bone(s) 21 0.04 0.02 (0.01 - 0.02) 0.01 (0.01 - 0.02)
X-ray;ankle 19 0.04 0.02 (0.01 - 0.02) 0.01 (0.01 - 0.02)
Ultrasound;neck 12 0.02 0.01 (0.00 - 0.01) 0.01 (0.00 - 0.01)
X-ray;back 12 0.02 0.01 (0.00 - 0.01) 0.01 (0.00 - 0.01)
X-ray;shoulder 10 0.02 0.01 (0.00 - 0.01) 0.01 (0.00 - 0.01)
X-ray;leg 7 0.01 0.01 (0.00 - 0.01) 0.00 (0.00 - 0.01)
X-ray;forearm 7 0.01 0.01 (0.00 - 0.01) 0.00 (0.00 - 0.01)
X-ray;spine 5 0.01 0.00 (0.00 - 0.01) 0.00 (0.00 - 0.01)
X-ray;spine;
thoracolumbar5 0.01 0.01 (0.00 - 0.01) 0.00 (0.00 - 0.01)
X-ray;arm 3 0.01 0.00 (0.00 - 0.01) 0.00 (0.00 - 0.00)
X-ray;clavicle 2 0.00 0.00 (0.00 - 0.00) 0.00 (0.00 - 0.00)
X-ray;wrist 2 0.00 0.00 (0.00 - 0.00) 0.00 (0.00 - 0.00)
X-ray;spine;lumbar 2 0.00 0.00 (0.00 - 0.00) 0.00 (0.00 - 0.00)
X-ray;femur 1 0.00 0.00 (0.00 - 0.00) 0.00 (0.00 - 0.00)
X-ray;metacarpal 1 0.00 0.00 (0.00 - 0.00) 0.00 (0.00 - 0.00)
Microbiological/
immunological test;
respiratory
447 0.84 0.32 (0.29 - 0.35) 0.24 (0.22 - 0.26)
Culture;tuberculosis 403 0.76 0.29 (0.26 - 0.31) 0.21 (0.19 - 0.24)
Test;sputum MC&S 34 0.06 0.03 (0.02 - 0.03) 0.02 (0.01 - 0.03)
Test;throat swab MC&S 10 0.02 0.01 (0.00 - 0.01) 0.01 (0.00 - 0.01)
Microbiological/
immunological test444 0.84 0.31 (0.29 - 0.34) 0.24 (0.21 - 0.26)
Test;sexually transmitted
infection355 0.67 0.25 (0.23 - 0.28) 0.19 (0.17 - 0.21)
Test;dengue fever 66 0.12 0.05 (0.04 - 0.06) 0.04 (0.03 - 0.04)
Test;measles virus
antibodies10 0.02 0.01 (0.00 - 0.01) 0.01 (0.00 - 0.01)
Test;alpha fetoprotein 6 0.01 0.01 (0.00 - 0.01) 0.00 (0.00 - 0.01)
Table 9.1 (continued): Types of investigations by ICPC-2 chapters and common individual
test within chapter in primary care clinics in 2012
(continued)Note: MC&S - microscopy, culture and sensitivity

� � � � � � � � � � � � � � � � � � � � � � � � � � � �
�
Investigation Number
Percentage
of all
investigations
(n = 53,028)
Rate per 100
encounters
(95% CI)
(n = 141,593)
Rate per 100
diagnoses
(95% CI)
(n = 188,944)
Test;lymphocyte type &
count6 0.01 0.01 (0.00 - 0.01) 0.00 (0.00 - 0.01)
Test;culture and
sensitivity1 0.00 0.00 (0.00 - 0.00) 0.00 (0.00 - 0.00)
Electrical tracing;
pregnancy433 0.82 0.31 (0.28 - 0.34) 0.23 (0.21 - 0.25)
Monitoring;foetal 428 0.81 0.30 (0.27 - 0.33) 0.23 (0.21 - 0.25)
Cardiotocography 6 0.01 0.01 (0.00 - 0.01) 0.00 (0.00 - 0.01)
Other diagnostic
procedure; eye427 0.81 0.30 (0.27 - 0.33) 0.23 (0.21 - 0.25)
Procedures;diagnostic;
eye427 0.81 0.30 (0.27 - 0.33) 0.23 (0.21 - 0.25)
Physical function test;
respiratory289 0.54 0.21 (0.18 - 0.23) 0.15 (0.14 - 0.17)
Test;lung function 177 0.33 0.13 (0.11 - 0.15) 0.09 (0.08 - 0.11)
110 0.21 0.08 (0.06 - 0.09) 0.06 (0.05 - 0.07)
Test;spirometry 1 0.00 0.00 (0.00 - 0.00) 0.00 (0.00 - 0.00)
9.3 INVESTIGATIONS MOST FREQUENTLY ORDERED IN PUBLIC AND PRIVATE
CLINICS
Individual investigations or tests were ranked in decreasing order irrespective of ICPC-2 chapter and ten
most frequently ordered investigations are presented in Figure 9.2 (public clinics) and Figure 9.3 (private
clinics).
49.6 per 100 diagnoses.
and 15.7 per 100 diagnoses.
investigations were listed among the top ten investigations for both sectors.
Table 9.1 (continued): Types of investigations by ICPC-2 chapters and common individual
test within chapter in primary care clinics in 2012

� � � � � � � � � � � � � � � � � � � � � � � � � � � �
� !
Figure 9.3 Top 10 investigations ordered in private clinics in 2012
Figure 9.2 Top 10 investigations ordered in public clinics in 2012
1.9
3.3
4.0
4.8
5.0
5.8
7.8
8.2
9.2
12.2
0 2 4 6 8 10 12 14
Electrocardiogram
Test;urine;albumin
Test;urine
Test;HbA1c
Test;liver functions
Test;full blood count
Test;lipids profile
Test;renal function
Ultrasound;obstetrics
Test;glucose & glucose tolerance
Rate per 100 encounters
0.4
0.4
0.5
0.6
0.6
0.9
2.0
2.2
2.6
3.6
0 2 4 6 8 10 12 14
Electrocardiogram
Test;HbA1c
Test;urine;pregnancy
Test;renal function
Test;lipids profile
Ultrasound;obstetric
Test;blood
X-ray;chest
Test;glucose tolerance
Test;urine
Rate per 100 encounters

� � � � � � � � � � � � � � � � � � � � � � � � � � � �
� %
9.4 DIAGNOSES WITH INVESTIGATIONS ORDERED
Table 9.2 shows the top 20 diagnoses for which investigations were ordered.
at a rate of 23.0 per 100 encounters.
were ordered.
with the leading investigations ordered, which was glucose blood test (see Section 9.2 and Section
9.3). Nearly half of all diabetes cases were accompanied with investigation test.
Table 9.2: Top 10 diagnoses for which investigation was most frequently ordered in primary
care clinics in 2012
Diagnosis Number Percentage(a)
Rate per 100
encounters
(n = 141,593)
95% CI Rate
per 100
contacts(b)LCL UCL
Diabetes - all* 6,515 20.0 4.60 4.49 4.71 49.3
Hypertension - all* 3,910 12.0 2.76 2.68 2.85 20.3
Medical examination -
pregnancy*3,745 11.5 2.65 2.56 2.73 68.7
Medical examination -
general*3,050 9.4 2.16 2.08 2.23 58.4
Lipid disorder 2,549 7.8 1.80 1.73 1.87 21.7
Cystitis/urinary infection 1,297 4.0 0.92 0.87 0.97 62.8
Anaemia - all* 1,146 3.5 0.81 0.76 0.86 57.3
Upper respiratory
infection, acute739 2.3 0.52 0.49 0.56 2.3
Perinatal morbidity 487 1.5 0.35 0.31 0.38 72.3
Pregnancy* 416 1.3 0.30 0.27 0.32 84.4
Subtotal 23,855 73.2 16.85 16.65 17.04 -
Total 32,570 100.0 23.00 22.78 23.22 -
(a) Percentage of all diagnoses with investigations
(b) Percentage of total contacts with the diagnosis that generated at least one order of investigation
*Multiple ICPC-2 codes (see Appendix 2)
Note: perinatal morbidity = neonatal jaundice


Chapter 10Advice/Counselling
And Procedures

� � � � � � � � � � � � � � � � � � � � � � � � � � � �
�
CHAPTER 10: ADVICE/COUNSELLING AND PROCEDURES
Counselling interventions in clinical settings are employed to assist patients in adopting, changing,
or maintaining behaviours affecting health outcomes and health status.1 In primary care, healthcare
providers have the opportunities to provide advice on health promotions and lifestyle counselling, but
heavy workload and lack of time were often reported by doctors as barriers to this interventions.1,2
In this report, advice/counselling refer to health education, advice or counselling delivered by doctors
or other healthcare professionals during patient visit to primary care. This can be related to disease,
medication compliance, healthy diet, lifestyle intervention or others. In addition, the number of procedures
and type of procedures commonly performed in primary care clinics were also measured. Procedures
refer to any therapeutic procedures, rehabilitation or administrative procedures undertaken in the clinic
during patient visit.
This chapter reports the advice/counselling and procedures provided to the patients at each encounter. For
each patient visit, the doctors were asked to record any procedure/counselling/other treatment provided
and linked to diagnosis of which this procedure/counselling/other treatment was indicated for.
10.1 NUMBER OF ADVICE/COUNSELLING AND PROCEDURES
Table 10.1 shows the proportion of encounters provided with advice/counselling and procedures during
visit to primary care clinics. Advice/counselling were provided for 19.3% of all encounters whereas
procedures were part of management process for only 2.3% of encounters.
Table 10.1: Advice/counselling and procedures in primary care clinics in 2012
Variable
Overall Public Private
Number of
encounters
Percent of
encounters
(95% CI)
(n = 141,593)
Number of
encounters
Percent of
encounters
(95% CI)
(n = 42,340)
Number of
encounters
Percent of
encounters
(95% CI)
(n = 99,253)
Advice/counselling 27,257 19.3 (19.1 - 19.5) 15,747 11.1 (11.0 - 11.3) 11,510 8.1 (8.0 - 8.3)
Procedures 3,219 2.3 (2.2 - 2.4) 623 0.4 (0.4 - 0.5) 2,595 1.8 (1.8 - 1.9)
10.2 TYPES OF ADVICE AND COUNSELLING
Table 10.2 displays the types of advice/ counselling provided to patients attending primary care clinics.
primary care clinics. Lifestyle advice accounted for majority of the cases. Others were related to quit
smoking, alcohol, illicit drugs, stress management or other psychological advice.
were diabetic health education, foot care and diabetic diet.

� � � � � � � � � � � � � � � � � � � � � � � � � � � �
�
Table 10.2: Types of advice/counselling provided in primary care clinics in 2012
Advice/counselling Number
Percentage
of all advice/
counselling
Rate per 100
encounters
(95% CI)
(n = 141,593)
Rate per 100
diagnoses
(95% CI)
(n = 188,944)
Advice/counselling; general/18,196 49.47 12.85 (12.68 - 13.03) 9.63 (9.50 - 9.76)
Advice/counselling;
psychological5,243 14.25 3.70 (3.61 - 3.80) 2.78 (2.70 - 2.85)
Advice/counselling; endocrine/
metabolic4,875 13.25 3.44 (3.35 - 3.54) 2.58 (2.51 - 2.65)
Advice/counselling;
respiratory1,789 4.86 1.26 (1.21 - 1.32) 0.95 (0.90 - 0.99)
Advice/counselling; pregnancy 1,720 4.68 1.22 (1.16 - 1.27) 0.91 (0.87 - 0.95)
Advice/counselling;
cardiovascular1,540 4.19 1.09 (1.03 - 1.14) 0.82 (0.78 - 0.86)
Advice/counselling;
musculoskeletal736 2.00 0.52 (0.48 - 0.56) 0.39 (0.36 - 0.42)
Advice/counselling; digestive 634 1.72 0.45 (0.41 - 0.48) 0.34 (0.31 - 0.36)
Advice/counselling; skin 598 1.63 0.42 (0.39 - 0.46) 0.32 (0.29 - 0.34)
Advice/counselling; blood/
lymph487 1.32 0.35 (0.31 - 0.38) 0.26 (0.24 - 0.28)
Advice/counselling; eye 349 0.95 0.25 (0.22 - 0.27) 0.19 (0.17 - 0.21)
Advice/counselling; genital;
female235 0.64 0.17 (0.15 - 0.19) 0.13 (0.11 - 0.14)
Advice/counselling; urinary 140 0.38 0.10 (0.08 - 0.12) 0.08 (0.06 - 0.09)
Advice/counselling;
neurological82 0.22 0.06 (0.05 - 0.07) 0.04 (0.04 - 0.05)
Advice/counselling; ear 70 0.19 0.05 (0.04 - 0.06) 0.04 (0.03 - 0.05)
Advice/counselling; social 38 0.10 0.03 (0.02 - 0.04) 0.02 (0.01 - 0.03)
Advice/counselling; genital;
male34 0.09 0.03 (0.02 - 0.03) 0.02 (0.01 - 0.03)
Demand6 0.02 0.01 (0.00 - 0.01) 0.00 (0.00 - 0.01)
Consultation primary care
provider2 0.00 0.00 (0.00 - 0.01) 0.00 (0.00 - 0.00)
Total advice/counselling 36,782 100 25.98 (25.75 - 26.21) 19.47 (19.29 - 19.65)
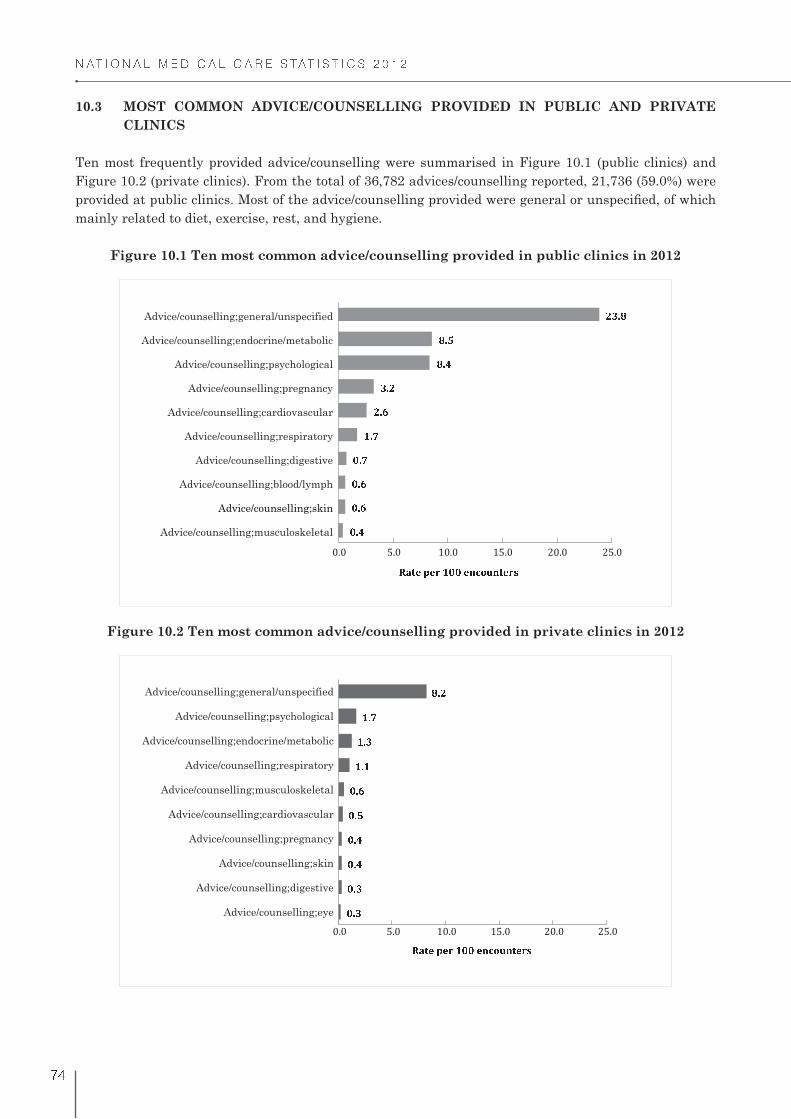
� � � � � � � � � � � � � � � � � � � � � � � � � � � �
#
10.3 MOST COMMON ADVICE/COUNSELLING PROVIDED IN PUBLIC AND PRIVATE
CLINICS
Ten most frequently provided advice/counselling were summarised in Figure 10.1 (public clinics) and
Figure 10.2 (private clinics). From the total of 36,782 advices/counselling reported, 21,736 (59.0%) were
mainly related to diet, exercise, rest, and hygiene.
Figure 10.1 Ten most common advice/counselling provided in public clinics in 2012
Figure 10.2 Ten most common advice/counselling provided in private clinics in 2012
& ' (& ' )& ' )& ' * + ' * , ' )- ' , . ' (. ' / , - ' .
Advice/counselling;musculoskeletal
Advice/counselling;skin
Advice/counselling;blood/lymph
Advice/counselling;digestive
Advice/counselling;respiratory
Advice/counselling;cardiovascular
Advice/counselling;pregnancy
Advice/counselling;psychological
Advice/counselling;endocrine/metabolic
Advice/counselling;general/unspecified
0 1 2 3 4 3 5 + & & 3 6 7 8 9 6 2 3 5 :
; < =; < =; < >; < >; < ?; < @A < AA < =A < B C < D
Advice/counselling;eye
Advice/counselling;digestive
Advice/counselling;skin
Advice/counselling;pregnancy
Advice/counselling;cardiovascular
Advice/counselling;musculoskeletal
Advice/counselling;respiratory
Advice/counselling;endocrine/metabolic
Advice/counselling;psychological
Advice/counselling;general/unspecified
E F G H I H J A ; ; H K L M N K G H J O
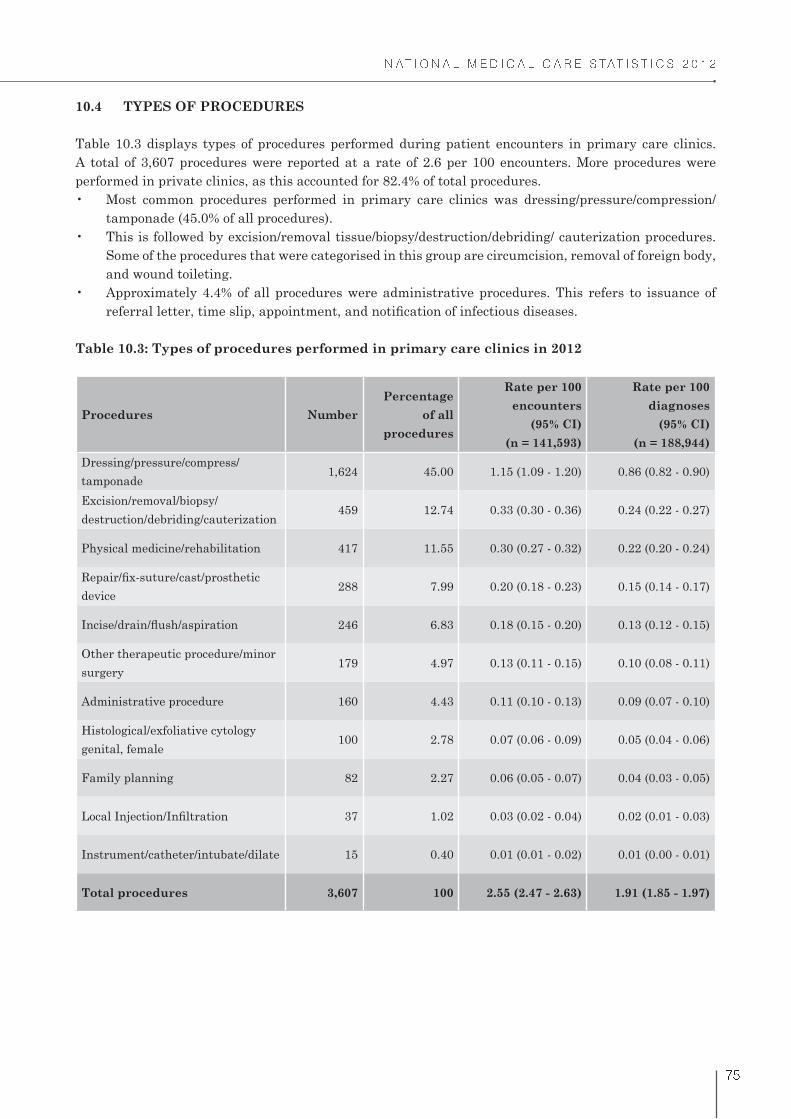
� � � � � � � � � � � � � � � � � � � � � � � � � � � �
$
10.4 TYPES OF PROCEDURES
Table 10.3 displays types of procedures performed during patient encounters in primary care clinics.
A total of 3,607 procedures were reported at a rate of 2.6 per 100 encounters. More procedures were
performed in private clinics, as this accounted for 82.4% of total procedures.
tamponade (45.0% of all procedures).
Some of the procedures that were categorised in this group are circumcision, removal of foreign body,
and wound toileting.
Table 10.3: Types of procedures performed in primary care clinics in 2012
Procedures Number
Percentage
of all
procedures
Rate per 100
encounters
(95% CI)
(n = 141,593)
Rate per 100
diagnoses
(95% CI)
(n = 188,944)
Dressing/pressure/compress/
tamponade1,624 45.00 1.15 (1.09 - 1.20) 0.86 (0.82 - 0.90)
Excision/removal/biopsy/
destruction/debriding/cauterization459 12.74 0.33 (0.30 - 0.36) 0.24 (0.22 - 0.27)
Physical medicine/rehabilitation 417 11.55 0.30 (0.27 - 0.32) 0.22 (0.20 - 0.24)
device288 7.99 0.20 (0.18 - 0.23) 0.15 (0.14 - 0.17)
246 6.83 0.18 (0.15 - 0.20) 0.13 (0.12 - 0.15)
Other therapeutic procedure/minor
surgery 179 4.97 0.13 (0.11 - 0.15) 0.10 (0.08 - 0.11)
Administrative procedure 160 4.43 0.11 (0.10 - 0.13) 0.09 (0.07 - 0.10)
Histological/exfoliative cytology
genital, female100 2.78 0.07 (0.06 - 0.09) 0.05 (0.04 - 0.06)
Family planning 82 2.27 0.06 (0.05 - 0.07) 0.04 (0.03 - 0.05)
37 1.02 0.03 (0.02 - 0.04) 0.02 (0.01 - 0.03)
Instrument/catheter/intubate/dilate 15 0.40 0.01 (0.01 - 0.02) 0.01 (0.00 - 0.01)
Total procedures 3,607 100 2.55 (2.47 - 2.63) 1.91 (1.85 - 1.97)
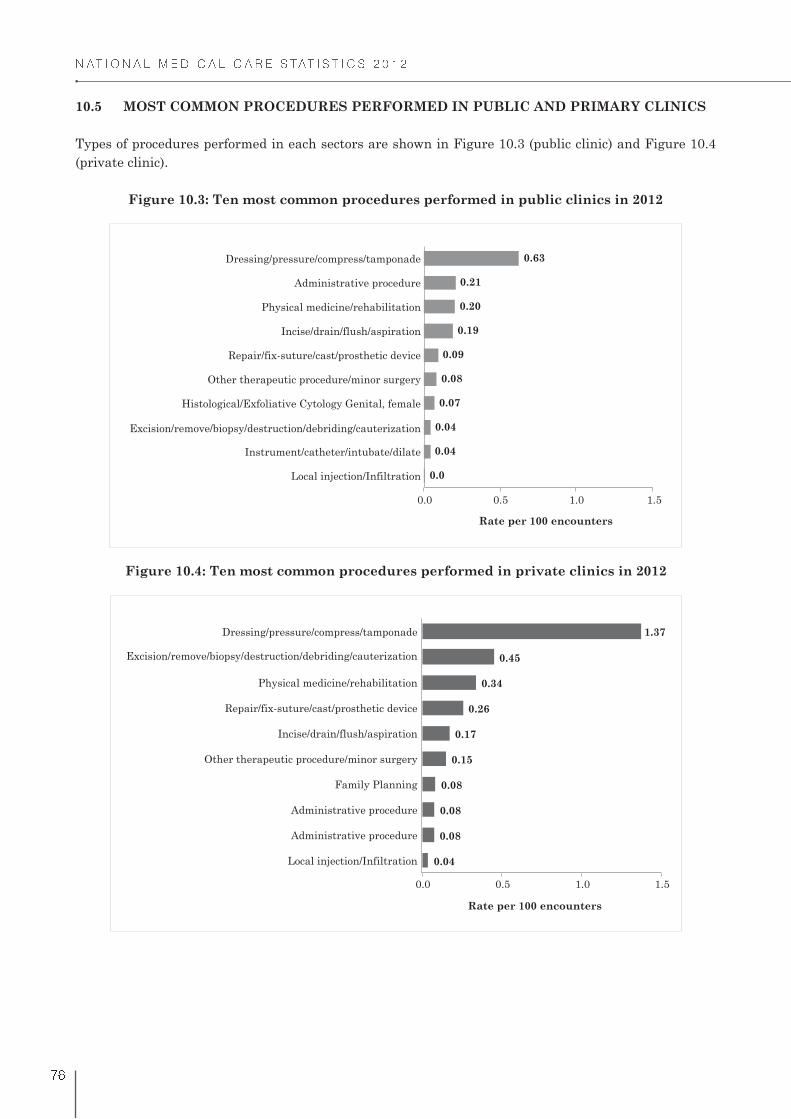
� � � � � � � � � � � � � � � � � � � � � � � � � � � �
�
10.5 MOST COMMON PROCEDURES PERFORMED IN PUBLIC AND PRIMARY CLINICS
Types of procedures performed in each sectors are shown in Figure 10.3 (public clinic) and Figure 10.4
(private clinic).
Figure 10.3: Ten most common procedures performed in public clinics in 2012
Figure 10.4: Ten most common procedures performed in private clinics in 2012
1.5
0.0
0.04
0.04
0.07
0.08
0.09
0.19
0.20
0.21
0.63
0.0 0.5 1.0
Local injection/Infiltration
Instrument/catheter/intubate/dilate
Excision/remove/biopsy/destruction/debriding/cauterization
Histological/Exfoliative Cytology Genital, female
Other therapeutic procedure/minor surgery
Repair/fix-suture/cast/prosthetic device
Incise/drain/flush/aspiration
Physical medicine/rehabilitation
Administrative procedure
Dressing/pressure/compress/tamponade
Rate per 100 encounters
Rate per 100 encounters
0.04
0.08
0.08
0.08
0.15
0.17
0.26
0.34
0.45
1.37
0.0 0.5 1.0 1.5
Local injection/Infiltration
Administrative procedure
Administrative procedure
Family Planning
Other therapeutic procedure/minor surgery
Incise/drain/flush/aspiration
Repair/fix-suture/cast/prosthetic device
Physical medicine/rehabilitation
Excision/remove/biopsy/destruction/debriding/cauterization
Dressing/pressure/compress/tamponade

� � � � � � � � � � � � � � � � � � � � � � � � � � � �
10.6 DIAGNOSES WITH ADVICE/COUNSELLING AND PROCEDURES
Table 10.4 and Table 10.5 list ten diagnoses most frequently managed with advice/counselling and
procedures in primary care.
Diagnoses with advice/counselling (Table 10.4):
with advice/counselling. Together, these three diagnoses made up 47.5% of all diagnoses with advice/
counselling.
in more than 50.0% of all gestational diabetes cases.
Diagnoses with procedures (Table 10.5):
diagnoses managed in primary care clinics.
procedures.
Table 10.4: Ten most common diagnoses with advice/counselling in primary care clinics in
2012
Diagnosis Number Percentage(a)
Rate per 100
encounters
(n = 141,593)
95% CI Rate
per 100
contacts(b)LCL UCL
Hypertension - all* 6,516 18.88 4.60 4.49 4.71 33.85
Diabetes - all* 6,016 17.43 4.25 4.14 4.35 45.55
Diabetes* 5,126 14.85 3.62 3.52 3.72 43.60
Diabetes, gestational 890 2.58 0.63 0.59 0.67 61.40
Lipid disorder 3,863 11.20 2.73 2.65 2.81 32.89
Upper respiratory infection,
acute2,264 6.56 1.60 1.53 1.67 7.05
Medical examination -
pregnancy*1,200 3.48 0.85 0.80 0.90 23.08
Pregnancy high risk 862 2.50 0.61 0.57 0.65 43.73
Asthma 815 2.36 0.58 0.54 0.62 21.00
Gastrointestinal infection* 721 2.09 0.51 0.47 0.55 10.36
Stomach function disorder 622 1.80 0.44 0.41 0.48 14.84
Medical examination -
general*427 1.24 0.30 0.27 0.33 8.18
Subtotal 23,306 67.55 16.46 16.27 16.65 -
Total 34,504 100.0 24.37 24.15 24.59 -
(a) Percentage of all diagnoses with advice/counselling
(b) Percentage of total contacts with the diagnosis that resulted in at least one advice/counselling
*Multiple ICPC-2 codes (see Appendix 2)
Note: Stomach function disorder = gastritis

� � � � � � � � � � � � � � � � � � � � � � � � � � � �
!
Table 10.5: Ten most common diagnoses with procedures in primary care clinics in 2012
Diagnosis Number Percentage(a)
Rate per 100
encounters
(n = 141,593)
95% CI Rate
per 100
contacts(b)LCL UCL
Laceration/cut 372 12.62 0.26 0.24 0.29 60.64
Chronic ulcer skin 265 9.00 0.19 0.17 0.21 73.17
Trauma/injury NOS 220 7.45 0.16 0.14 0.18 41.49
Infectious disease, other/
NOS205 6.96 0.15 0.13 0.17 15.65
Injury musculoskeletal
NOS124 4.21 0.09 0.07 0.10 30.91
Skin injury, other 109 3.70 0.08 0.06 0.09 12.29
Circumcision, male 108 3.67 0.08 0.06 0.09 100.00
Abrasion/scratch/blister 90 3.07 0.07 0.05 0.08 26.20
Upper respiratory tract
infection, acute85 2.88 0.06 0.05 0.07 0.26
Dressing/pressure/
compress/tamponade85 2.88 0.06 0.05 0.07 94.19
Subtotal 1,664 56.45 1.18 1.12 1.23 -
Total 2,947 100.00 2.08 2.01 2.16 -
(a) Percentage of all diagnoses with procedures
(b) Percentage of total contacts with the diagnosis that resulted in at least one procedure
REFERENCES:
1. Whitlock EP, Orleans T, Pender N, Allan J. Evaluating primary care behavioral counseling
interventions: an evidence-based approach. Am J Prev Med. 2002; 22(4):267-84.
2. Brotons C, Björkelund C, Bulc M, Ciurana R, Godycki-Cwirko M, Jurgova E et al. Prevention and
health promotion in clinical practice; the views of general practitioners in Europe. Prev Med. 2005;
40(5):595-601.

Chapter 11Follow-Up And Referrals
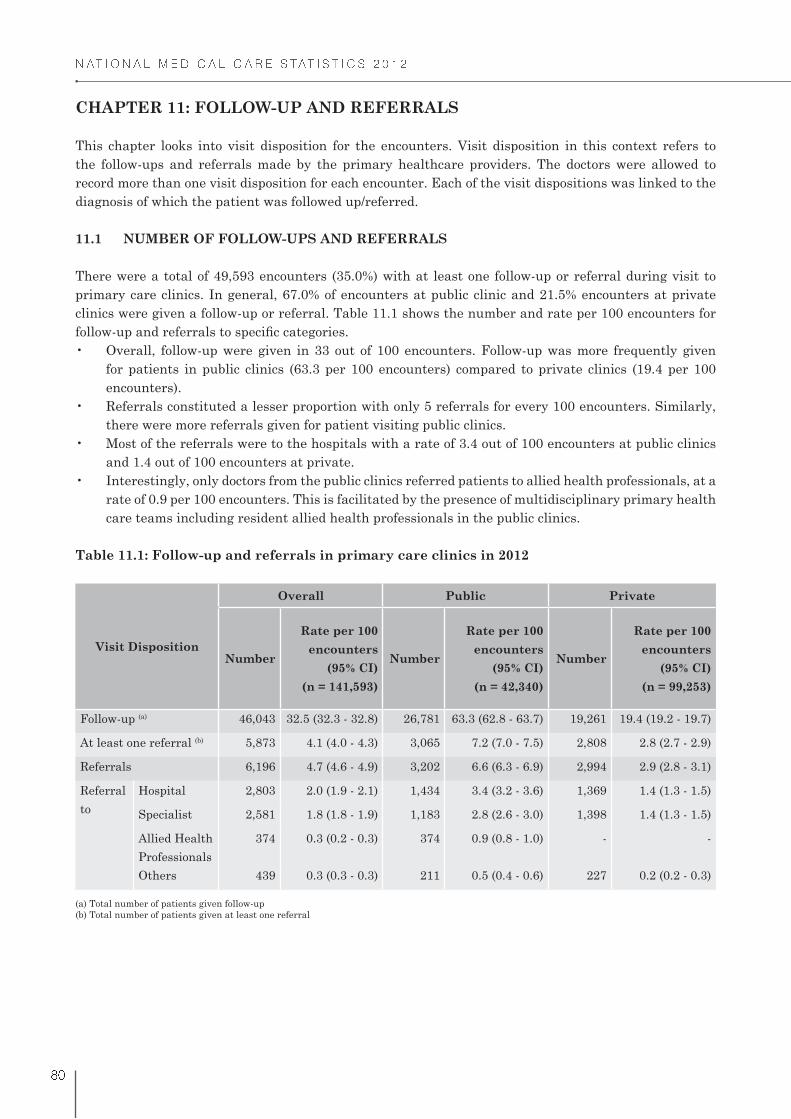
� � � � � � � � � � � � � � � � � � � � � � � � � � � �
! "
CHAPTER 11: FOLLOW-UP AND REFERRALS
This chapter looks into visit disposition for the encounters. Visit disposition in this context refers to
the follow-ups and referrals made by the primary healthcare providers. The doctors were allowed to
record more than one visit disposition for each encounter. Each of the visit dispositions was linked to the
diagnosis of which the patient was followed up/referred.
11.1 NUMBER OF FOLLOW-UPS AND REFERRALS
There were a total of 49,593 encounters (35.0%) with at least one follow-up or referral during visit to
primary care clinics. In general, 67.0% of encounters at public clinic and 21.5% encounters at private
clinics were given a follow-up or referral. Table 11.1 shows the number and rate per 100 encounters for
for patients in public clinics (63.3 per 100 encounters) compared to private clinics (19.4 per 100
encounters).
there were more referrals given for patient visiting public clinics.
and 1.4 out of 100 encounters at private.
rate of 0.9 per 100 encounters. This is facilitated by the presence of multidisciplinary primary health
care teams including resident allied health professionals in the public clinics.
Table 11.1: Follow-up and referrals in primary care clinics in 2012
Visit Disposition
Overall Public Private
Number
Rate per 100
encounters
(95% CI)
(n = 141,593)
Number
Rate per 100
encounters
(95% CI)
(n = 42,340)
Number
Rate per 100
encounters
(95% CI)
(n = 99,253)
Follow-up (a) 46,043 32.5 (32.3 - 32.8) 26,781 63.3 (62.8 - 63.7) 19,261 19.4 (19.2 - 19.7)
At least one referral (b) 5,873 4.1 (4.0 - 4.3) 3,065 7.2 (7.0 - 7.5) 2,808 2.8 (2.7 - 2.9)
Referrals 6,196 4.7 (4.6 - 4.9) 3,202 6.6 (6.3 - 6.9) 2,994 2.9 (2.8 - 3.1)
Referral
to
Hospital 2,803 2.0 (1.9 - 2.1) 1,434 3.4 (3.2 - 3.6) 1,369 1.4 (1.3 - 1.5)
Specialist 2,581 1.8 (1.8 - 1.9) 1,183 2.8 (2.6 - 3.0) 1,398 1.4 (1.3 - 1.5)
Allied Health
Professionals
374 0.3 (0.2 - 0.3) 374 0.9 (0.8 - 1.0) - -
Others 439 0.3 (0.3 - 0.3) 211 0.5 (0.4 - 0.6) 227 0.2 (0.2 - 0.3)
(a) Total number of patients given follow-up
(b) Total number of patients given at least one referral
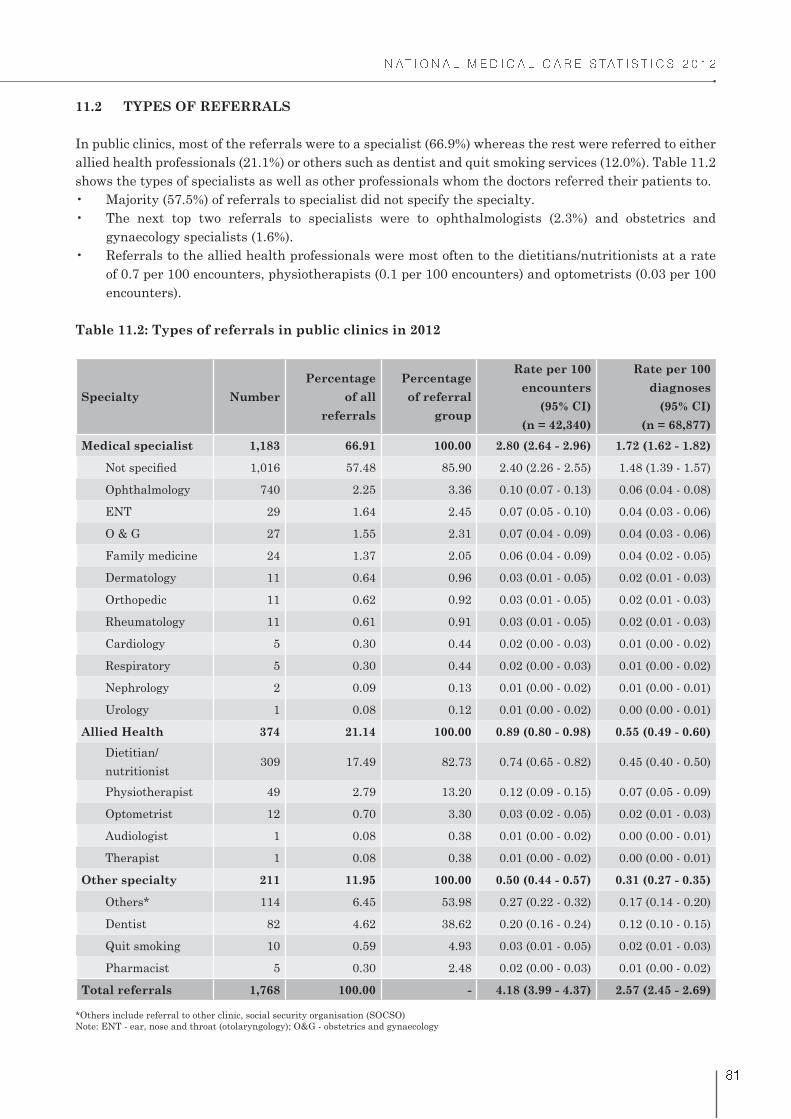
� � � � � � � � � � � � � � � � � � � � � � � � � � � �
! �
11.2 TYPES OF REFERRALS
In public clinics, most of the referrals were to a specialist (66.9%) whereas the rest were referred to either
allied health professionals (21.1%) or others such as dentist and quit smoking services (12.0%). Table 11.2
shows the types of specialists as well as other professionals whom the doctors referred their patients to.
gynaecology specialists (1.6%).
of 0.7 per 100 encounters, physiotherapists (0.1 per 100 encounters) and optometrists (0.03 per 100
encounters).
Table 11.2: Types of referrals in public clinics in 2012
Specialty Number
Percentage
of all
referrals
Percentage
of referral
group
Rate per 100
encounters
(95% CI)
(n = 42,340)
Rate per 100
diagnoses
(95% CI)
(n = 68,877)
Medical specialist 1,183 66.91 100.00 2.80 (2.64 - 2.96) 1.72 (1.62 - 1.82)
1,016 57.48 85.90 2.40 (2.26 - 2.55) 1.48 (1.39 - 1.57)
Ophthalmology 740 2.25 3.36 0.10 (0.07 - 0.13) 0.06 (0.04 - 0.08)
ENT 29 1.64 2.45 0.07 (0.05 - 0.10) 0.04 (0.03 - 0.06)
O & G 27 1.55 2.31 0.07 (0.04 - 0.09) 0.04 (0.03 - 0.06)
Family medicine 24 1.37 2.05 0.06 (0.04 - 0.09) 0.04 (0.02 - 0.05)
Dermatology 11 0.64 0.96 0.03 (0.01 - 0.05) 0.02 (0.01 - 0.03)
Orthopedic 11 0.62 0.92 0.03 (0.01 - 0.05) 0.02 (0.01 - 0.03)
Rheumatology 11 0.61 0.91 0.03 (0.01 - 0.05) 0.02 (0.01 - 0.03)
Cardiology 5 0.30 0.44 0.02 (0.00 - 0.03) 0.01 (0.00 - 0.02)
Respiratory 5 0.30 0.44 0.02 (0.00 - 0.03) 0.01 (0.00 - 0.02)
Nephrology 2 0.09 0.13 0.01 (0.00 - 0.02) 0.01 (0.00 - 0.01)
Urology 1 0.08 0.12 0.01 (0.00 - 0.02) 0.00 (0.00 - 0.01)
Allied Health 374 21.14 100.00 0.89 (0.80 - 0.98) 0.55 (0.49 - 0.60)
Dietitian/
nutritionist309 17.49 82.73 0.74 (0.65 - 0.82) 0.45 (0.40 - 0.50)
Physiotherapist 49 2.79 13.20 0.12 (0.09 - 0.15) 0.07 (0.05 - 0.09)
Optometrist 12 0.70 3.30 0.03 (0.02 - 0.05) 0.02 (0.01 - 0.03)
Audiologist 1 0.08 0.38 0.01 (0.00 - 0.02) 0.00 (0.00 - 0.01)
Therapist 1 0.08 0.38 0.01 (0.00 - 0.02) 0.00 (0.00 - 0.01)
Other specialty 211 11.95 100.00 0.50 (0.44 - 0.57) 0.31 (0.27 - 0.35)
Others* 114 6.45 53.98 0.27 (0.22 - 0.32) 0.17 (0.14 - 0.20)
Dentist 82 4.62 38.62 0.20 (0.16 - 0.24) 0.12 (0.10 - 0.15)
Quit smoking 10 0.59 4.93 0.03 (0.01 - 0.05) 0.02 (0.01 - 0.03)
Pharmacist 5 0.30 2.48 0.02 (0.00 - 0.03) 0.01 (0.00 - 0.02)
Total referrals 1,768 100.00 - 4.18 (3.99 - 4.37) 2.57 (2.45 - 2.69)
*Others include referral to other clinic, social security organisation (SOCSO)
Note: ENT - ear, nose and throat (otolaryngology); O&G - obstetrics and gynaecology
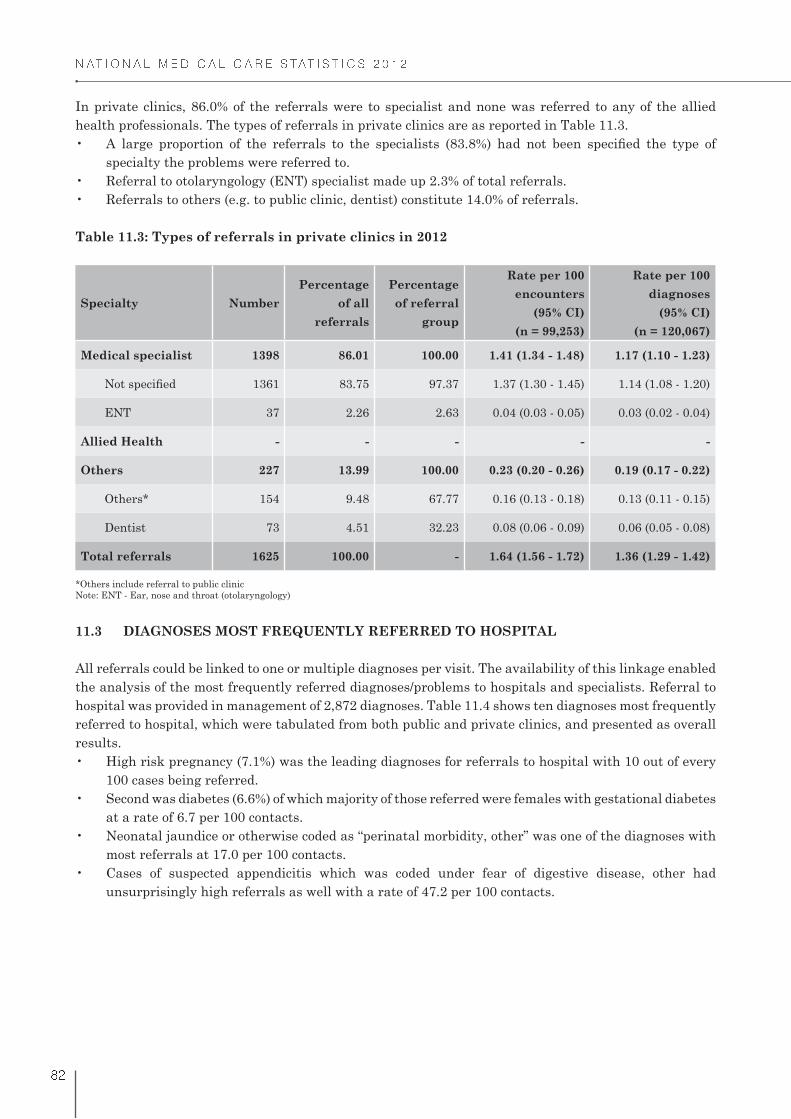
� � � � � � � � � � � � � � � � � � � � � � � � � � � �
! �
In private clinics, 86.0% of the referrals were to specialist and none was referred to any of the allied
health professionals. The types of referrals in private clinics are as reported in Table 11.3.
specialty the problems were referred to.
Table 11.3: Types of referrals in private clinics in 2012
Specialty Number
Percentage
of all
referrals
Percentage
of referral
group
Rate per 100
encounters
(95% CI)
(n = 99,253)
Rate per 100
diagnoses
(95% CI)
(n = 120,067)
Medical specialist 1398 86.01 100.00 1.41 (1.34 - 1.48) 1.17 (1.10 - 1.23)
1361 83.75 97.37 1.37 (1.30 - 1.45) 1.14 (1.08 - 1.20)
ENT 37 2.26 2.63 0.04 (0.03 - 0.05) 0.03 (0.02 - 0.04)
Allied Health - - - - -
Others 227 13.99 100.00 0.23 (0.20 - 0.26) 0.19 (0.17 - 0.22)
Others* 154 9.48 67.77 0.16 (0.13 - 0.18) 0.13 (0.11 - 0.15)
Dentist 73 4.51 32.23 0.08 (0.06 - 0.09) 0.06 (0.05 - 0.08)
Total referrals 1625 100.00 - 1.64 (1.56 - 1.72) 1.36 (1.29 - 1.42)
*Others include referral to public clinic
Note: ENT - Ear, nose and throat (otolaryngology)
11.3 DIAGNOSES MOST FREQUENTLY REFERRED TO HOSPITAL
All referrals could be linked to one or multiple diagnoses per visit. The availability of this linkage enabled
the analysis of the most frequently referred diagnoses/problems to hospitals and specialists. Referral to
hospital was provided in management of 2,872 diagnoses. Table 11.4 shows ten diagnoses most frequently
referred to hospital, which were tabulated from both public and private clinics, and presented as overall
results.
100 cases being referred.
at a rate of 6.7 per 100 contacts.
most referrals at 17.0 per 100 contacts.
unsurprisingly high referrals as well with a rate of 47.2 per 100 contacts.
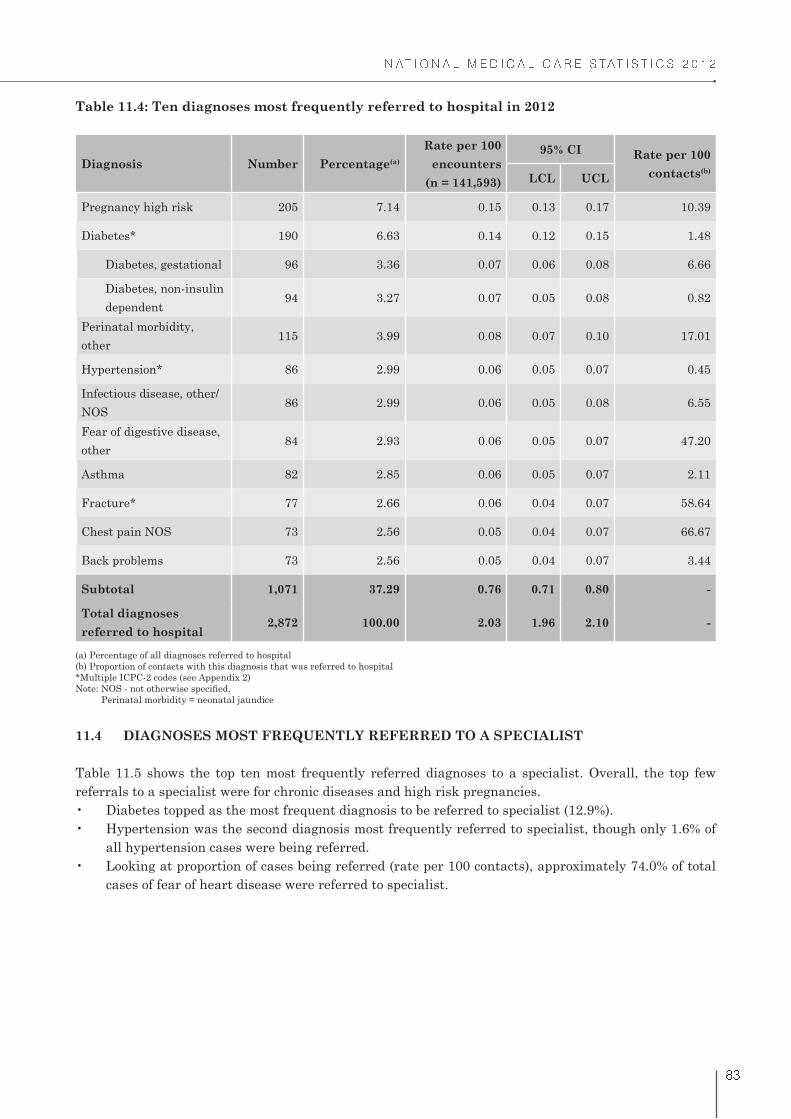
� � � � � � � � � � � � � � � � � � � � � � � � � � � �
! �
Table 11.4: Ten diagnoses most frequently referred to hospital in 2012
Diagnosis Number Percentage(a)
Rate per 100
encounters
(n = 141,593)
95% CI Rate per 100
contacts(b)
LCL UCL
Pregnancy high risk 205 7.14 0.15 0.13 0.17 10.39
Diabetes* 190 6.63 0.14 0.12 0.15 1.48
Diabetes, gestational 96 3.36 0.07 0.06 0.08 6.66
Diabetes, non-insulin
dependent94 3.27 0.07 0.05 0.08 0.82
Perinatal morbidity,
other115 3.99 0.08 0.07 0.10 17.01
Hypertension* 86 2.99 0.06 0.05 0.07 0.45
Infectious disease, other/
NOS86 2.99 0.06 0.05 0.08 6.55
Fear of digestive disease,
other84 2.93 0.06 0.05 0.07 47.20
Asthma 82 2.85 0.06 0.05 0.07 2.11
Fracture* 77 2.66 0.06 0.04 0.07 58.64
Chest pain NOS 73 2.56 0.05 0.04 0.07 66.67
Back problems 73 2.56 0.05 0.04 0.07 3.44
Subtotal 1,071 37.29 0.76 0.71 0.80 -
Total diagnoses
referred to hospital2,872 100.00 2.03 1.96 2.10 -
(a) Percentage of all diagnoses referred to hospital
(b) Proportion of contacts with this diagnosis that was referred to hospital
*Multiple ICPC-2 codes (see Appendix 2)
Perinatal morbidity = neonatal jaundice
11.4 DIAGNOSES MOST FREQUENTLY REFERRED TO A SPECIALIST
Table 11.5 shows the top ten most frequently referred diagnoses to a specialist. Overall, the top few
referrals to a specialist were for chronic diseases and high risk pregnancies.
all hypertension cases were being referred.
cases of fear of heart disease were referred to specialist.

� � � � � � � � � � � � � � � � � � � � � � � � � � � �
! #
Table 11.5: Ten diagnoses most frequently referred to specialist in 2012
Diagnosis Number Percentage(a)
Rate per 100
encounters
(n = 141,593)
95% CIRate per 100
contacts(b)LCL UCL
Diabetes - all* 391 12.94 0.28 0.25 0.30 3.02
Diabetes, non-insulin
dependent277 9.17 0.20 0.17 0.22 2.42
Diabetes, gestational 108 3.58 0.08 0.06 0.09 7.46
Diabetes, insulin
dependent6 0.19 0.01 0.00 0.01 10.83
Hypertension* 302 10.01 0.22 0.19 0.24 1.60
Pregnancy high risk 204 6.74 0.15 0.13 0.16 10.32
Arthritis - all* 181 5.99 0.13 0.11 0.15 11.11
Back problems 129 4.27 0.09 0.08 0.11 5.39
Lipid disorder 121 3.99 0.09 0.07 0.10 1.03
Upper respiratory infection,
acute75 2.48 0.05 0.04 0.07 0.23
Disease/condition of 73 2.43 0.05 0.04 0.07 5.32
Kidney disease 70 2.32 0.05 0.04 0.06 28.26
Fear of heart disease 66 2.19 0.05 0.04 0.06 73.97
Subtotal 1,612 53.37 1.14 1.08 1.20 -
Total diagnoses referred
to specialist3,020 100.00 2.13 2.06 2.21 -
(a) Percentage of all diagnoses referred to specialist
(b) Proportion of contacts with this diagnosis that was referred to specialist
*Multiple ICPC-2 codes (see Appendix 2)
Decision for referrals are dependent on patient’s factors which includes age, patient’s health status,
previous experiences as well as the doctor’s such as doctors’ practice styles.1,2
contact of care, judicious referrals to the appropriate point of care by the primary care providers are
important.3 This is because referrals ultimately will have a huge impact on the healthcare resources,
quality of care as well as the access to health system.1
REFERENCES:
1. Bertakis KD, Callahan EJ, Azari R, Robbins JA. Predictors of patient referrals by primary care
residents to specialty care clinics. Fam Med. 2001; 33(3): 203-9
2. Kinchen KS, Cooper LA, Levine D, Wang NY, Powe NR. Referral of patients to specialists: factors
affecting choice of specialist by primary care physicians. Ann Fam Med. 2004; 2(3):245-252.
3. Rushton J, Bruckman D, Kelleher K. Primary care referral of children with psychosocial problems.
Arch Paediatr Adolesc Med. 2002; 156(6):592-8.

Appendix
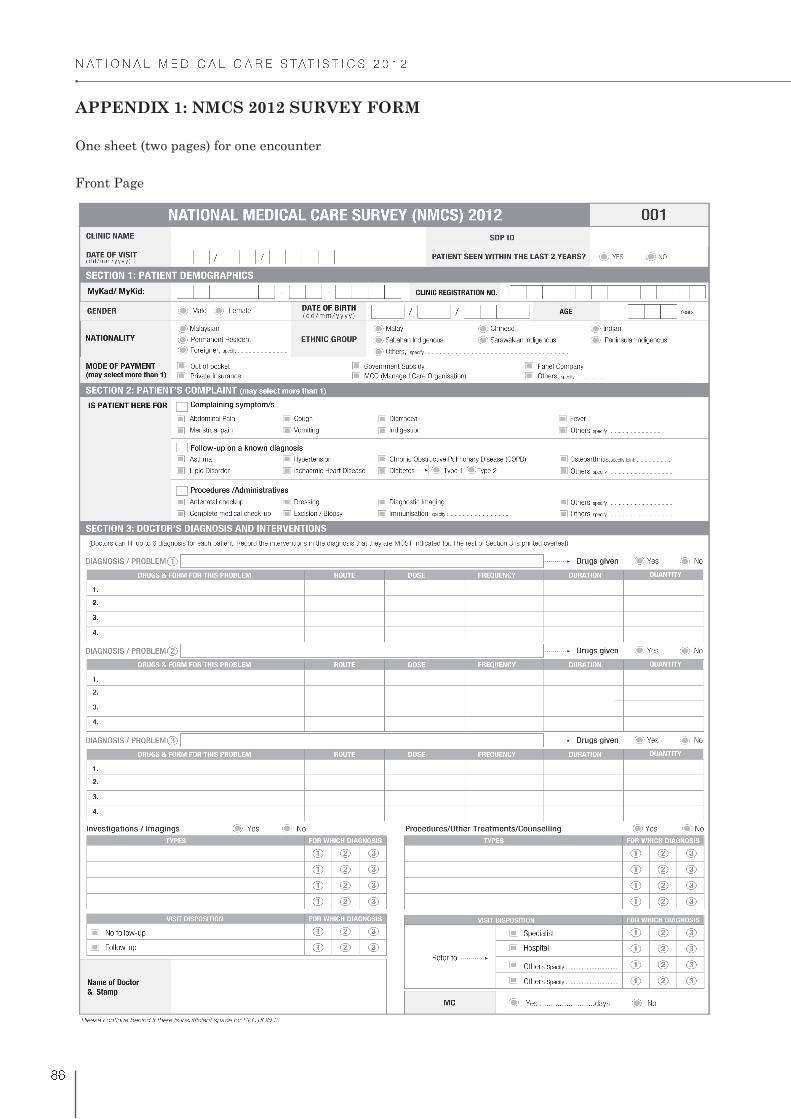
� � � � � � � � � � � � � � � � � � � � � � � � � � � �
! �
APPENDIX 1: NMCS 2012 SURVEY FORM
One sheet (two pages) for one encounter
Front Page
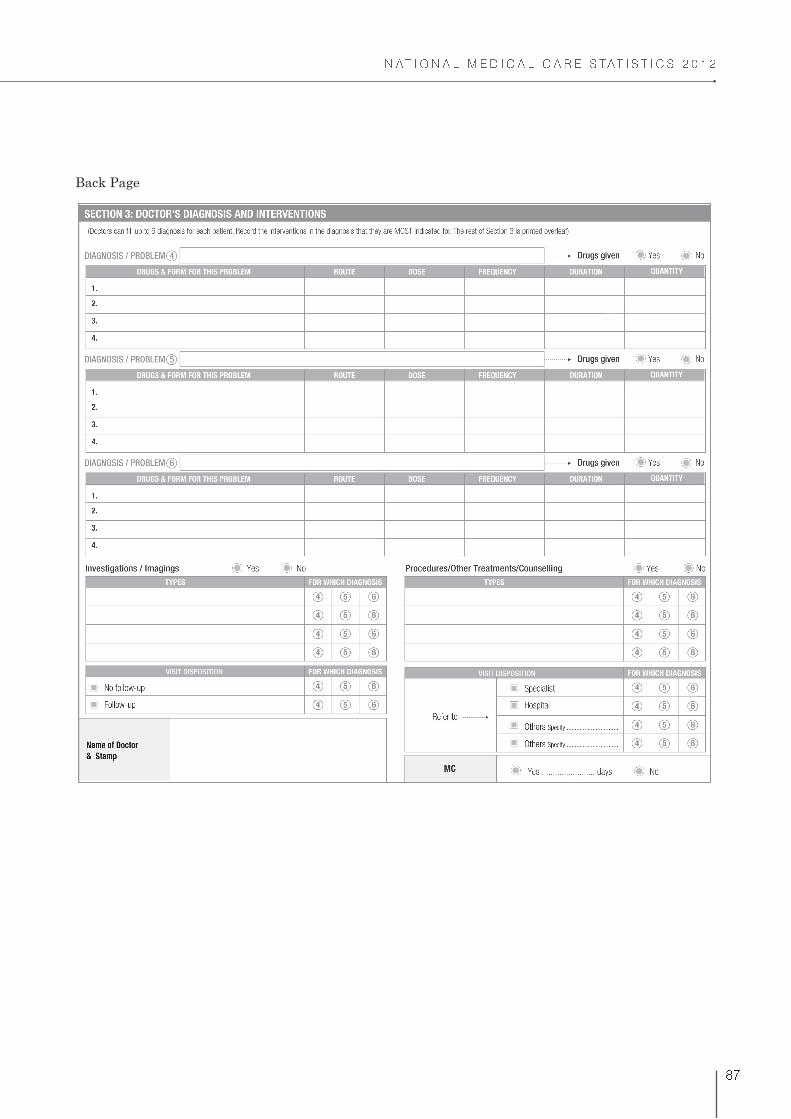
� � � � � � � � � � � � � � � � � � � � � � � � � � � �
!
Back Page
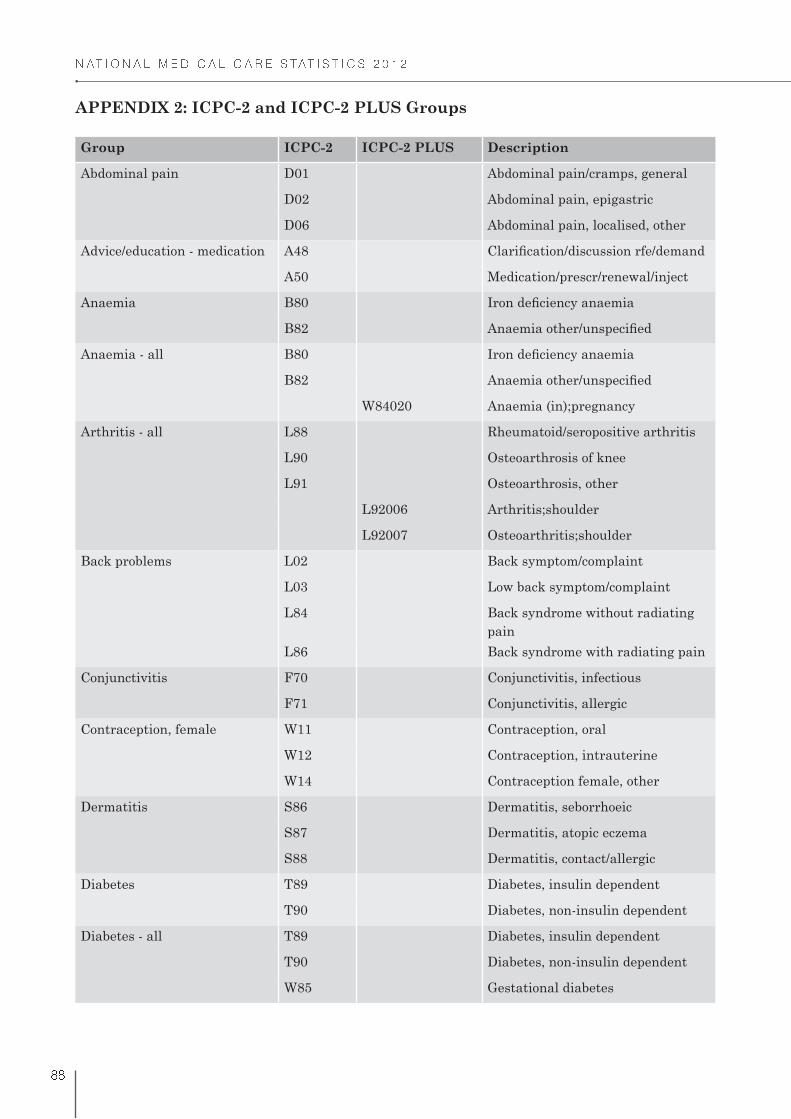
� � � � � � � � � � � � � � � � � � � � � � � � � � � �
! !
APPENDIX 2: ICPC-2 and ICPC-2 PLUS Groups
Group ICPC-2 ICPC-2 PLUS Description
Abdominal pain D01 Abdominal pain/cramps, general
D02 Abdominal pain, epigastric
D06 Abdominal pain, localised, other
Advice/education - medication A48
A50 Medication/prescr/renewal/inject
Anaemia B80
B82
Anaemia - all B80
B82
W84020 Anaemia (in);pregnancy
Arthritis - all L88 Rheumatoid/seropositive arthritis
L90 Osteoarthrosis of knee
L91 Osteoarthrosis, other
L92006 Arthritis;shoulder
L92007 Osteoarthritis;shoulder
Back problems L02 Back symptom/complaint
L03 Low back symptom/complaint
L84 Back syndrome without radiating
pain
L86 Back syndrome with radiating pain
Conjunctivitis F70 Conjunctivitis, infectious
F71 Conjunctivitis, allergic
Contraception, female W11 Contraception, oral
W12 Contraception, intrauterine
W14 Contraception female, other
Dermatitis S86 Dermatitis, seborrhoeic
S87 Dermatitis, atopic eczema
S88 Dermatitis, contact/allergic
Diabetes T89 Diabetes, insulin dependent
T90 Diabetes, non-insulin dependent
Diabetes - all T89 Diabetes, insulin dependent
T90 Diabetes, non-insulin dependent
W85 Gestational diabetes

� � � � � � � � � � � � � � � � � � � � � � � � � � � �
! %
Group ICPC-2 ICPC-2 PLUS Description
Fracture L72 Fracture: radius/ulna
L73
L74 Fracture: hand/foot bone
L75 Fracture: femur
L76 Fracture: other
Gastrointestinal infection D70 Gastrointestinal infection
D73 Gastroenteritis, presumed infection
Hernia D89 Inguinal hernia
D91 Abdominal hernia, other
Hypertension K86 Hypertension, uncomplicated
K87 Hypertension, complicated
Hypertension - all K86 Hypertension, uncomplicated
K87 Hypertension, complicated
W81003 Hypertension;in pregnancy
Immunisation/vaccination - all D44 Preventive immunisations/
medications digestive
N44 Preventive immunisations/
medications neurological
R44 Preventive immunisations/
medications respiratory
A44021 Immunisation;MMR
A44043 Immunisation
A44052 Immunisation;HPV
Immunisation/vaccination -
digestive
D44 Preventive immunisations/
medications digestive
Immunisation/vaccination
NOS
A44021 Immunisation;MMR
A44043 Immunisation
A44052 Immunisation;HPV
Ischaemic heart disease K74 Ischaemic heart disease with
angina
K76 Ischaemic heart disease without
angina
Lump/swelling S04 Lump/swelling, localised
S05 Lumps/swellings, generalised
Lymphadenitis B70 Lymphadenitis, acute
B71
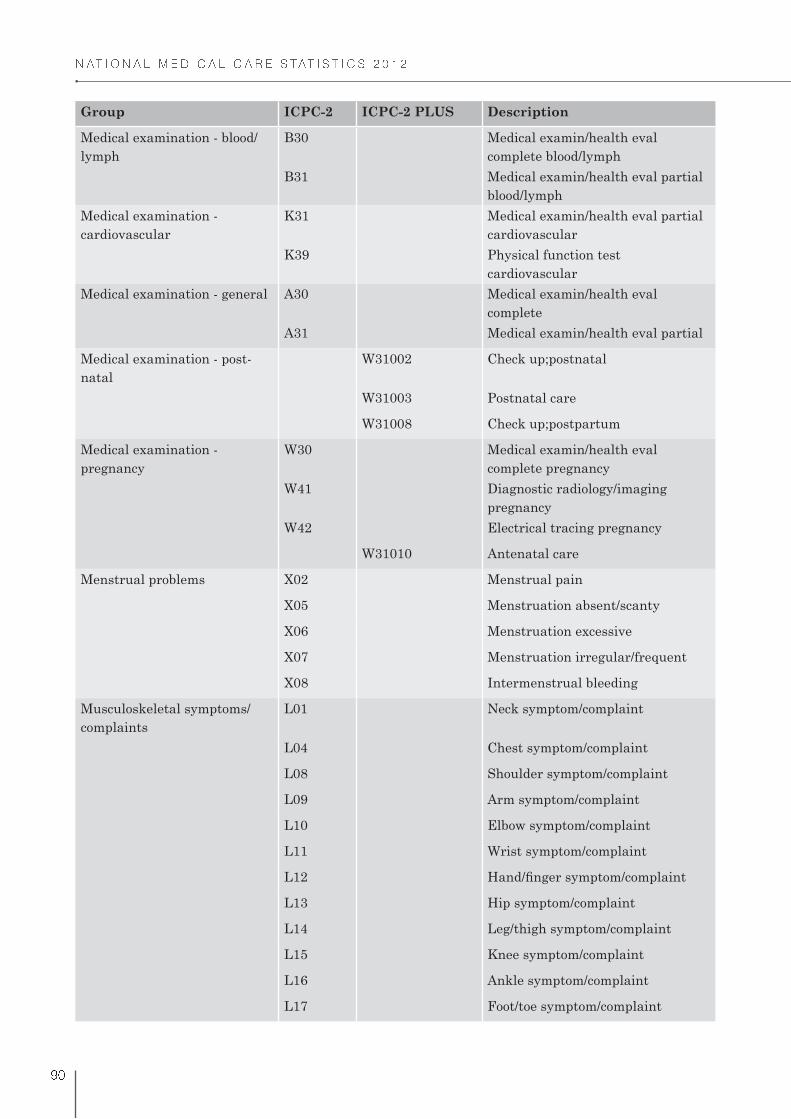
� � � � � � � � � � � � � � � � � � � � � � � � � � � �
% "
Group ICPC-2 ICPC-2 PLUS Description
Medical examination - blood/
lymph
B30 Medical examin/health eval
complete blood/lymph
B31 Medical examin/health eval partial
blood/lymph
Medical examination -
cardiovascular
K31 Medical examin/health eval partial
cardiovascular
K39 Physical function test
cardiovascular
Medical examination - general A30 Medical examin/health eval
complete
A31 Medical examin/health eval partial
Medical examination - post-
natal
W31002 Check up;postnatal
W31003 Postnatal care
W31008 Check up;postpartum
Medical examination -
pregnancy
W30 Medical examin/health eval
complete pregnancy
W41 Diagnostic radiology/imaging
pregnancy
W42 Electrical tracing pregnancy
W31010 Antenatal care
Menstrual problems X02 Menstrual pain
X05 Menstruation absent/scanty
X06 Menstruation excessive
X07 Menstruation irregular/frequent
X08 Intermenstrual bleeding
Musculoskeletal symptoms/
complaints
L01 Neck symptom/complaint
L04 Chest symptom/complaint
L08 Shoulder symptom/complaint
L09 Arm symptom/complaint
L10 Elbow symptom/complaint
L11 Wrist symptom/complaint
L12
L13 Hip symptom/complaint
L14 Leg/thigh symptom/complaint
L15 Knee symptom/complaint
L16 Ankle symptom/complaint
L17 Foot/toe symptom/complaint

� � � � � � � � � � � � � � � � � � � � � � � � � � � �
% �
Group ICPC-2 ICPC-2 PLUS Description
L18 Muscle pain
L19 Muscle symptom/complaint NOS
L20 Joint symptom/complaint NOS
L29 Musculoskeletal symptom/
complaint other
Obesity/overweight T82 Obesity
T83 Overweight
Osteoarthritis L90001 Osteoarthritis;knee
L91003 Osteoarthritis
L91015 Osteoarthritis;wrist
L92007 Osteoarthritis;shoulder
Pregnancy W01 Question of pregnancy
W78 Pregnancy
Preventive medication A44051 Medication;prevent
K44003 Medication;prevent;stroke
Rash S06 Rash localised
S07 Rash generalised
S89 Diaper rash
S92 Sweat gland disease
Skin infection S11 Skin infection, post-traumatic
S76 Skin infection, other
Skin symptom/complaint S21 Skin texture symptom/complaint
S29 Skin symptom/complaint, other
Sprain/strain L77 Sprain/strain of ankle
L78 Sprain/strain of knee
L79 Sprain/strain of joint NOS
Tonsillitis R76 Tonsillitis, acute
R90 Hypertrophy tonsils/adenoids
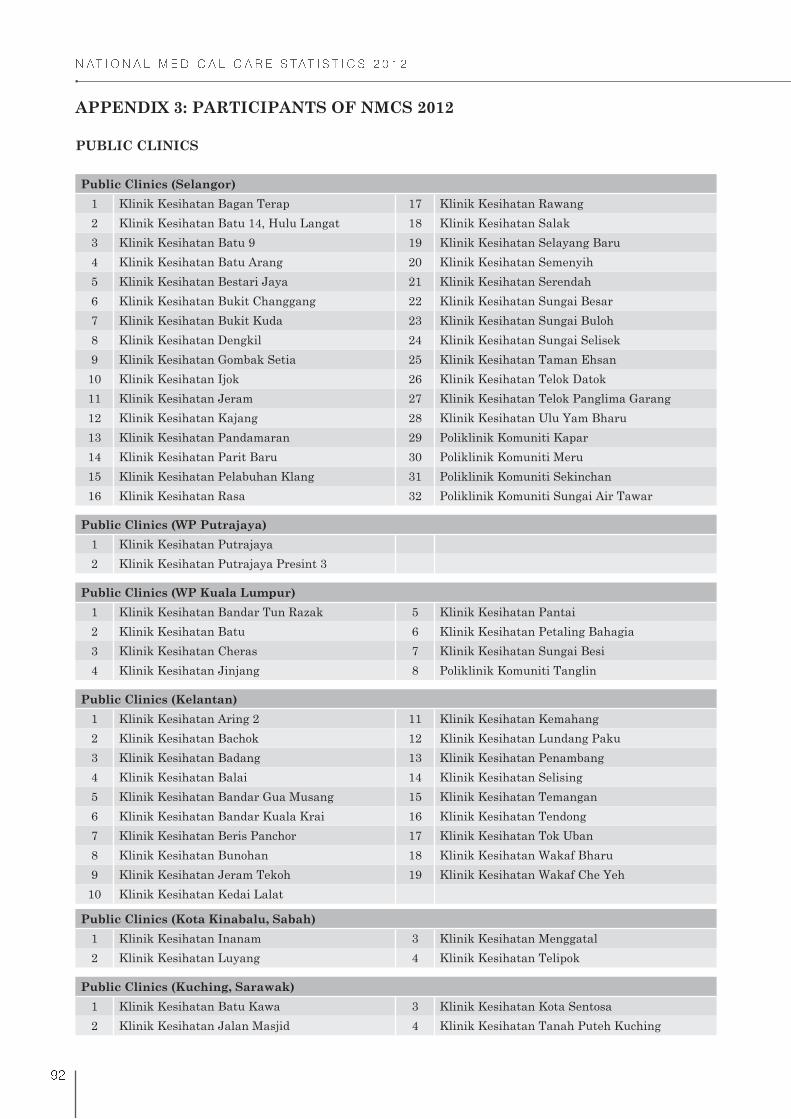
� � � � � � � � � � � � � � � � � � � � � � � � � � � �
% �
APPENDIX 3: PARTICIPANTS OF NMCS 2012
PUBLIC CLINICS
Public Clinics (Selangor)
1 Klinik Kesihatan Bagan Terap 17 Klinik Kesihatan Rawang
2 Klinik Kesihatan Batu 14, Hulu Langat 18 Klinik Kesihatan Salak
3 Klinik Kesihatan Batu 9 19 Klinik Kesihatan Selayang Baru
4 Klinik Kesihatan Batu Arang 20 Klinik Kesihatan Semenyih
5 Klinik Kesihatan Bestari Jaya 21 Klinik Kesihatan Serendah
6 Klinik Kesihatan Bukit Changgang 22 Klinik Kesihatan Sungai Besar
7 Klinik Kesihatan Bukit Kuda 23 Klinik Kesihatan Sungai Buloh
8 Klinik Kesihatan Dengkil 24 Klinik Kesihatan Sungai Selisek
9 Klinik Kesihatan Gombak Setia 25 Klinik Kesihatan Taman Ehsan
10 Klinik Kesihatan Ijok 26 Klinik Kesihatan Telok Datok
11 Klinik Kesihatan Jeram 27 Klinik Kesihatan Telok Panglima Garang
12 Klinik Kesihatan Kajang 28 Klinik Kesihatan Ulu Yam Bharu
13 Klinik Kesihatan Pandamaran 29 Poliklinik Komuniti Kapar
14 Klinik Kesihatan Parit Baru 30 Poliklinik Komuniti Meru
15 Klinik Kesihatan Pelabuhan Klang 31 Poliklinik Komuniti Sekinchan
16 Klinik Kesihatan Rasa 32 Poliklinik Komuniti Sungai Air Tawar
Public Clinics (WP Putrajaya)
1 Klinik Kesihatan Putrajaya
2 Klinik Kesihatan Putrajaya Presint 3
Public Clinics (WP Kuala Lumpur)
1 Klinik Kesihatan Bandar Tun Razak 5 Klinik Kesihatan Pantai
2 Klinik Kesihatan Batu 6 Klinik Kesihatan Petaling Bahagia
3 Klinik Kesihatan Cheras 7 Klinik Kesihatan Sungai Besi
4 Klinik Kesihatan Jinjang 8 Poliklinik Komuniti Tanglin
Public Clinics (Kelantan)
1 Klinik Kesihatan Aring 2 11 Klinik Kesihatan Kemahang
2 Klinik Kesihatan Bachok 12 Klinik Kesihatan Lundang Paku
3 Klinik Kesihatan Badang 13 Klinik Kesihatan Penambang
4 Klinik Kesihatan Balai 14 Klinik Kesihatan Selising
5 Klinik Kesihatan Bandar Gua Musang 15 Klinik Kesihatan Temangan
6 Klinik Kesihatan Bandar Kuala Krai 16 Klinik Kesihatan Tendong
7 Klinik Kesihatan Beris Panchor 17 Klinik Kesihatan Tok Uban
8 Klinik Kesihatan Bunohan 18 Klinik Kesihatan Wakaf Bharu
9 Klinik Kesihatan Jeram Tekoh 19 Klinik Kesihatan Wakaf Che Yeh
10 Klinik Kesihatan Kedai Lalat
Public Clinics (Kota Kinabalu, Sabah)
1 Klinik Kesihatan Inanam 3 Klinik Kesihatan Menggatal
2 Klinik Kesihatan Luyang 4 Klinik Kesihatan Telipok
Public Clinics (Kuching, Sarawak)
1 Klinik Kesihatan Batu Kawa 3 Klinik Kesihatan Kota Sentosa
2 Klinik Kesihatan Jalan Masjid 4 Klinik Kesihatan Tanah Puteh Kuching

� � � � � � � � � � � � � � � � � � � � � � � � � � � �
% �
PRIVATE CLINICS
Private Clinics (Selangor)
1 Drs Young Newton & Rakan-Rakan, Petaling
Jaya
28 Klinik Dr. Fauziah
2 Kelinik Lim, Jln Berangan 29 Klinik Dr. I. Chin
3 Kelinik Mohan, Jln Kg Jawa 30 Klinik Dr. Suhaida
4 Klinik & Surgeri Bukit Rimau 31 Klinik Fadzilyana
5 Klinik & Surgeri Chuah 32 Klinik Famili Bandar Puteri, Puchong
6 Klinik & Surgeri Sidhu 33 Klinik Famili Dr Wan Kamariah Sdn. Bhd, Batu
Caves
7 Klinik Abd Hamid, Sekinchan 34 Klinik Famili Shah Alam, Kota Kemuning
8 Klinik Alam Medic, Taman Tasik Prima 35 Klinik Famili Shah Alam, Seksyen 27
9 Klinik Alam Medic (Kota Kemuning) 36
10 Klinik Alam Medic, Taman Sri Muda 37 Klinik Famili TTDI
11 Klinik Alam Medic, Tmn Puchong Perdana 38 Klinik Faridah & Dr Rashid, Shah Alam
12 Klinik Alam Megah, Shah Alam 39 Klinik Fatimah
13 Klinik Amardev & Surgery 40 Klinik Fauziah Dan Rakan-Rakan
14 Klinik Anis, Shah Alam 41 Klinik Guan Sdn. Bhd
15 Klinik Antarabangsa 42 Klinik Hamzah, Klang
16 Klinik Aspalela, Pinggiran Subang 43 Klinik Hanita, Kajang
17 Klinik Azlina & Sharifah 44 Klinik Hasniah Elani, Batu Caves
18 Klinik Bahari 45 Klinik Hayati, Batu Caves
19 Klinik Bandaran, Subang Jaya 46 Klinik Hooi, Cheras
20 Klinik Bandaran, Kota Kemuning 47 Klinik Idzham (Tmn Wangsa Ukay)
21 Klinik Bandaran USJ 48 Klinik Johari Dan Anita
22 Klinik C J Kwek, Subang Jaya 49 Klinik Kathy Am
23 Klinik Chieng, Klang 50 Klinik Keluarga Jugra, Banting
24 Klinik Chin, Puchong 51 Klinik Keluarga Lee, Subang Jaya
25 Klinik Dan Surgeri Jaspal, Klang 52 Klinik Kumpulan Medic
26 Klinik Dr Shamsuddin, Sg Buloh 53 Klinik Mediviron (Formerly Kelinik Bina)
27 Klinik Dr Suraya
Private Clinics (WP Kuala Lumpur)
1 Drs Young Newton & Rakan-Rakan, Damansara
Heights
16 Klinik Leela Ratos & Rakan-Rakan
2 Drs. Young, Newton Dan Rakan-Rakan, Capital
Square
17 Klinik Medi Al Hilmi
3 Klinik Ahmad-Shan Dan Surgeri 18 Klinik Medic Bestari
4 Klinik Ashvini 19 Klinik Mediviron, Bukit Jalil
5 Klinik Catterall, Khoo And Raja Malek 20 Klinik Rakyat
6 Klinik Chin Chee Yeong 21 Klinik Rapha Goodwill
7 Klinik Chong & Rakan-Rakan 22 Klinik Reddy Setapak
8 Klinik Dan Surgeri Sri Damansara 23 Klinik Senan
9 Klinik Dr Shashikala Sdn Bhd 24 Klinik Sharani
10 Klinik Dr. Rahim Omar & Rakan-Rakan 25 Klinik Tan & Mano
11 Klinik Famili Seri Petaling 26 Klinik Yong
12 Klinik Genting Unimed 27 Kumpulan Medic
13 Klinik Harun 28 Poliklinik & Surgeri Kong
14 Klinik K.H.Ong 29 Poliklinik Lourdes
15 Klinik Kee 30 Poliklinik Meranti

� � � � � � � � � � � � � � � � � � � � � � � � � � � �
% #
Private Clinics (Kelantan)
1 Klinik A Wahab 13 Klinik Mardhiah
2 Klinik Chong 14 Klinik Murni
3 Klinik Dr Che Ku 15 Klinik Nik
4 Klinik Dr. Wan Abdul Kadir 16 Klinik Pancho
5 Klinik Dr. Yasiman Perdana 17 Klinik Penawar
6 Klinik Dr. Roslan 18 Klinik Perdana Cawangan Islah
7 Klinik Dr. Wan 19 Klinik Perdana Pengkalan Chepa
8 Klinik Keluarga 20 Klinik Raju
9 Klinik Kok Lanas 21
10 Klinik Lee 22 Klinik Sayyida Sdn. Bhd.
11 Klinik Lua 23 Klinik Shafee
12 Klinik Mahmood (Cawangan Wakaf Bharu) 24 Klinik Wakaf Siku 3
Private Clinics (Kota Kinabalu, Sabah)
1 Klinik & Surgeri Dr C. F. Pang Sdn. Bhd 6 Klinik Malaysia (Cawangan Centre Point)
2 Klinik & Surgeri Dr Harvinder 7 Klinik Sihat
3 Klinik & Surgeri Lau & Choong 8 Permai Polyclinics Lintas Plaza
4 Klinik Aslam 9 Poliklinik Rakyat - Cawangan Kota Kinabalu
5 Klinik Dr. Baharin
Private Clinics (Kuching, Sarawak)
1 Klinik Bina 3 Klinik Sharifah Ihsan
2 Klinik Cyril Songan 4 Klinik Waqaf An-Nur Samariang

� � � � � � � � � � � � � � � � � � � � � � � � � � � �
% $
APPENDIX 4: LIST OF DEFINITIONS
VARIABLE DEFINITION
Encounter A professional interaction between a patient and healthcare provider(s) for the
purpose of providing healthcare service(s) or assessing the health status of a
patient.
Morbidity Departure from a state of physical or psychological well-being resulting from
disease, illness, injury or sickness.
Provider A person to whom patient has access when contacting the healthcare system and
helps in identifying or preventing or treating illness or disability.
Government
subsidy
Funding for treatment is supported by government agencies such as Ministry
of Health. These agencies include a variety of permanent or semi-permanent
organisation in the machinery of government that is responsible for the oversight
Out of pocket
Third party payers Any organisation other than the patient or healthcare provider involved in the
Panel Company: Private employer or corporations. These include all resident
resident institutional units. They are simply characterised by the fact that
they are not subject to control by the government or from abroad.
Private insurance:
insurance enterprises or other institutional units administering private
funded social insurance schemes.
Managed Care Organisation (MCO): Any organisation or body with whom
a private healthcare facility or service makes a contract or has an arrangement
system through one or a combination of mechanisms. It combines functions
of health insurance, delivery of care and administration (e.g. Integrated
Healthcare Management (IHM)).
Reasons for
encounter (RFEs)
The subjective reason(s) given by the patient for seeking health care. These can
be a symptom, complaint, follow-up on a known problem, or request for a service.
Diagnosis A statement that describes the reason for a disease, illness, or problem presented
by a patient through evaluation of patient history, examination and review of
laboratory data.
Investigation A test or examination done to establish a diagnosis (e.g. full blood count, chest
X-ray).
Procedures A course of action done to establish diagnosis or for treatment.
Advice/counselling The act of giving advice to patients as needed. This refers to health education,
advice or counselling delivered by healthcare providers during encounter.
Follow-up The act of maintaining periodic contact with patient for continuous care.
Referral The process of directing patient to a different place or person for further
management.

