national market potential of anaerobic digester products for the dairy industry (4-01-13)
TRANSCRIPT

[Insert Title]
Prepared for:
National Market Value of Anaerobic Digester Products
February 2013 Informa Economics Phone: 901.766.4669 www.informaecon.com

National Market Value of Anaerobic Digester Products
i
Table of Contents
I. EXECUTIVE SUMMARY ................................................................................................................................................... 9
A. INTRODUCTION ................................................................................................................................................................. 9
B. MONETIZING MANURE ..................................................................................................................................................... 10
C. MONETIZING ORGANIC SUBSTRATES ................................................................................................................................ 12
D. POTENTIAL VARIATIONS IN PRICES USED FOR 3 SCENARIOS .............................................................................................. 13
E. ECONOMIC RETURNS ON A NATIONAL INVESTMENT IN ANAEROBIC DIGESTERS .................................................................... 18
F. SUSTAINABILITY BENEFITS OF ANAEROBIC DIGESTERS ...................................................................................................... 20
G. NUTRIENT MANAGEMENT BENEFITS FROM SEQUESTRATION TECHNOLOGIES ....................................................................... 21
II. ANAEROBIC DIGESTION AND PRODUCTION OF BIOGAS ....................................................................................... 23
A. ANAEROBIC DIGESTER TYPES ......................................................................................................................................... 23
B. SCENARIOS CONSIDERED ............................................................................................................................................... 27
C. NUMBER OF COWS ......................................................................................................................................................... 28
D. MANURE PRODUCTION ................................................................................................................................................... 30
E. ORGANIC SUBSTRATES ................................................................................................................................................... 31
F. ORGANIC SUBSTRATE AVAILABILITY ................................................................................................................................. 33
G. PRODUCTION OF BIOGAS AND METHANE .......................................................................................................................... 39
III. VALUE OF ANAEROBIC DIGESTER ENERGY PRODUCTS ...................................................................................... 41
A. ELECTRICITY PRODUCTION .............................................................................................................................................. 41
B. PIPELINE BIOMETHANE PRODUCTION ............................................................................................................................... 43
C. COMPRESSED NATURAL GAS PRODUCTION ...................................................................................................................... 44
IV. VALUATION OF ECO-SYSTEM MARKET AND NUTRIENT PRODUCTS OF DIGESTERS ....................................... 47
A. TIPPING FEES ................................................................................................................................................................ 47
B. RECOVERED NITROGEN (N), PHOSPHORUS (P), AND POTASSIUM (K) ................................................................................. 50
C. VALUE OF NUTRIENT-ENRICHED FIBER AS A CO-PRODUCT OF ANAEROBIC DIGESTION ......................................................... 52
1. Introduction ............................................................................................................................................................... 52
2. Overview .................................................................................................................................................................. 52 (a) Animal Bedding ................................................................................................................................................................. 53

National Market Value of Anaerobic Digester Products
ii
(b) Field Application ............................................................................................................................................................... 53 (c) Peat Moss Replacement ................................................................................................................................................... 53
3. Fiber Values ............................................................................................................................................................. 53
4. Market Size .............................................................................................................................................................. 56
D. CARBON CREDITS, RENEWABLE ENERGY CREDITS, AND RENEWABLE IDENTIFICATION NUMBERS ......................................... 57
1. Carbon Credits ......................................................................................................................................................... 57
2. Amount of Carbon-Equivalent Offsets ...................................................................................................................... 58
3. Prices of Carbon-Equivalent Offsets ......................................................................................................................... 58
E. RENEWABLE ENERGY CREDITS (RECS) ........................................................................................................................... 59
F. RENEWABLE IDENTIFICATION NUMBERS (RINS) AND LOW CARBON FUEL STANDARD CREDITS .............................................. 61
1. Renewable Identification Numbers ........................................................................................................................... 61
2. Credits Generated under California’s Low Carbon Fuel Standard (LCFS) ............................................................... 64
3. Total Value of CNG Including RINs and LCFS Credits ............................................................................................. 66
G. TOTAL VALUATION OF DIGESTER PRODUCTS .................................................................................................................... 66
V. NET PRESENT VALUE OF A NATIONAL INVESTMENT IN ANAEROBIC DIGESTERS IN THE DAIRY INDUSTRY 69
VI. ENVIRONMENTAL SUSTAINABILITY ......................................................................................................................... 72
VII. EVALUATING THE ENVIRONMENTAL NUTRIENT MANAGEMENT BENEFITS OF SEQUESTRATION TECHNOLOGIES IN ANAEROBIC DIGESTER SYSTEMS ............................................................................................... 74
A. BACKGROUND ................................................................................................................................................................ 74
B. APPROACH .................................................................................................................................................................... 76
C. SUMMARY OF CONCLUSIONS ........................................................................................................................................... 78
1. A. Baseline Nutrient Management Scenario with Lagoon-Only Waste Management ............................................... 80
2. Supplemental Fertilizer to Make Up for Full Fertilizer Needs of Crops that Received Manure Effluent .................... 83
3. Lagoon Plus Anaerobic Digester .............................................................................................................................. 85
4. Digester Plus Nutrient Separation Technology ......................................................................................................... 89
5. Nutrient Products Caveats ........................................................................................................................................ 90
APPENDIX A: RESULTS BY STATE AND SCENARIO .................................................................................................... 92
APPENDIX B: QUANTIS REPORT- PRELIMINARY ASSESSMENT OF THE ENVIRONMENTAL ADVANTAGES OF DISPOSAL OF FOOD WASTE THROUGH CO-FERMENTATION WITH COW MANURE IN THE UNITED STATES ... 103
SUMMARY OF FINDINGS .................................................................................................................................................... 103

National Market Value of Anaerobic Digester Products
iii
BACKGROUND AND SUMMARY OF METHODOLOGY ............................................................................................................... 103 FINDINGS ......................................................................................................................................................................... 106
QUANTIS REFERENCES ..................................................................................................................................................... 110 QUANTIS ABBREVIATIONS AND ACRONYMS ......................................................................................................................... 112
APPENDIX B1: LIFE CYCLE ASSESSMENT (LCA) ................................................................................................................. 113 APPENDIX B2: DESCRIPTION OF IMPACT ASSESSMENT INDICATORS...................................................................................... 114
Description of Indicators: ............................................................................................................................................ 114 Resources Indicator .............................................................................................................................................................. 114 Ecosystem Quality ................................................................................................................................................................ 115 Human Health Indicators ...................................................................................................................................................... 116 Climate Change .................................................................................................................................................................... 117
APPENDIX B3: FURTHER EXPLANATION OF IMPACT CATEGORIES IN TABLE 2 ......................................................................... 118

National Market Value of Anaerobic Digester Products
iv
List of Exhibits Exhibit 1: Value of Production for 2,647 Dairy Anaerobic Digesters Producing Electricity .................................................. 14 Exhibit 2: Potential Production and Value of Products and Co-Products for 2,647 Dairy Anaerobic Digesters ................... 15
Exhibit 3: Fiber, Nutrient, and Eco-system Markets Potentially Add Hundreds to the Value of Each Dairy Cow ................. 17 Exhibit 4: Energy Production Alone Provides Insufficient Returns for Digesters ................................................................. 19
Exhibit 5: Diversion of Organic Waste from Landfills to Dairy-based Digesters Would Remove the Carbon-Equivalent Emissions of over 3.2 Million Automobiles .......................................................................................................................... 21 Exhibit 6: Acres Needed to Dispose of Effluent and Separated Nutrients ........................................................................... 22
Exhibit 7: Suitable Digester Technology Matrix .................................................................................................................. 24 Exhibit 8: Products Produced by Each Anaerobic Digester Type ........................................................................................ 25
Exhibit 9: Shares of Digesters by State ............................................................................................................................... 26 Exhibit 10: Profiles of Top Ten States for Anaerobic Digestion of Dairy Waste ................................................................... 29 Exhibit 11: Number of Cows at Feasible Dairies by 2020 (Thousand Cows) ...................................................................... 30
Exhibit 12: Manure Production at Feasible Dairies .............................................................................................................. 31 Exhibit 13: Biogas Yields from Different Biomass ............................................................................................................... 32
Exhibit 14: Per Capita Retail Losses by Product Group ...................................................................................................... 36 Exhibit 15: Organic Substrate Trends.................................................................................................................................. 37
Exhibit 16: Commercial/Processing/Manufacturing Organic Substrate by State ................................................................. 38 Exhibit 17: Waste as a Share of Manure Production by State, 2010 & 2020F .................................................................... 39
Exhibit 18: Production of Primary Products and Associated Co-Products ........................................................................... 41 Exhibit 19: Electricity Price Assumptions by State .............................................................................................................. 42 Exhibit 20: Potential Annual Value of Fossil Natural Gas Displaced by Biomethane Used in CNG .................................... 46
Exhibit 21: Municipal Solid Waste Landfill Tipping Fees ..................................................................................................... 48 Exhibit 22: Average Recent Landfill Tipping Fees for Selected Dairy States ...................................................................... 49
Exhibit 23: Bedding Practices for Select States ................................................................................................................. 52
Exhibit 24: Average Dairy Bedding Costs by State ............................................................................................................ 54
Exhibit 25: U.S. Peat Production and Price Statistics ......................................................................................................... 55 Exhibit 26: Fiber Revenues by State .................................................................................................................................. 56 Exhibit 27: Market Size of the U.S. Digested Fiber Industry ............................................................................................... 57
Exhibit 28: Annual Renewable Energy Credit (REC) Values by State by Scenario ............................................................. 60 Exhibit 29: Full Annual Value of RINs Generated Through Production of CNG from Dairy Biomethane ............................. 64
National Market Value of Anaerobic Digester Products
v
Exhibit 30: Potential Production and Value of Products and Co-Products for 2,647 Dairy Anaerobic Digesters, Per Cow per Day ................................................................................................................................................................................ 68
Exhibit 31: Capital Expenses for Digester Systems on US Dairies ..................................................................................... 70 Exhibit 32: Operating Expenses for Digester Systems on US Dairies ................................................................................. 70
Exhibit 33: Net Present Value of Investment in 2,647 Digester Systems in US Dairies ...................................................... 71 Exhibit 34: Internal Rate of Return (IRR) ............................................................................................................................. 71 Exhibit 35: Nutrient Amounts (MT/year) In Feedstock and Effluent Per 1,000 Cows .......................................................... 75
Exhibit 36: Assumed Nutrient Usage per Acre Based on Top Three Crops per State ......................................................... 77
Exhibit 37: Acres Needed to Dispose of Effluent and Separated Nutrients ......................................................................... 78
Exhibit 38: Nutrients Required in Management Plans ......................................................................................................... 79 Exhibit 39: Supplemental Nutrient Needs for Crops in Nutrient Management Plans ........................................................... 80
Exhibit 40: Baseline Scenario, Lagoon Manure Effluent Collection and Tanker/Pipeline Distribution to Crop Acres .......... 82 Exhibit 41: Per Acre Nutrient Applications from Undigested Manure Effluent Only ............................................................. 83 Exhibit 42: Estimated Nutrient Needs of Crops in Dairy States ........................................................................................... 84
Exhibit 43: Quantities and Estimated Costs of Purchasing Supplement Fertilizer ............................................................... 85 Exhibit 44: Lagoon Plus Digester Feedstock and Production Summary ............................................................................. 87
Exhibit 45: Supplemental Nutrients Required in Digesters without Nutrient Recovery ........................................................ 89 Exhibit 46: Nutrient Recovery Reduces Acres Required in Nutrient Management Planning ............................................... 90
Exhibit 47: Arizona Annual Volume of Production and Values ............................................................................................ 92 Exhibit 48: California Annual Volume of Production and Values ......................................................................................... 93 Exhibit 49: Colorado Annual Volume of Production and Values .......................................................................................... 94
Exhibit 50: Idaho Annual Volume of Production and Values ............................................................................................... 95
Exhibit 51: Michigan Annual Volume of Production and Values .......................................................................................... 96 Exhibit 52: New Mexico Annual Volume of Production and Values ..................................................................................... 97 Exhibit 53: New York Annual Volume of Production and Values ......................................................................................... 98
Exhibit 54: Texas Annual Volume of Production and Values ............................................................................................... 99 Exhibit 55: Washington Annual Volume of Production and Values ................................................................................... 100 Exhibit 56: Wisconsin Annual Volume of Production and Values ...................................................................................... 101 Exhibit 57: Other 40 States Annual Volume of Production and Values ............................................................................. 102

National Market Value of Anaerobic Digester Products
vi
Disclaimer This report was produced for the Innovation Center for U.S. Dairy. Informa Economics, Inc. (“Informa”) has used the best and most accurate information available to complete this study. Informa is not in the business of soliciting or recommending specific investments. The reader of this report should consider the market risks inherent in any financial investment opportunity. Furthermore, while Informa has extended its best professional efforts in completing this analysis, the liability of Informa to the extent permitted by law, is limited to the professional fees received in connection with this project.

National Market Value of Anaerobic Digester Products
vii
Acknowledgements Informa Economics thanks the Idaho National Laboratory (INL) and the Center for Advanced Energy Studies (CAES) for their valuable contributions to this report. Informa Economics also thanks Quantis USA for the special report they did on disposal of food waste, which is included in Appendix B.

National Market Value of Anaerobic Digester Products
viii
Acronyms BTU British Thermal Unit CH4 Methane CO2 Carbon Dioxide CNG Compressed Natural Gas DGE Diesel Gallon Equivalent EPA Environmental Protection Agency (U.S.) GHG Greenhouse Gas HRT Hydraulic Retention Time K Potassium kWh Kilowatt hour LCFS Low Carbon Fuel Standard MMBTU Million British Thermal Units MMT Million Metric Tonnes MT Metric Tonnes MTCO2e Metric Tonnes Carbon Dioxide equivalent MWh Megawatt hour N Nitrogen P Phosphorus REC Renewable Energy Certificate RFS2 Renewable Fuel Standard 2 RIN Renewable Identification Number USDA United States Department of Agriculture

National Market Value of Anaerobic Digester Products
9
I. EXECUTIVE SUMMARY
A. Introduction
The purpose of this research is to identify the production possibilities and market values of the various products of a mature anaerobic digester industry based on large US dairy farms. The AgSTAR project of the Environmental Protection Agency (EPA) analyzed the possibility of installing anaerobic digesters in confined animal (CAFO) dairy operations of 500 cows or larger, which, at the time of their analysis, amounted to 2,647 dairy operations nationwide. While the original AgSTAR report estimated the production possibilities of only electricity and included only covered lagoon digesters, the most basic and primitive type, this report updates the AgSTAR paper to include the production possibilities of mixed plug flow and complete mix digesters and analyzes a number of products in addition to electricity that can be produced and potentially marketed. Anaerobic digesters are a solution to a problem dairy farmers have always had to solve but has become more acute with the innovation of larger scale, confined animal feeding operations (CAFOs) developed in response to the growing food demands of the world’s larger and more prosperous middle class population – what to do with cow manure. Cow manure contains high levels of nitrogen, phosphorus, and potassium which can have a negative impact on water
resources if their disposal is not sufficiently disbursed over enough land to filter the contaminants and recycle their use as crop fertilizers. The disposal is costly, and compliance with water quality legislation in the Clean Water Acts is threatening the
viability of many dairy operations.
Anaerobic digesters may be a profitable, sustainable solution to both the environmental challenges of waste disposal as well as providing for renewable fertilizer nutrients and energy production.
There are several avenues for digesters co-products that may be, as or more, economically valuable than energy,
which is obtained from capturing the methane produced by digesters. Recent technological developments allow the harvesting of nitrogen and phosphorus nutrients from digested waste
material and may provide significantly higher economic benefits than gas or electrical production alone has been able to provide.

National Market Value of Anaerobic Digester Products
10
In addition, modern mixed plug flow and complete mix digester systems allow the use of organic substrates other than manure, principally commercial food waste substrates, as feedstock. This allows dairy-based digesters to convert waste that would create atmospheric greenhouse gas (GHG) contamination into marketable fertilizer and energy products.
Furthermore, the development of eco-system markets, such as nutrient or carbon credit trading systems, would provide another way for digesters to monetize the economic benefits of reduced nutrient and greenhouse gas contamination in a way that compensates dairy farmers for the work they can do in this area.
B. Monetizing Manure
Anaerobic digesters produce methane gas which may be burned to produce heat as well as electric energy, or it may be marketed through connections to pipelines. However, in addition to gas and electricity, other co-products can be produced with the more advanced digester technology now in use. Following is a list of the products and co-products that can conceivably be produced by 2,647 digesters if installed on large dairies throughout the US – a production possibilities frontier for digesters installed on large CAFO dairy operations in the U.S.1 Note that the costs associated with each of the products listed may vary substantially among products. Energy Products: Historically, anaerobic digesters produced energy, mostly for on-farm use, as a result of the
methane collected from the digestion process. The amount of energy available from dairy manure is naturally constrained, however, by the fact that dairy cows themselves have already digested and extracted much of the energy potential of the animal feed already consumed. However, modern digester systems can augment the energy production of cow manure with additional, undigested substrates mostly in the form of commercial food waste which is presently disposed of in landfills – the economic and environmentally costly alternative to anaerobic digesters. The following estimates are based on digester feedstock of cow manure plus estimates of feasibly available additional organic substrates used in dairy digester operations.
1 All volumes of production and values of production given are for Informa’s mid-valuation scenario (Scenario 2), which assumes the prices that
Informa expects are more likely than its low or high valuation scenarios.

National Market Value of Anaerobic Digester Products
11
Electricity: 11,701,222 megawatt hours (MWhs) per year, at an estimated current market value of $894 million. This can be sold to electrical utilities or it can used on farms to replace purchased electricity. For electricity sales, the contractual conditions for such arrangements can differ dramatically by state and utility.
Pipeline Biomethane: The equivalent energy production to that used in electricity production could instead be used to generate 101.4 million MMBTUs per year, at an estimated market value of $413 million. This gas could be sold to utilities or distributors, or used in farm operations offsetting purchased gas energy.
Compressed Natural Gas (CNG): 788 million diesel gallon equivalent CNG units at a current estimated market value of $733 million. CNG can be used as a transportation fuel to replace purchased diesel if vehicles have been modified to operate on CNG.
Fertilizer Nutrients: Nutrient stripping technologies currently under development allow for nitrogen and phosphorus to be separated into a storable or transportable form.2 The ability to store and transport nutrients also allows easier compliance with nutrient management regulations for water quality, and where nutrient trading programs may develop as an environmental policy implementation tool, it potentially could become an additional source of revenue for dairy operators. Nitrogen: 331,163 tons per year at a current market value of $467 million.
Phosphorus: 108,782 tons per year, at a current market value of $324.6 million.
Fiber, for bedding or for peat moss substitute: Mixed plug flow digesters produce fiber that is more usable than that
produced by other digester types, and analysis suggests up to 30 million cubic yards of fiber may be produced at a likely market value of $217 million if sold as a peat moss replacement and on farm bedding material.
Eco-system markets. One useful strategy for encouraging cooperation with government policies to reduce
environmental contamination is trading systems for nutrients and emissions. Additionally subsidies are provided to
2 There is presently not a feasible means of separating potassium which would stay within the fiber. Technology may be developed in the future, but the production of potassium in a usable, marketable form was excluded in this report, the value of potassium remaining in the fiber material that is marketed is as soil supplement.

National Market Value of Anaerobic Digester Products
12
encourage the development of sustainable energy alternatives. Digesters offer several possibilities to take advantage of such trading and subsidies systems.
Greenhouse gas (GHG) offset credits: Although only in California at the present time, the California GHG credit
markets allow for participation by entities outside of California. If all US dairies were potentially able to participate in GHG trading, 34.3 million metric tonnes of carbon dioxide equivalent offsets can be generated by 2,647 large digesters, which if valued at $10 per metric tonne amounts to $343 million.
Renewable Energy Credits (RECs): 11.7 million RECs, valued at $34.4 million. RECs are only available for electricity, thus increasing the value of electrical production produced by anaerobic digesters.
Renewable Identification Numbers (RINs): Produced only for units of methane gas marketed as CNG, a replacement for transportation fuel. It is estimated that up to 1.3 billion RINS per year may be produced by 2,647 digesters on dairy farms if there were convenient and economical connections to major gas pipelines or other means of cleaning, compressing, and distributing the gas. If CNG were produced with the energy from all 2,647 digesters, the RINs generated could have a value of $1.01 billion.
Low Carbon Fuel Standard (LCFS) credits are specific to California and are only produced if CNG is the primary
energy product produced. California-based digesters may produce up to 1.8 million LCFS credits valued at $42.6 million.
C. Monetizing Organic Substrates
Tipping fees refer to the payments made to landfills for dumping waste. If organic substrates are dumped in landfills versus anaerobic digesters, the result is higher GHG emissions and the potential for nutrient leakage contamination of water resources. Tipping fee revenue accrues to either the digester operation or to the dumping entity in the form of lower fees if there is competition for waste material. Tipping fees were estimated by state and applied to the amount of organic substrates potentially available for use as a feedstock in dairy digester operations. Tipping fee revenue valued at the market value for landfill dumping rates represents the economic value to all
beneficiaries of disposing of organic substrates in anaerobic digesters instead of landfills because either digester operations are compensated for substrates diverted from landfills, or dumping entities are compensated in the form of lower landfill costs.

National Market Value of Anaerobic Digester Products
13
An estimated 19.8 million tons of organic substrate could potentially be used in the 2,647 dairy-based digesters,
generating an additional $575 million in annual revenue from tipping fees, accruing to either the operator of the digester or in the form of reduced costs of landfill dumping.
D. Potential Variations in Prices Used for 3 Scenarios
With the range of products possibly produced from anaerobic digestion of dairy manure and organic substrates, there is also a range of prices achievable for the products. This led to the calculation of three possible scenarios for the value of the outputs of the 2,647 dairy waste digesters. These three scenarios are: Scenario 1: Low Valuation Scenario. The low valuation scenario (Scenario 1) assumes that the prices received for
electricity, RECs, recovered nitrogen, recovered phosphorus, GHG Offset Credits, and nutrient-enriched fiber are all at the low end of the range. It is also assumed that a smaller proportion of the digesters accepting organic waste receive tipping fees for that waste. This scenario provides a comparison for what the value of the products may be in the event that low prices occur across the spectrum of products produced from the anaerobic digestion of dairy manure and organic substrates.
Scenario 2: Mid-Valuation Scenario. The mid-valuation scenario (Scenario 2) is the scenario believed to most likely occur if 2,647 digesters are established in the U.S. to operate on dairy waste and organic substrates. Prices assumed for energy products and other co-products are generally assumed to be near the middle in relation to the range of prices that are feasible. This scenario assumes prices estimated to be those most likely received by digester operators given presently expected market conditions.
Scenario 3: High Valuation Scenario. The high valuation scenario (Scenario 3) assumes the prices received for the
energy and various co-products are at the high end of the range that is likely for these markets. It also assumes a higher (80%) share of the digesters that accept organic substrate will receive tipping fees and that one of the 3 types of digesters included in the scenario model (modified mixed plug flow digesters) can utilize up to 30% organic substrate as a share of total substrate utilized, as opposed to the 25% assumed in Scenarios 1 and 2. Relative to the prices assumed in this scenario, it is unlikely that all prices for all products will reach these higher levels simultaneously. However, the high valuation scenario provides a sense of the upper revenue level expected for the energy and co-products produced by 2,647 digesters.

National Market Value of Anaerobic Digester Products
14
These valuation scenarios are compared throughout the report both in terms of the volumes of product produced as well as the potential value expected for that volume of product.
Exhibit 1: Value of Production for 2,647 Dairy Anaerobic Digesters Producing Electricity
Source: Informa Economics.
The analysis suggests that the most likely energy production pathway is for the production of electricity and REC’s,
which is added to the other co-products of the digester. Exhibit 1 illustrates that the addition of all of these products gives annual revenues for all 2,647 digesters a value of $1.3 billion for Scenario 1, $2.9 billion for Scenario 2, and $4.6 billion for Scenario 3. All three scenarios assume that the energy produced from the anaerobic digester is converted into electricity.

National Market Value of Anaerobic Digester Products
15
Exhibit 2: Potential Production and Value of Products and Co-Products for 2,647 Dairy Anaerobic Digesters
Note: Not all products and co-products can be produced simultaneously. For example, the same energy from biogas that is used to generate electricity cannot also be used to generate CNG or pipeline biomethane and vice versa. This tradeoff may also have implications on which type of co-products are produced. These tradeoffs are reflected in the Maximum Total Dollar Value. Co-products associated with primary products include: RECs, RINs, and CA FCFS Credits; co-products not associated with primary products include Recovered N, P, and K; nutrient enriched fiber, and GHG offset Credits Source: Informa Economics.
Scenario 1:
Low Valuation
Scenario 2:
Mid Valuation
Scenario 3:
High ValuationUnits
Scenario 1: Low
Valuation
Scenario 2: Mid
Valuation
Scenario 3: High
Valuation
Inputs and AssumptionsNumber of Cows 3,974,143 3,974,143 3,974,143 Number NA NA NA
Manure 108,792,165 108,792,165 108,792,165 Tons/year NA NA NA
Organic Substrate/ Tipping Fees 19,849,474 19,849,474 21,197,583 Tons/year $266,963,055 $574,997,350 $704,582,497
OutputsElectricity Production 11,701,222 11,701,222 12,062,917 MWh/year $351,036,648 $894,270,196 $1,328,127,203
Co-Products
Recovered Nitrogen (N) 331,163 331,163 341,678 Tons N/year $311,510,905 $467,271,030 $964,216,106
Recovered Phosphorus (P) 108,782 108,782 112,287 Tons P/year $162,302,945 $324,605,889 $418,831,327
Recovered Potassium (K) - - - Tons K/year - - -
Nutrient Enriched Fiber 30,111,422 30,111,422 30,111,422 yd3/year $180,668,532 $217,047,838 $231,255,721
GHG Offset Credits 34,327,120 34,327,120 35,177,415 MTCO2e/year $34,327,120 $343,271,198 $879,435,367
RECs (Produced only when
electricity is primary product
produced)
11,701,222 11,701,222 12,062,917 RECs/year $17,179,372 $34,358,745 $65,643,532
SubtotalsElectricity + RECs $368,216,021 $928,628,940 $1,393,770,735
Soil Amendments, Eco-System,
and Other Products$955,772,557 $1,927,193,305 $3,198,321,018
Total $1,323,988,577 $2,855,822,246 $4,592,091,753
Volume Total Annual Dollar Value

National Market Value of Anaerobic Digester Products
16
Exhibit 2 details the three production possibility scenarios for estimated market values of digester products and co-products.3 Due to the higher capital expenses required, production of CNG was not deemed economically feasible at the present time for the vast majority of digester locations; therefore the exhibit reflects the energy production value of electricity only.4
Exhibit 3 shows the economic value of digesters in large U.S. dairies per cow, per year for electrical energy generation and soil amendments. In the most likely (Mid-Range) commodity price scenario, producing only methane gas (from which electricity may be generated through burning) may provide $228 in revenues generated per cow per year in a dairy with an operating digester. The ability to also market fiber (as bedding or a soil amendments), fertilizer nutrients, and eco-system market products such as renewable energy credits (RECs) and GHG offset credits, provides for $487 more per cow per year in net economic benefits generated at large dairies. The total of $715 per cow per year multiplied by the eligible cow herd of over 3.9 million head nationwide5 results in an annual market value of digester products $2.86 billion dollars.
3 In this report, product is referred to as the primary commodities of electricity, biogas, or compressed natural gas (CNG). Co-products are products that are also produced along with the production of electricity, pipeline biomethane, or CNG with a digester system. Co-products are produced and available for marketing regardless of the amount of gas or electricity produced, but gas production precludes electricity production, and vice versa.
4 There are only two digesters in the U.S. currently producing CNG for use off-farm, so at least a small portion of digester production would be compressed natural gas, but that is not included in the estimates in Exhibit 2.
5 The eligible cow herd of over 3.9 million head includes cows on dairies of over 500 head with anaerobic lagoon or liquid slurry waste management systems.

National Market Value of Anaerobic Digester Products
17
Exhibit 3: Fiber, Nutrient, and Eco-system Markets Potentially Add Hundreds to the Value of Each Dairy Cow
Source: Informa Economics.

National Market Value of Anaerobic Digester Products
18
E. Economic Returns on a National Investment in Anaerobic Digesters
This report estimates the return on investment to the country as a whole for an investment in digesters on large dairy farms. A net present value was calculated where the present value of 15 years of net operating revenue (discounted at a 3% annual risk free rate) was subtracted from the initial, estimated capital expenses of building 2,647 digesters on large dairy operations. Exhibit 4 illustrates the different estimated returns to an investment in anaerobic digesters under three different pricing
scenarios for digester co-products. Energy production alone produces insufficient economic returns to justify a major national investment in digesters.
However, investments in nutrient stripping technology, diversion of organic substrates from landfills, and participation in eco-system markets such as California’s new carbon trading market provides significantly more economic benefits, potentially justifying such an investment.

National Market Value of Anaerobic Digester Products
19
Exhibit 4: Energy Production Alone Provides Insufficient Returns for Digesters6
Source: Informa Economics.
6 The internal rate of return (IRR) figures presented in this report do not include tax payments because they represent a national-level investment
in digesters and the return to the US economy as a whole, as does the original EPA AgSTAR report on which the present study is based. Firm-level IRRs would have to be calculated for individual producer operations to derive the equivalent return for individual dairy producers.

National Market Value of Anaerobic Digester Products
20
F. Sustainability Benefits of Anaerobic Digesters
In addition to economic sustainability, anaerobic digesters provide environmental sustainability benefits in the form of reduced nutrient application in soils immediately surrounding large dairy operations, modified plug flow and complete mix digesters can use organic substrates such as commercial food waste as a feedstock in addition to cow manure. The resulting reduction of landfill use and reduced GHG contamination from the organic substrate that is diverted to energy production in digesters provides a quantifiable environmental benefit. Exhibit 5 illustrates the various kinds and magnitudes of the potential benefits of diverting 19.8 million tons of organic
substrates (more than 8% of annual U.S. landfill dumping) to 2,647 dairy-based digesters instead of landfills.
The diversion of organic substrates from landfills to digesters provides the largest, single environmental benefit of digester use of such substrates in addition to dairy manure, estimated to be a net 13 million metric tons of CO2-equivelent gas not emitted into the atmosphere.).
The U.S. Environmental Protection Agency (EPA) reports that 38% of landfill methane is emitted directly to air, so
avoiding this release accounts for a substantial amount of the total benefits of a digester-plus-avoided-landfill system.

National Market Value of Anaerobic Digester Products
21
Exhibit 5: Diversion of Organic Waste from Landfills to Dairy-based Digesters Would Remove the Carbon-Equivalent Emissions of over 3.2 Million Automobiles
Source: Analysis and graphic provided by Quantis, September, 2012
7
G. Nutrient Management Benefits from Sequestration Technologies
Environmental benefits from reduced nutrient management costs can be calculated in terms of acres over which nutrient waste from manure effluent must be spread. Costs per acre vary by farm and region due to different crops, distances,
7 “Preliminary Assessment of The Environmental Advantages of Disposal Of Food Waste through Co-Fermentation with Cow Manure in the United
States,” Quantis study for the Innovation Center for U.S. Dairy, September 2012.

National Market Value of Anaerobic Digester Products
22
and soil features, so estimating the acres over which nutrient waste must be spread to comply with EPA management plans provides a generalized metric which individual producers can apply to their specific cases. As explained in previous chapters of this report, digesters’ ability to increase energy and nutrient production by using
non-farm organic substrate feedstock such as food waste is critical to the economic sustainability of digester operations. However, such feedstock actually complicates the environmental balance sheet because it increases the amount of nutrients which need to be disposed of in digester effluent and screened solids included in nutrient management plans. Almost twice as many more acres are required to dispose of nutrient waste from digesters with no nutrient sequestration technology. (Assuming separated nutrients are not licensed as fertilizer products and marketed outside of nutrient management plans.)
Nutrient sequestration technology allows the recovery of nutrients from digester effluent for marketing outside of
nutrient management areas or for better targeting nutrients to crops within a nutrient management plan. About 30% fewer acres are needed to dispose of nutrient waste in digesters with nutrient sequestration technologies. (Exhibit 6.)
Exhibit 6: Acres Needed to Dispose of Effluent and Separated Nutrients
(Acres)
Source: Informa Economics.
State FIPS StateScenarios A &
B: Lagoon Only
Scenario C:
Digester w/o
Nutrient
Recovery
Scenario D:
Digester w
Nutrient
Recovery
04 Arizona 533,111 819,756 293,710
06 California 5,018,013 7,235,762 2,632,508
08 Colorado 187,416 395,069 175,805
16 Idaho 978,091 1,431,033 556,943
26 Michigan 310,162 551,710 187,358
35 New Mexico 881,572 1,074,694 408,447
36 New York 248,977 910,539 354,372
48 Texas 434,770 1,818,874 790,851
53 Washington 295,042 836,010 325,366
55 Wisconsin 401,335 613,915 238,929
80 Other 40 States 1,240,161 4,236,728 1,681,190
99 US Total 10,528,651 19,924,088 7,645,478

National Market Value of Anaerobic Digester Products
23
II. ANAEROBIC DIGESTION AND PRODUCTION OF BIOGAS
With a number of factors related to anaerobic digestion that vary with both geographic factors and state boundaries, the potential for energy production and potential values of primary and co-products was calculated for each of the top ten states. Where possible and when appropriate, factors in these calculations were included on a state by state basis. As such, the results of some calculations are provided for each of the top 10 potential dairy anaerobic digester states, a group called the “Other 40 states,” and a U.S. total. The “Other 40 States” group includes states in the U.S. other than the top ten states (as estimated by EPA AgSTAR) for potential for dairy digesters: Arizona, California, Colorado, Idaho, Michigan, New Mexico, New York, Texas, Washington, and Wisconsin.
A. Anaerobic Digester Types
The three types of digesters are: Covered Lagoon - An earthen lagoon fitted with a cover to contain and facilitate collection of biogas is the least
expensive type of digester to install and operate. A covered lagoon is the least controlled system with the lowest gas production and the longest retention time due to its psychrophilic environment. In northern climates, there may be no gas production in cold weather. Odor may not be totally eliminated due to incomplete digestion. Covered lagoons are best suited for flush manure collection systems with total solids of 0.5 to 3.0 percent.
Plug Flow/ Modified Plug Flow - Long, rectangular concrete tank with an air-tight cover where manure flows in one
end and out the other. Sometimes the tank is U-shaped, with the entrance and exit at the same end. Influent manure first enters a mixing pit, allowing solids to be adjusted by adding water. Then as manure is added, the “plug” of manure slowly pushes the older manure down the tank. The tank is typically heated to maintain a mesophilic or thermophilic environment, often using recovered heat from the biogas burner. The tank volume commonly holds the manure and waste water produced for 20 to 40 days, or in other words, the digester has a hydraulic retention time (HRT) of 20 to 40 days. Plug flow digesters require 11 to 13 percent total solids in the manure and work well with scraped dairy manure. Currently a hybrid mixed or modified plug-flow digester is becoming more common than the horizontal plug-flow.
Complete Mix - A complete mix digester has a sealed, cylindrical concrete or steel tank where manure is
mechanically kept in suspension or “mixed” by a motor-driven impeller, pump, or various other devices. It is also referred to as a “continually stirred tank reactor.” The manure is typically heated to maintain a mesophilic or

National Market Value of Anaerobic Digester Products
24
thermophilic environment, often utilizing recovered heat from the biogas burner. The tank commonly holds the manure and waste water produced for 20 to 30 days, which is equivalent to a 20 to 30 day HRT for the digester. Slurry manure that is scraped or flushed with 3 to 10 percent total solids works best in this system.
The critical differences between digester types are the following:
Covered Lagoons cannot take organic substrates as a feedstock and cannot produce fertilizer nutrients or fiber, so their productivity is limited with respect to non-energy co-products. On the other hand, their installation and operating costs are much lower.
Mixed Plug Flow digesters can produce fertilizer nutrients as well as higher quality (low pathogen) fiber for bedding and garden mulch. They can also take organic substrates as feedstock. They are the most expensive of the digester operations to install, but their operation costs are lower or comparable to Complete Mix systems.
Complete Mix digesters can take more organic substrates than either of the other two types, but their fiber quality is generally lower and needs additional treatment to remove pathogens. The higher organic substrate capacity produces more energy at capacity than other types.
Each of the three types of digesters can handle different mixes of organic substrates, thus impacting the production of marketable commodities differently (Exhibit 7).
Exhibit 7: Suitable Digester Technology Matrix
Sources: EPA, Dairy Manure Anaerobic Digester Feasibility Study Report, E-C-Oregon, October 21, 2009; industry interviews
Covered Lagoon Complete Mix Plug Flow
Suitable Percent Solids 0.5% to 3% 3% to 10% 11% to 13%
Solids Characteristics Fine Coarse Coarse
Food Waste/Manure Mix 0% Greater than 25% Less than 25%
Biogas Yields Low Medium Medium
HRT Greater than 48 days 20-30 days 20-40 days
Round/Square in-
/above-ground tankDeep LagoonDigestion Vessel
Rectangular in-
ground tank
Yes - accepts
multiple co-digestion Limited
Not Necessary
Temperate & warm
climates All Climates All ClimatesOptimum Location
NoCo-Digestion CompatibleSolids Separation prior to
Digestion Recommended Not Necessary

National Market Value of Anaerobic Digester Products
25
New digesters are being designed with capacity to receive source separated organic substrate streams and high strength organics such as ethanol, thin stillage, glycerin, and food processing residuals. Source separated waste as differentiated from mixed waste is material that has been separated at the point of generation with nonorganic items such as plastic, metal, and glass. Each digester type also varies on the co-products that are recovered. Additional detail on which primary products and co-products recovered from each type of anaerobic digester is provided in Exhibit 8.
Exhibit 8: Products Produced by Each Anaerobic Digester Type
Note: “Yes” indicates that a product can be produced using that anaerobic digester type; “No” indicates that a particular anaerobic digester type cannot be used to produce a particular product.
There are benefits and drawbacks to each of the digester types. Some digester types are better suited to different types of waste than others, and for a number of reasons, the distribution of digester types is not uniform across the United
Covered
LagoonPlug Flow Complete Mix
Primary Products
Electricity Production Yes Yes Yes
Pipeline Quality Biomethane Yes Yes Yes
CNG Yes Yes Yes
Co-Products
Recovered Nitrogen (N) No Yes Yes
Recovered Phosphorus (P) No Yes Yes
Recovered Potassium (K) No Yes Yes
Nutrient Enriched Fiber No Yes Yes
GHG Offset Credits Yes Yes Yes
RECs (Produced only when
electricity is primary product
produced)
Yes Yes Yes
RINs (produced only when CNG
is primary product produced)Yes Yes Yes
LCFS Credits (produced only
when CNG is primary product
produced)
Yes Yes Yes

National Market Value of Anaerobic Digester Products
26
States. For example, the EPA assumes that covered lagoons installed north of the 40th parallel in the United States do not consistently produce enough biogas for capture of the energy produced through electricity or other means. Rather, the methane produced by these systems is flared and they are used primarily as waste and odor management tools. Each type of digester has a different maximum percentage of organic substrate that can be added as well. Given the potential implications in terms of the value of co-products produced by each type of digester, the assignment of the number of digesters of each type was considered extremely carefully. Once a share of each digester type was assigned for each state, these shares were applied to the potential 2,647 anaerobic digesters for dairies indicated by EPA AgSTAR. These assignments reflect a baseline that is largely drawn from current shares of digesters by state as well as expectations of the potential path for the growth in additional digesters. Based on conversations and research involving a wide spectrum of the anaerobic digester industry, the new digesters needed to reach 2,647 digesters in the U.S. will primarily be the modified plug flow and complete mix types, and that growth in the number of covered lagoon digesters will be limited, although these will still remain as part of the mix of digester technologies in use. Additional detail on the digester types assumed for the calculations is provided in Exhibit 9 below.
Exhibit 9: Shares of Digesters by State
Source: Informa Economics.
Share of
Covered
Lagoons
Share of
Plug
Flow
Share of
Complete
Mix
Arizona 11.7% 47.2% 41.1%
California 11.7% 47.2% 41.1%
Colorado 11.7% 47.2% 41.1%
Idaho - 53.4% 46.6%
Michigan - 53.4% 46.6%
New Mexico 11.7% 47.2% 41.1%
New York - 53.4% 46.6%
Texas 11.7% 47.2% 41.1%
Washington - 53.4% 46.6%
Wisconsin - 53.4% 46.6%
Other 40 States 2.9% 66.7% 30.4%
US Total 6.8% 52.7% 40.5%
National Market Value of Anaerobic Digester Products
27
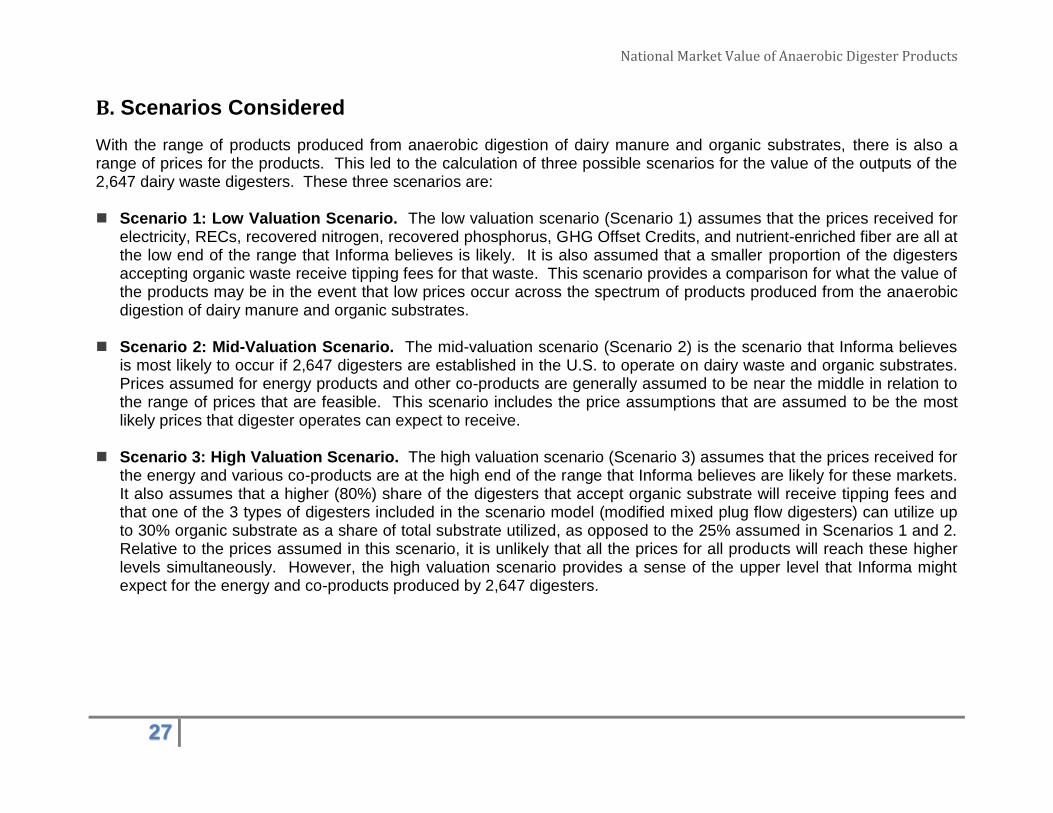
B. Scenarios Considered
With the range of products produced from anaerobic digestion of dairy manure and organic substrates, there is also a range of prices for the products. This led to the calculation of three possible scenarios for the value of the outputs of the 2,647 dairy waste digesters. These three scenarios are: Scenario 1: Low Valuation Scenario. The low valuation scenario (Scenario 1) assumes that the prices received for
electricity, RECs, recovered nitrogen, recovered phosphorus, GHG Offset Credits, and nutrient-enriched fiber are all at the low end of the range that Informa believes is likely. It is also assumed that a smaller proportion of the digesters accepting organic waste receive tipping fees for that waste. This scenario provides a comparison for what the value of the products may be in the event that low prices occur across the spectrum of products produced from the anaerobic digestion of dairy manure and organic substrates.
Scenario 2: Mid-Valuation Scenario. The mid-valuation scenario (Scenario 2) is the scenario that Informa believes is most likely to occur if 2,647 digesters are established in the U.S. to operate on dairy waste and organic substrates. Prices assumed for energy products and other co-products are generally assumed to be near the middle in relation to the range of prices that are feasible. This scenario includes the price assumptions that are assumed to be the most likely prices that digester operates can expect to receive.
Scenario 3: High Valuation Scenario. The high valuation scenario (Scenario 3) assumes that the prices received for
the energy and various co-products are at the high end of the range that Informa believes are likely for these markets. It also assumes that a higher (80%) share of the digesters that accept organic substrate will receive tipping fees and that one of the 3 types of digesters included in the scenario model (modified mixed plug flow digesters) can utilize up to 30% organic substrate as a share of total substrate utilized, as opposed to the 25% assumed in Scenarios 1 and 2. Relative to the prices assumed in this scenario, it is unlikely that all the prices for all products will reach these higher levels simultaneously. However, the high valuation scenario provides a sense of the upper level that Informa might expect for the energy and co-products produced by 2,647 digesters.

National Market Value of Anaerobic Digester Products
28
Regulations Impacting Anaerobic Digestion of Dairy Waste
Many of the regulations impacting dairy digesters are specific to the state where the anaerobic digester is operated, although federal Clean Water and Clean Air standards are also relevant. While there are some requirements that impact all anaerobic digester operations, the addition of off-farm organic substrate creates the need to comply with additional regulations in some cases. Regulatory requirements are targeted at a number of components of the digester system, including the maximum level of off-farm organic substrate that can be added to the digester, the handling of the digester effluent, and the operation of the energy capture portion of the facility. Dairy digesters in California face regulatory hurdles to implementation, with a lack of coordination among regulatory agencies cited as an important obstacle. The expense and time commitment (on the order of several years) to obtain a digester permit in the state prevented the construction of several digesters and also distorted the costs of various systems. For example, the additional requirements to use an in-ground (e.g., covered lagoon) system are expensive, and increases the cost of what would otherwise be the least expensive of the three main anaerobic digester types. It is assumed that the regulatory obstacles impacting digesters are not an impossible hurdle to overcome for the construction of more dairy digesters. This may occur through either eventual relaxation of restrictions because of the costs they impose on the overall sector, development of technology that is more adaptive to regulations, or because the economic benefits of co-products produced by digesters are more favorable. In particular, California is a key dairy producing state, and it is assumed that the full potential for anaerobic digestion of dairy waste will be reached in the state.
C. Number of Cows
The study uses EPA AgSTAR’s expansion and distribution of digesters and cow numbers as a basis for its forecasts (Exhibit 10). EPA AgSTAR used the 2007 Census of Agriculture data and based feasible dairies for digesters on dairy farms with 500 or more dairy cows and anaerobic lagoons or liquid slurry manure management systems. The study assumes EPA AgSTAR’s cow numbers for 2,647 digesters.

National Market Value of Anaerobic Digester Products
29
At the same time, it is important to note that although the total number of U.S. dairy cows is expected to stay relatively flat from now through 2020, the number of large dairy farms of 500 head or more is expected to continue to increase (Exhibit 11). The higher cow number forecast for 2020 implies even more abundant supplies of manure for anaerobic digestion and even greater potential for additional digesters by that time, although the availability of organic substrates in addition to cow manure would not increase at the same rate, so the same economic benefits are not presumed.
Exhibit 10: Profiles of Top Ten States for Anaerobic Digestion of Dairy Waste
State
Total No. of Dairies
Total No. of Dairy Cows
(1,000s)
No. of Feasible
Dairies for Digesters
No. Cows at
Feasible Dairies (1,000s)
Average No. of
Cows per Feasible
Dairy
No. of Other
Dairies
No. of Cows Other
Dairies (1,000s)
Average Number of Cows
per Other Dairy
Arizona 182 184 54 146 2,704 128 38 297
California 2,165 1,841 889 1,352 1,521 1,276 489 383
Colorado 449 127 54 97 1,796 395 30 76
Idaho 811 536 203 430 2,118 608 106 174
Michigan 2,647 344 107 138 1,290 2,540 206 81
New Mexico 272 326 110 261 2,373 162 65 401
New York 5,683 626 111 109 982 5,572 517 93
Texas 1,293 404 155 266 1,716 1,138 138 121
Washington 817 243 125 163 1,304 692 80 116
Wisconsin 14,158 1,249 251 238 948 13,907 1,011 73
Top 10 States 28,477 5,880 2,059 3,200 16,752 26,418 2,680 1,815
Other 40 States 41,413 3,387 588 775 1,316 40,825 2,613 64
United States 69,890 9,267 2,647 3,974 1,501 67,243 5,293 79
Note: “Other Dairies” refer to dairies that are not considered feasible for installation of anaerobic digesters based on farm size and/or manure management practices used.
Source: Market Opportunities for Biogas Recovery Systems at U.S. Livestock Facilities, 2011; EPA AgSTAR.

National Market Value of Anaerobic Digester Products
30
Exhibit 11: Number of Cows at Feasible Dairies by 2020 (Thousand Cows)
Note: EPA AgSTAR estimates are based on 2007 USDA Census of Agriculture Data. Source: EPA AgSTAR; Informa Economics.
D. Manure Production
The American Society of Agricultural Engineers estimates that a lactating cow produces 150 pounds of manure per day. The study uses 150 pounds per cow for all cows to calculate manure production (Exhibit 12). Total manure production for the U.S. is estimated at 108.8 million tons annually.
State
EPA AgSTAR Current
(Thousand Cows)
Informa 2020
Forecast (Thousand
Cows
Arizona 146 212 California 1,352 1,753 Colorado 97 153 Idaho 430 637 Michigan 138 308 New Mexico 261 343 New York 109 450 Texas 266 451 Washington 163 256 Wisconsin 238 686 Other 40 States 775 2,123 United States 3,974 7,371

National Market Value of Anaerobic Digester Products
31
Exhibit 12: Manure Production at Feasible Dairies
Source: EPA AgSTAR; Informa Economics.
E. Organic Substrates
Animal manure is the most widely recognized feedstock for anaerobic digesters but it provides a relatively small amount of biogas per pound of material when compared with other potential feedstock. The reason is cows have removed much of the nutrient and energy value of the feed they consumed before their manure waste reaches an anaerobic digester. Therefore, combining animal manure with other organic substrates greatly increases biogas production and helps to make
Number of
Cows on
Feasible
Dairies
Tons of
Manure
Production
Arizona 145,577 3,985,170
California 1,351,863 37,007,250
Colorado 97,282 2,663,095
Idaho 430,013 11,771,606
Michigan 137,665 3,768,579
New Mexico 260,564 7,132,940
New York 109,045 2,985,107
Texas 266,457 7,294,260
Washington 162,615 4,451,586
Wisconsin 237,825 6,510,459
Other 40 States 775,237 21,222,113
US Total 3,974,143 108,792,165

National Market Value of Anaerobic Digester Products
32
the use of digesters significantly more feasible than using animal waste alone. Exhibit 13 identifies the estimated biogas yield from various organic substrate feedstocks.8
Exhibit 13: Biogas Yields from Different Biomass
Co-digestion of manure and organic substrates has a number of advantages including: Addition of pre-consumer waste can significantly increase biogas production compared with using only manure.
The increase varies depending on the type and amount of waste used but research has shown that biogas production can increase from 25% to 400%.
8 Note that this report assumes manure and primarily commercial food waste as organic substrates, so the biogas yields reported in Exhibit 13 are different, and likely higher, than the yields assumed for digester feedstock in this report.
Substrate Biogas Yield (m3/t) Substrate Biogas Yield (m3/t)
Fats & Grease 961 Corn 200
Bakery Waste 714 Grasses 110
Food Scraps 265 Used Fats 800
Corn Silage 190 Fatty Wastes 400
Grass Silage 185 Vegetable Oil 350
Green Clippings 175 Sewage Waste 80
Brewery Waste 120 Distilary Waste 80
Chicken Manure 80 Dairy Waste 55
Potato Waste 39 Fruit & Vegetables 35
Pig Manure 30 Poultry Manure 35
Cow Manure 25 Cattle Manure 30
Pig Manure 25
Source: "Biogas for Farming, Energy
Conversion and Environmental Protection,
Nov 2007, Kestutis Navickas, Dept of
Agroenergetics, Lithuanian University of
Agriculture
Source: Basisdaten Biogas Deuthchland,
Marz 2005: Fachagentur Nachwachsende
Rohstoffe e. V.

National Market Value of Anaerobic Digester Products
33
The digester operator collects tipping fees to receive these wastes. Tipping fees sometimes are the digester’s largest revenue.
Many organic substrates have a higher methane yield per pound of volatile solids versus only using dairy manure.
F. Organic Substrate Availability
Organic substrates co-digested with animal waste can include fats, oils and grease, food scraps, cheese waste, brewery waste and other substrates listed in Exhibit 13. However the study assumes that at least 70% of the substrates used by digesters will come from commercial organic substrate. The study assumes only 30% of the substrates will come from food processors/manufacturers because of strong competition from renderers and animal feeders who often pay little or no tipping fees to obtain this type of waste. Also, higher hauling costs to obtain sufficient quantities of residential organic substrate will significantly limit the use of residential organic substrates used in digesters. The amount of organic substrates produced varies by type of establishment. A June 2006 waste characterization study for the California Integrated Waste Management Board (currently CalRecycle) by Cascadia Consulting Group focused on waste disposal and diversion for selected industry groups, including grocery stores and food service groups. The following are a summary of the findings: Grocery stores generate 4,750 pounds of waste per year per employee (after recycling) of which 65% are food scraps. Fast food restaurants generate 4,250 pounds of waste per year per employee (after recycling) of which 52% are food
scraps.
Full service restaurants generate 4,400 pounds of waste per year per employee (after recycling) of which 66% are food scraps.
Large hotels generate 3,900 pounds of waste per year per employee (after recycling) of which 44% are food scraps.9 As indicated above, commercial food waste is expected to account for the largest share of organic substrates co-digested with manure. Dairies should consider using additional organic substrates if:
9 “Source Seaparated Food Waste Flow to Farm Digesters,” by N. Goldstein, BioCycle/The JG Press, Inc.

National Market Value of Anaerobic Digester Products
34
Major organic substrate generators are located within a one to one-and-a-half hour radius from the digester location. Digester operator has adequate technical skills and resources to monitor organic substrate influent. Digester operator has necessary resources or contracts to collect and transport organic substrates. The organic substrate source is stable and biologically compatible with dairy manure for a digester process.
Other Key Considerations Involving Organic Substrate
1. Level of contamination: If the organic substrate has a high level of contaminants such as plastic, glass, etc., these contaminates must be removed before anaerobic digestion because they can plug the digester. The higher level of contamination requires more processing machinery such as a chopper pump. (It is assumed no additional capital or operating expenses are incurred for more processing machinery in this report, instead limiting organic substrates to the relatively cleaner, commercial food waste provided by large food distributors and industrial producers.)
2. Selection of substrates: Substrate composition determines methane yield and methane production rates. 3. Hauling costs: Need to purchase vehicles to transport waste. (It is assumed no additional transport costs in
this report because such waste material already requires transport to landfills, but actual experience of individual digester operations may differ.)
4. Using organic substrate in digesters provides significant environmental benefits by reducing the waste to landfills, extending landfill capacity, and preventing contamination from landfill leakage.
5. Organic substrate is a broad category which includes many kinds of potential feedstock for anaerobic digesters. Dairy-based digesters are presumably limited to types of organic substrates compatible with on-site production of dairy milk products for human consumption. Therefore, in this report, commercial food waste is presumed to make up the largest proportion of organic substrates used by digesters, and the term “organic substrate” is used here, with respect to quantities reported, assuming such a limitation.
The amount of organic substrate in the United States is large and rising. In 2010, according to EPA, about 250 million tons of municipal solid waste was generated. Total organic substrate accounts for 14% of the total municipal solid waste

National Market Value of Anaerobic Digester Products
35
stream and is the single largest component of municipal solid waste reaching landfills and incinerators. Commercial organic substrate accounts for about 8% of the total municipal solid waste stream. However, less than 3% or 970,000 tons was recovered and recycled in 2010, leaving 33.8 million tons discarded making it the largest component (20.5%) of municipal solid waste (MSW) reaching landfills and generators today. Less than 3% of organic substrate is recovered in U.S. The major reasons for this are: Lack of processing infrastructure for organic substrate, i.e. anaerobic digestion or composting; Relatively low landfill tipping fees that make it challenging for organic substrate recycling facilities to compete; and,
Potential of contamination in organic substrate, mainly plastic, being mixed in with inorganic matter. EPA’s organic substrate data includes uneaten food and food preparation scraps from residences or households, commercial establishments such as grocery stores, cafeterias, and industrial sources such as factory lunchrooms. Pre-consumer organic substrate generated during manufacturing and packaging of food products though is considered industrial waste and is not included in Municipal Solid Waste (MSW) food scrap estimates. Agricultural waste streams also are not included in EPA’s organic substrate estimates. This study derives commercial organic substrate data from EPA total organic substrate estimates (residential and commercial food waste). Based on discussions with EPA, the following assumptions are made to calculate EPA commercial organic substrate data for the national and state level: Commercial organic substrate accounts for about 60% of EPA’s total national organic substrate.
Note that commercial organic substrate data is available for some states such as California and that data is used in the study rather than the data derived using EPA data.
National per capita organic substrate is calculated by dividing the derived commercial organic substrate total by the
national population. State commercial organic substrate is calculated by multiplying the national per capita organic substrate by the state
population except when individual state data is available. The ERS system of calculating organic substrate by estimating per capita food losses at the retail level by type of food to calculate commercial organic substrate was used as a comparison with the EPA-derived data. For example, ERS

National Market Value of Anaerobic Digester Products
36
calculates that annual supermarket losses averaged 11.4% for fresh fruit, 9.7% for fresh vegetables, and 4.5% for fresh meat, poultry and seafood. Commercial organic substrate data calculated using the ERS food loss methodology is higher than using EPA data but is still fairly comparable. Based on ERS data, commercial organic substrate is estimated at 23.8 million tons in 2009 (Exhibit 14.)
Exhibit 14: Per Capita Retail Losses by Product Group
Product
Per Capita Retail
Losses (Pounds
per person)
Organic Substrate
Weight (Tons)
Vegetables 22.2 3,079,273 Fruit 19 2,635,414 Cane/Beet Sugar 6.9 957,071 Total Fats 17.8 2,468,967 All Milks 21.3 2,954,438 Dairy Products 28.8 3,994,733 Grains 23.3 3,231,850 Salad & Cooking Oils 10.9 1,511,895 Other Edible Fats Oils 0.1 13,871 Honey & Syrup 2 277,412 Corn Sweeteners 7.2 998,683 Meat Poultry Eggs Fish 12.2 1,692,213
Total 171.7 23,815,819 Source: ERS/USDA; Informa Economics.
The study also used ERS per capita food loss methodology to calculate the amount of processed/manufacturing organic substrate co-digested with manure. Processing/manufacturing organic substrate accounts for about 30% of total organic substrate estimated for digester use in the study.
National Market Value of Anaerobic Digester Products
37
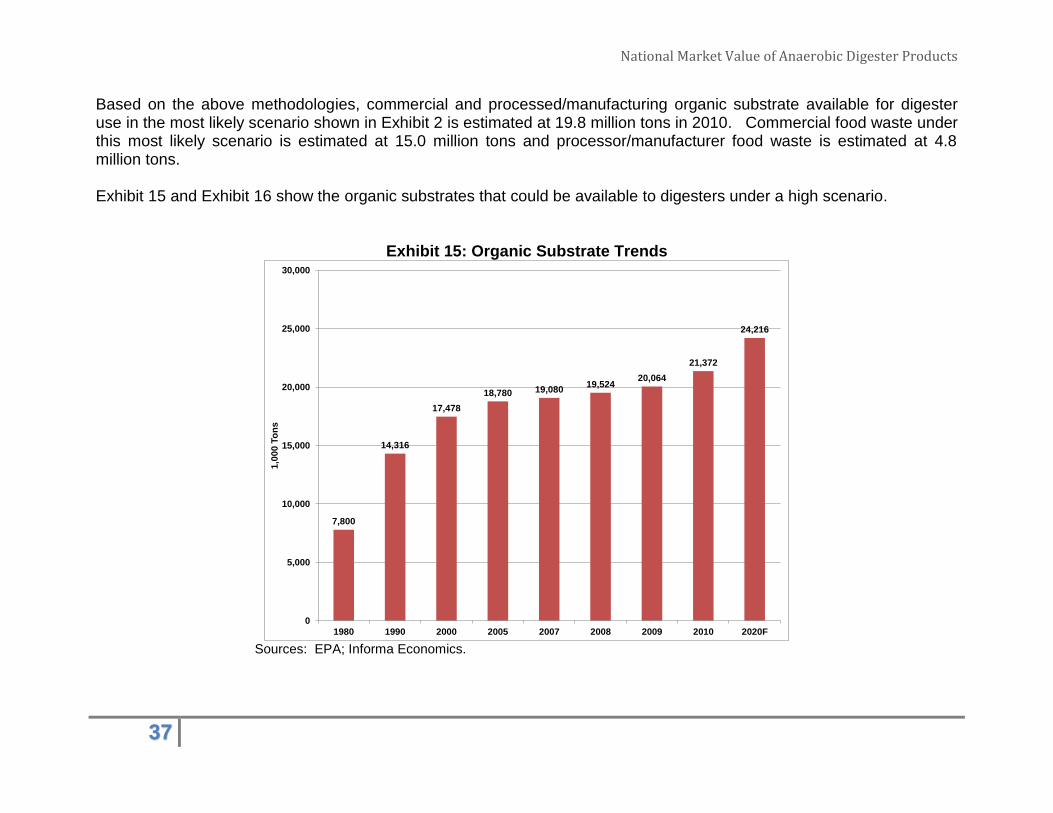
Based on the above methodologies, commercial and processed/manufacturing organic substrate available for digester use in the most likely scenario shown in Exhibit 2 is estimated at 19.8 million tons in 2010. Commercial food waste under this most likely scenario is estimated at 15.0 million tons and processor/manufacturer food waste is estimated at 4.8 million tons. Exhibit 15 and Exhibit 16 show the organic substrates that could be available to digesters under a high scenario.
Exhibit 15: Organic Substrate Trends
Sources: EPA; Informa Economics.
7,800
14,316
17,478
18,780 19,08019,524
20,064
21,372
24,216
0
5,000
10,000
15,000
20,000
25,000
30,000
1980 1990 2000 2005 2007 2008 2009 2010 2020F
1,0
00
To
ns

National Market Value of Anaerobic Digester Products
38
Exhibit 16: Commercial/Processing/Manufacturing Organic Substrate by State In 1,000 short tons
2000 2010 2020F
Arizona 318,643 442,469 597,040 California 2,103,634 3,032,805 4,000,000 Colorado 267,134 348,131 394,400 Idaho 80,362 108,511 122,400 Michigan 617,237 684,166 659,600 New Mexico 112,974 142,541 156,400 New York 1,178,553 1,341,392 1,339,396 Texas 1,295,024 1,740,627 2,057,204 Washington 366,061 465,486 504,016 Wisconsin 333,117 373,440 421,804
Top 10 States 6,672,739 8,679,568 10,252,260 Other 40 States 10,805,261 12,692,432 13,963,640
US 17,478,000 21,372,000 24,215,900 Source: EPA, ERS and Informa Economics.
Some of the large dairy states have a very small ratio of organic substrate to manure such as Idaho at 0.9% and New Mexico at 2% (Exhibit 17). For these states, it is not as important which types of anaerobic digesters are used relative to organic substrate because of the small availability of organic substrate. On the other hand, large dairy states such as New York and Texas as well as states within the other 40-state group have significantly higher organic substrate availability. In those states, the share of each digester type that is used and the amount of organic substrate that is assumed to be used in each type of digester are more critical assumptions.

National Market Value of Anaerobic Digester Products
39
Exhibit 17: Waste as a Share of Manure Production by State, 2010 & 2020F
Source: Informa Economics.
G. Production of Biogas and Methane
The production of biogas and methane are two key components in the generation of the three “primary products” of digesters: electricity, pipeline-quality biomethane, and compressed natural gas (CNG). Dairy manure naturally has the potential to produce biogas via anaerobic digestion. Biogas is a mixture comprised primarily of methane (CH4) and carbon dioxide (CO2), along with other trace gases. The production of biogas is based primarily on the volatile solids content of the manure. The volatile solids manure content values were obtained by state for U.S. dairies. An additional consideration is that the addition of organic waste not only has its own volatile solid content that contributes directly to the production of biogas, but it also changes the conditions in the digester such that there is increased potential for biogas production from the dairy manure. Thus, the amount of organic substrate available and utilized per state directly impacts the biogas production of digesters.
Scenario 1:
Food Waste as
a Percent of
Total Influent
by State
Scenario 2:
Food Waste as
a Percent of
Total Influent
by State
Scenario 3:
Food Waste as
a Percent of
Total Influent
by State
Arizona 10% 10% 10%
California 8% 8% 8%
Colorado 12% 12% 12%
Idaho 1% 1% 1%
Michigan 15% 15% 15%
New Mexico 2% 2% 2%
New York 31% 31% 31%
Texas 19% 19% 19%
Washington 9% 9% 9%
Wisconsin 5% 5% 5%
Other 40 States 34% 34% 37%
US Total 15% 15% 16%

National Market Value of Anaerobic Digester Products
40
The biogas is assumed to consist of 60% methane. This methane value is then converted to British Thermal Units (BTUs), a measure of energy content based on a conversion of 923 BTU per cubic foot (ft3) methane. However, neither biogas nor methane is ready to sell at this point in the production process, and both must go through one of several modifications before they are marketable products. There is significant variability in the dairy waste and organic substrate that are inputs to anaerobic digesters. Further, the types of organic wastes and their energy content are also wide ranging, from very dilute, high water-content products to waste fats and oils that are very high in energy. However, high energy organic substrates can take longer to digest and result in only partially digested material in the digester effluent. Another consideration is that the actual methane content of biogas produced by each digester can vary considerably, and often will not achieve the targeted percentage if the digester is not operating at peak performance. The energy generated through anaerobic digestion can be converted into one of several more readily usable forms of energy; the options considered for the dairy anaerobic digesters include electricity, pipeline biomethane, and compressed natural gas (CNG). One key reminder regarding the production of electricity, pipeline biomethane, and CNG is that these products cannot be produced simultaneously with the same energy. That is, once methane from the biogas has been used to generate electricity, that same methane cannot be used to generate pipeline biomethane or CNG. In most cases, there will be one use that clearly has a higher return relative to cost. However, there may be some site-specific situations where a dairy may choose to produce more than one of these energy products, depending on relative efficiencies, prices, and logistics considerations.

National Market Value of Anaerobic Digester Products
41
III. VALUE OF ANAEROBIC DIGESTER ENERGY PRODUCTS
The methane contained in the biogas produced by the anaerobic digesters can be utilized for production of three primary products. In addition to these primary products, some of these three have additional values associated with them based on incentives for renewable or low carbon energy production. Once biomethane has been used for one product, it cannot be reused to produce another of the primary products.10 The three primary products and associated co-products are given in Exhibit 18. There are several other co-products that are produced regardless of the primary product produced, and those co-products are described in further detail later. Given these tradeoffs, the volume of production and the value of that production are both important. The ability to secure long term pricing contracts for each of these energy products could also determine whether electricity, pipeline biomethane, or compressed natural gas is the most preferred option.
Exhibit 18: Production of Primary Products and Associated Co-Products
Electricity Pipeline Biomethane Compressed Natural Gas
(CNG)
Primary Product Electricity Pipeline Biomethane Compressed Natural Gas
(CNG)
Associated Co-Products Renewable Energy Certificates (RECs)
---
Renewable Identification Numbers (RINs)
and California Low Carbon Fuel Standard (LCFS) Credits
A. Electricity Production
Electricity is the most common form of energy that is harnessed from anaerobic digesters powered by dairy waste. This can be attributed, at least in part, to the availability and cost effectiveness of the technologies to generate electricity. In
10
The biomethane from one digester can be used to produce up to more than one primary product; the distinction is that the same biomethane cannot be used for more than one primary product. For example, a digester can be used to run a combined heat and power unit to generate enough electricity to be used by the farm, and any excess biomethane could be directed to pipeline biomethane production. However, there is a tradeoff between the amount of electricity and the amount of pipeline biomethane produced.

National Market Value of Anaerobic Digester Products
42
particular, Combined Heat and Power (CHP) units generate electricity and capture the heat produced by the electricity generation process. That heat can be used to maintain the temperature of the anaerobic digester system, heat manure or waste influent for the digester, or be utilized elsewhere on the farm to heat milking parlors or other facilities. For electricity production, a thermal efficiency factor of 35% was assumed, along with an uptime capacity factor of 90% to reflect a 10% downtime of the system for repairs and maintenance. Additionally, a parasitic load of 10% is assumed to maintain the heat of the digester system. The following electricity prices (Exhibit 19) were assumed by state for the mid-valuation scenario (Scenario 2) based on the average electricity price paid by industrial customers (e.g., agricultural users) in 2011. The comparable price of electricity varies substantially from one digester to the next, and depends on state regulations on the amount that generators of renewable electricity must be paid, state-or utility-specific net metering laws, and specific contracts between the digester operator and the utility. While some dairies may only receive an “avoided cost” payment (the price at which the utility could have generated or purchased non-renewable electricity), others may receive a higher price based on the price that the farm pays or would otherwise have to pay to purchase electricity from the utility.
Exhibit 19: Electricity Price Assumptions by State
State Electricity Price
($/kWh)
Arizona 0.0658 California 0.1101 Colorado 0.0712 Idaho 0.0516 Michigan 0.0736 New Mexico 0.0611 New York 0.0780 Texas 0.0634 Washington 0.0397 Wisconsin 0.0734 Other 40 States 0.0660
Source: Informa Economics.
Using these assumptions, the range of electricity production was 11.7 million megawatthours (MWh) in the low- and mid-valuation scenario and up to 12.1 million MWh in Scenario 3 (High Valuation Scenario). Electricity prices vary

National Market Value of Anaerobic Digester Products
43
considerably by user type and with the specific contract that is agreed upon by the utility and the digester operator. On the low end, it is estimated that the electricity could be valued as low as $0.03 per kWh. On the high end, assuming that there is some additional value given to the electricity itself because of its “green” source, electricity prices are assumed to potentially range up to $0.11 per kWh. The level of electricity production described for the 2,647 digesters is expected to have a value of $0.24 to $0.92 per cow per day, ranging from the low to high valuation scenarios; the middle valuation scenario for electricity has a value of $0.62 per cow per day. This equates to a total annual value for all cows of $894 million in the mid-valuation scenario, with a low to high range estimated at $351 million up to $1.33 billion. Of course, there are considerations that go along with these assumptions. Mechanical issues may reduce the percent uptime on the electricity generation system or reduce the efficiency with which methane content is converted to electricity. Further, electricity pricing arrangements are complex. They vary by state and often require expensive investments to connect to the power grid. Only some states have so-called “net-metering” arrangements where farmers/digester operators receive the same price for electricity they put back on the grid as they receive for electricity purchased from the utility. These agreements often vary even among utility companies within a state.
B. Pipeline Biomethane Production
Much like electricity, the key determinant of potential pipeline biomethane production is the amount of energy generated by the digester in the form of methane in biogas. However, pipeline biomethane production is an alternative means of harnessing the energy produced by the anaerobic digester. In most cases, this option is much more feasible if the anaerobic digester is located in close proximity to a natural gas pipeline where the scrubbed biogas is injected into the pipeline without the need to build a lengthy feed-in pipeline. The costs of pipeline biomethane are developed more extensively later in the report. To move from biogas, which is assumed to be 60% methane, to a pipeline-quality methane product that is nearing 99% or higher methane content, the carbon dioxide in the biogas must be removed. Further, hydrogen sulfide is another gas often present in biogas and is very corrosive to equipment; it must also be removed from the biogas. Since the scrubbing of the biogas does not produce the same quantity of heat that a combined heat and power unit would produce to generate electricity, for pipeline biomethane production a parasitic load of 20% to contribute to the operation of the digester along with a parasitic load of 10% for the gas clean-up facility means that a significant portion of the potential energy of the biogas is lost by the time a pipeline-quality biomethane is obtained.

National Market Value of Anaerobic Digester Products
44
These results suggest that approximately 69,921 BTUs of pipeline quality biomethane can be produced per cow per day; equating over 101 million MMBTUs per year in Scenario 2 for all 2,647 anaerobic digesters in the U.S. Unfortunately, current natural gas prices are not considered favorable to the use of anaerobic digesters to generate pipeline biomethane. Using current (April 2012) monthly citygate price for natural gas from the Energy Information Administration (EIA) gives an average value of around $0.28 per cow per day of the production of pipeline quality biomethane. Unless natural gas prices rise substantially, which they are not expected to do in the short-term, the added cost and reduced revenue of pipeline biomethane production could be prohibitive for some dairies with anaerobic digesters.
C. Compressed Natural Gas Production
According to the U.S. Department of Energy’s (DOE) Alternative Fuels Data Center (AFDC), there are approximately 112,000 natural gas vehicles in the U.S. “Natural gas vehicles (NGVs), which can run on compressed natural gas (CNG), are good choices for high-mileage, centrally-fueled fleets that operate within a limited area. For vehicles needing to travel long distances, liquefied natural gas (LNG) is a good choice […] There are many heavy-duty natural gas vehicles—as well as a few light-duty NGVs—available from original equipment manufacturers.”11 However, the interest in using natural gas for transportation has grown dramatically in recent years as the supply of domestically produced natural gas has swelled and the price of natural gas has fallen sharply due to the advent of hydraulic fracturing of shale formations. A 2011 report by Jim Jensen of Washington State University identified only two dairies in the U.S. that were producing CNG from anaerobic digestion: Hilarides Dairy in California and Fair Oaks Dairy in Indiana.12 Accordingly, the dairy industry has a long way to go before CNG is a major source of revenue. Biogas from the anaerobic digestion of dairy cattle manure contains roughly 60% methane, with the remainder consisting mostly of carbon dioxide (CO2) along with other trace gases. The biogas can be scrubbed and upgraded to remove the trace gases and most of the carbon dioxide, to the point where it is over 90% methane, which makes it suitable for use as a transportation fuel in the form of CNG. However, if the biogas is injected into a pipeline carrying fossil natural gas prior to delivery to a station that performs the compression, it might have to be upgraded to at least 95% methane. Based on
11
"Natural Gas Vehicles." Alternative Fuels Data Center. U.S. Department of Energy, 6 July 2012. Web. 25 July 2012. <http://www.afdc.energy.gov/vehicles/natural_gas.html>. 12
Jensen, Jim. Biomethane for Transportation: Opportunities for Washington State. Rep. Western Washington Clean Cities Coalition, Nov. 2011. Web. 22 May 2012. <http://www.energy.wsu.edu/Documents/Biomethane_For_Transportation_WWCleanCities.pdf>.

National Market Value of Anaerobic Digester Products
45
conversations with biogas industry participants, it is assumed for purposes of this report that the biogas will generally have to be upgraded to the higher level of purity and transported by pipeline to a CNG station, where it is compressed and sold/distributed. Accordingly, it is assumed that in the production of CNG, the parasitic load to run the digester is 20%, and the parasitic load to upgrade the gas is an additional 10%, or the same parasitic load as for pipeline biomethane production. If all of the biomethane produced by the 2,647 digesters considered for this study were converted into CNG, 788 million diesel gallon equivalents (DGE) in Scenarios 1 and 2, up to 812 million DGEs of CNG in Scenario 3 could be produced. DGEs are considered here rather than gasoline gallon equivalents (GGE) since the two dairies currently producing CNG are using it to run their tractor-trailer fleets, and since Waste Management, Inc., which runs a large-scale biogas-to-CNG program across the West Coast from its Altamont, California, landfill, is using CNG rather than LNG in a major initiative to convert its waste and recycling collection trucks to natural gas. “Waste Management already operates over 1,400 CNG vehicles, the largest fleet of CNG recycling and waste collection trucks in North America. … In 2012, natural gas vehicles will represent 80 percent of our annual new truck purchases and continue for the next five years. We also have 28 fueling stations in North America and plan to have 50 in operation by the end of 2012.”13 Based solely on the 2012 cost of fossil natural gas that the digester-produced methane would displace in the production of CNG, the DGEs of CNG would be $578 million in the baseline (i.e., Scenario 1) (Exhibit 20); as discussed below, since the biobased CNG would also qualify as an advanced biofuel under the federal Renewable Fuel Standard (RFS2) and as a low-carbon fuel under California’s Low Carbon Fuel Standard (LCFS), additional value in the form of credits would be associated with the CNG. Among the top ten dairy states, the avoided fossil natural gas cost ranges from $0.57/DGE in Texas, a natural gas production center, to $1.29/DGE in Washington State. The average is $1.03/DGE in the other forty states, resulting in a $1.02/DGE national average. Given the large dairy herd in California and the scale of operations, the state has the largest potential revenue from biomethane used as CNG, at $164 million annually in Scenarios 2 and 3, or just over one-quarter of the national total, based on 2012 natural gas prices. However, it should be noted that based on a conversation with an industry consultant experienced in the process of establishing digesters in California, it can be difficult to obtain the permits necessary to build and operate a digester. Additionally, for biomethane to be shipped in a non-dedicated pipeline to CNG stations, the
13
"Waste Management Expands Natural Gas-Powered Fleet and Opens Conroe CNG Fueling Station." PR Newswire. Waste Management, Inc., 11 May 2012. Web. 25 July 2012. <http://www.prnewswire.com/news-releases/waste-management-expands-natural-gas-powered-fleet-and-opens-conroe-cng-fueling-station-151129645.html>.

National Market Value of Anaerobic Digester Products
46
biomethane would have to meet the specifications of individual pipeline owners, which can be restrictive; for example, landfill gas is prohibited by law from being carried in such pipelines, due to concern over toxic contaminants (though these would not be present in biomethane from dairy manure). For the mid-valuation scenario, the potential revenue from biomethane used as CNG in the other nine top states ranges from $15 million in Colorado to $47.6 million in Idaho. The combined value in the other 40 states is $290 million.
Exhibit 20: Potential Annual Value of Fossil Natural Gas Displaced by Biomethane Used in CNG
Source: Informa Economics.
Under the high valuation scenario (Scenario 3), different amounts of CNG would be produced and the value of that production would vary accordingly. Under Scenario 2, in which it is assumed that plug-flow and complete mix digesters gain market share from covered lagoon models, potential national revenues from biomethane used to produce CNG would be $733 million and equal to the baseline scenario. Again, these are the values of avoided fossil natural gas usage based on 2012 prices; the additional value of credits related to RFS2 and the California LCFS which will be discussed subsequently.
StateAnnual CNG
Value ($)
Arizona 29,522,881
California 164,523,860
Colorado 15,394,922
Idaho 47,607,152
Michigan 27,582,460
New Mexico 24,757,170
New York 35,675,389
Texas 34,042,458
Washington 34,266,905
Wisconsin 30,088,601
Other 40 States 290,064,790
US Total 733,526,587

National Market Value of Anaerobic Digester Products
47
IV. VALUATION OF ECO-SYSTEM MARKET AND NUTRIENT PRODUCTS OF DIGESTERS
A. Tipping Fees
Dairy anaerobic digesters can receive organic substrate for tipping fees. As indicated earlier, these fees may raise revenue substantially for digester owners. Additionally, tipping fees represent the market value of costs to present producers of organic substrate waste materials who must dispose of such waste in landfills if not delivered to digesters. The economic benefits of delivering food waste to digesters is thus provided by the average tipping fee prices in each state, although the actual distribution of such benefits may partially accrue to waste producers in addition to digester operators. The tipping fee is normally referred to as the cost of waste disposal at a Municipal Solid Waste facility. Most tipping fees exist at a facility but the most commonly referenced tipping fee is the “spot market” tip fee (the drive-up cost to dispose of a single ton of MSW). Between 1985 and 1995, national tipping fees increased by $2.40 per ton per year (Exhibit 21). Tipping fees were relatively constant from 1995 to 2004. From 2004 to 2010 tipping fees increased $1.62 per year, in part due to higher fuel costs.

National Market Value of Anaerobic Digester Products
48
Exhibit 21: Municipal Solid Waste Landfill Tipping Fees
Source: National Solid Waste Management Association
Landfill tipping fees vary by state (Exhibit 22). For example, Michigan, Washington and Wisconsin have the highest tipping fees in the top dairy producing states with Idaho and Arizona having the lowest tipping fees. The majority of industry interviews indicate that digester owners receiving organic substrate should be able to receive the equivalent of landfill tipping fees in the states they are located in. The study uses 2008-2010 national and state level tipping fees as a basis for calculating national level tipping fees in 2020 which total $996 million. Using the state fees to calculate a national value gives a tipping fee average of $41.12 per ton of waste, which is slightly below the $43.99 national average in 2010. It should be noted that if tipping fees increase following past trends they would likely be much higher in 2020 (Exhibit 22).
8.20
10.92
16.11
19.12
23.01
26.32
32.19 31.81 32.1933.70 34.29
39.5040.56
42.10
43.99
0.00
5.00
10.00
15.00
20.00
25.00
30.00
35.00
40.00
45.00
50.00
1985 1986 1987 1988 1990 1992 1995 1998 2000 2002 2004 2007 2008 2009 2010
Do
llars
per
To
n

National Market Value of Anaerobic Digester Products
49
Exhibit 22: Average Recent Landfill Tipping Fees for Selected Dairy States
Source: National Solid Waste Management Association
Landfills are a major source of human-related methane in the United States, accounting for more than 20 percent of all methane emissions. Reducing, recovering, and recycling organic substrate diverts organic materials from landfills and incinerators, reducing GHG emissions from landfills and waste combustion. The use of recycled organic substrate (compost) has many environmental benefits such as: improving soil health and structure; increasing drought resistance; and reducing the need for supplemental water, fertilizers, and pesticides.14
14
EPA at http://www.epa.gov/osw/conserve/materials/organics/food/fd-basic.htm
24.06
35.00
30.47
24.13
64.00
28.00
44.69
27.80
52.65 52.00
0.00
10.00
20.00
30.00
40.00
50.00
60.00
70.00
Do
lla
rs p
er
To
n

National Market Value of Anaerobic Digester Products
50
B. Recovered Nitrogen (N), Phosphorus (P), and Potassium (K)
While the discussion thus far has focused on many of the primary products of anaerobic digesters, there are a number of co-products that have the potential to increase the returns to anaerobic digestion of dairy waste. The availability of these technologies varies among nutrients, but it has advanced substantially in recent years and there is still the potential for further advancements. Currently, the technical capability exists to remove nitrogen and phosphorus from digester effluent. However, to the authors’ knowledge there is no practical technology for removing potassium from the effluent of anaerobic dairy digesters; this is an area where additional research is ongoing. To remove nitrogen, the current technology frontrunner appears to be some form of ammonia stripping technology. While other options exist, they are not well suited to the physical properties of dairy digester effluent (high ammonia content, high suspended solids content, etc.). An added benefit of ammonia stripping technologies is that they generate a product that is familiar to many farmers in the form of ammonium fertilizers. Depending on the acid used in the process, this may be ammonium sulfate or ammonium nitrate. A separate process is used to recover phosphorus, which is recovered mostly in an organic form.15 Up to 80% of the phosphorus can be removed through a settling process. This product is high in calcium and magnesium that the phosphorus is bound to, along with some nitrogen, potassium, and micronutrients. The removal of phosphorus is important for many farmers with excessive levels of phosphorus on their fields where dairy waste has been land-applied for many years. Although the addition of organic substrate to an anaerobic digester has the potential to increase the amount of N and P available to be recovered following anaerobic digestion, doing so may also create nutrient management challenges. Farmers must carefully consider the expected increase in nutrients that they are bringing onto the farm by co-digesting products not already generated on their own farm. Further, the capture of these nutrients is not possible with all digester types; covered lagoons are not generally considered suitable candidates for recovery of nutrients using the practices described here. Assuming a recovery rate of 80% for phosphorus and 40% for nitrogen, dairy waste and the other organic substrate included in the digesters can generate 0.46 to 0.47 pounds of recovered nitrogen per cow per day and up to 0.15 pounds of recovered phosphorus per cow per day. It is assumed that there is no recovery of potassium.16
15
This is in contrast to commercial phosphorus fertilizers, which are typically in an inorganic form. 16
The technology for potassium recovery has not been adequately developed for application on a commercial scale at the time of the writing of this report.

National Market Value of Anaerobic Digester Products
51
One challenge of these fertilizer products is developing a market for selling the recovered N and P. Although these are both sources of nutrients that are familiar, the form of the N and P that are generated are not necessarily the same as the fertilizer product traded on world markets. For example, the nitrogen may be in a liquid form rather than a solid form, and the phosphorus is often in an organic form, much different from the commercial inorganic fertilizer that is typically purchased. Despite this, assuming a price of $1,411 per nutrient ton N and $2,984 per nutrient ton P in the mid-valuation scenario (Scenario 2) gives a valuation of $467 million for nitrogen and $324 million for phosphorus (Scenario 2) as a mid-point, with a range of valuation from $312 million (Scenario 1) to $964 million (Scenario 3) for nitrogen and $162 million (Scenario 1) to $418 million (Scenario 3) for phosphorus.
Nitrogen, Phosphorus, and Potassium and the Environment
Dairy farmers with and without anaerobic digesters must both deal with the nitrogen, phosphorus, and potassium that is concentrated in dairy waste. In most cases, these nutrients are stored in either wet or dry form before being land-applied. In this way, the nutrients are made available for the production of crops. In some cases, these crops are used to feed dairy cattle. Several important considerations related to nutrient management are relevant to anaerobic digestion. In the case where the nutrients are recovered separately in the form of N and P, the nutrient recovery process may allow the farmer to better target his nutrient application. (Using standard dairy manure, there is little the farmer can do to adjust the ratios of N, P, and K to match the existing soil nutrient profile or the ratio of these nutrients needed by a particular crop.) Dairy producers utilizing organic substrate in addition to dairy waste for anaerobic digestion must also consider that they are bringing additional N, P, K, and other nutrients onto their operation. These are nutrients that they will have to manage in addition to the waste nutrients generated on-farm. Depending on the farm situation, this could be an added benefit in terms of sales of recovered N, P, and K or it could be an additional management task necessary to ensure proper levels of nutrient application are maintained.

National Market Value of Anaerobic Digester Products
52
C. Value of Nutrient-Enriched Fiber as a Co-product of Anaerobic Digestion
1. Introduction
Digested fiber is one of the co-products of dairy anaerobic digestion and can provide additional value to a digester system, thus enhancing the Return on Investment (ROI) of the overall system. This section provides a description of digested fiber. It also provides differences between types of anaerobic digester systems and the value of the fiber for various applications. The value is then used to determine the potential size of the U.S. digested fiber market.
2. Overview
There are three main uses for anaerobic digested fiber from dairies. Digested fiber is used for animal bedding, land application to provide plant nutrients, and as a peat moss replacement. Adoption of an end use will depend on geographic location and on the current practices for the area. The table in Exhibit 23 shows the dairy bedding practices for select states. Recovery rates of digested fiber vary by digester type. Digested fiber is also assumed to be derived entirely from the dairy manure management. This means that a digester using 10% of its capacity for organic substrates, like food waste, will not see an increase in fiber production. All fiber production is based on recovery rates by technology type and on a per cow basis. This analysis uses a recovery rate of 9 cubic yards per cow for plug flow systems, 7 cubic yards per cow for complete mix systems, and no recoverable fiber for a covered lagoon system.
Exhibit 23: Bedding Practices for Select States
State Bedding Practice
California Sand, composted manure, rice hulls, and straw Idaho Dirt, straw, compost New York Sand, manure solids, shavings/sawdust Texas Sand, manure solids Washington Sand, sawdust Wisconsin Sand
Source: US Dairy Fiber Report, R. Alexander and Associates, January 12, 2012.

National Market Value of Anaerobic Digester Products
53
(a) Animal Bedding Interviews suggest that sand is the preferred bedding due to its cow comfort and management aspects. Interviews also confirmed that dairymen will not allow their manure management plan to dictate their cow care plans. One drawback of digested fiber is that when water is added to the bedding, it causes the fiber to become more difficult to manage. However, dairymen who currently use manure solids for bedding will be open to the use of digested fiber for bedding. Interviews also suggested that digested fiber from a plug flow system is preferred for bedding as it has a better pathogen kill rate. Even so, digested fiber from a complete mix system can be composted to kill residing pathogens and make the fiber more suitable for bedding. It should be noted that many farmers are already composting manure solids and using the compost for bedding purposes without the added expense of an anaerobic digester. (b) Field Application Field application is commonly used to discard current manure production on dairies. Likewise, digested fiber can be used as a soil amendment on farm ground. This is the lowest valued use of the fiber, but also requires fewer demands on management. In high moisture areas where digested fiber is not used for animal bedding, field application is common. In the analysis in this report, field application is used to calculate market potential for a portion of digested fiber that is unsuitable for either animal bedding or peat moss replacement. (c) Peat Moss Replacement Peat moss is basically organic material that has been broken down over time. Peat is mined and used as an organic material in multiple products including soil amendments, nursery mediums, and for wholesale applications. Peat moss is typically preferred over digested fiber because peat moss has a neutral PH rating, whereas digested fiber tends to be acidic. However, digested fiber has proven to be a substitute and both a literature review and interviews confirmed that it is being sold for this purpose. The analysis in the report assumes that only the digested fiber from a plug flow system will be used for the peat moss replacement, because this system typically provides the lowest pathogen counts and will thus be more suitable for this purpose.
3. Fiber Values
Fiber was valued for four different alternatives. These alternatives include animal bedding for on farm use as animal bedding, excess animal bedding to be sold, field application, and peat moss replacement. To determine the potential market size of the digested fiber industry digested fiber was allocated to its highest value but was constrained by uses specific to digester type and preference of end use by state. For, example animal bedding wasn’t used for higher moisture states such as Wisconsin. In Wisconsin, digested fiber produced from a modified plug flow system was valued
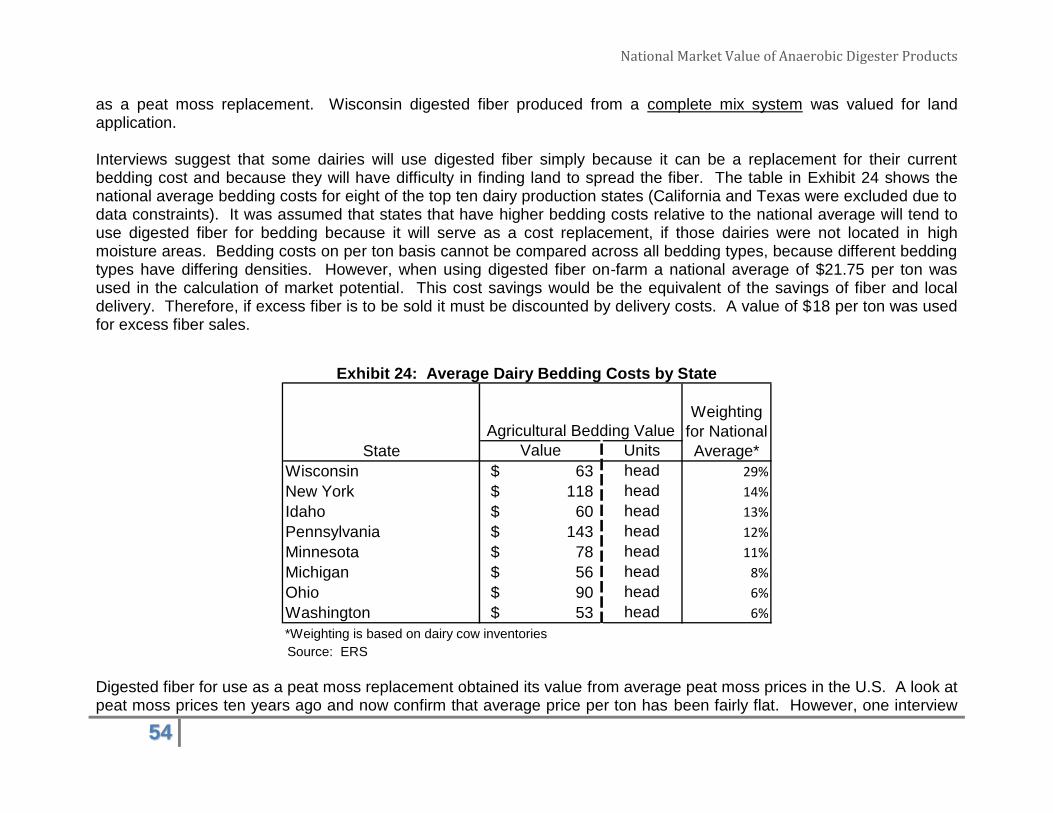
National Market Value of Anaerobic Digester Products
54
as a peat moss replacement. Wisconsin digested fiber produced from a complete mix system was valued for land application. Interviews suggest that some dairies will use digested fiber simply because it can be a replacement for their current bedding cost and because they will have difficulty in finding land to spread the fiber. The table in Exhibit 24 shows the national average bedding costs for eight of the top ten dairy production states (California and Texas were excluded due to data constraints). It was assumed that states that have higher bedding costs relative to the national average will tend to use digested fiber for bedding because it will serve as a cost replacement, if those dairies were not located in high moisture areas. Bedding costs on per ton basis cannot be compared across all bedding types, because different bedding types have differing densities. However, when using digested fiber on-farm a national average of $21.75 per ton was used in the calculation of market potential. This cost savings would be the equivalent of the savings of fiber and local delivery. Therefore, if excess fiber is to be sold it must be discounted by delivery costs. A value of $18 per ton was used for excess fiber sales.
Exhibit 24: Average Dairy Bedding Costs by State
Source: ERS
Digested fiber for use as a peat moss replacement obtained its value from average peat moss prices in the U.S. A look at peat moss prices ten years ago and now confirm that average price per ton has been fairly flat. However, one interview
State Value Units
Wisconsin 63$ head 29%
New York 118$ head 14%
Idaho 60$ head 13%
Pennsylvania 143$ head 12%
Minnesota 78$ head 11%
Michigan 56$ head 8%
Ohio 90$ head 6%
Washington 53$ head 6%
*Weighting is based on dairy cow inventories
Agricultural Bedding Value
Weighting
for National
Average*

National Market Value of Anaerobic Digester Products
55
suggested that the peat prices in the US had risen for the last two years, which have yet to be published by the United States Geological Service (USGS). The average price reported by the USGS includes both bulk and retail prices that are received by producers. This assumes that the same ratio of retail versus bulk sales is achieved by both the commercial peat moss producers and the digested fiber industry. Interviews suggested that at least some firms are developing their own retail brands, so it is reasonable that the retail price is obtainable for a portion of producers. The table in Exhibit 25 was published in March of 2012 and provides the most recent statistics from the USGS for peat production and prices in the U.S. A price of $23.04 per short ton, or nearly $8 per cubic yard, was used as the average digested fiber value as a peat moss replacement.
Exhibit 25: U.S. Peat Production and Price Statistics
Source: USGS The table in Exhibit 26 provides the fiber values and fiber revenue per cow for each of the modified plug flow and complete mix digestion systems for select states. This table combines the aforementioned data on value by end-use and
2006 2007 2008 2009 2010
United States:1
Number of active producers 39 38 37 38 38
Production 551 635 615 609 628
Sales by producers:
Quantity:
Bulk 525 590 546 559 554
Packaged 209 104 102 85 51
Total 734 694 647 r
644 605
Value 20,100 17,700 17,100 15,000 14,800
Average value dollars per metric ton 27.34 25.59 26.42 23.24 24.39
Average value, bulk do. 23.00 14.69 24.73 22.06 24.28
Average value, packaged or baled do. 38.28 30.64 36.24 31.01 26.48rRevised.
1Excludes Alaska.
(Thousand metric tons and thousand dollars unless otherwise specified)

National Market Value of Anaerobic Digester Products
56
allocates fiber to its feasible, highest and best use. The economic model for market size, in the next section uses these values with the adoption rate of digester type by state to generate the potential market size of the digested fiber industry.
Exhibit 26: Fiber Revenues by State
4. Market Size
Three scenarios were used to present the potential market size of U.S. digested fiber and these scenarios are consistent with the three scenarios used throughout this report. These scenarios provide a low, mid, and high estimate that also takes into account a consistent market share of each digester technology type (covered lagoon, plug flow, and complete mix). The market size for digested fiber is summarized by scenario in Exhibit 27. The market size for the Mid Valuation Scenario suggests the market potential for digested fiber is $217 million.
The low scenario uses similar assumptions and estimates, but allocates fiber to its lowest value of use, which is typically field application.
The High Valuations Scenario also uses similar assumptions and analysis, but assumes that all of the fiber is allocated to the highest value.
Region Average Fiber Price Per Ton Fiber Revenue per Cow Per Year Average Fiber Price Per Ton Fiber Revenue per Cow Per Year
ARIZONA 22.52$ 67.57$ 19.40$ 45.26$
CALIFORNIA 23.04$ 69.12$ 19.93$ 46.50$
COLORADO 22.52$ 67.57$ 19.40$ 45.26$
IDAHO 23.04$ 69.12$ 20.01$ 46.68$
MICHIGAN 23.04$ 69.12$ 18.00$ 42.00$
NEW MEXICO 22.52$ 67.57$ 19.40$ 45.26$
NEW YORK 22.52$ 67.57$ 20.01$ 46.68$
TEXAS 23.04$ 69.12$ 20.01$ 46.68$
WASHINGTON 23.04$ 69.12$ 20.01$ 46.68$
WISCONSIN 23.04$ 69.12$ 18.00$ 42.00$
Other 40 States 22.52$ 67.57$ 19.40$ 45.26$
Notes:
Only fiber from a plug flow system was considered for a peat moss replacement product.
States with high bedding costs tended to use fiber for bedding purposes
The exception was for areas with high moisture levels, in which fiber was excluded as a bedding material. These areas used fiber for either peat moss replacement or land application.
Peat moss replacement uses three year average values from the U.S. Geological Service (2008-2010) and were then discounted as digested fiber lacks the neutral PH that is found in peat moss.
Coverd lagoon's have are not represented as they do not produce recoverable fiber.
Due to data limitations, an average from the top ten states (by cow inventories) was used for Arizona, Colorado, New Mexico, and the other 40 states category.
Modified Plug Flow(Producing 9 cubic yards of recoverable fiber per cow per year)
Complete Mix(Producing 7 cubic yards of recoverable fiber per cow per year)

National Market Value of Anaerobic Digester Products
57
The Mid Valuation Scenario assumes that fiber will tend to be allocated to its highest use, except when physical barriers (A wet climate can prohibit adoption of digested fiber for bedding) or cost structure (dairies with high bedding costs will tend to consider fiber as a replacement) are likely to impact a producer’s decision. With these issues in mind, the Mid Valuation Scenario is closer to the high end of the estimate, but is considered a more likely outcome.
Exhibit 27: Market Size of the U.S. Digested Fiber Industry
Source: Informa Economics.
D. Carbon Credits, Renewable Energy Credits, and Renewable Identification Numbers
1. Carbon Credits
Methane, if allowed into the atmosphere, becomes a greenhouse gas (GHG) that is 21 times more polluting than the same amount of carbon dioxide. For this reason, animal agriculture, including commercial-scale confined animal dairy operations, has been identified as a significant source of GHGs. Courts have determined that the EPA is required to regulate GHG emissions under the broad provisions and authorities of the Clean Air Acts, so finding ways to reduce GHG emissions in animal agriculture has become important and also a potential source of profit for some dairy farmers – regulation provides for the existence of eco-system markets for GHG offset credits. The establishment of markets for GHG offsets provides a potentially powerful way to organize agricultural producers, including dairy farmers, to reduce GHG emissions by compensating them for doing so. Because it may be much more cost effective to reduce greenhouse gas emissions in dairy and other agricultural operations than in other, urban sources
ScenarioMarket Size
(Millions of US$)
Scenario 1: Low Valuation $181
Scenario 2: Mid Valuation $217
Scenario 3: High Valuation $231

National Market Value of Anaerobic Digester Products
58
of such emissions, regulations which provide for GHG offset markets can become profitable, additional sources of revenue for many farmers. Anaerobic digesters can provide a means for dairy farms to participate in potentially lucrative markets for GHG avoidance and sequestration. Although a federal-level effort to provide for an eco-system market for GHGs failed to come to fruition when the “Cap and Trade” legislation failed to pass Congress in 2009, voluntary markets for GHG offsets have developed, and California is in the process of establishing state regulations which will provide for a market for GHG offsets to develop. This market will allow California industries to compensate other GHG emission sources, including dairies outside of California, for reducing GHG emissions through certifiable practices such as the use of anaerobic digesters, providing a potentially significant source of revenue for digester operations.
2. Amount of Carbon-Equivalent Offsets
The total amount of carbon-equivalent offsets produced was provided the adapting the formula for converting dairy waste to carbon offsets in the AgSTAR report17 to include organic substrate. Organic substrate, because of its higher energy content, also produces more GHG emissions per pound than dairy manure as it rots, so the conversion factor for estimating the total production of GHGs is higher than it is for dairy manure alone.
3. Prices of Carbon-Equivalent Offsets
In the US, only voluntary markets for GHG emission reduction or sequestration have existed, and prices per MT of carbon equivalent gas have been less than $10 for most of the past decade. No national-level voluntary market presently exists for GHG emissions trading, but over-the counter activity still continues where private parties engage in commitments to perform emissions reduction practices or sequestration practices in exchange for compensation of some kind. Most of that activity is occurring in the $1 per MT of carbon equivalent gas, although there are instances of contracts for higher than $10. The estimate of $10 per MT of carbon equivalent gas has been given by numerous studies as a long-term equilibrium price of GHG offsets. This price has been assumed in the valuation calculations in this report. For comparison, USDA
17
“Market Opportunities for Biogas Recovery Systems at U.S. Livestock Facilities,” AgSTAR, EPA, pp. 5-6.

National Market Value of Anaerobic Digester Products
59
currently estimates the value of carbon credits for California’s cap and trade system to be $13 per MT. (California’s carbon trading system begins in 2013.) In the present analysis, $1 per MT is assumed as the low-valuation scenario for GHG offset credits. $10 is assumed as the most likely pricing scenario for GHG offset credits, which many economic studies have estimated is the long-term price of offsetting GHGs, inclusive of behavioral changes in economic activity to reduce GHG production. If regulation of GHGs is more aggressive and California’s model is emulated by other states, or even more aggressively in other countries than is already occurring, the demand for GHG offset credits will at least temporarily outstrip supply, driving the prices of such credits higher. In the longer term, changes in economic activity, including installation of digesters and other GHG-preventative measures, will expand the supply of such credits and drive prices down, but there may conceivably be several years of policy-driven expansion of eco-system markets such as California’s, thus potentially maintaining higher prices for GHG offsets. Although credit prices may be significantly higher at times, this report assumed an average GHG offset price of $25 per carbon equivalent metric tonne of gas that is certifiably not emitted due to anaerobic digester operations in the high-production scenario for digester eco-system market products.
E. Renewable Energy Credits (RECs)
Renewable energy credits are generated when electricity is the primary product produced using the biogas from the anaerobic digester. RECs are generally used by utilities to meet renewable portfolio standards or other state standards for the use of renewable feedstocks for production of electricity. Some states meet most of these requirements already with abundant wind or solar energy, while others do not have abundant sources of renewable electricity already being produced in their state. It is important to note that RECs are not generated for biogas that is used to produce pipeline quality biomethane or compressed natural gas. Therefore, the calculation of the number of RECs generated is straightforward. Using the electricity produced and a 0.001 REC per kilowatt-hour conversion, the average cow would produce 0.0081 to 0.0084 REC’s per cow per day (assuming previously described levels of organic substrate inclusion). This would amount to an annual REC production of 11.7 to 12.1 million RECs per year. While RECs are extremely sought after in some states with mandates that they be generated from a particular renewable energy source (e.g., solar in many cases), they are often less valuable in states without such a mandate. For that reason, for the mid-valuation scenario (Scenario 2) a REC price of $1 is assumed for all states except California. In California, RECs are assumed to have a value of $8.50 per MWh. For all states included, the generator of the REC is assumed to be the owner of the REC and is thus expected to receive the value of the REC. This gives an annual value of $17.2

National Market Value of Anaerobic Digester Products
60
million to $65.6 million for all RECs generated by dairy anaerobic digesters in the U.S., with a middle valuation expected to equal $34.4 million. However, the combination of electricity value and REC value must be considered for comparison to pipeline biogas and CNG plus Renewable Identification Numbers and California Low Carbon Fuel Standard Credits, along with the costs of these production pathways. For the low valuation scenario, it is assumed that mandatory markets for RECs remain weak and that other sources of RECs (e.g., wind, solar) continue to expand, causing prices by state fall to half of their current value ($0.50 per MWh for all states with the exception of $4.25 per MWh in California). For the high valuation scenario, it is assumed that the REC price increases to $3.00 per MWh for all states, with the exception of California, which is assumed to increase to $12.75 per MWh. REC credit values for each state and scenario are given in Exhibit 28.
Exhibit 28: Annual Renewable Energy Credit (REC) Values by State by Scenario Dollars
Note: Scenario 1 assumes the low end of prices Informa expects are possible, Scenario 2 assumes a middle value for prices and is the scenario that is the most likely of the scenarios presented, and Scenario 3 assumes a high value for prices that is at the upper end of the values Informa expects are possible. Source: Informa Economics.
State
Scenario 1:
Annual RECs
Value, Total for
All ADs
Scenario 2:
Annual RECs
Value, Total for
All ADs
Scenario 3:
Annual RECs
Value, Total
for All ADs
Arizona 180,327 360,655 1,081,964
California 12,839,263 25,678,526 38,517,789
Colorado 128,022 256,045 768,135
Idaho 364,614 729,228 2,187,683
Michigan 205,654 411,309 1,233,926
New Mexico 241,949 483,898 1,451,694
New York 264,328 528,657 1,585,971
Texas 443,346 886,693 2,660,078
Washington 197,858 395,716 1,187,147
Wisconsin 233,161 466,322 1,398,965
Other 40 States 2,080,849 4,161,698 13,570,181
US Total 17,179,372 34,358,745 65,643,532

National Market Value of Anaerobic Digester Products
61
F. Renewable Identification Numbers (RINs) and Low Carbon Fuel Standard Credits
1. Renewable Identification Numbers
The federal Renewable Fuel Standard (RFS) was established by the Energy Policy Act of 2005 and expanded significantly by the Energy Independence and Security Act of 2007 (subsequently referred to as RFS2). RFS2 consists of usage mandates for several categories of renewable fuels: cellulosic biofuels, biomass-based diesel, total advanced biofuels and total renewable fuels. The usage mandates are “nested,” in that cellulosic biofuels and biomass-based diesel both count toward the total advanced biofuels mandate, and advanced biofuels count toward the total renewable fuel mandate. The total advanced biofuels mandate exceeds the sum of the cellulosic biofuels and biomass-based diesel standards, by an amount that increases steadily through 2022, at which time this “undifferentiated” advanced biofuels allocation reaches approximately 3.5 billion gallons (after adjusting for the energy equivalence value of biomass-based diesel). Renewable CNG generally qualifies toward this undifferentiated advanced biofuels requirement, as long as it meets the 50% greenhouse gas reduction criterion for advanced biofuels (60% in the case of cellulosic biofuels). The Environmental Protection Agency (EPA) is the federal agency charged with implementing and enforcing RFS2. The EPA developed a system of Renewable Identification Numbers (RINs) as the means for tracking renewable fuel volumes and ensuring compliance with RFS2. According to the U.S. Department of Agriculture (USDA), “The [RIN] system was developed by the EPA to ensure compliance with RFS2 mandates. A RIN is a 38-character numeric code … that corresponds to a volume of renewable fuel produced in or imported to the United States. RINs are generated by the producer or importer of the renewable fuel. RINs must remain with the renewable fuel as the renewable fuel moves through the distribution system and as ownership changes. Once the renewable fuel is blended into motor vehicle fuel, the RIN is no longer required to remain with the renewable fuel. Instead, the RIN may be separated from the renewable fuel and then can be used for compliance, held for future compliance, or traded. RINs are the basic units for RFS2 compliance.”18 Furthermore, “Each year, obligated parties are required to meet their prorated share of the RFS mandates by accumulating RINs, either through fuel blending (with renewable fuels) or by purchasing RINs from others.” As mentioned above, if biomethane from anaerobic digesters operated by dairies is to be used on a broad scale, usage will need to go beyond vehicles owned by the dairies, and this will generally necessitate the use of pipelines to carry
18
McPhail, Lihong, Paul Westcott, and Heather Lutman. The Renewable Identification Number System and U.S. Biofuel Mandates. BIO-03. U.S. Department of Agriculture, Economic Research Service, Nov. 2011. Web. 25 July 2012. <http://www.ers.usda.gov/media/138383/bio03.pdf>.

National Market Value of Anaerobic Digester Products
62
biomethane to CNG stations. The EPA has devised specific rules that must be followed if RINs are to be generated for such CNG:
“(11)(i) For purposes of this section, renewable electricity or biogas that is introduced into a commercial distribution system may be considered renewable fuel and the producer may generate RINs if: (A) The fuel is produced from renewable biomass and qualifies for a [RIN] code … or has received approval for use of a [RIN] code by the Administrator; (B) The fuel producer has entered into a written contract for the sale of a specific quantity of fuel derived from renewable biomass sources with a party that uses fuel taken from a commercial distribution system for transportation purposes, and such fuel has been introduced into that commercial distribution system (e.g., pipeline, transmission line); and (C) The quantity of biogas or renewable electricity for which RINs were generated was sold for use as transportation fuel and for no other purposes. (ii) For biogas that is introduced into a commercial distribution system, the producer may generate RINs only for the volume of biogas that has been gathered, processed, and injected into a common carrier pipeline if: (A) The gas that is ultimately withdrawn from that pipeline for transportation purposes is withdrawn in a manner and at a time consistent with the transport of fuel between the injection and withdrawal points; and (B) The volume and heat content of biogas injected into the pipeline and the volume of gas used as transportation fuel are measured by continuous metering. (iii) The fuel used for transportation purposes is considered produced from renewable biomass only to the extent that: (A) The amount of fuel sold for use as transportation fuel matches the amount of fuel derived from renewable biomass that the producer contracted to have placed into the commercial distribution system; and

National Market Value of Anaerobic Digester Products
63
(B) No other party relied upon the contracted volume of biogas for the creation of RINs.”19
Furthermore, under the RFS2 regulations, the entity that produces the transportation fuel is the one that generates the RIN. In cases where the dairy operation produces CNG, it will generate the RIN and can thereby capture its full value. However, if biomethane from a dairy operation is sold and transported via pipeline to a CNG station that is separately owned, and the station performs the compression into CNG, it is understood that the CNG station would generate the RIN. In this latter case, the dairy might only get a portion of the value of the RIN, determined through negotiation between the dairy and the CNG station. For purposes of this section of the report, it is assumed that the dairy receives the full value of the RIN, since there are no publicly reported transactions on which to base an assumption as to what percentage of the RIN price the dairy would receive as a premium for biomethane over the price of fossil natural gas. RINs for CNG are generated at a ratio of one RIN for every 77,000 Btu, based on EPA regulations. This is roughly equivalent to the amount of energy in one gallon of ethanol, which was essentially the standard unit of renewable fuel in the original Renewable Fuel Standard established by the Energy Policy Act of 2005. Note that this means that more RINs are generated from the CNG produced by the 2,647 dairy digesters than the number of DGEs of CNG. If the biogas produced from all 2,647 digesters considered in this study were converted into CNG, it would generate 1.3 billion RINs. On average from January through July 2012, advanced biofuel RINs generated during 2012 were trading for $0.766 each, leading to a value for all RINs associated with CNG of $1.01 billion for Scenario 2 (Exhibit 29). Thus, the value of the RINs would be greater than the value of the natural gas displaced in CNG production by biomethane from dairies, assuming that the value of advanced biofuel RINs remains at 2012 levels. In 2011 and the first part of 2012, a large majority of the RFS2 allocation to undifferentiated advanced biofuels has been met through the importation of sugarcane-based ethanol produced in Brazil. For the last couple of years, Brazil has been experiencing shortfalls in the production of sugarcane, and as a result of this and periodic high prices of sugar, ethanol production has been constrained. As a result, the price of Brazilian sugarcane-based ethanol has been high relative to historical levels and to U.S.-produced ethanol, and advanced biofuel RIN prices have been high as well. While Brazilian ethanol prices might revert lower over the course of the next few years, it is not known if the volume of Brazilian ethanol and other advanced biofuels will be sufficient to meet the 3.0-billion-gallon RFS2 allocation to undifferentiated advanced
19
40 CFR, part 80, subpart M, § 80.1426 <http://ecfr.gpoaccess.gov/cgi/t/text/text-idx?c=ecfr&sid=bff4e5af12a652a39b1d83fb4cb43374&rgn=div6&view=text&node=40:17.0.1.1.9.13&idno=40>

National Market Value of Anaerobic Digester Products
64
biofuels in 2020 or the 3.5-billion-gallon allocation in 2022, and as a consequence it is difficult to predict whether advanced biofuel RIN prices might be lower at the end of the decade than they are currently. (It is also possible that the U.S. Congress will modify RFS2 before the end of the decade.)
Exhibit 29: Full Annual Value of RINs Generated Through Production of CNG from Dairy Biomethane
Source: Informa Economics.
Given the potential CNG production by state, the highest RIN value is in California, totaling $260 million annually. This is approximately $100 million less than the value of RINs generated from CNG in all states combined outside the top ten dairy states. Among the top ten, the second-highest RIN value is in Texas, at $76 million, while the lowest is in Colorado, at $22 million.
2. Credits Generated under California’s Low Carbon Fuel Standard (LCFS)
Following enactment of the California Global Warming Solutions Act of 2006 (Assembly Bill No. 32) requiring limits on statewide GHG emissions by 2020, California Governor Arnold Schwarzenegger in early 2007 issued Executive Order S-01-07, which established a statewide goal of reducing the carbon intensity (CI) of California’s transportation fuels by at least 10% by 2020. The order specifically tasked the state Air Resources Board (ARB) with establishing and implementing a Low Carbon Fuel Standard for transportation fuels in California. The ARB undertook a large-scale rulemaking process, and on April 23, 2009, it approved the adoption of the LCFS.
State
Scenario 2:
Annual RIN
Value ($)
Arizona 31,098,919
California 260,498,324
Colorado 22,078,512
Idaho 62,880,620
Michigan 35,466,776
New Mexico 41,726,076
New York 45,585,606
Texas 76,458,710
Washington 34,122,185
Wisconsin 40,210,490
Other 40 States 358,859,389
US Total 1,008,985,605

National Market Value of Anaerobic Digester Products
65
Under the LCFS, the CI of gasoline, diesel and substitute fuels will have to be reduced 10% by 2020. The reduction is gradual at first, starting in 2011 at 0.25%, but it becomes steeper in each subsequent year, reaching 10% by 2020. Credits and deficits are calculated for each type of fuel based on its CI score. According to the ARB, “A fuel that has a CI that is below the target in a given compliance period generates credits; conversely, a fuel with a CI above the target will generate a deficit. For a given annual compliance period, a regulated party’s overall credit balance is determined by adding up all the quarterly deficits and credits assessed to that party, and an overall negative balance at the end of the year results in a shortfall that needs to be reconciled. Reconciliation can be accomplished by purchasing credits off the market, surrendering credits that the regulated party already has in hand, or by any other means prescribed in the regulation.”20 CNG from dairy digester biogas is estimated by the ARB to have one of the lowest CIs of any fuel available, at 13.45 grams of carbon dioxide equivalent per mega joule of energy (gCO2e/MJ), compared to an average of 94.71 gCO2e/MJ for ultra-low-sulfur diesel on average in California. Given that the reduction schedule for diesel targets a reduction to 85.24 gCO2e/MJ in 2020 and subsequent years, CNG from biogas will continue to generate substantial credits as long as the LCFS is in effect under its current structure. As a result, not only would California have the highest value by far of any state for biogas used to produce CNG and for the RINs that would be generated from its production, but renewable CNG would have significant additional value under California’s LCFS due to the credits it generates. According to the ARB, in the first quarter of 2012 LCFS credits traded for an average $24 per metric ton of CO2 equivalent.21 Based on the formula specified by the ARB for determining the number of credits generated for a specific fuel in a given year, as well as the energy content of one DGE, the average credit value in 2012 is equal to $0.21/DGE. If all biogas produced from anaerobic digesters operated by dairies in California was converted into CNG, the value of LCFS credits would be $42.6 million annually in the mid-valuation scenario, based on 2012 credit prices. Although credit trading has been thin as the LCFS has begun and initial CI reductions have not been steep, it is likely that credit prices will
20
Low Carbon Fuel Standard Question and Answer Guidance Document. California Air Resources Board, 10 June 2011. Web. 25 July 2012. <http://www.arb.ca.gov/fuels/lcfs/LCFS_Guidance_(Final_v.1.0).pdf>. 21
2012 LCFS Reporting Tool (LRT) Quarterly Data Summary – Report No. 1. California Air Resources Board, 22 June 2012. Web. 25 July 2012. <http://www.arb.ca.gov/fuels/lcfs/20120625_q1datasummary.pdf>.

National Market Value of Anaerobic Digester Products
66
rise as the decade proceeds, as CI reductions intensify and the availability of sufficiently low-CI fuels is questionable (i.e., significant technological and production advancements will likely need to take place for LCFS targets to be met). However, it should be noted that the status of the LCFS is in limbo as of the writing of this report due to lawsuits filed by the ethanol industry (via the Rocky Mountain Farmers Union) and the petroleum industry (led by the National Petrochemical & Refiners Association, now known as the American Fuel & Petrochemical Manufacturers). In December 2011, Judge Lawrence O’Neill of the United States District Court in Fresno ruled that the LCFS violates the Commerce Clause of the U.S. Constitution and granted an injunction against enforcement of the standard. In early 2012, the State appealed the decision to the U.S. Court of Appeals for the Ninth Circuit, which subsequently issued a stay on Judge O’Neill’s injunction; however, the ultimate fate of the LCFS is not known as of the writing of this report.
3. Total Value of CNG Including RINs and LCFS Credits
Including the value of fossil natural gas displaced, RINs and California LCFS credits, the total value of CNG produced by the 2,647 dairy digesters considered in this report would be $1.79 billion annually in the mid-valuation scenario (Scenario 2). An estimated $468 million would be generated in California alone, equivalent to almost one-third of the national total, as a result of the volume of biogas that could be produced by the industry in the state, as well as CNG qualifying for both RINs and LCFS credits. This total value relies on several key assumptions. First, it assumes that all operators of anaerobic digesters on dairies would be able either to produce and use/sell CNG on their farms or that they would have economical access to pipelines to transport biomethane to a sufficient number of CNG stations willing to buy the product. Second, it assumes that dairy operations would receive the full value of RINs generated, and that advanced biofuel RIN prices will be sustained. Finally, it assumes that California’s LCFS will remain in effect and not be discontinued as a result of lawsuits, though the value of the LCFS credits is a relatively modest share of the overall value of CNG, at least at current LCFS credit prices.
G. Total Valuation of Digester Products
Based on the calculations and assumptions described, the volumes of production and total values of production are provided in Exhibit 30. This provides insights into similarities and differences among scenarios, and is easier to compare regardless of the number of cows in a state. This table also provides useful information for dairies considering adding anaerobic digesters, as additional revenues can be compared to the number of cows on a farm where an anaerobic digester is being considered.

National Market Value of Anaerobic Digester Products
67
There are some differences within states for these valuations, as a whole the U.S. totals suggest that the valuation per cow per day is $0.62 for electricity + RECs and $1.34 per cow per day for soil amendments and eco-system and other products. This gives a total value for Scenario 2- Mid Valuation of $1.96 per cow per day. Although the potential values for the products and associated co-products in all three scenarios are provided in Exhibit 30, there is a substantial range of the expected total value, ranging from $0.91 to $3.16 per cow per day. On a state by state basis, the low values go down as low as $0.48 per cow per day, and the high values range up to $4.87 per cow per day.

National Market Value of Anaerobic Digester Products
68
Exhibit 30: Potential Production and Value of Products and Co-Products for 2,647 Dairy Anaerobic Digesters, Per Cow per Day
Source: Informa Economics.
Scenario 1:
Low
Valuation
Scenario 2:
Mid
Valuation
Scenario 3:
High
Valuation
Units
Scenario 1:
Low
Valuation
Scenario 2:
Mid Valuation
Scenario 3:
High Valuation
Inputs and AssumptionsNumber of Cows NA NA NA NA NA NA
Manure 150 150 150 lbs/cow/day NA NA NA
Organic Substrate/ Tipping Fees 27 27 29 lbs/cow/day $0.18 $0.40 $0.49
OutputsElectricity Production 8.1 8.1 8.3 kWh/cow/day $0.24 $0.62 $0.92
Co-Products
Recovered Nitrogen (N) 0.46 0.46 0.47 lbs N/cow/day $0.21 $0.32 $0.66
Recovered Phosphorus (P) 0.15 0.15 0.15 lbs P/cow/day $0.11 $0.22 $0.29
Recovered Potassium (K) - - - lbs K/cow/day - - -
Nutrient Enriched Fiber 0.02 0.02 0.02 yd3 fiber/cow/day $0.12 $0.15 $0.16
GHG Offset Credits 54 54 55 Potential lbs carbon
offset credits/cow/day$0.02 $0.24 $0.62
RECs (Produced only when
electricity is primary product
produced)
0.0081 0.0081 0.0083 RECs/cow/day $0.004 $0.01 $0.02
SubtotalsElectricity + RECs $0.25 $0.62 $0.94
Soil Amendment, Eco-System,
and Other Products$0.66 $1.34 $2.22
Total $0.91 $1.96 $3.16
Volume Dollars per Cow Per Day

National Market Value of Anaerobic Digester Products
69
V. NET PRESENT VALUE OF A NATIONAL INVESTMENT IN ANAEROBIC DIGESTERS IN THE DAIRY INDUSTRY
This report estimates the return on investment to the country as a whole for an investment in digesters on large dairy farms. A net present value was calculated where the present value of 15 years of net operating revenue (discounted at a 3% annual risk free rate) was subtracted from the initial, estimated capital expenses of building 2,647 digesters on large dairy operations. Net Present Value (NPV) is a means of determining whether an investment is a good one compared to alternative investment options, usually compared to a risk free investment in US government securities. Net present value requires three estimated variables – initial capital costs, per period operating costs, and per period revenues. The values of these variables are discounted by the expected rate of return of a given alternative investment, such as the yield of a 10-year US government bond. The internal rate of return (IRR) is the rate at which the NPV of the investment is zero, i.e., the rate at which an investor may judge an investment in a dairy digester relative to an alternative investment that has been similarly discounted for financial risk. The financial analysis indicates that without being able to produce and market fiber, soil nutrient, and/or eco-system market products, the return on an investment in digesters for energy production only remains low to negative. This is consistent with the experience of digester operations in the US thus far. However, the incremental investment and operations expenses in nutrient stripping and fiber separation and preparation provides very significant returns, and combined with the returns of a digester system the mid-range pricing scenario provides for an internal rate of return (IRR) of 38%. Capital Expenses. Exhibit 31 provides the estimated capital expenses to install digester systems in 2,647 dairies, as
given in the three scenarios provided for in this report, for each of three production path options, electricity, pipeline natural gas, and CNG. The figures are given in total for 2,647 digesters and on a per cow average basis.

National Market Value of Anaerobic Digester Products
70
Exhibit 31: Capital Expenses for Digester Systems on US Dairies
Source: Informa Economics.
Operating Costs. Exhibit 32 provides the estimated operating costs accumulated on a national basis and a per cow
average basis. Operating expenses for gas production are higher than those shown in the chart for electricity production.
Exhibit 32: Operating Expenses for Digester Systems on US Dairies
Source: Informa Economics.
Net Present Value (NPV). Exhibit 33 displays the estimated NPV of investing in 2,647 anaerobic digesters on large US dairy farms. The estimates are provided as US totals and on a per cow average basis. The per cow figure provides a convenient comparison with other investments in dairy operations which are frequently analyzed with respect to a per cow borrowing base by lenders. Exhibit 34 provides the same information reported as an IRR.
Capital ExpensesScenario 1: Low
Valuation
Scenario 2: Mid
Valuation
Scenario 3:
High Valuation
Scenario 1:
Low Valuation
Scenario 2: Mid
Valuation
Scenario 3:
High Valuation
Energy Generation (Electrical) $5.18 $5.18 $5.18 $1,302 $1,302 $1,302
Soil Amendments and Eco-
System Markets $1.26 $1.26 $1.26 $317 $317 $317
Total $6.44 $6.44 $6.44 $1,619 $1,619 $1,619
Per Cow ($US)Total ($US Billions)
Operating ExpensesScenario 1: Low
Valuation
Scenario 2: Mid
Valuation
Scenario 3:
High Valuation
Scenario 1:
Low Valuation
Scenario 2: Mid
Valuation
Scenario 3:
High Valuation
Energy Generation (Electrical) $0.31 $0.31 $0.31 $79 $79 $79
Soil Amendments and Eco-
System Markets $0.06 $0.06 $0.06 $16 $16 $16
Total $0.38 $0.38 $0.38 $95 $95 $95
Total ($US Billions) Per Cow ($US)

National Market Value of Anaerobic Digester Products
71
Exhibit 33: Net Present Value of Investment in 2,647 Digester Systems in US Dairies
Source: Informa Economics.
Exhibit 34: Internal Rate of Return (IRR)22
Source: Informa Economics.
22
The internal rate of return (IRR) figures presented in this report do not include tax payments because they represent a national-level investment in digesters and the return to the US economy as a whole, as does the original EPA AgSTAR report on which the present study is based. Firm-level IRRs would have to be calculated for individual producer operations to derive the equivalent return for individual dairy producers.
NPVScenario 1: Low
Valuation
Scenario 2: Mid
Valuation
Scenario 3:
High Valuation
Scenario 1:
Low Valuation
Scenario 2: Mid
Valuation
Scenario 3:
High Valuation
Energy Generation NPV $10.29 $16.60 $21.83 $2,590 $4,177 $5,494
Soil Amendments and Eco-
System Markets NPV $23.42 $34.35 $48.65 $5,892 $8,643 $12,242
Total NPV $19.15 $36.39 $55.92 $4,818 $9,156 $14,072
Total ($US Billions) Per Cow ($US)
IRRScenario 1: Low
Valuation
Scenario 2: Mid
Valuation
Scenario 3:
High Valuation
Energy Only IRR Negative Cash Flow 8% 19%
Soil Amendments and Eco-
System Markets IRR 71% 148% 249%
Aggregate IRR 12% 38% 65%

National Market Value of Anaerobic Digester Products
72
VI. ENVIRONMENTAL SUSTAINABILITY
The Innovation Center for U.S. Dairy partnered with the Boston-based engineering research firm Quantis to provide analysis of the environmental benefits of anaerobic digesters in U.S. dairies based on the economic scenarios provided in this report. The purpose was to quantify, in terms of GHG credits, the net environmental benefits of diverting organic substrates to digesters instead of landfills, as explained in the discussion of organic substrate feedstocks in sections II.E, II.F, and IV.A, above. The analysis by Quantis is included in its entirety in Appendix II of this report.23 The key findings from the report are listed below with only minor edits from the original report.
Diversion of Organic Substrates from Landfills to Digesters Provides Net Environmental Benefits
The diversion of organic substrates from landfills provides the largest environmental benefit of digester use of such substrates in addition to dairy manure, estimated to be a net 13 million metric tonnes of CO2-equivelent gas not emitted into the atmosphere. US EPA (2012b) reports that 38% of landfill methane is emitted directly to air, and avoiding this release provides substantial credits to the digester plus avoided landfill system.
The second largest carbon credit (ranging from 4 to 5 million metric tonne CO2-eq.), is due to using the biogas
harvested from digesters to replace natural gas, diesel fuel, or electricity production. Digester systems are credited for products that they offset. For example, when the harvested biogas is used for electricity, the digester system is credited with the impacts of average US grid electricity generation that have been avoided from fossil-based or other sources.
To ensure proper accounting of net environmental benefits attributable to digesters, all impacts associated with the
generation of electricity from biogas must be assigned to the digester system if the benefits of avoiding conventional electricity production are credited to it. The impacts of producing the biogas and then using it (converting it to electricity or burning it in place of diesel) appear as negative contributions to the total benefits.
23
Quantis’s analysis was based on an earlier definition of scenarios for digester production that was based on different distributions of digester technologies. Scenario 2 of Quantis’s report in Appendix II is identical to the distribution of digester technologies among the 2,647 large dairies contained in this report, with minor adjustments for quantities of feedstocks obtained subsequent to Quantis’s analysis.

National Market Value of Anaerobic Digester Products
73
Landfill gas is already harvested from landfills at a rate of roughly 28%, and largely converted to electricity. When food waste is diverted from landfills, that beneficial use of the landfill gas is lost, offsetting gains from that use by digesters. This loss of recovered landfill gas to energy provides the largest detrimental carbon impact to the digester plus avoided landfill system (1.4 million metric tonnes of GHGs.).
Finally, during the digestion process, nitrogen and phosphorous are recovered, and as a result the digester systems
are credited with the avoided impact of average nitrogen and phosphorous fertilizer production in US. The net benefit (the difference between digestion and landfill) is 15-16 million metric tonnes of CO2-eq. This equates
to 2% of the U.S. annual methane emissions or to taking 3.2 million U.S. passenger cars off the road for a year.
Only Electrical Production Produces Net Positive GHG Offset Benefits for Diverting Organic Substrates from Landfills.
As explained above, digesters can produce electricity, pipeline biomethane, or CNG, but not all of the energy production possibilities provide the same environmental benefits. Electrical production is the only energy production option which provides net environmental benefits from diverting organic substrates from landfills. Landfill of food waste generates environmental damage for almost all environmental categories except fossil fuel
depletion. (The use of harvested landfill gas for electricity and heat avoids the fossil fuel depletion associated with conventional sources for electricity and heat, thus causing this benefit.) In contrast to landfills, digestion of food waste causes benefits for most environmental categories.
The use of biogas for biomethane or compressed natural gas generates negative tradeoffs with respect to fossil fuel depletion. The reason for these tradeoffs is that some landfill gas is already used to offset electricity production. As average U.S. electricity production uses large amounts of fossil fuels, offsetting electricity production provides a significant benefit for the landfill option that needs to be discounted from the benefits attributable to using the same, diverted organic substrates in digesters. When digester gas is not used for electricity production, it does not reduce the use of fossil fuels to the same extent.

National Market Value of Anaerobic Digester Products
74
VII. EVALUATING THE ENVIRONMENTAL NUTRIENT MANAGEMENT BENEFITS OF SEQUESTRATION TECHNOLOGIES IN ANAEROBIC DIGESTER SYSTEMS
This chapter evaluates the economic and environmental advantages of an investment in 2,647 dairy digesters on large, confined animal operations in the US dairy industry. Without digesters installed, confined animal feeding operations must store manure effluent in lagoons and dispose of such waste as manure fertilizer on nearby fields.
A. Background
Because of the low level of nutrients per mass of waste material as well as the watery slurry form of such material, it is relatively costly to transport manure effluent very far from the dairy operation where it was produced as stored.
The installation of a digester system allows for offsetting the costs of waste management by producing energy in the form of biogas, which can be transformed into electricity or marketable methane gas. Such energy production can be increased by accepting additional organic substrates produced elsewhere as digester feedstock as described in preceding chapters of this report.
However, accepting additional organic substrates may potentially compound the waste disposal problem of dairy farms if the product of digestion systems is not able to economically market or otherwise dispose of the effluent and other nutrient outputs of digester systems.
The development of nutrient harvesting technologies potentially solves the problem by providing a means of transforming the nutrients in manure and organic substrate waste effluent, post-digestion, into more easily used and measured fertilizer products that can be distributed to crops more economically because of their higher nutrient to mass levels.
As a result, digesters with nutrient harvesting technologies provide a solution to two outstanding problems in commercial scale dairy operations. Digesters with nutrient harvesting technology reduce the total amount of manure waste effluent that must be spread
on nearby cropland under nutrient management supervision of the EPA.

National Market Value of Anaerobic Digester Products
75
Digesters with nutrient harvesting technologies offset the production of mineral-based nutrient fertilizers that must be brought into crop areas to supplement the nutrients not provided by manure effluent spreading alone.
Exhibit 35 indicates how nutrients pass through dairy waste systems in the three forms reviewed in this chapter: lagoon-only systems; digesters without nutrient separation technologies; and digesters with nutrient separation technologies. In lagoon-only waste management systems, virtually all nutrients in the manure must be applied to crops in the effluent. However, because digester systems, unlike lagoon systems, can use organic substrates to supplement manure, the effluent remaining to be land-applied from digester systems actually contains more nutrients than lagoon-only systems, unless nutrient separation technologies have also been installed.
Exhibit 35: Nutrient Amounts (MT/year) In Feedstock and Effluent Per 1,000 Cows24
Source: Frear et al, 2011, Clean – Soil, Air, Water 2011, 39 (7), 697–704
24
These NPK ratios are molecular weight estimates; phosphate or potash estimates as is typically given in commercial fertilizer.
Nitrogen (N) Phophorus (P) Potassium (K)
Approximate
NPK Ratio
Lagoon OnlyManure
EffluentFeedstock/Effluent 112 17 112 7:1:7
Organic
Substrate
Addititions
Feedstock from
Organic Substrates116 9 15 13:1:2
Manure
Plus
Organic
Substrate
Feedstock
Total Digester
Feedstock228 26 127 9:1:5
Digester
w/o Nutrient
Recovery
Effluent Nutrient
Content177 24 123 7:1:5
Digester w/
Nutrient
Recovery
Effluent Nutrient
Content82 7 114 12:1:16
Digesters
National Market Value of Anaerobic Digester Products
76
B. Approach
The strategy for this evaluation was to incrementally show the advantages of installing digester systems compared to a base case of lagoon-only storage of animal waste. The four incremental scenarios are as follows: A) Baseline case of manure storage in lagoons without digesters B) Buying fertilizer in addition to manure effluent from lagoons that is spread on cropland C) Lagoon plus anaerobic digester system D) Lagoon plus anaerobic digester with nutrient sequestration technology. In each scenario, economic and environmental impacts of are evaluated. This allows for a decomposition of the values of the various key elements of digester systems, including emerging technologies that allow for the harvesting (sequestration) of more usable forms of fertilizer nutrients so they may be more easily stored and transported. This use of technology for nutrient capture can thus provide revenue streams instead of costs for dairy operations trying to comply with environmental constraints.
Metrics
A standard metric is needed to compare the environmental and economic benefits of digesters and nutrient recovery technologies to dairy farmers relative to the alternative of having no digesters. Finding such a metric is complicated by differing dollar values of digester products and different costs of waste management at the state and even farm levels as well as the different ways individual farming operations actually resolve the effluent disposal issues due to different soils and crops around each dairy operation. To resolve this, Informa’s strategy was to use acreage on which remaining effluent waste must be spread as the standardized metric for comparison of the four scenarios, and to standardize the other, farm level parameters at the state level through identifying the acreage distribution of the top three crops in each state upon which dairy operations are likely to have to dispose of manure effluent. By doing it this way, lower acreage levels for disposing of manure or digester effluent are the metric for estimating the benefits to the environment and to dairy farmers of digester and nutrient recovery investments. The EPA regulates point source emissions directly, which provides for both direct imposition of costs of environmental
protection on confined animal dairy operations typical of most large dairies as well as a means of estimating the benefits to such dairy operations for investing in digesters and nutrient recovery technologies.

National Market Value of Anaerobic Digester Products
77
Although the costs, and therefore benefits, of nutrient waste management vary considerably at the farm level so should not be taken as individual farm-level estimates, using a standard, state-level average distribution of acres and crops allows for an honest comparison of the benefits of digesters versus lagoon-only nutrient waste management systems and nutrient recovery technology versus both digester-only systems and lagoon-only systems.
Some simplifying assumptions were made to estimate the amount of nutrients that could be spread on neighboring cropland as well as the amount of additional nutrients required to fill in the nutrient gaps which lagoon or digester effluent leave. One key assumption was use of the acreage in 2011 for the top three crops in each state which were deemed close enough to dairy producers to be practical for field application of waste. With few exceptions, alfalfa, corn, and either wheat or soybeans were among the top three crops, but in reality there may be somewhat greater capacity to spread effluent more optimally on a greater number of crops. Cotton and non-alfalfa hay were also among the top three crops in some states. Based on the distribution of acres of the top three crops in each state, the nutrient needs per acre are given in Exhibit 36. It is assumed in this report that nutrient applications of nitrogen and phosphorus above these levels will result in harm to water resources. This is obviously a gross over-simplification of the actual soil processes on each farm, but it provides a high-level examination of the incremental value of digesters and nutrient separation technologies.
Exhibit 36: Assumed Nutrient Usage per Acre Based on Top Three Crops per State
Source: Informa Economics.
State
Annual N
Required
Per Acre
(Lbs)
Annual P
Required
Per Acre
(Lbs)
Annual K
Required
Per Acre
(Lbs)
Arizona 37 20 97
California 36 16 92
Colorado 70 16 42
Idaho 58 14 52
Michigan 60 20 68
New Mexico 41 19 87
New York 56 13 56
Texas 80 11 27
Washington 74 12 34
Wisconsin 75 21 69
Other 40 States 78 21 52
US Total 56 17 68

National Market Value of Anaerobic Digester Products
78
C. Summary of Conclusions
Digester technologies to better manage nutrient waste provide significant potential economic and environmental benefits for the national economy as well as dairy operators. For the 2,647 digesters assumed for this study, these benefits are as follows:
The environmental benefits of digesters can be provided in terms of acres required to dispose of nutrient waste
generated by diary operations as a part of the nutrient management planning required by the EPA.
Exhibit 37: Acres Needed to Dispose of Effluent and Separated Nutrients25 (Acres)
Source: Informa Economics.
25
“Separated nutrients” refers to 2nd
screenings of fine solids, which must still be disposed of on agricultural land. Fiber and recovered nutrients, however, may be licensed for sale outside of nutrient management plans. The recovered nutrients obtained from application of nutrient fractionation technologies provides for the bulk of the acreage reduction in Scenario D.
StateScenarios A &
B: Lagoon Only
Scenario C:
Digester w/o
Nutrient
Recovery
Scenario D:
Digester w
Nutrient
Recovery
Arizona 533,111 819,756 293,710
California 5,018,013 7,235,762 2,632,508
Colorado 187,416 395,069 175,805
Idaho 978,091 1,431,033 556,943
Michigan 310,162 551,710 187,358
New Mexico 881,572 1,074,694 408,447
New York 248,977 910,539 354,372
Texas 434,770 1,818,874 790,851
Washington 295,042 836,010 325,366
Wisconsin 401,335 613,915 238,929
Other 40 States 1,240,161 4,236,728 1,681,190
US Total 10,528,651 19,924,088 7,645,478

National Market Value of Anaerobic Digester Products
79
An estimated 10.5 million acres are required to dispose of manure effluent from the storage lagoons of the 2,647
dairies in the EPA AgSTAR report. If digesters were installed in those dairies, but without nutrient recovery technology, and if additional volume of
organic substrate feedstock supplemented dairy manure as required for economic reasons, effluent disposal acreage would increase to 19.9 million acres. The increase acreage is due to increased nutrient waste resulting from supplemental organic substrate feedstock.
If nutrient recovery technologies are provided, however, the acreage required to dispose of effluent and separated nutrient waste is reduced to 7.6 million acres. Nutrient recovery technologies should therefore be deemed critical to both realizing the environmental benefits of large digester systems as well as the economic sustainability of those systems.
Exhibit 38: Nutrients Required in Management Plans (Pounds)
Source: Informa Economics.
StateScenarios A &
B: Lagoon Only
Scenario C:
Digester w/o
Nutrient
Recovery
Scenario D:
Digester w
Nutrient
Recovery
Scenarios A
& B: Lagoon
Only
Scenario C:
Digester w/o
Nutrient
Recovery
Scenario D:
Digester w
Nutrient
Recovery
Arizona 19,646,486 30,210,075 10,823,959 1,589,817 8,876,145 3,970,936
California 178,999,686 258,109,929 93,905,296 14,763,425 77,250,145 34,860,677
Colorado 13,211,358 21,183,037 7,517,356 1,062,397 6,183,784 2,751,771
Idaho 56,937,864 66,933,898 18,406,822 4,696,086 20,266,846 7,887,637
Michigan 18,461,867 32,839,562 9,030,880 1,503,412 9,612,002 3,740,887
New Mexico 36,049,314 43,946,482 16,702,234 2,845,567 12,763,437 5,891,747
New York 13,975,833 38,990,667 10,722,433 1,190,859 11,459,115 4,459,764
Texas 34,602,984 69,704,615 23,600,485 2,909,924 20,723,390 9,010,580
Washington 21,945,866 33,068,737 9,093,903 1,775,886 9,705,783 3,777,386
Wisconsin 30,279,155 41,012,979 11,278,569 2,597,239 12,716,457 4,949,108
Other 40 States 96,995,146 302,728,091 86,329,301 8,466,208 89,407,502 35,478,098
US Total 521,105,559 938,728,073 297,411,238 43,400,821 278,964,605 116,778,590
Phosphorus Available for CropsNitrogen Available for Crops

National Market Value of Anaerobic Digester Products
80
Exhibit 38 shows how the acreage benefits are derived from changing volumes and distributions of nitrogen and phosphorus. Digester systems without nutrient recovery add more nitrogen as well as phosphorus to the waste products requiring disposal on crops, requiring more acres as part of an acceptable nutrient management plan.
Digesters systems with nutrient recovery allow fertilizer products to be licensed and marketed (provided digester owners comply with licensing requirements), and therefore removed from nutrient management planning.
Exhibit 39: Supplemental Nutrient Needs for Crops in Nutrient Management Plans (Pounds)
Source: Informa Economics
1. A. Baseline Nutrient Management Scenario with Lagoon-Only Waste Management
The waste management problem of confined animal dairy operations centers on how to get rid of the manure effluent from storage lagoons. Because effluent contains nitrogen, phosphorus, and potassium in roughly an NPK ratio of 7:1:7, the lagoon effluent may be spread on nearby cropland acres as fertilizer. Exhibit 40 and Exhibit 41 indicate the volumes and costs for the 2,647 large dairies evaluated in this report to manage nutrient waste if no digester operations were installed.
StateScenarios A &
B: Lagoon Only
Scenario C:
Digester w/o
Nutrient
Recovery
Scenario D:
Digester w
Nutrient
Recovery
Scenarios A
& B: Lagoon
Only
Scenario C:
Digester w/o
Nutrient
Recovery
Scenario D:
Digester w
Nutrient
Recovery
Scenarios A
& B: Lagoon
Only
Scenario C:
Digester w/o
Nutrient
Recovery
Scenario D:
Digester w
Nutrient
Recovery
Arizona - - - 8,983,620 7,382,454 1,854,352 41,500,794 65,434,625 14,865,877
California - - - 67,323,181 41,115,248 8,202,902 362,323,387 537,774,144 122,314,257
Colorado - 6,666,263 4,875,526 1,871,112 - - 921,352 6,540,243 -
Idaho - 16,371,211 14,014,626 9,156,017 - - 20,032,393 42,637,555 -
Michigan - - 2,121,283 4,689,446 1,403,718 - 11,243,584 21,611,509 -
New Mexico - - - 13,964,486 7,729,123 1,896,625 57,772,379 73,142,777 16,282,767
New York - 12,120,528 9,169,491 1,942,519 - - 6,061,844 31,038,276 1,053,150
Texas - 75,057,921 39,342,614 2,043,645 - - - 13,988,005 -
Washington - 29,115,514 15,107,536 1,649,448 - - - 12,387,508 -
Wisconsin - 5,304,500 6,747,693 5,715,898 - - 10,533,246 21,833,785 -
Other 40 States - 28,633,627 45,159,481 17,704,871 - - 8,559,057 64,284,238 -
US Total - 173,269,565 136,538,249 135,044,243 57,630,544 11,953,879 518,948,036 890,672,666 154,516,051
Supplemental Potassium NeedsSupplemental Nitrogen Needs Supplemental Phosphorus Needs

National Market Value of Anaerobic Digester Products
81
Using lagoon effluent, relatively fixed ratios of nitrogen, phosphorus, and potassium are applied to crop acres,
regardless of the nutrient amounts needed by crops. This leads to gaps in nutrients needed relative to what is provided by lagoon effluent. Because of higher levels of nitrogen concentration relative to nitrogen needs, for most of the top three crops selected for each state, for this exercise nitrogen is the nutrient that caps the amount of phosphorus and potassium that can be applied, often requiring additional purchases of those nutrients.26
At the present time, only nitrogen and phosphorus represent problematic and therefore regulated nutrients, and since nitrogen is present in greater quantities than phosphorus in manure effluent, spreading nitrogen over more acres results in lower levels of phosphorus than is optimal for many crops.
Potassium may be spread in much greater amounts than is needed for the crops to which the effluent is applied
because it is not presently managed for water pollution potential. Although not associated with the kinds of environmental problems attributed to nitrogen and phosphorus, it does mean that more potassium, a finite mineral resource, is being used than would be needed if it were possible to separately distribute potassium apart from nitrogen and phosphorus, a technology which is not currently commercially available even in advanced digester systems.
26 These estimates are highly dependent on soil types in each state and the actual mix of crops upon which manure effluent is spread, items
which are outside of the scope of this report. For example, conversations with EPA officials report that manure effluent contributes to phosphorus runoff into water resources more than nitrogen leaching, indicating that soil and crop types in Wisconsin may differ from the broad assumptions regarding similar national soil types and using nutrient requirements of the top three crops in each state to estimate the distribution of manure effluent on crop acres.

National Market Value of Anaerobic Digester Products
82
Exhibit 40: Baseline Scenario, Lagoon Manure Effluent Collection and Tanker/Pipeline Distribution to Crop Acres
Source: Informa Economics.
State
Manure
Effluent
Produced
(Ft3/year)
Acres
Needed to
Dispose of
Effluent
Nutrients
Effluent N
Applied on
Acres (Lbs.)
Effluent P
Applied on
Acres (Lbs.)
Effluent K
Applied on
Acres (Lbs.)
Arizona 127,525,452 533,111 19,646,486 1,589,817 10,449,117
California 1,184,231,988 5,018,013 178,999,686 14,763,425 97,033,009
Colorado 85,219,032 187,416 13,211,358 1,062,397 6,982,634
Idaho 376,691,388 978,091 56,937,864 4,696,086 30,865,151
Michigan 120,594,540 310,162 18,461,867 1,503,412 9,881,215
New Mexico 228,254,064 881,572 36,049,314 2,845,567 18,702,567
New York 95,523,420 248,977 13,975,833 1,190,859 7,826,950
Texas 233,416,332 434,770 34,602,984 2,909,924 19,125,551
Washington 142,450,740 295,042 21,945,866 1,775,886 11,672,058
Wisconsin 208,334,700 401,335 30,279,155 2,597,239 17,070,424
Other 40 States 679,107,612 1,240,161 96,995,146 8,466,208 55,644,380
US Total 3,481,349,268 10,528,651 521,105,559 43,400,821 285,253,056

National Market Value of Anaerobic Digester Products
83
Exhibit 41: Per Acre Nutrient Applications from Undigested Manure Effluent Only (Pounds per Acre)
Source: Informa Economics.
2. Supplemental Fertilizer to Make Up for Full Fertilizer Needs of Crops that Received Manure Effluent
Exhibit 42 indicates the estimated per acre nutrient needs, per state, based on the top three cultivated crops in each state which were deemed accessible to dairy operations. The crop nutrient needs of N to P to K are only 3:1:4,27 while the ratio of NPK in manure effluent is about 7:1:7. This
means that there will be significant gaps in nutrient needs of crops that must be covered by purchased fertilizer, most likely from mineral sources, particularly with respect to phosphorus. Obviously, these needs will vary significantly by crop and soil characteristics surrounding specific dairy operations.
27
N P K ratios are provided in this paper by element, not phosphate and potash weights.
State
Per Acre N
Application
(lbs/acre)
Per Acre P
Application
(lbs/acre)
Per Acre K
Application
(lbs/acre)
Arizona 37 3 20
California 36 3 19
Colorado 70 6 37
Idaho 58 5 32
Michigan 60 5 32
New Mexico 41 3 21
New York 56 5 31
Texas 80 7 44
Washington 74 6 40
Wisconsin 75 6 43
Other 40 States 78 7 45
US Total 49 4 27

National Market Value of Anaerobic Digester Products
84
Exhibit 42: Estimated Nutrient Needs of Crops in Dairy States
Source: Informa Economics.
In order to prevent nutrient contamination of water resources, the amount of nutrients spread on crop acres must not
be significantly larger than the crop needs, so on average, nitrogen needs provide an effective cap on the amount of manure effluent that may be spread on crop acres (as seen in Exhibit 43).
State
Annual N
Required
Per Acre
(Lbs)
Annual P
Required
Per Acre
(Lbs)
Annual K
Required
Per Acre
(Lbs)
Ratio of N
to P
Ratio of K to
PCrop 1 Crop 2 Crop 3
Arizona 37 20 97 1.9 4.9 Alfalfa Corn All Wheat
California 36 16 92 2.2 5.6 Alfalfa Hay Other Corn
Colorado 70 16 42 4.5 2.7 Corn Alfalfa All Wheat
Idaho 58 14 52 4.1 3.7 Alfalfa All Wheat Barley
Michigan 60 20 68 3.0 3.4 Corn Alfalfa Soybeans
New Mexico 41 19 87 2.1 4.5 Alfalfa Corn All Wheat
New York 56 13 56 4.5 4.4 Corn Hay Other Alfalfa
Texas 80 11 27 7.0 2.4 Cotton Corn Hay Other
Washington 74 12 34 6.4 2.9 All Wheat Alfalfa Hay Other
Wisconsin 75 21 69 3.6 3.3 Corn Soybeans Alfalfa
Other 40 States 78 21 52 3.7 2.5 Corn Soybeans All Wheat
US Total 56 17 68 3.4 4.0
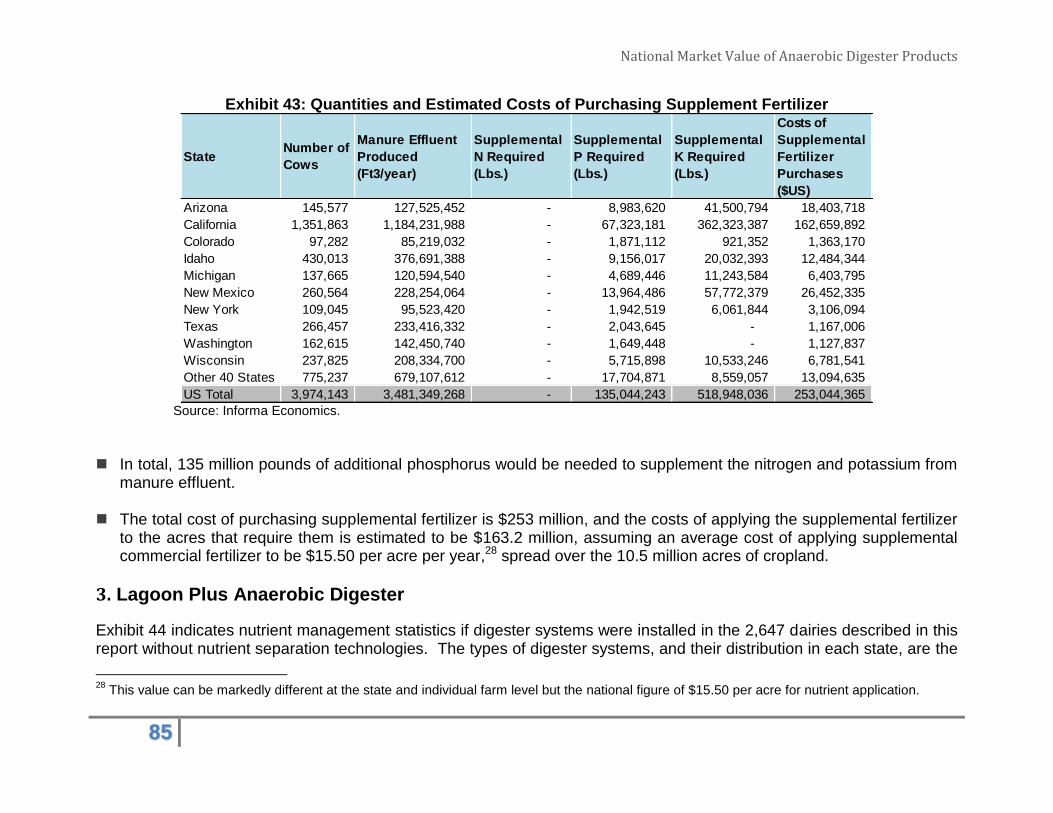
National Market Value of Anaerobic Digester Products
85
Exhibit 43: Quantities and Estimated Costs of Purchasing Supplement Fertilizer
Source: Informa Economics.
In total, 135 million pounds of additional phosphorus would be needed to supplement the nitrogen and potassium from
manure effluent.
The total cost of purchasing supplemental fertilizer is $253 million, and the costs of applying the supplemental fertilizer to the acres that require them is estimated to be $163.2 million, assuming an average cost of applying supplemental commercial fertilizer to be $15.50 per acre per year,28 spread over the 10.5 million acres of cropland.
3. Lagoon Plus Anaerobic Digester
Exhibit 44 indicates nutrient management statistics if digester systems were installed in the 2,647 dairies described in this report without nutrient separation technologies. The types of digester systems, and their distribution in each state, are the
28
This value can be markedly different at the state and individual farm level but the national figure of $15.50 per acre for nutrient application.
StateNumber of
Cows
Manure Effluent
Produced
(Ft3/year)
Supplemental
N Required
(Lbs.)
Supplemental
P Required
(Lbs.)
Supplemental
K Required
(Lbs.)
Costs of
Supplemental
Fertilizer
Purchases
($US)
Arizona 145,577 127,525,452 - 8,983,620 41,500,794 18,403,718
California 1,351,863 1,184,231,988 - 67,323,181 362,323,387 162,659,892
Colorado 97,282 85,219,032 - 1,871,112 921,352 1,363,170
Idaho 430,013 376,691,388 - 9,156,017 20,032,393 12,484,344
Michigan 137,665 120,594,540 - 4,689,446 11,243,584 6,403,795
New Mexico 260,564 228,254,064 - 13,964,486 57,772,379 26,452,335
New York 109,045 95,523,420 - 1,942,519 6,061,844 3,106,094
Texas 266,457 233,416,332 - 2,043,645 - 1,167,006
Washington 162,615 142,450,740 - 1,649,448 - 1,127,837
Wisconsin 237,825 208,334,700 - 5,715,898 10,533,246 6,781,541
Other 40 States 775,237 679,107,612 - 17,704,871 8,559,057 13,094,635
US Total 3,974,143 3,481,349,268 - 135,044,243 518,948,036 253,044,365
National Market Value of Anaerobic Digester Products
86
same as provided in Exhibit 9, but in addition to manure feedstock, 19.8 million tons of organic substrates have been diverted from landfills to supplement manure feedstock, increasing energy output and nutrient production. This provides an additional economic benefit if nutrients can be marketed, but it may also provide an additional environmental cost, and therefore economic cost, if the nutrients must be spread on the same farmland as lagoon-only effluent. With the same amount of manure as in Scenarios A and B, above, digesters allow for an additional 19.8 million tons of
organic substrates. This amount is primarily made up of food waste gathered from commercial and industrial sources as described in Section II.
Separation equipment allows for the removal of material containing 30% solids and with N:P:K ratios of approximately 6:3:2. Thus, the fiber material removed and either used or marketed also removes the following volumes of solids, nitrogen and phosphorus from the amount of nutrient waste that has to be disposed of in some way. This separation process has two parts – an initial separation of larger material and a second screening where finer material is removed. The total estimated production from 2,647 digesters nationwide is as follows: Annual volume of fiber / total solids separated for use as bedding or soil supplements: 30.1 million cubic feet, dry
basis. This material is removed from nutrient management acres. Annual volume nitrogen removed in second screening of solids: 82.8 million pounds of nitrogen to be distributed on
crops along with digester effluent. Annual volume of phosphorus removed in second screening of solids: 34.0 million pounds of phosphorus to be
distributed on crops along with digester effluent.

National Market Value of Anaerobic Digester Products
87
Exhibit 44: Lagoon Plus Digester Feedstock and Production Summary
Source: Informa Economics.
The solid material removed from the digester is assumed, for the purposes of this study, to be distributed by vehicular
transport to wholesale providers of soil supplements or fiber, or used as bedding in nearby dairy barns. After removal of separated and screened fiber, solids and nutrient material, an amount of nitrogen and phosphorus nutrients remains in the 98% liquid effluent. This must be disposed of in a manner similar to disposal of lagoon-only waste management system with spreading by vehicle or pipe/injection systems. Even with the additional organic substrates added to manure feedstock, nitrogen and phosphorus levels remaining in the digester effluent are less than the amount that would be left in lagoon-only waste management systems because some of the nutrients are removed in the fiber separation and second- screening process. The nutrient amounts remaining in the effluent after screening are as follows: Nitrogen remaining in effluent: 172.1 million pounds per year. Phosphorus remaining in effluent: 56.5 million pounds per year.
State
Manure
Effluent
Produced
(Ft3/year)
Organic
Subtrates
Added
(MT/year)
Annual N
Remaining In
Effluent After
1st and 2nd
Screenings
(Lbs/yr)
Annual P
Remaining In
Effluent After
1st and 2nd
Screenings
(Lbs/yr)
Annual K
Remaining In
Effluent After
1st and 2nd
Screenings
(Lbs/yr)
Acres Needed
to Dispose of
Post Digestate
Effluent and
Fine Solids
Arizona 127,525,452 2,054,687 5,295,419 1,698,921 760,158 819,756
California 1,184,231,988 19,080,321 44,352,415 14,377,704 7,059,010 7,235,762
Colorado 85,219,032 1,373,047 3,758,233 1,203,492 507,976 395,069
Idaho 376,691,388 6,877,290 10,768,878 3,460,344 2,245,395 1,431,033
Michigan 120,594,540 2,201,706 6,022,792 1,952,054 718,844 551,710
New Mexico 228,254,064 3,677,625 7,106,116 2,196,602 1,360,584 1,074,694
New York 95,523,420 1,743,980 7,770,856 2,585,530 569,399 910,539
Texas 233,416,332 3,760,799 13,075,854 4,319,602 1,391,356 1,818,874
Washington 142,450,740 2,600,736 5,802,990 1,860,361 849,125 836,010
Wisconsin 208,334,700 3,803,586 6,958,178 2,321,248 1,241,848 613,915
Other 40 States 679,107,612 10,133,168 61,186,775 20,504,947 4,048,047 4,236,728
US Total 3,481,349,268 57,306,945 172,098,504 56,480,805 20,751,743 19,924,088

National Market Value of Anaerobic Digester Products
88
The remaining effluent after fiber and other usable soil supplement solids have been separated, marketed or distributed would allow for fewer acres to dispose of the effluent as well as lower amounts of purchased nutrients to supplement the gaps in nutrient coverage.
The environmental implication is a reduction in the amount nutrients that must be spread on nearby cropland, thus allowing for the possibility of dairy operations with digesters to offset some nutrient contamination of soil and water resources by non-agricultural sources as well as their own operations by reducing the amount of nutrients spread on nearby cropland.
Exhibit 45 indicates the nutrients that must still be spread on nearby cropland as part of a nutrient management plan along with the acreage required to do so. From 10.5 million acres required spread manure effluent without digesters as part of nutrient management plans for the 2,467 digesters in the AgSTAR report, with digesters operating in each dairy, the acreage required to dispose of nutrients remaining in effluent and separated fine solids is 19.9 million acres. Second screening of solids still must be distributed on crop acres and provided for in nutrient management plans.
The increase in acreage needed to dispose of nutrient loads with digesters compared to lagoon-only systems in the
baseline scenario is due to the additional organic substrates that are diverted to dairy farms as supplemental feedstock for digesters in order to achieve the economic benefits detailed in earlier chapters of this report. Even though nutrients are removed from management plans in the form of dried fiber used as bedding or marketed as gardening supplement, there is still greater nutrients in the digester effluent than a lagoon-only system provides for because of the additional organic substrates.
Fiber is generally not spread on cropland and can be licensed as a fertilizer supplement transported out of nutrient
management reporting areas, thus reducing the acreage upon which nutrients must be spread in management plans.
Second screening solids, which takes the form of a wet, claylike paste, may not be licensed as a fertilizer supplement or transported far from dairy operations without further processing. The benefit of second screening solids is that their removal and separate application allows for fewer acres required in nutrient management planning because the gaps between crop nutrient needs and nutrients available in effluent and fine solids is much closer than lagoon-only manure effluent.

National Market Value of Anaerobic Digester Products
89
Also, by diverting nutrients from landfills to digesters, nutrient leaching from landfills is correspondingly reduced. This may benefit landfill operators who divert some organic substrates to digesters in response to regulatory conditions in some jurisdictions.
Exhibit 45: Supplemental Nutrients Required in Digesters without Nutrient Recovery
Source: Informa Economics.
4. Digester Plus Nutrient Separation Technology
Nutrient recovery technology is being developed at the University of Washington and elsewhere to use chemical processes to separate phosphorus and nitrogen from digestate. With technologies currently under development, potassium is still unable to be recovered on a commercial scale using these methods so potassium would remain in the post-digester effluent while much of the nitrogen and phosphorus can be removed and stored or applied separately.
StateNumber of
Cows
Manure
Effluent
Produced
(Ft3/year)
Supplemental
N Required
(Lbs.)
Supplement
al P
Required
(Lbs.)
Supplemental
K Required
(Lbs.)
Arizona 145,577 127,525,452 - 7,382,454 65,434,625
California 1,351,863 1,184,231,988 - 41,115,248 537,774,144
Colorado 97,282 85,219,032 6,666,263 - 6,540,243
Idaho 430,013 376,691,388 16,371,211 - 42,637,555
Michigan 137,665 120,594,540 - 1,403,718 21,611,509
New Mexico 260,564 228,254,064 - 7,729,123 73,142,777
New York 109,045 95,523,420 12,120,528 - 31,038,276
Texas 266,457 233,416,332 75,057,921 - 13,988,005
Washington 162,615 142,450,740 29,115,514 - 12,387,508
Wisconsin 237,825 208,334,700 5,304,500 - 21,833,785
Other 40 States 775,237 679,107,612 28,633,627 - 64,284,238
US Total 3,974,143 3,481,349,268 173,269,565 57,630,544 890,672,666

National Market Value of Anaerobic Digester Products
90
Exhibit 46: Nutrient Recovery Reduces Acres Required in Nutrient Management Planning
Source: Informa Economics.
Exhibit 46 provides the volumes of nutrients in 2,647 dairy operations that may be potentially removed from nutrient
management planning if the removed nutrients were licensed as commercial fertilizer products and thus transported and distributed outside nutrient management planning areas.
There are two physical forms which the recovered nutrients take. Nitrogen is assumed to be recovered in the form of ammonium sulfate, which means it can be distributed on cropland using existing equipment for that purpose. Phosphorus, however, is collected in a wet, clay-like substance that is currently being spread on crops using manure spreading equipment.
5. Nutrient Products Caveats
A key hurdle yet to be overcome in the development of a mature, anaerobic digester industry in the United States, comparable to the biofuels industry, is the development of proven markets for the nutrient products, particularly the wet
State
Total N to be
Removed
From Nutrient
Management
Plan Acres
(lbs N/year)
Total P to be
Removed
From Nutrient
Management
Plan Acres
(lbs P/year)
Total K to be
Removed
From Nutrient
Management
Plan Acres (lbs
K/year)
Total N
Included in
Nutrient
Management
Plan Acres (lbs
N/year)
Total P
Included in
Nutrient
Management
Plan Acres (lbs
P/year)
Total K Included
in Nutrient
Management
Plan (lbs K/year)
Acres
Required in
Nutrient
Management
Plan
Arizona 8,855,967 992,734 1,528,356 10,823,959 3,970,936 13,755,207 293,710
California 76,831,606 8,715,169 13,185,488 93,905,296 34,860,677 118,669,395 2,632,508
Colorado 6,150,564 687,943 1,070,420 7,517,356 2,751,771 9,633,782 175,805
Idaho 15,060,127 1,971,909 3,350,530 18,406,822 7,887,637 30,154,768 556,943
Michigan 7,388,902 935,222 1,680,507 9,030,880 3,740,887 15,124,564 187,358
New Mexico 13,665,464 1,472,937 2,127,702 16,702,234 5,891,747 19,149,321 408,447
New York 8,772,900 1,114,941 2,079,432 10,722,433 4,459,764 18,714,892 354,372
Texas 19,309,487 2,252,645 3,668,615 23,600,485 9,010,580 33,017,534 790,851
Washington 7,440,466 944,346 1,664,333 9,093,903 3,777,386 14,978,997 325,366
Wisconsin 9,227,920 1,237,277 2,146,427 11,278,569 4,949,108 19,317,840 238,929
Other 40 States 70,633,065 8,869,525 16,331,208 86,329,301 35,478,098 146,980,873 1,681,190
US Total 243,336,467 29,194,648 48,833,019 297,411,238 116,778,590 439,497,173 7,645,478

National Market Value of Anaerobic Digester Products
91
form that digester nutrient products take. While crop farmers are able to readily adapt to using ammonium sulfate as means of applying nitrogen, along with the equipment and expertise for applying it, the same has yet to occur with applications of organic phosphorus applications outside of organic farming. Phosphorus recovered using nutrient recovery technologies is wet, clay-like material composed of 70% water. At the present it is being applied with spreaders, which may be marginally more expensive than piped injection systems. There are three products of the series of nutrient recovery technologies that were assumed: Ammonium sulfate, which is liquid and applicable to crops through current tanker, piping, or sprinkler methods,
essentially the same as commercially available ammonium sulfate.
Organic phosphorus material, which is a wet, clay-like material with the phosphorus in organic form, rather than the inorganic form of P commonly found in commercial fertilizers. This product may be up to 90% dry, but at the present time still is likely to be applied to crops using existing manure spreading or throwing machinery. Further refinements of this product may involve drying and pelletization which may allow for application of such nutrients using machinery suited for dry commercial fertilizer applications, but this is not presently the way it is being done.
Digester solids, or fiber, which are 25% liquid and can be dried and stored for economical shipment to markets further
from the dairy operation that is presently possible with lagoon effluent.

National Market Value of Anaerobic Digester Products
92
APPENDIX A: RESULTS BY STATE AND SCENARIO
Exhibit 47: Arizona Annual Volume of Production and Values
Source: Informa Economics
Scenario 1:
Low Valuation
Scenario 2:
Mid Valuation
Scenario 3:
High ValuationUnits
Scenario 1: Low
Valuation
Scenario 2: Mid
Valuation
Scenario 3: High
Valuation
Inputs and AssumptionsNumber of Cows 145,577 145,577 145,577 Number NA NA NA
Manure 3,985,170 3,985,170 3,985,170 Tons/year NA NA NA
Organic Substrate/ Tipping Fees 442,469 442,469 442,469 Tons/year $3,459,883 $7,452,055 $8,516,634
OutputsElectricity Production 360,655 360,655 360,655 MWh/year $10,819,639 $23,731,076 $39,708,076
Co-ProductsRecovered Nitrogen (N) 9,756 9,756 9,756 Tons N/year $9,176,589 $13,765,021 $27,530,041
Recovered Phosphorus (P) 3,135 3,135 3,135 Tons P/year $4,677,261 $9,354,521 $11,693,152
Recovered Potassium (K) - - - Tons K/year - - -
Nutrient Enriched Fiber 1,037,236 1,037,236 1,037,236 yd3/year $6,223,417 $7,350,803 $7,965,973
GHG Offset Credits 1,457,186 1,457,186 1,457,186 MTCO2e/year $1,457,186 $14,571,860 $36,429,650
RECs (Produced only when
electricity is primary product
produced)
360,655 360,655 360,655 RECs/year $180,327 $360,655 $1,081,964
SubtotalsElectricity + RECs $10,999,967 $24,091,730 $40,790,040
Soil Amendments, Eco-
System, and Other Products$21,534,452 $45,042,205 $83,618,817
Total $32,534,419 $69,133,935 $124,408,857
Volume Total Annual Dollar Value

National Market Value of Anaerobic Digester Products
93
Exhibit 48: California Annual Volume of Production and Values
Source: Informa Economics
Scenario 1:
Low Valuation
Scenario 2:
Mid Valuation
Scenario 3:
High ValuationUnits
Scenario 1: Low
Valuation
Scenario 2: Mid
Valuation
Scenario 3: High
Valuation
Inputs and AssumptionsNumber of Cows 1,351,863 1,351,863 1,351,863 Number NA NA NA
Manure 37,007,250 37,007,250 37,007,250 Tons/year NA NA NA
Organic Substrate/ Tipping Fees 3,032,805 3,032,805 3,032,805 Tons/year $34,498,157 $74,303,723 $84,918,540
OutputsElectricity Production 3,021,003 3,021,003 3,021,003 MWh/year $90,630,092 $332,612,438 $332,612,438
Co-ProductsRecovered Nitrogen (N) 81,094 81,094 81,094 Tons N/year $76,281,756 $114,423,779 $228,847,557
Recovered Phosphorus (P) 26,314 26,314 26,314 Tons P/year $39,259,898 $78,519,796 $98,149,745
Recovered Potassium (K) - - - Tons K/year - - -
Nutrient Enriched Fiber 9,632,024 9,632,024 9,632,024 yd3/year $57,792,143 $69,938,451 $73,973,943
GHG Offset Credits 10,432,352 10,432,352 10,432,352 MTCO2e/year $10,432,352 $104,323,523 $260,808,806
RECs (Produced only when
electricity is primary product
produced)
3,021,003 3,021,003 3,021,003 RECs/year $12,839,263 $25,678,526 $38,517,789
SubtotalsElectricity + RECs $103,469,355 $358,290,965 $371,130,228
Soil Amendments, Eco-
System, and Other Products$183,766,150 $367,205,548 $661,780,052
Total $287,235,505 $725,496,513 $1,032,910,280
Volume Total Annual Dollar Value

National Market Value of Anaerobic Digester Products
94
Exhibit 49: Colorado Annual Volume of Production and Values
Source: Informa Economics.
Scenario 1:
Low Valuation
Scenario 2:
Mid Valuation
Scenario 3:
High ValuationUnits
Scenario 1: Low
Valuation
Scenario 2: Mid
Valuation
Scenario 3: High
Valuation
Inputs and AssumptionsNumber of Cows 97,282 97,282 97,282 Number NA NA NA
Manure 2,663,095 2,663,095 2,663,095 Tons/year NA NA NA
Organic Substrate/ Tipping Fees 348,131 348,131 348,131 Tons/year $3,447,457 $7,425,292 $8,486,048
OutputsElectricity Production 256,045 256,045 256,045 MWh/year $7,681,345 $18,230,393 $28,190,537
Co-ProductsRecovered Nitrogen (N) 6,955 6,955 6,955 Tons N/year $6,542,030 $9,813,144 $19,626,287
Recovered Phosphorus (P) 2,231 2,231 2,231 Tons P/year $3,329,053 $6,658,107 $8,322,634
Recovered Potassium (K) - - - Tons K/year - - -
Nutrient Enriched Fiber 693,134 693,134 693,134 yd3/year $4,158,806 $4,912,182 $5,323,271
GHG Offset Credits 738,890 738,890 738,890 MTCO2e/year $738,890 $7,388,905 $18,472,261
RECs (Produced only when
electricity is primary product
produced)
256,045 256,045 256,045 RECs/year $128,022 $256,045 $768,135
SubtotalsElectricity + RECs $7,809,368 $18,486,438 $28,958,672
Soil Amendments, Eco-
System, and Other Products$14,768,780 $28,772,337 $51,744,453
Total $22,578,147 $47,258,775 $80,703,125
Volume Total Annual Dollar Value

National Market Value of Anaerobic Digester Products
95
Exhibit 50: Idaho Annual Volume of Production and Values
Source: Informa Economics.
Scenario 1:
Low Valuation
Scenario 2:
Mid Valuation
Scenario 3:
High ValuationUnits
Scenario 1: Low
Valuation
Scenario 2: Mid
Valuation
Scenario 3: High
Valuation
Inputs and AssumptionsNumber of Cows 430,013 430,013 430,013 Number NA NA NA
Manure 11,771,606 11,771,606 11,771,606 Tons/year NA NA NA
Organic Substrate/ Tipping Fees 108,511 108,511 108,511 Tons/year $850,972 $1,832,863 $2,094,701
OutputsElectricity Production 729,228 729,228 729,228 MWh/year $21,876,825 $37,628,140 $80,287,949
Co-ProductsRecovered Nitrogen (N) 21,538 21,538 21,538 Tons N/year $20,259,646 $30,389,773 $60,779,546
Recovered Phosphorus (P) 6,921 6,921 6,921 Tons P/year $10,325,665 $20,651,330 $25,814,163
Recovered Potassium (K) - - - Tons K/year - - -
Nutrient Enriched Fiber 3,469,345 3,469,345 3,469,345 yd3/year $20,816,069 $25,225,215 $26,644,569
GHG Offset Credits 2,372,682 2,372,682 2,372,682 MTCO2e/year $2,372,682 $23,726,822 $59,317,054
RECs (Produced only when
electricity is primary product
produced)
729,228 729,228 729,228 RECs/year $364,614 $729,228 $2,187,683
SubtotalsElectricity + RECs $22,241,439 $38,357,367 $82,475,632
Soil Amendments, Eco-
System, and Other Products$53,774,063 $99,993,140 $172,555,332
Total $76,015,502 $138,350,508 $255,030,964
Volume Total Annual Dollar Value

National Market Value of Anaerobic Digester Products
96
Exhibit 51: Michigan Annual Volume of Production and Values
Source: Informa Economics.
Scenario 1:
Low Valuation
Scenario 2:
Mid Valuation
Scenario 3:
High ValuationUnits
Scenario 1: Low
Valuation
Scenario 2: Mid
Valuation
Scenario 3: High
Valuation
Inputs and AssumptionsNumber of Cows 137,665 137,665 137,665 Number NA NA NA
Manure 3,768,579 3,768,579 3,768,579 Tons/year NA NA NA
Organic Substrate/ Tipping Fees 684,166 684,166 684,166 Tons/year $14,230,650 $30,650,630 $35,029,292
OutputsElectricity Production 411,309 411,309 411,309 MWh/year $12,339,263 $30,272,324 $45,285,094
Co-ProductsRecovered Nitrogen (N) 12,046 12,046 12,046 Tons N/year $11,330,766 $16,996,319 $33,992,638
Recovered Phosphorus (P) 3,904 3,904 3,904 Tons P/year $5,824,931 $11,649,861 $14,562,327
Recovered Potassium (K) - - - Tons K/year - - -
Nutrient Enriched Fiber 1,110,681 1,110,681 1,110,681 yd3/year $6,664,087 $7,775,407 $8,530,032
GHG Offset Credits 939,842 939,842 939,842 MTCO2e/year $939,842 $9,398,417 $23,496,043
RECs (Produced only when
electricity is primary product
produced)
411,309 411,309 411,309 RECs/year $205,654 $411,309 $1,233,926
SubtotalsElectricity + RECs $12,544,917 $30,683,633 $46,519,020
Soil Amendments, Eco-
System, and Other Products$24,759,626 $45,820,005 $80,581,040
Total $37,304,543 $76,503,638 $127,100,060
Volume Total Annual Dollar Value

National Market Value of Anaerobic Digester Products
97
Exhibit 52: New Mexico Annual Volume of Production and Values
Source: Informa Economics.
Scenario 1:
Low Valuation
Scenario 2:
Mid Valuation
Scenario 3:
High ValuationUnits
Scenario 1: Low
Valuation
Scenario 2: Mid
Valuation
Scenario 3: High
Valuation
Inputs and AssumptionsNumber of Cows 260,564 260,564 260,564 Number NA NA NA
Manure 7,132,940 7,132,940 7,132,940 Tons/year NA NA NA
Organic Substrate/ Tipping Fees 142,541 142,541 142,541 Tons/year $1,297,119 $2,793,796 $3,192,909
OutputsElectricity Production 483,898 483,898 483,898 MWh/year $14,516,938 $29,566,164 $53,277,163
Co-ProductsRecovered Nitrogen (N) 12,679 12,679 12,679 Tons N/year $11,927,047 $17,890,750 $35,781,500
Recovered Phosphorus (P) 3,923 3,923 3,923 Tons P/year $5,852,458 $11,704,916 $14,631,145
Recovered Potassium (K) - - - Tons K/year - - -
Nutrient Enriched Fiber 1,856,519 1,856,519 1,856,519 yd3/year $11,139,111 $13,156,986 $14,258,062
GHG Offset Credits 1,709,825 1,709,825 1,709,825 MTCO2e/year $1,709,825 $17,098,251 $42,745,627
RECs (Produced only when
electricity is primary product
produced)
483,898 483,898 483,898 RECs/year $241,949 $483,898 $1,451,694
SubtotalsElectricity + RECs $14,758,887 $30,050,062 $54,728,857
Soil Amendments, Eco-
System, and Other Products$30,628,442 $59,850,903 $107,416,335
Total $45,387,329 $89,900,965 $162,145,192
Volume Total Annual Dollar Value

National Market Value of Anaerobic Digester Products
98
Exhibit 53: New York Annual Volume of Production and Values
Source: Informa Economics.
Scenario 1:
Low Valuation
Scenario 2:
Mid Valuation
Scenario 3:
High ValuationUnits
Scenario 1: Low
Valuation
Scenario 2: Mid
Valuation
Scenario 3: High
Valuation
Inputs and AssumptionsNumber of Cows 109,045 109,045 109,045 Number NA NA NA
Manure 2,985,107 2,985,107 2,985,107 Tons/year NA NA NA
Organic Substrate/ Tipping Fees 1,341,392 1,341,392 1,341,392 Tons/year $19,482,713 $41,962,766 $47,957,447
OutputsElectricity Production 528,657 528,657 528,657 MWh/year $15,859,709 $41,235,244 $58,205,133
Co-ProductsRecovered Nitrogen (N) 15,542 15,542 15,542 Tons N/year $14,619,424 $21,929,355 $43,858,710
Recovered Phosphorus (P) 5,171 5,171 5,171 Tons P/year $7,715,222 $15,430,444 $19,288,055
Recovered Potassium (K) - - - Tons K/year - - -
Nutrient Enriched Fiber 879,775 879,775 879,775 yd3/year $5,278,650 $6,306,668 $6,756,672
GHG Offset Credits 1,077,742 1,077,742 1,077,742 MTCO2e/year $1,077,742 $10,777,416 $26,943,541
RECs (Produced only when
electricity is primary product
produced)
528,657 528,657 528,657 RECs/year $264,328 $528,657 $1,585,971
SubtotalsElectricity + RECs $16,124,038 $41,763,901 $59,791,104
Soil Amendments, Eco-
System, and Other Products$28,691,038 $54,443,883 $96,846,978
Total $44,815,075 $96,207,784 $156,638,082
Volume Total Annual Dollar Value

National Market Value of Anaerobic Digester Products
99
Exhibit 54: Texas Annual Volume of Production and Values
Source: Informa Economics.
Scenario 1:
Low Valuation
Scenario 2:
Mid Valuation
Scenario 3:
High ValuationUnits
Scenario 1: Low
Valuation
Scenario 2: Mid
Valuation
Scenario 3: High
Valuation
Inputs and AssumptionsNumber of Cows 266,457 266,457 266,457 Number NA NA NA
Manure 7,294,260 7,294,260 7,294,260 Tons/year NA NA NA
Organic Substrate/ Tipping Fees 1,740,627 1,740,627 1,740,627 Tons/year $15,726,568 $33,872,608 $38,711,552
OutputsElectricity Production 886,693 886,693 886,693 MWh/year $26,600,785 $56,216,326 $97,624,881
Co-ProductsRecovered Nitrogen (N) 24,680 24,680 24,680 Tons N/year $23,215,849 $34,824,121 $69,648,242
Recovered Phosphorus (P) 8,158 8,158 8,158 Tons P/year $12,171,612 $24,343,224 $30,429,030
Recovered Potassium (K) - - - Tons K/year - - -
Nutrient Enriched Fiber 1,898,506 1,898,506 1,898,506 yd3/year $11,391,037 $13,804,830 $14,580,527
GHG Offset Credits 3,103,692 3,103,692 3,103,692 MTCO2e/year $3,103,692 $31,036,916 $77,592,290
RECs (Produced only when
electricity is primary product
produced)
886,693 886,693 886,693 RECs/year $443,346 $886,693 $2,660,078
SubtotalsElectricity + RECs $27,044,131 $57,103,018 $100,284,959
Soil Amendments, Eco-
System, and Other Products$49,882,189 $104,009,091 $192,250,089
Total $76,926,320 $161,112,109 $292,535,049
Volume Total Annual Dollar Value

National Market Value of Anaerobic Digester Products
100
Exhibit 55: Washington Annual Volume of Production and Values
Source: Informa Economics.
Scenario 1:
Low Valuation
Scenario 2:
Mid Valuation
Scenario 3:
High ValuationUnits
Scenario 1: Low
Valuation
Scenario 2: Mid
Valuation
Scenario 3: High
Valuation
Inputs and AssumptionsNumber of Cows 162,615 162,615 162,615 Number NA NA NA
Manure 4,451,586 4,451,586 4,451,586 Tons/year NA NA NA
Organic Substrate/ Tipping Fees 465,486 465,486 465,486 Tons/year $7,965,055 $17,155,504 $19,606,290
OutputsElectricity Production 395,716 395,716 395,716 MWh/year $11,871,465 $15,709,905 $43,568,277
Co-ProductsRecovered Nitrogen (N) 11,606 11,606 11,606 Tons N/year $10,917,248 $16,376,036 $32,752,073
Recovered Phosphorus (P) 3,721 3,721 3,721 Tons P/year $5,551,317 $11,102,633 $13,878,292
Recovered Potassium (K) - - - Tons K/year - - -
Nutrient Enriched Fiber 1,311,978 1,311,978 1,311,978 yd3/year $7,871,867 $9,539,243 $10,075,990
GHG Offset Credits 1,082,473 1,082,473 1,082,473 MTCO2e/year $1,082,473 $10,824,734 $27,061,834
RECs (Produced only when
electricity is primary product
produced)
395,716 395,716 395,716 RECs/year $197,858 $395,716 $1,187,147
SubtotalsElectricity + RECs $12,069,323 $16,105,621 $44,755,423
Soil Amendments, Eco-
System, and Other Products$25,422,905 $47,842,646 $83,768,188
Total $37,492,228 $63,948,267 $128,523,611
Volume Total Annual Dollar Value

National Market Value of Anaerobic Digester Products
101
Exhibit 56: Wisconsin Annual Volume of Production and Values
Source: Informa Economics.
Scenario 1:
Low Valuation
Scenario 2:
Mid Valuation
Scenario 3:
High ValuationUnits
Scenario 1: Low
Valuation
Scenario 2: Mid
Valuation
Scenario 3: High
Valuation
Inputs and AssumptionsNumber of Cows 237,825 237,825 237,825 Number NA NA NA
Manure 6,510,459 6,510,459 6,510,459 Tons/year NA NA NA
Organic Substrate/ Tipping Fees 373,440 373,440 373,440 Tons/year $6,311,136 $13,593,216 $15,535,104
OutputsElectricity Production 466,322 466,322 466,322 MWh/year $13,989,650 $34,228,010 $51,342,015
Co-ProductsRecovered Nitrogen (N) 13,916 13,916 13,916 Tons N/year $13,090,521 $19,635,978 $39,271,956
Recovered Phosphorus (P) 4,642 4,642 4,642 Tons P/year $6,926,604 $13,853,208 $17,316,510
Recovered Potassium (K) - - - Tons K/year - - -
Nutrient Enriched Fiber 1,918,772 1,918,772 1,918,772 yd3/year $11,512,633 $13,432,508 $14,736,170
GHG Offset Credits 1,029,052 1,029,052 1,029,052 MTCO2e/year $1,029,052 $10,290,523 $25,726,307
RECs (Produced only when
electricity is primary product
produced)
466,322 466,322 466,322 RECs/year $233,161 $466,322 $1,398,965
SubtotalsElectricity + RECs $14,222,811 $34,694,332 $52,740,980
Soil Amendments, Eco-
System, and Other Products$32,558,810 $57,212,216 $97,050,942
Total $46,781,620 $91,906,548 $149,791,923
Volume Total Annual Dollar Value

National Market Value of Anaerobic Digester Products
102
Exhibit 57: Other 40 States Annual Volume of Production and Values
Note: The “Other 40 States” group includes states in the U.S. other than Arizona, California, Colorado, Idaho, Michigan, New Mexico, New York, Texas, Washington, and Wisconsin. Source: Informa Economics.
Scenario 1:
Low Valuation
Scenario 2:
Mid Valuation
Scenario 3:
High ValuationUnits
Scenario 1: Low
Valuation
Scenario 2: Mid
Valuation
Scenario 3: High
Valuation
Inputs and AssumptionsNumber of Cows 775,237 775,237 775,237 Number NA NA NA
Manure 21,222,113 21,222,113 21,222,113 Tons/year NA NA NA
Organic Substrate/ Tipping Fees 11,169,905 11,169,905 12,518,015 Tons/year $159,693,345 $343,954,897 $440,533,979
OutputsElectricity Production 4,161,698 4,161,698 4,523,394 MWh/year $124,850,936 $274,840,175 $498,025,638
Co-ProductsRecovered Nitrogen (N) 121,351 121,351 131,867 Tons N/year $114,150,028 $171,226,755 $372,127,556
Recovered Phosphorus (P) 40,663 40,663 44,168 Tons P/year $60,668,924 $121,337,848 $164,746,276
Recovered Potassium (K) - - - Tons K/year - - -
Nutrient Enriched Fiber 6,303,452 6,303,452 6,303,452 yd3/year $37,820,712 $45,605,546 $48,410,512
GHG Offset Credits 10,383,383 10,383,383 11,233,678 MTCO2e/year $10,383,383 $103,833,832 $280,841,952
RECs (Produced only when
electricity is primary product
produced)
4,161,698 4,161,698 4,523,394 RECs/year $2,080,849 $4,161,698 $13,570,181
SubtotalsElectricity + RECs $126,931,785 $279,001,873 $511,595,819
Soil Amendments, Eco-
System, and Other Products$223,023,048 $442,003,981 $866,126,295
Total $349,954,833 $721,005,854 $1,377,722,114
Volume Total Annual Dollar Value

National Market Value of Anaerobic Digester Products
103
APPENDIX B: QUANTIS REPORT- PRELIMINARY ASSESSMENT OF THE ENVIRONMENTAL ADVANTAGES OF DISPOSAL OF FOOD WASTE THROUGH CO-FERMENTATION WITH COW MANURE IN THE UNITED STATES
[Quantis Disclaimer: Information contained in this report has been compiled from and/or computed from sources believed to be credible. Application of the data is strictly at the discretion and the responsibility of the reader. Quantis is not liable for any loss or damage arising from the use of the information in this document.]
Summary of Findings
This is a preliminary assessment of the environmental benefits associated with co-fermentation of food waste with dairy cow manure as an alternative to landfill disposal in the US. This assessment looked at the annual diversion of 18.8 million tons of commercial food waste from landfill to 2,647 digesters that may be installed in large US dairy operations nationwide. The findings indicate that, in all scenarios considered, co-fermentation provides an environmental advantage in comparison to landfill disposal for most environmental indicators. In terms of climate impacts, diversion of this food waste to digesters could avoid the release of greenhouse gases equivalent to between 15 and 16 million metric tons of CO2. This equates to taking 3.2 million cars off of the road for a year or to reducing U.S. annual methane emissions by 2%. It should be emphasized that the present assessment is a preliminary examination intended to provide a rough sizing of the potential environmental benefit of co-fermentation of food waste. There is clearly a need for a more detailed quantification of the benefits of such systems under different conditions of implementation and to address various sources of uncertainty in the current results.
Background and Summary of Methodology
The Innovation Center for U.S. Dairy has commissioned Quantis to perform a preliminary assessment the environmental benefit of disposal of food waste in the United States through co-fermentation with dairy cow manure as compared to disposal in landfill. This assessment has been performed based on a life cycle assessment (LCA) methodology. The

National Market Value of Anaerobic Digester Products
104
methodology applied here follows the principles and practices outlined in ISO 14040 and 14044 regarding LCA. (See more about LCA in 0.) However, being preliminary, this assessment is not in conformance with the requirements outlined in those standards to support a comparative claim that would be disclosed publicly.
The baseline scenario in this study is landfilling of food waste. Figure 1 illustrates the methane emissions from landfills based on data provided by US EPA (2012a & b).
Figure 1: Fate of CH4 generated by U.S. landfills in 2009
Approximately, 38% of methane is directly emitted to atmosphere, 33% of methane is either flared or oxidized, and 29% of methane is recovered for energy, of which most (74%) is harnessed for electricity generation, 24% is used for heating, and 2% is used for alternative transport fuel (US EPA (2012b) LMOP database)
Table 1 exhibits nine alternative scenarios of food waste used for co-fermentation with dairy cow manure.

National Market Value of Anaerobic Digester Products
105
Table 1: Scenarios considered in this study (Informa Economics 2012 & EPA CoEAT 2010)
* Note: Not all products can be produced simultaneously. For example, the same energy from biogas that is used to generate electricity cannot also be used to generate CNG or pipeline biomethane and vice versa.
The nine scenarios represent various combinations of three digester design selections and three potential uses for the digester gas. The three digester design options are for a suite of three digester designs implemented at different rates across an assumed potential of 2,647 digesters which could be implemented in large US dairy operations nationwide. The scenarios are:
1. Baseline design, which maintains the current suite of digester designs;
2. More plug flow, in which the total number of covered lagoons is decreased while the number of digesters with plug
flow and complete mix designs increases; and
3. More complete mix, in which the number of both covered lagoons and plug flow fermenters decreases while the
number of complete mix fermenters increases.
The three potential uses for the digester gas are:
1. Pipeline quality biomethane;
2. Compressed natural gas (CNG); or
3. Electricity generation.
More information regarding scenarios can be found in the Informa Economics August 2012 report National Market Value of Anaerobic Digester Products, on which many assumptions of the present assessment are based. Each scenario attempts to represent a realistic implementation of the use of digesters for disposal of all accessible food waste within the U.S. on an annual basis. It is assumed that the food waste used in digesters will primarily be commercial food waste. The amounts of commercial food waste and co-products (nitrogen, N, and phosphorous, P) for each scenario are based on
Scenarios considered Digester technology
Primary
Products
FoodWaste
(Tons/yr)
Biomethane
(MMBTU/yr) CNG (DGEs/yr)
Electricity
(MWH/yr) N (Tons/yr) P (Tons/yr) Replacing alternatives
Biomethane, Baseline Baseline Biomethane 18,812,736 53,283,984 161,753 53,917 Natural gas for heating, US Average
Biomethane, More Plug Flow, More Plug Flow Biomethane 18,812,736 53,283,984 161,753 53,917 Natural gas for heating, US Average
Biomethane, More Complete Mix More Complete Mix Biomethane 21,372,000 60,532,679 183,757 61,252 Natural gas for heating, US Average
CNG, Baseline Baseline CNG 18,812,736 414,016,969 161,753 53,917 Vehicle diesel fuel, US average
CNG, More Plug Flow, More Plug Flow CNG 18,812,736 414,016,969 161,753 53,917 Vehicle diesel fuel, US average
CNG, More Complete Mix More Complete Mix CNG 21,372,000 470,339,384 183,757 61,252 Vehicle diesel fuel, US average
Electricity, Baseline Baseline Electricity 18,812,736 6,147,251 161,753 53,917 Electricity, production, US average
Electricity, More Plug Flow, More Plug Flow Electricity 18,812,736 6,147,251 161,753 53,917 Electricity, production, US average
Electricity, More Complete Mix More Complete Mix Electricity 21,372,000 6,983,516 183,757 61,252 Electricity, production, US average

National Market Value of Anaerobic Digester Products
106
estimations made by Informa Economics (2012). The potential amounts of primary products (biomethane, CNG and/or electricity) produced from digesters (as shown in Table 1) are estimated based on a U.S. EPA food waste biogas economic model, which considers the products of food waste digestion only, without considering the contribution from the manure which would be co-fermented with the food waste.
Findings
Figure 2 summarizes the estimated carbon credits (CO2-equivalence) of food waste disposal that could potentially be provided by 2,647 digesters, if they were installed in large US dairy operations nationwide. The three scenarios shown are for three potential uses of the biogas harvested from these digesters: use to replace pipeline-quality methane, use as compressed natural gas (CNG) to replace diesel fuel, and use for electricity to offset the average US grid. Each bar shows the contribution of a different aspect of the digester + avoided landfill system to the total net impact. Beneficial contributions appear on the positive y-axis, while detrimental contributions appear on the negative y-axis. The net impact (beneficial minus detrimental) is marked with black diamond indicators, and shows a net benefit: the avoided release of greenhouse gases equivalent to between 15 and 16 million metric tons of CO2.
Figure 2: Contribution of different life cycle stages to climate change benefits for the three primary product options (baseline digester design) vs. landfill

National Market Value of Anaerobic Digester Products
107
For all scenarios, the diversion of food waste from landfill provides the largest carbon credit (13 million metric ton CO2-eq.). US EPA (2012b) reports that 38% of landfill methane is emitted directly to air, and avoiding this release provides substantial credits to the digester + avoided landfill system.
The second largest carbon credit (ranging from 4 to 5 million metric ton CO2-eq.), is due to using the biogas harvested from digesters to replace natural gas, diesel fuel, or electricity production. The digester systems are credited for products that they offset. For example, when the harvested biogas is used for electricity, the digester system is credited with the impacts of average US grid electricity generation that have been avoided (shown in Figure 1 as ‘Natural gas/diesel fuel/electricity’).
However, to ensure proper accounting, all impacts associated with the generation of electricity from biogas must be assigned to the digester system if the benefits of avoiding conventional electricity production are credited to it. The impacts of producing the biogas and then using it (converting it to electricity or burning it in place of diesel) appear as negative contributions to the total benefits (shown in Figure 1 as ‘Biomethane/CNG/electricity prod. & use’).
It should be noted that landfill gas is harvested from landfills at a rate of roughly 28%, and largely converted to electricity. When food waste is diverted from landfills, that beneficial use of the landfill gas is lost. This loss of recovered landfill gas to energy provides the largest detrimental carbon impact to the digester + avoided landfill system (1.4 million metric ton CO2-eq.). (See more on landfill methane emissions in Figure 1 CH4 Emissions from Landfills).
Finally, during the digestion process, nitrogen and phosphorous are recovered, and as a result the digester systems are credited with the avoided impact of average nitrogen and phosphorous fertilizer production in US.
The net benefit (the difference between digestion and landfill) is 15-16 million metric tons of CO2-eq. This equates to 2% of the U.S. annual methane emissions or to taking 3.2 million US passenger cars off the road for a year. Table 2 details the potential positive and negative (beneficial and detrimental) environmental impacts of food waste disposal in landfills and digesters, and the difference of the two options (the net benefit). Landfill of food waste generates environmental damage for almost all environmental categories except fossil fuel depletion. (The use of harvested landfill gas for electricity and heat avoids the fossil fuel depletion associated with conventional sources for electricity and heat, thus causing this benefit.) In contrast to landfills, digestion of food waste causes benefits for most environmental categories.

National Market Value of Anaerobic Digester Products
108
Table 2: Potential environmental impact/ benefits of landfill, digestion, and the difference of the two options (net benefit)
* Abbreviations: TMT= thousand metric tons; MMT: million metric tons. Impact assessment methods: TRACI v2.1 (Bare 2011; See more in 0)
The results indicate that digester disposal is preferable to landfill for all environmental impact categories when biogas is used for electricity generation. However, despite the advantage in other environmental impact categories, the use of biogas for biomethane or compressed natural gas generates tradeoffs for the environmental indicator of fossil fuel depletion. The reason for these tradeoffs is that some landfill gas is used to offset electricity production. As average U.S. electricity production uses large amounts of fossil fuels, offsetting electricity production provides a significant benefit for the landfill option. And, when digester gas is not used for electricity production, it does not reduce the use of fossil fuels to the same extent. See 0 for further explanation of impact categories. It should be emphasized that the present assessment is a preliminary examination intended to provide a rough sizing of the potential environmental benefit of co-fermentation of food waste. There is clearly a need for a more detailed
Impact category Unit
Baseline:
Landfill
Digestion:
Biomethane
Digestion:
CNG
Digestion:
Electricity
Net benefit:
Biomethane
Net benefit:
CNG
Net benefit:
Electricity
Human Health
Carcinogenic effects CTUh -12.2 4.2 -1.2 254.8 16.4 11.0 267.0
Non-carcinogenic effects CTUh -1049.1 152.9 -20.0 612.6 1202.0 1029.1 1661.7
Respiratory effects TMT PM2.5 eq -0.1 2.0 0.5 2.1 2.1 0.6 2.2
Ozone layer depletion kg CFC-11 eq -45.7 91.9 876.1 306.1 137.6 921.8 351.8
Photochemical oxidation TMT O3 eq -26.2 25.4 83.5 245.8 51.6 109.7 272.0
Ecosystem Quality
Ecotoxicity Billion CTUe -2.0 2.6 0.2 4.6 4.6 2.2 6.6
Acidification TMT SO2 eq -0.7 22.6 -3.7 22.2 23.3 -3.0 22.9
Eutrophication TMT N eq -73.9 4.9 6.5 23.0 78.8 80.4 96.9
Climate Change
Global warming MMT CO2 eq -11.2 4.0 4.8 4.9 15.2 16.0 16.1
Resources & water use
Fossil fuel depletion Million MJ surplus 9.6 0.6 -1.9 65.7 -9.0 -11.5 56.1

National Market Value of Anaerobic Digester Products
109
quantification of the benefits of such systems under different conditions of implementation and to address various sources of uncertainty in the current results.

National Market Value of Anaerobic Digester Products
110
Quantis References
Food Waste availability and co-product (N, P) estimate Informa Economics (2012). National Market Value of Anaerobic Digester Products, Prepared for the Innovation
Center for U.S. Dairy. Primary product estimation
U.S. Environmental Protection Agency (2010) Co-Digestion Economic Analysis Tool (CoEAT) http://www.epa.gov/region9/organics/coeat/index.html
Life cycle inventory database:
Ecoinvent v2.2 http://www.ecoinvent.ch/
US LCI database http://www.nrel.gov/lci/
GREET Model (The Greenhouse Gases, Regulated Emissions, and Energy Use in Transportation Model) http://greet.es.anl.gov/ Note on the reference: It gives emissions data and miles per gallon of vehicles powered by diesel fuel and compressed natural gas (CNG)
Niels Jungbluth, et al (2007) ecoinvent report No. 17 Life Cycle Inventories of bioenergy Note on the reference: It gives process data for biogas production, upgrading biogas to compressed natural gas
Life cycle impact assessment methodologies Jane Bare (2011). TRACI 2.0: the tool for the reduction and assessment of chemical and other environmental
impacts 2.0. Clean Techn Environ Policy.
Humbert, S. et al (2012) IMPACT 2002+ vQ2.2: User Guide http://www.quantis-intl.com/pdf/IMPACT2002_UserGuide_for_vQ2.2.pdf
Baseline scenario: Landfill of food waste impact and credit modeling
U.S. Environmental Protection Agency (USEPA) (2006) Solid Waste Management and Greenhouse Gases: A Life-Cycle Assessment of Emissions and Sinks. 3rd Edition. September 2006. Note on the reference: It gives the amount of direct methane emission and carbon sequestration in landfill of food discards in the US.

National Market Value of Anaerobic Digester Products
111
U.S. Environmental Protection Agency (USEPA) (2012a) Chapter 8: Waste in Inventory of U.S. Greenhouse Gas Emissions and Sinks: 1990-2010. Table 8-4. http://www.epa.gov/climatechange/Downloads/ghgemissions/US-GHG-Inventory-2012-Chapter-8-Waste.pdf Accessed 9/7/2012. Note on the reference: It indicates that 28.5% of landfill biogases are recovered for energy production.
U.S. Environmental Protection Agency (USEPA) Landfill Methane Outreach Program (2012b) LMOP landfill and project database, sorted by states, project status, and landfill name [XLS] http://www.epa.gov/lmop/documents/xls/lmopdata.xls Note on the reference: It shows, for recovered landfill biogas, 74% are used for electricity generation, 24% are used for heat and 2% are used for alternative transport fuel.
Illustration: U.S. Environmental Protection Agency (USEPA) Clean Energy Calculations and References
http://www.epa.gov/cleanenergy/energy-resources/refs.html Note on the reference: 5.1 metric tons CO2-Eq /vehicle/year. This number is used for showing the magnitude of climate change credits.
Junbeum Kim et al (2012, accepted by Journal of Industrial ecology, to be published). The Importance of
Normalization References in Interpreting LCA Results Note on the reference: It gives the total phosphorous amount emitted to water in US. This number is used for showing the magnitude of eutrophication credits.

National Market Value of Anaerobic Digester Products
112
Quantis Abbreviations and Acronyms
CFC-11 Trichlorofluoromethane, an ozone -depleting substance CH4 Methane CNG Compressed natural gas CO2 Carbon Dioxide CO2 eq Equivalent global warming potential as 1 kg of CO2 CTU e Comparative toxicity unit, for environmental toxicity CTU h Comparative toxicity unit, for human toxicity DGE Diesel gallon equivalents, the amount of energy in 1 gallon of diesel fuel EPA Environmental Protection Agency eq Equivalents GHG Greenhouse gas GWP Global Warming Potential IPCC Intergovernmental Panel on Climate Change ISO International Organization for Standardization kg Kilogram = 1,000 grams (g) = 2.2 pounds (lbs) km Kilometer kWh Kilowatt-hour = 3,600,000 joules (j) LCA Life Cycle Assessment LCI Life Cycle Inventory LCIA Life Cycle Impact Assessment m Meter m
2 Square meter
m3
Cubic meter MMBTU Million British Thermal Units MJ Megajoule = 1,000,000 joules, (948 Btu) MSW Municipal solid waste MWh Mega watt hour, 1000 kilowatt-hours N Nitrogen NOx Nitrogen Oxides O3 Ozone P Phosphorous PM 2.5 Particulate matter, with particles sized 2.5 micrometers (10
-6 m) and
smaller SO2 Sulfur dioxide Ton Metric ton (1000 kg) USEPA United States Environmental Protection Agency WtE Waste-to-Energy yr year

National Market Value of Anaerobic Digester Products
113
Appendix B1: Life Cycle Assessment (LCA)
LCA is a tool implemented to assess the environmental benefits or drawbacks of decisions and actions across a wide range of industries. It provides a unique ability to quantitatively measure and manage environmental impacts across the full life cycle of products and production systems, beginning with raw material extraction and including all aspects of transportation, production, use, and end-of-life treatment as shown below. It can be integrated with existing corporate programs around product design, procurement, and beyond to provide a lens for assessing and acting in the area of environmental sustainability.
Figure 3: Life Cycle Assessment

National Market Value of Anaerobic Digester Products
114
Appendix B2: Description of Impact Assessment Indicators
The most effective way to achieve long-term environmental results is through the use of a consistent set of metrics and decision making framework. EPA has developed TRACI, the Tool for the Reduction and Assessment of Chemical and other environmental Impacts, to assist in impact assessment for Sustainability Metrics, Life Cycle Assessment, Industrial Ecology, Process Design, and Pollution Prevention. The impact assessment methodology used in this study is based on US EPA TRACI v2.1. The schematic diagram and descriptions of each indicator follow. A full description of the impact assessment method can be found in Bare (2011).
Figure 4: TRACI impact assessment indicators applied in this study
Description of Indicators:
Resources Indicator

National Market Value of Anaerobic Digester Products
115
Fossil fuel depletion
Fossil fuel depletion indicator measures the potential impact on Fossil fuel depletion throughout a product's life cycle. It takes into account the additional energy needed to extract fuels in the future. It does not include the energy embodied in the fuels. The impact metric is expressed in MJ surplus. Fossil fuels production tends to extract the easily recoverable reserves first, so that (assuming fixed technology) continued extraction will become more difficult and energy intensive in the future. This is especially true once economically recoverable reserves of conventional petroleum and natural gas are consumed, leading to the need to use nonconventional sources, such as oil shale.
Ecosystem Quality
Ecotoxicity
Ecotoxicity indicator measures the potential impact on freshwater Ecotoxicity caused by toxic emissions throughout a product's life cycle. It takes into account toxic impacts on freshwater species. The impact metric is expressed in CTUe (i.e. comparative toxic unit for ecosystems in terms of the estimated potentially affected fraction of species (PAF) integrated over time and volume per unit mass of a chemical emitted, i.e. PAF.m3.day.kg−1). The model is based on a thorough evaluation of a large set of existing ecotoxicological models developed for LCA under the UNEP-SETAC Life Cycle Initiative. The latest version of the USEtox model may be downloaded at www.usetox.org to calculate characterization factors for new substances. No available method is recommended to address marine and terrestrial ecotoxicity.
Acidification
Acidification indicator measures the potential impact on Acidification throughout a product's life cycle. It takes into account the increasing concentration of hydrogen ions (H+) within a local environment. The impact metric is expressed in kg SO2-eq. This can be the result of the addition of acids (e.g., nitric acid and sulfuric acid) into the environment, or by the addition of other substances which increase the acidity of the environment due to various chemical reactions and/or biological activity, or by natural circumstances such as the change in soil concentrations because of the growth of local plant species.
Eutrophication
Eutrophication indicator measures the potential impact on Eutrophication throughout a product's life cycle. It takes into account enrichment of an aquatic ecosystem with nutrients (nitrates, phosphates) that accelerate biological productivity (growth of algae and weeds) and an undesirable accumulation of algal biomass. The impact metric is expressed in kg N-

National Market Value of Anaerobic Digester Products
116
eq. Although nitrogen and phosphorus play an important role in the fertilization of agricultural lands and other vegetation, excessive releases of any of these substances may cause undesired effects on the waterways in which they travel. Phosphorus usually has a more negative impact on freshwater lakes and streams, while nitrogen is often more detrimental to coastal environments.
Human Health Indicators
Carcinogenics
Carcinogenics indicator measures the potential impact on Human toxicity, cancer caused by toxic emissions throughout a product's life cycle. It takes into account human exposure to cancer-causing substances. The impact metric is expressed in CTUh (i.e. comparative toxic units for humans in terms of cases per kilogram). The model is based on a thorough evaluation of a large set of existing human toxicological models developed for LCA under the UNEP-SETAC Life Cycle Initiative. The latest version of the USEtox model may be downloaded at www.usetox.org to calculate characterization factors for new substances.
Non Carcinogenics
Non carcinogenics indicator (midpoint; based on USEtox method, Rosenbaum et al. 2008) measures the potential impact on Human toxicity, non-cancer caused by toxic emissions throughout a product's life cycle. It takes into account human exposure to substances that cause undesirable health effects other than cancer. The impact metric is expressed in CTUh (i.e. comparative toxic units for humans in terms of cases per kilogram). The model is based on a thorough evaluation of a large set of existing human toxicological models developed for LCA under the UNEP-SETAC Life Cycle Initiative. The latest version of the USEtox model may be downloaded at www.usetox.org to calculate characterization factors for new substances.
Respiratory Effects
Respiratory effects indicator measures the potential impact on Respiratory effects throughout a product's life cycle. It takes into account particulate matter and precursors to particulates, which cause negative human health effects including respiratory illness and death. The impact metric is expressed in kg PM2.5-eq. Numerous epidemiology studies show an increased mortality rate with elevated levels of ambient particulate matter. Particulate matter may be emitted as particulates, or may be the product of chemical reactions in the air (secondary particulates). The most common precursors to secondary particulates are sulfur dioxide (SO2) and nitrogen oxides (NOx). Common sources of primary and secondary

National Market Value of Anaerobic Digester Products
117
particulates are fossil fuel combustion, wood combustion, and dust particles from roads and fields. The fate and transport of these substances from the point of emission to human exposure differ depending on the source of the emissions.
Ozone Depletion
Ozone depletion indicator measures the potential impact on Ozone depletion throughout a product's life cycle. It takes into account the decrease in ozone molecules in the stratosphere. This metric was proposed by the World Meteorological Organization (WMO), for calculating the relative importance of substances expected to contribute significantly to the breakdown of the ozone layer. The impact metric is expressed in kg CFC-11 eq.
Photochemical Oxidation
Photochemical oxidation indicator measures the potential impact on Photochemical oxidation throughout a product's life cycle. It takes into account various chemical reactions between nitrogen oxides (NOx) and volatile organic compounds (VOCs) in sunlight, which form ozone at the tropospheric level. The characterization factors are calculated based on maximum incremental reactivity (MIR) modeling. A more recent study is now available from Carter for MIR values. Some of this study was conducted specifically for TRACI 2.0. The impact metric is expressed in kg O3-eq. Human health effects can include a variety of respiratory issues such as increasing symptoms of bronchitis, asthma, and emphysema. Permanent lung damage may result from prolonged exposure to ozone. Ecological impacts include damage to various ecosystems and crops. The primary sources of ozone precursors are motor vehicles, electric power utilities, and industrial facilities.
Climate Change
Global Warming
Global warming indicator (midpoint; based on IPCC 2007; also named carbon footprint or impact on climate change) measures the potential impact on Global warming from greenhouse gas emissions throughout a product's life cycle. It takes into account the radiative forcing of a greenhouse gas, expressed in terms of a reference substance and specified time horizon. The midpoint characterization factors are calculated based on the Bern model over a 100 year time horizon. The impact metric is expressed in kg CO2-eq. For example, the global warming potential on a 100 year scale of methane is 25 times higher than CO2, thus its CF is 25 kg CO2-eq.

National Market Value of Anaerobic Digester Products
118
Appendix B3: Further Explanation of Impact Categories in Table 2
Values for two categories of environmental impact are negative. In these instances, the option of sending the food waste to landfill is preferable to digestion, meaning the fermentation of food waste causes a detrimental impact (a net harm).
Fossil fuel depletion: Biogas that is generated from food waste in landfills is harvested at a rate of 28.5% and used primarily for electricity production as well as for heat. This beneficial use of landfill gas is credited to the landfill option and—largely because of the avoided impacts of electricity production—it produces a benefit in fossil fuel depletion. These benefits are not realized by the use of digester gas for biomethane or for compressed natural gas, leaving a greater benefit for landfill in these scenarios. However, use of digester gas for electricity produces positive benefits compared to landfill, as the fossil fuel depletion impact of electricity production is avoided even more by the use of digester gas for electricity than the landfill option. Digester gas is harvested at a higher rate than landfill gas and the assumption is made in the electricity generation scenarios that all of it is converted to electricity.
Acidification: Per mile driven, a car powered by CNG generated from digestion of food waste has more impact on acidification than a conventional diesel car in the scenario where biogas is harnessed for CNG production. This higher impact is because the hydrogen sulfide and ammonia emissions from the production and use of biogas are much larger than acidifying emissions from production and use of conventional diesel. However, use of digester gas for heat or electricity generation produces positive benefits compared to landfill, as the acidification impact of electricity or heat generation is of lesser magnitude than that avoided in electricity or heat generation by other means.