national institute of technologyethesis.nitrkl.ac.in/4840/1/211me3194.pdfsession 2012-2013 in the...
TRANSCRIPT
Determination of sauter mean diameter of four Determination of sauter mean diameter of four Determination of sauter mean diameter of four Determination of sauter mean diameter of four
different fuels and their effects on performance and different fuels and their effects on performance and different fuels and their effects on performance and different fuels and their effects on performance and
emission in a CI engineemission in a CI engineemission in a CI engineemission in a CI engine
A
THESIS SUBMITTED IN PARTIAL FULFILLMENT OF
THE REQUIREMENTS FOR THE DEGREE OF
Master of Technology
In
Mechanical Engineering
(Specialization: Thermal Engineering)
By
NIRAJ TOPPO
ROLL NO 211ME3194
Guided by
Dr. S. MURUGAN
DEPARTMENT OF MECHANICAL ENGINEERING
NATIONAL INSTITUTE OF TECHNOLOGY ROURKELA 769008

i
NATIONAL INSTITUTE OF TECHNOLOGY
ROURKELA (INDIA)
CERTIFICATE
This is to certify that the thesis entitled, “Determination of sauter mean diameter of four
different fuels and their effects on performance and emission in a CI engine” submitted
by Mr. Niraj Toppo in partial fulfilment of the requirements for the award of Master of
Technology in Mechanical Engineering with Thermal Engineering specialization during
session 2012-2013 in the Department of Mechanical Engineering, National Institute of
Technology, Rourkela.
It is an authentic work carried out by him under my supervision and guidance. To the best of
my knowledge, the matter embodied in this thesis has not been submitted to any other
University/Institute for the award of any Degree or Diploma.
Dr. S. Murugan (Associate Professor)
Date: Department of Mechanical Engineering Place: Rourkela National Institute of Technology, Rourkela
Odhisa, India

ii
ACKNOWLEDGEMENT
First and foremost I record my sincere gratitude and respect towards my project supervisor,
Dr. S. MURUGAN, Associate professor, Department of Mechanical Engineering, for his
valuable guidance, valuable suggestions and endless support during my study. He has not
only been a wonderful supervisor, but also a genuine person. I consider myself extremely
lucky to be able to work under guidance of such a dynamic personality. This thesis was made
possible by his patience and persistence.
After the completion of this thesis, I experience the feeling of achievement and satisfaction.
Looking into the past I realize how impossible it was for me to succeed on my own. I wish to
express my deep gratitude to all those who extended their helping hands towards me in
various ways during my short tenure at NIT Rourkela.
I also express my sincere thanks to Prof. K.P. MAITY, HOD, Department of Mechanical
Engineering, Prof. R.K. SAHOO, Professor and group head, Thermal Engineering
Specialization and also the other staff members of Department of Mechanical Engineering,
NIT Rourkela, for providing me the necessary facilities that was required to conduct the
experiment and completion of my thesis.
I also express my special thanks to our research scholar Mrs. PRITINIKA BEHERA, Mr.
R. PRAKASH, Mrs. DULARI HANSDAH, Mr. ARUN KUMAR WAMANKAR, Mr.
ABHISEK SHARMA and my batch mates Mr. KISHAN KHALDIA, Mr. CHANCHAL
KUMAR GAUTAM and Mr. PAUL PRAMOD LAKRA for their support during my
experimentation. I also express my deep thanks to our lab instructor Mr. N.P. BARIKI and
Mr. N.K. BISOI for their help and encouragement.
I am especially indebted to my parents for their love, sacrifice, and support. They are my first
teachers after I came to this world and have set great examples for me about how to live,
study and work.
DATE: NIRAJ TOPPO

iii
ABSTRACT
Spray characteristics play a vital role on mixture formation of injected fuel with air in a
compression ignition (CI) engine. The better mixing rate of fuel with air helps to improve
performance and reduce the tailpipe emissions of the CI engine. Spray characteristics are
generally influenced by engine’s injection characteristics and fuel quality. The physical
properties of fuels like viscosity, density, bulk modulus and surface tension affect the droplet
size that causes spray formation. In this experimental study, the droplet size in terms of sauter
mean diameter (SMD) of different non conventional liquid fuels were studied experimentally
and compared the performance and emission parameters with diesel fuel. For this purpose,
an experimental setup was developed in a lab scale to capture the droplets of injected fuel at
200 bar injection pressure. The fuel was injected on a magnesium oxide coated plate
materials. The droplet size and spray angle were measured with the help of image analyzer.
The results showed that as the blending ratio increases, the spray size distribution and mean
diameter become large. For all the blended fuel Sauter mean diameter (SMD) is higher than
that of diesel.
KEYWORDS- Sauter mean diameter, Image analyzer, Magnesium oxide, blended fuel.

iv
CONTENTS
Description Page no.
Certificate i
Acknowledgement ii
Abstract iii
Contents iv
List of figures vii
List of tables viii
Nomenclature ix
Chapter 1 Introduction 1-14
1.1 General 1
1.2 Energy scenario of CI engine application in India 1
1.2.1 Uses of diesel in India 2
1.2.1.1 Transportation 2
1.2.1.2 Power generation 2
1.2.1.3 Industry 2
1.2.1.4 Agriculture 2
1.2.1.5 Military equipment 3
1.3 Fuels for CI engines 4
1.3.1 Solid fuels 4
1.3.2. Liquids fuels 4
1.3.2.1 Biodiesel 5
1.3.2.2 Alcohols 5
1.3.2.3 Methanol 6
1.3.2.4 Ethanol 6
1.3.2.5 Vegetable oil 6
1.3.3 Gaseous fuels 7
1.3.3.1 Hydrogen 7
1.4.Combustion in reciprocating engines 8
1.4.1 Droplet combustion 8
1.5 Oxidiser for combustion 9
1.5.1 Air as an oxidiser 9

v
1.5.2 Stoichiometric ratio 10
1.6 Principle of four stroke diesel engine 10
1.7 Combustion in compression ignition engine 11
1.8 Sauter mean diameter 14
1.9 Objective of the present study 14
Chapter 2 Literature Review 15-21
Chapter 3 Experimentation 22-32
3.1 Fuel preparation for the study 22
3.2 Used transformer oil 22
3.2.1 Pyrolysis oil 23
3.3 Wood pyrolysis oil 23
3.3.1 Biodiesel preparation 23
3.3.2 Wood pyrolysis oil preparation 24
3.3.3 Emulsification of WPO and Biodiesel 25
3.4 Biodiesel TPO Blend 26
3.4.1 Tyre pyrolysis oil 26
3.4.2 Preparation of tyre pyrolysis oil 26
3.5 Properties of test fuels 27
3.6 Experimental study 27
3.6.1 Droplet measurement 28
3.7 Experimental set up for sauter mean diameter 28
3.7.1 Arrangement for nozzle and nozzle injector 29
3.7.2 Coatings of plates 29
3.7.3 Use of microscope and software for the study 30
3.8 Steps involved in droplet size measurement 30
3.9 Specification of diesel engine 31
Chapter 4 Result and Discussion 33-42
4.1 Droplet images of diesel, UTO and UTO40 33
4.1.1 Determination of sauter mean diameter 34
4.2 Droplet images of diesel, JOE15 and JME 34
4.2.1 Determination of sauter mean diameter 35
4.3 Droplet images of diesel, TPO5,TPO and TPO15 36
4.3.1 Determination of sauter mean diameter 36

vi
4.4 Comparisons of performance parameters 37
4.4.1 Brake specific energy consumption 37
4.4.2 Exhaust gas temperature 38
4.5 Comparisons of emission parameters 39
4.5.1 Hydrocarbon emission 39
4.5.2 Carbon monoxide emission 39
4.5.3 Nitric oxide emission 40
4.5.4 Smoke 41
Chapter 5 Conclusion 43
References 44-47
Annexure 48-50
A1 Technical specification of exhaust gas analyser 48
A2 Technical specification of diesel smoke meter 50
Research Paper published in conference/ Published in Journal 51

vii
LIST OF FIGURES
Fig. No. Description Page No.
1.1 Consumption of diesel and petroleum products in India 1
1.2 Cycle of operation of a CI engine 11
1.3 Schematic representation of a disintegration of a fuel jet 12
3.1 Production of JME biodiesel oil 23
3.2 Schematic diagram of pyrolysis set up 25
3.3 Pyrolysis process of waste automobile tyre 26
3.4 Pyrolysis set up 27
3.5 Arrangement for experimental set up 28
3.6 Single hole nozzle 29
3.7 MgO coated glass plate 29
3.8 An inverted microscope and a computer 30
3.9 Experimental set up 32
4.1 Droplet images of diesel, UTO and UTO40 33
4.2 Droplet images of diesel, JOE15 and JME 34
4.3 Droplet images of diesel, TPO5,TPO and TPO15 36
4.4 Variation of brake specific energy consumption with engine load 37
4.5 Variation of exhaust gas temperature with engine load 38
4.6 Variation of hydrocarbon emission with engine load. 39
4.7 Variation of Carbon monoxide emission with engine load 40
4.8 Variation of nitric oxide emission with engine load 41
4.9 Variation of smoke density with engine load 41

viii
LIST OF TABLES
Table No. Description Page No.
1.1 Sector wise share of GDP and total diesel consumed 3
1.2 Electronegativity of elements 9
3.1 Comparison of fuel properties of different test fuels 27
3.2 Technical specification of the engine 31
4.1 Droplet number of diesel, UTO and UTO40 33
4.2 SMD of diesel, UTO and UTO40 34
4.3 Droplet number of diesel, JME and JOE15 35
4.4 SMD of diesel, JME and JOE15 35
4.5 Droplet number of diesel, TPO5, TPO and TPO15 36
4.6 SMD of diesel, TPO5, TPO and TPO15 37

ix
NOMENCLATURE
Sl. No. Short form Full form
1 SMD Sauter mean diameter
2 CI Compression ignition
3 TPO Tyre pyrolysis oil
4 WPO Wood pyrolysis oil
5 UTO Used transformer oil
6 JME Jatropha Methyl Ester
7 JOE Jatropha Oil Emulsion
8 H2O Water
9 CO2 Carbon dioxide
10 CO Carbon monoxide
11 NO Nitric Oxide
12 MgO Magnesium oxide
13 CR Compression ratio

1
CHAPTER 1
INTRODUCTION
1.1 GENERAL
In a compression ignition (CI) engine, the fuel is introduced into a hot air stream and gets
ignited and burnt. This is in contrast to the spark-ignition (SI) engine which uses a spark
plug to ignite an air-fuel mixture. The CI engines are manufactured in two-stroke and four-
stroke versions. Since the 1910s, they have been used in submarines and ships. They were
introduced in locomotives, trucks, heavy equipment and electric generating plants later. In
early 1930s, the use of CI engines was picked up in a few automobiles. Since 1970, CI
engine have been used larger on-road and off-road vehicles. As of 2007, about 50% of all
new car sales in Europe are the CI engines. Now a days, the CI engines are more preferred
than SI engine because, the former has a higher thermal efficiency and durability than the
later. As a result, the diesel fuel consumption increases drastically. The diesel run
automotive vehicles and stationary engines emit more pollutants to the environment. The
fuel quality plays an important role on the combustion parameters. The fuel quality also
predominantly affects the formation of emissions in the CI engines. As there is a heavy
demand for CI engine fuel, many researchers and engineers try to explore and utilize variety
of alternative fuels. Before, utilizing any alternative liquid fuel in a CI engine, it is
necessary to study the fuel properties and the spray formation of fuel.
1.2 ENERGY SCENARIO OF CI ENGINE APPLICATION IN INDIA
Figure 1.1 Consumption of diesel and petroleum products in India,1974-1975 to 2010-11

2
Figure 1.1 illustrates the consumption of diesel during the period 1974-2011. It is seen from
Fig.1.1 that the consumption has significantly increased from six million tonnes to about 60
million tonnes between the years 1974-1975 and 2010-2011. During that period, the shares of
diesel in total consumption of petroleum products has varied from 27 percent in the period
1974-1975 to a high 43 percent in the years 1995-1996 and 1997-1998 respectively.
1.2.1 USES OF DIESEL IN INDIA
Among the existing fuels, diesel presents wide applications in India. Diesel is consumed in
the following applications:
1.2.1.1 Transportation
Goods – railways (freight), maritime (carriers, liners), military vehicles, heavy and light
commercial vehicles; Passenger – railways, roadways [buses, personal vehicles (cars, utility
vehicles)], waterways [motor-boats, steamers, ferries, catamarans, yachts, cruise ships].
1.2.1.2 Power generation
Power plants, industrial captive power, back-up generators (large commercial, residential
units). Diesel engines are used in running water-pumps for irrigation is likely accounted
under either ‘power generation’ or more likely ‘farm equipment’. Diesel engines are used to
power mobile telephone towers which are likely accounted under ‘power generation’. Some
suggest that roughly one-third of diesel for power generation caters to the need of the
telephone towers.
1.2.1.3 Industry
In industry, diesel is generally used as stand by for conveyors, pumps and motors. To meet
the emergency power needs, the switch gears involved continuously monitors the electrical
current and if the power is interrupted for any reason it automatically loads to the generators.
Today, many five star hotels, manufacturing plants, municipal buildings, data centres, tele-
communication organizations, hospitals, nursing homes, financial institution, mining
companies and financial institution have diesel engine generators as back up.
1.2.1.4 Agriculture
Diesel technology is used for the world’s farms and ranches, powering two-thirds of all farm
equipment. The typical use of diesel in agriculture: used to pump the water or provide power
for growing crops or raising livestock. Agriculture uses diesel engines as the source to power
almost $19 billion worth of tractors, combines irrigation pumps and other farm equipment.

3
1.2.1.5 Military equipment
Diesel engines are used to move weapons systems and to power all kinds of auxiliary mobile
and stationary equipment, including generators, compressors, pumps, most of the amphibious
force vessel (e.g. vehicle transporting troops equipments, material to mission sites), Auxiliary
ships (e.g. combat support vessels), Military sealift command (All oilers and fleet ocean tugs,
combats stores etc.), Navy sealift force (e.g. Tanker and Roll-on-Roll off ships), Ice-breakers
propelled by diesel-electric systems (e.g. work horse icebreakers), Most armor and self-
propelled artillery are diesel powered, with a wide range of uses and functions(e.g. armored
personnel carriers, ambulances, mortar carriers, anti-aircraft gun carriers, missile launchers),
almost all military equipments and logistics systems (e.g. prime movers, heavy-equipments
transporters, special attack vehicles etc.).
Table 1.1 gives the share of diesel consumption in broad areas of economic activity, in India.
The contribution of respective activities to GDP is also presented. It is observed that diesel is
used as an input in activities that together account for about two-fifths of GDP in India during
2008-9 and 2009-10.
Table 1.1 Sector-wise share of GDP and total diesel consumed (percent))))
Sector
Mode
Diesel consumed GDP
2008-9 2009-10 2010-11 2008-9 2009-10
Transportation
Railways 4.2 4.0 4.0 1.0 1.0
Water 1.4 1.2 0.9
5.6
5.5 Aviation Negligible
Road 59.6
60.0
60.4
Industry 10.2 Power Generation 8.3
10.7
8.3
10.5 8.2
15.6 (10.6)
2.0
15.9 (10.7)
2.0 Agriculture 11.9 12.1 12.2 15.7
(13.3) 14.6
(12.3) Miscellaneous 4.2 3.5 3.6

4
1.3 FUELS FOR CI ENGINES
An internal combustion (IC) engine converts the heat energy obtained from the chemical
combination of fuel with oxygen, into mechanical energy. Since, the heat energy is derived
from the fuel, a fundamental knowledge of the types of fuel and their characteristics is
essential in order to understand the combustion phenomenon. The characteristics of the fuel
have considerable influence on the design, efficiency, output and particularly, the reliability
and durability of the engine. CI engines can be operated on different types of fuels liquid,
gaseous and solid fuels. Depending upon the types of fuels to be used the engine has to be
designed accordingly. An alternative fuel may be a renewable or non-conventional fuel
derived from various organic substances that can substitute or replace conventional fuels for
CI engines to a little or a greater proportion. Conventional fuels include fossil fuels
(petroleum (oil), coal, propane, and natural gas), Some well-known alternative fuels include
biodiesel, alcohol (methanol, ethanol, butanol), chemically stored electricity (batteries and
fuel cells), hydrogen, non-fossil methane, non-fossil natural gas, vegetable oil, and other
biomass sources.
1.3.1 SOLID FUELS
The solid fuels find less practical applications at present, because of the problems associated
with the handling and disposal of ash after combustion. However, in the initial stages of the
engine development, solid fuels such as finely powdered coal were attempted. Compared to
the gaseous and liquid fuels, the solid fuels are quite difficult to handle, store and feeding are
quite cumbersome. Because of the complications in the design of the fuel feed systems, these
fuels have become unsuitable in solid forms. Attempts are being made to generate
gaseous or liquid fuels from charcoal for the use in CI engine. Examples of solid
fuels include coal, charcoal and biomass.
1.3.2 LIQUID FUELS
In most of the modern CI engines, liquid fuels which are the derivatives of liquid petroleum
are being used. Liquid fuels are easy to transport, and can be handled with relative ease.
Also, they are relatively easy to use for all engineering applications, and home use. Most of
the liquid fuels are derived from crude oil; however, fuels such as hydrogen, ethanol, and
biodiesel, derived from the biomass and the other feed stocks are also categorized as liquid
fuels. Crude oil is formed from the fossilized remains of dead plants and animals by exposure

5
to heat and pressure in the earth's crust. Petroleum products are the main fuels for IC engines
as on today. There are varieties of alternative liquid fuels considered presently which are
biodiesel, alcohol, vegetable oil etc.
1.3.2.1 BIODIESEL
Biodiesel is a methyl or ethyl ester of fatty acid made from vegetable oils and animal fats. It
was discovered even before fossil fuel like gas, coal and oil. It is environmental friendly than
other fuel like petrol or diesel. It is a clean fuel and a more economic as it encourages the
recycling process and can be manufactured from waste oils. It can be easily pumped and
handled. It contains no petroleum and it can be blended with diesel at any level to create
biodiesel blends. The use of biodiesel in a CI engine results in reduction of unburned
hydrocarbons, carbon monoxide and particulate matter emissions. Biodiesel is a clean fuel, as
it contains no sulphur, no aroma but it contains 10% oxygen, which helps it to burn fully. It
has been designated as an alternative fuel by the U.S. Department of energy and the
Department of Transportation. The raw materials for biodiesel vary for each country.
Sunflower, rape seed oil etc., are used as a raw material in Europe, soyabean is used as a raw
material in the U.S, palm oil is used in Thailand and, frying oil and animal fats is used in
Ireland. Biodiesel can be used in diesel engines as B5, a blend of 5% biodiesel in diesel fuel
or B20 or B100. In India, biodiesel is produced from non edible oils obtained from Jatropha
cureas, Karanj, Mahua (Madhuca Indica) etc. The by product of biodiesel from the process
are the seed oil cake and glycerol, which have good commercial values.
1.3.2.2 ALCOHOLS
Alcohols are used as an alternative fuel, because they can be easily obtained from natural and
manufactured sources. Alcohols are of two types, ethanol and methanol which can be
produced from sugarcane waste, and many other agricultural products. All starch rich plants
like maize, tapioca, and potato can also be used to produce alcohol as well as cellulosic waste
materials can also be used.
The main advantages of alcohol as an alternative fuel are as follows;
(i) Alcohol can be obtained from a large number of sources either natural or artificial.
(ii) It emits less emission when compared with gasoline.
(iii) It is a high octane fuel and has higher flame speed.
(iv) It has very less sulphur content.
(v) It gives higher pressure and more power in the expansion stroke.

6
The disadvantages of alcohols as fuels are as given below;
(i) Alcohol has a low calorific value.
(ii) It has very poor ignition characteristics, because of high octane number.
(iii) Its flame is invisible which is very dangerous during handling of fuel.
(iv) It produces aldheydes after combustion.
(v) Alcohol fuel has low lubricating qualities which creates trouble in injection pump and nozzle.
1.3.2.3 METHANOL
Methanol is the most promising fuel in future which can be obtained from fossil fuel and
renewable sources. This includes wood, coal, biomass, petroleum, natural gas etc. Methanol
is not good for CI engines, due to its high octane number, but if a small amount of diesel fuel
is used for ignition, it can give a good result. Methanol can be obtained from a cheaper source
as compared to diesel. Pure methanol and mixture of methanol and gasoline in various
proportions have been extensively tested in engines, the most common mixture are M85
(which have 85% methanol and 15% gasoline) and M10 (which have 10% methanol and 90%
gasoline).
1.3.2.4 ETHANOL
Ethanol is produced from ethylene or made by fermenting sugar components of the plant
materials and it is mostly made from sugar, beats, corn, sugarcane and starch crops. With the
advanced technology, cellulosic biomass like trees and grasses are used as feed stocks for
production of ethanol. Ethanol can be used as a fuel for the vehicles in the pure form, but it is
mainly used as a gasoline additive to increase the octane number and improve the vehicle
emissions. Ethanol has been used as an alternative fuel in various countries of the world for
many years. It is widely used in USA and in Brazil.
1.3.2.5 VEGETABLE OIL
Vegetable oil can also be used as an alternative liquid fuel for diesel engines, because they
are renewable in nature, easily available and can reduce CO2 emissions. There are many
vegetable oils like peanut oil, linseed oil, rapeseed oil which can be used in diesel engines
directly or when blended with diesel fuel. The draw backs associated with the use of
vegetable oils in CI engines are given below;

7
(i) The viscosity of vegetable oil is much higher than diesel. It can cause many
problems such as fuel handling, atomization and fuel jet penetration.
(ii) Vegetable oil burns slowly. It can give rise to exhaust smoke, fuel impingement
on cylinder wall and contamination of lubricating oil.
1.3.3 GASEOUS FUELS
Gaseous fuels are preferred in CI engines and pose no problems as, they mix more
homogenously with air and eliminate the distribution and starting problems that are found
with liquid fuels. Even though the gaseous fuels are most ideal for CI engines, the problems
associated with the storage and handling problems restrict their use in automobiles.
Consequently, they are more commonly used in stationery power plants that are located near
the source of fuel. Some of the gaseous fuels can be liquefied under pressure for reducing the
storage volume. But, this arrangement is very expensive as well as risky. Because of the
energy crisis in the recent years, considerable research efforts are being made to improve the
design and performance of the engines. Hydrogen fuel is treated as the main alternative
gaseous fuel.
1.3.3.1 HYDROGEN
Hydrogen has the potential to solve the environmental problem, air pollution and global
warming. Utilization of hydrogen as a fuel for engine is not a new concept. Hydrogen could
meet the twin challenges of energy crisis and environmental pollution. Hydrogen can be
produced from renewable source. The common pollutants which come out of the exhaust of a
gasoline or diesel engine are practically absent in case of hydrogen fueled engine.
The advantages of hydrogen as an alternative fuel are as follow;
(i) There is no carbon in the fuel, so there is no CO or HC in the exhaust of the
engine.
(ii) Hydrogen is available in abundance and there are large numbers of different ways
of making hydrogen.
(iii) Fuel leakage to the environment is not a problem as it is pollutant free.
(iv) It has high energy content per volume when stored as a liquid.
(v) Hydrogen as an engine fuel is exceptionally clean burning.

8
1.4 COMBUSTION IN RECIPROCATING ENGINES
In a CI engine, diesel as a fuel is injected at high pressure. During the compression stroke, the
air temperature rises to such an extent that when liquid droplets is injected, ignition takes
place. One of the major requirement of the CI engine is that ignition should take place very
fast. The typical time available for combustion in an engine, for example an engine running
with 1500 revolution per minute is 2-4 ms. This requires the droplet size to be very fine. The
other requirement for ignition is the environmental conditions, under which it's operates.
1.4.1 DROPLET COMBUSTION [3]
In a CI engine, the air is compressed in the combustion chamber at a high pressure, and the
diesel fuel is injected into the combustion chamber in the form of fine spray. In order to know
the droplet combustion, it is necessary to determine the burn rate of a liquid droplet, and the
thermodynamic and transport properties of the droplet in the combustion chamber.
Burn rate which is a function of diameter is affected by the flow of oxygen past the droplet by
free or forced convection. In case of free convection, burn rate is dependent on Grashoff
number, and in case of forced convection, it is dependent on Reynolds number.
The differential equation for energy conservation is;
��� 4���� ��
�� − � ��� � � = 0 -------- (1.1)
This differential equation is of second order, in which �
�� 4���� ���� represents the conduction
heat transfer and the term, � ��� � � represents the convection heat transfer.
Now applying the boundary equation;
At r = rs, T=Ts
And when � → ∞, � → ��
The equation (1.1) becomes
[4���� ����]��=� � --------- (1.2)
Where L=latent heat,
In the above equation,
Heat transferred from the outer region to the surface =heat taken away by vaporising liquid.
Again from equation (1.1) and (1.2)
� = 4���(�/� )� ln(1 + $%)------- (1.3)

9
Where,$% = � (�� − ��)/�, called the transfer number, which indicates the thermodynamic
potential to cause vaporisation. K is the thermal conductivity or transport property and cp
specific heat at constant pressure.
Equation (1.3) indicates the vaporisation rate, which is directly proportional to radius of
droplets. The dependence on transfer number is weak as logarithmic term changes little for
large variation of Bv. This shows that time for combustion is much smaller than that for
vapourisation, which is affected by the transfer number.
1.5 OXIDISER FOR COMBUSTION
Oxidiser is one which accepts electron and fuel is one which can donate its electron.
Oxidisers are composed of carbon, hydrogen, nitrogen, oxygen and other CI elements. The
various elements which are categorised in terms of donating the electron and receiving the
electron are shown by a table called electro negativity table. Table 1.2 gives the Pauling’s
electro negativity in ascending order.
Table1.2 Electro-negativity of elements
Elements Electro-negativity Elements Electro-negativity
K 0.8 H, P 2.1
Na, Ba 0.9 C, S, I 2.5
Li, Ca 1.0 Br 2.8
Mg, 1.2 N, Cl 3.0
Be, Al 1.5 O 3.5
B 2.0 F 4.0
As we see from Table 1.2, the fluorine has the highest capacity of accepting the electron. The
next elements after fluorine are oxygen, chlorine, bromine and iodine. The elements which
donate its electron are known as fuel which is carbon, hydrogen, aluminium, magnesium,
lithium etc.
1.5.1 AIR AS AN OXIDISER [3]
As fluorine has the highest capacity of accepting the electron, it is very powerful oxidiser,
which would react very quickly and form stable products. Therefore, it can’t be used as an
oxidiser in combustion. The next element after fluorine is oxygen which is most abundantly

10
available and a powerful oxidiser. The power produced by oxygen is very high so it is diluted
with inert substance nitrogen to reduce its power.
1.5.2 STOICHIOMETRIC RATIO
Stoichiometric ratio implies the ratio of oxidiser to fuel, which leads to complete product of
combustion. The elements which are used as a fuel are carbon and hydrogen and the elements
which are used as an oxidiser are oxygen. The stoichiometric reactions are represented as:
H2 + 1/2O2 H2O -------(1.4)
H2 + (1/2) O2 + [79 / (21x2) N2] H2O + [79/(21x2)N2] -------(1.5)
CH4 + (3/2) O2 CO2+H2O -------(1.6)
CH2 + (3/2) O2 + (79/21) x (3/2)N2 CO2+H2O + (79/21)x(3/2)N2 -------(1.7)
In the above equation (1.4), one mole of hydrogen react with half mole of oxygen to give one
mole of H2O or 2 gm of hydrogen reacts with 16 gm of oxygen to give 18 gm of water. The
stoichiometric ratio for the above equation is 16/2=8.
In equation (1.5) 1 mole of H2 react with ½ mole of oxygen and 1.88 mole of N2 to give 1
mole of water and 1.88 mole of nitrogen. The stoichiometric ratio in this case is
16+[(79/(21x2))x28]/2=34.4.
The stoichiometric ratio in equation (1.6) is 3.4, and in equation (1.7) is 14.7. Thus, we see
that in equation (1.7) there is no excess oxygen left with the product being CO2, H2O and N2.
The proportion of air to fuel is termed as stiochiometric ratio which is 14.7.
1.6 PRINCIPLE OF FOUR STOKE DIESEL ENGINE
Diesel engines can be of two types based on the number of strokes; (i) two stroke and (ii) four
stroke. Four stroke diesel engines are highly preferred than two stroke engines because of the
former have the following merits:
(a) The thermal efficiency of the four stroke diesel engine is greater than two stroke diesel
engine.
(b) The overall efficiency of four stroke diesel engines is greater than two stroke diesel
engines.
(c) The consumption of lubricating oil is less than that of two strokes.

11
(d) Four stoke diesel engine have high compression ratio in respect to two stroke diesel
engine.
In the CI engine, air alone is inducted during suction stroke. Due to the high compression
ratio employed, the temperature at the end of the compression stroke is sufficiently high to
self ignite the fuel which is injected into the combustion chamber. A high pressure fuel pump
and an injector are provided to inject the fuel into the combustion chamber.
The ideal sequence of operation for the four-stroke CI engine are shown in the Fig 1.2
(a) Suction (b) Compression (c) Expansion (d) Exhaust
Figure.1.2 Cycle of operation of a CI Engine
(i) Suction Stroke: Air alone is inducted during the suction stroke. During this stroke intake
valve is open and exhaust valve is closed, Fig 1.2 (a).
(ii) Compression Stroke: Air inducted during the suction stroke is compressed into the
clearance volume. Both valves remain closed during this stroke, Fig 1.2 (b).
(iii) Expansion Stroke: Fuel injection starts nearly at the end of compression stroke. Heat is
assumed to have been added at constant pressure. After the injection of fuel is completed (i.e.
after cut-off) the products of combustion expand. Both the valves remain closed during the
expansion stroke, Fig 1.2 (c).
(iv) Exhaust Stroke: The piston travelling from BDC to TDC pushes out the products of
combustion. The exhaust valve is open and the intake valve is closed during this stroke, Fig
1.2 (d).
1.7 COMBUSTION IN COMPRESSION-IGNITION ENGINES
In the compression ignition engine, air is compressed into the combustion chamber at a high
compression ratio of 16:1 to 20:1 during its compression stroke raising its temperature and

12
pressure to a high value. Fuel which is also highly compressed to a high pressure of 110 to
200 bar by means of a fuel pump is injected through one or more jets into the highly
compressed and heated air in the form of liquid jet. Each droplet as it entered into the hot air
is quickly surrounded by an envelope of its own vapour Fig 1.3(a), and after that it is flamed
at the surface of the envelope.
Fig 1.3(a) [Source: Internal combustion engines,V.Ganesan,TMH publishers]
Fig 1.3(b) No Air Swirl
Fig 1.3(c) with air swirl
Figure.1.3 Schematic Representation of a Disintegration of a Fuel Jet [1]

13
In order to evaporate the liquid the latent heat of vapourization is absorbed from the
surrounding air which reduces the temperature of a thin layer of air surrounding the droplet
and some time elapse before this the temperature can be raised again by taking heat from the
main bulk of air. As soon as this vapour and air comes in contact, it reaches a certain
temperature and the local A/F ratio is in the combustion range, ignition takes place. Once
ignition has started and a flame is established, the heats required for further evaporation are
supplied from that released from combustion.
Thus it is seen that, it takes certain time interval to ignite fuel and air in the combustion
chamber called delay period. The duration of delay period depends upon the temperature and
the pressure of the fuel. The higher the air temperature, the shorter will be the delay period.
The higher pressure also results in the shorter ignition delay because of the increase in the
rate of heat transfer. Subsequently the heat is released as a result of a continuous combustion
of fuel. This is mainly divided into two phase;
(i) Uncontrolled combustion or premixed combustion.
(ii) Controlled combustion or diffuse combustion.
After this, late burning of fuel occurs where the heat released by the fuel. In the CI engine,
the fuel droplet is not injected uniformly in the combustion chamber due to heterogeneous
mixture, but it spreads over a definite period of time which is 20-40 degree of the crank
travel. The initial fuel droplets meet the air whose temperature is little above their self
ignition temperature and are ignited after the ignition delay period. The subsequent fuel
droplets find air which is already heated to a much higher temperature by the burning of the
initial droplets.
It is not possible to inject the fuel droplet uniformly due to heterogeneous mixture. So under
these conditions, if the air in the cylinder is motionless, only a small proportion of the fuel
would find sufficient oxygen for burning Fig 1.3(b), and even burning of this fuel would be
slow as it is surrounded by its own product of combustion. Therefore, it is essential to impart
an orderly and controlled movement to air and fuel so that a continuous supply of fresh air is
brought for each burning droplet and the products of combustion are swept away. The effect
of this motion of air is called air swirl on the fuel jet as shown in Fig 1.3(c).

14
1.8 SAUTER MEAN DIAMETER
The Sauter Mean Diameter is the measure of mean droplets diameter, the finer and more
homogenous the atomization, the more complete will be physical preparation of the fuel and
more easily effective combustion is achieved. The Sauter mean diameter (SMD) is a very
common parameter in fluid dynamics used for expressing the fineness of a spray in terms of
the surface area of the spray droplets. Studies include the measurement of droplet size using
magnesium oxide (Mgo) coating technique and converting into more sophisticated Laser
Beam technique. Though Mgo technique is erraneous, it is simple and can be used in any
laboratory environment compared to highly sophisticated and very costly Malvern particle
analyser which is out of reach of many researches.
1.9 OBJECTIVE OF THE PRESENT STUDY
The objective of the present work is to determine the Sauter mean diameter (SMD) of four
different fuels, analyse the images of their sprays and effects of it on performance and
emission in a CI engine. The four oils taken for the study are given below;
(i) Diesel oil for reference data.
(ii) A waste oil from industry and its diesel blend.
(iii) A pyrolytic oil from wood and its emulsion with biodiesel.
(iv) A pyrolytic oil from scrap tyres and its biodiesel blend.

15
CHAPTER 2
LITERATURE REVIEW
Choi and Oh [4] investigated the spray characteristics of diesel and biodiesel blends.
Experiments were performed to analyze the effect of blend ratio and injection pressure on the
spray behaviour. The spray atomization characteristics were also studied using sauter mean
diameter (SMD) of the fuel droplets. It was found that the fuel containing unrefined biodiesel
exhibited different spray pattern in comparison with diesel fuel due to the fuel's high
viscosity and large surface tension. The results indicated that the increase in the injection
pressure caused the SMD to become smaller.
He et al., [5] conducted an experiment to investigate the spray properties, spray tip
penetration and cone angle of biodiesel. The experimental setup comprised of an electronic
unit-pump (EUP) bench, a constant volume chamber and a high-speed digital camera. The
experimental results indicated that the spray tip penetration and cone angles of biodiesel
increased with increasing injection durations. Also, with decreasing ambient pressure, the
spray tip penetration increased while the cone angle decreased.
Kumar et al., [6] investigated the effect of ambient pressure on spray characteristics such as
tip penetration, cone angle and spray area in a constant volume spray chamber of karanja
biodiesel (KB100), diesel(KBO) and blends (KB5 and KB20). The results of macro-analysis
show that with diesel, B100 gives the highest spray tip penetration, cone angle and spray area
followed by KB20, KB5 and diesel respectively because of differences in fuel density.
Reddy [7] studied the droplet size measurement and engine performance using non-edible
oils like Mahua, Neem, and Silk worm papae (SWP) oil as substitute fuels. The sauter mean
diameter of Mahua, Neem and Silk worm papae oil were measured using magnesium oxide
(Mgo) coated technique and converted into equivalent value of Malvern particle laser beam
analyzer technique and compared them with diesel. The results concluded that the SMD
values of oils were found to be almost same as they were preheated and brought to the
viscosity levels equal to that of diesel, largest number of drops fell in the range of 20 to 40
micron at given pressure, and engine run with 100% (pure) Mahua oil, Neem oil and silk
worm papae oil can be sprayed without difficulty and no studies also suggested that engine
modification is necessary.

16
Bae and Kang [8] investigated various spray characteristics from different holes of VCO
(Valves Covered Orifices) nozzles and its results were compared to standard SAC nozzle.
The global characteristics of the spray, including spray angle, spray tip penetration, and spray
pattern were measured from the spray images which were frozen by an instantaneous
photography with a spark light sources and ICCD.
Choi [9] investigated the spray behaviour and atomization characteristics for the combination
of non-esterification biodiesel and fuel additive Water Dipole Power (WDP) and Isopropyl
Alcohol (IPA). The process of spray was visualized through the visualization system
composed of a halogen lamp and high speed camera, and atomization characteristics were
investigated through Laser Diffraction Particle size Analyzer (LDPA). When blending the
WDP and IPA with biodiesel, atomization and spray characteristics were improved, and SMD
of blended fuel, WDP 25% and biodiesel 75%, was 33.9% reduced at a distance of 6 cm from
a nozzle tip under injection pressure 30MPa.
Park et al., [10] focused on the study to investigate the spray characteristics and atomization
performance of gasoline fuel (G100), bioethanol fuel (E100), and bioethanol blended
gasoline fuel (E85) in a direct injection, gasoline injector in a gasoline engine. The overall
spray and atomization characteristics such as an axial spray tip penetration, spray width, and
overall SMD were measured experimentally and predicted by using KIVA-3V code. The
axial spray tip penetrations of the test fuels were similar, while the spray width and the spray
cone angle of E100 were marginally larger than the other fuels. In terms of atomization
performance, the E100 fuel among the tested fuels had the largest droplet size because E100
has a high kinematic viscosity and surface tension.
Dong et al., [11] studied the spray characteristics including the spray angle and the spray tip
penetration by the comparison of two V-type intersecting hole nozzles with different
intersecting angles and a single hole nozzle under variable boundary conditions. The
characteristic of fuel droplet diameter was also carried out by using Phase Doppler
Anemometry (PDA). Comparing to conventional nozzles, the two V-type intersecting hole
nozzles showed a significant improvement of spray spatial distribution with the same exit
area and injection pressure level according to the dSVER.
Lin and Lin [12] studied a two-stage transesterification to lower the high viscosity of waste
oil. They also utilized an emulsion to reduce the NOx from methyl ester, and used methanol
to enhance the stability and to reduce viscosity of emulsified fuel. For this experiment, a

17
constant volume bomb under high temperature, high speed photography were used to analyze
spray tip penetration, spray angle, and the sauter mean diameter of fuel droplets, and
compared the results with diesel. The experimental results suggested that, the two-stage
transesterification can significantly lower the waste oil's viscosity to that which is close to
diesel viscosity. At a temperature above 300°C, the waste cooking oil methyl esters had a
water content of 20%, spray droplet characteristics were significantly improved, and NOx
emission dropped significantly.
Gao et al., [13] studied the spray characteristics of non edible oil using experimental and
simulation methods. Parameters such as spray penetration spray cone angle and spray tip
speed were measured at different biodiesel ratios in a constant volume vessel with a wide
visualization and high back pressure, using a high-speed camera. The experimental results
showed that, as the ratio of biodiesel in the blends increased, spray penetration and spray
speed increased, but the spray cone angle decreased. The results also showed that the Sauter
mean diameters of the blended fuels were greater than that of diesel, and the spray was more
concentrated, due to the higher viscosity and surface tension of biodiesel, compared to that of
conventional diesel fuel.
Park et al., [14] investigated the emission reduction characteristics of bio-ethanol blended
diesel fuel at early injection condition including spray, atomization and evaporation
characteristics using a spray visualization system and KIVA-3V code. The results showed
that, the droplet size of bio-ethanol blended fuel was smaller than that of diesel, and bio-
ethanol blended diesel droplets firstly evaporated by its volatility and the superior
atomization characteristics. In early injection condition, the bio-ethanol blend caused an
increase in indicated mean effective pressure with an extension of the ignition delay. The HC
emission was found to be increased while the CO emission found to be decreased because of
the ethanol blend. The geometrical mean diameter and total number density increased as a
result of ethanol blending, the particle number in the nuclei mode decreased, and the particle
number in the accumulation mode increased in early injection condition.
Choi and Oh [15] performed an experiment to analyze the effects that blending ratio and the
injection pressure had on the spray behaviour of blended fuel containing conventional diesel
fuel and unrefined biodiesel. The process of spray injection was analyzed through a laser
diffraction particle analyzer (LDPA), and spray atomization characteristics were studied
using the Sauter mean diameter (SMD) as well as droplet concentrations under various

18
injection conditions. The fuel containing unrefined biodiesel fuel exhibited different spray
patterns in comparison to conventional diesel fuel due to the fuel’s high viscosity and large
surface tension. The results indicate that the increase of injection pressure causes the SMD to
become smaller, and an increase in the mixing ratio causes the SMD to become larger.
Payri et al., [16] studied the effect of cavitation on diesel spray behaviour. For this purpose,
two bi-orifices nozzle geometries, a cylindrical nozzle and a convergent one, are
characterized by means of two fundamental spray parameters: mass flux and momentum flux.
Five injection pressures and five discharge pressures have been measured in order to change
the cavitation regime inside the nozzle flow. The results showed that in the cylindrical nozzle,
cavitation was detected by a collapse on the mass flow rate. The result also imply that the
discharge coefficient Cd, will decrease when cavitation number K decreases, and the conical
nozzle did not present cavitation effects even in severe pressure conditions.
Payri et al., [17] investigated the influence of orifice geometry on the flow at the nozzle exit
and to analyse its effect on the spray in evaporative conditions. The visualization was made in
a wide optical access engine for different operating conditions. From the measurements, the
dependencies of nozzle geometry, injection conditions and ambient conditions on liquid-
phase length were studied and analyzed. A model for liquid-phase fuel penetration in diesel
sprays based on the nozzle flow parameters has also been proposed and validated.
Wang et al., [18] studied experimentally and analytically the spray characteristics of
biodiesels (from palm and cooked oil) and diesel under ultra-high injection pressures up to
300 MPa. Injection delay, spray penetration, spray angle, spray projected area and spray
volume were measured in a spray vessel using a high speed video camera. The study showed
that biodiesels gave a longer injection delay and spray tip penetration. The spray angle,
projected area and volume of biodiesels were found to be smaller than those of diesel fuel.
The estimation on spray droplet size showed that biodiesels generated a larger Sauter mean
diameter due to higher viscosity and surface tension.
Kegl and Hribernik [19] paper deals with the study of injection characteristics using
different fuels at different fuel temperatures of neat biodiesel from rapeseed oil and, some
blends with diesel as well as neat mineral diesel D2. The fuel and fuel temperature influences
were investigated experimentally in the mechanically controlled diesel fuel injection system,
and the fuel temperature was investigated. On the basis of the measurements of pressure drop
through a fuel filter, a minimum fuel temperature for safe engine operation was determined.

19
Park et al., [20] studied the effects of the energizing duration, ambient gas pressure, fuel
temperature, and diesel dimethyl ether (DME) blending ratio on the DME spray
characteristics. The DME spray characteristics were analyzed using the spray images
obtained from the spray visualization system. The experimental results showed that the DME
fuel had a shorter spray tip penetration and a wider spray cone angle compared to those of
conventional diesel fuel atomization. The DME spray became blurry at the outer region of the
spray, and its evaporation was more active than that of diesel fuel. The droplet sizes of DME
were found to be much smaller than those of diesel fuel because of low kinematic viscosity
and evaporation of DME.
Kim et al., [21] investigated the experimental and numerical analysis of the macroscopic and
microscopic spray characteristics of biodiesel, dimethyl ether (DME), and the biodiesel-
ethanol blended fuels in a common-rail injection system. For this, the macroscopic spray
characteristics, spray developing process and spray tip penetration of the test fuels were
visualized using a laser sheet method. In this work, the effects of different alternative fuels
such as biodiesel, dimethyl-ether, and biodiesel-ethanol blended fuel on the spray atomization
characteristics were simulated by the KIVA code and the calculated results using the hybrid
model combined with the primary and secondary breakup were compared and analyzed with
the experimental results in terms of the shape of spray, spray evolution processes, and the
SMD distribution.
Subramanian and Lahane [22] studied the injection and spray characteristics of a diesel
engine with 7.4 kW rated power output for use of different karanja biodiesel blends (B10 and
B20) for the performance improvement and emission reduction. The dynamic injection
timing advanced for the biodiesel blends resulting in higher NOx emissions, which increased
from 2.94 g/kW-hour with base diesel to 3.40 g/kW-hour with B20. Air entrainment
increased for the biodiesel blends, and it enhanced the mixing rate of injected fuel with
surrounding hot air. Vaporization time of biodiesel droplets were found to be increased
because of larger SMD. However, an increase in over penetration distance, large SMD and
high vaporization time for the biodiesel blends would lead to deteriorated performance and
emission characteristics of the diesel engines.
Battistoni et al., [23] compared the injection process of two fuels (i) A standard diesel fuel
and (ii) A pure biodiesel, methyl ester of soybean oil. Multiphase cavitating flows inside
injector nozzles are calculated by means of unsteady CFD simulations using an Eulerian–

20
Eulerian two-fluid approach and spray evolutions are also evaluated in a Lagrangian
framework. Nozzle flow simulations highlighted that the extent of cavitation regions was not
much affected by the fuel type, whereas it was strongly dependent on the nozzle shape.
Biodiesel provided a marginally higher mass flow in the highly cavitating nozzles. On the
contrary, using hole shaped nozzles (to reduce cavitation) diesel provided a similar or
marginally higher mass flow.
Lin and Lin [24] investigated the emulsified castor biodiesel (EBD) spray characteristics on
DI diesel engine emission and deposit formation. A constant-volume bomb was established to
analyze the biodiesel spray characteristics under elevated temperatures. A bio-fuel deposit
simulator was developed to solve the EBD deposit problem. The experimental results
indicated that the biodiesel generator operated on EBD can improve the fossil diesel
emissions. The high NOx emission of CBD was solved by water-biodiesel emulsion method.
Cheng et al., [25] performed an experiment with distilled water as a test liquid to study the
spray cooling heat transfer in non-boiling regime. A phase Doppler Anemometry (PDA) was
used to study the spray characteristics. The effects of spray flow rate, spray height, and inlet
temperature on spray cooling heat transfer were investigated, and the corresponding droplet
axial velocity and Sauter mean diameter (SMD) were successfully correlated with mean
absolute error of 15%, which were based upon the orifice diameter, the Weber and Reynolds
numbers of the orifice flow. The heat transfer in a non-boiling regime was correlated with a
mean absolute error of 7%, associated with the working fluid thermo physical properties, the
Weber and Reynolds numbers hitting the heating surface, dimensionless heating surface
temperature and diameter.
Genbao et al., [26] analysed the droplet size distribution features of the DME/diesel blended
fuels and conventional diesel fuel by using a high-resolution digital camera with image
processing techniques. Based on the acquired size distribution data, the microscopic spray
characteristics including the mean diameter, the characteristic diameter, and the relative span
was calculated. According to the experimental results, the finer spray droplets could be
observed for the blended fuels compared with the diesel spray, when the mass fraction of
DME increases from 10% to 20%, the corresponding droplet size distribution curve moved
toward smaller diameters and the number of large droplets reduces, indicating that the spray
quality can be improved by DME addition.

21
Wu et al., [27] investigated a numerical simulation of the combustion characteristics for a
closed cycle diesel engine (CCDE) with different intake gas contents under different engine
speeds and equivalence ratios. The numerical simulation used KIVA3V-Release2 code as the
main program by modifying some subroutines containing different intake gas contents of
Oxygen, Argon, and Nitrogen and their thermodynamic properties. The results showed that
the pressure will increase earlier, if the percentage of argon was higher when Argon was used
to replace Nitrogen, and the ignition delay will be shorter. The higher in-cylinder temperature
results from a higher concentration of Argon.
Gogoi and Baruah [28] did an experimental investigation on a small direct injection (DI)
diesel engine, fueling the engine with 10% (B10), 20% (B20), 30% (B30) and 40% (B40)
blending of Koroch seed oil methyl ester (KSOME) with diesel. The performance and
combustion characteristics of the engine at various loads were compared and analyzed. The
results showed higher brake specific fuel consumption (BSFC) and lower brake thermal
efficiency (BTE) for the KSOME blends. The engine indicated power (IP) was more for the
blends up to B30, but found to be reduced for the blend B40 when compared to that of diesel.
The KSOME blends exhibited similar combustion trend with diesel. The study revealed the
suitability of the KSOME blends up to B30 as a fuel for a diesel engine mainly used in
generating sets and the agricultural applications in India without any significant drop in the
engine performance.

22
CHAPTER 3
EXPERIMENTATION
3.1 FUEL PREPARATION FOR THE STUDY
In the present investigation, three types of oils were used to study the droplet size.
(i) Fuel emulsion obtained from biomass (i.e, biodiesel-bio oil emulsion)
(ii) An industrial waste oil and its blend with diesel.
(iii) A non conventional fuel obtained from industrial waste by pyrolysis process blended with diesel.
Biodiesel is defined as mono-alkyl esters of long chain fatty acids which is derived from
vegetable oils, animal fats or algae. It is a renewable, cheaper and eco-friendly resources.
Biodiesel is produced through transesterification of triglycerides (which are present in
vegetable oils and animal fat) with methanol or ethanol or butanol to give methyl or ethyl
esters or butyl esters and glycerol as a by product. It is simple to use, biodegradable,
nontoxic, and essentially free of sulphur and aromatics. Biodiesel contains no petroleum, and
it can be blended with petroleum diesel at any level to create a biodiesel blend. It is much
cleaner than fossil-fuel diesel. It can be used in any diesel engine without any modifications
in the engine. The availability of biodiesel is limited in many countries which cannot even
meet the demand to produce B20, a biodiesel diesel blend where the numeric value 20 refers
to percentage of biodiesel. Therefore, the biodiesel can be suitably mixed with another fuel of
renewable in nature and checked for its use. In this context, bio-oil obtained from pyrolysis of
wood is considered to use with biodiesel.
3.2 USED TRANSFORMER OIL [29]
The oil which is used in the transformers for the cooling purpose is disposed out in the form
of waste after its use. After prolonged use, the transformer oil deteoriates and becomes as a
waste. However, the waste or used transformer oil (UTO) posses a considerable heating value
and some of the properties are similar to that of diesel fuel. After cleaning, it can also be used
as an alternate fuel in a CI engine. Transformer oil is an insulating oils which acts as a heat
transfer medium so that the operating temperature of a transformer does not exceed the
specific acceptable limits.

23
3.2.1 PYROLYSIS OIL
Pyrolysis oil is obtained by the thermal decomposition of materials in the absence of oxygen
or with little presence of oxygen. It basically resembles to tar and contains very high levels of
oxygen to be called a hydrocarbon. The pyrolysis oil produced by wood pyrolysis, is referred
as bio-oil, is a high viscous, highly acidic and does not ignite easily as it contains a
substantial amount of water. Bio-oil usually has a lower calorific value than biodiesel because
of high levels of water content and presence of oxygen originating from trees. It generally
corrodes the fuel delivery system. If stable emulsion of bio-oil and biodiesel is formed, it may
reduce the viscosity to a certain extent.
3.3 WOOD PYROLYSIS OIL
3.3.1 BIODIESEL PREPARATION
In this study, Jatropha methyl ester (JME), a biodiesel was produced by the transesterification
process of Jatropha oil. The detailed information related to this process was described by
Prakash et al [31].
Figure 3.1 Production of JME biodiesel oil
In the transesterification process, vegetable oils and triglyceride is reacted with alcohol in the
presence of a strong acid or base, which produces a mixture of fatty acid alkyl esters and
glycerol. About 3- 4 gm of sodium hydroxide (NaOH) is dissolved in 100 ml of methanol to
prepare methoxide, which is required to initialize the methanol. The mixture is stirred for
about 15-20 min in a closed container until the alkali is dissolved completely, and then this

24
mixture is transferred to the reactor containing moisture free Jatropha oil. A continuous
stirring of the resulting mixture at the temperature range of 60–65oC is carried out for about
an hour, with water. The resulting mixture is taken out and poured into the separating funnel
to separate the glycerol and methyl ester of Jatropha oil. Further, water washing is done in
order to remove the moisture and impurities from the biodiesel. The block diagram of the
methyl ester obtained from Jatropha is shown in the Fig. 3.1.
3.3.2 WOOD PYROLYSIS OIL PREPARATION
The schematic diagram of the pyrolysis set up used in this study is shown in Fig.3.2. The
production process of WPO is described by Prakash et al. [30]. It is reported that the
Pyrolysis oil was extracted by pyrolysis process of waste package wood chips of size 5mm-
10mm.The process was carried out in the pyrolysis reactor which has a maximum feed
capacity of 1kg of wood chips. The reactor used for pyrolysis oil was cylindrical in shape and
has outer diameter 250 mm, inner diameter 200 mm and a height of 250 mm. The reactor was
fully covered by glass wool and refractory lining. The pyrolysis reactor was equipped with
temperature sensor, temperature control device to set the temperature of operation, energy
meter to measure the power required for pyrolysis process and also to estimate the economy
for the overall operation. It was also equipped with a condenser flask for condensing the
pyrolytic gases into liquid by circulating water around the condenser by the help of a water
pump. One end of condenser was connected with the tube from pyrolysis reactor and the
other end was connected to a conical flask which was kept for collecting the condensed
liquid. The temperature inside the reactor was increased at the rate of 9oC per minute at initial
stages and fells to 2oC at next stages. The optimum temperature of operation was in the range
of 4oC to 420oC. Therefore, the temperature control device was set to 400oC. The average
energy meter reading was 3.9 kWh. The pyrolysis gases coming out from the reactor were of
two types, condensable and non-condensable. The moisture present in the wood comes out as
water and this generally started at 220oC and continues up to 350oC, then the colour change
to dark brown in the liquid. The pyrolysis oil started to come out at 350oC and continues up
to 390oC. The typical yield for 500 grams of feed was 150 ml of water and 100 ml of wood
pyrolysis oil.

25
Figure 3.2 Schematic diagram of pyrolysis set up [31]
3.3.3 EMULSIFICATION OF WPO AND BIODIESEL [30]
High viscous fuels can be used as an alternative fuel in diesel engine by adopting different
techniques such as blending, preheating, increasing injection pressure and improving ignition
quality. But, in the case of WPO, pilot ignition or addition of ignition improver or
emulsification with diesel or biodiesel are used. Emulsification is a technique used when a
fuel has to be mixed with another fuel which is hydroscopic in nature. The emulsifier
provides ability for the water tolerance of alcohol/pyrolysis oil fuel blends. An emulsion was
prepared for pyrolysis oil with biodiesel oil using a surfactant ranging from 0.8 to 1.5% by
volume. Surfactants are compounds that lower the surface tension of a liquid or interfacial
tension between two liquids or that between a liquid and a solid. Surfactant acts as an
emulsifier in the emulsification process. The commonly used surfactants for pyrolysis oil
with biodiesel emulsions are Tween 80, Tween20, Span20, Span80, Triton x-100 etc. The
surfactant Polysorbate-20 commercially known as Tween-20 was used as an emulsifier for
the preparation of WPO and diesel emulsion. For the preparation, first the surfactant was
added to the diesel and then the pyrolysis oil was also added. The resultant mixtures were
shaken well to make emulsions. Hence, different emulsions of WPO with biodiesel using
Tween20 at varying concentrations have been prepared. Samples of 100ml each are prepared
with varying WPO blends i.e. 5%, 10%, 15% and varying surfactants composition i.e. 2%
and 4 %.

26
3.4 BIODIESEL-TPO BLEND
3.4.1 TYRE PYROLYSIS OIL
Tyre pyrolysis oil can be obtained from pyrolysis of automobile waste tyre. Pyrolysis is a
thermal degradation of organic matter which is converted into value added products such as
oil, gas and char. In this process, waste tyre chips were heated in an oxygen free environment.
The volatile vapour evolves during heating, is condensed in a water cooled condenser. Three
value added products namely tyre pyrolysis oil (TPO), pyrogas and char are obtained.
3.4.2 PREPARATION OF TYRE PYROLYSIS OIL
For the preparation of TPO, an automobile tyre was cut into a number of pieces. Then the
bead, steel wires and fabrics were removed and the thick rubber at the periphery of the tyre
was made into small chips. The tyre chips was washed, dried and then fed into a mild steel
pyrolysis reactor unit. The pyrolysis reactor which was a fully insulated cylindrical chamber
of inner diameter 110 mm, outer diameter 115 mm and a height of 300 mm. Vacuum was
created in the pyrolysis reactor which was then externally heated by means of heaters. The
process was carried out between 450°C and 650°C in the reactor for about 2 hours and 30
minutes. The product of pyrolysis which was in the form of vapour was sent to a water cooled
condenser and then the condensed liquid was collected as a fuel. The non condensable gases
were sent out to atmosphere. The TPO collected was crude in nature. The time taken for the
pyrolysis process was about 90 minutes. TPO was then filtered by using fabric filter and
further filtered by micron filter, which removed impurities, dust, low and high volatile
fractions of hydrocarbons. The schematic diagram of the pyrolysis process of waste
automobile tyres is as shown in Fig 3.3. The photographic view of the pyrolysis setup is
shown in Fig.3.4.
Figure.3.3 Pyrolysis process of waste automobile tyre [30]

27
Figure.3.4 Pyrolysis set up
3.5 PROPERTIES OF TEST FUELS
The comparison of fuel properties of different test fuels used in this study is given in Table
3.1.
Table 3.1 Comparision of fuel properties of different test fuels used in this study
Properties Diesel UTO WPO TPO
Flash point (oC) 76 150 98 43
Fire point (oC) 56 176 108 50
Lower calorific value (kJ/kg) 44800 39270 38416 42830
Kinematic viscosity (cSt@27oC) 2.4 413 4.3 3.2
Carbon residue 0.1 0.020 0.71 2.41
3.6 EXPERIMENTAL STUDY
The experimental programme comprises of three parts. (i) determination of sauter mean
diameter (SMD) of UTO, WPO and TPO. (ii) the image analysis of these sprays when used in
diesel engine and (iii) effects of these oil on performance and emission of a DI engine.
28
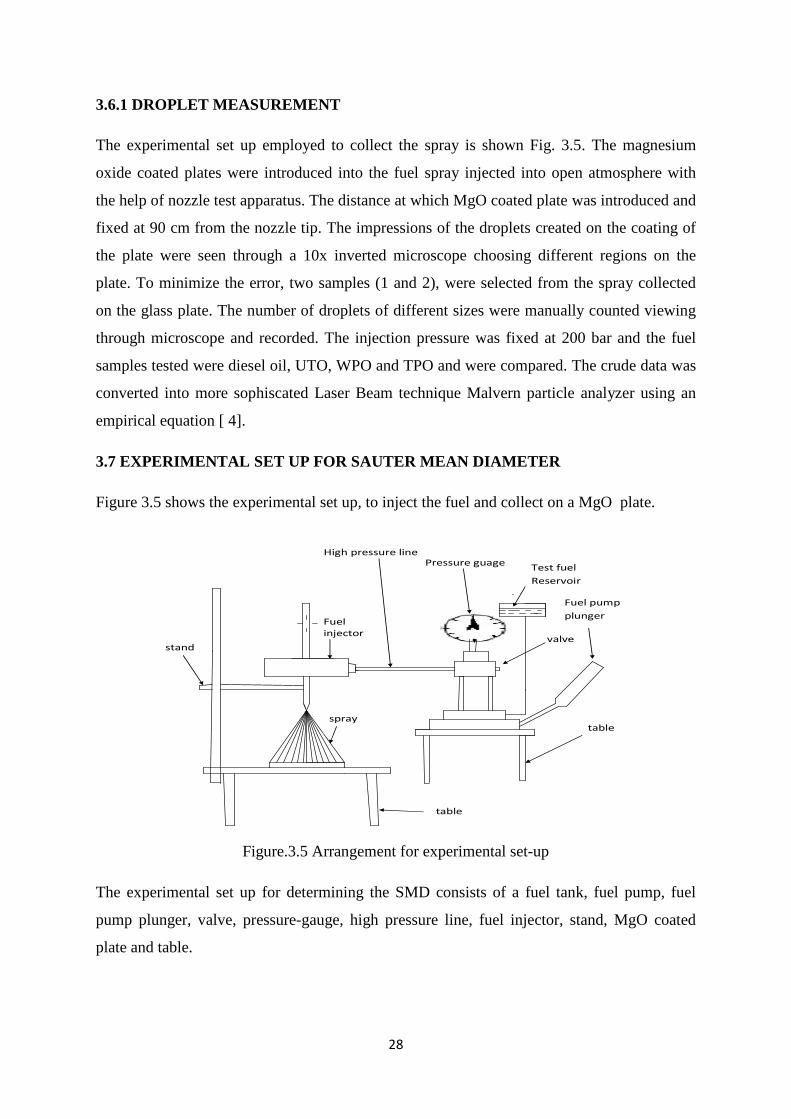
3.6.1 DROPLET MEASUREMENT
The experimental set up employed to collect the spray is shown Fig. 3.5. The magnesium
oxide coated plates were introduced into the fuel spray injected into open atmosphere with
the help of nozzle test apparatus. The distance at which MgO coated plate was introduced and
fixed at 90 cm from the nozzle tip. The impressions of the droplets created on the coating of
the plate were seen through a 10x inverted microscope choosing different regions on the
plate. To minimize the error, two samples (1 and 2), were selected from the spray collected
on the glass plate. The number of droplets of different sizes were manually counted viewing
through microscope and recorded. The injection pressure was fixed at 200 bar and the fuel
samples tested were diesel oil, UTO, WPO and TPO and were compared. The crude data was
converted into more sophiscated Laser Beam technique Malvern particle analyzer using an
empirical equation [ 4].
3.7 EXPERIMENTAL SET UP FOR SAUTER MEAN DIAMETER
Figure 3.5 shows the experimental set up, to inject the fuel and collect on a MgO plate.
Test fuel
Reservoir
Fuel pump
plunger
table spray
Fuel
injector
High pressure line
Pressure guage
table
stand valve
Figure.3.5 Arrangement for experimental set-up
The experimental set up for determining the SMD consists of a fuel tank, fuel pump, fuel
pump plunger, valve, pressure-gauge, high pressure line, fuel injector, stand, MgO coated
plate and table.

29
3.7.1 ARRANGEMENT OF NOZZLE AND NOZZLE INJECTOR
A single hole nozzle was used for spraying the tested fuel in the study. The nozzle was
connected through a nozzle pipe to reservoir. The nozzle was set at a pressure of 200 bar
which was kept at a distance of about 90 cm from the plate so that the fuel sprayed on it can
easily impinge on to the MgO coated glass plate.
Figure.3.6 Single hole Nozzle
3.7.2 COATING OF PLATES
Figure 3.7 shows the photograph of a MgO coated glass plate. The glass plates were cut into
a square shape of size (88 x 88 mm).
Figure.3.7 MgO coated glass plate
Mgo coated plate
Nozzle injector
hole

30
The glass plates were cut into a square shape of size (88 x 88 mm). Magnesium oxides
powder was used for coating. Initially, magnesium oxide was mixed with water and a paste
was formed. A thin layer of paste was coated on to the glass plate with the help of paint brush
so that the light can easily pass through it.
3.7.3 USE OF MICROSCOPE AND SOFTWARE FOR THE STUDY
An inverted microscope was used for the study of droplet size diameter of different fuels.
Sprays of different fuels on the glass plates were seen through 10x resolution microscope and
snaps were taken through a camera attached with it. The images were saved in the computer.
Figure.3.8 An inverted microscope and a computer
Droplets size diameters were measured through NI vision software. To minimize the error
two samples (1and 2) were selected from the spray collected on a glass plate and different
diameters with different range were manually counted and recorded.
3.8 STEPS INVOLVED IN DROPLET SIZE MEASUREMENT
• Before starting the experiment, the fuel tank was filled with that particular fuel to be
tested.
• With the help of plunger, the fuel was injected from the nozzle at a pressure of 190
bar.
• The fuels were sprayed on the magnesium coated glass plate.
camera
Eye pipe
Light source
Objective lense
diaphragm
31
• The fuel droplet collected on the glass plate were observed through an inverted 10x
microscope.
• Images were taken of different samples at different region.
• Droplets were counted by using NI vision software and compared the droplet diameter
of diesel oil with UTO, WPO and TPO.
3.9 SPECIFICATION OF DIESEL ENGINE
The test engine used in this investigation was a Kirolaskar TAF-1 single cylinder, four-
stroke, air cooled, constant speed direct injection diesel engine. The technical specifications
of the engine are given in Table 3.2.
Table 3.2 Technical specification of the engine
Parmeters Value
Bore, mm 87.5
Stroke, mm 110
Rated power,kW@1500rpm 4.4
Compression ratio 17.5
Nozzle opening pressure, bar 200
Injection timing, oCAbTDC 23
Figure.3.9 illustrates the schematic diagram of the experimental setup to evaluate the
performance and emission of a DI diesel engine fuelled with the test fuels. A control panel
was fitted with an alternator to provide the load to the engine. Fuel from the fuel tank was
admitted to the engine. A burette and a fuel sensor were included in the fuel circuit to
measure the fuel consumption and give the input to the computer. In the fuel line a fuel filter
and fuel pump were also connected.

32
1.Fuel tank 2. Burette 3.Computer 4. Load cell 5. Fuel pump
6. Test engine 7. Air tank 8.Fly wheel 9. Flexible coupling
10. Alternator 11. Control unit 12. Sampler
Figure.3.9 Experimental setup [29]
Atmospheric air enters the intake manifold of the engine through an air filter and an air box.
An air flow sensor fitted in the air box gave the input for the air consumption to the data
acquisition system. All the inputs such as engine brake power, air and fuel consumption, were
recorded by the data acquisition system, stored in a computer and displayed in the monitor. A
thermocouple in conjunction with a temperature indicator was connected at the exhaust pipe
that indicated the exhaust gas temperature. An AVL DiGas444 exhaust gas analyzer was used
to measure the engine exhaust gas components in percentage. The technical specification of
the AVL DiGas444 analyser is given in Annexure A1. The smoke density of the exhaust was
measured with the help of an AVL 437 diesel smoke meter. The technical specification of the
AVL 437C diesel smoke meter is given in Annexure A2. All the tests were conducted by
starting the engine with diesel only at 0%, 25%, 50%, 75% and 100% loads. After the engine
was warmed up, it was switched for the UTO, WPO and TPO operations. At the end of the
test, the fuel was switched back to diesel and the engine was kept running for a while, before
shut-down to flush UTO, WPO and TPO from the fuel line and the injection system.

33
CHAPTER 4
RESULT AND DISCUSSION
4.1 DROPLET IMAGES OF DIESEL, UTO AND UTO 40
Figure 4.1 shows the droplet image of diesel, UTO and UTO40 by using MgO coating
technique, at an injection pressure of 200 bar and a room temperature of 27oC through a
single hole nozzle injector. The glass plate were fixed at 762 mm from the nozzle injector
The impression of the droplets created on the glass plate were seen through a 10x microscope
choosing different region on the plates. To minimize the error 2 samples were taken.
Diesel UTO UTO40
Figure.4.1 Droplet images of diesel, UTO and UTO40
Table 4.1 gives the number of droplets at different ranges of diameter of diesel UTO and
UTO40. Droplets number were counted manually using NI vision software, it is clearly seen
that the maximum number of droplets fall within the range of less than 15 microns and
minimum in 60-70 microns. The more numbers of droplet of UTO than diesel is due to high
viscosity.
Table 4.1 Droplet number of diesel, UTO and UTO40
Injection Pressure =200 bar; No. Of Holes Used= 1 hole
Sl.No Range of Droplet
Diameter
Diesel oil Sample I
Diesel oil Sample
II
UTO Sample I
UTO Sample
II
UTO40 Sample
I
UTO40 Sample
II Micron Number Number Number Number Number Number 1 >15 1040 1056 1580 1724 1520 1408 2 15-30 164 132 144 116 88 136 3 30-45 72 56 60 52 40 48 4 45-60 24 14 23 21 20 16 5 60-75 15 5 9 6 4 12

34
4.1.1 DETERMINATION OF SAUTER MEAN DIAMETER
SMD [7] is determined by using the following empirical equation:
(&'())�* = +,- ./0 1(0 23 4- + /� 1(� 23 4- + /- 1(- 23 4- + ⋯ … … … … … … … . 8
4� ./0 1(0 23 4� + /0 1(0 23 4� + /0 1(0 23 4� + ⋯ … … … … … … … … . 8… … … . (4.1)
Where, /0, /�, /- … … … are the numbers of droplets collected on coated glass plate.
(0, (�, (- … … …are respective diameters of those droplets.
SMD is further converted into equivalent value of Malvern particle laser beam analyzer by
using the following equation:
(&'()9:�;� = 37 − 0.1739 (&'())�?..........(4.2)
Table 4.2 shows the SMD value of both diesel and UTO in terms of MgO technique and
equivalent value of Malvern particle laser beam.
Table 4.2 SMD of the Diesel, UTO and UTO40
Sl No. Sample oil Mgo Laser 1 Diesel(I) 5.74365 35.97105 2 Diesel(II) 6.2093 36.0821 3 UTO(I) 5.0865 36.115 4 UTO(II) 5.281 36.081 5 UTO40(I) 4.792 36.166 6 UTO40(II) 5.37 36.066
4.2 DROPLET IMAGES OF DIESEL, JOE15 AND JME
Figure 4.2 shows the droplet image of diesel, JOE15 and JME by using MgO coating
technique, at an injection pressure of 200 bar and a room temperature of 27oC through a
single hole nozzle injector.
Diesel JOE 15 JME
Figure 4.2 Droplet images of diesel, JOE15 and JME

35
Table 4.3 show the number of droplets at different ranges of diameter of diesel, JOE15 and
JME. Droplets number were counted manually using NI vision software, it is clearly seen that
the maximum number of droplets fall within the range of less than 15 microns and minimum
in 60-70 microns.
Table 4.3 Droplet number of Diesel, JME and JOE15
Injection Pressure =200 bar; No. Of Holes Used= 1 hole
Sl.No Range of Droplet
Diameter
Diesel oil Sample I
Diesel oil Sample
II
JME Sample I
JME Sample
II
JOE15 Sample
I
JOE15 Sample
II Micron Number Number Number Number Number Number 1 >15 1040 1056 484 456 840 888 2 15-30 164 132 120 112 112 100 3 30-45 72 56 68 48 52 48 4 45-60 24 14 14 15 12 13 5 60-75 15 5 4 2 5 4
4.2.1 DETERMINATSION OF SAUTER MEAN DIAMETER
SMD diameter of JME and JOE 15 are calculated from the above stated formulae:
SMD is further converted into equivalent value of Malvern particle laser beam analyzer by
using the following equation:
(&'()9:�;� = 37 − 0.1739 (&'())�?..........(4.3)
Table 4.4 shows the SMD value of diesel, JME and JOE15 in terms of MgO technique and equivalent value of Malvern particle laser beam.
Table 4.4 SMD of Diesel, JME and JOE15
Si No. Sample oil Mgo Laser 1 Diesel(I) 5.74 35.97 2 Diesel(II) 6.20 35.92 3 JME(I) 5.93 35.96 4 JME(II) 3.97 36.30 5 JOE(I) 5.32 36.07 6 JOE(II) 5.44 36.30

36
4.3 DROPLET IMAGES OF DIESEL, TPO5, TPO AND TPO15 Figure 4.3 shows the droplet image of TPO5, TPO and TPO15 by using MgO coating
technique, at an injection pressure of 200 bar and a room temperature of 27oC through a
single hole nozzle injector.
TPO 5 TPO TPO 15
Figure 4.3 Droplet images of TPO5, TPO and TPO15
Table 4.5 show the number of droplets at different ranges of diameter of TPO5, TPO and
TPO15. Droplets number were counted manually using NI vision software, it is clearly seen
that the maximum number of droplets fall within the range of less than 15 microns and
minimum in 60-70 microns.
Table 4.5 Droplet number of diesel, TPO5, TPO and TPO15
Injection Pressure =200 bar; No. Of Holes Used= 1 hole
Sl.No Range of Droplet
Diameter
TPO 5 Sample
I
TPO 5 Sample
II
TPO Sample
I
TPO Sample
II
TPO15 Sample
I
TPO15 Sample
II Micron Number Number Number Number Number Number 1 >15 392 414 432 440 392 402 2 15-30 88 56 97 68 63 59 3 30-45 29 56 38 32 29 36 4 45-60 15 9 11 13 12 9 5 60-75 2 5 2 4 5 7
4.3.1 DETERMINATION OF SAUTER MEAN DIAMETER
Table 4.6 shows the SMD value of diesel, JME and JOE15 in terms of MgO technique and
equivalent value of Malvern particle laser beam.
The SMD diameter of TPO5, TPO and TPO 15 are calculated from the above stated
formulae.

37
The SMD is further converted into equivalent value of Malvern particle laser beam analyzer
by using the following equation:
(&'()9:�;� = 37 − 0.1739 (&'())�? … … … . (4.4)
Table 4.6 SMD of Diesel, TPO5, TPO and TPO15
Si No. Sample oil Mgo Laser 1 Diesel(I) 5.74 35.97 2 Diesel(II) 6.20 35.92 3 TPO5(I) 5.91 35.976 4 TPO5(II) 5.40 36.06 5 TPO(I) 5.32 36.07 6 TPO(II) 5.20 36.09 7 TPO15(I) 5.68 36.01 8 TPO15(II) 4.21 36.26
4.4 COMPARISION OF PERFORMANCE PARAMETERS
4.4.1 BRAKE SPECIFIC ENERGY CONSUMPTION
Figure 4.4 shows the variation of brake specific energy consumption of JOE, JME,
ATJOE15, JMETPO20, UTO, UTO40 and diesel at different loads.
Figure. 4.4 Variation of Brake specific energy consumption with engine load
The brake specific energy consumption is higher for all the fuel as compared to diesel at
different loads. It can be observed from the Fig 4.4 that the brake specific energy
0
5
10
15
20
25
30
35
40
0 20 40 60 80 100 120
Bra
ke s
peci
fic
ener
gy c
onsu
mpt
ion
(g/k
Wh)
Load (%)
JOE JME
ATJOE15 JMETPO20
UTO UTO40
Diesel

38
consumption of JOE, JME, ATJOE15, JMETPO20, UTO, UTO40 and diesel at full loads are
26.91%, 30.38%, 27.98%, 29.87%,33.9%, 31.8% and 28.6% respectively. The BSEC is lower
for diesel than all the fuels at full load. This may be due larger value of SMD, the shape of
the fuel spray,their atomization characteristics and viscosity of all fuels than diesel.
4.4.2 EXHAUST GAS TEMPERATURE
Figure 4.5 shows the variation of exhaust gas temperature of different fuels at different loads.
Exhaust gas temperature is an indication of efficient combustion. Higher values of exhaust
gas temperature are indicative of inefficient combustion.
Figure.4.5 Variation of Exhaust gas temperature with engine load
The exhaust gas temperature increases with an increase in the engine load for JOE, JME,
ATJOE 15, JMETPO 20, UTO, UTO40 and diesel. The EGT for JOE, JME, ATJOE 15,
JMETPO 20, UTO, and UTO40 is higher than that of diesel as a result of higher viscosity,
higher SMD and higher density of these fuels. It is observed from the figure that the
ATJOE15, JOE15 and UTO shows the highest exhaust gas temperature with respect to JME,
JME 20, UTO40 and diesel fuel, at full loads.
0
50
100
150
200
250
300
350
400
0 20 40 60 80 100 120
Exh
aust
Gas
Tem
pera
ture
(°° °°C
)
Load (%)
JOE15 JME
ATJOE15 JMETPO20
UTO UTO40
Diesel

39
4.5 COMPARISION OF EMISSION PARAMETERS
4.5.1 HYDROCARBON EMISSION
Figure 4.6 shows the variation of hydrocarbon emission values of different fuels at different
loads. It is observed from Fig.4.6 that unburned hydrocarbon emission decreases for UTO,
UTO40, JME, JOE, ATJOE15 and diesel from zero to full load. The HC emission of
ATJOE15 and JME is found to be lower than that of diesel fuel, since there is fast breakup of
fuel, small number of droplet sizes and higher oxygen content of JME and ATJOE15 leads to
complete burning than that of diesel fuel.
Figure.4.6 Variation of hydro carbon emissions with engine load
4.5.2 CARBON MONOXIDE EMISSION
It can be observed from Fig.4.7 that the CO emission is highest for JMETPO20 compared to
all other fuels at full load. The CO emission is an indication for incomplete combustion of
fuel air mixture that takes part in the combustion. The CO value is lowest for diesel and
higher for all other fuel at full load. The higher CO emission may be due to local rich regions
and poor mixture formation in the combustion chamber [34]. Higher SMD values leads to
poor air entrainment which leads to poor mixture formation.
0
0.01
0.02
0.03
0.04
0.05
0.06
0.07
0.08
0.09
0.1
0 20 40 60 80 100 120
HC
em
issi
on (
g/kW
h)
Load (%)
JOE15 JMEATJOE15 JMETPO20UTO UTO40Diesel
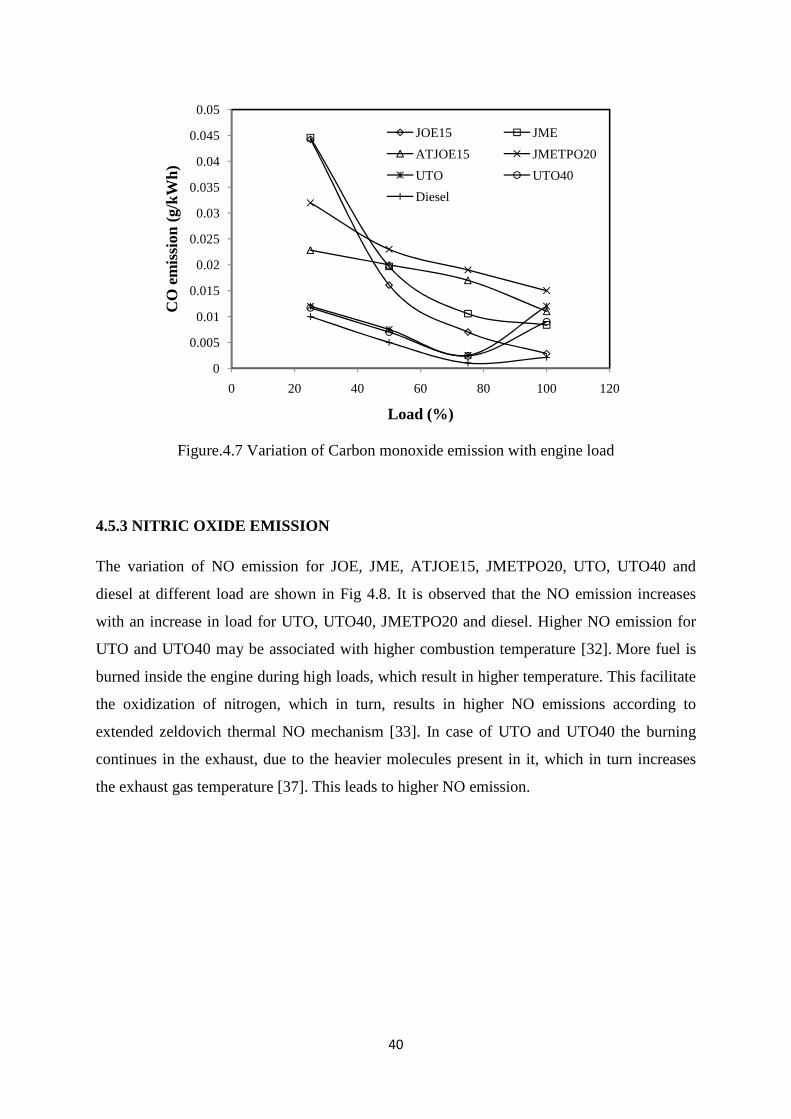
40
Figure.4.7 Variation of Carbon monoxide emission with engine load
4.5.3 NITRIC OXIDE EMISSION
The variation of NO emission for JOE, JME, ATJOE15, JMETPO20, UTO, UTO40 and
diesel at different load are shown in Fig 4.8. It is observed that the NO emission increases
with an increase in load for UTO, UTO40, JMETPO20 and diesel. Higher NO emission for
UTO and UTO40 may be associated with higher combustion temperature [32]. More fuel is
burned inside the engine during high loads, which result in higher temperature. This facilitate
the oxidization of nitrogen, which in turn, results in higher NO emissions according to
extended zeldovich thermal NO mechanism [33]. In case of UTO and UTO40 the burning
continues in the exhaust, due to the heavier molecules present in it, which in turn increases
the exhaust gas temperature [37]. This leads to higher NO emission.
0
0.005
0.01
0.015
0.02
0.025
0.03
0.035
0.04
0.045
0.05
0 20 40 60 80 100 120
CO
em
issi
on (
g/kW
h)
Load (%)
JOE15 JME
ATJOE15 JMETPO20
UTO UTO40
Diesel

41
Figure.4.8 Variation of Nitric oxide emission with engine load
It can be observed from Fig.4.8 that the nitric oxide emission of JOE, JME, ATJOE15,
JMETPO20, UTO, UTO40 and diesel at full loads are 262, 289, 209, 564, 1597, 1552, 1252
parts per million.
4.5.4 SMOKE
Figure 4.9 portrays the variation of smoke opacity with engine load for the tested fuel.
Figure.4.9 Variation of Smoke density with engine load
0
200
400
600
800
1000
1200
1400
1600
1800
0 20 40 60 80 100 120
NO
em
issi
on (
ppm
)
Load (%)
JOE15
JME
ATJOE15
JMETPO20
UTO
UTO40
Diesel
0
5
10
15
20
25
0 20 40 60 80 100 120
Smok
e de
nsit
y (%
)
Load (%)
JOE15 JME
ATJOE15 JMETPO20
UTO UTO40
Diesel

42
Smoke is higher when a fuel's ratio of hydrogen to carbon is less than two. It is observed that
the smoke density increases at full load. The value of smoke is higher for UTO40, ATJOE15,
and JME than diesel than other fuels. This may be due to the effects of enhancement in the
spray volume, considerable amount of entrainment in the emulsion spray, and the micro-
explosion effect during combustion process [38].

43
CHAPTER 5
CONCLUSION
Fuel density, viscosity and SMD are the main properties affecting the spray characteristics.
Spray characteristics were investigated through a single hole nozzle arrangements. The
combustion and emission characteristics of JOE, JME, ATJOE15, JMETPO20, UTO and
UTO40 were carried in a single cylinder, four strokes, air-cooled, direct injection diesel
engine and compared with those of diesel. The findings from this study are summarized as
follows:
� The maximum number of droplet fall within the range of less than 15 micron, and
minimum number of droplet fall in the range of 60 to 75 micron of all the tested fuels.
� The sauter mean diameter of JME, ATJOE15, JMETPO20, UTO and UTO40 is
higher than diesel.
� As the blending ratio increased, the spray size distribution and the mean diameter
became large, and spray size was distributed in a wider range than that of diesel.
� For all blended fuels the sauter mean diameter has considerably increased.
� The brake specific energy consumption is lowest for JOE than all others fuel.
� The exhaust gas temperature of JOE, JME, ATJOE15, JMETPO20, UTO and UTO40
are higher than that of diesel at full load.
� The hydrocarbon emission for JOE, JME, ATJOE15 is lower than that of diesel at full
load. However for UTO, UTO40 hydrocarbon emission is higher than diesel.
� Nitric oxide emission for JOE, JME, ATJOE15, JMETPO20 is lower than diesel at
full load, however nitric oxide emission for UTO and UTO40 is much higher than
others fuel.
� Smoke is lower for ATJOE15, JMETPO20, UTO and UTO40 than diesel at full load.

44
REFRENCES
[1] V. Ganeshan, “A textbook on Internal Combustion Engines” 2nd edition, ISBN 0-07-04
9457-6, pp 220-223.
[2] G.D. Rai, “Non conventional energy sources” Khanna publishers, ISBN 81-7409-073-
8, pp 315-615.
[3] H.S.Mukunda, “Understanding combustion”2nd edition, ISBN 978-81-7371-685-0, pp-
85-106
[4] Seunghun Choi, Youngtaig Oh “The spray characteristics of unrefined biodiesel”
Renewable Energy 42 (2012): 136–139.
[5] Chao He, Yunshan Ge1, Jianwei Tan and Xiukun Han “Spray properties of alternative
fuels: A comparative analysis of biodiesel and diesel” Int. J. Energy Res. 2008; 32:1329–
1338
[6] Avinash Kumar Agarwal ,Vipul H. Chaudhary “Spray characteristics of biodiesel/blends
in a high pressure constant volume spray chamber” Experimental Thermal and Fluid
Science 42 (2012) 212–218
[7] C. Prabhakar Reddy “Studies on droplet size measurement and engine performance using
non-edible oils as alternate fuels” National Conference on IC Engine and
Combustion(1994)pp-197-204
[8] Choongsikbae and Jinsuk Kang “Diesel spray characteristics of common-rail VCO nozzle
injector” Department of MechEngg. Korea advanced Institute of Science and
Technology.
[9] Seung-hunchoi “Spray behaviour and atomization characteristics of biodiesel”
International Journal of Modern Physics: Conference Series Vol. 6 (2012) 419-424.
[10] Su Han Park, Hyung Jun Kim, Hyun KyuSuh, Chang SikLee “Atomization and spray
characteristics of bioethanol and bioethanol blended gasoline fuel injected through a
direct injection gasoline injector” International Journal of Heat and Fluid Flow 30 (2009)
1183–1192.

45
[11] Quan Dong, Wuqiang Long, TsuneakiIshima, Hisanobu Kawashima “Spray
characteristics of V-type intersecting hole nozzles for diesel engines” Fuel 104 (2013)
500–507.
[12] Yung-Sung Lin, Hai-Ping Lin “ Study on the spray characteristics of methyl esters from
waste cooking oil at elevated temperature” Renewable Energy 35 (2010) 1900-1907.
[13] Yuan Gao, Jun Deng, Chunwang Li, Fengling Dang, Zhuo Liao, Zhijun Wu, Liguang Li
“Experimental study of the spray characteristics of biodiesel based on inedible oil”
Biotechnology Advances 27 (2009) 616–624.
[14] Su Han Park, Junepyo Cha, Hyung Jun Kim, Chang SikLee,“Effect of early injection
strategy on spray atomization and emission reduction characteristics in bioethanol
blended diesel fueled engine” Energy 39 (2012) 375-387.
[15] Seunghun Choi a, Youngtaig Oh “The spray characteristics of unrefined
biodiesel” Renewable Energy 42 (2012) 136-139.
[16] R. Payri, J.M. Garc, F.J. Salvador, J. Gimeno “Using spray momentum flux
measurements to understand the influence of diesel nozzle geometry on spray
characteristics” Fuel 84 (2005) 551–561.
[17] R. Payri, F.J. Salvador, J. Gimeno, L.D. Zapata “Diesel nozzle geometry influence on
spray liquid-phase fuel penetration in evaporative conditions” Fuel 87 (2008) 1165–
1176.
[18] Xiangang Wang, Zuohua Huang, OlawoleAbiolaKuti, Wu Zhang ,Keiya Nishida
“Experimental and analytical study on biodiesel and diesel spray characteristics under
ultra-high injection pressure” International Journal of Heat and Fluid Flow 31 (2010)
659–666.
[19] Breda Kegl and Ales Hribernik “Experimental analysis of injection characteristics using
biodiesel fuel” Energy and Fuels2006, 20, 2239-2248.
[20] Su Han Park, Hyung Jun Kim, and Chang Sik Lee, “Study on the dimethyl ether spray
characteristics according to the diesel blending ratio and the variations in the ambient
pressure, energizing Duration, and Fuel Temperature” Energy Fuels 2011, 25, 1772–
1780.

46
[21] Hyung Jun Kim, Hyun Kyu Suh,Su Han Park,and Chang Sik Lee “ An experimental and
numerical investigation of atomization characteristics of biodiesel, dimethyl ether, and
biodiesel-ethanol blended fuel” Energy & Fuels 2008, 22, 2091–2098.
[22] K. A. Subramanian and Subhash Lahane “Comparative evaluations of injection and
spray characteristics of a diesel engine using karanja biodiesel–diesel blends” Int. J.
Energy Res. (2011) DOI: 10.1002/er.1947.
[23] Michele Battistoni, Carlo Nazareno Grimaldi “Numerical analysis of injector flow and
spray characteristics from diesel injectors using fossil and biodiesel fuels” Applied
Energy 97 (2012) 656–666.
[24] Yung-Sung Lin, Hai-Ping Lin “Spray characteristics of emulsified castor biodiesel on
engine emissions and deposit formation” Renewable Energy 36 (2011) 3507-3516.
[25] Wen-Long Cheng , Feng-Yun Han , Qi-Nie Liu, Han-Lin Fan “Spray characteristics and
spray cooling heat transfer in the non-boiling regime” Energy 36 (2011) 3399-3405.
[26] Li Genbao, Cao Jianming, Li Minglong, Quan Yuhua, Chen Zhaoyang “Experimental
study on the size distribution characteristics of spray droplets of DME/diesel blended
fuels”Fuel Processing Technology 104 (2012) 352–355.
[27] Horng-Wen Wu, Zhan-Yi Wu, Jia-Ying Yang, Ren-Hung Wang, Wen-Hui Lin
“Combustion characteristics of a closed cycle diesel engine with different intake gas
contents”Applied Thermal Engineering 29 (2009) 848–858.
[28] T.K. Gogoi , D.C. Baruah, “The use of koroch seed oil methyl ester blends as fuel in a
diesel engine”Applied Energy 88 (2011) 2713–2725.
[29] PritinikaBehera , S. Murugan “Combustion, performance and emission parameters of
used transformer oil and its diesel blends in a DI diesel engine” Fuel 104 (2013) 147–154
[30] R. Prakash, R. K. Singh & S. Murugan “An experimental investigation on a diesel
engine fueled by biodiesel and its emulsions with wood pyrolysis oil” International
Journal of Green Energy, 9:8, 749-765.
[31] R. Prakash , Raghubansha Kumar singh and Murugan Sivalingam “Performance and
emission studies of a diesel fuelled with wood pyrolysis oil, biodiesel emulsion”, SAE
International doi;10,4271/2012-01-5306.

47
[32] Ramadhas AS, Muraleedharan C, Jayaraj S, “Performance and emission evaluation of a
diesel engine fuelled with meyhyl ester of rubber seed oil” Renewable Energy
2005;30:1789-800.
[33] Agarawal D, Agarawal AK, “Performance and emission characteristics of jatropha oil
(preheated and blends) in a diesel injection compression ignition engine” Applied
thermal Engg. 2007; 27:2314-23.
[34] Paradeep V, Sharma RP, “Evaluation of performance parameters of a CI engine fuelled
with biodiesel from rubber seed oil and it's blend” SAE paper no: 2005-26-353.
[35] PK Devan, NV Mahalakshmi “Utilization of an unattended methyl ester of paradise oil
as a fuel in diesel engine” Fuel 2009;88:1828-33.
[36] Nishioka, M.,Nakagawa, S.,Ishijawa, Y.,Takeno, T., “NO emission characteristics of
methane-air double flame”, Combust Flame 98, 127-38,1994
[37] Kannan,T., Marappan,R., “Comparative study of performance and emission
characteristics of a diesel engine fuelled by emulsified biodiesel/diethyl blended
biodiesel” Journal of applied science 11, 2961-2967, 2011.
[38] Subramanian, K. and Ramesh,A., “Use of diethyl ether along with water-diesel emulsion
in a diesel engine”, SAE Technical paper 2002-01-2720,2002,doi ;10,4274/2002-01-
2720.

48
ANNEXURE
A1.TECHNICAL SPECIFICATION OF EXHAUST GAS ANALYSER
1. Details of instruments
Si.
No. Instrument Measurement
Make and
model
Measurement
technique / method
1 Load cell Loading device Indian make Load cell
2 Burette Fuel
consumption Indian make Solenoid type
3 Temperature indicator Exhaust gas
measurement Indian make Thermocouple
4 Exhaust gas analyzer
NO
AVL 444
Digas
analyzer
Chemiluminescence
HC FID
CO NDIR
5 Pressure transducer
with charge amplifier
Cylinder
pressure
Kistler
5395A Piezoelectric pickup
6 Crank angle encoder Crank angle Indian make Magnetic pick up
type

49
2. Range, Accuracy and Uncertainity
Si. No. Instrument Range Accuracy Uncertainty
1 Load indicator 250 - 6,000 W ±1 W 0.2
2 Temperature indicator 0 - 900 ±1 oC 0.15
3 Burette 1- 30cc ±0.2 cc 1.5
4 Speed sensor 0 - 10,000 rpm ±10rpm ±1
5 Exhaust gas analyser
NO (0 - 5,000 ppm) ±50ppm 1
HC (0 - 200,000 ppm) ±10ppm 0.5
CO (0-10%) 0.03% 1
6 Smoke meter 0-100% ±1 % 1
7 Pressure transducer 0-110bar ±1bar 0.15
8 Crank angle encoder
±1 1

50
A2.TECHNICAL SPECIFICATION OF DIESEL SMOKE METER
Parameter OPACITY ABSORPTION RPM Oil
Temperature
Measuring range 0-100 % 0-99.99 m-1 400-6000 min-1 0-150oC
Accuracy &
Repeatability
± 1 % of full
scale Better than ± 0.1 m-1 ± 10 ± 3oC
Resolution 0.10% 0.01 m-1 ± 1 ± 1oC

51
RESEARCH PAPER PUBLISHED
CONFERENCE
Niraj Toppo, Pritinika Behera and S.Murugan, “Waste management of disposed oil and
characterization of used transformer oil as a energy source” at International conference on
advances in mechanical and energy engineering, 2013 Chennai on 4-5 April 2013.