national innovation system and the emergence of indian information
TRANSCRIPT

NATIONAL INNOVATION SYSTEM AND THE EMERGENCE OF INDIAN INFORMATION AND SOFTWARE TECHNOLGY MULTINATIONALS
Jaya Prakash Pradhan
Institute for Studies in Industrial Development 4, Institutional Area, Vasant Kunj, New Delhi - 110 070 Phone: +91 11 2689 1111; Fax: +91 11 2612 2448
E-mail: [email protected]

i
PREFACE On 10th October 2005, I received an e-mail from Karl P. Sauvant, who wanted a press release on Indian Transnational Corporations (TNCs) with an idea to ‘identify the main players to watch, how they have expanded internationally through FDI and to give a sense of the dynamics of the process’. He suggested releasing it in early 2006 as a joint Columbia University-ISID (Institute for Studies in Industrial Development) press release. I formally accepted his suggestion on Indian TNCs and the work began in December 2005.
The work, which was initially thought to be a small piece on Indian TNCs, turned out to be a larger study. The existing data sources on Indian companies investing abroad like the erstwhile Indian Investment Centre or unpublished database of the Ministry of Finance, Government of India just provide data on name of Indian investing company, approved amount of investment, ownership participation and name of host country. However, these sources do not provide information on actual number of overseas subsidiaries of Indian firms, names of overseas subsidiaries, foreign sales and fixed assets, etc., which are needed for the proposed study. I realized that a new database needs to be constructed on the overseas business operations of Indian multinationals. Without a reliable dataset any study on Indian multinationals may not be able to throw more light on their overseas activities, the precise objective of the present study. I started constructing a dataset manually on Indian multinationals based on individual company’s annual reports and information collected from their websites. Later my colleague, Mahua Paul, had shown interest in the subject and offered her help in compiling the dataset. After working for a couple of months she opted out from the project, obviously for tardiness and painful manual work of data compilation. I was again alone in the work and continued the data compilation myself.
Finally, I decided to proceed sectorally—targeting the most internationalized sector of Indian economy first and then moving on to other less internationalized sectors in descending order. The Indian software sector was selected and the work proceeded on a long drawn research exercise. This is the first report in a series of reports on Indian multinationals to be released in due time. I hope that these studies can help policy makers, researchers and thinkers to enhance their knowledge on Indian multinationals and better appreciate their role in the context of growing globalization of production from developing countries. I deeply appreciate Karl Sauvant for his suggestion on the press release that ultimately led to the present study on Indian multinationals. Vinoj Abraham has provided useful comments on the paper. I also acknowledge my colleagues at ISID, S.K. Goyal, K.S. Chalapati Rao, K.V.K. Ranganathan and others for their support

ii
and encouragement during the preparation of this study. Editorial help from Ms. Puja Mehta is thankfully acknowledged.

CONTENTS
Preface i-ii Abstract 1
1. Introduction 1
2. National Innovation System and Internationalization: A Theoretical Note 3
2.1. Agents of Innovation 4
2.2. Interaction and Inter-linkages among Innovation Agents 6
2.3. NIS and Internationalization 8
3. NIS and Rise of Indian IST Multinationals 10
3.1. The Evolution and Transformation of the Indian IST Industry 10
3.2. Emergence of Indian IST OFDI 20
4. Indian IST Multinationals: Main Features 21
4.1. Geographical Composition 22
4.2. Ownership Pattern 25
4.3. India’s Leading IST Multinationals 26
4.4. Firm-specific Characteristics of Indian IST Multinationals 29
5. Case Study of Two Selected IST Multinationals 31
5.1. Tata Consultancy Services Ltd. 32
5.2. H C L Technologies Ltd. 39
6. Conclusion 45
6.1. Implications for Developing Countries 46
i. Establishment of Skill Institutions 46
ii. Improvement in Infrastructure and Promotion of IT Usage 47
iii. An Outward-looking Policy Regime 47
6.2. Implications for India 47
6.3. Implications for Indian IST Firms 48
Reference 49
Appendix 52

List of Tables
Table-1 Indian OFDI Stock (In $ million), 1976 to 2006 2
Table-2 Electronic Production in India, 1981–1990 13
Table-3 Electronic Production in India, 1991–2000 17
Table-4 Resources Raised by Electronics and Information Technology Firms from Indian Capital Market, in Rs. crore. 17
Table-5 Software Exports by Software Technology Parks of India, 1991–92 to 1999–00 18
Table-6 Electronic Production in India, 2001–2005 19
Table-7 Geographical Distribution of Overseas Subsidiaries, Joint Ventures and Associate Companies of Indian IST Multinationals, as in 2006 23
Table- 8 Ownership Patterns of Indian IST Multinationals 26
Table-9 Top Sixty Indian IST Multinationals by Number of Overseas Ventures 27
Table-10 Foreign Assets and Sales of Top Eleven Indian IST Multinationals, 2005–06 28
Table-11 Difference between Indian IST firms with and without Overseas Subsidiaries, 2005 30
Table-12 Results from Wilcoxon Rank-Sum (Mean -Whitney) Test 30
Table-13 The Size of TCS, 2001–2006 34
Table-14 Composition of TCS’ Global Revenue, 2005–2006 34
Table-15 Assets and Turnovers of TCS’ Foreign Subsidiaries, 2005–2006 35
Table-16 Acquisition by TCS, 2001–2006 38
Table-17 Acquisition by HCL Technologies, 2001–2005 41
Table-18 Geography of HCL Technologies’ Foreign Assets and Sales, 2005–2006 42
Table-19 Assets and Turnovers of HCL Technologies’ Foreign Subsidiaries, 2005–2006 43
Table-A1 Information on Overseas Subsidiaries of Indian IST Multinationals 52

List of Figures
Figure-1 National Innovation System and Internationalization 4
Figure-2 Overseas Subsidiaries, Joint Ventures and Associate Companies of Indian IST Multinationals 23

NATIONAL INNOVATION SYSTEM AND THE EMERGENCE OF INDIAN INFORMATION AND SOFTWARE TECHNOLGY MULTINATIONALS
Jaya Prakash Pradhan*
[Abstract: The dramatic growth of outward FDI from India over the past decade is significantly led by Indian information and software technology (IST) firms. These IST firms have aggressively adopted outward FDI as a competitive strategy for seeking overseas markets, networks, skills and technologies. This study analyzes the factors leading to the emergence of these Indian IST firms as multinationals in the global market. Applying the theoretical framework of national innovation system (NIS), the study establishes that origin of Indian IST multinationals are critically linked to the overall policy environment and strategic government intervention in skill formation, development of supporting institutions, proactive role of Indian households in undertaking human capital investment and providing risk taking entrepreneurs , and also to the firm-level business strategies. The Indian experience shows that the development of a suitable NIS is required if other developing countries are aspiring to build their capability in the IST industry.]
1. Introduction
The dramatic growth of outward investment activities by Indian multinationals since the last decade has motivated a growing literature on the study of the behaviour of these multinational firms (Pradhan, 2004, 2005, 2007; Pradhan and Sahoo, 2005; UNCTAD, 2004, 2005, 2006; Sauvant, 2005). The actual stock of Indian direct investment has risen from about US $46 million in 1980 to US $8181 million at the end of February 2006 (Table-1). A key feature of the recent wave of Indian outward foreign direct investment (OFDI) has been the emergence of Indian information and software technology (henceforth IST) firms as the most aggressive outward investors from the Indian economy (see Pradhan, 2003, 2005 for detailed analysis). These firms together with firms from communication sector contributed about 56 per cent of total approved OFDI undertaken by the service sector alone in the late 1990s and about 30 per cent of OFDI by all sectors of the economy.
* Assistant Professor at the Institute. For communication, E-mail: [email protected]

2
Table-1 Indian OFDI Stock (In $ million), 1976 to 2006
OFDI Stock ($ million) Approved Actual
Year Number of Approvals
Value Percentage Change Value Percentage Change As on 1.1. 1976 133 38 ----- 17 ----- As on 31-8-1980 204 119 213 46 171 As on 1-9-1986 208 90 -24 75 63 As on 31-12-1990 214 NA ------ NA ---- As on 31-12-1995 1016 961 ------ 212 ---- As on 31-3-2000 2204 4151 332 794 275 As on 28-2-2006 8620 16395 295 8181 930 Note: NA–Not available. Source: Pradhan (2007), based on Ministry of Commerce, Indian Investment Centre, and Ministry of
Finance.
The expanding magnitude of OFDI by Indian IST firms raises several issues: Why are these firms investing abroad? Where are they investing? What are their competitive advantages for overseas investment? What set of problems they face while operating in overseas markets? Are there government agencies that provide timely information and assistance to these firms on the various aspects of host countries? What are the policy lessons that the Indian experience offers to other developing countries that want to develop their own capability in the IST industry?
The present study is an attempt to identify the factors that led to the rise of Indian IST industry and its overseas investment activities. Although, recently a number of empirical studies on Indian overseas investment have appeared, the present study seeks to contribute to the literature on two directions. First, these existing studies mostly rely on approved and actual OFDI flows data to analyze the behaviour of Indian multinationals but invariably provide incomplete picture and fail to identify the leading actors and their overseas subsidiaries. This study, based on a new dataset of Indian subsidiaries abroad, goes on to analyze the behaviour of Indian multinationals that are actually operating today. Secondly, the previous studies (Pradhan 2003, 2004) have explored the firm -specific advantages that led these Indian firms to invest abroad from a narrow theoretical framework. For example, they presumed the existence of some firm-specific advantages like technology, skill, advertising, etc., to start with and then proceed to identify which factors are in fact influencing the OFDI behaviour of domestic firms. In this process, these studies have failed to integrate the larger forces that led to the emergence of these advantages in the first place. In my view, unless the theories of foreign direct investment assimilate the forces that cause firm-specific advantages to appear with firms’ internationalization process, we still lack a satisfactory theoretical framework to analyze

3
OFDI behaviour of firms. In this paper, I have proposed the use of the theoretical framework of national innovation system (NIS) to analyze firms’ OFDI performance and to gain a larger understanding of the phenomenon. In the next two sections, I elaborate on this theoretical framework to explain OFDI by firms in general and apply the same to the case of Indian IST industry. Section 4 presents the geographical patterns of Indian IST multinat ionals, their ownership choice and undertakes identification of large IST multinationals with indicators on the extent of their global production. The firm-specific characteristics of Indian IST multinationals are also explored in this section. A brief case study of two selected large Indian IST multinationals is undertaken in Section 5. These case studies are inspired by the specific objective of examining the causes and motivations of IST firms’ OFDI activities in the NIS theoretical framework. Section 6 concludes the study, summarizing main the lessons that other developing countries can learn from the Indian experience in the IST industry.
2. National Inno vation System and Internationalization: A Theoretical Note
In the last decade or so there has been a growing realization among policy makers, researchers and technology practitioners across the world that national firms are just one of the agents of innovation and their innovativeness can’t be completely related to their own firm-specific technological efforts alone. Following the pioneering works of Lundvall (1985) and Freeman (1988) a flowering literature has emerged to emphasize that innovation and technology developments of a nation are a result of a complex and dynamic interactive process among different agents that generate and commercialize new knowledge through changes in products, processes, or services. This literature (Lundvall, 1992; Nelson, 1993; OECD, 1997; among others) has come to be known as ‘National System of Innovation’ (NIS) perspective of innovation.
Before the arrival of NIS approach, the nature of innovation process was narrowly interpreted and the focus of science and technology policies was restricted to encourage R&D investment in the economy (OECD, 1997; Abrunhosa, 2003). Both public and private sector firms were provided with a host of incentives to undertake that basic research which is ultimately determined by market parameters like fragmentation of demand, market power, cost advantage and profitability. The NIS perspective concurs that the innovation process is usefully represented by technology variables like R&D or patents but these variables alone fail to provide the complete analysis of the actions and interactions of all the agents involved in that process.

4
Figure-1 presents my interpretation of NIS for an economy and relates the same to the process of internationalization. There are three related components in the present figure—(i) modes of internationalization, (ii) agents of innovation and their inter-linkages, and (iii) agents’ functions and characteristics. First, I will take up the latter two components to elaborate on the concept of NIS.
Figure-1 National Innovation System and Internationalization
Source: Own construction
2.1. Agents of Innovation
NIS comprises four agents of innovation, which undertake innovative activities or create conducive atmosphere for such activities. They are firms, household, government and institutions. In today’s economies, a significant part of national innovation takes place within the firm or industrial sector itself. Firms in their drive to grow and survive undertake various technological and specialized R&D functions to improve their production process, product, quality, and design. There exists a rich firm and industry-
NATIONAL INNOVATION
FIRMS
HOUSEHOLD
GOVERNMENT
INSTITUTIONS
Export
Outward direct
investment
Overseas acquisition
Overseas int er-firm alliances
Firm-specific factors
Market characteristics
Overall Business Environment
Supply of Labour
Supply of Entrepreneurs
Provision and incentives for skill formation
Provision of physical infrastructure like transportation, power, and communication.
Provision of technological infrastructure
Policies related to industry, trade, foreign investment, technology etc.
Public Sector Firms and technology creation
Administrative institutions
Political institutions
Legal institutions
Financial institutions
Research institutions and universities
Modes of internalization
Agents of innovation and their inter-linkages
Agents’ functions and characteristics

5
level R&D literature that investigates the factors that motivate firms to undertake R&D activities. The decision of a firm to undertake R&D is strongly determined by a set of firm-specific factors like firm size, age, linkages with global market (i.e. foreign investment, export-orientation, technology licensing), location (i.e. rural-urban), etc. Apart from these factors, their R&D behaviour is also related to market characteristics like concentration, inter-sectoral differences in technological opportunities and demand characteristics, etc. The overall business environment like growth expectation, movement in prices, interest rate, exchange rate, and changes in public policies, etc., also influences firms’ ability to undertake R&D.
The importance of households to the innovation process may be traced to their two important contributions. They are the source of productive labour and entrepreneurs. By supplying skilled and technical labour force to the firms, household plays a significant role in firms’ technological activities. Households are also the source of entrepreneurs who identify market opportunities, undertake risks and ultimately start the productive units called firms. Besides, households also subscribe to the equity capital of enterprises and thus are a source of finance for them, indirectly affecting their innovative activities.
In NIS, government also plays a critical role. Public investment has an important influence on the provision of social, economic, and technological infrastructure like educational facilities (schools, colleges, universities, and training centre), hospitals, public housing, transport networks (railways, roads, water and airways), telecommunications, power, public research institutes and laboratories, etc. These infrastructures have a positive impact on labour quality and investment. They also lead to reduction in business costs, increase in quality and rel iability of production process, and improvement in accessibility of firms to technological infrastructure. In this way public capital not only encourages the establishment of new firms, but also makes possible firms’ expansion, favourably influencing their R&D decisions. Public policies with regard to trade, technology and foreign investment tend to determine market structure, competition, export-orientation and inter-firm technological linkages. Fiscal incentives for innovation activities, waiver of imports duties on capital goods and machineries imported by firms for innovation, are other mediums by which government plays its role in encouraging national innovation. Starting of public sector always remain a direct form of government intervention in the creation of local technological and production capabilities. Studies indicated that public innovation spending like defense and basic research in countries like US have played a crucial role in their national innovation and technological change via valuable spillovers to the rest of the economy (Krugman, 1987).

6
The importance of institutions for human creativity and innovation can hardly be undermined. A democratic and decentralized political institution along with an efficient, independent, and impartial legal institution (judiciary as well as law enforcing agencies) protects human freedom, choice and creativity. They help economic agents to undertake their respective activities of production, trade, and consumption with minimum transaction and information costs in an economy. Transparency and accountability in general administration and good governance system tends to strengthen the usefulness of public resources for development purposes. Development of financial institutions like banks, capital market, and venture capital improve accessibility and timeliness of finance for entrepreneurs to turn their vision into enterprises and businesses. Research institutions and universities come to be the centre of knowledge flows and their networking with business firms are of critical importance for NIS.
2.2. Interaction and Inter -linkages among Innovation Agents
The interaction and linkages between innovative functions of different agents form a system which is known as NIS. This is a more integrated approach to understand innovation process of an economy than just looking at traditional R&D or patent statistics since this system explicitly takes into account the fact that innovativeness of agents are interdependent in real market situation. Although these agents are connected in systemic ways, there always exists a possibility of inefficient synergies between their activities which in turn can negatively affect the innovative process.
In Figure-1, bi-way arrows of a curve or a line connecting two agents indicate that their relationship is dominated by reverse causation. Let’s take the relationship between firms and household. The innovation function of firms is crucially dependent upon the availability of skilled and R&D manpower in the economy. Household decides the extent of investment in human capital like general and technical education, health, etc., for its member and is the supplier of skilled workers in the labour market. An economy where households invest more in human capital is likely to have a pool of trained labour force easily available for innovative activities of firms than another economy where its households shy away from undertaking such investment. Firms also influence the nature and content of human capital investment made by households since all the employees of firms are primary members in households. In other instances firms generate demand for a particular skill thus raising returns to that particular human capital and households in turn positively get affected to send their members for acquiring the concerned skill.
The relationship between government and household is also interdependent. Public sector investment in schools, colleges, management, technology, and science institutes,

7
improves households’ access to education and positively affects thei r human capital investment. Government incentives for education like provision of cheap educational loan, liberal scholarships, freeships, and free study materials also increase the value of government service in the education of households. Social investment in roads, health and sanitation all positively influence the household’s preference for higher human capital investment. Members in households as electorate influence the government support for education and thus are part of the decision making process in a democratic political system.
The link between government and firms for innovation is quite strong indeed. In several ways governments across countries have been influencing the way in which their industries evolve and attain competitive maturity. The fiscal incentives in the form of tax breaks and subsidies by governments for in-house R&D activities can push the pace of innovation in targeted sectors or their industrial policies covering foreign investment and trade can det ermine the market structure, which will ultimately impact the firm-level R&D activities. For example, providing strong protection from imports and foreign investment and encouraging small firms led industrialization would definitely introduce size-based limitation for achieving higher levels of innovation. The particular nature of patent regime these governments follow also affects the innovative activities of firms given the level of economic development. Developing countries like India with low levels of technological strength in knowledge-intensive industries like pharmaceuticals may like to have a short-duration process patent policy so that their infant domestic firms can use adaptive, incremental and reverse engineering forms of technological innovation to grow and gain their own competitive advantage. In Indian pharmaceutical industry, the starting of the public sector enterprises in the 1950s–60s had strong positive spillovers on domestic sectors for skills and local technology creation (Pradhan and Alakshendra, 2006) and hence government direct R&D spending can also determine the R&D activities of industrial firms. It is also a well known fact that corporate or industrial lobbies are a powerful group that influences government policies to serve their corporate interests. In the US, the pharmaceutical and health products industry had spent more than $800 million in federal lobbying and campaign donations at the federal and state levels in the past seven years (Centre for Public Integrity, 2005). As a result of industry's pressure, the U.S. government contributes more money to the development of new drugs through fiscal subsidies than any other government in the world.
A higher level of innovative activities of firms may not be actualized in an environment of political instability, uncertainty of life and property, weak laws and order system, corruption, severe restrictions on human freedom and creativity, etc. Efficient institutions that tend to remove general uncertainty of life, to ensure availability of finance,

8
transparency in dealing with business, existence of centre of knowledge like universities, play their own part in influencing the industrial R&D in an economy.
2.3. NIS and Internationalization
When each innovation agent plays its complementary role in expanding the innovation process, industries and firms evolve out of a growing sophisticated NIS. The growing firm-specific technological capabilities that are a result of cumulative interactive process between firms and other innovation agents ultimately led these firms to reorganize themselves into global value chains by undertaking different internationalization activities.
Once national firms achieve their competitive edge in innovation and technology, then the traditional theories of FDI play their role in explaining the nature of OFDI behaviour of outward investing firms. National firms may like to exploit their technological superiority in world market and depending upon relative benefits and costs they may chose any of these strategies or a combination there of—manufacture the products and export to overseas market or license out their technology to a local player in the host market, or choose to produce the product in the host location by themselves (Figure-1).
The industrial organization theory of FDI (Hymer, 1960; Cave, 1971; Kindleberger, 1969) presupposes that outward investing firms must possess some firm-specific advantages which are easily transferable to overseas location. This theory does not go beyond the apparent market imperfections in which firms tend to have asymmetric access to product, production process, know-how, brand name, skills to explain the reason for the existence of these firm-specific advantages. This is where NIS gives a greater picture of forces that lie behind the creation of these advantages in certain industries and, within them, certain firms. NIS recognizes that there are regional and sectoral variations in the interaction of different innovation agents like government, household, and institutions, besides firm-specific variations in innovative capabilities. In a federal set-up like India, states have their own governments, industrial policies and a set of locational advantages like skill, power, transportation infrastructure, etc. In this framework, states with suitable policy and locational advantages are likely to host a particular industry than states lacking those suitable factors. This kind of variation can also be noted within a particular state. For example, starting of a firm may be easier in an urban area than in rural area since financial institutions are well developed in former area. A firm located in one urban area may have easy access to required skills due to location of large number of favourable institutions than another firm in another urban location lacking such institutions.

9
With all these variations in NIS, a set of advanced firms with technological and marketing advantages appear s to think in terms of a global market. As far as out-licensing as a strategy of exploiting firm -specific advantages abroad is concerned, firms find internalization of these advantages (i.e. directly producing abroad via FDI) as the most efficient strategy to overcome the transaction costs and imperfections involved in the global markets for technology (Rugman, 1985, 1986; Buckley and Casson, 1985; Buckley, 1988). There are several reasons for firms to choose FDI over exports like tariffs, transportation costs, cheap factor prices in host location, etc. In the proximity concentration trade off hypothesis, Brainard (1997) assumed that export strategy compared to FDI strategy entails higher variable and lower fixed costs. Resourceful firms prefer to invest in a plant in foreign location (high fixed costs) with complete elimination of transport costs associated with exports from home country whereas firms that are not able to undertake this substantial fixed costs associated with foreign production will chose to undertake variable costs of exporting and small amount of fixed costs in building trade supporting networks abroad. Dunning (1980, 1988) has proposed an eclectic theory of FDI that encompasses theories existed before him. According to this framework, firms’ FDI decision depends not only on ownership and internalization advantages as discussed above, but also on locational advantages offered by host countries. The relative locational advantages of a potential host country like market size and growth, geographical and cultural distance, availability of good infrastructure, low cost skilled manpower, etc., in relation to other competing potential locations explain whether a firm will invest or not in that particular location.
Besides FDI and exports, firms can also take other internationalization strategies like overseas acquisition and inter-firm strategic alliances. Overseas acquisition strategy can be adopted by a variety of firms and for variety of reasons. Technologically backward firms from NIS representing a home developing country may like to acquire knowledge resources in advanced countries, which are the centre of innovation activities at the global level. Technologically advanced firms may also adopt this strategy to acquire complementary strategic resources like technologies and marketing distributions and to enter the foreign markets (Pradhan and Abraham, 2005). Strategic inter-firm alliances are also increasingly becoming a new mode of internationalization in which firms from different NISs cooperate with each other according to their firm-specific advantages in different parts of a value-chain (Pradhan and Alakshendra, 2006). For example, given their cost -effective process a large number of Indian pharmaceutical companies are supplying raw materials and bulk drugs to developed country firms which in turn produce the formulations and market the world over. These strategic alliances in the form of contract manufacturing, collaborative R&D and marketing are beneficial for firms from both developed and developing countries and suggest that globalization not

10
only increase inter-firm competition, but also inter-firm cooperation based on their competitive advantages in different parts of a value chain.
It is important to emphasize here that these internationalization strategies also affect NIS. Export activities demand continuous innovation and learning whereas OFDI can act as a channel of knowledge spillovers to the home country. Overseas acquisitions of technologies and skills also help the acquiring national firms to improve their technological strength. There are also inter-relationships that exist among different internationalization strategies.
3. NIS and Rise of Indian IST Multinationals
By the early 2010s the Indian information and software technology sector had emerged as a major player in the global market with its phenomenal growth performance and significant structural transformation in terms of moving up the value chain. This led to the emergence of a large number of Indian IST firms investing cross-border and acquiring increasing number of businesses abroad. Presently, the IST sector is the most globalized and internationalized sector in the Indian economy. In this section, I have explored how NIS of India has contributed to the growth of this sector and thus led to the emergence of a large number of multinationals from this country. A recent study by Joseph (2006) has competently explored the role of various NIS elements like infrastructure, R&D, government policy, trade regime, etc. , in the rise of IT sector in India and the ASEAN countries. However, this study has not gone beyond to link the growth process of Indian IST sector with the rise of Indian IST multinationals.
3.1. The Evolution and Transformation of the Indian IST Industry
The Indian IST industry has passed through different periods of development with different innovation agents playing their respective roles. Since the introduction of computer in 19551 at the public sector research institute to the exit of IBM (International Business Machines Corporation) on June 1, 1978, India’s exposure to computer hardware was nascent with little domestic capabilities for manufacturing. In spite of policy initiative that set up a computer division in the Electronics Corporation of India Ltd. (ECIL) in 1969 to set the direction towards self-reliance in computer technology, the industry was completely dominated by foreign players like IBM and International
1 A Russian computer URAL —1&2 was introduced at the public sector research institute, Indian
Statistical Institute (ISI), in 1955.

11
Computers Limited (formerly known as International Computers and Tabulators), with IBM alone controlling about 70 per cent of the Indian computer market.
The exit of IBM due to implementation of Foreign Exchange Regulation Act (FERA) 2 has contributed to the entry of new domestic firms, mainly government owned, into computer manufacturing and system maintenance. The starting of the these public sector companies was strongly propelled by strategic importance of the industry for defence and restrictions imposed by developed countries like US on India’s access to high-performance computing systems. The public sector company ECIL Ltd. took the leading role in indigenous hardware manufacture and started producing 12-bit systems in 1977. In addition, ECIL has also generated a strong spillover impact on the training and growth of high caliber technical and managerial manpower related to computers and information technology. In 1976, Computer Maintenance Corporation (CMC) Ltd. was set up to look after system maintenance and the Department of Electronics and the Electronics Commission that came up in early 1970s to laying down the policies to guide the development of electronics industry in India.
The positive spillovers from past foreign investment like IBM, public sector investment, and an unfulfilled demand for computers led to the emergence of a number of privately owned Indian companies like HCL (Hindustan Computer Ltd.) and DCM Data Products with their own microcomputers. Most importantly, ECIL and HCL had their own operating system alternative to foreign operating systems. The availability of a pool of extremely skilled programmers and entrepreneurs created by IBM had in fact played an important role in the development of indigenous companies. In fac t Indian companies like IDM, CMC, ICIL, and HCL were set up by ex-employees of IBM 3.
Although, India was a pioneer in having operating systems and most of the demands for software were met in-house in the 1970s, the growth of software industry was severely limited due to a low base of computer usage in the country. It is estimated that at the end of 1977, there were just 450 computers installed in the country (Sharma et. al., 2006). However, then increasing usage of computers since early 1980s led to a higher demand for computer software and technology. In this way, computer software grew in India as
2 FERA required that foreign companies without having meaningful manufacturing base in India
must dilute their ownership to 40 per cent of the equity. IBM refused to dilute its controlling interest and left India whereas the British company ICL diluted its foreign equity to 40 per cent and became ICIM.
3 Dataquest (2006) ‘...Companies that defined Indian IT’, Saturday, December 30; Harding, E. U. (1989) ‘After IBM's exit, an industry arose; India offers a development alternative for U.S. firms facing make/buy decision’, Software Magazine, November 15.

12
part of the broader process of development of the computer (and electronics) industry (Radhakrishnan, 2003). Like computer hardware, public sector investment has assumed a leadership role in the development of computer software industry. The public sector company, CMC, that was providing system maintenance service to IBM installations at over 800 locations in the country, subsequently emerged as the leading player in software development for both the indigenous and overseas markets (Dataquest, 2006).
The early 1980s to early 1990s marked the second stage of the transformation of Indian IST industry. The Indian electronic industry grew by a compound rate of 24.6 per cent in 1981–1990, from a mere US $965 million in 1981 to a noticeable US $5465 million (Table-2). Over the same period, the computer hardware segment has grown by even more impressive rate of 38.9 per cent and the computer software by 34.3 per cent. As a result of better growth performance by computer hardware and software segment as compared with others, their share in total electronic production has gone up respectively from 3.5 per cent to 10.7 per cent and from 0.7 per cent to 4.2 per cent. The rapid growth of domestic software at 105.8 per cent during this period is due to its extremely low base value.
The relatively higher growth performance of IST segment in India’s electronics industry is related to suitable changes in public policy and international developments (Joseph, 2006). The adoption of National Computer Policy 1984 heralded a new liberalized policy regime for computer hardware and the Computer Software Development, Export and Training Policy 1986 visualized an outward looking strategy for software industry. This new policy has removed prior government approval for capacity expansions and put in place single window system of approval for broadly defined products for computer hardware. Computer software was recognized as a separate industry and a Software Development Agency (SDA) was established for its overall growth. Tariffs and import duties were slashed for imports of components and inputs for software development and a liberal view was adopted towards foreign technology imports and foreign collaborations. Similar to hardware, large domestic and foreign companies were allowed to become software producers. Various fiscal and non-fiscal incentives were provided to promote software exports like simplified procedures, granting export-oriented software units a liberal access to foreign exchange and exemption from 40 per cent ceiling on foreign ownership under FERA, allowing import of software packages/programmes under open general licence (OGL), according copy-right protection to software, etc.
The government procurement has also added another growth push for the industry. Government spending for computerization of government offices from central to district level, the establishment of National Informatics Centre (NIC), etc., fuelled the growth of the industry. These policies changed the overall market condition with removing policy-

13
led barriers to entry and improved market competitiveness. The changing policy regime in India coincided with two important developments in international markets—(i) emergence of IBM PC as the global standard for micro-computing, and (ii) rise of regional clone markets like Singapore, Hong Kong, South Korea and Taiwan, which led to large scale imports of PC-compatibles. These factors led to boom in Indian PC-compatible market, which in turn stimulated domestic ancillary industries like printed circuit boards (PCBs), floppy drives, power supply, and printers (Radhakrishnan, 2003).
Table-2 Electronic Production in India, 1981–1990
Production in $ million (percentage share) Sector 1981 1985 1990
Growth rate (%)
Consumer Electronics 285 (29.54)
857 (40.02)
1698 (31.06)
26.2
Industrial Electronics 183 (18.96)
327 (15.25)
802 (14.68)
19.6
Computers 34 (3.52)
125 (5.85)
584 (10.69)
38.9
Communication & Broadcasting Equipment 177 (18.37)
308 (14.39)
932 (17.05)
32.2
Strategic Electronics 80 (8.25)
159 (7.43)
326 (5.96)
16.7
Electronic Components 199 (20.64)
332 (15.48)
895 (16.37)
21.1
Total Electronic Hardware 958 (99.27)
2108 (98.43)
5237 (95.82)
24.2
Domestic Software 0.26 (0.03)
6 (0.29)
114 (2.09)
105.8
Software for Exports 7 (0.70)
28 (1.28)
114 (2.09)
34.3
Total Computer Software 7 (0.73)
34 (1.57)
229 (4.18)
43.6
Total Electronic Production 965 (100)
2142 (100)
5465 (100)
24.6
Note: Growth rate has been obtained from running semi logarithmic regression of the form, logy=a+bt on annual production from 1981 to 1990, where y=production, t=time, a, b are constants. Growth rate = {antilog (b)-1]}*100; Percentage shares are provided in parenthesis.
Source: Based on two sources of Department of Electronics, Government of India, New Delhi: (i) Electronics Information & Planning, November 1991; (ii) Guide to Electronics Industry in India 1999.
During 1987–1990, Indian government established several other institutions to support the growth of the IST industry (Kokhova and Sukharev, 2001). Software exports by companies registered with Department of Electronics has been provided with export promotion benefits as granted to manufactureed exports. The clients of Indian software companies were provided with insurance protection against malpractices and software companies were granted access to export shipment credit and credit guarantees. The

14
Electronics and Computer Software Export Promotion Council (ESC) was established in 1988 as electronics and IT trade facilitation organization. In March 1988, Government of India established an R&D institution, National Centre for Software Technology (NCST) (presently known as Centre for Development of Advanced Computing), meant fro designing, developing and deploying of advanced IT based solutions. In the wake of the US government’s refusal to sell supercomputers to India, the NCST has played an important role in developing indigenous technology for supercomputers and has introduced a range of high performance parallel computers, known as the PARAM series of supercomputers. These computers were later exported to several countries like Russia, Canada, Germany and Singapore. In 1990 the government adopted the scheme of Software Technology Parks (STPs) of India to leverage from cluster benefits and providing software companies with abundance of requisite infrastructure. India’s adoption of satellite-based telecommunication has in fact significantly improved the speed of interaction between Indian software companies and their overseas subsidiaries and clients. In this period venture capital funding for software companies became available, which has helped many Indian software companies to come into existence. To further boost software exports, profits earned from software and services exports were totally exempted from taxation.
The differential performance of computer hardware and software industry both being two sides of the same coin should not surprise anyone. It is an example of how one segment of an industry that has benefited from efficient synergies among different innovation agents in a NIS whereas another is fighting for survival due to inefficient synergies. The government policy towards the exports and development of computer softw are was more systematic, dynamic and outward-looking whereas that towards hardware was marked by frequently changing and more of inward-looking protectionist strategy since 1970s. In post-Independent India, the policy regime towards computer can be divided into five phases—outward-looking to foreign investment and imports during 1950–72, became more restrictive over 1972–84, partially liberalized during 1984–87, reversal of partial liberalization specifically with regard to imports in 1987–1990 and moved into a highly liberalized and outward-looking phase from 1991 onwards. The changing direction of policy in the 1980s led to more confused firm -level strategies in the hardware industry. Since the hardware industry in India has a high import dependency due to lack of local availability of inputs and raw material, the imposition of high import duties had adversely affected the industry. The Indian hardware firms were devoid of seriousness of a government-backed cluster approach as in the case of software through software technology parks and thus were suffering from lack of suitable infrastructure. Although, the policy notifications for Electronic Hardware Technology Park (EHTP) were issued during 1992–1993, but government seriousness for hardware segment was

15
lost in “a general hostile policy environment and the impact of wrongly balanced structure of the original version of EHTP”. 4 The unfavourable domestic market condition like low PC-intensity has not led these firms to achieve the economies of scale so important to the industry. There are also firm-specific inadequacies which have affected the competitiveness of Indian hardware industry in the global markets. Indian hardware companies although had shown their ability to design a new product like supercomputer but always they are late relative to global developments. They could not create a strong brand name for their products due to low quality and low level of innovation.
The growth of Indian IST industry in 1980s is also related to the overall strategy of government to build industrial capacity in the country during the period 1950s–1980s with targeted public sector investment in skill, infrastructure, and institutions. In various Five Year Plan documents, the policy has laid special emphasis on expanding facilities for post-graduate studies and research in engineering, technological, and management education besides improving facilities for diploma or certificate courses for training supervisory personnel. The basic objective was to create a skilled workforce to support the economic development of post-Independent India. The Central Government has established a number of higher technological institutes like five IITs (Indian Institute of Technology) at Kharagpur (1951), Mumbai (1958), Chennai (1959), Kanpur (1959), and Delhi (1961); IIMs (Indian Institute of Management) at Ahmedabad (1961), Bangalore (1973), Calcutta (1961); in addition a number of technological institutions (engineering colleges and polytechnics) and universities were being added to the national educational system. Between 1950–51 and 1981 the number has increased from 49 with an annual capacity of 4120 students to 171 with a capacity of 34835 students in the case of degree courses and 84 with a capacity of 5900 students to 363 with a capacity of 61114 students in the case of diploma courses. The increased availability of these specialized institutions has led Indian households to send their children for higher specialized and technical education. The overall enrollment ratio for secondary school education has gone up from 5.4 per cent in 1950–51 to 17.3 per cent in 1980 –81 and the number of engineering graduates and diploma holders jumped between the same years from 4680 to 53499. All these have contributed to the major development of skills and education in India, which have greatly helped the growth of Indian IST industry (Abraham and Sharma, 2005).
In the meantime, the policy started laying emphasis on directly promoting computer education in the country. The Department of Electronics (DoE) in collaboration with
4 Basic Background Report (BR-2) for National Task Force on Information Technology and
Software Development, Government of India, 8th August 1998, available at http://it-taskforce.nic.in/bbr2/bbr2-2.htm.
16
Department of Education started a pilot initiative for introducing computer literacy and studies in about 250 selected secondary/higher secondary schools in 1984–85 and later 1700 more schools were covered under this progamme. The shortage of specialized skill for the growth of IST industry was felt in the 1980s and the DoE took the initiative to identify institutions that could undertake the bachelor and post graduate course s in computer applications in early 1980s. A number of new courses such as Master of Computer Applications (MCA), Diploma in Computer Applications (DCA), Bachelor of Engineering or Technology (BE/B.Tech.) in computer engineering and science were introduced in universities, IITs, engineering colleges. The large demand of households for IT and computer education led to proliferation of a number of private players like NIIT (1981), Aptech Ltd. (1986), etc., and which in turn trained a very large number of professionals in the country. Most importantly, Indian households started sending a group of their technical manpower to work overseas in countries like USA. Later on these expatriate Indian computer professionals turned into entrepreneurs strongly linking Indian software industry with global software industry and generating knowledge spillovers from the Silicon Valley to India.
The 1990s—the third stage of the evolution of Indian IST industry—saw significant transformation in the structure of Indian electronic industry. This was a period of rapid growth period for Indian software industry—domestic software and software exports respectively grew at 38 per cent and 51 per cent over 1991–2000 (Table-3). As a result of this phenomenal growth, computer software has emerged as largest component of Indian electronic industry. Its share has gone up from 5.7 per cent in 1991 to 53.7 per cent in 2001. On the contrary, the growth of computer hardware suffered a serious setback—its growth dropped by seven times from 38.9 per cent in 1981–1990 to just 5.4 per cent in 1991–2000.
The growth of Indian IST industries in 1990s also reveals the importance of institutions as a determining factor in the evolution of an industry. The development of Indian capital market has favourably affected the industry and a large number of Indian IST firms raised their resource requirement via this route of financing. Over 1993–94 to 2005–06 Indian electronics and software firms went for as many as 320 capital issues (both public and rights issues) raising over Rs. 126 billion worth of investment from Indian capital markets (Table-4). The emergence of software technology parks (STP) all over the country as institutions with excellent infrastructure and fiscal benefits have led to tremendous growth of software exports from India. The share of STP towards total software exports from India has increased from mere 3.3 per cent in 1991–92 to a staggering 67.7 per cent in 1999–00 (Table-5).

17
Table-3 Electronic Production in India, 1991–2000
Production in $ million (percentage share) Sector 1991 1995 2000
Growth rate (%)
Consumer Electronics 1333 (29.5)
1715 (26.1)
2644 (17.8)
9.4
Industrial Electronics 624 (13.8)
790 (12.0)
883 (6.0)
5.2
Computers 425 (9.4)
622 (9.5)
745 (5.0)
5.4
Communication & Broadcasting Equipment 853 (18.9)
935 (14.2)
990 (6.7)
0.2
Strategic Electronics 229 (5.1)
239 (3.6)
385 (2.6)
10.2
Electronic Components 794 (17.6)
1064 (16.2)
1224 (8.2)
5.2
Total Electronic Hardware 4258 (94.3)
5364 (81.7)
6871 (46.3)
5.9
Domestic Software 110 (2.4)
478 (7.3)
1958 (13.2)
38.2
Software for Exports 145 (3.2)
725 (11.0)
6008 (40.5)
51.2
Total Computer Software 256 (5.7)
1203 (18.3)
7966 (53.7)
46.5
Total Electronic Production 4514 (100)
6567 (100)
14838 (100)
14.2
Note: Same as Table-1. Source: Same as Table-1 and Ministry of Communications & Information Technology (2006) Information
Technology Annual Report 2005–06, Department of Information Technology, Government of India.
Table-4 Resources Raised by Electronics and Information Technology Firms from Indian Capital
Market, in Rs. crore. Electronics Information Technology Industry
No. Value No. Value 1993–94 70 828 22 409 1994–95 7 746 30 298 1995–96 1997–98 3 62 1 9 1998–99 4 204 5 47 1999–00 3 213 36 1547 2000–01 4 69 89 804 2001–02 0 0 6 38 2002–03 0 0 3 227 2003–04 4 247 9 804 2004–05 2 61 5 5095 2005–06 2 54 15 902 All above years 99 2484 221 10180 Note: The number includes both public issue and rights issue. Source: SEBI (2007), Handbook of Statistics on the Indian Securities Market 2006, pp.24–25.

18
Table-5 Software Exports by Software Technology Parks of India, 1991–92 to 1999–00
Software Export (Rs. Crore) Name of STP 1991–92 1992–93 1993–94 1994–95 1995–96 1996–97 1997–98 1998–99 1999–00
Bangalore 16.1 22.9 56.6 126.4 405.5 913.7 1650.0 2888.1 4321 Bhubaneswar 0.3 0.5 1.1 3.8 53.3 89 Calcutta 7.6 15.9 27.4 96.1 150 Gandhinagar 0.0 0.9 0.0 1.2 1.5 3.8 6.2 13.3 27 Hyderabad 0.2 4.6 9.8 24.7 60.4 133.2 274.0 573.5 1059 Chennai 161.0 393.9 747.6 1890 Jaipur 5.4 8.0 6.1 3.7 15 Noida 0.1 23.6 45.7 82.1 200.0 415.8 750.0 1346.3 2450 Mohali 5.4 15 Pune 0.2 0.5 1.6 7.4 41.5 120.5 251.9 381.2 572 Navi Mumbai 147.5 962 Thiruvananthapuram 1.2 1.7 2.3 3.6 8.0 25.0 44.0 57 Total STP Exports 16.6 53.59 115.77 244.49 726.62 1779.86 3388.22 6300.04 11607 Total Software Exports from India
508 675 1020 1535 2550 3700 6500 10940 17150
STP as a per cent of total software exports from India
3.3 7.9 11.4 15.9 28.5 48.1 52.1 57.6 67.7
Source: Based on (i) Electronics and Computer Software Export Promotion Council (2000) Statistical Year Book 2000, New Delhi; (ii) Guide to Electronics Industry in India, various years, Data Bank and Information Division, Department of Information Technology; (iii) Annual Report (various years), Department of Information Technology, Ministry of Communications & Information Technology, New Delhi.
In the 1990s the policy regime governing Indian industries including IST industry has become more globalized and liberalized with progressive liberalization of industrial, foreign investment, technology and trade policies that have taken place since the issue of new industrial policy statement on July 24, 1991. The existing liberalized policy environment for the Indian electronics and IT industry is characterized by the following features—abolition of industrial licensing requirement except electronic aerospace and defence equipment which is still under reserved for public sector companies; automatic approval for foreign technology agreement and foreign equity up to 100 per cent; zero custom duties on computer software as well as for inputs, raw materials and capital goods imports for manufacture of electronic components and goods, imports of computer parts such as microprocessors, hard disc drives, floppy disc drives, CD ROM drives, DVD drives, USB flash memory and combo-drives; 12 per cent excise duty on imports of finished computers; income tax exemption on export profits earned by firms that are Export Oriented or are based in electronics hardware technology park (EHTP), STPs and Special Economic Zones (SEZs); 60 per cent depreciation on computers; and a weighted deduction of 150 per cent on expenditure borne for the purposes of scientific, social or statistical research. The exiting policy related to hardware segment of IST

19
industry is quite a contrast to the policy pursued during 1987–1995. Apart from instituting liberal trade measures for hardware segment, various policy notifications in the late 1990s made the EHTP as duty free area for hardware manufacture.
These liberal policy measures led to a continuous growth momentum of the IST industry during 2001–2005. In spite of the strong negative impact of the US economic slow-down and 9/11 World Trade Centre terrorist attacks, the software segment continued its high growth performance at 31.5 per cent in 2001–05, which is of course lower than the growth rate of 46.5 per cent in 1991–2000 (Table-6). The favourable policies towards hardware segment led to a reversal of growth set backs received during 1991–00 and this segment achieved an impressive growth rate of 35.3 per cent in 2001–05. Not withstanding the
Table-6 Electronic Production in India, 2001–2005
Production in $ million (percentage share)
Sector
2001 2002 2003 2004 2005
Growth rate (%)
Consumer Electronics 2607 (16.0)
2794 (14.6)
3188 (13.1)
3641 (11.4)
4082 (10.3 )
12.3
Industrial Electronics 949 (5.8)
1111 (5.8)
1284 (5.3)
1832 (5.7)
2041 (5.1)
22.5
Computers 746 (4.6)
860 (4.5)
1417 (5.8)
1915 (6.0)
2268 (5.7)
35.3
Communication & Broadcast Equipment
943 (5.8)
988 (5.2)
1106 (4.5)
1053 (3.3)
1179 (3.0)
5.2
Strategic Electronics 371 (2.3)
479 (2.5)
573 (2.4)
629 (2.0)
680 (1.7)
16.0
Electronic Components 1197 (7.4)
1340 (7.0)
1599 (6.6)
1920 (6.0)
1995 (5.0)
14.8
Total Electronic Hardware 6814 (41.9)
7572 (39.7)
9167 (37.7)
10989 (34.3 )
12245 (30.9 )
16.7
Domestic Software 2246 (13.8)
2469 (12.9)
3327 (13.7)
4524 (14.1 )
5669 (14.3 )
27.8
Software for Exports 7206 (44.3)
9054 (47.4)
11807 (48.6)
16550 (51.6 )
21769 (54.9 )
32.5
Total Computer Software 9452 (58.1)
11523 (60.3)
15135 (62.3)
21074 (65.7 )
27438 (69.1 )
31.5
Total Electronic Production 16266 (100)
19095 (100)
24301 (100)
32063 (100)
39683 (100)
25.9
Note: Same as Table-1. Source: Ministry of Communications & Information Technology (2006) Information Technology Annual
Report 2005–06, Department of Information Technology, Government of India.
growth reversal, the local capability for a globally competitive hardware industry in India still continued to be low. The industry is largely import-led since capability for manufacturing components locally is either limited or has higher cost with low quality.

20
Inadequate R&D investment and skill upgradation have negated India’s skilled manpower advantage to design world-class state -of-the-art hardware products. Therefore, the growth of Indian computer industry is actually led by screwdriver assembly operations of imported components rather by any major component that is indigenous.
3.2. Emergence of Indian IST OFDI
The first known case of Indian IST OFDI can be traced back to an Indian computer hardware company named Hindustan Computers Limited (HCL)5. On 10th December 1979, HCL entered into a joint venture with Far East Computers Limited to manufacture micro- and mini-computers in Singapore. This was the post-IBM period in the evolution of Indian IST industry when a number of Indian companies came into being as a response to the import substituting policy being followed towards computer hardware segment. HCL was among the few Indian private players to locally produce indigenous micro-computer in 1978 and that also at the same time as Apple and 3 years before IBM's PC. This first mover advantage of HCL in computer hardware industry led to the first ever internationalization drive by an Indian IST company. HCL was followed by two other oldest Indian IST companies to undertake OFDI for foraying into overseas market. DCM Data Systems Services Private Ltd. entered into an overseas joint venture for marketing software in Baharain on 5th May 1983 and Hinditron Computers System Private Ltd. established a wholly-owned subsidiary in USA on 10th January 1983. These three Indian companies were at their pinnacle in the late 1970s and 1980s with strong capability to manufacture microprocessor-based computers and required computer software. Given these capabilities it is no surprise that they led the internationalization of Indian IST industry in that period.
In the late 1980s, HCL Overseas Ltd. and Infosys Consultants Private Ltd. undertook one OFDI project each directed at the USA. Both these projects were for development of computer software. The real break in the trend of Indian IST OFDI took place in 1991 with an increasing number of Indian firms undertaking overseas investment project compared to the past. In 1991 there are cases of three overseas joint ventures and two overseas wholly-owned subsidiaries undertaken by five Indian IST companies6. The total
5 Author based on Indian Investment Centre (1998), Indian Joint Ventures & Wholly Owned
Subsidiaries Abroad Approved up to December 1995, New Delhi. 6 These outward investing companies are Computer Aided Learning Systems Private Ltd. KEI
Systems P. L td. each undertaking a JV in Russia, Hinditron Services and International Computer Ltd. each establishing a wholly owned subsidiary in USA, and Tata Consultancy Services
contd...

21
OFDI approvals for Indian IST increased to seven in 1992—four joint ventures and three wholly-owned subsidiaries. In 1996, the approved IST OFDI was estimated to be 46 comprising 9 JV and 37 wholly-owned subsidiaries. The increasing tendency of Indian IST firms to have complete control over their overseas operation is similar to the behaviour of Indian manufacturing firms in 1990s7 (Pradhan, 2005, 2007). As Indian hardware companies started loosing their competitive advantages because of their inability to innovate according to fast changing demand conditions and uncertainty in public policy in India as well as abroad the cases of OFDI by hardware companies went into oblivion in late 1990s. The Indian IST OFDI was largely led by Indian software companies that benefited from a suitable NIS system maturing in India. The liberalization of OFDI policy in 1990s and early 2010s has facilitated the emergence of Indian IST multinationals by relaxing policy led barriers to undertake trans-border investment activities (Pradhan, 2007).
4. Indian IST Multinationals: Main Features
In this section, I present the broad statistics related to Indian IST multinationals b ased on a unique dataset that has been constructed at the Institute for Studies in Industrial Development, New Delhi. This dataset contains information on a total of 165 Indian IST multinationals which in turn have a total of 645 overseas subsidiaries, 9 overseas joint ventures and 7 overseas associate companies (in which parent firms own a substantial equity interest). These subsidiaries and joint ventures are in operation presently. This dataset has been constructed from two sources—(i) annual reports of companies listed with Indian stock market and available at the EDIFAR (Electronic Data Information Filing and Retrieval System) of the Securities and Exchange Board of India8; (ii) websites of unlisted companies accessed based on the web addresses obtained from the NASSCOM (National Association of Software and Services Companies) Directory, 2005. As per the regulatory requirement, Section 212(1) of the Companies Ac t 1956, Indian companies investing abroad should attach the balance sheet, profit and loss accounts of their overseas subsidiaries to the accounts of the parent company. However, this legal provision is hardly implemented in India and hence it is rare to find Indian companies adhering to it. Ministry of Company Affairs, Government of India, has been liberally granting exemption to most of the Indian companies having operating subsidiaries from
entering into a JV in USA.
7 Author based on Indian Investment Centre (1998), Indian Joint Ventures & Wholly Owned Subsidiaries Abroad Approved during the year 1996, New Delhi.
8 This can be access at http://sebiedifar.nic.in/sebi_doc_pub.asp?value=ar

22
complying with this provision. As a result the constructed dataset could only collect information on the name of overseas subsidiaries, country of incorporation, and the percentage of ownership interest. Majority of available annual reports related to the fiscal year 2005–2006 or the date of searching companies’ websites belong to 2006 (cover 610 Indian IST multinationals); with a few reports confined to 2004–2005 (cover 47 Indian IST multinationals) and two reports are related to the year 2003. In view of the manual construction of the dataset with different sources, the available information is obviously not comprehensive and sketchy in nature. However, this dataset covering a large number of Indian IST multinationals still can provide some broad indication s of the phenomena under study.
4.1. Geographical Composition
The geographical distribution of the presence of Indian IST multinationals through their overseas subsidiaries, joint ventures and associate companies is presented in Figure -2 and Table-7. Two North American countries, USA and Canada, host 241 overseas ventures of Indian IST multinationals, accounting for 37.2 per cent of total overseas ventures. USA being the largest global market for software services has emerged as the top host of Indian IST multinationals with 226 overseas ventures. The large concentration of Indian IST multinationals in USA is also due to the presence of successful Indian immigrants and professionals related to the IT industry who have played a crucial role in development of Indian IST industry by providing overseas networks, contacts, skills and reverse brain drain.
Although India has risen as a software services player largely dependent on the USA, of late Indian IST companies are making consistent efforts to decrease their dependence on a single country. After being hit hard by the US slow-down in 2001, these companies have been aggressively foraying into Europe, the second largest market accounting for global IT services. As a result European countries emerged as the second largest host region to Indian IST multinationals. Within European software markets UK is the largest in size accounting for over 21 per cent of total European spending on computer services9. Apart from a growing market size, India’s long history of economic and cultural ties with UK has also positively affected the location of Indian IST multinationals. UK turns out to be the largest European host with 84 overseas ventures of Indian IST multinationals. Germany and the Netherlands are other two most attractive European destinations for Indian IST firms respectively accounting for 38 and 19 overseas ventures. 9 UK Trade & Investment (2005), ‘Software & Computer Services Opportunities in the UK’,
February 22.

23
Figure-2 Overseas Subsidiaries, Joint Ventures and Associate Companies of Indian IST Multinationals
Table-7
Geographical Distribution of Overseas Subsidiaries, Joint Ventures and Associate Companies of Indian IST Multinationals, as in 2006
Number Per cent Region/Countries Subsidiary Joint Venture Associate Company Total
Developed countries 445 5 5 455 68.8 European Union 175 2 177 26.8
Austria 4 4 0.6 Belgium 6 6 0.9 Denmark 2 2 0.3 France 6 6 0.9 Germany 37 1 38 5.7 Ireland 7 7 1.1 Italy 3 3 0.5 Luxembourg 2 2 0.3 Netherlands 19 19 2.9 Portugal 1 1 0.2 Spain 1 1 0.2 Sweden 4 4 0.6 UK 83 1 84 12.7
Other Western Europe 4 4 0.6 Switzerland 4 4 0.6
North America 231 3 4 238 36.0 Canada 11 1 12 1.8 USA 220 3 3 226 34.2
Other Developed Countries
34 1 35 5.3
Australia 20 20 3.0 Japan 11 1 12 1.8
North America 246 (37.2%)
South America 15 (2.3%)
The Caribbean 21 (3.2%)
Europe 164 (24.8%)
Africa 17 (2.6%)
Middle East 31 (4.7%)
Asia 144 (21.8%)
The Oceania 23 (3.5%)

24
Number Per cent Region/Countries Subsidiary Joint Venture Associate Company Total
New Zealand 3 3 0.5 Developing Countries 199 4 2 205 31.0
Africa 16 1 17 2.6 Mauritius 12 12 1.8 South Africa 4 1 5 0.8
Latin America and the Caribbean
25 25 3.8
Argentina 2 2 0.3 Bermuda 5 5 0.8 Brazil 2 2 0.3 British Virgin Island 1 1 0.2 Cayman Island 1 1 0.2 Chile 9 9 1.4 Mexico 3 3 0.5 Uruguay 2 2 0.3
Asia and the Pacific 158 4 1 163 24.7 Bahrain 5 5 0.8 Bangladesh 1 1 0.2 China 17 1 18 2.7 Cyprus 1 1 0.2 Hong Kong 11 11 1.7 Indonesia 3 3 0.5 Korea 2 2 0.3 Malaysia 20 1 21 3.2 Oman 3 3 0.5 Philippines 2 2 0.3 Saudi Arabia 1 1 0.2 Singapore 60 1 61 9.2 Sri Lanka 1 1 0.2 Taiwan 1 1 0.2 Thailand 10 10 1.5 UAE 19 2 21 3.2 Vietnam 1 1 0.2
Central and Eastern Europe 2 2 0.3 Czech Republic 2 2 0.3
All Region 645 9 7 661 100 Source: Based on Appendix Table-A1.
Asian countries emerged as the third largest host region to Indian IST multinationals. They accounted for 144 overseas ventures of these multinationals (about 21.8 per cent of the total). Singapore with 61 overseas ventures, China (including Hong Kong) with 29, Malaysia and UAE with 21 each, Japan with 11, Thailand with 10 are important Asian host countries. Singapore has traditionally been the focus of Indian IST multinationals since 1989 with increasing number of Indian software firms selling their products and services. The booming financial sector in Singapore with user-friendly financial environment based on strong physical infrastructure and telecommunications

25
capabilities has generated a large demand for IT solutions related to financial and telecom sector, thus, attracting many Indian IST multinationals. The faster growing Chinese economy is the second most attractive country in Asia.
The share of other regions in attracting overseas ventures of Indian IST multinationals is quite low. Middle East countries could attract only about 4.7 per cent of total overseas ventures followed by Oceania with 3.5 per cent, Caribbean with 3.2 per cent, Africa with 2.6 per cent, and South America with 2.3 per cent. Another aspect of Indian IST multinationals is that their overseas activities are related to the developmental status of host countries. Developed countries that tend to spent large amounts on IT have claimed 68.7 per cent of the total overseas ventures undertaken by IST multinationals whereas developing countries have attracted just 31 per cent.
4.2. Ownership Pattern
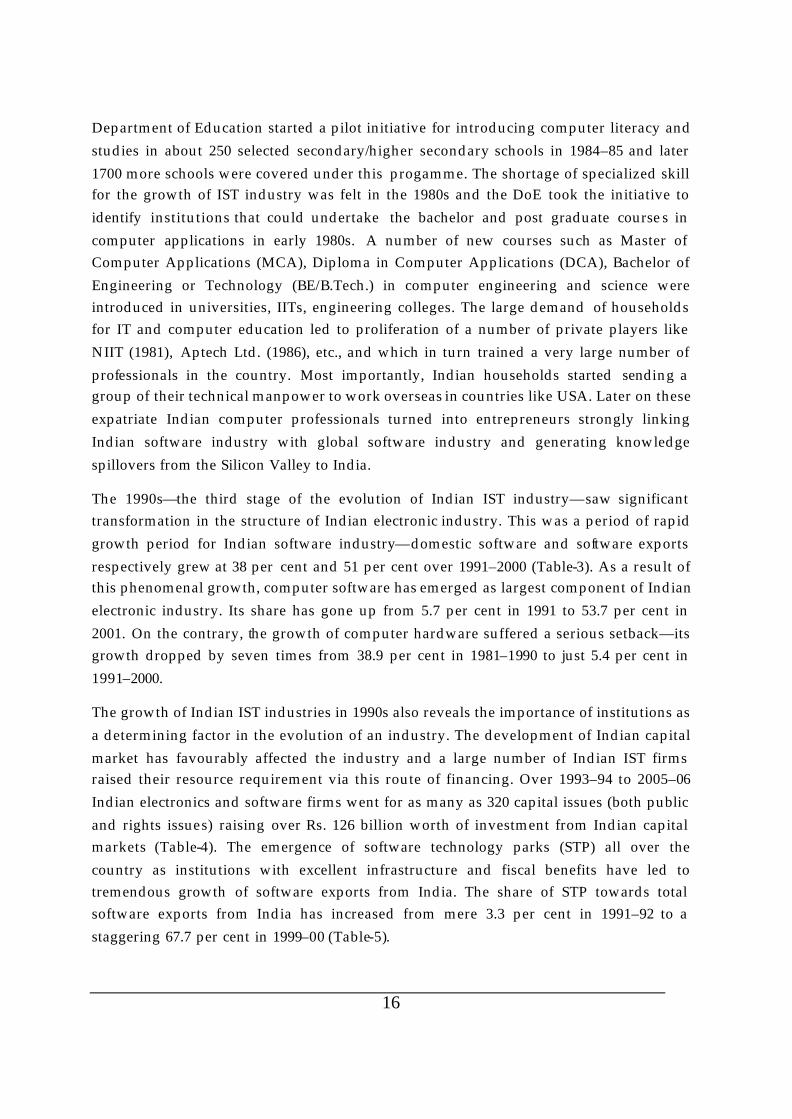
The Indian IST multinationals are observed to have majority equity ownership in their overseas ventures. Wholly-owned subsidiaries account for about as high as 89 per cent of total oversea s ventures (Table-8). The behaviour of Indian IST multinationals to have full control over their overseas operations can be explained by the nature of software services that they offer. Indian IST multinationals possess their competitive advantages in thei r global service delivery model s based on an efficient interaction between their onshore and offshore development centres. Many Indian software firms have already opened their offshore development centre in overseas markets to achieve closer customer relationship, which is a critical component of a competitive service delivery model. Unless they possess majority control over their overseas subsidiaries, an efficient and effective service delivery system that strongly protects the customer data and may not be achieved. As most of the services offered by Indian firms involve trade and service secrecy and protected data, sharing ownership of overseas ventures with other parties is not a secure mode of operation. Majority -owned offshore development subsidiaries thus offer an efficient form of overseas expansion that can maximize the benefits from their global service delivery models.
26
Table- 8 Ownership Patterns of Indian IST Multinationals
Number Ownership Interest (%) Subsidiaries Joint ventures Associate
Companies Total
Per cent Cumulative per cent
4% 1 1 0.20 0.2 20% 1 1 0.20 0.4 26% 1 1 0.20 0.6 40% 1 1 0.20 0.8 43% 1 1 0.20 1.0 49% 2 2 0.40 1.4 50% 1 3 1 5 1.01 2.4 51% 11 11 2.22 4.6 52% 1 1 0.20 4.8 53% 1 1 0.20 5.0 58% 2 2 0.40 5.4 59% 3 3 0.60 6.0 60% 1 2 3 0.60 6.7 64% 1 1 0.20 6.9 70% 1 1 0.20 7.1 72% 1 1 0.20 7.3 75% 2 2 0.40 7.7 76% 2 2 0.40 8.1 80% 2 2 0.40 8.5 82% 1 1 0.20 8.7 90% 2 2 0.40 9.1 91% 1 1 0.20 9.3 98% 2 2 0.40 9.7 99% 6 6 1.21 10.9 100% 442 442 89.11 100.0 Total 485 6 5 496 100 Source: Based on Appendix Table-A1.
4.3. India’s Leading IST Multinationals
Table-9 presents India’s sixty leading IST multinationals by the number of overseas ventures. These sixty multinationals, which constitute about 36 per cent of the total number of Indian IST multinationals at 165, account for as much as 72.6 per cent of the total number of overseas affiliates of Indian IST industry operating in 2005–06. Clearly there is a high firm-level concentration among outward investing parent firms by the number of overseas subsidiaries. Tata Consultancy Services (TCS) with 47 overseas affiliates emerged as the top Indian IST multinational, accounting for over 7 per cent of the total overseas affiliations of the Indian IST industry. About 48.4 per cent of the total assets and 57.5 per cent of the total sales of the parent company (i.e. TCS) are accounted for by its foreign subsidiaries in 2005–06 (Table-10). H C L Technologies Ltd. with 31 overseas affiliates, Cambridge Solutions Ltd. with 19 overseas affiliates and Teledata

27
Informatics Ltd. with 15 overseas affiliates are the next three leading Indian IST multinationals. The foreign assets and foreign sales of these multinational firms consti tute as high as 73.3 and 65.3 per cent of the total assets and sales in the case of H C L Technologies, 53 and 41.1 per cent in the case of Cambridge Solutions, 38.3 and 46.7 per cent in the case of Teledata Informatics. Taking the number of overseas affiliates down, the fifth ranking IST multinationals are Mphasis Ltd. and Wipro Ltd. with 14 overseas affiliates each, followed by N I I T Technologies Ltd. and R Systems International Ltd. with 12 overseas affiliates each, and Firstsource Solutions Ltd., G T L Ltd. and Megasoft Ltd. with 10 overseas affiliates each. In 2005–06, 39 per cent of the assets of eleven leading Indian IST multinationals are based in foreign countries and about 40 per cent of their sales are from their overseas subsidiaries (Table-10).
Table-9 Top Sixty Indian IST Multinationals by Number of Overseas Ventures
Name of Indian Parent Firm Number of Overseas Ventures Per cent Cumulative per cent Tata Consultancy Services Ltd. 47 7.11 7.1 H C L Technologies Ltd. 31 4.69 11.8 Cambridge S olutions Ltd. 19 2.87 14.7 Teledata Informatics Ltd. 15 2.27 16.9 Mphasis Ltd. 14 2.12 19.1 Wipro Ltd. 14 2.12 21.2 N I I T Technologies Ltd. 12 1.82 23.0 R Systems International Ltd. 12 1.82 24.8 Firstsource Solutions Ltd. 10 1.51 26.3 G T L Ltd. 10 1.51 27.8 Megasoft Ltd. 10 1.51 29.4 N I I T Ltd. 9 1.36 30.7 Trigyn Technologies Ltd. 9 1.36 32.1 3I Infotech Ltd. 8 1.21 33.3 Four Soft Ltd. 8 1.21 34.5 I-Flex Solutions Ltd. 8 1.21 35.7 Igate Global Solutions Ltd. 8 1.21 36.9 Infotech Enterprises Ltd. 8 1.21 38.1 Polaris Software Lab Ltd. 8 1.21 39.3 Aurionpro Solutions Ltd. 7 1.06 40.4 ISGN Technologies Ltd 7 1.06 41.5 Network Systems & Technologies (P) Ltd 7 1.06 42.5 Nucleus Software Exports Ltd. 7 1.06 43.6 Patni Computer Systems Ltd. 7 1.06 44.6 Rolta India Ltd. 7 1.06 45.7 Satyam Computer Services Ltd. 7 1.06 46.8 BPL Telecom Pvt. Ltd. 6 0.91 47.7 Cybertech Systems & Software Ltd. 6 0.91 48.6 Hexaware Technologies Ltd. 6 0.91 49.5 Hinduja T M T Ltd. 6 0.91 50.4 Infinite Computer Solutions (India) Pvt 6 0.91 51.3 K P I T Cummins Infosystems Ltd. 6 0.91 52.2

28
Name of Indian Parent Firm Number of Overseas Ventures Per cent Cumulative per cent Mascon Global Ltd. 6 0.91 53.1 Mastek Ltd. 6 0.91 54.0 Melstar Information Technologies Ltd. 6 0.91 54.9 Tech Mahindra Ltd. 6 0.91 55.9 Zensar Technologies Ltd. 6 0.91 56.8 Aptech Ltd. 5 0.76 57.5 Cranes Software Intl. Ltd. 5 0.76 58.3 Helios & Matheson Information Technology 5 0.76 59.0 Insoft.com Pvt Ltd 5 0.76 59.8 Java Softech Private Limited 5 0.76 60.6 Northgate Technologies Ltd. 5 0.76 61.3 Orient Informati on Technology Ltd. 5 0.76 62.1 Panoramic Universal Ltd. 5 0.76 62.8 Quintegra Solutions Ltd. 5 0.76 63.6 Ramco Systems Ltd. 5 0.76 64.4 Tata Technologies Ltd. 5 0.76 65.1 Thirdware Solution Ltd. 5 0.76 65.9 B 2 B Software Technologies Ltd. 4 0.61 66.5 California Software Co. Ltd. 4 0.61 67.1 Geodesic Information Systems Ltd. 4 0.61 67.7 IBS Software Services (P) Ltd 4 0.61 68.3 Infosys Technologies Ltd. 4 0.61 68.9 Kale Consultants Ltd. 4 0.61 69.5 Olive e-Business Pvt. Ltd. 4 0.61 70.2 Ontrack Systems Ltd. 4 0.61 70.8 SunTec Business Solutions Pvt. Ltd. 4 0.61 71.4 Synergy Log-In Systems Ltd. 4 0.61 72.0 Unisoft Infotech Pvt Ltd. 4 0.61 72.6 Total IST Multinationals 661 100.00 Source: Based on Appendix Table-A1.
Table-10 Foreign Assets and Sales of Top Eleven Indian IST Multinationals, 2005–06
Gross Assets (Rs. crore) Revenue (Rs. crore) Name of Indian Parent Total Foreign FPT* Total Foreign FPT*
Year
Tata Consultancy Services Ltd. 6975 3373 48.4 13252 7617 57.5 2005–06 H C L Technologies Ltd. 4024 2951 73.3 4572 2986 65.3 2005–06 Cambridge Solutions Ltd. 824 437 53.1 1181 485 41.1 2005–06 Teledata Informatics Ltd. 1142 437 38.3 1038 485 46.7 2005–06 Mphasis Ltd. 844 744 88.1 940 638 67.9 2005–06 Wipro Ltd. 7979 552 6.9 10603 211 2.0 2005–06 N I I T Technologies Ltd. 498 255 51.3 608 534 87.9 2005–06 R Systems International Ltd. 95 27 28.7 157 95 60.1 2005 Firstsource Solutions Ltd. 550 176 32.0 2005–06 G T L Ltd. 980 429 43.8 2005–06 Megasoft Ltd. 103 9.60 9.4 115 60 52.1 2005 All above companies 22484 8785 39 33996 13716 40 Note: * FPT: Foreign as percentage of Total; Rupee 1 crore = Rupee 10 million; total figure is the consolidated value
(i.e. parent, Indian subsidiaries and foreign subsidiaries) while foreign is the value of foreign subsidiaries. Source: Based on annual reports of individual companies.

29
4.4. Firm-specific Characteristics of Indian IST Multinationals
Earlier studies on Indian manufacturing industry such as Lall (1986) and Pradhan (2 004) suggest that outward investing Indian firms constitute a separate group as compared to other firms not performing such investment activities10. Whilst Lall (1986) found outward investing firms to be only large-sized, export oriented and dependent on imports of raw materials, Pradhan (2004), based on relatively a large sample and for a most recent period, observed them to be relatively older, large-sized, technology-intensive (in-house R&D as well as imports of disembodied technology), productive, export-oriented and to have strong dependent on managerial skills (proxied by residual profitability), selling activities and liberalization of the policy regime. How do Indian IST multinationals differ from other Indian IST firms that are not engaged in overseas investment ac tivities?
Table-11 presents an explorative comparative picture of Indian IST firms with and without overseas subsidiaries on six selected firm-level characteristics for the year 2005. Except advertising intensity, overseas investing IST firms on an average possess higher values for indicators like firm age, size, R&D intensity and export intensity than IST firm s without cross-border investment. The difference is quite substantial in the case of firm size as outward investing firms turn out to be more than eight-times in size than non-outward investing firms. Outward investing firms are observed to have R&D and export-intensity nearly double those associated with non-outward investors. Table-12 provides statistical content to the comparative analysis by implementing a non-parametric test that examines whether the groups of outward investing and non-investing IST firms are from the same population distribution or not. The results from the Wilcoxon rank-sum test suggest that Indian IST multinationals differs si gnificantly from other Indian IST firms on all the five firm-specific characteristics such as firm size, age, R&D intensity, advertising intensity and export intensity. The probability of non-outward investing IST firms having
1 0 Based on a total sample of 162 compabies broken down into 138 firms without outward
investment and 24 firms with outward investment over 1977–78 to 1978–79, Lall (1986) through Probit and Tobit analysis found that outward investing firms are intimately related with four firm-specific characteristics such as firm size, capital -output ratio, export-intensity and imports of raw materials. Therefore, in the sample period outward investing activities of sample firms were generally limited to a group of large, highly export-oriented, and import dependent firms. Pradhan (2004) is the most recent study based on a larger sample of 3951 manufacturing firms with 26 346 observations of which 2 155 observations are of outward investing firms over the period 1990–91 to 2000-01. This study found that the outward investment intensity, measured as stock of outward investment as a per cent of net worth, of Indian manufacturing firms was significantly and positively related to firm size, firm age, R&D intensity, disembodied technology imports intensity, selling cost intensity, managerial skills (proxied by residual profitability), labour productivity, export-intensity, and liberalization dummies.

30
higher values for these variables vis-à-vis IST firms with outward investment is less than 0.5, indicating that statistically former group of firms have lower values than the latter category of firms. However, only in the case of firm size and export intensity that the difference in probability is considerable. Therefore, the Indian IST multinationals are relatively large-sized and higher export oriented firms than other Indian IST firms. They are also characterized by relatively higher values for R&D intensity, advertising activities and firm age.
Table-11 Difference between Indian IST firms with and without Overseas Subsidiaries, 2005
Indian IST Firms Variables Firms without overseas
subsidiaries Firms with overseas
subsidiaries All IST Firms
AGE (In number of years) 12.9 (306)
14.9 (111)
13.4 (417)
Size (In Rs. Crore) 44.5 (190)
365.1 (105)
158.6 (295)
RDINT (In %) 0.36 (190)
0.66 (105)
0.61 (295)
ADVINT (In %) 0.51 (190)
0.38 (105)
0.40 (295)
EXPOINT (In %) 46.85 (190)
83.65 (105)
77.00 (295)
Note: Number of firms in parenth esis; RDINT- R&D expenditure as a per cent of sales; ADVINT- Advertising expenses as a per cent of sales; EXPOINT- Exports as a per cent of sales.
Source: Estimation based on a dataset constructed by merging the Prowess database of the CMIE and OFDI data from Appendix Table-A1.
Table-12 Results from Wilcoxon Rank-Sum (Mean-Whitney) Test
Obs with firms Variable Z Statistics Level of Statistical Significance
(two-tailed test)
P{(IST firms without OFDI)> (IST firms with
OFDI)} Without OFDI With OFDI
Firm Age -2.653 1% 0.415 306 111 Firm SIZE -6.649 1% 0.261 176 103 RDINT -3.132 1% 0.441 176 103 ADVINT -2.663 1% 0.410 176 103 EXPOINT -7.884 1% 0.223 176 103 Note: Estimated through STATA statistical package; P{(IST firms without OFDI)> (IST firms with OFDI)}
provides the probability that the values of the particular variable associated with Indian IST firms without OFDI is larger than those values associated with Indian IST firms with OFDI.
Source: Same as Table-11.

31
5. Case Study of Two Selected IST Multinationals
In this section a brief case study of India’s two largest IST multinationals, namely Tata Consultancy Services and HCL Technologies Limited is presented. These firms are among India’s oldest IST firms and an analysis of their emergence as multinational firms can throw valuable light on the internalization process of Indian IST industry. The growth of these two firms is found to be strongly related to the evolving NIS of India from 1960s onwards. In 1960s, Indian households were pioneers in sending their members for studying and working abroad. Most of these early immigrants have generally returned to India after finishing their studies or after earning sufficient amount to lead a decent life in India. Large Indian companies like Tata hav e successfully tapped these home country bound foreign trained skilled and technical manpower. This is amply clear in the case of TCS’ rise under the business model identified by Dr. Fakir Chand Kohli. The proactive government policy in the domestic skill creation led to the establishment of the Indian Institute of Technology (IIT) and various other technical institutions. These institutions along with universities emerged as the knowledge core of India’s manpower and entrepreneurship with ever rising number of students being sent by Indian households. Availability of technical manpower at lower cost ensured that companies like TCS and HCL leveraged for their growth and internationalization. The government initiative for computerization of its different departments, banks, and demand from research institutions for database services has provided early demand for TCS. The government and research institutions also generated demand for indigenous computers thus helping the growth of HCL. The role of foreign investment has been instrumental in the growth of these two companies. Foreign investment in the form of IBM has led to a process of skill creation and when IBM exited in 1978–79 it left a pool of trained manpower in India. Some of these ex -IBM skilled employees started their own businesses, some others migrated to the US and others joined existing Indian companies like TCS, HCL and DCM Data Systems. HCL came up to serve the domestic demand for computers in the post IBM period. The adoption of favourable and stable government policy on software exports, starting of satellite based communication system, software technology parks, growing number of technical manpower in India, rising entrepreneurship of the US-based Indian professionals and technical manpower, etc., have all positively influenced the growth of TCS and the software part of HCL known as HCL technologies. The case studies on these two Indian IST multinationals are provided below.

32
5.1. Tata Consultancy Services Ltd.
The origin of Indian computer softw are industry can be traced back to the starting of Tata Consultancy Services (TCS) by the Tata group way back in 1968 in Mumbai. The company under the leadership of Dr. Faqir Chand Kohli, an electrical engineer trained at the Massachusetts Institute of Tec hnology, has identified the niche business of providing IT solutions and started offering data processing services to various domestic companies and institutions in 1969. TCS perceived emerging business opportunity in the demand for computerization of information that is being led by increasing use of computers in the public sector. Up to 1973, the focus of the company was largely on domestic market tapping business opportunities like automation of inter -branch reconciliation process of nationalized banks under the Reserve Bank of India, computerization of the database of the Mumbai telephone directory, computerization of the Income Tax department, etc11.
After achieving a successful record of project execution in the domestic market, the company entered into the global market in 1974. The company wanted to exploit its limited capabilities by catering to overseas business opportunities and to benefit technologically from interacting with overseas customers. The company bagged its first international software assignment related to a health care system project from Burroughs, the second largest hardware manufacturer after IBM that time12. This happened in an unplanned visit of Dr. Kohli to the Burroughs office in Detroit in 1974 where he was able to convince the US hardware company to outsource their project from India. In the same year TCS also got another overseas order from an Iranian electricity generation company to provide software solution for stores and inventory control.13 Subsequently, the company’s exposure to the US market grown in the late 1970s with a successful completion of a number of projects including archiving of crime database of the Detroit City Police Department, maintenance and upgradation order from the Institutional Group and Information Co (IGIC), etc. To expand further and to have active business interactions with potential customers in the US market, TCS opened its first office in New York City in 1979. This is the beginning of TCS’ overseas expansion mainly to ensure service supports to its export activities.
With the arrival of New Computer Policy 1984, TCS and other software companies benefited from easier access to foreign exchange and also were recognized as a separate
1 1 Economic Times (2002), ‘We’ve to tap the power of computers’, Interview of Dr. Faqir Chand
Kohli, March 22. 1 2 Economic Times (2002), ‘To a global village: F C Kohli is ET's lifetime achiever’ August 21. 1 3 Dataquest (2002), ‘THE HOT VERTICALS: The Great Indian Software Revolution’, December
23.

33
industry with simplified licensing and openness to foreign investm ent. Under this liberal policy regime in late 1990s TCS continued its export -led growth with rapid diversification in its service profile from data entry to software development and application maintenance. Its annual sales reached about $35 million in 1989, of which exports constitute about 70 per cent14. Geographically its export market became diversified to cover about 35 countries from North America, Europe and the Middle East. In 1989 TCS entered into a strategic alliance with Japanese trading company Nichimen where the latter will market former company’s software in Japan. With rising number and size of overseas orders and growing base of overseas customers, the company’s need to be present overseas via its direct subsidiaries becomes irresistible as most of the offshore contracts also have parts to be executed on-site, nearer to the overseas customers. As a result the company went for direct investment abroad and entered into two joint ventures targeted at the US in 1991 and 199415.
The liberalization of policy regime towards OFDI, software industry, making of Software Technology Parks with abundant infrastructure, satellite based high speed communication systems, rising number of trained manpower and the global factor in the form of Year 2000 (Y2K) problem have all positively contributed to the growth of Indian software industry including TCS. In the early 1990s the export model of Indian software companies has shifted from physical transfers (i.e. sending programmer onshore or software on floppies) to an offshore-onshore model facilitated by satellite communication system and overseas presence thorough subsidiaries or marketing offices16. The software packages of Indian firms on accounting, banking, etc., which did not grow beyond India in the 1980s, also started attracting international attention in 1990s. These favourable factors led to the rapid organic growth of TCS. The resources (i.e. Rs. 5,000 crore) that it has raised from the Indian capital market in 2004 have allowed it to grow inorganically via acquisitions. The company became a billion dollar company in 2003 with a total of 24000 employees. By March 2006, company’s total revenue increased to above $2.5 billion and its manpower jumped to 62832 (Table-13). A significant part of this impressive growth achieved by TCS has been contributed by establishment of a large number of overseas subsidiaries that have played important role in directly contributing to the parent’s global revenue and indirectly to the higher exports performance from India. As
1 4 Ken Takahashi (1989), ‘India group in Tokyo - Tata Consultancy Service’, Newsbytes News
Network, August 01. 1 5 Author based on Indian Investment Centre (1998), Indian Joint Ventures & Wholly Owned
Subsidiaries Abroad Approved up to December 1995, New Delhi. 1 6 Dataquest (2002), ‘THE HOT VERTICALS: The Great Indian Software Revolution’, December
23.

34
noted earlier the overseas subsidiaries of the company have contributed above 57 per cent of parent’s consolidated sales in 2005–06. The role of overseas subsidiaries in promoting parent’s exports is also likely to be quite substantial. Without an onshore presence through overseas subsidiaries, TCS would not have achieved such a dramatic growth performance. By blending their onshore delivery and strong offshore supply capability in India, Indian software companies such as TCS have significantly improved the effectiveness of their delivery system of software services to global clients17. As a result the contribution of exports in total sales of TCS is consistently above 90 per cent since 2001. Geographically, about 88 per cent of the company’s consolidated revenue originates from overseas markets and America alone accounts for around 59 per cent share (Table-14). The share of European region is in the range of 21–23 per cent.
Table-13 The Size of TCS, 2001–2006
Year Revenue ($ million) Net Income ($ million) Net Profit Margin (%) Employees (In number) March 2006 2,528.50 864.7 34.20% 62,832 March 2005 2,221.70 468.7 21.10% 40,992 March 2004 1,614.00 365.4 22.60% March 2003 1,041.00 24,000 March 2002 880 19,000 March 2001 689 16,000 Source: hoovers.com
Table-14 Composition of TCS’ Global Revenue, 2005–2006
Consolidated Revenue (%) Region 2006 2005 2003 2002
Americas 59.06 59.20 59.28 61.13 Europe 22.40 23.08 20.00 20.63 India 12.50 12.18 14.85 11.94 Others 6.04 5.54 5.86 6.31 Total Revenue 100 100 100 100 Source: TCS Annual Report 2005–2006 and 2002–2003.
Table-15 summarizes the performance of overseas subsidiaries of TCS during 2005–2006. The total assets and revenues of its overseas subsidiaries have grown by 158 and 33 per cent respectively between 2005 and 2006. This high growth rate is because of two factors—(i) expansion of existing subsidiaries and (ii) acquisition of new subsidiaries by the parent firm. The New York-based subsidiary, Tata America International
1 7 John Ribeiro (2004), ‘Pure' outsourcing model falls from favor: Indian BPO companies are
finding they need U.S. facilities and staff to run operations’, IDG News Service, October 07.

35
Corporation, is the largest overseas subsidiary accounting for about 39 and 81 per cent of total overseas assets and sales respectively. The sales of this subsidiary have grown at a rate of 28.4 per cent between 2005 and 2006. Other subsidiaries except TCS Iberoamerica SA also have shown tremendous sales growth over the same period.
Table-15 Assets and Turn overs of TCS’ Foreign Subsidiaries, 2005–2006
Total Assets (Rs. Crore) Turnover (Rs. Crore) Name of the Subsidiary Company 2006 2005 Change (%) 2006 2005 Change (%)
Country of location
TCS Argentina S.A. 0.8 (0.02)
0.3 (0.02)
171.4 2.1 (0.03)
0.4 (0.01)
491.4 Argentina
TCS FNS Pty. Limited 126.6 (3.75)
0.2 (0.00)
Australia
Financial Network Services -Holdings Pty Limited
21.1 (0.63)
Australia
Financial Network Services Pty Limited
48.1 (1.42)
27.2 (0.36)
Australia
Financial Network Services -Facilities Management Pty Limited
0.5 (0.01)
Australia
Tata Consultancy Services Belgium SA.
53.6 (1.59)
16.7 (1.28)
221.5 51.2 (0.67)
34 (0.59)
50.7 Belgium
TCS Brazil S/C Limitada 9.0 (0.27)
3.0 (0.23)
204.1 Brazil
Tata Consultancy Services Do Brasil S.A.
77.2 (2.290
17.2 (1.32)
349.0 98.8 (1.30)
34 (0.60)
186.4 Brazil
Exegenix Canada Inc. 3.3 (0.10)
1.8 (0.02)
Canada
TCS Inversiones Chile Limitada
117 .9 (3.50)
1.4 (0.11)
8263.1 0.0 (0.00)
Chile
Tata Consultancy Services Chile S.A.
15.8 (0.47)
8.6 (0.66)
83.5 28.1 (0.37)
15 (0.26)
88.5 Chile
Tata Consultancy Services Chile Limitada
117.5 (3.48)
Chile
Comicrom S.A. 56.8 (1.68)
45.3 (0.59)
Chile
Sisteco S.A. 7.0 (0.21)
4.0 (0.05)
Chile
Syscrom S.A. 11.4 (0.34)
10.3 (0.14)
Chile
Pentacrom S.A. 4.7 (0.14)
4.9 (0.06)
Chile
Pentacrom Servicios S.A. 2.2 (0.07)
0.3 (0.00)
Chile
Custodia De Documentos Intres Limitada
3.2 (0.09)
0.7 (0.01)
Chile
Financial Network Services Chile Limitada
Chile
Tata Information 16.1 9.7 65.4 30.0 20 47.9 China

36
Total Assets (Rs. Crore) Turnover (Rs. Crore) Name of the Subsidiary Company 2006 2005 Change (%) 2006 2005 Change (%)
Country of location
Technology -Shanghai Company Limited
(0.48) (0.75) (0.39) (0.35)
Tata Consultancy Services France SA.
0.5 (0.02)
0.6 (0.05)
-20.3 France
Tata Consultancy Services Deutschland GmbH
152.9 (4.53)
41.3 (3.16)
270.3 191.6 (2.52)
144 (2.51)
33.4 Germany
Tata Infotech Deutschland GmbH
0.5 (0.02)
0.0 (0.00)
Germany
Chong Wan Investments Limited
-1.2 (-0.04)
0.0 (0.00)
Hong Kong
Financial Network Services -H.K. Limited
0.0 (0.00)
0.3 (0.00)
Hong Kong
PT Financial Network Services
0.6 (0.02)
2.7 (0.04)
Indonesia
TCS Italia SRL 36.2 (1.07)
16.9 (1.30)
113.7 51.7 (0.68)
31 (0.54)
67.1 Italy
Tata Consultancy Services Japan Limited
39.8 (1.18)
31.6 (2.42)
26.0 118.4 (1.55)
78 (1.36)
51.9 Japan
Tata Consultancy Services Luxembourg S.A
13.4 (0.40)
12.4 (0.16)
Luxembourg
Tata Consultancy Services Malaysia Sdn. Bhd.
6.6 (0.20)
3.3 (0.25)
102.8 6.4 (0.08)
2 (0.03)
278.2 Malaysia
Financial Network Services Malaysia Sdn Bhd
0.1 (0.00)
0.0 (0.00)
Malaysia
Tata Consultancy Services de Mexico S.A. De. C.V.
15.4 (0.46)
4.2 (0.32)
265.2 23.2 (0.30)
8 (0.14)
190.5 Mexico
Tata Consultancy Services Netherlands BV.
163.5 (4.85)
85.5 (6.55)
91.1 193.1 (2.53)
177 (3.09)
9.2 Netherlands
Tata Consultancy Services Portugal Unipesoal Limitada
1.2 (0.04)
0.9 (0.01)
Portugal
Tata Consultancy Services Asia Pacific Pte Ltd.
123.9 (3.67)
54.8 (4.20)
126.0 143.2 (1.88)
93 (1.63)
53.3 Singapore
Tata Infotech -Singapore Pte. Limited
2.7 (0.08)
1.5 (0.02)
Singapore
Financial Network Services -Africa Pty Ltd
0.0 (0.00)
South Africa
Tata Consultancy Services de Espana S.A.
3.6 (0.11)
3.1 (0.24)
17.5 21.8 (0.29)
10 (0.17)
123.9 Spain
Tata Consultancy Services Sverige AB.
71.4 (2.12)
43.7 (3.35)
63.5 117.7 (1.55)
79 (1.37)
49.8 Sw eden
Swedish Indian IT Resources AB
0.5 (0.02)
-0.3 (0.00)
Sw eden
Diligenta Limited 515.0 (15.27)
48.8 (0.64)
U.K.
Financial Network Services -Europe plc
0.8 (0.02)
2.6 (0.03)
U.K.
Tata America International Corporation
1323.10 (39.23)
877.7 (67.24)
50.7 6186 (81.22)
4816 (84.26)
28.4 U.S.A.

37
Total Assets (Rs. Crore) Turnover (Rs. Crore) Name of the Subsidiary Company 2006 2005 Change (%) 2006 2005 Change (%)
Country of location
CMC Americas Inc. 37.7 (1.12)
29.2 (2.23)
29.1 130.0 (1.71)
87 1.52
49.9 U.S.A.
TCS Iberoamerica SA. 155.9 (4.62)
41.9 (3.21)
271.9 3.5 (0.05)
70 (1.23)
-95.1 Uruguay
TCS Solution Center S.A. 16.1 (0.48)
14.7 (1.13)
9.5 56.2 (0.74)
18 (0.31)
215.3 Uruguay
All subsidiaries 3372.6 (100)
1305.4 (100)
158.4 7616.7 (100)
5716 (100)
33.3
Note: percentage share is in parenthesis. Source: TCS Annual Report 2004 -05 and 2005 –06.
Along with greenfield OFDI, TCS has been aggressively pursuing inorganic growth through overseas acquisitions to become a global leader. After the acquisition of public sector company Computer Maintenance Corporation (CMC) Ltd. in November 2001, TCS set up a separate mergers and acquisitions (M&A) cell in December 2001 to identify potential target companies that possess synergy with the core business of TCS and can provide leveraging market strength18. Since then TCS has been experimenting with growth via “mergers and acquisitions that are a strategic fit, complement our capabilities and plug gaps in our portfolio of offerings” (TCS Annual Report 2005–2006, p. 7). During 2005–2006, TCS acquired as many as six overseas business entities aggregating an investment of about Rs. 10.2 billion (Table-16). In May 2005, TCS acquired a Swedish company named Swedish Indian IT Resources (SITR) through its wholly -owned subsidiary Tata Consultancy Services Sverige AB. The basic objective of this acquisition was to deal directly with end-customers rather than through SITR which was then TCS’ exclusive partner in Sweden and a non -exclusive partner in Norway and also to increase presence in the targeted market19. The Australian company Financial Network Services was acquired by TCS in October 2005 with the basic objective of strengthening competitive position in the global banking industry. This acquisition ensures TCS’ access to globally implemented BANCS software and a strong customer base that include banks in emerging markets in Europe, Asia, Australia and Africa. This software has been adopted by over 115 banks in 35 countries and TCS is motivated “to derive high synergistic value by combining its own product portfolio with BANCS software and by offering the customer its servicing capabilities” (TCS Annual Report 2005–2006, p. 18). With a view to expand its presence and capability in the global business process outsourcing (BPO), TCS acquired the BPO division of UK based Pearl Group in October 2005 and Chile based Comicrom in November 2005. In the UK life and pensions industry,
1 8 Financial Express (2001), ‘ TCS forms special cell for mergers and acquisitions’, December 15. 1 9 TCS Annual Report 2005–2006, p. 18.

38
the acquired entity from Pearl Group is the second largest player and Comicron is the biggest player in Chile's banking and pensions BPO business20. Obviously, these acquisitions are motivated to benefit from the local expertise, skills and customer base of acquired entities and reap economies of operating synergies. In October 2006, TCS made a strategic decision to acquire 75 per cent stake in Switzerland-based TKS-Teknosoft. This acquisition is to increase the business of the company in Europe thus reducing excess dependence on the US market and to access TKS’ ALPHA and e-Portfolio product portfolio, global distribution rights over QUARTZ (a wholesale banking product), experience and domain expertise, language capabilities and knowledge of local practices21. The acquisition of an Australian company Total Communication Solutions was inspired by the desire to enhance TCS’ market share in Australian business and IT consulting market22. In this case too the acquired entity is expected to provide substantial operating synergies by bringing in knowledge and experience on local practices and domain consulting.
Table-16 Acquisition by TCS, 2001–2006
Year Acquired Company Country of Incorporation
Value of the Acquisition (Rs. Crore)
November 2001 Computer Maintenance Corporation (CMC) Ltd.
India 157
January 2004 Airline Financial Support Services India (AFS)
India NA
March 2004 Aviation Software Development Consultancy India (ASDC)
India 14.03
July 2004 Phoenix Global Solutions India 27.02 May 2005 Sw edish Indian IT Resources AB Sw eden 21.50 October 2005 Financial Network Services Australia 110.27 October 2005 BPO division of Pearl Group UK 426.20 November 2005 Comicrom Chile 103.84 February 2006 Tata Infotech India stock swap October 2006 TKS-Teknosoft Switzerland 360 November 2006 Total Communication Solutions Australia 50 Source: Based on different newspaper reports, TCS’ website and various annual reports.
Above discussion shows that TCS has been employing OFDI in greenfield and brownfield forms to increase its global presence, acquire new skills, technologies and benefits from operating synergies. Given the strong base of skilled manpower, higher
2 0 Business Standard (2005), ‘TCS: Acquisition spree’, November 09. 2 1 Hindu Business Line (2006), ‘TCS buys 75% stake in Swiss co’, November 01. 2 2 Hindu Business Line (2006), ‘TCS buys Australian co for Rs 50 cr, Business Line’, November 09.

39
innovative activities23 and aggressively pursued OFDI strategy the company is likely to emerge as a leading Indian multinational in the global market.
5.2. H C L Technologies Ltd.
HCL technologies is a part of one of India’s oldest private sector hardware company HCL enterprise that led the first ever IST OFDI from India in 1979. HCL came into existence in August 1976 with a group of eight engineers who migrated from the calculator division of DCM Limited. The exit of IBM left an unfulfilled domestic demand for computers in India and companies like HCL came forward to meet that demand. Government institutions like IITs, institutes of science and various engineering colleges were source of the initial demand for computers from HCL24. In 1978, the company went for commercial computers and successfully launched in-house designed micro-computers in India. With its initial strength, the company decided to go for international production and received the government approval for a joint venture in Singapore in 1979, which started operating from 1980. This overseas expansion by HCL was targeted at the SME (small and medium size enterprises) market and to exploit its modest expertise in hardware25. The operation in Singapore has provided immense learning to the company, which Mr. Ajai Chowdhry, President and MD, HCL Infosystem, expressed as follows: “However, once there, we realized that the demand was more for solutions, not so much for boxes. We set up a software factory in Chennai—we would go to customers and tell them we would do everything—make the box, write the software, train the staff, maintain the equipment, the works…”26 This is the beginning of HCL to devote some focus on software services apart from its primary orientation on computer hardware segment. The Software Export Division that was formed at Chennai in 1981 was to provide personalized application development needs of overseas clients in Singapore 27. The Singapore experience led the company to work on the software integration database much before Intel but could not foresee the technological changes so it discontinued work on its original product. The company continued to grow in the
2 3 As of February 2007, Tata group (excluding Corus) owns about 8 patents granted by the USPTO.
Of these as many as 6 paten t belongs to TCS, 2 patents are with TCS’ subsidiary Tata America International Corporation and just 1 belong to Tata Tea Ltd. Source: Harish Damodaran (2007) ‘80 plus Corus patents for Tata Steel likely’, Hindu Business Line, February 04.
2 4 Hindu Busines s Line (2001), `Time to celebrate competition', September 05. 2 5 Interview of Mr. Ajai Chowdhry, President and MD, HCL Infosystem, in Dataquest (2002) ‘The
Making of a Giant’, March 15, first issue. 2 6 Interview of Mr. Ajai Chowdhry, President and MD, HCL Infosystem, Ibid. 2 7 The history of HCL Infosystems Ltd available at
http://www.hclinfosystems.com/op_history.htm

40
domestic market in the 1980s by providing the largest selling software product to Indian banks during computerization of Indian banks and by launching HCL designs Unix-based computers and IBM PC clones. It has also taken the initiative in IT education and has established NIIT– the first private sector IT education institution in 1981.
In 1989, HCL entered into the US market with its expertise in computer hardware. This product led entry of HCL turned out to be an imperfect expansion strategy marked by inadequate resource base of the parent firm and its inability to even obtain required environmental clearances. The US reversal led the company to rethink on its business strategy to emphasize on its UNIX strengths for software development28. HCL’s joint venture with Hewlett Packard in 1991 turned out to be a turning point in the growth of the company. HCL had a great learning experience with HP providing technical assistance to HCL in providing IT based services covering systems integration, IT consulting, and packaged support services. As a part of the joint venture agreement, HCL employees got the opportunity to work at the HP research centres mastering all of the technologies developed by the joint venture partner. However, HCL did not close down its RISC (Reduced Instruction Set Computer) and UNIX R&D units set-up as asked by HP and continued its R&D work under a separate entity named HCL Consulting. This is a classic example of how a domestic company has leveraged its technological capability by collaborating with a foreign firm.
The favourable policy regime for software exports and uncertain policy on hardware segment pursued by India has affected the business behaviour of HCL significantly. The company, which was predominantly a hardware player, started aggressively focusing on software and services in the mid-1990s. It also wanted to derive growth benefits from the home country’s cheap manpower advantage as exploited by faster growing software companies like TCS, Wipro, etc. In 1994, HCL successfully completed its first offshore project from IBM Thailand and has set up a core group to define software development methodologies. Taking advantage of the policy of Software Technology Park (STP), the company entered into STPs at Chennai, Kolkata and Noida during 1996–97. In 1997 HCL bought back HP stake in HCL Hewlett Packard and HCL Consulting was later turned into HCL Technologies in 1998. The software business of HCL grew impressively in the late 1990s to dominate its overall business—the hardware to software ratio has consistently declined from 83:17 in early 1990s to 38:62 in 1997–98 to further 23:77 (including NIIT) in 2000–01 (Dataquest, 2001)29.
2 8 Interview of Mr. Ajai Chowdhry, President and MD, HCL Infosystem, Ibid. 2 9 Dataquest (2001) ‘HCL: Top of the Giants; A continuing shift tow ard services kept all group
companies growing and profitable, and helped the HCL group stay No 1’, July 21.

41
The late 1990s further saw HCL technologies establishing a number of greenfield subsidiaries in European countries like UK, Germany, Sweden, Belgium and Italy with the objective of providing software services on -site nearer to the overseas customers. The OFDI activity of the company was also directed at other developed countries such as New Zealand, Australia, Japan and Hong Kong. The company is also a forerunner among Indian IST firms to use acquisition as a strategy of growth. Its acquisition activities cover four overseas acquisitions targeting two countries such as Ireland and USA (Table-17). In December 2001 it acquired Ireland-based Apollo Contact Centre for $11.5 million to gain a sound market presence in the IT-enabled services space and in the European market 30. The acquisition of Gulf Computers Inc. in June 2002 was motivated to
Table-17 Acquisition by HCL Technologies, 2001–2005
Month and Year Acquired Entity Country of Incorporation
Value of the deal
Feb. 2005 AnswerCall Direct Contact Centre Ireland Rs. 29.39 crore
Feb. 2005 Aquila Technologies Ltd (balance 43 per cent stake)
India
Dec. 2004 Apollo Contact Centre (10 percent stake) Ireland Rs. 15.23 crore Dec. 2004 Aalayance Inc. (Additional 36 per cent stake) USA $1.9 million Oct. 2004 Shipara Technologies (remaining 23 per cent
stake) India
July 2004 Aquila Technologies Ltd (additional 21.5 per cent stake)
India
Jan. 2003 Aalayance Inc. (19 per cent stake) USA $0.45 million June 2002 Gulf Computers inc. USA $9.75 million May 2002 Aquila Technologies Ltd (35.5 per cent stake) India Rs 5.55 crore Dec. 2001 Apollo Contact Centre (90 percent stake) Ireland $12.7million Sept. 2001 Deutsche Software (51 per cent stake) India $11.5 million Source: Based on various newspaper reports.
access the strong client relationship and established advantages in application development for business process automation of the targeted entity in the US market31. The acquisition of strategic stake in the US based Aalayance Inc. in 2003 was to further improve the expertise of HCL technologies in the areas of enterprise application integration and business integration32. By acquiring the assets and business of
3 0 Newsbytes News Network (2001), ‘India - HCL Tech Acquires Irish Firm For $11.5Mil’, October
30. 3 1 Hindu Business Line (2002), ‘HCL Tech buys Gulf Computers’, June 02. 3 2 Hindu Business Line (2003), ‘HCL Tech acquires 19 pc stake in US company’, January 18.

42
AnswerCall Direct in 2005, HCL technologies catapulted to the single largest Outsourced Contact/BPO Centre operating in Ireland33. This acquisition has provided access to expertise in newer domains of call centre services like media and transportation.
The foreign assets and revenues of HCL technologies is observed to be overwhelmingly concentrated in developed countries. Respectively about 81.6 and 93.7 per cent of foreign assets and revenues of the company in 2006 is accounted by them (Table-18). Within the
Table-18 Geography of HCL Technologies’ Foreign Assets and Sales, 2005–2006
Assets (%) Sales (%) Region/Country 2006 2005 2006 2005
Developed Countries 81.6 77.2 93.7 94.7 Europe 37.0 40.4 30.4 46.6
Austria 15.9 13.8 1.1 0.5 Belgium 0.2 0.2 0.2 0.2 Germany 2.6 16.4 1.5 29.0 Italy 0.0 0.0 0.0 0.0 Netherlands 0.6 0.3 0.6 0.2 Sw eden 0.4 0.2 0.3 0.1 UK 17.4 9.4 26.6 16.6
North America 42.3 35.4 56.3 43.2 USA 42.3 35.4 56.3 43.2 Canada 0.0 0.0 0.0 0.0
Other Developed Countries 2.2 1.5 7.1 4.8 Australia 0.8 0.6 2.8 2.2 Japan 1.2 0.7 3.3 1.9 New Zealand 0.2 0.2 0.9 0.7
Developing Countries 18.4 22.8 6.3 5.3 Africa 0.9 1.1 0.0 0.0
Mauritius 0.9 1.1 0.0 0.0 Latin America 14.8 18.8 1.3 1.2
Bermuda 14.8 18.8 1.3 1.2 Asia 2.7 2.9 5.1 4.2
Malaysia 1.0 0.9 1.3 1.2 Singapore 1.3 1.7 3.0 2.2 Hong Kong 0.4 0.3 0.7 0.7
All Region 100 100 100 100 Source: Based on Table-18.
developed region, North America led by USA is the largest overseas market for the company. Europe is the second most important foreign market for the company largely led by UK and Germany. However, the share of Germany has substantially plummeted between 2005 and 2006, thus leaving UK as the largest European market. Although 3 3 Hindu Business Line (2005), ‘HCL Tech acquires call centre in Ireland’, February 25.

43
developing countries account for about 18 per cent of HCL technologies’ foreign assets their contribution to foreign revenue is as low as 5 per cent.
The distribution of the foreign assets and revenues of HCL technologies among its individual foreign firms is summarized in Table-19. It can be seen that majority of HCL technologies’ foreign subsidiaries are of small size in terms of the asset base. Of the 31 foreign subsidiaries, just four (HCL America Inc., HCL Holdings GmbH, HCL Bermuda, and HCL Great Britain) accounted for about 84 per cent of the total foreign asset of the parent company in 2006. Similar feature can also be obtained in terms of revenue distribution and the three large subsidiaries (HCL America Inc., HCL Great Britain, and HCL BPO Services (NI)) together accounted for about 78 per cent of total foreign sales of the parent firm in 2006. Between 2005 and 2006, the assets and sales of all foreign subsidiaries have been characterized by moderate change of 3.63 and 2.52 per cent respectively. However, there are substantial differences among individual foreign subsidiaries with respect to expansion of total assets and growth of sales during 2005–2006. Substantial investment in total assets has been undertaken in seven overseas subsidiaries such as HCL GmbH (279 per cent), HCL Great Britain (157 per cent), HCL Sweden AB (82 per cent), HCL Japan (74 per cent), HCL (Netherlands) (72.3 per cent), HCL Technologies (Mass) (69 per cent), and HCL Australia Services Pty. (59 per cent). At the same time, there has been significant dilution in the assets of small-sized foreign subsidiaries such as E Serve Holding, HCL Venture Capital, DSI Financial Solutions Pte, HCL Jones (Bermuda), and HCL Italy SLR. This trend in asset formation clearly shows that the parent company is making efforts to strengthen its market position in the European countries and also in Japan. In terms of revenue performance between 2005 and 2006, an impressive growth can be seen in HCL Sweden AB, HCL GmbH, HCL (Netherlands) BV, HCL Holdings GmbH, HCL Great Britain, HCL Japan, HCL Singapore Pte, HCL America Inc., HCL Australia Services Pty., HCL (New Zealand), HCL BPO Services (NI), and HCL Bermuda.
Table-19 Assets and Turnovers of HCL Technologies’ Foreign Subsidiaries, 2005–2006
Total Assets (Rs. Crore) Turnover (Rs. Crore) Name of the Subsidiary Company 2006 2005 Change (%) 2006 2005 Change (%)
Country of location
HCL Bermuda Limited
427.59 (14.49)
516.68 (18.15)
-17.24 17.56 (0.59)
13.94 (0.48)
26.02 Bermuda
HCL America Inc. 1194.42 (40.48)
971.58 (34.12)
22.94 1531.16 (51.28)
1121.79 (38.52)
36.49 USA
HCL Great Britain Limited
382.04 (12.95)
148.59 (5.22)
157.10 529.69 (17.74)
273.12 (9.38)
93.94 UK
HCL Sweden AB 11.42 (0.39)
6.28 (0.22)
81.97 9.29 (0.31)
2.63 (0.09)
252.95 Sweden
HCL (Netherlands) 16.58 9.62 72.34 18.07 5.76 213.66 Netherlands

44
Total Assets (Rs. Crore) Turnover (Rs. Crore) Name of the Subsidiary Company 2006 2005 Change (%) 2006 2005 Change (%)
Country of location
BV (0.56) (0.34) (0.61) (0.20) HCL GmbH 77.45
(2.62) 20.42 (0.72)
279.26 44.11 (1.48)
14 (0.48)
215.11 Germany
HCL Italy SLR 0.04 (0.00)
0.06 (0.00)
-20.14 0 (0.00)
0 (0.00)
-93.48 Italy
HCL Belgium NV 5.59 (0.19)
4.71 (0.17)
18.72 6.99 (0.23)
6.42 (0.22)
8.93 Belgium
HCL Australia Services Pty. Ltd.
24.59 (0.83)
15.58 (0.55)
57.86 84.26 (2.82)
65.02 (2.23)
29.60 Australia
HCL (New Zealand) Limited
7.15 (0.24)
5.41 (0.19)
32.13 27.15 (0.91)
21.25 (0.73)
27.73 New Zealand
HCL Hong Kong SAR Limited
11.01 (0.37)
8.53 (0.30)
29.17 21.38 (0.72)
21.11 (0.72)
1.24 Hong Kong
HCL Japan Limited. 34.15 (1.16)
19.67 (0.69)
73.59 99.57 (3.33)
54.9 (1.89)
81.38 Japan
HCL Holdings GmbH 468.26 (15.87)
392.95 (13.80)
19.17 32.36 (1.08)
14 (0.48)
131.10 Austria
HCL Venture Capital Limited
0.38 (0.01)
4.78 (0.17)
-92.16 5.97 (0.20)
Bermuda
E Serve Holding Limited
0.02 (0.00)
4.4 (0.15)
-99.60 0.03 (0.00)
Mauritius
HCL Enterprise Solutions Ltd.
27 (0.92)
25.65 (0.90)
5.25 0 (0.00)
Mauritius
DSI Financial Solutions Pte Limited
0.53 (0.02)
1.16 (0.04)
-53.89 (0.00)
Singapore
HCL BPO Services (NI) Ltd.
130.55 (4.42)
119.31 (4.19)
9.42 265.39 (8.89)
209.44 (7.19)
26.72 UK
HCL Technologies (Mass) Inc.
25.45 (0.86)
15.07 (0.53)
68.84 56.47 (1.89)
66.31 (2.28)
-14.85 USA
HCL Jones LLC 15.84 (0.54)
12.66 (0.44)
25.12 50.46 (1.69)
50.77 (1.74)
-0.62 USA
HCL Jones (Bermuda) Limited
8.14 (0.28)
13.95 (0.49)
-41.61 14.24 (0.48)
19.97 (0.69)
-28.66 Bermuda
HCL m.a. Limited 0.04 (0.00)
0.03 (0.00)
19.55 0 (0.00)
UK
Insys Inc, Canada 0 (0.00)
0.01 (0.00)
-51.00 (0.00)
Canada
HCL Singapore Pte Limited
38.67 (1.31)
47.34 (1.66)
-18.30 90.11 (3.02)
65.34 (2.24)
37.91 Singapore
HCL (Malaysia) Sdn. Bhd
29.2 (0.99)
25.69 (0.90)
13.66 39.32 (1.32)
35.25 (1.21)
11.55 Malaysia
Infosystems (Europe) Limited
0.62 (0.02)
0.62 (0.02)
-0.39 (0.00)
UK
HCL EAI Services Inc. 13.76 (0.47)
41.51 (1.39)
USA
Aalayance (UK) Limited
0.22 (0.01)
0.54 (0.02)
UK
Aalayance Inc.
7.78 (0.27)
(0.00)
20.1 (0.69)
USA
Infosystems Australia 0.93 0.01 Australia

45
Total Assets (Rs. Crore) Turnover (Rs. Crore) Name of the Subsidiary Company 2006 2005 Change (%) 2006 2005 Change (%)
Country of location
Pty. Ltd. (0.03) (0.00) (0.00) DSL GmbH
447.98 (15.73)
(0.00)
831.25 (28.54)
Germany
All subsidiaries 2950.71 (100.00)
2847.44 (100.00)
3.63 2985.63 (100.00)
2912.38 (100.00)
2.52
Note: percentage share is in parenthesis. Source: HCL Technologies Annual Report 2004-05 and 2005–06.
6. Conclusion
The emergence of IST multinationals from India is a result of growing sophistication of Indian national innovation system (NIS). The government has played a crucial role in the innovation process by creati ng conditions for skills accumulation, infrastructure building and adopting a more conducive and systematic outward looking policy for software industry. Indian software firms, in turn, have shown their ability to leverage from availability of skill resources and improve their firm-specific technology and other capabilities. As far as Indian households are concerned, they send their members for technical education in India and abroad and overseas labour markets (mainly US) as skilled workers linking Indian IST industry with global market by providing valuable contacts, linkages, and networking. The development of financial institutions like bank, capital market and venture capital, democratic polity, etc., also have positively influenced the growth of India’s capabilities in the IST sector. With strong capabilities in skill-based technologies, Indian IST firms started serving global customers by establishing their subsidiaries overseas. This OFDI drive of these firms is primarily motivated to exploit firm-specific advantages through an offshore-onshore model of service delivery.
There are four distinct features of Indian IST multinationals. First, majority of their overseas subsidiaries are in developed countries with USA and UK as the two major hosts. The share of developed countries is about 69 per cent in total number of IST overseas subsidiaries from India. Developing countries accounted for just 31 per cent and Asia is the major host developing region with about 25 per cent. Second, the Indian IST multinat ionals tend to have majority ownership over their overseas ventures. Third, there is a high level concentration among Indian IST multinationals on the number of their overseas subsidiaries. A group of sixty large IST multinationals (about 36 per cent of total IST multinationals) disproportionately accounts for over 72 per cent of Indian IST overseas subsidiaries. Fourth, the firm-specific characteristics of Indian IST multinationals indicate that they are large-sized and highly export oriented and possess relatively higher values for R&D intensity, advertising intensity and firm age as

46
compared to Indian IST firms not investing in overseas investment. The case study of two selected large Indian IST multinationals reveals the firm-level dynamics in growth and capability building under an evolving and a favourable NIS.
6.1. Implications for Developing C ountries
India’s development experience in the IST industry offers a number of lessons to policy makers in other developin g countries aspiring to benefit from promoting their own IST industry. Being a skill-based industry, a developing country may find it easier to build capability in the IST industry with relatively less resources than what may be required in the case of capital intensive manufacturing industries. These countries should judiciously invest their scarce resources in specific skill and infrastructural development required by IST industry. A more proactive government policy based on cluster approach and openness to IST FDI can also contribute to the development of IST industry. With the Indian IST multinationals showing increasing intensity to secure overseas skill base, other developing countries can also invite these firms to set up development and training centres in their respective location so as to benefit from knowledge-spillovers effect. Overall, developing countries need to build up a suitable NIS for achieving critical success in the global IST sector. This suitable NIS should address following three main areas of interventions:
i . Establ ishment of Skil l Institution s
The most important factor that contributes to the development of software industry is availability of requisite skills in a country. India’s unprecedented success in this industry can be traced back to a pool of highly trained software professionals routinely churned out by a rising number of public-funded autonomous technology centres like IITs, IISs, Regional Engineering Colleges, etc. Obviously, government investment in specific skill creation has a critical bearing on the growth of IST industry. Hence, developing countries should establish a chain of institutions in engineering and computer science and these technology institutions in turn will act as national centres for knowledge creation meeting the skill requirement of the IST industry. Besides, promoting technical knowledge and computer skills through general educational institutions like universities, colleges, schools, etc., can go a long way in helping developing countries to develop their own IST sector.

47
i i . Improvement in Infrastructure and P romotion of IT Usage
The Indian experience highlighted the importance of developing quality telecommunication and physical infrastructure for encouraging the growth of IST industry. Indian government has promoted several Software Technology Parks as a cost-effective means of ensuring infrastructure like high speed satellite links, power, etc., and has also pro vided incentives for locating services centres in such industrial clusters. Other developing countries shall explore ways to replicate India’s experience in the provision of infrastructure in cost -effective manners. They should also go for computerization of various government departments thus generating demand for domestic software companies. Use of computers, internet, and other IT technologies in the domestic economy also needs to be encouraged by various policy initiatives.
i ii. An Outward - looking Policy Regime
A systematic and outward-looking policy regime emerges as one of the critical factors leading to the rise of Indian IST industry. Developing countries’ policy framework needs to adopt a more liberal attitude to the IST foreign investment. Inward foreign software services companies tend to provide state of the art training to domestic manpower and thus could generate valuable skill spillover effects in the host developing countries. These trained professionals by foreign firms could later start their own enterprises, as happened in the case of India in the post-IBM period. Domestic software companies should also be encouraged to enter into collaborative alliances with foreign firms. Various fiscal incentives to domestic software firms like exempting their export and consultancy revenues from custom duties and taxation, permitting them to have easy and duty-free imports of computers and other accessories, etc., are also valuable policy tools.
The above-listed policies together with those directed at helping the domestic firms with easy and cheap financial resources, information, marketing-support, R&D facilities, etc., can help other developing countries to develop their indigenous IST industry.
6.2. Implications for India
Although India is able to promote globally competitive software industry based on a well crafted NIS, its policy emphasis now needs to focus on emerging problems faced by the industry. The skill manpower, the fundamental competitive source of Indian software capability, is increasingly falling short of the requirement of a phenomenally growing sector. A sharp shortage of skilled labour can be seen in different segments of the IT sector. For example, the projected requirement for Outsourced Product Development

48
segment is 2.8 lakh product engineers by 2008, where the current availability of product-focused software professionals is just about 80,00034. As per Nasscom-McKinsey Report 2005 on Extending India’s leadership in the global IT and BPO industries, India requires an additional 5 lakh professionals just to maintain its existing share in the global IT and BPO industries. While Indian government has set up additional IITs and IIMs and taken steps to covert Regional Engineering Colleges into National Institute of Technologies, the resources available at the disposal of policy makers for investing in higher education is quite inadequate. In this case policy measures to encourage private training institutions are required. It is not just the quantity of skilled manpower that is important for Indian IT sector but also, and more importantly, access to relevant skill. In this context, training and skill institutions should show needed flexibility to redraft their syllabus and courses in accordance with the skill requirement of a dynamic industry.
Apart from addressing the problem of skill shortages, India needs to tackle severe infrastructural constraints faced by urban locations hosting software technology parks. For example, India’s Silicon Valley, Bangalore, is increasingly witnessing a serious lack of the basic infrastructure involving roads, electricity, public transportation, airport facilities and suffering from congestation and rising pollution35. Since these urban locations ac as nerve centre s of India’s software exports, it is essential that infrastructure spending must be at a comparable pace as the growth of these cities.
6.3. Implications for Indian IST Fir ms
Overseas presence through sales and development subsidiaries is a critical factor for increasing software exports from India and to maintain the global market share. In this context, outward FDI constitutes a basic element for developing an efficient an d successful onshore-offshore model of service delivery system. The phenomenal growth of India’s successful companies like TCS and HCL technologies can be attributed to their pioneering attempts to open sales subsidiaries abroad and then to establish software development subsidiary. It is also important for Indian companies to pursue the route of overseas acquisition to enter into a foreign market or to gain access to skill and knowledge-base of a host country. Once they have a sound acquisition strategy with well designed integration process, then acquisition provides an easy way to acquire new business domain or strengthen global position in a particular area.
3 4 Financial Express (2005), ‘Skill shortage hits outso urced product development industry’, August
22. 3 5 New York Times (2005), ‘Companies rebel over Bangalore's sad state’, September. 13.

49
Reference
Abraham,V. and R.K.Sharma (2005), ‘New Technology and the Emerging Labour Market: A Study of Indian IT Industry’, Indian Journal of Labour Economics , 48 , pp. 789–802.
Abrunhosa, A. (2003), ‘The National Innovation Systems Approach and the Innovation Matrix’, paper presented at the DRUID Summer Conference 2003, Copenhagen, June 12–14.
Bainard, S. L. (1997), ‘An empirical assessment of the proximity-concentration trade-off between multinational sales and trade’, American Economic Review , 87, pp. 520–544.
Buckley, P.J. (1988), ‘The Limits of Explanation: Testing the Internalization Theory of Multinational Enterprise’, Journal of International Business Studies, 19, pp. 181–193.
Buckley, P.J. and M. Casson (1985), The Economic Theory of the Multinational Enterprise, London: MacMillan Press.
Center for Public Integrity (2005), Drug Lobby Second to None: How the pharmaceutical industry gets its way in Washington, Special Report, Washington.
Dataquest (2006), ‘...Companies that defined Indian IT’, Saturday, December 30.
Dunning, J.H. (1980), ‘Toward an Eclectic Theory of International Production: Some Empirical Results’, Journal of International Business Studies, 11, pp. 9–31.
Dunning, J.H. (1988), ‘The Eclectic Paradigm of International Production: A Restatement and Some Possible Extensions’, Journal of International Business Studies, 19, pp. 1–31.
Freeman, C. (1988), ‘Japan: A new National Innovation Systems?’, in Dosi, G., Freeman, C., Nelson, R.R., Silverberg, G. and Soete, L.,(eds.) Technology and Economic Theory, London: Pinter Publishers, pp. 330–348.
Harding, E. U. (1989), ‘After IBM's exit, an industry arose; India offers a development alternative for U.S. firms facing make/buy decision’, Software Magazine, Nov 15.
Joseph, K.J. (2006), Information Technology, Innovation System and Trade Regime in Developing Countries: India and the ASEAN, New York: Palgrave Macmillan.
Kokhova, S. V. and A. G. Sukharev (2001), India: Targeting For the Status of a Global IT Superpower: Indian Government Software Policies and Their Benefits, Moscow: Moscow University Publishing House.
Krugman, P. R. (1987), (ed.) Strategic Trade Policy and the New International Economics, Second Printing, Cambridge: MIT Press.
Lall, R.B. (1986), Multinationals from the Third World: Indian Firms Investing Abroad, Delhi: Oxford University Press.
Lundvall , B-Å. (1985), Product Innovation and User-Producer Interaction, Aalborg: Aalborg University Press.

50
Lundvall , B-Å. (1992), (ed.) National Systems of Innovation – Towards a Theory of Innovation and Interactive Learning , London and New York: Pinter Publishers.
Nelson, R.R. (1993), (ed.) National Systems of Innovation: A Comparative Study, Oxford: Oxford University Press.
OECD (1997), National Innovation Systems, Paris, France.
Pradhan, J.P. (2003), ‘Rise of Service Sector Outward Foreign Direct Investment from Indian Economy: Trends, Patterns, and Determinants’, RIS Discussion Paper (RIS -DP) #63/2003, later published in GITAM Journal of Management, Vol. 4, No. 1, 2006, pp. 70–97.
Pradhan, J.P. (2004), ‘The Determinants of Outward Foreign Direct Investment: A Firm Level Analysis of Indian Manufacturing’, Oxford Development Studies, 32, pp. 619–639.
Pradhan, J.P. (2005), ‘Outward Foreign Direct Investment from India: Recent Trends and Patterns’, GIDR Working Paper, No. 153, Gujarat Institute of Development Research, Ahmedabad.
Pradhan, J.P. (2007), ‘Growth of Indian multinationals in the world economy: implications for development’, ISID Working Paper, No. 2007/04, Institute for Studies in Industrial Development, New Delhi.
Pradhan, J.P. and A. Alakshendra (2006), ‘Overseas Acquisition versus Greenfield Foreign Investment: Which Internationalization Strategy is better for Indian Pharmaceutical Enterprises?’, ISID Working Paper, No. WP2006/07.
Pradhan, J.P. and M.K. Sahoo (2005), Outward Foreign Direct Investment by Indian Small and Medium-Sized Enterprises, A consultancy report prepared for the UNCTAD's Global Network of Global Players project.
Pradhan, J.P. and V. Abraham (2005), ‘Overseas Mergers and Acquisitions by Indian Enterprises: Patterns and Motivations’, Indian Journal of Economics, Vol. LXXXV, pp. 365–386.
Radhakrishnan, K. G. (2003), Growth and Structural Transformation of Indian Software Industry, unpublished Ph.D. thesis, Jawaharlal Nehru University, New Delhi.
Rugman, A. (1985), ‘Internalization is still a general theory of Foreign Direct Investment. A Reappraisal of the Literature’, Welwirtshaftliches Archiv,116, pp. 365–739.
Rugman, A. (1986), ‘New Theories of the Multinational Enterprise: An Assessment of Internalization Theory’, Bulletin of Economic Research, 38, pp. 101–118.
Sauvant, K. P. (2005), ‘New Sources of FDI: The BRICs’, Journal of World Investment & Trade, 6, pp. 639–709.
Sharma, G., P. Anand and A. Sen (2006), ‘Indian Hardware Industry – Structure, Problems and Prospects’, IIMC Working Paper, No. 598, Indian Institute of Management Calcutta, India.
UNCTAD (2004), ‘India’s outward FDI: a giant awakening?’, UNCTAD/DITE/IIAB/2004/1, October 20.
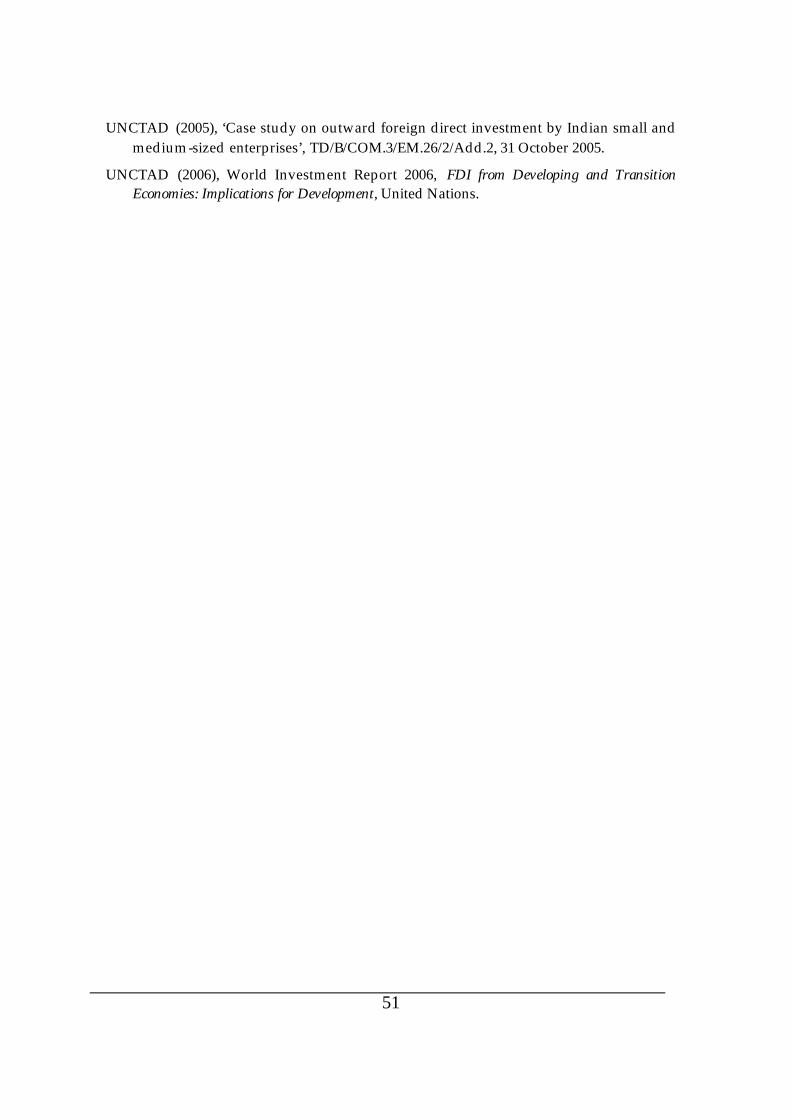
51
UNCTAD (2005), ‘Case study on outward foreign direct investment by Indian small and medium-sized enterprises’, TD/B/COM.3/EM.26/2/Add.2, 31 October 2005.
UNCTAD (2006), World Investment Report 2006, FDI from Developing and Transition Economies: Implications for Development, United Nations.

52
Appendix
Table-A1 Information on Overseas Subsidiaries of Indian IST Multinationals
Name of Indian Parent Firm Name of Overseas Venture S / JV / AC*
Country of incorporation
%age of equity holding
Year of the data
3I Infotech Ltd. 3i Infotech (Thailand) Ltd S Thailand 100% 2006 3I Infotech Ltd. SDG Software Technologies Pte. Ltd. S Singapore 100% 2006 3I Infotech Ltd. 3I Infotech SDN BHD (formerly
ICICI Infotech SDN BHD) S Malaysia 100% 2006
3I Infotech Ltd. 3i Infotech (UK) Ltd S UK 100% 2006 3I Infotech Ltd. 3I Infotech Pte Ltd (formerly ICICI
Infotech Pte Ltd) S Singapore 100% 2006
3I Infotech Ltd. 3i Infotech Consulting Inc. S USA 100% 2006 3I Infotech Ltd. 3i Infotech Inc. S USA 100% 2006 3I Infotech Ltd. FormulaWare Inc S USA 100% 2006 AG Technologies Pvt. Ltd AG Tech, Inc. S USA 2006 AXIS-IT&T Ltd. Axis Inc. S USA 100% 2006 AXIS-IT&T Ltd. Axis EU Limited S UK 100% 2006 Aftek Ltd. Arexera Information Technologies
GmbH S Germany 100% 2006
Aftek Ltd. Opdex Inc USA (Formerly known as Aftek Infosys (USA) Inc.)
S USA 100% 2006
Akal information Systems Ltd
SG Martin Infoways (USA) Ltd. S USA 2006
Allsec Technologies Ltd. B2K Corp Inc., S USA 100% 2006 Allsec Technologies Ltd. Allsectech Inc., S USA 100% 2006 Apt Software Avenues Pvt Ltd
Agarwal Associates Ltd S UK 2006
Aptech Ltd. Aptech Worldwide Corporation S USA 100% 2005 Aptech Ltd. Aptech (WOS) Bangladesh Limited S Bangladesh 100% 2005 Aptech Ltd. Beijing Aptech Beida Jade Bird
Information Technology Co. Limited JV China 50% 2005
Aptech Ltd. Aptech Training Limited FZE S UAE 100% 2005 Aptech Ltd. Aptech Worldwide Limited S South Africa 2005 Artech Infosystems Pvt Ltd
Dalton International Limited S UK 2006
Artech Infosystems Pvt Ltd
Artech Information Systems L.L.C. S USA 2006
Artech Infosystems Pvt Ltd
Artech China Ltd S China 2006
Aspire Systems (India) Pvt. Ltd.
Aspire Systems, Inc. S USA 2006
Aurionpro Solutions Ltd. Software Professional Services S USA 2006 Aurionpro Solutions Ltd. Aurionpro Solutions PTE Ltd S Singapore 100% 2006 Aurionpro Solutions Ltd. Aurionpro Solutions, SPC S Bahrain 100% 2006 Aurionpro Solutions Ltd. Coban Corporation, S USA 2006 Aurionpro Solutions Ltd. Agile Solv LLC S USA 100% 2006

53
Name of Indian Parent Firm Name of Overseas Venture S / JV / AC*
Country of incorporation
%age of equity holding
Year of the data
Aurionpro Solutions Ltd. Infobyte International WLL S Bahrain 2006 Aurionpro Solutions Ltd. Aurionrpo Solutions INC S USA 100% 2006 Aztecsoft Ltd. Disha Technologies Inc S USA 100% 2006 Aztecsoft Ltd. Aztec Software Inc. S USA 100% 2006 B 2 B Software Technologies Ltd.
B2B Infotech SDNBHD S Malaysia 100% 2006
B 2 B Software Technologies Ltd.
B2B Infotech Pte Limited S Singapore 100% 2006
B 2 B Software Technologies Ltd.
B2B Software Technologies Kassel GmbH
S Germany 100% 2006
B 2 B Software Technologies Ltd.
B2B Softech Inc S USA 100% 2006
BPL Telecom Pvt. Ltd. P.R. Glolinks Consulting S UK 2006 BPL Telecom Pvt. Ltd. ATL Industries Pte Ltd. S Singapore 2006 BPL Telecom Pvt. Ltd. BPL Systems S USA 2006 BPL Telecom Pvt. Ltd. SEAIN Solutions Limited S Taiwan 2006 BPL Telecom Pvt. Ltd. BK Solutions Limited S Japan 2006 BPL Telecom Pvt. Ltd. HANI Corporation S Korea 2006 Bangalore Softsell Ltd. Lemit Inc. S USA 100% 2006 Bangalore Softsell Ltd. nv Lemit Europe sa S Belgium 100% 2006 Blue Star Infotech Ltd. Blue Star Infotech (UK) S UK 100% 2006 Blue Star Infotech Ltd. Blue Star Infotech America Inc S USA 100% 2006 C G-V A K Software & Exports Ltd.
C G-V A K Software Usa Inc. S USA 100% 2005
C M C Ltd. C M C Americas,Inc. S USA 100% 2006 CG-Smith Software Private Limited
CG-Smith Software Inc. S USA 2006
California Software Co. Ltd.
Informed Decisions Corporations S USA 51% 2006
California Software Co. Ltd.
Cswl Inc. Usa S USA 100% 2006
California Software Co. Ltd.
American Healthnet Inc S USA 52% 2006
California Software Co. Ltd.
Healthnet International Inc S USA 100% 2006
Cambridge Solutions Ltd. BWH SARL S France 100% 2006 Cambridge Solutions Ltd. Cambridge Integrated Services
Victoria Pty Ltd S Australia 100% 2006
Cambridge Solutions Ltd. Scandent Group Pte Ltd., S Singapore 100% 2006 Cambridge Solutions Ltd. ProcessMind Holdings Mauritius
Limited S Mauritius 100.00% 2006
Cambridge Solutions Ltd. Cambridge Integrated Services Group Inc.
S USA 100% 2006
Cambridge Solutions Ltd. Cambridge Presidium Holdings Inc. S USA 100% 2006 Cambridge Solutions Ltd. Scantalent Inc, S USA 100% 2006 Cambridge Solutions Ltd. Indigo Markets Ltd, Bermuda S Bermuda 100% 2006 Cambridge Solutions Ltd. Scandent Network Europe Ltd., S UK 100% 2006 Cambridge Solutions Ltd. ProcessMind Services Inc S USA 100% 2006

54
Name of Indian Parent Firm Name of Overseas Venture S / JV / AC*
Country of incorporation
%age of equity holding
Year of the data
Cambridge Solutions Ltd. Scandent Group Inc, S USA 100% 2006 Cambridge Solutions Ltd. Indigo Markets Europe Limited, S UK 100% 2006 Cambridge Solutions Ltd. Indigo Markets Singapore Pte Ltd S Singapore 100% 2006 Cambridge Solutions Ltd. Albion Inc, S USA 100% 2006 Cambridge Solutions Ltd. Cambridge Galaher Settlements &
Insurance Services S USA 100% 2006
Cambridge Solutions Ltd. Scandent Group GmbH, S Germany 100% 2006 Cambridge Solutions Ltd. ScadentGroup Sdn, BHD, S Malaysia 100% 2006 Cambridge Solutions Ltd. e-Business Corp. Inc, S USA 100.00% 2006 Cambridge Solutions Ltd. Cambridge Integrated Services
Australia Pty Ltd. S Australia 100% 2006
Cherrysoft Cherrytech Solutions S USA 2006 Compucom Software Ltd. ITneer, Inc., S USA 100% 2006 Compudyne Winfosystems Ltd.
COMPUDYNE WINFOSYSTEMS INC.
S USA 100% 2006
Compulink Systems Ltd. Compulink USA Inc. S USA 100% 2006 Compulink Systems Ltd. Compulink Software Pte. Ltd. S Singapore 100% 2006 Compulink Systems Ltd. Compulink Europe Ltd. S UK 100% 2006 Congruent Solutions Private Limited
Congruent Solutions, Inc S USA 2006
Congruent Solutions Private Limited
Congruent Solutions, Pte. Ltd. S Singapore 2006
Contech Software Ltd. Contech America Inc. S USA 2006 Core Projects & Technologies Ltd.
Enterprises Computing Services, Inc., S USA 2006
Core Projects & Technologi es Ltd.
CORE Projects & Technologies (FZE),
S UAE 2006
Cranes Software Intl. Ltd. Cranes Software International Pte Limited
S Singapore 100% 2006
Cranes Software Intl. Ltd. Systat Software Inc S USA 100% 2006 Cranes Software Intl. Ltd. Systat Software GmbH S Germany 100% 2006 Cranes Software Intl. Ltd. NISA Software Inc., S USA 100% 2006 Cranes Software Intl. Ltd. Systat Software UK Limited, United
Kingdom S UK 100% 2006
Cressanda Solutions Ltd. Cressanda Solutions UK Limited S UK 2006 Cressanda So lutions Ltd. Cressanda Solutions, Inc. S USA 2006 Cybertech Systems & Software Ltd.
CyberTech Europe S.A. S Luxembourg 100% 2006
Cybertech Systems & Software Ltd.
CyberTech Information Services BVBA
S Belgium 100% 2006
Cybertech Systems & Software Ltd.
CyberTech Systems and Software Inc.
S USA 100% 2006
Cybertech Systems & Software Ltd.
Corliant Inc., JV USA 4% 2006
Cybertech Systems & Software Ltd.
CyberTech Systems Inc. AC USA 2006
Cybertech Systems & Software Ltd.
Corliant Japan, K.K. AC Japan 2006
55
Name of Indian Parent Firm Name of Overseas Venture S / JV / AC*
Country of incorporation
%age of equity holding
Year of the data
Danlaw Technologies India Ltd.
Danlaw Technologies Inc, Usa S USA 100% 2006
Datamatics Technologies Ltd.
Datamatics Technologies U.K Limited
S UK 100% 2006
Datamatics Technologies Ltd.
Datamatics Technologies Inc. S USA 100% 2006
Datamatics Technologies Ltd.
Datamatics Technologies GmbH S Germany 100% 2006
DecisionCraft Analytics Limited
DecisionCraft Inc. S USA 100% 2006
Encore Software Ltd. Ncore Usa Inc S USA F I Sofex Ltd. FI Sofex LLC JV USA Financial Technologies (India) Ltd.
Financial Technologies Middle East DMCC
S UAE 100% 2006
Financial Technologies (India) Ltd.
Dubai Gold and Commodities Exchange DMCC
JV UAE 50% 2006
Firstsource Solutions Limited
Accounts Solutions Group, LLC S USA 100.00% 2006
Firstsource Solutions Limited
FirstRing Inc, USA ('FRUS') S USA 100% 2006
Firstsource Solutions Limited
MedPlans Partners S USA 100% 2006
Firstsource Solutions Limited
Firstsource Solutions S.A. S Argentina 100% 2006
Firstsource Solutions Limited
MedPlans 2000 Inc S USA 100.00% 2006
Firstsource Solutions Limited
Business Process Management, Inc S USA 100% 2006
Firstsource Solutions Limited
Pipal Research Corporation S USA 51% 2006
Firstsource Solutions Limited
Sherpa Business Solutions Inc S USA 100% 2006
Firstsource Solutions Limited
Firstsource Solutions USA Inc S USA 100% 2006
Firstsource Solutions Limited
Firstsource Solutions Limited S UK 100% 2006
Flextronics Software Systems Ltd.
HSS Japan KK S Japan 100% 2005
Flextronics Software Systems Ltd.
Tenet Software Limited S UK 100% 2005
Flextronics Software Systems Ltd.
Tenet Technologies Inc. S USA 100% 2005
Fortune Infotech Ltd. Fortune Infotech USA, Inc. S USA 2006 Four Soft Ltd. Four Soft LLC S USA 100% 2006 Four Soft Ltd. Four Soft Germany GmbH S Germany 100% 2006 Four Soft Ltd. Four Soft B.V., S Netherlands 100% 2006 Four Soft Ltd. Four Soft UK Limited S UK 100.00% 2006 Four Soft Ltd. Four Soft USA Inc. S USA 100% 2006

56
Name of Indian Parent Firm Name of Overseas Venture S / JV / AC*
Country of incorporation
%age of equity holding
Year of the data
Four Soft Ltd. Four Soft Singapore Pte Limited S Singapore 100% 2006 Four Soft Ltd. Four Soft NL B.V. S Netherlands 100% 2006 Four Soft Ltd. Four Soft Malaysia Sdn Bhd S Malaysia 100% 2006 G T L Ltd. International Global Tele-Systems
Limited S Mauritius 100% 2006
G T L Ltd. iGTL Solutions (Australia) Pty. Ltd. S Australia 100% 2006 G T L Ltd. iGTL Solutions (USA), Inc. S USA 100% 2006 G T L Ltd. IGTL Solutions Lanka (Pvt.) Ltd. S Sri Lanka 100% 2006 G T L Ltd. IGTL Solutions (Saudi Arabia)
Limited S UAE 90% 2006
G T L Ltd. IGTL Solutions (UK) Limited S UK 100% 2006 G T L Ltd. IGTL Solutions (s) Pte ltd. S Singapore 100% 2006 G T L Ltd. IGTL Solutions Mauritius Limited S Mauritius 100% 2006 G T L Ltd. IGTL Solutions (Germany) GmbH S Germany 100% 2006 G T L Ltd. IGTL Solutions Middle East FZ LLC S UAE 100% 2006 GAVS Information Services Private Limited
GAVS Information Services LLC S Oman 2006
GAVS Information Services Private Limited
GAVS Information Services Asia (Pte) Ltd.
S Singapore 2006
Genesys International Corpn. Ltd.
Genesys Enterprises Inc. S USA 100% 2006
Genesys International Corpn. Ltd.
Aerial Surveyor Limited S UK 100% 2006
Genesys International Corpn. Ltd.
Genesys International (UK) Limited S UK 100% 2006
Geodesic Information Systems Ltd.
Engage Solutions Ltd., S Hong Kong 100% 2006
Geodesic Information Systems Ltd.
Geodesic Information Systems AB, S Sweden 76% 2006
Geodesic Information Systems Ltd.
Geodesic Information Systems Inc., S USA 100% 2006
Geodesic Information Systems Ltd.
Geodesic Information Systems Pte. Ltd.,
S Singapore 100% 2006
Geometric Software Solutions Co. Ltd.
TekSoft, Inc. S USA 82% 2006
Geometric Software Solutions Co. Ltd.
Geometric Software Solutions Inc. S USA 100% 2006
Geometric Software Solutions Co. Ltd.
Geometric Software Solutions Pte. Ltd.
S Singapore 100% 2006
Global Edge Software Ltd. Global Edge Software Inc. S USA 2006 Globsyn Technologies Ltd.
Globsyn Technologies, Inc S USA 100% 2006
Goldstone Technologies Ltd.
Primesoft LLC S USA 100% 2005
Goldstone Technologies Ltd.
Staytop Systems Inc. S USA 100% 2005
H C L Technologies Ltd. HCL (Netherlands) BV S Netherlands 100% 2006 H C L Technologies Ltd. DSI Financial Solutions Pte. Limited [ S Singapore 100% 2006
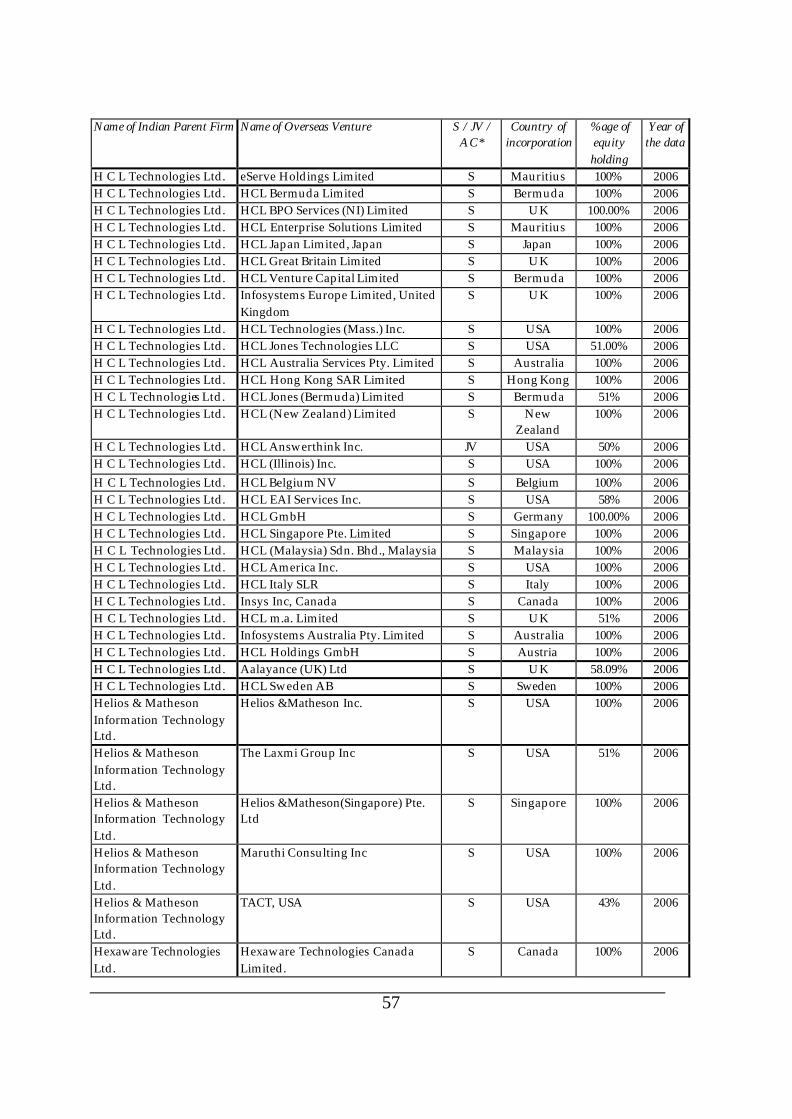
57
Name of Indian Parent Firm Name of Overseas Venture S / JV / AC*
Country of incorporation
%age of equity holding
Year of the data
H C L Technologies Ltd. eServe Holdings Limited S Mauritius 100% 2006 H C L Technologies Ltd. HCL Bermuda Limited S Bermuda 100% 2006 H C L Technologies Ltd. HCL BPO Services (NI) Limited S UK 100.00% 2006 H C L Technologies Ltd. HCL Enterprise Solutions Limited S Mauritius 100% 2006 H C L Technologies Ltd. HCL Japan Limited, Japan S Japan 100% 2006 H C L Technologies Ltd. HCL Great Britain Limited S UK 100% 2006 H C L Technologies Ltd. HCL Venture Capital Limited S Bermuda 100% 2006 H C L Technologies Ltd. Infosystems Europe Limited, United
Kingdom S UK 100% 2006
H C L Technologies Ltd. HCL Technologies (Mass.) Inc. S USA 100% 2006 H C L Technologies Ltd. HCL Jones Technologies LLC S USA 51.00% 2006 H C L Technologies Ltd. HCL Australia Services Pty. Limited S Australia 100% 2006 H C L Technologies Ltd. HCL Hong Kong SAR Limited S Hong Kong 100% 2006 H C L Technologies Ltd. HCL Jones (Bermuda) Limited S Bermuda 51% 2006 H C L Technologies Ltd. HCL (New Zealand) Limited S New
Zealand 100% 2006
H C L Technologies Ltd. HCL Answerthink Inc. JV USA 50% 2006 H C L Technologies Ltd. HCL (Illinois) Inc. S USA 100% 2006 H C L Technologies Ltd. HCL Belgium NV S Belgium 100% 2006 H C L Technologies Ltd. HCL EAI Services Inc. S USA 58% 2006 H C L Technologies Ltd. HCL GmbH S Germany 100.00% 2006 H C L Technologies Ltd. HCL Singapore Pte. Limited S Singapore 100% 2006 H C L Technologies Ltd. HCL (Malaysia) Sdn. Bhd., Malaysia S Malaysia 100% 2006 H C L Technologies Ltd. HCL America Inc. S USA 100% 2006 H C L Technologies Ltd. HCL Italy SLR S Italy 100% 2006 H C L Technologies Ltd. Insys Inc, Canada S Canada 100% 2006 H C L Technologies Ltd. HCL m.a. Limited S UK 51% 2006 H C L Technologies Ltd. Infosystems Australia Pty. Limited S Australia 100% 2006 H C L Technologies Ltd. HCL Holdings GmbH S Austria 100% 2006 H C L Technologies Ltd. Aalayance (UK) Ltd S UK 58.09% 2006 H C L Technologies Ltd. HCL Sweden AB S Sweden 100% 2006 Helios & Matheson Information Technology Ltd.
Helios &Matheson Inc. S USA 100% 2006
Helios & Matheson Information Technology Ltd.
The Laxmi Group Inc S USA 51% 2006
Helios & Matheson Information Technology Ltd.
Helios &Matheson(Singapore) Pte. Ltd
S Singapore 100% 2006
Helios & Matheson Information Technology Ltd.
Maruthi Consulting Inc S USA 100% 2006
Helios & Matheson Information Technology Ltd.
TACT, USA S USA 43% 2006
Hexaware Technologies Ltd.
Hexaware Technologies Canada Limited.
S Canada 100% 2006

58
Name of Indian Parent Firm Name of Overseas Venture S / JV / AC*
Country of incorporation
%age of equity holding
Year of the data
Hexaware Technologies Ltd.
Specsoft Consulting Inc. S USA 100% 2006
Hexaware Technologies Ltd.
Hexaware Technologies UK Ltd. S UK 100% 2006
Hexaware Technologies Ltd.
Hexaware Technologies Gmbh. S Germany 100% 2006
Hexaware Technologies Ltd.
Hexaware Technologies Asia Pacific Pte Limited.
S Singapore 100% 2006
Hexaware Technologies Ltd.
Hexaware Technologies Inc. S USA 100% 2006
Hinduja T M T Ltd. HTMT Europe Limited S UK 51.00% 2006 Hinduja T M T Ltd. Hinduja TMT France S France 51% 2006 Hinduja T M T Ltd. Source One HTMT Inc. S USA 100% 2006 Hinduja T M T Ltd. Customer Contact Centre Inc. S Philippines 100% 2006 Hinduja T M T Ltd. C-Cubed B.V. S Netherlands 100% 2006 Hinduja T M T Ltd. C-Cubed ( Antilles ) N.V. S Netherlands 100% 2006 Honeywell Technology Solutions Lab
HTS China S China 2006
Honeywell Technology Solutions Lab
HTS-Brno S Czech Republic
2006
I-Flex Solutions Ltd. i-flex solutions ltd. S UAE 40% 2005 I-Flex Solutions Ltd. i-flex solutions b.v. S Netherlands 100.00% 2005 I-Flex Solutions Ltd. SuperSolutions Corporation S USA 100% 2005 I-Flex Solutions Ltd. i-flex solutions inc. S USA 100% 2005 I-Flex Solutions Ltd. i-flex solutions pte ltd S Singapore 2005 I-Flex Solutions Ltd. ISP Internet Mauritius Company S Mauritius 100% 2005 I-Flex Solutions Ltd. i-flex America inc. S USA 100% 2005 I-Flex Solutions Ltd. Equinox Corporation, S USA 100% 2005 IBS Software Services (P) Ltd
IBS Software Services Pty Ltd S Australia 2006
IBS Software Services (P) Ltd
IBS Software Services (P) Ltd. S UAE 2006
IBS Software Services (P) Ltd
IBS Software Services Americas, Inc. S USA 2006
IBS Software Services (P) Ltd
Avient Solutions Ltd. S UK 2006
ISGN Technologies Ltd ISGN - CA S USA 2006 ISGN Technologies Ltd MortgageHub, Inc. S USA 2006 ISGN Technologies Ltd ISGN - UK S UK 2006 ISGN Technologies Ltd ISGN - PA S USA 2006 ISGN Technologies Ltd ISGN - Europe S Ireland 2006 ISGN Technologies Ltd ISGN - Singapore S Singapore 2006 ISGN Technologies Ltd ISGN - IA S USA 2006 ITC Infotech India Ltd ITC Infotech Denmark S Denmark 100% 2006 ITC Infotech India Ltd ITC Infotech Ltd, UK S UK 100% 2006 ITC Infotech India Ltd ITC Infotech (USA) Inc. S USA 100% 2006 ITTI Pvt. Ltd. ITTI MA Inc. S USA 2006 ITTI Pvt. Ltd. ITTI FZ. S UAE 2006

59
Name of Indian Parent Firm Name of Overseas Venture S / JV / AC*
Country of incorporation
%age of equity holding
Year of the data
Igate Global Solutions Ltd.
iGATE Global Solutions LLC (formerly eJiva LLC)
S USA 100% 2005
Igate Global Solutions Ltd.
Quintant Inc. S Canada 100% 2005
Igate Global Solutions Ltd.
iGATE Global Solutions (Wuxi) Co. Ltd.
S China 100% 2005
Igate Global Solutions Ltd.
iGATE Global Solutions Sdn. Bhd. S Malaysia 59% 2005
Igate Global Solutions Ltd.
Mascot Systems GmbH S Germany 59% 2005
Igate Global Solutions Ltd.
Symphoni Interactive LLC S USA 100% 2005
Igate Global Solutions Ltd.
Quintant Corporation S USA 59% 2005
Igate Global Solutions Ltd.
Quintant Ltd. S UK 100.00% 2005
Infinite Computer Solutions (India) Pvt Ltd
Infinite Computer Solutions Sdn. Bhd.
S Malaysia 2006
Infinite Computer Solutions (India) Pvt Ltd
Infinite Computer Solutions Inc. S USA 2006
Infinite Computer Solutions (India) Pvt Ltd
Infinite Computer Solutions, China S China 2006
Infinite Computer Solutions (India) Pvt Ltd
Infinite Computer Solutions Pte. Ltd S Singapore 2006
Infinite Computer Solutions (India) Pvt Ltd
Infinite Computer Solutions, Hong Kong
S Hong Kong 2006
Infinite Computer Solutions (India) Pvt Ltd
Infinite Computer Solutions Ltd. S UK 2006
Infomart (India) Pvt Ltd Infomart Technologies S USA 2006 Infomart (India) Pvt Ltd Infomart Asia Pacific Pte. Ltd S Singapore 2006 Infosys Technologies Ltd. Progeon S.R.O. S Czech
Republic 72% 2006
Infosys Technologies Ltd. Infosys Technologies (Australia), Pty. Limited
S Australia 100% 2006
Infosys Technologies Ltd. Infosys Technologies (Shanghai) Co. Limited
S China 100% 2006
Infosys Technologies Ltd. Infosys Consulting, Inc. S USA 100% 2006 Infotech Enterprises Ltd. Infotech Enterprises Benelux, B.V S Netherlands 100% 2006 Infotech Enterprises Ltd. Infotech Software Solutions Canada
Inc., S Canada 100% 2006
Infotech Enterprises Ltd. Vargis LLC S USA 100.00% 2006 Infotech Enterprises Ltd. Infotech Aerospace Services Inc. AC USA 49% 2006 Infotech Enterprises Ltd. Mapcentric Consulting Limited S UK 100% 2006 Infotech Enterprises Ltd. Infotech Enterprises America, Inc. S USA 100.00% 2006 Infotech Enterprises Ltd. Infotech Enterprises Europe Limited S UK 100% 2006 Infotech Enterprises Ltd. Infotech Enterprises GmBh. S Germany 100% 2006 Infovision Software Pvt. Ltd
Transcription South Inc. S USA 2006

60
Name of Indian Parent Firm Name of Overseas Venture S / JV / AC*
Country of incorporation
%age of equity holding
Year of the data
Infovision Software Pvt. Ltd
Choice Transcriptions Inc S USA 2006
Insoft.com Pvt Ltd Insoft The Netherlands S Netherlands 2006 Insoft.com Pvt Ltd Insoft USA S USA 2006 Insoft.com Pvt Ltd Insoft Nordic S Denmark 2006 Insoft.com Pvt Ltd Insoft Belgium S Belgium 2006 Insoft.com Pvt Ltd Insoft France S France 2006 Integra Software Services Private Limited
Integra Software Services Inc. S USA 2006
Integrated Hitech Ltd. Integrated Hitech (America) Corporation
S USA 2005
Integrated Hitech Ltd. Integrated Hitech Singapore Pte Ltd S Singapore 2005 Intergraph Consulting Pvt Ltd.
Intergraph Consulting Inc. S USA 2006
Intertec Communications Ltd.
De Two Forging P Ltd S USA 100% 2006
Intertec Communications Ltd.
Intertec America Inc. S USA 100% 2006
JK Technosoft Ltd. JK Technosoft Ltd. Ireland S Ireland 100% 2006 JK Technosoft Ltd. Proserve Consulting Inc. S USA 100% 2006 JK Technosoft Ltd. JK Technosoft (UK) Ltd. S UK 100% 2006 Java Softech Private Limited
Prima Java Softech Fz - LLC S UAE 2006
Java Softech Private Limited
JavaSoftech Singapore PTE Ltd S Singapore 2006
Java Softech Private Limited
Java Viernam Co. Limited S Vietnam 2006
Java Softech Private Limited
PT JavaSoftech Indonesia S Indonesia 2006
Java Softech Private Limited
JSPL Philippines Inc. S Philippines 2006
Jopasana Software & Systems Ltd.
Jopasana Software & Systems (USA), LLC.
S USA 2006
Jopasana Software & Systems Ltd.
Jopasana Software & Systems (UK) Ltd.
S UK 2006
K P I T Cummins Infosystems Ltd.
KPIT Infosystems Gmbh JV Germany 60% 2006
K P I T Cummins Infosystems Ltd.
SolvCentral.com Inc. S USA 90% 2006
K P I T Cummins Infosystems Ltd.
Panex Consulting Inc. S USA 100% 2006
K P I T Cummins Infosystems Ltd.
KPIT Systems LLC JV UAE 2006
K P I T Cummins Infosystems Ltd.
KPIT Infosystems Ltd. S UK 100% 2006
K P I T Cummins Infosystems Ltd.
KPIT Infosystems Inc S USA 100% 2006
Kale Consultants Ltd. Kale Softech, Inc. S USA 100% 2006
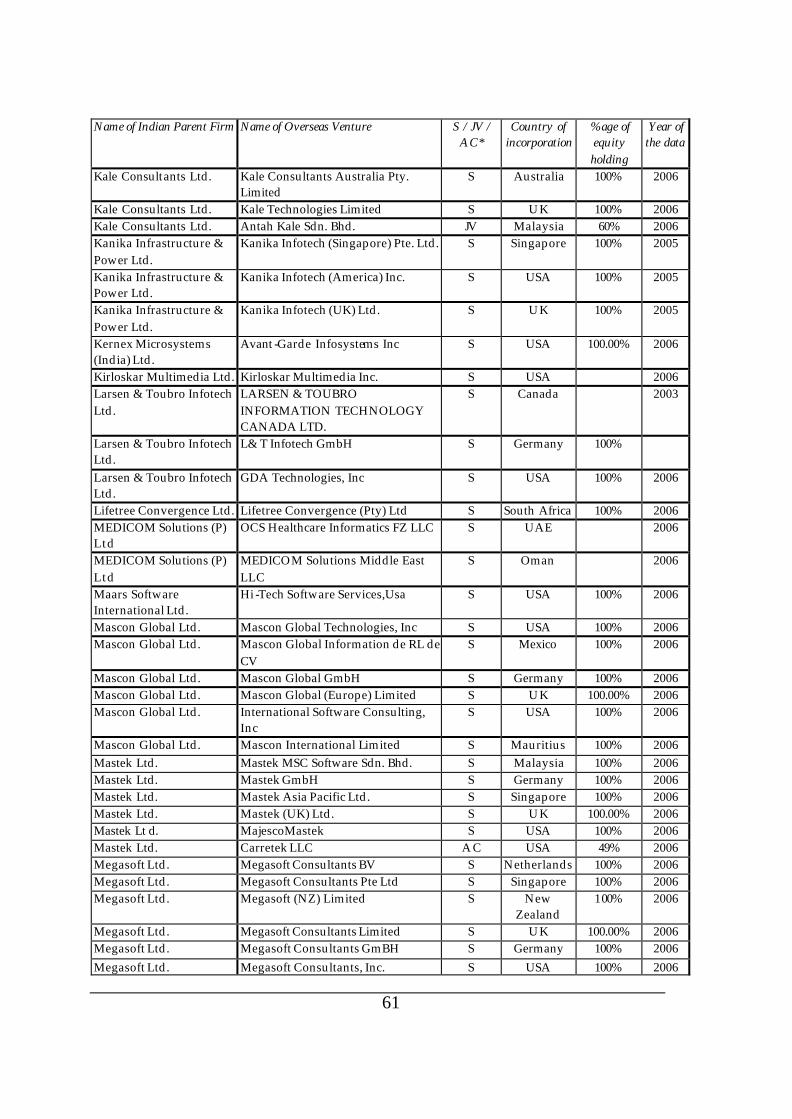
61
Name of Indian Parent Firm Name of Overseas Venture S / JV / AC*
Country of incorporation
%age of equity holding
Year of the data
Kale Consultants Ltd. Kale Consultants Australia Pty. Limited
S Australia 100% 2006
Kale Consultants Ltd. Kale Technologies Limited S UK 100% 2006 Kale Consultants Ltd. Antah Kale Sdn. Bhd. JV Malaysia 60% 2006 Kanika Infrastructure & Power Ltd.
Kanika Infotech (Singapore) Pte. Ltd. S Singapore 100% 2005
Kanika Infrastructure & Power Ltd.
Kanika Infotech (America) Inc. S USA 100% 2005
Kanika Infrastructure & Power Ltd.
Kanika Infotech (UK) Ltd. S UK 100% 2005
Kernex Microsystems (India) Ltd.
Avant -Garde Infosystems Inc S USA 100.00% 2006
Kirloskar Multimedia Ltd. Kirloskar Multimedia Inc. S USA 2006 Larsen & Toubro Infotech Ltd.
LARSEN & TOUBRO INFORMATION TECHNOLOGY CANADA LTD.
S Canada 2003
Larsen & Toubro Infotech Ltd.
L& T Infotech GmbH S Germany 100%
Larsen & Toubro Infotech Ltd.
GDA Technologies, Inc S USA 100% 2006
Lifetree Convergence Ltd. Lifetree Convergence (Pty) Ltd S South Africa 100% 2006 MEDICOM Solutions (P) Ltd
OCS Healthcare Informatics FZ LLC S UAE 2006
MEDICOM Solutions (P) Ltd
MEDICOM Solutions Middle East LLC
S Oman 2006
Maars Software International Ltd.
Hi -Tech Software Services,Usa S USA 100% 2006
Mascon Global Ltd. Mascon Global Technologies, Inc S USA 100% 2006 Mascon Global Ltd. Mascon Global Information de RL de
CV S Mexico 100% 2006
Mascon Global Ltd. Mascon Global GmbH S Germany 100% 2006 Mascon Global Ltd. Mascon Global (Europe) Limited S UK 100.00% 2006 Mascon Global Ltd. International Software Consulting,
Inc S USA 100% 2006
Mascon Global Ltd. Mascon International Limited S Mauritius 100% 2006 Mastek Ltd. Mastek MSC Software Sdn. Bhd. S Malaysia 100% 2006 Mastek Ltd. Mastek GmbH S Germany 100% 2006 Mastek Ltd. Mastek Asia Pacific Ltd. S Singapore 100% 2006 Mastek Ltd. Mastek (UK) Ltd. S UK 100.00% 2006 Mastek Lt d. MajescoMastek S USA 100% 2006 Mastek Ltd. Carretek LLC AC USA 49% 2006 Megasoft Ltd. Megasoft Consultants BV S Netherlands 100% 2006 Megasoft Ltd. Megasoft Consultants Pte Ltd S Singapore 100% 2006 Megasoft Ltd. Megasoft (NZ) Limited S New
Zealand 100% 2006
Megasoft Ltd. Megasoft Consultants Limited S UK 100.00% 2006 Megasoft Ltd. Megasoft Consultants GmBH S Germany 100% 2006 Megasoft Ltd. Megasoft Consultants, Inc. S USA 100% 2006

62
Name of Indian Parent Firm Name of Overseas Venture S / JV / AC*
Country of incorporation
%age of equity holding
Year of the data
Megasoft Ltd. Megasoft Australia Pty Ltd S Australia 100% 2006 Megasoft Ltd. Megasoft Consultants Sdn Bhd S Malaysia 100% 2006 Megasoft Ltd. Beam AG S Germany 64% 2006 Megasoft Ltd. Megasoft (HK) Limited S Hong Kong 100% 2006 Melstar Information Technologies Ltd.
Melstar Singapore Pte Ltd. S Singapore 100% 2006
Mel star Information Technologies Ltd.
Melstar UK Ltd. S UK 100% 2006
Melstar Information Technologies Ltd.
Melstar Inc. S USA 100% 2006
Melstar Information Technologies Ltd.
Linkhand Support Ltd. S UK 100% 2006
Melstar Information Technologies Ltd.
Melstar Deutschland GmbH S Germany 100% 2006
Melstar Information Technologies Ltd.
Melstar Ltd. S UK 100% 2006
Metalearn Services Pvt. Ltd.
Metalearn US LLC S USA 2006
Mindteck (India) Ltd. Mindteck Middle East SOC. S Bahrain 100% 2005 Mindteck (India) Ltd. Mindteck USA Inc. S USA 100.00% 2005 Mindteck (India) Ltd. Mindteck Software Malaysia SDN,
BHD. S Malaysia 100% 2005
Mistral Software Pvt. Ltd. Mistral Software Inc. S USA 2006 Mistral Software Pvt. Ltd. Mistral Software Europe S Germany 2006 Moschip Semiconductor Technology Ltd.
Moschip Semiconductor Technology, Usa
S USA 100% 2006
Mphasis Ltd. MsourcE Mauritius Inc., S Mauritius 100% 2006 Mphasis Ltd. Eldorado Computing Inc. S USA 100% 2006 Mphasis Ltd. MphasiS Europe BV S Netherlands 100% 2006 Mphasis Ltd. MphasiS Ireland Limited S Ireland 100% 2006 Mphasis Ltd. MphasiS (Shanghai) Software &
Services Company Limited S China 100% 2006
Mphasis Ltd. Princeton Consulting Limited S UK 100% 2006 Mphasis Ltd. MphasiS Australia Pty Ltd S Australia 100% 2006 Mphasis Ltd. MsourcE Holdings BV, S Netherlands 100% 2006 Mphasis Ltd. MbrokeR Inc. S USA 100% 2006 Mphasis Ltd. MphasiS UK Limited S UK 100% 2006 Mphasis Ltd. MphasiS Corporation S USA 100% 2006 Mphasis Ltd. BFL Software Asia Pacific Pte Ltd S Singapore 100% 2006 Mphasis Ltd. MphasiS Deutschland GmbH S Germany 91% 2006 Mphasis Ltd. MphasiS Pte Ltd S Singapore 100% 2006 N I I T Ltd. NIIT USA Inc. S USA 100% 2006 N I I T Ltd. NIIT Malaysia Sdn Bhd S Malaysia 100% 2006 N I I T Ltd. NIIT GC Ltd S Mauritius 100% 2006 N I I T Ltd. NIIT Middle East WLL S Bahrain 100% 2006 N I I T Ltd. PT NIIT Indonesia S Indonesia 100% 2006 N I I T Ltd. NIIT China (Shanghai) Limited S China 100% 2006 N I I T Ltd. NIIT Limited, UK S UK 100% 2006

63
Name of Indian Parent Firm Name of Overseas Venture S / JV / AC*
Country of incorporation
%age of equity holding
Year of the data
N I I T Ltd. PCEC NIIT Institute of Information Technology
S China 100% 2006
N I I T Ltd. NIIT Antilles NV, Netherlands Antilles
S Netherlands 100% 2006
N I I T Technologies Ltd. NIIT Technologies Gmbh, Osterreich S Austria 100% 2006 N I I T Technologies Ltd. NIIT Technologies Inc., USA S USA 100% 2006 N I I T Technologies Ltd. NIIT Technologies Ltd. S UK 100% 2006 N I I T Technologies Ltd. NIIT Thailand Limited S Thailand 100% 2006 N I I T Technologies Ltd. NIIT Smart Serve Limited, S UK 100% 2006 N I I T Technologies Ltd. NIIT Belgium NV S Belgium 99.96% 2006 N I I T Technologies Ltd. NIIT Benelux BV S Netherlands 100% 2006 N I I T Technologies Ltd. NIIT Technologies Co. Ltd. S Japan 100% 2006 N I I T Technologies Ltd. NIIT Asia Pacific Pty Limited S Australia 100% 2006 N I I T Technologies Ltd. NIIT Technologies AG, Schweiz S Switzerland 100% 2006 N I I T Technologies Ltd. NIIT Technologies AG, Germany S Germany 100% 2006 N I I T Technologies Ltd. NIIT Technologies Pte Ltd. S Singapore 100% 2006 Navayuga Infotech Pvt. Ltd.
NAVAYUGA MIDDLE EAST FZC S UAE 2006
Navayuga Infotech Pvt. Ltd.
NAVAYUGA INFOTECH LLC S USA 2006
Navayuga Infotech Pvt. Ltd.
NAVAYUGA EUROPE LIMITED S UK 2006
NeilSoft Limited Neilsoft Inc. S USA 2006 NeilSoft Limited Neilsoft Technologies Co. Ltd. S China 2006 NetEdge Computing Global Services Pvt Ltd
Neruby Consulting Services Ltd. S UK 2006
NetEdge Computing Global Services Pvt Ltd
ProSoft Technology Group, Inc. S USA 2006
Nettlinx Ltd. NETTLINX INC. S USA 100.00% 2006 N etwork Systems & Technologies (P) Ltd
NeST Canada Corporation S Canada 2006
Network Systems & Technologies (P) Ltd
NeST Technologies, Inc. S USA 2006
Network Systems & Technologies (P) Ltd
Ashling Microsystems Ltd. S Ireland 2006
Network Systems & Technologies (P) Ltd
Nihon NeST Corporation S Japan 2006
Network Systems & Technologies (P) Ltd
NeST Europe Ltd. S UK 2006
Network Systems & Technologies (P) Ltd
NeST Technologies MEA Fz Co S UAE 2006
Network Systems & Technologies (P) Ltd
NeST Solutions Pty Ltd S Australia 2006
Newgen Software Technologies Ltd.
Newgen Software Inc. S USA 2006
Nihar Info Global Ltd. Winquest Consultants, Inc S USA 100% 2006 Northgate Technologies Ltd.
Axill Inc, Usa S USA 100% 2006

64
Name of Indian Parent Firm Name of Overseas Venture S / JV / AC*
Country of incorporation
%age of equity holding
Year of the data
Northgate Technologies Ltd.
Glob e 7 HK Limited S Hong Kong 100% 2006
Northgate Technologies Ltd.
Northgate Holdings (S) Pte. Ltd. S Singapore 2006
Northgate Technologies Ltd.
Axill Europe Limited S UK 100% 2006
Northgate Technologies Ltd.
Globe7 Inc, Usa S USA 100% 2006
NuNet Technologies Private Limited
NuNet Technologies Pte Limited S Singapore 2006
NuNet Technologies Private Limited
NuNet Technologies Pty Ltd S Australia 2006
Nucleus Software Exports Ltd.
VirStra i - Technology (Singapore) Pte. Ltd.
S Singapore 100% 2006
Nucl eus Software Exports Ltd.
Nucleus Software Solutions Pte. Ltd. S Singapore 100% 2006
Nucleus Software Exports Ltd.
Nucleus Software Netherlands B.V. S Netherlands 100% 2006
Nucleus Software Exports Ltd.
Nucleus Software Japan Kabushiki Kaiga
S Japan 100% 2006
Nucleus Software Exports Ltd.
Nucleus Software (HK) Ltd. S Hong Kong 100% 2006
Nucleus Software Exports Ltd.
Nucleus Software Inc. S USA 100% 2006
Nucleus Software Exports Ltd.
Nucleus Software (Australia) Pty. Ltd.
S Australia 100% 2006
Ocimum Biosolutions Ltd. Isogen Biosolutions S Netherlands 2006 Ocimum Biosolutions Ltd. Ocimum Biosolutions Inc. S USA 2006 Olive Technology Limited Olive Technology, Inc. S USA 2006 Olive e-Business Pvt. Ltd. Olive e-Business S Canada 2006 Olive e-Business Pvt. Ltd. Olive Global Ltd. S UK 2006 Olive e-Business Pvt. Ltd. Digital Touch LLC S Oman 2006 Olive e-Business Pvt. Ltd. Digital Touch Ebusiness S UAE 2006 Ontrack Systems Ltd. Ontrack Systems Inc. S USA 100.00% 2006 Ontrack Systems Ltd. Ontrack Systems (UAE) Ltd. S UAE 100% 2006 Ontrack Systems Ltd. Ontrack Systems (UK) Ltd. S UK 100% 2006 Ontrack Systems Ltd. Ontrack Systems BV.,
NETHERLAND S Netherlands 51% 2006
Onward Technologies Ltd.
Onward Technologies Inc. S USA 100% 2006
Onward Technologies Ltd.
Onward Technologies GmbH S Germany 100% 2006
Orient Information Technology Ltd.
Information Technology People WLL-
S Bahrain 2005
Orient Information Technology Ltd.
Orient Information Technology Inc. S USA 100% 2005
Orient Information Technology Ltd.
Orient Information Technology FZ LLC
S UAE 100% 2005

65
Name of Indian Parent Firm Name of Overseas Venture S / JV / AC*
Country of incorporation
%age of equity holding
Year of the data
Orient Information Technology Ltd.
Orient Infotech Limited-UK S UK 100% 2005
Orient Information Technology Ltd.
Orient Information Technology GmbH-
S Germany 100% 2005
Panoramic Universal Ltd. Panoramic Ace Properties Inc. S USA 100% 2006 Panoramic Universal Ltd. Georgian Motel Corp. S USA 100% 2006 Panoramic Universal Ltd. Sai Properties Inc. S USA 100% 2006 Panoramic Universal Ltd. Sai Living Hudson Inc. S USA 100% 2006 Panoramic Univ ersal Ltd. Sai Motels Limited S New
Zealand 100% 2006
Paradyne Infotech Ltd. Dyne Techservices Inc S USA 100% 2006 Patni Computer Systems Ltd.
Patni Computer Systems (UK) Ltd. S UK 100% 2006
Patni Computer Systems Ltd.
Reference Inc. S USA 100% 2006
Patni Computer Systems Ltd.
Patni Computer Systems, Inc. S USA 100% 2006
Patni Computer Systems Ltd.
Cymbal Information Services (Thailand) Limited
S Thailand 100% 2006
Patni Computer Systems Ltd.
Patni Computer Systems GmbH S Germany 100% 2006
Patni Computer Systems Ltd.
Patni Telecom Solutions (UK) Ltd. S UK 100% 2006
Patni Computer Systems Ltd.
Patni Telecom Solutions Inc. S USA 100% 2006
Pentasoft Technologies Ltd.
Esoftcom Mauritius Ltd., S Mauritius 100% 2006
Persistent Systems Pvt. Ltd.
Persistent Systems Inc. S USA 2006
Polaris Software Lab Ltd. Polaris Software Lab S.A S Switzerland 100% 2006 Polaris Software Lab Ltd. Polaris Software Lab Canada Inc. S Canada 100% 2006 Polaris Software Lab Ltd. Polaris Software Lab Pte Ltd. S Singapore 100% 2006 Polaris Software Lab Ltd. Polaris Software Lab Ltd. S UK 100% 2006 Polaris Software Lab Ltd. Polaris Software Lab Ireland Ltd. S Ireland 100% 2006 Polaris Software Lab Ltd. Polaris Software Lab Japan KK S Japan 100% 2006 Polaris Software Lab Ltd. Polaris Software Pty Ltd. S Australia 100% 2006 Polaris Software Lab Ltd. Polaris Software Lab GmbH S Germany 100% 2006 Prologic First India Pvt Ltd.
Prologic First Dubai S UAE 2006
Prologic First India Pvt Ltd.
WISH Technologies S China 2006
Quadran t Infotech (India) Private Limited
Quadrant Technologies Inc. S USA 2006
Quintegra Solutions Ltd. Quintegra Solutions Limited, UK S UK 2006 Quintegra Solutions Ltd. Quintegra Solutions, Inc S USA 2006 Quintegra Solutions Ltd. Quintegra Solutions GmbH S Germany 100% 2006 Quintegra Solutions Ltd. Quintegra Solutions Pte. Ltd S Singapore 2006 Quintegra Solutions Ltd. Quintegra Solutions (M) Sdn. Bhd S Malaysia 2006

66
Name of Indian Parent Firm Name of Overseas Venture S / JV / AC*
Country of incorporation
%age of equity holding
Year of the data
R S Software (India) Ltd. RS Software UK Limited S UK 100.00% 2006 R S Software (India) Ltd. Responsive Solutions Inc S USA 100% 2006 R Systems International Ltd.
ECnet (Hong Kong) S Hong Kong 100.00% 2006
R Systems International Ltd.
ECnet Limited S Singapore 99% 2006
R Systems International Ltd.
ECnet Inc. S USA 100% 2006
R Systems International Ltd.
ECnet Systems (Thailand) Co. Ltd. S Thailand 100% 2006
R Systems International Ltd.
ECnet (Taiwan) Co. S China 100% 2006
R Systems International Ltd.
ECnet Korea Co, Ltd. S Korea 100% 2006
R Systems International Ltd.
ECnet Kabushiki Kaisha S Japan 100.00% 2006
R Systems International Ltd.
Indus Software Inc. S USA 100% 2006
R Systems International Ltd.
R Systems Inc. S USA 100% 2006
R Systems International Ltd.
ECnet (M) Sdn Bhd S Malaysia 100% 2006
R Systems International Ltd.
ECnet (Shanghai) Co. Ltd. S China 100% 2006
R Systems International Ltd.
R Systems (Singapore) Pte Limited S Singapore 100% 2006
Ram Informatics Ltd. Aravali Technologies Inc. S USA 2006 Ramco Systems Ltd. Ramco Systems Sdn Bhd., S Malaysia 100% 2006 Ramco Systems Ltd. Ramco Systems Pte Ltd., S Singapore 100% 2006 Ramco Systems Ltd. Ramco Systems Ltd., S Switzerland 100% 2006 Ramco Systems Ltd. Ramco Systems Corporation S USA 98% 2006 Ramco Systems Ltd. RSL Enterprise Solutions (Pty) Ltd., S South Africa 100% 2006 Rave Technologies (India) Pvt Ltd
Rave Technologies, USA S USA 2006
Rave Technologies (India) Pvt Ltd
Rave Technologies, Italy S Italy 2006
Rave Technologies (India) Pvt Ltd
Rave Technologies, UK S UK 2006
Rishabh Software Pvt. Ltd.
Sytemart LLC S USA 2006
Rishabh Software Pvt. Ltd.
Rishabh InfoServices Pvt.Ltd. S UK 2006
Rolta India Ltd. Rolta Deutschland Gmbh S Germany 100% 2006 Rolta India Ltd. Rolta Benelux B.V. S Netherlands 100% 2006 Rolta India Ltd. Rolta Middleeast S UAE 100% 2006 Rolta India Ltd. Rolta International, inc S USA 100% 2006 Rolta India Ltd. Rolta Saudi Arabia S Saudi
Arabia 75% 2006

67
Name of Indian Parent Firm Name of Overseas Venture S / JV / AC*
Country of incorporation
%age of equity holding
Year of the data
Rolta India Ltd. Rolta Canada Ltd S Canada 2006 Rolta India Ltd. Rolta UK Ltd S UK 100.00% 2006 S Q L Star International Ltd.
SQL Star International, Inc S USA 100% 2006
S Q L Star International Ltd.
International SQL Star Pte. Ltd, S Singapore 100% 2006
S Q L Star International Ltd.
SQL Star International Ltd, S UK 100.00% 2006
S S I Ltd. Telephoto International Pte Ltd S Singapore 100% 2006 Saksoft Ltd. Saksoft Pte Ltd S Singapore 100% 2005 Saksoft Ltd. Saksoft Gmbh S Germany 100% 2005 Saksoft Ltd. Saksoft Inc USA S USA 100% 2005 Sankhya Infotech Ltd. Sankhya SARL S France 100% 2006 Sasken Communication Technologies Ltd.
Sasken Communication Technologies Mexico, S.A.De C.V
S Mexico 100% 2006
Sasken Communication Technologies Ltd.
Sasken Communication Technology (Shanghai) Co. Ltd.,
S China 100% 2006
Satyam Computer Services Ltd.
Knowledge Dynamics USA Inc. S USA 98% 2006
Satyam Computer Services Ltd.
Satyam Technologies, Inc. S USA 100% 2006
Satyam Computer Services Ltd.
Info On Demand SDN BHD S Malaysia 100% 2006
Satyam Computer Services Ltd.
Satyam Computer Services (Shanghai) Co. Ltd.
S China 100% 2006
Satyam Computer Services Ltd.
Knowledge Dynamics Pte. Ltd S Singapore 100% 2006
Satyam Computer Services Ltd.
Citisoft Inc. S USA 100% 2006
Satyam Computer Services Ltd.
Citisoft Plc. S UK 75% 2006
Saven Technologies Ltd. Saven Technologies Inc., S USA 2006 Saven Technologies Ltd. Saven Technologies (UK) Ltd. S UK 100% 2006 Saven Technologies Ltd. Penrillian Limited, JV UK 2006 Serviont Global Solutions Ltd.
5by5 Networks Inc., S USA 2006
Serviont Global Solutions Ltd.
Servion Global Solutions Inc. S USA 2006
Serviont Global Solutions Ltd.
Servion Global Solutions Pte Ltd. S Singapore 2006
Silverline Technologies Ltd.
SKY Capital International Ltd., HK S Hong Kong 2005
Silverline Technologies Ltd.
eComServer Inc. USA S USA 100% 2005
Silverline Technologies Ltd.
Innovative BPO Solutions ltd., Canada.
S Canada 2005
Softsol India Ltd. SoftSol Resources Inc., S USA 100% 2006 Software Technology Software Technology Group S USA 100% 2006

68
Name of Indian Parent Firm Name of Overseas Venture S / JV / AC*
Country of incorporation
%age of equity holding
Year of the data
Group International Ltd. International Inc Software Technology Group International Ltd.
Software Technology Group, Inc. S USA 100% 2006
Sonata Software Ltd. Abisko Development Ltd S Cyprus 80.10% 2006 Sonata Software Ltd. Sonata Software GmbH S Germany 100% 2006 Sonata Software Ltd. Offshore Digital Services Inc. S USA 100% 2006 Spanco Telesystems & Solutions Ltd.
Spanco (S) Pte Ltd S Singapore 100% 2006
Spanco Telesystems & Solutions Ltd.
Global Respondez Inc. S USA 50% 2006
Srishti Software Pvt. Ltd. IntelliApp Solutions Ltd. S USA 2006 Subex Azure Ltd. Subex Technologies, Inc. S USA 100% 2006 SunTec Business Solutions Pvt. Ltd.
SunTec Business Solutions Ltd, UK S UK 2006
SunTec Business Solutions Pvt. Ltd.
SunTec Business Solutions, Singapore
S Singapore 2006
SunTec Business Solutions Pvt. Ltd.
SunTec Busi ness Solutions Inc S USA 2006
SunTec Business Solutions Pvt. Ltd.
SunTec Business Solutions GmbH S Germany 2006
Synergy Log-In Systems Ltd.
Synergy Log-in Systems Sdn.Bhd S Malaysia 100% 2006
Synergy Log-In Systems Ltd.
Synergy Information Technology Inc S USA 100.00% 2006
Synergy Log-In Systems Ltd.
Globsyn Technologies Inc S USA 100% 2006
Synergy Log-In Systems Ltd.
Sigmasoft Pte Ltd S Singapore 100% 2006
Tally ( India) Pvt. Ltd. Tally Solutions FZ LLC. S UAE 2006 Tally ( India) Pvt. Ltd. Tally Solutions International Pte Ltd. S Singapore 2006 Tanla Solutions Ltd. Tanla Solutions (UK) Limited S UK 100% 2006 Tanla Solutions Ltd. Mobizar Limited S UK 100% 2006 Tarang Software Technologies Pvt Ltd.
Tarang Software Technologies Pte. Ltd.
S Japan 2006
Tasaa Netcom Private Limited
Tasaa Netcom USA, Inc. S USA 2006
Tata Consultancy Services Ltd.
Financial Network Services (H.K.) Limited
S Hong Kong 100% 2006
Tata Consultancy Services Ltd.
Pentacrom Servicios S.A. S Chile 100% 2006
Tata Consultancy Services Ltd.
Tata Consultancy Services Sverige AB
S Sweden 100% 2006
Tata Consultancy Services Ltd.
Swedish Indian IT Resources AB S Sweden 100% 2006
Tata Consultancy Services Ltd.
Tata Consultancy Services Solution Center S.A.
S Uruguay 100% 2006
Tata Consultancy Services Ltd.
TCS Argentina S.A. S Argentina 99% 2006

69
Name of Indian Parent Firm Name of Overseas Venture S / JV / AC*
Country of incorporation
%age of equity holding
Year of the data
Tata Consultancy Services Ltd.
Financial Network Services (Africa) Pty Ltd
S South Africa 100% 2006
Tata Consultancy Services Ltd.
Tata Consultancy Services Do Brasil S.A.
S Brazil 51% 2006
Tata Consultancy Services Ltd.
Tata Consultancy Services Chile S.A. S Chile 100% 2006
Tata Consultancy Services Ltd.
CMC Americas Inc. S USA 100% 2006
Tata Consultancy Services Ltd.
Chong Wan Investments Limited S Hong Kong 100% 2006
Tata Consultancy Services Ltd.
Tata Consultancy Services Japan Limited
S Japan 100% 2006
Tata Consultancy Services Ltd.
Tata Infotech (Singapore) Pte. Limited
S Singapore 100% 2006
Tata Consultancy Services Ltd.
Tata Consultancy Services de Espana S.A.
S Spain 99% 2006
Tata Consultancy Services Ltd.
Exegenix Canada Inc. S Canada 100% 2006
Tata Consultancy Services Ltd.
Tata Consultancy Services Belgium S.A.
S Belgium 100% 2006
Tata Consultancy Services Ltd.
Sisteco S.A. S Chile 100% 2006
Tata Consultancy Services Ltd.
Financial Network Services (Facilities Management) Pty Limited
S Australia 100.00% 2006
Tata Consultancy Services Ltd.
Financial Network Services Pty Limited
S Australia 100% 2006
Tata Consultancy Services Ltd.
Tata Infotech Deutscheland GmbH S Germany 100% 2006
Tata Consultancy Services Ltd.
TCS FNS Pty. Limited S Australia 100% 2006
Tata Consultancy Services Ltd.
Conscripti (Pty) Ltd. AC South Africa 20% 2006
Tata Consultancy Services Ltd.
Exegenix Research Inc. AC Canada 50% 2006
Tata Consultancy Services Ltd.
Tata Consultancy Services Portugal Unipesoal Limitada
S Portugal 100% 2006
Tata Consultancy Services Ltd.
Tata Consultancy Services de Mexico S.A. De. C.V.
S Mexico 99% 2006
Tata Consultancy Services Ltd.
Pentacrom S.A. S Chile 100% 2006
Tata Consultancy Services Ltd.
Tata Consultancy Services Asia Pacific Pte Limited
S Singapore 100% 2006
Tata Consultancy Services Ltd.
PT Financial Network Services S Indonesia 100% 2006
Tata Consultancy Services Ltd.
Tata Consultancy Services Deutscheland GmbH
S Germany 100% 2006
Tata Consultancy Services Ltd.
Tata Consultancy Services Luxembourg S.A
S Luxembourg 99% 2006
Tata Consultancy Services Tata Consultancy Services Chile S Chile 99% 2006

70
Name of Indian Parent Firm Name of Overseas Venture S / JV / AC*
Country of incorporation
%age of equity holding
Year of the data
Ltd. Limitada Tata Consultancy Services Ltd.
Tata Consultancy Services France S.A.
S France 100% 2006
Tata Consultancy Services Ltd.
Tata America International Corporation
S USA 100% 2006
Tata Consultancy Services Ltd.
Financial Network Services Malaysia Sdn Bhd
S Malaysia 100% 2006
Tata Consultancy Ser vices Ltd.
Tata Information Technology (Shanghai) Company Limited
S China 100% 2006
Tata Consultancy Services Ltd.
Financial Network Services (Holdings) Pty Limited
S Australia 100% 2006
Tata Consultancy Services Ltd.
Tata Consultancy Services Netherland s B.V.
S Netherlands 100% 2006
Tata Consultancy Services Ltd.
Syscrom S.A. S Chile 100% 2006
Tata Consultancy Services Ltd.
Financial Network Services (Europe) plc
S UK 100% 2006
Tata Consultancy Services Ltd.
Tata Consultancy Services Malaysia SDN. BHD.
S Malaysia 100% 2006
Tata Consultancy Services Ltd.
Custodia De Documentos Intres Limitada
S Chile 100% 2006
Tata Consultancy Services Ltd.
TCS Iberoamerica S.A. S Uruguay 100% 2006
Tata Consultancy Services Ltd.
Diligenta Limited S UK 76% 2006
Tata Consultancy Services Ltd.
TCS Brazil S/C Limitada S Brazil 99.99% 2006
Tata Consultancy Services Ltd.
TCS Italia SRL S Italy 100% 2006
Tata Consultancy Services Ltd.
TCS Inversiones Chile Limitada S Chile 99.99% 2006
Tata Consultancy Services Ltd.
Comicrom S.A. S Chile 100% 2006
Tata Technologies Ltd. TATA TECHNOLOGIES U S A S USA 100% 2005 Tata Technologies Ltd. INCAT Engineering Solutions BV S Netherlands 2006 Tata Technologies Ltd. INCAT GmbH S Germany 2006 Tata Technologies Ltd. Tata Technologies (Thailand) Ltd S Thailand 2006 Tata Technologies Ltd. Tata Technologies Pte. Ltd S UK 2006 Tech Mahindra Ltd. Tech Mahindra (R & D Services) Pte.
Ltd S Singapore 100% 2006
Tech Mahindra Ltd. Tech Mahindra (Americas) Inc. S USA 100% 2006 Tech Mahindra Ltd. Tech Mahindra (Singapore) Pte. Ltd. S Singapore 100% 2006 Tech Mahindra Ltd. Tech Mahindra GmbH S Germany 100% 2006 Tech Mahindra Ltd. Tech Mahindra (R & D Services) Inc. S USA 100% 2006 Tech Mahindra Ltd. Tech Mahindra (Thailand) Limited S Thailand 100% 2006 Teledata Informatics Ltd. Alpha Soft Services Corporation S USA 100% 2006 Teledata Informatics Ltd. SBC Data Systems Limited, S Ireland 60% 2006 Teledata Informatics Ltd. Vanguard Technologies S USA 100.00% 2006

71
Name of Indian Parent Firm Name of Overseas Venture S / JV / AC*
Country of incorporation
%age of equity holding
Year of the data
Teledata Informatics Ltd. Transworld Information Systems Inc.,
S USA 53% 2006
Teledata Informatics Ltd. Nemera International Company Ltd; S Thailand 100% 2006 Teledata Informatics Ltd. Data Methods USA S USA 100% 2006 Teledata Informatics Ltd. Teledata Informatics (Bangkok ) Co.
Ltd S Thailand 100% 2006
Teledata Informatics Ltd. Insoft Systems Ltd; S Singapore 100% 2006 Teledata Informatics Ltd. Bitech International Pte Ltd., S Singapore 51% 2006 Teledata Informatics Ltd. Teledata Marine Systems Pte, Ltd, AC Singapore 26% 2006 Teledata Informatics Ltd. Hopway Limited S Hong Kong 100% 2006 Teledata Informatics Ltd. Picnic Marine Company Ltd; S Thailand 70% 2006 Teledata Informatics Ltd. Bitech International LLC, Dubai S UAE 100% 2006 Teledata Informatics Ltd. I-Max Communications Ltd, S UK 80% 2006 Teledata Informatics Ltd. Netsol Technologies Company.
Limited S Thailand 100% 2006
Thirdware Solution Ltd. Thirdware Ireland Limited S Ireland 2006 Thirdware Solution Ltd. Thirdware Solution Deutschland
GmbH S Germany 2006
Thirdware Solution Ltd. Thirdware Solution Inc. S USA 2006 Thirdware Solution Ltd. Thirdware Solution Europe Ltd. S UK 2006 Thirdware Solution Ltd. Thirdware Solution Singapore Pte. S Singapore 2006 Trident Info-Tech Corpn. Ltd.
Trident Info.Inc. S USA 2006
Trigent Software Ltd. Trigent Software, Inc. S USA 100.00% 2003 Trigyn Technologies Ltd. Trigyn Technologies Inc. S USA 100% 2006 Trigyn Technologies Ltd. eCapital Solutions (Bermuda)
Limited S Bermuda 100% 2006
Trigyn Technologies Ltd. eVector (Cayman) Limited S Cayman Island
100% 2006
Trigyn Technologies Ltd. Trigyn Technologies Limited, UK S UK 100.00% 2006 Trigyn Technologies Ltd. EVector Inc. S USA 100% 2006 Trigyn Technologies Ltd. eCapital Solutions (Mauritius)
Limited S Mauritius 100% 2006
Trigyn Technologies Ltd. Applisoft, Inc. S USA 100% 2006 Trigyn Technologies Ltd. EVector (UK) Limited S UK 100% 2006 Trigyn Technologies Ltd. Trigyn Technologies Europe Gmbh, S Germany 100% 2006 Tutis Technologies Ltd. Amex Information Technologies
GmbH S Germany 100% 2006
Tutis Technologies Ltd. Global Software Technologies Ltd. S UK 100% 2006 Twinstar Software Exports Ltd.
Twinstar Software Inc S USA 2006
Twinstar Software Exports Ltd.
Twinstar Software Exports Limited, UK
S UK 100% 2006
Unisoft Infotech Pvt Ltd. Unisoft Infotech Inc S USA 2006 Unisoft Infotech Pvt Ltd. Unisoft Infotech Pte Ltd S Singapore 2006 Unisoft Infotech Pvt Ltd. Unisoft Infotech Pty Ltd S Australia 2006 Unisoft Infotech Pvt Ltd. Unisoft Infotech Sdn Bhd S Malaysia 2006 Unitex Designs Ltd. Futur I Tech Inc Usa S USA 2006

72
Name of Indian Parent Firm Name of Overseas Venture S / JV / AC*
Country of incorporation
%age of equity holding
Year of the data
Usha Martin Infotech Ltd. Usha Communications Technology Limtied
S British Virgin Island
2006
ValueLabs (India) ValueLabs,Inc. S USA 2006 ValueLabs (India) ValueLabs Sdn. Bhd. S Malaysia 2006 Wipro Ltd. Enthink Inc. S USA 2006 Wipro Ltd. mPower Software Services Inc S USA 100% 2006 Wipro Ltd. Wipro Holdings (UK) Limited S UK 100% 2006 Wipro Ltd. New Logic Technologies SARL S France 100% 2006 Wipro Ltd. Wipro Shanghai Limited S China 100% 2006 Wipro Ltd. Wipro Holdings (Mauritius) Limited S Mauritius 100% 2006 Wipro Ltd. Wipro Technologies UK Limited S UK 100% 2006 Wipro Ltd. Wipro Inc S USA 100% 2006 Wipro Ltd. Spectramind Inc S USA 100.00% 2006 Wipro Ltd. Wipro Japan KK S Japan 100% 2006 Wipro Ltd. New Logic Technologies Inc S USA 100% 2006 Wipro Ltd. New Logic Technologies AG S Austria 100% 2006 Wipro Ltd. BVPENTE Beteiligungsverwaltung
GmbH S Austria 100% 2006
Wipro Ltd. New Logic Technologies SA S Switzerland 100% 2006 Zenith Infotech Ltd. Zenith Infotech (Singapore) Pte Ltd S Singapore 100% 2006 Zenith Software Ltd. Zenith Software (UK) Ltd. S UK 2006 Zenith Software Ltd. Zenith Software, Inc. S USA 2006 Zensar Technologies Ltd. Zensar Technologies(Shenzhen)
Limited S China 100% 2006
Zensar Technologies Ltd. Zensar Technologies, GmbH S Germany 100% 2006 Zensar Technologies Ltd. OBT Global Inc S USA 100% 2006 Zensar Technologies Ltd. Zensar Technologies (Singapore) Pte
Ltd. S Singapore 100% 2006
Zensar Technologies Ltd. Zensar Technologies Inc. S USA 100% 2006 Zensar Technologies Ltd. Zensar Technologies (UK) Ltd. S UK 100% 2006 softProjex Ltd. softProjex Inc. S USA 2006 softProjex Ltd. softProjex (UK) Ltd. S UK 2006 Note: * S: Subsidiary; JV: Joint Ventur e; AC: Associate Company

73