national influenza surveillance in the philippines from ... article open access national influenza...
TRANSCRIPT

RESEARCH ARTICLE Open Access
National Influenza Surveillance in thePhilippines from 2006 to 2012: seasonalityand circulating strainsMarilla G. Lucero1*, Marianette T. Inobaya1, Leilani T. Nillos1, Alvin G. Tan1, Vina Lea F. Arguelles1,Christine Joy C. Dureza1, Edelwisa S. Mercado1, Analisa N. Bautista1, Veronica L. Tallo1, Agnes V. Barrientos1,Tomas Rodriguez2 and Remigio M. Olveda1
Abstract
Background: The results of routine influenza surveillance in 13 regions in the Philippines from 2006 to 2012 arepresented, describing the annual seasonal epidemics of confirmed influenza virus infection, seasonal and alertthresholds, epidemic curve, and circulating influenza strains.
Methods: Retrospective analysis of Philippine influenza surveillance data from 2006 to 2012 was conductedto determine seasonality with the use of weekly influenza positivity rates and calculating epidemic curves andseasonal and alert thresholds using the World Health Organization (WHO) global epidemiological surveillancestandards for influenza.
Results: Increased weekly influenza positive rates were observed from June to November, coinciding with therainy season and school opening. Two or more peaks of influenza activity were observed with different dominantinfluenza types associated with each peak. A-H1N1, A-H3N2, and two types of B viruses circulated during theinfluenza season in varying proportions every year. Increased influenza activity for 2012 occurred 8 weeks late inweek 29, rather than the expected week of rise of cases in week 21 as depicted in the established averageepidemic curve and seasonal threshold. The intensity was severe going above the alert threshold but of shortduration. Southern Hemisphere vaccine strains matched circulating influenza virus for more surveillance yearsthan Northern Hemisphere vaccine strains.
Conclusions: Influenza seasonality in the Philippines is from June to November. The ideal time to administerSouthern Hemisphere influenza vaccine should be from April to May. With two lineages of influenza B circulatingannually, quadrivalent vaccine might have more impact on influenza control than trivalent vaccine. Establishmentof thresholds and average epidemic curve provide a tool for policy-makers to assess the intensity or severity ofthe current influenza epidemic even early in its course, to help plan more precisely resources necessary to controlthe outbreak. Influenza surveillance activities should be continued in the Philippines and funding for suchactivities should already be incorporated into the Philippine health budget.
Keywords: Influenza seasonality, Average epidemic curve, Seasonal threshold, Alert threshold, Circulatinginfluenza strains, Influenza vaccine strains
* Correspondence: [email protected] of Health, Research Institute for Tropical Medicine, FilinvestCorporate City, Alabang, Muntinlupa City, PhilippinesFull list of author information is available at the end of the article
© The Author(s). 2016 Open Access This article is distributed under the terms of the Creative Commons Attribution 4.0International License (http://creativecommons.org/licenses/by/4.0/), which permits unrestricted use, distribution, andreproduction in any medium, provided you give appropriate credit to the original author(s) and the source, provide a link tothe Creative Commons license, and indicate if changes were made. The Creative Commons Public Domain Dedication waiver(http://creativecommons.org/publicdomain/zero/1.0/) applies to the data made available in this article, unless otherwise stated.
Lucero et al. BMC Infectious Diseases (2016) 16:762 DOI 10.1186/s12879-016-2087-9
BackgroundThe World Health Organization recommends that sea-sonal and alert thresholds and average epidemic curvesbe established in countries as tools for early detection ofinfluenza outbreaks to help control annual influenza epi-demics [1, 2]. Seasonal influenza epidemics occur allover the world and cause substantial economic burdenthrough health care costs and absenteeism [3]. Althoughsurveillance is now routinely conducted in many coun-tries providing seasonality data and recommendationsfor timely vaccination [4, 5], not all countries have estab-lished influenza thresholds or epidemic curves. Developedcountries like the United States (US), United Kingdom(UK), most European countries, Australia, and NewZealand [6–10] are already using thresholds for influenzasurveillance calculated through various methods [11, 12].In contrast, few countries in Asia have established theirown thresholds and epidemic curves to determine if aninfluenza outbreak has started while concurrently moni-toring influenza activity [2]. The purpose of this article isto report the results of Philippine National InfluenzaSurveillance from 2006 to 2012, particularly on the estab-lishment of seasonal and alert thresholds, and averageepidemic curve according to methods in the WHO man-ual [1], define the seasonality of influenza, and describethe circulating influenza strains.
MethodsStudy designWe retrospectively analyzed weekly trends in influ-enza virus activity using Philippine National InfluenzaSurveillance data from 2006 to 2012.
Surveillance siteThe Philippines is located within the latitude and longi-tude of 13° 00′ N, 122° 00′ E [13]. The Philippines in-cludes 300,000 km2 of total land area and is divided intothree island groups: Luzon, Visayas, and Mindanao. It isadministratively divided into 17 regions. It has a tropicalclimate with the rainy season from June to Novemberand the dry season from December to May [14].
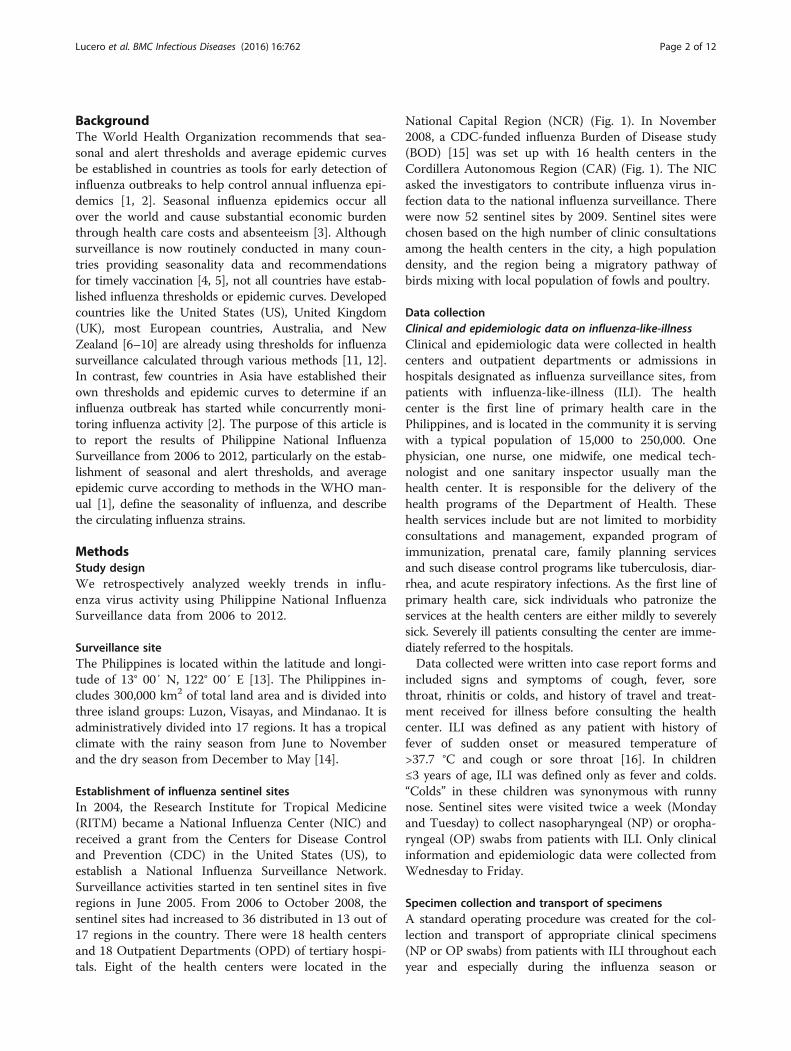
Establishment of influenza sentinel sitesIn 2004, the Research Institute for Tropical Medicine(RITM) became a National Influenza Center (NIC) andreceived a grant from the Centers for Disease Controland Prevention (CDC) in the United States (US), toestablish a National Influenza Surveillance Network.Surveillance activities started in ten sentinel sites in fiveregions in June 2005. From 2006 to October 2008, thesentinel sites had increased to 36 distributed in 13 out of17 regions in the country. There were 18 health centersand 18 Outpatient Departments (OPD) of tertiary hospi-tals. Eight of the health centers were located in the
National Capital Region (NCR) (Fig. 1). In November2008, a CDC-funded influenza Burden of Disease study(BOD) [15] was set up with 16 health centers in theCordillera Autonomous Region (CAR) (Fig. 1). The NICasked the investigators to contribute influenza virus in-fection data to the national influenza surveillance. Therewere now 52 sentinel sites by 2009. Sentinel sites werechosen based on the high number of clinic consultationsamong the health centers in the city, a high populationdensity, and the region being a migratory pathway ofbirds mixing with local population of fowls and poultry.
Data collectionClinical and epidemiologic data on influenza-like-illnessClinical and epidemiologic data were collected in healthcenters and outpatient departments or admissions inhospitals designated as influenza surveillance sites, frompatients with influenza-like-illness (ILI). The healthcenter is the first line of primary health care in thePhilippines, and is located in the community it is servingwith a typical population of 15,000 to 250,000. Onephysician, one nurse, one midwife, one medical tech-nologist and one sanitary inspector usually man thehealth center. It is responsible for the delivery of thehealth programs of the Department of Health. Thesehealth services include but are not limited to morbidityconsultations and management, expanded program ofimmunization, prenatal care, family planning servicesand such disease control programs like tuberculosis, diar-rhea, and acute respiratory infections. As the first line ofprimary health care, sick individuals who patronize theservices at the health centers are either mildly to severelysick. Severely ill patients consulting the center are imme-diately referred to the hospitals.Data collected were written into case report forms and
included signs and symptoms of cough, fever, sorethroat, rhinitis or colds, and history of travel and treat-ment received for illness before consulting the healthcenter. ILI was defined as any patient with history offever of sudden onset or measured temperature of>37.7 °C and cough or sore throat [16]. In children≤3 years of age, ILI was defined only as fever and colds.“Colds” in these children was synonymous with runnynose. Sentinel sites were visited twice a week (Mondayand Tuesday) to collect nasopharyngeal (NP) or oropha-ryngeal (OP) swabs from patients with ILI. Only clinicalinformation and epidemiologic data were collected fromWednesday to Friday.
Specimen collection and transport of specimensA standard operating procedure was created for the col-lection and transport of appropriate clinical specimens(NP or OP swabs) from patients with ILI throughout eachyear and especially during the influenza season or
Lucero et al. BMC Infectious Diseases (2016) 16:762 Page 2 of 12
suspected outbreaks. Influenza surveillance officers (ISO)employed by the project or trained personnel like mid-wives or nurses in the sentinel sites collected the NP/OPswabs. Swabs were transferred to virus transport medium(VTM) and stored in refrigerators before transporting toRITM in cold boxes with ice or frozen gel packs throughprivate couriers or by ISO within a day or two of specimencollection.
Identification of influenza virusFor the ILI sentinel surveillance clinical specimens (NPor OP swabs), we used viral culture to detect influenzavirus and other respiratory viruses (Parainfluenza 1,2,3,Respiratory Syncytial Virus (RSV), Herpes Simplex Virus(HSV), adenovirus, enterovirus and rhinovirus) usingstandard procedures recommended by the WHO GlobalInfluenza Surveillance Network (WHO-GISN) [17]. Fromviral culture, direct Immunofluorescence (IF) test of theImagen kit was used to identify influenza virus types Aand B. We performed Hemagglutination Inhibition (HAI)test using the WHO Influenza Reagent kit provided by theWHO Collaborating Centre for Reference and Researchon Influenza (WHO-CCRI), Melbourne, Australia forfurther influenza virus strain characterization. For the
confirmation of Parainfluenza 1, 2, 3, RSV, HSV andAdenovirus in viral culture, we used Immunofluorescencetest while Acid stability testing was used to identify en-terovirus and rhinovirus.The influenza BOD study used real-time reverse-
transcriptase polymerase chain reaction (RT-PCR) todetect Influenza A from clinical specimens (NP or OPswabs) using the US CDC method or the AppliedBiosystems Pandemic H1N1/09 Assay Set v. 2.0 (LifeTechnologies, CA, USA) [18]. Further subtyping wasdone to identify seasonal H1 and H3 subtypes using themethod of the Centre for Health Protection, Departmentof Health, Hong Kong SAR [19] and Pandemic H1N12009 subtype [18] for Influenza A positive samples.Conventional RT-PCR methodology was used to detectInfluenza B and RSV [20].
Data management and statistical analysisThe National Influenza Surveillance database containinginformation from CRFs that were initially encoded intoEPI-INFO software version 6.04 (public domain statis-tical software from CDC) was used to obtain data onweekly counts of ILI cases, ILI cases with and withoutspecimens, and those that were positive for influenza
Fig. 1 Map of the Philippines showing the sentinel sites (areas with numbers) participating in the national influenza surveillance network. (Themap was created using Epi Info Map of Epi Info 7)
Lucero et al. BMC Infectious Diseases (2016) 16:762 Page 3 of 12

and other viruses. Analysis was conducted using MS-Excel, STATA 10 (STATA Corporation, College Station,TX, USA), and R 2.15.0 software [21]. We calculated sea-sonal and alert thresholds, and epidemic curves usingboth counts (number of influenza positive cases) and pro-portions (percent positivity rates). We chose to presentthe results according to percent positivity rates per week.
Determination of influenza season and seasonal thresholdSeasonal threshold was defined as the level of influenzaactivity that signalled the start and end of the annual influ-enza season [1]. We defined influenza season as the periodin which weekly influenza positive rates were above theaverage influenza positivity rate for a particular surveil-lance year for at least three consecutive weeks. Weekly in-fluenza positivity rate was the per cent of ILI withspecimens per week, which were positive for influenzavirus. We noted the onset, end, and duration of the influ-enza season for each surveillance year. The onset of influ-enza season was the week in which positivity rate wasabove the weekly average positivity rate for that year andwhich continued for three consecutive weeks. The end ofthe influenza season was the first week in which the posi-tivity rate was below the average weekly positivity rate forthat year and which continued for three consecutiveweeks. Once the onset and end of the influenza seasonwas known, weekly data from this period were deletedcreating a pre- and post-influenza period. This was donefor surveillance years 2006, 2007, 2008, 2010, and 2011and the average weekly influenza positivity rate for allthese years was determined and considered as the seasonalthreshold. We excluded 2009 because a pandemic yearwould not reflect findings for a regular influenza season.
Determination of average epidemic curve and alertthresholdWe used the weekly influenza positivity rates for the cal-culation of average epidemic curve and alert thresholdutilizing the 2006, 2007, 2008, 2010 and 2011 data. Theaverage epidemic curve was the usual level of influenza
activity in and out of season and alert threshold was thelevel above which influenza activity was higher thanmost years [1]. Using Excel, the transmission peaks of5 years of data were aligned around the median week ofpeak occurrence during the influenza season for eachyear studied. Then we calculated the average weekly in-fluenza positivity rate for each week centered on the me-dian peak week of transmission. A 4-week runningaverage was used to smooth the curve that representedthe average epidemic curve. The standard deviation (SD)of the mean for each week was calculated to define ex-treme values, after which a curve was created for thosevalues based on 1.65 SD above the mean representingthe upper 90% confidence interval of the mean. Thisvalue was used as the alert threshold for severe seasons.After this procedure, weekly data for 2012 was plottedto the curve to determine how 2012 compared with theaverage epidemic curve, seasonal and alert thresholdscalculated from the previous 5 years of observation.
Comparison of circulating influenza viruses with Northernand Southern Hemisphere vaccine antigensComparison was done by simply matching the influenzaviruses by type, subtype and/or lineage (in the case of in-fluenza B) and by circulating strain for each surveillanceyear with the Northern (NH) and Southern Hemisphere(SH) vaccine antigens recommended for the influenzaseasons for the same surveillance year.
ResultsNumber of ILI cases enrolled from 2006 to 2011There were 8826 ILI cases enrolled in 2006. The numberssteadily increased through the course of surveillance andin 2011, 18,714 cases were enrolled. The highest numberof ILI case enrolled was during the 2009 pandemic. Thetotal number of ILI cases from 2006 to 2011 was 102,806.Mean specimen (NP or OP swabs) collection rate was55.3% (Range 45.2 to 67.5%). Majority (91%) of patientswith ILI who went to the sentinel sites were childrenunder 15 years of age (Table 1).
Table 1 Number and age distribution of ILI cases from 2006 to 2011, National Influenza Surveillance, Philippines
Age group 2006N (%)
2007N (%)
2008N (%)
2009N (%)
2010N (%)
2011N (%)
TotalN (%)
<6 months 624 (7.07) 944 (8.82) 2128 (9.74) 1732 (7.67) 1538 (7.64) 1623 (8.67) 8589 (8.35)
6–23 months 2525 (28.61) 3291 (30.74) 7156 (32.76) 6515 (28.86) 6064 (30.11) 5937 (31.72) 31488 (30.63)
2–4 years 2405 (27.25) 2846 (26.58) 5613 (25.70) 5511 (24.41) 5585 (27.73) 5390 (28.8) 27350 (26.6)
5–14 years 2393 (27.11) 2676 (24.99) 5175 (23.69) 6179 (27.37) 5258 (26.11) 4452 (23.79) 26133 (25.42)
15–49 years 757 (8.58) 746 (6.97) 1504 (6.89) 2269 (10.05) 1479 (7.34) 1110 (5.93) 7865 (7.65)
50+ years 89 (1.01) 113 (1.06) 246 (1.13) 313 (1.39) 198 (0.98) 200 (1.07) 1159 (1.13)
No data 33 (0.37) 91 (0.85) 22 (0.10) 56 (0.25) 18 (0.09) 2 (0.01) 222 (0.22)
Total 8826 10707 21844 22575 20140 18714 102806
Lucero et al. BMC Infectious Diseases (2016) 16:762 Page 4 of 12

Influenza seasonality and durationFigure 2 shows the number of influenza virus positiveILI cases per week, weekly influenza positivity rates, 4-week moving average, average weekly influenza positivityrates for each year, and influenza types and subtypes forsurveillance years 2006, 2007, 2008, 2009, 2010 and2011. Excluding 2009, the pandemic year, the highestweekly influenza positivity rate was seen in 2010 (35%).Influenza virus activity was observed all-year round butwith distinct weekly positivity rates above the averageweekly influenza positivity rate for a year startingbetween weeks 24 to 31 and ending during weeks 41 to52 (Table 2).Table 2 also shows the duration and peak weeks of the
influenza season. The onset of the influenza season wasnot very different for the years 2006 to 2010. The end ofinfluenza season however differed considerably betweenthe years resulting in variation in the duration of influ-enza season. The year 2010 was an unusually severe sea-son. This was also true for 2009 because this was thepandemic year. The median week of onset for the 5 yearsof surveillance, 2006 to 2011 (excluding 2009) was week25 and the median week of the end of influenza seasonwas week 44. The median duration of the influenzaseason was 21 weeks.We observed that within the influenza season de-
scribed above, there was more than one peak of in-creased proportion of influenza positive cases (Fig. 2). In2006, using the 4-week moving average, three peakswere seen. The first peak was higher than the otherpeaks. Dual peaks were clearly distinct for 2007, 2008and 2011. 2010 also had a minor second peak, whichcould only be detected by looking at the bar graph.Starting 2008 up to 2011, we observed minor peaks dur-ing the first 11 weeks of the year. However these werejust single or two consecutive weeks of increased weeklyinfluenza positive rates.
Seasonal and alert threshold, and epidemic curveFigure 3 shows the non-aligned and aligned transmissionpeaks of influenza activity from 5 years of surveillancedata.Figure 4 shows the plot of percent of cases for 2012
compared to the seasonal threshold (5%), average epi-demic curve and alert threshold. The first 2 weeks of2012 showed weekly influenza positivity rates whichwere higher than the alert threshold followed by weeklyinfluenza positivity rates that were lower than the sea-sonal threshold but only up to week 29 when influenzaseason started, 8 weeks after the expected week of riseof cases in week 21. The intensity was severe goingabove the average epidemic curve but of short duration.There was a sharp drop of weekly influenza positivityrates after week 30 lower than the alert threshold but
still above the seasonal threshold. Thereafter, a minorpeak was observed in week 35 conforming to the dualpeak pattern observed for the other years. The decreasein the percentage of weekly influenza positivity ratesbelow the seasonal threshold was sustained until week40 with another small peak occurring in week 46.Figure 5 Panel A shows that influenza A(H1) was the
dominant subtype in 2006, 2009, and 2011, influenza B in2008 and 2010, and A(H3) in 2007. In this panel, from2009 to 2011, the red H1N1 bar includes both seasonaland pandemic influenza. Panel B shows that the periodsor peaks of increased activity observed during an influenzaseason were each populated by distinctive influenzastrains, either a single dominant or co-circulating strains.Two influenza B lineages were found for all years except2009 although lineage of many influenza B strains couldnot be determined for this year.
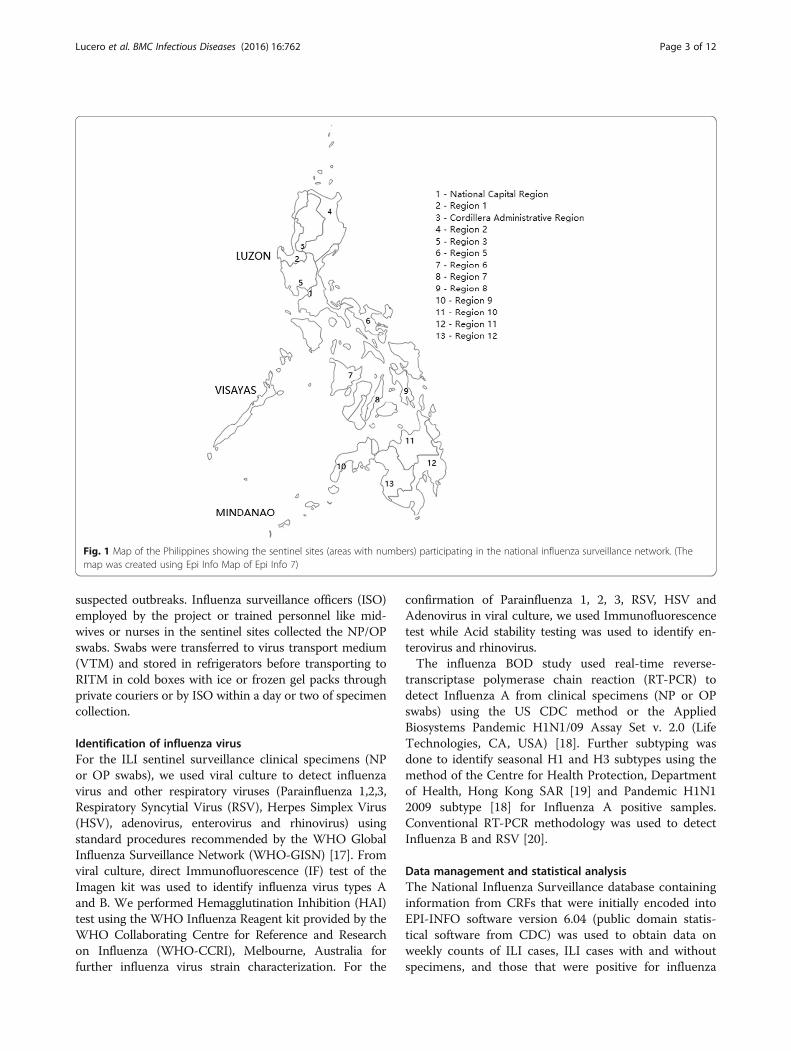
Comparison of circulating influenza strains and vaccinestrainsNinety-two percent of SH vaccine strains matched thatof the circulating strains in 2006, compared to only 69%for NH strains. This was also observed in 2008 (69%versus 15.12%), and 2010 (66% versus 37%). Percentmatched strains were lowest in 2009 (the pandemic year)with both SH and NH at 10.18% (Table 3).
DiscussionIn this study we have established the seasonal and alertthresholds, and average epidemic curve based on 5 yearsof influenza surveillance data using the method de-scribed in the WHO surveillance manual [1], describedthe seasonality of influenza in the Philippines, and pre-sented the influenza strains circulating in the countryfrom 2006 to 2011. While influenza viruses were de-tected year-round, increased activity was seen from Juneto November. We used the established thresholds andepidemic curve to assess the influenza season for 2012,its onset and end, and its severity in relation to thesethresholds. We also showed that intensity of influenzaactivity was different for each year, and that differentstrains of influenza viruses circulated every year. Ana-lysis of influenza activity using weekly detections showedmore than one peak of activity within the influenzaseason from June to November of each year. Differentdominant strains were associated with each peak.Two influenza B lineages circulated for five out of sixsurveillance years. Circulating strains matched theSouthern Hemisphere vaccine more often thanNorthern Hemisphere vaccine strains.The WHO surveillance manual has emphasized the
need for standardized tools to establish thresholds andepidemic curves that could be used to compare influ-enza season between countries, and to assess the severity
Lucero et al. BMC Infectious Diseases (2016) 16:762 Page 5 of 12

Fig. 2 Plot of confirmed weekly influenza positivity rates from 2006 to 2011, National Influenza Surveillance, Philippines
Lucero et al. BMC Infectious Diseases (2016) 16:762 Page 6 of 12

of the current season in a country to previous seasons ofthat same country. The method recommended in themanual [1] is relatively simple and uses software, whichis readily available, and can be implemented by NICs aslong as five or more years of influenza surveillance dataare available. Knowing the usual baseline level of diseaseand the seasonal pattern as a point of reference aids indetermining whether the current season is atypical bothin timing and relative severity compared to previousones. This information can help improve the accuracy ofclinical diagnosis, appropriate use of antiviral medica-tion, and the uptake and timeliness of seasonal influenzavaccines. As of this writing, we have not seen studies inSoutheast Asia reporting established alert and seasonalthresholds or epidemic curves using the WHO surveil-lance manual. Although there is one publication fromThailand wherein Early Aberration Reporting System(EARS) and Cumulative sum (CUSUM) were used,calculations were only for ILI [22]. Routine influenzaweekly monitoring reports from surveillance activities inAsia included ILI and influenza strains but comparedthese to historical influenza activity [23]. We have notbeen able to obtain information from countries in Asiaon the use of the WHO method or moving epidemicmethod (MEM) to establish influenza seasonal thresh-olds or epidemic curves. At this point in time, there arealready many countries in Asia, which have more than5 years of surveillance data. The WHO method forcalculating thresholds and epidemic curves could verywell be applied in these countries.The Philippines, Bangladesh, Cambodia, India, the Lao
People’s Democratic Republic, Thailand and Vietnamhave similar influenza seasonality [5]. Seasonality hasbeen associated not only with climatological but alsolatitudinal variations [5, 24–26]. Influenza virus infectionwas found throughout the year in these countries, butmore than 60% of influenza positivity rates were ob-served during the months of June to November [5]. Thecapital cities of these countries lie north of the equator(between 11.6 to 28.7° N). Thus, April to May is themost appropriate month for influenza vaccination for
the Philippines and countries with similar seasonality[5]. In areas in India north of 30° N however, there wasalso increased influenza activity during winter, so thata separate vaccination timing has been recommended[5, 24, 25] for this country. In contrast, tropical countriesin Asia below 11° N like Indonesia (Jakarta, 6.2° N),Malaysia (Kuala Lumpur, 3.2° N), and Singapore (1.3° N),influenza was found all throughout the year with no dis-tinct influenza season [5]. Specific analysis on the associ-ation between influenza activity and climate variables hasnot been done in this study but June to November coin-cides with the rainy season in the Philippines similar tothat of Cambodia [27], Myanmar [28], North Thailand[29], Bangladesh [5, 30], Lao [31], and some parts of IndiaSouth of Srinagar [24, 25]. Factors other than the rainyseason might also play a role for the increased influenzavirus activity starting the month of June in the Philippines.Schools open in June for all levels in the Philippines, sug-gesting the effect of crowding on influenza transmission.More than one peak of influenza activity was observed
during the surveillance years but these peaks wereconfined to the defined influenza season from June toNovember. The presence of the different dominant in-fluenza strains for each of the peaks may be through thefollowing mechanisms: virus interaction leading to inter-ference between viruses, break in transmission due toschool vacation, development of immunity to the dom-inant virus, or a combination of these factors. Goldsteinet al. [32] have noted that there was a negative associ-ation between strains’ incidences indicating that high in-fection rates with one strain can interfere with thetransmission of other strains. Raoult [33] has postulatedthat the dynamics of influenza virus subtypes againstthose of other subtypes and even other respiratory vi-ruses is complex and interference between these virusesmight impact on their transmissibility in humans. Schoolclosure has been associated with reduced transmission ofinfluenza virus because of decreased contact rate [34, 35].School vacation or semestral break occurs at around theend of October to the first week of November. We haveobserved that influenza activity decreases during this time
Table 2 Onset, end, duration and peak week of influenza season, 2006–2011. Influenza positivity rate by week and by month date
Year Onset week(Month date)
End week(Month date)
Duration Peak week(Month date)
2006 24 (Jun 11–17) 48 (Nov 26–Dec 2) 25 29 (Jul 16–Jul 22)
2007 25 (Jun 17–23) 43 (Oct 21–27) 19 27 (Jul 1–7)
2008 25 (Jun 15–21) 41 (Oct 5–11) 17 30 (Jul 20–26)
2010 24 (Jun 13–19) 44 (Oct 31–Nov 6) 21 33 (Aug 15–21)
2011 31 (Jul 31–Aug 6) 52 (Dec 25–31) 22 33 (Aug 14–20)
Median (week) 25 44 21 30
Range 24–31 41–52 17–25 27–33
Lucero et al. BMC Infectious Diseases (2016) 16:762 Page 7 of 12
of school disruption. A break in the transmission of thefirst peak dominant virus causes co-circulating influenzastrains to increase in activity leading to the developmentof a second peak. Increased transmission of the first dom-inant influenza strain may later lead to development ofsufficient immunity among the population, which in turn
will stop or decrease the spread of the virus. Consequentlyincreased activity of co-circulating strains [36, 37] occurs.The influenza strains circulating in the Philippines
from 2006 to 2011 frequently matched the Southern ra-ther than the Northern Hemisphere vaccine strains. Thevaccine currently used in the Philippines is the Southern
Table 3 Comparison of Northern and Southern Hemisphere vaccine strains with the circulating strains per year of observation(2006–2011)
Northern Hemisphere vaccine strains % MatchingCirculating strains
Southern Hemisphere vaccine strains % MatchingCirculating strains
2005–2006 2006
A/New Caledonia/20/99 (H1N1)-like 45 A/New Caledonia/20/99 (H1N1)-like 45
A/California/7/2004-(H3N2)-like a 20 A/California/7/2004-(H3N2)-likea 20
B/Shanghai/361/2002-like virus(YAMAGATA)
4 B/Malaysia/2506/2004-like(VICTORIA)
27
Total Matching 69 Total Matching 92aA/New York/55/2004(H3N2)-like virus was a circulating virus and was antigenically similar to A/California/7/2004-(H3N2)-like
2006–2007 2007
A/New Caledonia/20/99 (H1N1)-like 34 A/New Caledonia/20/99 (H1N1)-like 34
A/Wisconsin/67/2005 (H3N2)-likea 3 A/Wisconsin/67/2005 (H3N2)-likea 3
B/Malaysia/2506/2004-like 2 B/Malaysia/2506/2004-like 2
Total matching 39 Total matching 39
2007–2008 2008
A/Solomon Islands/3/2006 (H1N1) like 0 A/Solomon Islands/3/2006 (H1N1) like 0
A/Wisconsin/67/2005 (H3N2)-like 0.12 A/Brisbane/10/2007 (H3N2)-likea 14
B/Malaysia/2506/2004-like (VICTORIA lineage) 15 B/Florida/4/2006-like (YAMAGATA)b 55
Total matching 15.12 Total matching 69aA/Brisbane/59/2007(H1N1)-like virus (one of the H3N2 circulating strains) is not antigenically similar to A/Solomon Islands/3/2006 (H1N1)-like virus;bB/Shanghai Yamagata lineage (circulating strain) is antigenically similar to B/Florida/4/2006-like virus
2008–2009 2009
A/Brisbane/59/2007 (H1N1)-likea 1 A/Brisbane/59/2007 (H1N1)-likea 1
A/Brisbane/10/2007 (H3N2)-like 9 A/Brisbane/10/2007 (H3N2)-like 9
B/Florida/4/2006-like 0.18 B/Florida/4/2006-like 0.18
Total Matching 10.18 Total Matching 10.18aA(H1N1) pdm09 was the H1N1 circulating virus for 2009
2009–2010 2010
A/Brisbane/59/2007 (H1N1)-like 0 A/California/7/2009 (H1N1)-likea 29
A/Brisbane/10/2007 (H3N2)-like 0 A/Perth/16/2009 (H3N2)-like 0
B/Brisbane/60/2008-like virus 37 B/Brisbane/60/2008-like 37
Total Matching 37 Total Matching 66aA/California/7/2009 (H1N1)-like is antigenically similar to A(H1N1) pdm09 which is a circulating virus
2010 - 2011 2011
A/California/7/2009 (H1N1)-like 53 A/California/7/2009 (H1N1)-like 53
A/Perth/16/2009 (H3N2)-like 4 A/Perth/16/2009 (H3N2)-like 4
B/Brisbane/60/2008-likea 6 B/Brisbane/60/2008-like 6
Total Matching 63 Total Matching 63aB/Malaysia/2506/2004-like (Victoria lineage) another circulating strain is antigenically similar to B/Brisbane/60/2008-like
Lucero et al. BMC Infectious Diseases (2016) 16:762 Page 8 of 12

Hemisphere vaccine. Influenza B strains both of theYamagata and the Victoria lineages were found duringthe years of surveillance. With these findings, the appro-priate timing of vaccination should be from April toMay, the current choice of Southern Hemisphere influ-enza vaccine should be continued, and most importantly,the vaccine should contain two influenza B lineages.Therefore, quadrivalent rather than trivalent vaccineswould be a better choice.There are several limitations to this study. The first limi-
tation is that we used collated data from all sentinel sites toanalyze seasonality. Sixty-four percent of influenza positive
cases came from Luzon where Manila is located, 15% fromthe Visayas islands, and 21% from Mindanao. Since major-ity of the cases came from the Luzon islands, the resultsmay be representative for only the north of the Philippines.The actual latitudinal location of the country extends from5 to 20° N. Mindanao islands are situated below 9.7° N upto 5° N. The second limitation is that we were not able tocompare the WHO method to other analytic methods. Thethird limitation is that data from this study mostly camefrom the pediatric age group (<15 years of age). There werevery few adult ILI consultations probably because adultsare able to handle ILI much better than children. The
Fig. 3 Weekly influenza positivity rates with transmission peaks of influenza activity aligned and not aligned
Fig. 4 Plot of average epidemic curve, alert and seasonal thresholds and weekly influenza positivity rates for year 2012, National InfluenzaSurveillance, Philippines
Lucero et al. BMC Infectious Diseases (2016) 16:762 Page 9 of 12

fourth limitation is that we could only match vaccine andcirculating strains through names of the strains detectedand not by genomic sequencing or antigenic testing. Al-though the Philippine National Surveillance followed theCDC definition for ILI, the definition of ILI was differentfrom other countries and this may be considered a fifthlimitation. Despite these limitations, this study has given avaluable insight into the measurement of seasonal and alertthresholds, and epidemic curves that will help DOH influ-enza program managers in the management of annual in-fluenza epidemics in the country.
ConclusionsAnalysis of surveillance data from 2006 to 2012 has pro-vided information about seasonal thresholds, epidemiccurves, and circulating strains to guide health personnelin the control of influenza virus infection. Although in-fluenza virus circulated throughout the year, a distinctseasonality was observed from June to November. Theideal time therefore to administer Southern Hemisphereinfluenza vaccines is from April to May. Quadrivalentvaccine might have more impact on influenza control
than trivalent vaccine. Policy-makers are now capable ofassessing the intensity or severity of the current influ-enza epidemic even early in its course, and plan moreprecisely resources necessary to control the outbreak. In-fluenza surveillance activities should be continued in thePhilippines and funding for such activities shouldalready be incorporated into the Philippine healthbudget. The results of seasonality patterns will be of im-mense help in the analysis of future studies on excessmortality during influenza seasons in the Philippines.Continuation of surveillance activities is needed not onlyto obtain data on circulating strains but also to recalcu-late the thresholds and epidemic curves as influenzasurveillance continues. More sentinel sites should beadded in the Mindanao islands. If possible, a separateanalysis for seasonality is conducted for the Mindanaoarea. Further research should be conducted on theassociation of meteorological and other factors on sea-sonality of influenza virus infection. Genomic sequen-cing and antigenic testing of Philippine influenza virusisolates should be conducted to determine more accur-ately matching of vaccine and circulating strains.
Fig. 5 Panel a: Percentage of influenza subtypes from 2006 to 2011, National Influenza Surveillance, Philippines, Panel b: Circulating influenzastrains from 2006 to 2011, National Influenza Surveillance, Philippines
Lucero et al. BMC Infectious Diseases (2016) 16:762 Page 10 of 12

Additional file
Additional file 1: Data on influenza positivity rates from 2006 to 2011,National Influenza Surveillance Philippines and computation of averageepidemic curve and alert threshold. (XLSX 52 kb)
AbbreviationsBOD: Burden of disease; CDC: Centers for Disease Control and Prevention;CRF: Case report form; CUSUM: Cumulative sum; DMU: Data managementunit; DOH: Department of Health; EARS: Early aberration reporting system;HAI: Hemagglutination inhibition; HSV: Herpes simplex virus; ILI: Influenza-like-illness; ISO: Influenza surveillance officer; MEM: Moving epidemic method;NEC: National Epidemiology Center; NH: Northern hemisphere; NIC: NationalInfluenza Center; NP: Nasopharyngeal; OP: Oropharyngeal; RITM: ResearchInstitute for Tropical Medicine; RITM-IRB: Research Institute for TropicalMedicine-Institutional Review Board; RSV: Respiratory syncytial virus; RT-PCR: Real-time reverse-transcriptase polymerase chain reaction; SD: Standarddeviation; SH: Southern hemisphere; UK: United Kingdom; US: United States;VTM: Virus transport medium; WHO: World Health Organization; WHO-CCRRI: WHO Collaborating Centre for Reference and Research on Influenza;WHO-GISN: WHO Global Influenza Surveillance Network
AcknowledgementsDr. Eric Tayag, Director of the National Epidemiology Center (NEC)-DOH,Regional Directors of the Center for Health Development and Head of theRegional Epidemiology Surveillance Units in Regions I, II, III, V, VI, VII, IX, X, XI,XII and CAR, Chief of Hospitals, Municipal Health Officers, health centerphysicians, nurses, and other health workers in the sentinel sites, theInfluenza Surveillance Officers (ISOs) in the sentinel sites, the staff of the DataManagement Unit (DMU) of RITM. Acknowledgement is also given to Dr.Anthony Mounts of CDC for the initial discussion on the WHO method ofcalculating thresholds and epidemic curves using the first version of theWHO manual [38]. We acknowledge the contribution of the RITM-Tohokuteam for allowing us to use the data collected in the BOD study.
FundingFunding for the national influenza surveillance as well as the BOD studyconducted by the RITM-Tohoku University collaboration came from the Centersfor Disease Control and Prevention, Atlanta, Georgia, USA. The NationalInfluenza Surveillance of the DOH conducted the surveillance accordingto a protocol submitted to the funding agency. The funding agency(CDC) did not participate in the design of the study and collection, analysis, andinterpretation of data except for help by one of the authors in the comparisonor matching of the vaccine strains circulating in the country and the strainsavailable in the Southern and Northern Hemisphere vaccine.
Availability of data and materialsThe dataset supporting the conclusions of this article comes from thePhilippine National Influenza Surveillance dataset (2006 to 2012) which includeddata from the Influenza BOD study conducted in Baguio City by the RITM-Tohoku University starting November 2008. As such, the authors do not ownthe dataset and are unable to share the data to the public. However, we aresharing the excel file which we used to calculate the thresholds and epidemiccurve (Additional file 1).
Authors’ contributionsMGL helped in the revisions of the concept and design of the surveillancestarting 2007 to 2012 leading to changes in the acquisition of data; wrotethe manuscript, analyzed and interpreted the data; gave final approval of theversion to be published and agreed to be accountable for all aspects of thework. MTI, AGT, CCD, VLT, AVB, RMO, ESM, VFA, and ANB helped in therevisions of the concept and design of the surveillance starting 2007 to 2012leading to changes in the acquisition of data; analyzed data; criticallyappraised the manuscript; and gave final approval of the version to bepublished and agreed to be accountable for all aspects of the work. LTNhelped in the analysis and interpretation of results particularly in the calculationof thresholds and epidemic curves, and analysis of circulating strains; wrotesome parts of the manuscript and critically appraised and proof-read the draftmanuscript; gave final approval of the version to be published and agreed tobe accountable for all aspects of the work. TR helped in the interpretation of
the matching of vaccine and circulating strains; critically appraised themanuscript; and gave final approval of the version to be published andagreed to be accountable for all aspects of the work.
Competing interestsThe authors declare that they have no competing interests.
Consent for publicationNot applicable.
Ethics approval and consent to participateThe RITM Institutional Review Board (RITM-IRB) approved the protocol forinfluenza surveillance. Approval from RITM-IRB also included use of data forresearch purposes. Patients consented to be included in the surveillanceactivity. Sample collection was not part of standard care.
Author details1Department of Health, Research Institute for Tropical Medicine, FilinvestCorporate City, Alabang, Muntinlupa City, Philippines. 2Centers for DiseaseControl and Prevention, Atlanta, GA, USA.
Received: 9 February 2016 Accepted: 1 December 2016
References1. World Health Organization. Global epidemiological surveillance standards
for influenza. 2014. http://www.who.int/influenza/resources/documents/WHO_Epidemiological_Influenza_Surveillance_Standards_2014.pdf?ua=1.Accessed 15 Apr 2014.
2. Tay EL, Grant K, Kirk M, Mounts A, Kelly H. Exploring a proposed WHOmethod to determine thresholds for seasonal influenza surveillance. PLoSOne. 2013;8(10):e77244.
3. World Health Organization. Influenza (Seasonal) Fact sheet November 2016. 2016.http://www.who.int/mediacentre/factsheets/fs211/en/. Accessed 22 Nov 2016.
4. Cox N. Influenza seasonality: timing and formulation of vaccines. Bull WorldHealth Organ. 2014;92(5):311.
5. Saha S, Chadha M, Mamun AA, Rahman M, Sturm-Ramirez K, ChittaganpitchM, et al. Influenza seasonality and vaccination timing in tropical andsubtropical areas of southern and south-eastern Asia. Bull World HealthOrgan. 2014;92(5):318–30.
6. Fluview. 2014–2015 Influenza Season Week 9 ending March 7, 2015. 2015.http://www.cdc.gov/flu/weekly/pdf/External_F1509.pdf. Accessed 20 Mar 2015.
7. Public Health England. Surveillance of influenza and other respiratoryviruses in the United Kingdom: Winter 2013/14. 2014. https://www.gov.uk/government/uploads/system/uploads/attachment_data/file/325203/Flu_annual_report_June_2014.pdf. Accessed 03 Feb 2015.
8. European Centre for Disease Prevention and Control (EDCD). Surveillancereport. Influenza in Europe: Season 2011–2012. 2012. http://ecdc.europa.eu/en/publications/Publications/Influenza-Europe-2011-2012-surveillance-report.pdf. Accessed 08 Sept 2015.
9. Australian Government Department of Health. Australian InfluenzaSurveillance Report 20 June to 3 July 2015. 2015. http://www.health.gov.au/internet/main/publishing.nsf/Content/1AC8DFF3C7950531CA257E7E001868A7/$File/Australian-Influenza-Surveillance-Report.pdf. Accessed 08 Sept 2015.
10. Public Health Surveillance. Influenza weekly update 2014/39: 22–28September 2014. 2014. https://surv.esr.cri.nz/PDF_surveillance/Virology/FluWeekRpt/2014/FluWeekRpt201439.pdf . Accessed 03 Feb 2015.
11. Vega T, Lozano JE, Meerhoff T, Snacken R, Mott J, Ortiz de Lejarazu R, NunesB. Influenza surveillance in Europe: establishing epidemic thresholds by themoving epidemic method. Influenza Other Respir Viruses. 2013;7(4):546–58.
12. Hutwagner L, Browne T, Seeman GM, Fleischauer AT. Comparing aberrationdetection methods with simulated data. Emerg Infect Dis. 2005;11(2):314–6.
13. Philippines Latitude and Longitude Map. Map of the World. http://www.mapsofworld.com/lat_long/philippines-lat-long.html. Accessed 09 Sept 2015.
14. Mildenstein T, Stier SC. The Philippines (Modern World Nations).Philadelphia: Chelsea House Pub; 2004.
15. Tallo VL, Kamigaki T, Tan AG, Pamaran RR, Alday PP, Mercado ES, et al.Estimating influenza outpatients’ and inpatients’ incidences from 2009 to2011 in a tropical urban setting in the Philippines. Influenza Other RespirViruses. 2014;8(2):159–68.
Lucero et al. BMC Infectious Diseases (2016) 16:762 Page 11 of 12

16. Brammer L, Bresee J, Smith N, Klimov A, Cox N. Influenza. In: Roush SW,McIntyre, Baldy LM, editors. Manual for the Surveillance of Vaccine-Preventable Diseases. 4th ed. Atlanta: Centers for Disease Control andPrevention; 2008. p. 6–4.
17. World Health Organization. WHO Global Influenza Surveillance NetworkManual for the laboratory diagnosis and virological surveillance of influenza.2011. http://apps.who.int/iris/bitstream/10665/44518/1/9789241548090_eng.pdf. Accessed 13 Sept 2013.
18. World Health Organization. CDC protocol of realtime RTPCR for influenzaA(H1N1). 2009. http://www.who.int/csr/resources/publications/swineflu/CDCrealtimeRTPCRprotocol_20090428.pdf. Accessed 10 Nov 2014.
19. Cheng PKC, Wong KKY, Mak GC, Wong AH, Ng AYY, Chow SYK, et al.Performance of laboratory diagnostics for the detection of influenzaA(H1N1)v virus as correlated with the time after symptom onset and viralload. J Clin Virol. 2010;47(2):182-5.
20. Bellau-Pujol S, Vabret A, Legrand L, Dina J, Gouarin S, Petitjean-Lecherbonnier J,et al. Development of three multiplex RT-PCR assays for the detection of 12respiratory RNA viruses. J Virol Methods. 2005;126(1–2):53–63.
21. R Core Team. R: A language and environment for statistical computing. Vienna:R Foundation for Statistical Computing; 2013. http://www.r-project.org.
22. Makaroon J, Pittayawonganon C, Gross DK, McMorrow M. An Evaluation ofInfluenza-like Illness (ILI) Epidemic Alert Thresholds in Two Provinces ofThailand, 2007–2010. OSIR. 2013;6(1):13–8.
23. Flu Express. Local Situation of Influenza Activity (as of May 13, 2015). 2015.http://www.chp.gov.hk/files/pdf/fluexpress_web_week19_14_5_2015_eng.pdf . Accessed 17 May 2015.
24. Koul PA, Broor S, Saha S, Barnes J, Smith C, Shaw M, et al. Differences ininfluenza seasonality by latitude, northern India. Emerg Infect Dis. 2014;20(10):1723–6.
25. Chadha MS, Potdar VA, Saha S, Koul PA, Broor S, Dar L, et al. Dynamics ofinfluenza seasonality at sub-regional levels in India and implications forvaccination timing. PLoS One. 2015;10(5):e0124122.
26. Yu H, Alonso WJ, Feng L, Tan Y, Shu Y, Yang W, Viboud C. Characterizationof regional influenza seasonality patterns in China and implications forvaccination strategies: spatio-temporal modeling of surveillance data. PLoSMed. 2013;10(11):e1001552.
27. Mardy S, Ly S, Heng S, Vong S, Huch C, Nora C, et al. Influenza activity inCambodia during 2006–2008. BMC Infect Dis. 2009;9:168.
28. Dapat C, Saito R, Kyaw Y, Naito M, Hasegawa G, Suzuki Y, et al.Epidemiology of human influenza A and B viruses in Myanmar from 2005 to2007. Intervirology. 2009;52(6):310–20.
29. Chittaganpitch M, Supawat K, Olsen SJ, Waicharoen S, Patthamadilok S,Yingyong T, et al. Influenza viruses in Thailand: 7 years of sentinel surveillancedata, 2004–2010. Influenza Other Respir Viruses. 2012;6(4):276–83.
30. Zaman RU, Alamgir AS, Rahman M, Azziz-Baumgartner E, Gurley ES, SharkerMA, et al. Influenza in outpatient ILI case-patients in national hospital-basedsurveillance, Bangladesh, 2007–2008. PLoS One. 2009;4(12):e8452.
31. Khamphaphongphane B, Ketmayoon P, Lewis HC, Phonekeo D, Sisouk T,Xayadeth S, et al. Epidemiological and virological characteristics of seasonaland pandemic influenza in Lao PDR, 2008–2010. Influenza Other RespirViruses. 2013;7(3):304–11.
32. Goldstein E, Cobey S, Takahashi S, Miller JC, Lipsitch M. Predicting theepidemic sizes of influenza A/H1N1, A/H3N2, and B: a statistical method.PLoS Med. 2011;8(7):e1001051.
33. Raoult D. Molecular, epidemiological, and clinical complexities of predictingpatterns of infectious diseases. Front Microbiol. 2011;2:25.
34. Tamerius J, Viboud C, Shaman J, Chowell G. Impact of school cycles andenvironmental forcing on the timing of pandemic influenza activity in MexicanStates, May-December 2009. PLoS Comput Biol. 2015;11(8):e1004337.
35. Cauchemez S, Valleron AJ, Boelle PY, Flahault A, Ferguson NM. Estimatingthe impact of school closure on influenza transmission from sentinel data.Nature. 2008;452(7188):750–4.
36. Lowen AC, Bouvier NM, Steel J. Transmission in the guinea pig model. In:Compans RW, Oldstone MBA, editors. Influenza Pathogenesis and Control,vol. I. Switzerland: Springer; 2014. p. 176.
37. Fontana JM, Eiras DP, Salvatore M. Human influenza virus infections. In: SinghSK, editor. Human respiratory viral infections. Florida: CRC Press; 2014. p. 411.
38. World Health Organization. WHO Interim Global EpidemiologicalSurveillance Standards for Influenza. 2012. http://www.who.int/influenza/resources/documents/INFSURVMANUAL.pdf. Accessed 15 July 2013.
• We accept pre-submission inquiries
• Our selector tool helps you to find the most relevant journal
• We provide round the clock customer support
• Convenient online submission
• Thorough peer review
• Inclusion in PubMed and all major indexing services
• Maximum visibility for your research
Submit your manuscript atwww.biomedcentral.com/submit
Submit your next manuscript to BioMed Central and we will help you at every step:
Lucero et al. BMC Infectious Diseases (2016) 16:762 Page 12 of 12