national household education surveys program of … schneider commissioner the ... 1.6 contents of...
TRANSCRIPT

National Household Education Surveys Program of 2005
Public-Use Data File User’s Manual, Volume I
Study Overview and Methodology
U.S. Department of Education
Institute of Education Sciences
NCES 2006-078


National Household Education Surveys Program of 2005
Public-Use Data File User’s Manual, Volume I
Study Overview and Methodology May 2006 Mary Hagedorn
Jill Montaquila
Priscilla Carver
Kevin O’Donnell Westat
Christopher Chapman
National Center for Education Statistics
U.S. Department of Education
Institute of Education Sciences
NCES 2006-078

U.S. Department of Education Margaret Spellings Secretary Institute of Education Sciences Grover J. Whitehurst Director National Center for Education Statistics Mark Schneider Commissioner The National Center for Education Statistics (NCES) is the primary federal entity for collecting, analyzing, and reporting data related to education in the United States and other nations. It fulfills a congressional mandate to collect, collate, analyze, and report full and complete statistics on the condition of education in the United States; conduct and publish reports and specialized analyses of the meaning and significance of such statistics; assist state and local education agencies in improving their statistical systems; and review and report on education activities in foreign countries. NCES activities are designed to address high priority education data needs; provide consistent, reliable, complete, and accurate indicators of education status and trends; and report timely, useful, and high quality data to the U.S. Department of Education, the Congress, the states, other education policymakers, practitioners, data users, and the general public. We strive to make our products available in a variety of formats and in language that is appropriate to a variety of audiences. You, as our customer, are the best judge of our success in communicating information effectively. If you have any comments or suggestions about this or any other NCES product or report, we would like to hear from you. Please direct your comments to National Center for Education Statistics Institute of Education Sciences U.S. Department of Education 1990 K Street, NW Washington, DC 20006-5650 May 2006 The NCES World Wide Web Home Page is http://nces.ed.gov. The NCES World Wide Web Electronic Catalog is http://nces.ed.gov/pubsearch. Suggested Citation Hagedorn, M., Montaquila, J., Carver, P., O’Donnell, K., and Chapman, C. (2006). National Household Education Surveys Program of 2005: Public-Use Data File User’s Manual, Volume I, Study Overview and Methodology. (NCES 2006-078). U.S. Department of Education. Washington, DC: National Center for Education Statistics. Content Contact Christopher Chapman (202) 502-7414 [email protected]

NHES:2005 Public-Use Data File User’s Manual Volume I: Study Overview and Methodology
iii
ACKNOWLEDGMENTS
The questionnaires for the National Household Surveys Program of 2005 were designed by Kevin O’Donnell, Priscilla Carver, and Mary Hagedorn of Westat and Christopher Chapman and Gail Mulligan of the National Center for Education Statistics (NCES). NCES received support from Sandra Eyster, Stacey Bielick, Matthew DeBell, Daniel Princiotta, Frank Avenilla, and Alexa Van Brunt of the American Institutes for Research (AIR).
Advice and guidance on survey design was provided by experts in academic and research
institutions and government agencies, who shared their knowledge and perspectives with study designers. Experts who commented on the Adult Education survey were Mark Van Buren, Corporate Executive Board; John Comings, National Center for the Study of Adult Learning and Literacy (NCSALL); Carol Kasworm, Department of Adult and Community College Education, North Carolina State University; Kevin Hollenbeck, Upjohn Institute for Employment Research; Cheryl Keenan, Office of Vocational and Adult Education, U. S. Department of Education; David Bills, Educational Policy and Leadership Studies, University of Iowa; Joy Peyton, The National Center for ESL Literacy Education (NCLE); Melody Thompson, American Center for the Study of Distance Education (ACSDE), Pennsylvania State University; Ronald Cervero, Department of Adult Education, University of Georgia; and Michael Horrigan, Bureau of Labor Statistics. Experts who provided input on the design of the After-School Programs and Activities Survey were Jean Grossman, Office of Population Research, Princeton University; Gregory Pettit, Auburn University; Joyce Shortt, National Institute on Out-of-School Time (NIOST), Wellesley College; Beth Miller, Former Research Director, National Institute on Out-of-School Time (NIOST), Wellesley College; Georgia Hall, National Institute on Out-of-School Time (NIOST), Wellesley College; Deborah Vandell, University of Wisconsin-Madison; Emily McAdams, 21st Century Community Learning Centers, U.S. Department of Education; Adriana de Kanter, Office of Elementary and Secondary Education, U.S. Department of Education; An-Me Chung, C.S. Mott Foundation; and Robert Halpern, Erikson Institute. Experts who provided input on the Early Childhood Program Participation Survey were Robert Pianta, University of Virginia; Martha Abbott-Shim, Quality Counts, Inc.; Natasha Cabrera, University of Maryland; Deborah Phillips, Georgetown University. It is important to note that much of the content in these surveys was developed over many years through the work of other Westat and NCES staff with the advice and input of experts in academia, government, and research institutions.
NCES is grateful to the thousands of people who participated in the 2005 National Household
Education Surveys Program. Their cooperation was integral to the success of the study.

NHES:2005 Public-Use Data File User’s Manual Volume I: Study Overview and Methodology
iv
This page is intentionally blank.

NHES:2005 Public-Use Data File User’s Manual Volume I: Study Overview and Methodology
v
TABLE OF CONTENTS Chapter Page 1. Introduction ........................................................................................................... 1 1.1 Background of Study.................................................................................... 2 1.2 NHES Survey Topics ................................................................................... 3 1.2.1 Early Childhood Education/Program Participation..................... 3 1.2.2 Adult Education ........................................................................... 4 1.2.3 School Readiness ......................................................................... 4 1.2.4 School Safety and Discipline....................................................... 5 1.2.5 Parent and Family Involvement in Education and Civic Involvement.................................................................................. 5 1.2.6 After-School Programs and Activities......................................... 6 1.2.7 Household and Library Use ......................................................... 7 1.3 NHES:2005 Surveys .................................................................................... 7 1.4 Overview of NHES Design.......................................................................... 9 1.5 Flow of the Interviews.................................................................................. 11 1.6 Contents of Manual ...................................................................................... 11 2. Description of Data Collection Instruments....................................................... 13 2.1 NHES:2005 Screener ................................................................................... 13 2.2 Early Childhood Program Participation (ECPP) Survey............................. 14 2.3 After-School Programs and Activities (ASPA) Survey .............................. 14 2.4 Adult Education (AE) Survey...................................................................... 16 3. Sample Design and Implementation ................................................................... 17 3.1 Precision Requirements for NHES:2005..................................................... 17 3.2 Sampling Households................................................................................... 17 3.3 Sampling Within Households ...................................................................... 20 3.4 Weighting Procedures .................................................................................. 22 3.4.1 Household-Level Weights ................................................................. 22 3.4.2 Person-Level Weights ........................................................................ 23 3.5 Computing Sampling Errors ........................................................................ 29 3.6 Approximate Sampling Errors ..................................................................... 32 3.7 Imputation..................................................................................................... 34 4. Data Collection Methods and Response Rates .................................................. 37 4.1 Data Collection Procedures.......................................................................... 37 4.1.1 Special Precollection Procedures................................................. 37

NHES:2005 Public-Use Data File User’s Manual Volume I: Study Overview and Methodology
vi
TABLE OF CONTENTS—Continued Chapter Page 4.1.2 CATI System Applications.......................................................... 39 4.1.3 Interviewer Training .................................................................... 39 4.1.4 Interviewing Procedures .............................................................. 40 4.1.5 Special Data Collection Procedures ............................................ 42 4.1.6 Data Collection Quality Control.................................................. 43 4.2 Unit Response Rates..................................................................................... 44 4.2.1 Screener Unit Response Rate....................................................... 45 4.2.2 Extended Interview Unit Response Rates ................................... 49 4.2.3 Unit Nonresponse Bias.............................................................. 53 4.3 Item Response Rates .................................................................................... 54 5. Data Preparation ................................................................................................... 59 5.1 Disclosure Risk Analysis ............................................................................. 59 5.2 Coding and Editing Specifications............................................................... 59 5.2.1 Range Specifications.................................................................... 59 5.2.2 Consistency Checks (Logic Edits)............................................... 60 5.2.3 Structural Edits............................................................................. 60 5.2.4 Frequency and Cross-Tabulation Review ................................... 61 5.2.5 Review of “Other, specify” Items................................................ 61 5.2.6 Coding of Open-Ended Items ...................................................... 61 References .............................................................................................................. 63 Appendixes Appendix A: NHES:2005 Screener, ECPP, ASPA, and AE Questionnaires............................ A-1 Screener ............................................................................................................... A-1 Early Childhood Program Participation Interview.............................................. A-13 After-School Programs and Activities Interview ................................................ A-65 Adult Education Interview .................................................................................. A-123 Appendix B: Summary of Weighting and Sample Variance Estimation Variables ................. B-1 Appendix C: NHES:2005 Reasonableness Tables ................................................................... C-1

NHES:2005 Public-Use Data File User’s Manual Volume I: Study Overview and Methodology
vii
TABLE OF CONTENTS—Continued LIST OF TABLES Page Tables
1-1 Surveys conducted under the National Household Education Surveys Program, by years administered: 1991, 1993, 1995, 1996, 1999, 2001, 2003, 2005............................................................................................................... 2 1-2 Summary of completed interviews and weighted unit response and overall unit response rates, by survey: 2005....................................................................... 10
1-3 Summary of completed interviews and unweighted unit response and overall unit response rates, by survey: 2005........................................................... 10
2-1 Content of the ECPP-NHES:2005 and ASPA-NHES:2005, by path: 2005.......... 15
3-1 Expected number of completed screeners, by sampling stratum: 2005................. 20 3-2 Expected and actual numbers of completed interviews and weighted overall unit response rates for the NHES:2005 Screener and extended interviews,
by survey: 2005 ....................................................................................................... 21 3-3 Control totals for poststratifying the NHES:2005 household-level weights:
2004 ......................................................................................................................... 23
3-4 Control totals for raking the ECPP-NHES:2005 person-level weights by characteristics used in raking: 2004, 2003............................................................ 26 3-5 Control totals for raking the ASPA-NHES:2005 person-level weights by characteristics used in raking: 2004, 2003 ........................................................... 27
3-6 Control totals for raking the AE-NHES:2005 person-level interview weights by characteristics used in raking: 2004................................................................... 30
4-1 Number and percentage of telephone numbers dialed, by screener response
status: 2005 ............................................................................................................. 45
4-2 Weighted and unweighted Screener unit response rates: 2005.............................. 47 4-3 Number of telephone numbers dialed in the Screener, by response status,
weighted unit response rate, and characteristics of the telephone number and the geographic area based on the telephone exchange: 2005................................. 48
4-4 Number of enumerated children and adults, completed interviews, and
weighted unit response and overall unit response rates, by type of extended interview: 2005........................................................................................................ 50 4-5 Number of sampled ECPP interviews, by response status, and weighted unit response rates: 2005......................................................................................... 51

NHES:2005 Public-Use Data File User’s Manual Volume I: Study Overview and Methodology
viii
TABLE OF CONTENTS—Continued LIST OF TABLES—Continued Page Tables 4-6 Number of sampled ASPA interviews, by response status, and weighted unit response rates: 2005......................................................................................... 52 4-7 Number of sampled AE interviews, by response status, and weighted
unit response rates: 2005......................................................................................... 53 4-8 Item response rates and total response rates for selected items in the
ECPP interview: 2005............................................................................................. 55 4-9 Item response rates and total response rates for selected items in the
ASPA interview: 2005 ............................................................................................ 56 4-10 Item response rates and total response rates for selected items in the
AE interview: 2005 ................................................................................................. 57
LIST OF FIGURES
Figure 1-1 Flow of the interviews: 2005 .................................................................................. 12

NHES:2005 Public-Use Data File User’s Manual Volume I: Study Overview and Methodology
1
1. INTRODUCTION The National Household Education Surveys Program (NHES) was developed by the National Center for Education Statistics (NCES) and incorporates random digit dial (RDD) telephone surveys of households in the United States. The 2005 administration (NHES:2005) was conducted by Westat from January 3 through April 24, 2005. In the NHES:2005 Screener, household members were enumerated and demographic and educational information that determined eligibility for the three distinct topical surveys was collected. The NHES:2005 surveys are as follows:
• Early Childhood Program Participation Survey (ECPP-NHES:2005), which gathered information on the nonparental care arrangements and educational programs of preschool children, consisting of care by relatives, care by persons to whom they were not related, and participation in day care centers and preschool programs including Head Start;
• After-School Programs and Activities Survey (ASPA-NHES:2005), which addressed relative and nonrelative care during the after-school hours of elementary and middle school-age children, as well as participation in school-based and center-based after-school programs, after-school activities, and self-care; and
• Adult Education Survey (AE-NHES:2005), in which data were collected about participation in the following types of formal adult educational activities: English as a second language, basic skills and high school completion, postsecondary degree and diploma programs, apprenticeships, work-related courses, and personal interest courses. Information on informal learning activities for personal interest was gathered as well.
Three populations of interest corresponded to the three surveys that composed NHES:2005:
• Children from birth through age 6 who were not yet enrolled in kindergarten or above, of interest in either the infant/toddler path (ages 0 through 2) or the preschool path (ages 3 through 6) of the ECPP-NHES:2005 survey;1
• School-age children in kindergarten through grade 8, up to age 15, of interest in the ASPA-NHES:2005 survey; and
• Adults (persons age 16 or older), who were not enrolled in grade 12 or below, not institutionalized, and not on active duty in the U.S. armed forces, of interest in the AE-NHES:2005 survey.
The National Household Education Surveys Program of 2005: Public-Use Data File User’s Manual provides documentation and guidance for users of the following three data files of NHES:2005, the ECPP data file, the ASPA data file, and the AE data file. The manual is composed of four volumes. Information about the purpose of the study, the data collection instruments, the sample design, and data collection and data processing procedures is included in Volume I. The data collection instruments, a chart summarizing weighting and sample variance estimation variables for all NHES surveys, and tables comparing NHES:2005 estimates to those of other surveys are contained in appendixes to Volume I. Volumes II, III, and IV of the manual each address one data file, the ECPP, ASPA, and AE data files, respectively. They each contain a guide to the data file, a discussion of data considerations and anomalies and, in appendixes, the file layout, derived variable specifications, and the codebook for the file.
1 The number of children age 6 and not yet enrolled in kindergarten is small (N=11 in the ECPP database).

NHES:2005 Public-Use Data File User’s Manual Volume I: Study Overview and Methodology
2
The data files contain the following:
• The ECPP-NHES:2005 file includes data from interviews completed with parents of 7,209 children, 3,855 of whom were infants or toddlers and 3,354 of whom were preschoolers.
• The ASPA-NHES:2005 file contains data from interviews completed with parents of 11,684 children in kindergarten through eighth grade, including 11,415 students enrolled in regular public or private schools and 269 homeschooled children.
• The AE-NHES:2005 file contains data from interviews with 8,904 adult respondents, of whom 4,732 were participants in formal educational activities and 4,172 were not.
1.1 Background of Study NHES was developed by NCES to complement its institutional surveys. NHES is the principal mechanism for addressing topics that cannot be addressed in institutional data collections. By collecting data directly from households, NHES allows NCES to gather data on a wide range of issues, such as early childhood care and education, children’s readiness for school, parent perceptions of school safety and discipline, before- and after-school activities of school-age children, participation in adult and continuing education, parent involvement in education, and civic involvement. NHES uses RDD and computer-assisted telephone interviews (CATI); the survey has been conducted by Westat in the spring of 1991, 1993, 1995, 1996, 1999, 2001, 2003, and 2005. As shown in table 1-1, each administration has included more than one survey. The first test of NHES was a large field test conducted in the fall of 1989. This effort, which included the screening of about 15,000 households, included surveys on the following two topics: school dropouts (interviews were conducted with adult household respondents and 14- to 21-year-old youths) and Table 1-1. Surveys conducted under the National Household Education Surveys Program, by
years administered: 1991, 1993, 1995, 1996, 1999, 2001, 2003, 2005
NHES survey administration Survey topics 1991 1993 1995 1996 19991 2001 2003 2005
Early childhood education/program
participation √ √ √ √
√
Adult education √ √ √ √ √ √ School readiness √ √ School safety and discipline √ Parent and family involvement in education √ √ √ Civic involvement √ √ After-school programs and activities √2 √ √3 √ Household and library use √
1 NHES:1999 was a special end-of-decade administration that measured key indicators from the surveys fielded during the 1990s. See text below for further explanation. 2 These items were only asked about children in first through third grades. 3 The NHES:2001 survey about after-school programs and activities (ASPA) also included before-school programs. SOURCE: U.S. Department of Education, National Center for Education Statistics, National Household Education Surveys Program (NHES), 1991, 1993, 1995, 1996, 1999, 2001, 2003, and 2005.

NHES:2005 Public-Use Data File User’s Manual Volume I: Study Overview and Methodology
3
early childhood education (interviews were conducted with parents/guardians2 of 3- to 5-year-olds). The design of the field test and the results of the field test data collection activities are described in an Overview of the NHES Field Test (Brick et al. 1992). 1.2 NHES Survey Topics
The following sections provide more detailed information on the topical areas addressed in the
full-scale NHES administrations and the survey populations associated with each topic. 1.2.1 Early Childhood Education/Program Participation
The nonparental care and education of preschool children has been an important recurring
topic for NHES and was the subject of the 1991 Early Childhood Education Survey (ECE-NHES:1991) and the ECPP-NHES:1995, ECPP-NHES:2001, and ECPP-NHES:2005. In addition, selected items about nonparental care were included in the 1999 Parent Survey (Parent-NHES:1999). The ECPP surveys have provided cross-sectional, national estimates of participation in early care and education programs for children in varying age groups, depending on the specific research questions addressed in a given survey. Estimates can be computed for White, Black, and Hispanic children for subgroups composed of 2- to 3-year age groups or two to three grades in school, depending on the survey year.3 In addition, the surveys were designed to support the analysis of change in early childhood care and education over time.
In ECE-NHES:1991, 13,298 parents of children ages 3 through 8 and 9-year-olds in first or
second grade completed interviews about their children’s early childhood education, including participation in nonparental care by relatives, nonrelatives, or in center-based programs (including Head Start). They also answered questions about early school experiences, including delayed kindergarten entry and grade retention, and activities children engaged in with parents and other family members inside and outside the home. For ECPP-NHES:1995, the population was expanded to include children newborn through third grade. Parents of 14,064 children from birth through third grade were asked detailed questions about their children’s participation in nonparental care and education programs. Other items captured information about early school experiences of school-age children and home and out-of-home family activities with children. ECPP-NHES:2001 focused on children from birth through age 6 who were not yet enrolled in kindergarten; interviews were completed with parents of 6,749 children. In addition to obtaining the same in-depth information on relative care, nonrelative care, center-based program participation, and participation in Early Head Start and Head Start, questions designed to capture continuity of care, parents’ perceptions of the quality of care, and reasons for choosing parental over nonparental care were included.
Information on early childhood care and program participation for preschool children was
also gathered in Parent-NHES:1999, which collected data on key indicators that had been measured in previous NHES collections in order to provide the U.S. Department of Education (ED) with end-of-decade estimates for important education issues. Parent-NHES:1999 was administered to parents of 24,600 children from birth through grade 12, including parents of 6,939 infants, toddlers, and preschoolers for whom information was collected on nonparental care by relatives, nonrelatives, and in center-based programs. Detailed information about children’s health and disability status and parent/guardian and household characteristics has also been obtained in all NHES ECPP surveys, as well as in Parent-NHES:1999.
2 Respondents need not have been parents or legal guardians. The household member most knowledgeable about the child’s care and education was identified by the Screener respondent and selected to respond to the survey. The respondent was usually, but not always, a parent. 3 While the NHES data can be used to produce estimates of other subgroups as well, those in this section reflect population subgroups specifically taken into account in the sample designs for the surveys.

NHES:2005 Public-Use Data File User’s Manual Volume I: Study Overview and Methodology
4
ECPP-NHES:2005 was the fifth collection for this topic and provides current data on the early childhood program participation of infants, toddlers, and preschoolers as well as providing the ability to measure change over time.
1.2.2 Adult Education Adult educational activities capture the interest of educational researchers and policymakers
interested in the phenomenon of learning over the lifetime. AE surveys were conducted in 1991, 1995, 1999, and 2005 (AE-NHES:1991, AE-NHES:1995, AE-NHES:1999, and AE-NHES:2005); the Adult Education and Lifelong Learning Survey was administered in 2001 (AELL-NHES:2001); and the Adult Education for Work-Related Reasons Survey was conducted in 2003 (AEWR-NHES:2003). Each of the surveys provided cross-sectional, national estimates of educational participation for noninstitutionalized persons4 age 16 or older who were not enrolled in grade 12 or below and not on active duty in the U.S. armed forces, as well as estimates for White, Black, and Hispanic adults. The 1995 and 2001 surveys provided estimates for adults who did not have a high school diploma or its equivalent. The surveys were also designed to permit the analysis of change over time in educational participation.
In the 1991, 1995, 1999, and 2001 administrations, respondents were asked about their
participation in basic skills courses, English as a second language (ESL) courses, postsecondary credential (degree or diploma) programs, apprenticeships, work-related courses, courses taken for personal development or personal interest, and in AELL-NHES:2001, informal learning at work. Sample sizes for these surveys ranged from 6,697 to 19,722 depending on the survey year and the specific analytical goals for each collection. Adults participating in programs or courses provided details about those programs or courses, such as subject matter, duration, cost, location and sponsorship, and employer support. In AE-NHES:1991 and AE-NHES:1995, adults who had not participated in selected types of adult education were asked about their interest in educational activities and the barriers to participation in educational activities that they perceived. A battery of personal background, employment, and household questions was also asked in each adult education survey.
The AEWR-NHES:2003 was the first administration of an NHES survey focusing
specifically on work-related education and training. Information was collected from 12,725 adults on participation in four types of formal educational activities in the previous 12 months: college and university degree or certificate programs for work-related reasons; vocational/technical school diploma or degree programs for work-related reasons; apprenticeships; and work-related courses. In addition, adults were asked about participation in less formal learning activities related to a job or career. The interview included questions about reasons for participation and the outcomes of participation. Employer support for educational activities was also a key area of interest in this survey. A new series of items developed for this survey addressed factors associated with participation or nonparticipation in work-related adult education activities.
AE-NHES:2005 collected current information on participation in adult education, and
addressed a new topic, informal learning for personal interest. In addition to providing cross-sectional, national estimates, AE-NHES:2005 provides the ability to measure change in participation over time.
1.2.3 School Readiness The School Readiness Survey was conducted in 1993 (SR-NHES:1993); a subset of key
items was also included in Parent-NHES:1999. Adopting a broad approach to assessing children’s
4 Institutionalized persons are those in long-term hospitals, mental health facilities, prisons, or other institutions.

NHES:2005 Public-Use Data File User’s Manual Volume I: Study Overview and Methodology
5
readiness for entering school, the survey encompassed a range of items related to learning. Parents of 10,888 3- to 7-year-olds who were in second grade or below and children age 8 and 9 who were still in first or second grade completed interviews about their children’s developmental accomplishments and difficulties, including emerging literacy and numeracy, center-based program participation, educational activities with family members, and health and nutrition status. Parents of children in elementary school were also asked about school adjustment, early school experiences, and feedback from teachers on children’s school adjustment. Information about family stability and other risk factors was collected along with parent/guardian and household characteristics. SR-NHES:1993 provided cross-sectional, national estimates for the population of interest, for White, Black, and Hispanic subgroups, and for preschoolers (children ages 3 to 5 and not yet in kindergarten) and students in early elementary grades (kindergarten through second grade).
School Readiness items addressing emerging literacy and numeracy were also administered
to parents of 3,631 preschoolers in Parent-NHES:1999 and parents of 3,150 preschoolers in ECPP-NHES:2001. These items were repeated in ECPP-NHES:2005, providing the ability to examine trends in the emerging literacy and numeracy of preschoolers over time.
1.2.4 School Safety and Discipline In 1993, NHES included the School Safety and Discipline Survey (SSD-NHES:1993).
Interviews were conducted with parents of 12,680 students in grades 3 through 12 and with 6,504 youth in grades 6 through 12. Parents and youth were asked about the school learning environment, discipline policy, safety at school, victimization, availability and use of alcohol and drugs, and alcohol and drug education. Youth were also asked about peer norms for achievement and behavior in school and substance use. The survey addressed parents’ contributions to their children’s learning environment through questions about parental expectations for academic achievement and good behavior at school, parental efforts to educate and protect their children, and parental involvement in the school. Parent/guardian and household characteristics were also elicited. SSD-NHES:1993 provided national estimates of the topics above for the full population of interest, for White, Black, and Hispanic children, and for children in grades 3 through 5, 6 through 8, and 9 through 12.
1.2.5 Parent and Family Involvement in Education and Civic Involvement The Parent and Family Involvement in Education and Civic Involvement Survey was
conducted in 1996 (PFI/CI-NHES:1996). Key family involvement items were incorporated in Parent-NHES:1999 as well, and NHES:2003 included a survey focusing specifically on parent and family involvement (PFI-NHES:2003). PFI/CI-NHES:1996 focused on parents’ participation in educational activities at home as well as participation in various capacities at the programs or schools their children attended. The population of interest was children age 3 through grade 12; interviews were conducted with 20,792 parents. Questions for parents of 19,581 children who attended school or a center-based program addressed specific ways the family was involved in the school/program, communication with teachers and other school practices to involve families, and parent involvement with children’s homework. Parents of all children responded to questions about parent and family involvement with their children in educational activities outside of school. Children’s contact with nonresidential parents and the involvement of those parents with school was also captured. An additional topic for parents of preschoolers was support and training received for parenting.
The civic involvement of parents of students in grades 6 though 12 and that of the students
themselves, as well as a separate random sample of adults, was addressed in PFI/CI-NHES:1996 and in two other 1996 surveys, the Youth Civic Involvement Survey (YCI-NHES:1996) and the Adult Civic

NHES:2005 Public-Use Data File User’s Manual Volume I: Study Overview and Methodology
6
Involvement Survey (ACI-NHES:1996). The topic of community service was expanded for inclusion in the end-of-decade 1999 Youth Survey (Youth-NHES:1999). Questions related to the diverse ways that parents and other adults may socialize children for informed civic participation. The surveys were intended to provide an assessment of the opportunities that youth have to develop the personal responsibility and skills that would facilitate their taking an active role in civic life, such as through exposure to information about politics or national issues, through discussion of politics and national issues, and by the example of adults who participate in community or civic life. Questions about attitudes that relate to democratic values and knowledge about government were also included. In Youth-NHES:1999, special emphasis was placed on the opportunities youth had for participation in community service and the extent of school efforts to support youth community involvement.
PFI/CI-NHES:1996 and Parent-NHES:1999 provided cross-sectional, national estimates of
the topics described earlier for all children in the population of interest, for White, Black, and Hispanic children, for preschoolers, and for three-grade groupings. YCI-NHES:1996 (8,043 interviews) and Youth-NHES:1999 (7,913 interviews) provided national estimates for 6th- through 8th-graders and 9th- through 12th-graders. ACI-NHES:1996 (2,250 interviews) provided estimates that could be used to compare adults in households without children age 3 through grade 12 to adults in households with children in this age/grade range.
PFI-NHES:2003 focused on children and youth in kindergarten through grade 12 and
addressed school experiences, family participation in schools, school practices to involve and support families, family involvement in schoolwork, and family involvement outside of school. Homeschooling parents were asked about their reasons for choosing and resources for implementing homeschooling. The involvement of nonresidential parents was also addressed, when applicable. In addition, information was collected on the child’s or youth’s health and disability status, and child and parent demographic characteristics. A total of 12,426 interviews were completed with parents of eligible children and youth. PFI-NHES:2003 provided current national, cross-sectional estimates for the population of interest and provided the ability to examine change over time.
1.2.6 After-School Programs and Activities The ways that parents arrange for supervision and enrichment during the out-of-school hours
for children who are enrolled in kindergarten through eighth grade was introduced as a topic in Parent-NHES:1999. In 1999, parents of 12,396 children in kindergarten through eighth grade reported on their children’s participation in care by relatives, nonrelatives, and in center-based programs, as well as their participation in after-school activities arranged to provide adult supervision. The 2001 Before- and After-School Programs and Activities Survey (ASPA-NHES:2001) collected detailed information from parents of 9,583 children in kindergarten through eighth grade about the before- and after-school arrangements in which their children participated, including care by relatives or nonrelatives in private homes, before- or after-school programs in centers and in schools, activities that might provide adult supervision in the out-of-school hours, and children’s self-care. Items also addressed continuity of care arrangements, parental perceptions of quality, reasons for choosing parental care, and obstacles to participation in nonparental arrangements. The child’s health and disability status and characteristics of the parents and household were also collected. Information about after-school programs was collected again in 2005 (ASPA-NHES:2005). The Parent-NHES:1999, ASPA-NHES:2001, and ASPA-NHES:2005 all provide cross-sectional, national estimates of participation in various types of arrangements for children in the population of interest as well as for White, Black, and Hispanic children, and for those in kindergarten through fifth grade and sixth through eighth grade. In addition, these data can be used to examine change in participation over time.

NHES:2005 Public-Use Data File User’s Manual Volume I: Study Overview and Methodology
7
1.2.7 Household and Library Use
The Household and Library Use Survey of 1996 (HHL-NHES:1996) examined public library
use by household members. This brief survey was administered to the 55,708 households that completed screeners in 1996. The items tapped the ways that household members used public libraries (e.g., borrowing books, attending lectures, attending story hours) and the purposes for using public libraries (e.g., for school assignments, enjoyment, work-related projects). In addition, demographic and educational information was collected about each household member. HHL-NHES:1996 provided cross-sectional, national estimates of household characteristics and library use for all households in the United States as well as estimates by state.
1.3 NHES:2005 Surveys
The three surveys that composed NHES:2005 addressed topics that had been addressed in previous years. ECPP-NHES:2005 and AE-NHES:2005 encompass topics surveyed in 1991, 1995, and 2001. Items related to these topics were also included in NHES:1999. ASPA-NHES:2005 included topics on after-school arrangements of school-age children, previously included in ASPA-NHES:2001; however, unlike the NHES:2001 survey, questions about before-school arrangements were not included in the 2005 survey.
Early Childhood Program Participation Survey ECPP-NHES:2005 addressed the nonparental care and program participation of preschool
children, that is, children from birth through age 6 and not yet in enrolled kindergarten or higher grades. The survey collected information on all of the child’s current, regular care arrangements, including care by a relative or by someone not related to the child in a private home and participation in a day care center or preschool, including Head Start. Information was collected about the number of hours per week or per month of nonparental care and parent perceptions of the factors associated with choosing nonparental care.
Other information collected in this survey pertained to educational activities at home, emerging literacy and numeracy, the child’s characteristics, including health and disability status, and parent/guardian and household characteristics. Interviews were completed with parents of 7,209 preschool children.
After-School Programs and Activities Survey
ASPA-NHES:2005 focused on children enrolled in kindergarten through eighth grade who were 15 years old or younger. Parents reported on the after-school arrangements in which their children participated, including care by relatives or nonrelatives in a private home, after-school programs in schools or centers, activities that might provide adult supervision in the after-school hours, and children’s self-care. Items also addressed reasons for choosing parental care, the child’s characteristics, including health and disability status, and parent/guardian and household characteristics. Interviews were conducted with the parents of 11,684 students.

NHES:2005 Public-Use Data File User’s Manual Volume I: Study Overview and Methodology
8
Adult Education Survey
AE-NHES:2005 measured participation in the following types of formal educational activities: ESL, basic skills and general education development (GED) preparation courses, college or university degree or certificate programs, vocational or technical diploma programs, apprenticeship programs, courses or training for work-related reasons, and personal interest classes or courses. In addition, information was collected on participation in informal learning activities for personal interest. Items also gathered information on employer support for educational activities. Detailed information about educational attainment, employment, and household characteristics was also collected from both participants and nonparticipants. Adults age 16 and older who were not enrolled in grade 12 or below, were noninstitutionalized, and not serving on active military duty were eligible for this survey, and interviews were completed with 8,904 people, 4,732 of whom had participated in formal educational activities in the past year and 4,172 of whom had not.
NHES:2005 Survey Design Activities The NHES:2005 topical surveys drew heavily upon design work that was conducted for prior NHES administrations. At the same time, there was considerable emphasis on reducing the length of the interviews to limit the burden on potential respondents. In addition to considering the NHES:2001 instruments for the same survey topics, other survey design activities were undertaken in order to ensure that the data resulting from the NHES:2005 administration addressed emerging issues and those of concern to researchers and policymakers.
• Westat staff consulted with experts in academic and research institutions and government agencies to obtain their perspectives on the survey topics. Provided with copies of the NHES:2001 instruments, the experts were asked to respond to proposed deletions, to comment on the relative priority of specific areas of survey content, and to identify important research issues that were not addressed in the surveys. Telephone conferences were held with 24 experts.
• Survey staff also examined extant surveys to assess the content areas addressed and the
items used to measure survey concepts. • Survey staff conducted reviews of the relevant literature, drawing upon professional
journals, scholarly books, and government reports. • A set of research questions was developed for each survey. These research questions
identified the content areas to be addressed and provided a means to map the survey instruments to content areas to ensure sufficient coverage of important issues.
Each of these activities contributed to the development of the draft survey instruments, which underwent cognitive testing to assess respondent comprehension of the questions, their knowledge of the information requested, and the sensitivity of survey items. In addition, the instruments were field tested by telephone to evaluate interview flow, administration time, areas of respondent confusion, and items that were difficult for respondents to answer.

NHES:2005 Public-Use Data File User’s Manual Volume I: Study Overview and Methodology
9
1.4 Overview of NHES Design The ECPP, ASPA, and AE surveys were developed to provide reliable national estimates. Three surveys were conducted simultaneously because of the high costs associated with screening large numbers of households in order to meet the sample size requirements for precise estimates. By addressing more than one topic in NHES:2005, the cost of screening households to find those eligible could be partitioned over the three surveys. This strategy is key to the NHES design.
Another feature of NHES, within-household sampling, was developed in response to concerns about the burden placed upon households in which the same household member would be eligible to respond to multiple surveys or more than one household member could be sampled. A Screener was used to collect information on household composition and interview eligibility, and to reduce burden, no more than three persons were sampled in a single household. Because of numbers needed to meet precision requirements and their relative scarcity in the population, a preschooler (age 3 through 6 and not enrolled in kindergarten or higher grades) and a middle school student (sixth through eighth grades) were sampled in any household that contained them. In contrast, more adults, infants and toddlers (age 0 through 2), and elementary school students (kindergarten through fifth grade) would be found during screening than were needed for precision requirements, so a maximum of two persons among adults, infants, and elementary school students could be sampled in any household. Also, adults were sampled at a lower rate in households that contained eligible children, further reducing respondent burden. (See chapter 3 for a detailed discussion of precision requirements and sampling procedures for NHES:2005.)
Even though sampling methods reduced the number of interviews per household, the length of the interview was considered to be a critical factor in obtaining good response rates and reliable estimates. Therefore, the number of items included in the NHES:2005 surveys was limited in order to help improve response rates and reduce the demands made on survey respondents. The overall average administration time for the Screener was 3.09 minutes. The average administration time was 2.57 minutes for Screeners with no extended interviews, between 3.2 and 3.8 minutes for Screeners with one extended interview, between 4.5 and 4.8 minutes for Screeners that generated two extended interviews, and about 6.3 minutes for Screeners associated with three extended interviews. The average administration time for the ECPP interview was 15.4 minutes; for the ASPA interview it was 17.5 minutes. The AE interview took an average of 15.9 minutes overall. The administration time was 20.4 minutes for adult education participants and 10.8 minutes for nonparticipants.
Because of the requirement to reduce respondent burden, the complex sampling techniques used, and the need for quick and accurate administration, NHES:2005 was conducted using CATI technology. Some of the advantages of CATI include improved project administration, online sampling and eligibility checks, scheduling of interviews according to a priority scheme to improve unit response rates, managing data quality by controlling skip patterns and checking responses online for range and consistency, and an online “help” function to assist interviewers in answering respondents’ questions. Items within each of the NHES:2005 instruments were programmed so that the appropriate items appeared on the interviewer’s computer screen according to the respondent’s answers to previous questions. Table 1-2 summarizes the number of completed interviews and gives weighted unit response and overall unit response rates for the Screener and the ECPP, ASPA, and AE surveys. Table 1-3 gives unweighted unit response and overall unit response rates for the Screener and the ECPP, ASPA, and AE surveys. More details on the computation of these rates, including a discussion of the uses of weighted and unweighted response rates, are given in chapter 4.

NHES:2005 Public-Use Data File User’s Manual Volume I: Study Overview and Methodology
10
Table 1-2. Summary of completed interviews and weighted unit response and overall unit response rates, by survey: 2005
Interview type Number of completed
interviewsUnit response
rate1 Overall unit
response rate2
Screener 58,140 66.9 66.9ECPP survey 7,209 84.4 56.4ASPA survey 11,684 84.1 56.3AE survey 8,904 71.2 47.6
1 The unit response rate is the percentage of completed interviews for a specific stage of the survey (i.e., the Screener, ECPP, ASPA, or AE interview). It is a ratio of the number of completed interviews to the number of units (e.g., households and household members) sampled for the interviews. For many telephone numbers sampled for the Screener interview, no contact was ever made. Based on results of the survival method calculations, 22 percent of these numbers were assumed to be residential and were added to the denominator for the calculation of the Screener unit response and overall unit response rates. Additionally, the Screener unit response rate accounts for the subsampling of cases for nonresponse followup, which is discussed further in section 4.1.1. 2 The overall unit response rate indicates the percentage of possible interviews that have been completed, taking all sampling stages into account. The overall unit response rate and the unit response rate are identical for the first stage of sampling and interviewing (i.e., the Screener). For the ECPP, ASPA, or AE surveys, the overall unit response rate is the product of the Screener unit response rate and the interview unit response rate (e.g., for the ASPA survey, the calculation for the overall unit response rate is 100 x (0.669 x 0.841) = 56.3). SOURCE: U.S. Department of Education, National Center for Education Statistics, Early Childhood Program Participation (ECPP) Survey of the National Household Education Surveys Program (NHES), 2005; After-School Programs and Activities (ASPA) Survey of the NHES, 2005; and Adult Education (AE) Survey of the NHES, 2005. Table 1-3. Summary of completed interviews and unweighted unit response and overall unit
response rates, by survey: 2005
Interview type Number of completed
interviewsUnit response
rate1 Overall unit response
rate2
Screener 58,140 67.5 67.5ECPP survey 7,209 86.1 58.0ASPA survey 11,684 86.2 58.2AE survey 8,904 75.3 50.7
1 The unit response rate is the percentage of completed interviews for a specific stage of the survey (i.e., the Screener, ECPP, ASPA, or AE interview). It is a ratio of the number of completed interviews to the number of units (e.g., households and household members) sampled for the interviews. For many telephone numbers sampled for the Screener interview, no contact was ever made. Based on results of the survival method calculations, 22 percent of these numbers were assumed to be residential and were added to the denominator for the calculation of the Screener unit response and overall unit response rates. The unweighted proportion of nonrespondents in the sample is higher than in previous NHES administrations due to the subsampling of cases for nonresponse followup in NHES:2005. Only cases subsampled for followup were included in the calculation of the unweighted rates. 2 The overall unit response rate indicates the percentage of possible interviews that have been completed, taking all sampling stages into account. The overall unit response rate and the unit response rate are identical for the first stage of sampling and interviewing (i.e., the Screener). For the ECPP, ASPA, or AE surveys, the overall unit response rate is the product of the Screener unit response rate and the interview unit response rate (e.g., for the ASPA survey, the calculation for the overall unit response rate is 100 x (0.675 x 0.862) = 58.2). SOURCE: U.S. Department of Education, National Center for Education Statistics, Early Childhood Program Participation (ECPP) Survey of the National Household Education Surveys Program (NHES), 2005; After-School Programs and Activities (ASPA) Survey of the NHES, 2005; and Adult Education (AE) Survey of the NHES, 2005.

NHES:2005 Public-Use Data File User’s Manual Volume I: Study Overview and Methodology
11
1.5 Flow of the Interviews Figure 1-1 shows the flow of the NHES:2005 interviews. Each household contact began with a Screener to obtain information used to sample adults and children for extended interviews. If the household contained any children from birth through eighth grade, up to three interviews were conducted with the parent or guardian most knowledgeable about each child’s care and education. Up to two adults were sampled in each household for an AE interview. The maximum number of interviews in a household was three. (See chapter 3 for additional details about the sample.) Whenever possible, all interviews with household members were conducted during the same telephone call as the Screener. Followup calls were made to complete interviews that were not completed during the initial contact. 1.6 Contents of Manual The chapters that follow in Volume I provide additional information about the survey instruments (chapter 2), the sample design and estimation procedures (chapter 3), data collection and response rates (chapter 4), and data preparation (chapter 5). Appendix A provides a copy of the Screener and the ECPP, ASPA, and AE questionnaires. Appendix B contains a summary of weighting and sample variance estimation variables. Appendix C contains tables comparing NHES:2005 estimates to those of other surveys. Volumes II through IV of the NHES:2005 Public-Use Data File User’s Manual provide information on the ECPP, ASPA, and AE data files, respectively. Each contains a guide to the relevant data file and codebook, a discussion of data considerations and anomalies, and, in appendixes, the file layout, derived variable specifications, and codebook.

NHES:2005 Public-Use Data File User’s Manual Volume I: Study Overview and Methodology
12
Figure 1-1. Flow of the interviews: 2005
Screener through householdcomposition and/or sampling point.
Any extended interviewsto be done?
Is Screener respondent arespondent for an
extended interview?
Conduct interview(s) withother appropriate
respondent(s).
End ofcall.
Remaining Screener items. End ofcall.
Conduct appropriateinterview(s) with Screener
respondent.
Any remaininginterviews to be
done?
no
yes
yes
no
yes
no

NHES:2005 Public-Use Data File User’s Manual Volume I: Study Overview and Methodology
13
2. DESCRIPTION OF DATA COLLECTION INSTRUMENTS The sections that follow describe the instruments used to collect data contained in the Early Childhood Program Participation Survey (ECPP), After-School Programs and Activities Survey (ASPA), and Adult Education Survey (AE) data files in the National Household Education Surveys Program of 2005 (NHES:2005). In addition to the Screener, through which eligibility was determined, ECPP, ASPA, and AE questionnaires were used. Appendix A contains a copy of each instrument. 2.1 NHES:2005 Screener The screening interview in NHES:2005 was used to determine whether sampled telephone numbers belonged to households, gather the information needed to sample household members to be interview subjects, select the appropriate parent/guardian respondent for ECPP and ASPA interviews, and administer some household items in households in which no one was sampled for an extended interview. The Screener was designed to accomplish these tasks efficiently, placing minimum burden on the respondent. The first series of questions in the Screener determined whether the telephone number was residential and whether the person on the telephone was eligible to answer the questions. If it was determined that the telephone number was used for business only, the call was terminated. The survey continued for numbers that were for household use or for both household and business use. If the person who answered the telephone was not a household member or was a household member under 18 years of age, an appropriate Screener respondent was requested. If no member of the household was 18 years old or older, a person designated as the male or female head of household was eligible to be the Screener respondent. The order of subsequent Screener questions varied depending upon whether the household contained any members age 15 or younger and whether the household had been designated for an AE interview. In households not designated for an AE interview and in which there were children age 15 or younger, only those members age 15 and younger were enumerated (i.e., the name, age, and sex of each person was collected). Full enumeration of these households was completed later during the extended interview if a child was selected. Screener questions directly following the enumeration determined whether they could be sampled for the study. The questions asked whether household members age 3 through 15 were attending school or being homeschooled, and the grade or year of school in which they were enrolled. If a child was sampled for an ECPP or ASPA interview, the parent/guardian most knowledgeable about the child’s education and care was selected as the respondent. In households designated for an AE interview, all household members were enumerated in the Screener. Participation in any educational activities during the past 12 months was determined for all household members age 16 or older and not currently enrolled in grade 12 or below. Following selection of an adult for the extended interview, eligibility was determined by asking whether the sampled adult was currently serving on active duty in the military. Active duty military personnel were not eligible for an AE interview. When appropriate, contact information was gathered for sampled adults living in school-sponsored housing. If no child was sampled for an ECPP or ASPA interview and no adult was sampled for an AE interview, the Screener respondent was asked whether the home was owned or rented and whether there were other telephone numbers in the household for home use. This information was used for weighting and nonresponse adjustment. Then the interview was terminated.

NHES:2005 Public-Use Data File User’s Manual Volume I: Study Overview and Methodology
14
2.2 Early Childhood Program Participation (ECPP) Survey In the ECPP-NHES:2005 survey, data were collected about children from birth through age 6 as of December 31, 2004, who were not enrolled in kindergarten or a higher grade in school. The respondent for the ECPP interview was the adult living in the household who was the most knowledgeable about the child’s care and education. Typically, this was the mother of the child; however, the respondent could be a father, stepparent, adoptive parent, foster parent, grandparent, another relative, or a nonrelative designated as the most knowledgeable household member. For simplicity, when referring to the most knowledgeable respondent in the manual, this person will be called the parent. In the ECPP interview, subjects were routed to one of two questionnaire paths, infant/toddler or preschool. Irrespective of the questionnaire path for the child, parents were asked basic demographic questions about the child, questions about the child’s health and disability status, questions about parent/guardian characteristics, and questions about household characteristics. To avoid redundancy and limit response burden, household information was collected only during the first interview conducted in each household. Similarly, parent/guardian information was collected only once per household, unless sampled children in the same household had different parents. Table 2-1 shows the structure of the ECPP and ASPA interviews, which contained many parallel items, and the distribution of topics among the paths for each interview. The infant/toddler path (I) of the ECPP interview was for those children newborn through 2 years of age. Information was collected on participation in early childhood care and arrangements (relative care, nonrelative care, and center-based arrangements, including Early Head Start), and, for 2-year-olds, literacy-related skills and activities. The preschool path (N) was for those children who were age 3 or older and not yet attending kindergarten or primary school. These children were typically 3 to 5 years old, but could have been 6 years old. As shown in table 2-1, information was collected about current school participation, participation in early childhood care and programs (relative care, nonrelative care, and center-based programs, including Head Start), factors in parental choice of arrangements, and literacy-related skills and activities. 2.3 After-School Programs and Activities (ASPA) Survey In the ASPA-NHES:2005 survey, data were collected about children who were in kindergarten through eighth grade provided they were age 15 or younger. Students who were homeschooled with a grade equivalent of kindergarten through eighth grade were also eligible; a subset of questions was asked about this population (table 2-1). The respondent for the ASPA interview was the adult living in the household who was the most knowledgeable about the child’s care and education. Usually, this was the mother of the child; however, the respondent could be a father, stepparent, adoptive parent, foster parent, grandparent, another relative, or a nonrelative. There were two paths through the interview items, the school path and the homeschool path. All parents were asked basic demographic questions about the child, questions about the child’s health and disability status, questions about parent/guardian characteristics, and questions about household characteristics.

NHES:2005 Public-Use Data File User’s Manual Volume I: Study Overview and Methodology
15
Table 2-1. Content of ECPP-NHES:2005 and ASPA-NHES:2005, by path: 2005 ECPP survey ASPA survey Preschoolers (N)
Characteristic Infants/
toddlers (I)
Not enrolled in center-based
programs
Enrolled in center-based
programs1
Enrolled in regular school (S)
Home-schooled
(H)
Child demographic characteristics √ √ √ √ √ Current school/program status √ √ √ √3
Program characteristics √ School characteristics √ √3
Student academic performance and behavior √ √3
Nonparental care arrangement √ √ √ After-school care arrangements/programs √ Parental care after school √ Parental choice of care arrangements √ √ √ √ Children’s home activities √ √ √ Emerging literacy and numeracy √2 √ √ Child health and disability √ √ √ √ √ Parent/guardian characteristics √ √ √ √ √ Household characteristics √ √ √ √ √
1 Center-based programs include day care centers, nursery schools, preschools, and prekindergartens. 2 Emerging literacy and numeracy questions were asked about 2-year-olds in the infant/toddler path. 3 Asked of homeschooled students who also attended regular school for 9 hours per week or more. SOURCE: U.S. Department of Education, National Center for Education Statistics, Early Childhood Program Participation (ECPP) Survey of the National Household Education Surveys Program (NHES), 2005; and After-School Programs and Activities (ASPA) Survey of the NHES, 2005.
The school path (S) was administered to parents/guardians of children currently attending a regular school in kindergarten, including transitional kindergarten and prefirst grade, through eighth grade. (As defined in NHES, transitional kindergarten is a program before regular kindergarten for children who are old enough for kindergarten but not yet ready to start. Prefirst grade is an extra year between kindergarten and first grade.) The ages of the children typically ranged from 5 to 13. In the school path, data were collected about enrollment in school, school characteristics, student academics and behavior at school, after-school care arrangements and programs, after-school activities, self-care, parental care during the out-of-school hours, and factors in parental choice of arrangements. The homeschool path (H) was administered to those parents/guardians of children who were being instructed at home for some or all of their classes instead of attending regular school and who had a grade equivalent of kindergarten through eighth grade. Parents of homeschoolers were asked questions about the student’s grade equivalent; for those students who were reported to be homeschooled but also attended a school 9 or more hours per week, parents/guardians were administered the sections on school characteristics and student performance at school.

NHES:2005 Public-Use Data File User’s Manual Volume I: Study Overview and Methodology
16
2.4 Adult Education (AE) Survey
The AE-NHES:2005 was designed to provide national estimates of participation in adult educational activities. Adults age 16 and older who were not enrolled in grade 12 or below, not institutionalized, and not on active duty in the military were eligible for this survey. Respondents were asked about their participation in the following types of educational activities: English as a second language (ESL), basic skills/GED preparation, degree or certificate programs in colleges or universities, vocational or technical diploma programs, apprenticeships, career- or job-related training or courses, personal interest/development classes, and informal learning activities for personal interest. Information about employer support for educational activities was obtained. Other items gathered demographic, household, and detailed employment information.

NHES:2005 Public-Use Data File User’s Manual Volume I: Study Overview and Methodology
17
3. SAMPLE DESIGN AND IMPLEMENTATION
This chapter describes the sample design for the National Household Education Surveys Program of 2005 (NHES:2005), including a number of special features of the design. Also presented are the procedures for weighting, variance estimation, and imputation for items that had missing values. 3.1 Precision Requirements for NHES:2005 The number of telephone numbers required for NHES:2005 was determined by the precision requirements for the estimates from the Early Childhood Program Participation (ECPP), After-School Programs and Activities (ASPA), and Adult Education (AE) Surveys. The general precision requirement for all three surveys was the ability to detect a 10 to 15 percent relative change for an estimate of between 30 and 60 percent. In NHES:2005, the overall screening sample was largely determined by the need to produce precise estimates of indicators for children, particularly preschoolers (age 3 through 6 and not yet in kindergarten) and middle schoolers (sixth- through eighth-graders). For the ECPP and ASPA surveys, key sample size determinants were the requirements to detect changes in estimates of type of care arrangement by age/grade groupings and by race/ethnicity. The age/grade groupings considered were infants (0 through 2 years), preschoolers (children age 3 through 6 and not yet in kindergarten), elementary schoolers (kindergarten through fifth-graders), and middle schoolers (sixth- through eighth-graders). The race/ethnicity categories considered were White, non-Hispanic; Black, non-Hispanic; and Hispanic. As a result, target sample sizes (in terms of numbers of sampled children) of about 5,100 for infants/toddlers, 4,200 for preschoolers, 8,100 for elementary schoolers, and 6,000 for middle schoolers were established.
For adults, key sample size determinants were the requirements to detect changes in estimates of participation in adult education activities overall and participation by type of adult education. In addition, the requirements to estimate participation by race/ethnicity and by educational attainment (less than high school or high school and higher) were also considered. Based on these requirements, a target sample size of about 13,600 sampled adults was established. Adult education participants were sampled at a higher rate than nonparticipants in order to improve the precision of estimates of characteristics of participants. Adults with less than a high school diploma were sampled at a higher rate for the same reason.
Taking into account all stages of sampling and expected response, a goal of screening about 59,400 households was established. Screening sample sizes and within-household sampling were expected to yield the target sample sizes given above. As discussed in the next section, a lower than expected residency rate (i.e., the proportion of telephone numbers that are assigned to households) necessitated the release of a portion of the reserve sample of telephone numbers in an attempt to attain the original target numbers of completed extended interviews. 3.2 Sampling Households
Different methods have been developed over the years for selecting random samples of telephone households. The Mitofsky-Waksberg method of random digit dialing (RDD) as described in Waksberg (1978) is probably the best known of the methods. For NHES:1991 and NHES:1993, a modified Mitofsky-Waksberg method described by Brick and Waksberg (1991) was used.

NHES:2005 Public-Use Data File User’s Manual Volume I: Study Overview and Methodology
18
Since NHES:1995, a different approach to RDD sampling, called a list-assisted method, described by Casady and Lepkowski (1993), has been used for the NHES surveys. This method reduces the number of unproductive calls to nonworking or nonresidential numbers (compared with simple random sampling of all numbers), produces a self-weighting sample, is a single stage and unclustered sample, and eliminates the sequential difficulties5 associated with the Mitofsky-Waksberg method. With the list-assisted method, an equal probability random sample of telephone numbers is selected from all telephone numbers that are in 100-banks (numbers in a 100-bank have the same first 8 digits of the 10-digit telephone number) in which there is at least one residential telephone number listed in the white pages directory (the listed stratum). Both listed and unlisted telephone numbers are included in the listed stratum. Telephone numbers in 100-banks with no listed telephone numbers (the zero-listed stratum) were not sampled.
The sampling frame for NHES:2005 was all telephone numbers in 100-banks with one or more listed residential telephone numbers as of September 2004. A stratified two-phase list-assisted sample (described below) was used in order to support design goals for national-level and subdomain statistics for the ECPP, ASPA, and AE surveys of NHES:2005.
Because NHES is a telephone survey, undercoverage bias resulting from differences between telephone and nontelephone households is a concern. Undercoverage bias is the average difference between the survey estimate and the population parameter being estimated that results from some members of the inference population being excluded from the sampling frame. For example, while NHES is conducted using a sample of telephone households, the inference population includes both telephone and nontelephone households, so undercoverage bias could result from the exclusion of persons in nontelephone households. Differences in telephone coverage rates, especially differential rates among population subgroups, such as those defined by region, age, race/ethnicity, and household composition, are of concern to telephone survey methodologists because they can introduce bias in the estimates.
The largest component of coverage bias in a telephone survey such as NHES is likely due to
the prevalence of nontelephone households6 and the differences between such households and those with telephones. Blumberg, Luke, and Cynamon (in press) examined differences in characteristics among persons and households having no telephone service, cellular service only, and landline service (including both landline only, and landline and cellular). Although there are differences in landline coverage (e.g., young adults, adults in one-person households, and renters are less likely to have landline telephones), raking to population totals for these subgroups is used in NHES to statistically adjust for and reduce undercoverage bias. Various studies have been undertaken to examine the undercoverage bias for key subgroups in NHES. Brick, Burke, and West (1992) looked at undercoverage bias for 3- to 5-year-olds and 14- to 21-year-olds. Brick (1996) examined undercoverage bias for 0- to 2-year-olds and adults. Undercoverage bias for 3- to 7-year-olds was examined by Brick et al. (1997). Undercoverage bias for estimates of characteristics of households and for adults was investigated by Montaquila, Brick, and Brock (1997). The undercoverage bias for most subgroups is not likely to be a major problem after the raking adjustment.7
Results from these studies suggest that undercoverage bias is not a significant problem in
NHES. (The studies cited above found that with very few exceptions, the adjusted weights after raking yielded estimates with absolute telephone coverage bias of 2 percent or less.) However, the
5 With the Mitofsky-Waksberg method, primary sampling units (PSUs) comprising sets of telephone numbers having the same first 8 digits (i.e., 100-banks) are created and sampled. Within each sampled PSU, a single telephone number (called the prime number) is selected. The telephone number is dialed, and if it is found to be residential, the PSU is retained in the sample and an additional k telephone numbers are selected from the PSU; otherwise, the PSU is discarded and no telephone numbers are sampled from the PSU. In order to obtain a fixed number of telephone numbers in the sample, PSUs cannot be selected in one step but must be selected sequentially as the telephone numbers are dialed, since the number of PSUs in which the prime number is residential is unknown at the time of PSU selection. 6 Nontelephone households include cellular phone-only households, in addition to households with no telephone service. 7 See section 3.4.2 for further details about the raking adjustment that was applied in creating the survey weights.

NHES:2005 Public-Use Data File User’s Manual Volume I: Study Overview and Methodology
19
undercoverage bias for smaller subgroups could be more problematic and requires additional research. When dealing with a small subgroup that is likely to be differentially undercovered, data users should consider the possible impact of different sources of error. Both sampling errors and nonsampling errors from undercoverage bias are likely to be relatively large for small subgroups.
Another potential source of undercoverage bias in telephone surveys that use the list-assisted method is the fact that not all telephone households are included in the sampling frame. Households in the zero-listed stratum have no chance of being included in the sample. Empirical findings were presented in Brick et al. (1995) to address the question of coverage bias associated with excluding the zero-listed stratum. The results show that the percentage of telephone numbers in the zero-listed stratum that are residential is small (about 1.4 percent) and that about 3 to 4 percent of telephone households are in the zero-listed stratum. The results also indicate that households in the zero-listed stratum are not very different from households in the listed stratum. Because the proportion of telephone households that are in the zero-listed stratum is small and the persons living in these households are not very different from those living in households in the listed stratum, the bias resulting from excluding the zero-listed stratum is generally very small.
In NHES:2005, a two-phase stratification was used to select telephone numbers in order to
produce more reliable national estimates from the extended interviews for subdomains defined by race and ethnicity. In the first phase, a sample of 349,998 telephone numbers was drawn, with telephone numbers in areas with high percentages of Black and Hispanic residents sampled at higher rates than those in areas with low percentages of Black and Hispanic residents. The sampling frame contained the Census 2000 counts of persons in the area by race and ethnicity. Race and ethnicity information was obtained for ZIP Codes served by the telephone exchange and then aggregated. A 100-bank was classified in the high minority concentration stratum if its population was either at least 20 percent Black or at least 20 percent Hispanic. The banks that did not meet this requirement were classified in the low minority concentration stratum. The sampling rate in the high minority concentration stratum was nearly twice that of the low minority stratum. While telephone exchanges do not correspond exactly to census tracts or blocks, this approach is still effective at increasing sample yield for Blacks, Hispanics, and Asians.
In the second phase, within each minority stratum, the sampled telephone numbers were
classified as mailable or nonmailable according to whether they could be matched to a mailing address in the white pages telephone directory or from other databases. Mailable status was used because it has been found to improve the efficiency of the sample by facilitating the oversampling of mailable numbers (which are more likely to be residential). Within each of the four strata defined by the combinations of minority concentration and mailable status, telephone numbers were subsampled at different rates. In the low minority stratum, telephone numbers in the mailable substratum were sampled at a rate about 72 percent higher than numbers in the nonmailable substratum; in the high minority stratum, telephone numbers in the mailable substratum were sampled at a rate about twice as high as that used for numbers in the nonmailable substratum.
In this manner, a sample of 206,999 was initially selected for NHES:2005.8 The remaining
142,999 telephone numbers from the first phase sample of 349,998 were held in reserve. Assuming that 49 percent of the sampled telephone numbers would belong to households and assuming a Screener unit response rate of 65 percent, it was expected that about 59,380 screening interviews would be completed. For example, in table 3-1, 25,264 Screeners were expected to be completed in stratum 1 (mailable, high minority). This was calculated by taking the final NHES:2005 phase 2 allocation to stratum 1 (51,487
8 The sample of 206,999 was selected using different rates for four strata. These strata were defined using exchange level classification of minority status and the telephone number level of mailable status, as follows: mailable high minority, mailable low minority, non-mailable high minority, and non-mailable low minority. Subsampling rates for each stratum were determined by the target sample sizes. All mailable telephone numbers were retained in the subsample. Non-mailable telephone numbers were subsampled at rates of approximately 58 percent for high minority and 51 percent for low minority.

NHES:2005 Public-Use Data File User’s Manual Volume I: Study Overview and Methodology
20
telephone numbers) and multiplying by the expected residency rate (84 percent) to get the approximate number of residential telephone numbers (43,249). For the 60 percent of those residential numbers that were randomly designated to receive the standard protocol (see section 4.1 for details on the standard protocol), a 69 percent expected response rate was used to estimate the expected number of completed Screeners; for the remaining 40 percent, a 43 percent initial cooperation rate was used to estimate the expected number of completed Screeners.9 These calculations result in a total of 25,264 expected completed Screeners10 for stratum 1. However, after the release of the initial sample of 206,999 telephone numbers, it was determined that the residency rates in the mailable strata were lower than expected.11 Thus, an additional 34,000 telephone numbers, subsampled from the 142,999 numbers in the reserve sample at the same rates used for the original sample, were released. The total number of telephone numbers released for the study was 240,999, including the 34,000 reserve telephone numbers. The Screener unit response rate was 67 percent, and the number of households with completed screening interviews was 58,140. Table 3-1. Expected number of completed screeners, by sampling stratum: 2005
Stratum
Final NHES:2005
phase 2 allocation
Expected residency
rate(percent)
Expected Screener
response rate(percent)
Expected initial
cooperation rate (percent)
Expected number of completed Screeners
Total 206,999 † † † 59,380
1 (Mailable, High minority) 51,487 84 69 43 25,264 2 (Mailable, Low minority) 55,079 85 73 47 29,168 3 (Not mailable, High minority) 54,252 11 58 38 2,901 4 (Not mailable, Low minority) 46,181 9 59 38 2,048
† Not applicable. SOURCE: U.S. Department of Education, National Center for Education Statistics, National Household Education Surveys Program (NHES), 2005.
3.3 Sampling Within Households
To limit burden on respondents, a within-household sampling scheme was developed to control the number of persons sampled for extended interviews in each household. In all households with children ages 15 or younger, children were enumerated. To determine whether adults would be enumerated, the sample of telephone numbers was randomly divided into three groups. The first group (80,854 telephone numbers or approximately one-third of the sample) was designated for adult enumeration. The second group (40,066 telephone numbers or about one-sixth of the sample) was designated for adult enumeration only if there were no eligible children in the household. The third group (120,079 telephone numbers or about one-half of the sample) was designated for no adult enumeration.
Once the enumeration of the appropriate household members was completed in the Screener, the
sampling of household members for the extended interviews was done by computer. The ECPP and ASPA interviews were conducted with parents/guardians of sampled children from birth through age 15 who were
9 See sections 4.1.4 and 4.1.5 for details on the subsampling of cases for nonresponse followup. 10 The rates given in table 3-1 and the associated text have been rounded to whole numbers for presentation purposes. However, more significant digits were used in the actual calculations. Therefore, calculations of the expected number of completed Screeners based on the rounded rates do not match the values given in the table. 11 The residency rates in the high minority mailable, low minority mailable, high minority nonmailable, and low minority nonmailable strata were 75 percent, 78 percent, 9 percent, and 8 percent, respectively, compared to expected residency rates of 86 percent, 87 percent, 11 percent, and 9 percent, respectively.

NHES:2005 Public-Use Data File User’s Manual Volume I: Study Overview and Methodology
21
in grade eight or below. In households with one or more preschoolers (children age 3 through 6 and not yet in kindergarten), one child in this age/grade range was sampled. In households with middle school students (sixth through eighth grade), one child in this age/grade range was also sampled. The sampling of infants (newborn through age 2), elementary school children (kindergarten through fifth grade), and adults was conducted using an algorithm designed to attain the sampling rates required to meet the target sample sizes while minimizing the number of interviews per household. The within-household sample size was limited to three eligible children if no adults were to be selected or two eligible children and one eligible adult. No more than one child from any given domain (i.e., infants, preschoolers, elementary students, middle school students) was sampled in any given household. This sampling algorithm was designed to limit the amount of time required to conduct interviews with parents in households with a large number of eligible children. If no children were selected and there were multiple adults with less than a high school diploma/equivalent, up to two adults could be selected.
Table 3-2 gives the expected and actual unit response rates and numbers of completed interviews
for each of the NHES:2005 surveys. The actual number of interviews was less than expected because the observed residency rate was lower than expected. However, the actual Screener unit response rate, which excludes nonresidential telephone numbers, was higher than expected.
Table 3-2. Expected and actual numbers of completed interviews and weighted overall unit
response rates for the NHES:2005 Screener and extended interviews, by survey: 2005
Expected Actual
Interview
Number of completed interviews
Overall unit response rate
(percent)
Number of completed interviews
Overall unit response rate
(percent)
Screener 59,380 65.0 58,140 66.9 ECPP survey 7,714 54.1 7,209 56.4 ASPA survey 11,705 54.1 11,684 56.3 AE survey 10,527 50.1 8,904 47.6
SOURCE: U.S. Department of Education, National Center for Education Statistics, Early Childhood Program Participation (ECPP) Survey of the National Household Education Surveys Program (NHES), 2005; After-School Programs and Activities (ASPA) Survey of the NHES, 2005; and Adult Education (AE) Survey of the NHES, 2005.
Estimates from the October 2001 Current Population Survey (CPS)12 indicated that 30 percent of
all households have at least one child age 15 or below and enrolled in eighth grade or below. Using the within-household sampling algorithm developed for NHES:2005, the expected 59,380 screened households should have yielded sample sizes of 5,078 infants, 4,183 preschoolers, and 14,052 students in kindergarten through eighth grade. Assuming an ECPP interview unit response rate of 83 percent, the expected number of completed ECPP interviews was 7,714 (4,230 infant interviews and 3,484 preschooler interviews). The expected number of ASPA interviews, again based on an 83 percent interview unit response rate, was 11,705. The actual number of completed ECPP interviews was 7,209, and the actual number for ASPA was 11,684.13
The AE interview may be used to generate estimates for all civilian, noninstitutionalized persons age 16 or older and not enrolled in grade 12 or below. Based on the sampling algorithm, the expected 59,380 screened households were expected to yield 13,610 sampled adults. Assuming an AE interview unit response rate of 77 percent, the expected number of completed AE interviews was 10,527.
12 The Current Population Survey (CPS) is a monthly survey conducted by the Bureau of the Census. 13 The actual unit response rates for the ECPP and ASPA surveys were both 84 percent, compared to the expected unit response rate of 83 percent for both surveys. Expected unit response rates were based on experiences in previous NHES collections.

NHES:2005 Public-Use Data File User’s Manual Volume I: Study Overview and Methodology
22
The actual number of completed AE interviews was 8,904. The difference between the expected and observed numbers of interviews was due to the lower-than-expected number of completed Screeners, the lower-than-expected AE interview unit response rate,14 and a lower-than-expected proportion of adults who were enumerated as adult education participants. In households with children, AE Screener participation rates were 37 percent for adults with a high school diploma or higher (47 percent expected), and 10 percent for adults with less than a high school diploma (16 percent expected). In households without children, AE Screener participation rates were 46 percent for adults with a high school diploma or higher (57 percent expected), and 19 percent for adults with less than a high school diploma (30 percent expected).
Although the sample yield for the ECPP and AE interviews was lower than expected, the lower
yield did not affect the ability to detect differences between previous surveys and the 2005 surveys in key statistics beyond the thresholds that were used to design the sample. (The key statistics for ECPP and ASPA were type of care arrangement by age/grade grouping for infants, preschoolers, elementary school students, and middle school students and by the race/ethnicity categories of White, non-Hispanic; Black, non-Hispanic; and Hispanic. For adults, the key statistics were overall participation in adult education and participation by type of adult education activity, as well as overall participation by race/ethnicity and level of educational attainment.) However, the reduction in sample size may affect the ability to detect differences in other statistics that were not used to design the sample.
3.4 Weighting Procedures
The objective of the NHES:2005 surveys is to make inferences about the entire civilian, noninstitutionalized population for the domains of interest. Although only telephone households were sampled, the estimates were adjusted to totals of persons living in both telephone and nontelephone households derived from the October 2003 and March 2004 CPS to achieve this goal. The CPS weights were adjusted to population totals that were adjusted to account for the undercoverage from the 2000 decennial census. Any additional undercoverage in the census of special populations, such as the homeless, remains in the totals obtained from the CPS. The weighting procedures are described below.
3.4.1 Household-Level Weights
The primary purpose of the Screener in NHES:2005 was to provide information required to assess the eligibility of household members for an extended interview. Household-level information that is of analytic interest was also collected during the extended interview. Since no data intended for analyses were collected at the household level only, household-level weights were calculated solely for use as a basis for computing person-level weights for the analysis of the extended interview data. In computing household weights, a household base weight was developed to account for the RDD sampling of telephone numbers, including the sampling rate differences by minority concentration stratum and mailable stratum and a factor to reflect the subsampling of Screener cases for nonresponse follow-up. This weight was adjusted for Screener nonresponse15 and then adjusted for households that had more than one telephone number, hence more than one chance of being included in the sample. A CHAID analysis was run to identify
14 The actual unit response rate for the AE survey was 71 percent, compared to the expected rate of 77 percent. 15 Characteristics used in household nonresponse adjustment included whether an address match was obtained for the telephone number, whether an answering machine message was left at the household, percentage homeowners in the telephone exchange, percentage White in the telephone exchange, percentage Hispanic in the telephone exchange, percentage Black in the telephone exchange, percentage high school graduates in the telephone exchange, percentage renters in the telephone exchange, MSA status, census region, census division, median home value in the telephone exchange, and percentage of households with income $75,000 or more in the telephone exchange.
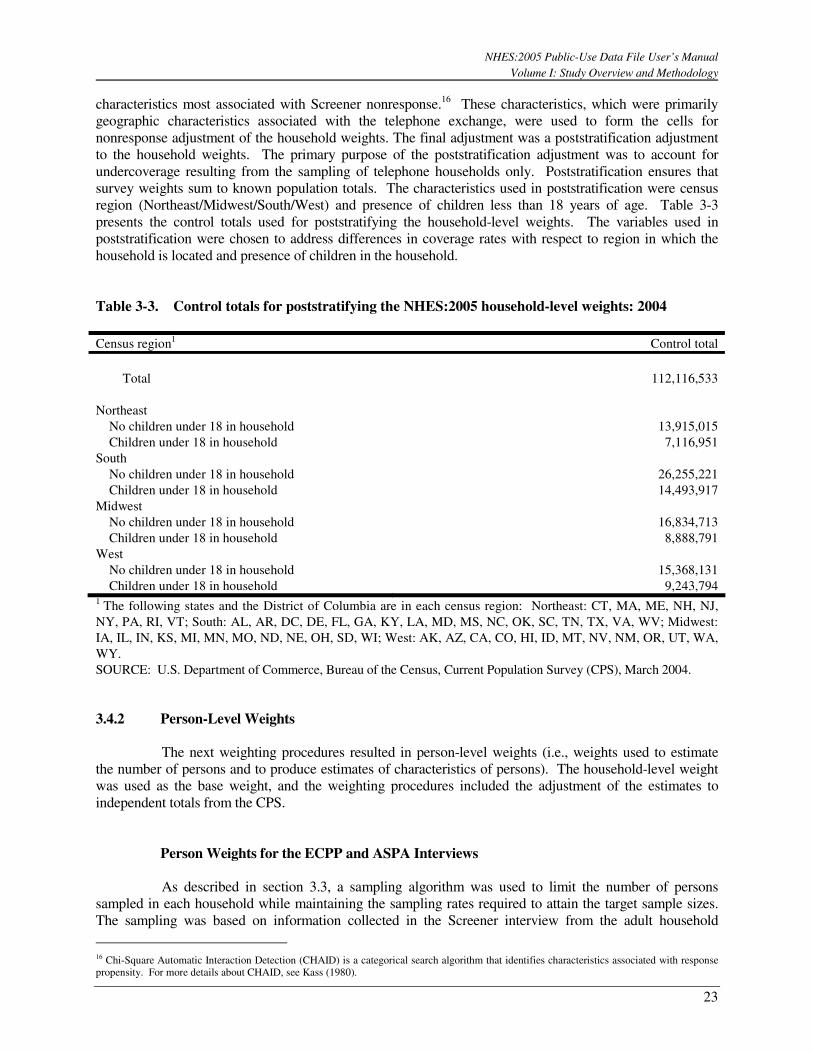
NHES:2005 Public-Use Data File User’s Manual Volume I: Study Overview and Methodology
23
characteristics most associated with Screener nonresponse.16 These characteristics, which were primarily geographic characteristics associated with the telephone exchange, were used to form the cells for nonresponse adjustment of the household weights. The final adjustment was a poststratification adjustment to the household weights. The primary purpose of the poststratification adjustment was to account for undercoverage resulting from the sampling of telephone households only. Poststratification ensures that survey weights sum to known population totals. The characteristics used in poststratification were census region (Northeast/Midwest/South/West) and presence of children less than 18 years of age. Table 3-3 presents the control totals used for poststratifying the household-level weights. The variables used in poststratification were chosen to address differences in coverage rates with respect to region in which the household is located and presence of children in the household.
Table 3-3. Control totals for poststratifying the NHES:2005 household-level weights: 2004 Census region1 Control total
Total 112,116,533
Northeast No children under 18 in household 13,915,015 Children under 18 in household 7,116,951 South No children under 18 in household 26,255,221 Children under 18 in household 14,493,917 Midwest No children under 18 in household 16,834,713 Children under 18 in household 8,888,791 West No children under 18 in household 15,368,131 Children under 18 in household 9,243,794 1 The following states and the District of Columbia are in each census region: Northeast: CT, MA, ME, NH, NJ, NY, PA, RI, VT; South: AL, AR, DC, DE, FL, GA, KY, LA, MD, MS, NC, OK, SC, TN, TX, VA, WV; Midwest: IA, IL, IN, KS, MI, MN, MO, ND, NE, OH, SD, WI; West: AK, AZ, CA, CO, HI, ID, MT, NV, NM, OR, UT, WA, WY. SOURCE: U.S. Department of Commerce, Bureau of the Census, Current Population Survey (CPS), March 2004. 3.4.2 Person-Level Weights
The next weighting procedures resulted in person-level weights (i.e., weights used to estimate the number of persons and to produce estimates of characteristics of persons). The household-level weight was used as the base weight, and the weighting procedures included the adjustment of the estimates to independent totals from the CPS.
Person Weights for the ECPP and ASPA Interviews
As described in section 3.3, a sampling algorithm was used to limit the number of persons sampled in each household while maintaining the sampling rates required to attain the target sample sizes. The sampling was based on information collected in the Screener interview from the adult household
16 Chi-Square Automatic Interaction Detection (CHAID) is a categorical search algorithm that identifies characteristics associated with response propensity. For more details about CHAID, see Kass (1980).

NHES:2005 Public-Use Data File User’s Manual Volume I: Study Overview and Methodology
24
member who responded to the Screener, and the eligibility of the sampled children was later verified or updated when the parent/guardian most knowledgeable about the child responded to the ECPP or ASPA interviews. Because sampling eligibility was defined in terms of the data collected in the Screener, the weighting procedures were developed with possible misclassification of children according to grade—resulting in a change in interview path—taken into account so that the estimates would not incur bias due to misclassification.
The same methodology was used for creating person-level weights for the ECPP interview and for the ASPA interview. Additionally, the same variables were used to create cells for nonresponse adjustment and for raking (a statistical procedure described below). With the exception of the final raking adjustment, the weighting adjustments were performed simultaneously but independently for the two surveys.17 The first step in developing the person weights for the ECPP and ASPA surveys was to account for the probability of sampling the child’s domain in the given household. For example, if there was one preschooler, one elementary school child (enrolled in kindergarten through fifth grade), and one middle school child (enrolled in sixth through eighth grade), then the preschooler and the middle school child were sampled with certainty, and the elementary school child was sampled with probability two-thirds; the domain sampling adjustment factors for the preschooler and the middle school child were 1, and the factor for the elementary school child (if sampled) was 1.5 [=1/(2/3)]. The second adjustment accounted for the probability of sampling the child from among all eligible children in the given domain. For example, if there were three preschoolers in the household, then one of the three was sampled, and the adjustment was 3, which is the reciprocal of the probability of selecting the child from among all children in that domain. The application of these two adjustments to the household weight created a person-level base weight for the ECPP and the ASPA interviews.
The next step involved adjusting the person-level base weight for nonresponse to the ECPP or ASPA interviews. Nonresponse adjustment cells were created using age/grade combinations: children age 0, children age 1, children age 2, unenrolled children ages 3 through 6, preschoolers, kindergartners, and children enrolled in each single grade for grade 1 through grade 8; enrolled children with no grade equivalent were included in the cell containing the modal grade for their age; that is, they were assigned to the grade in which most children their age are enrolled. For each cell, the ratio of the weighted number of eligible sampled children to the weighted number of responding children was then computed. This ratio was multiplied by the person-level base weight to create the nonresponse-adjusted person-level ECPP and ASPA interview weight.
The final stage of weighting for the ECPP and ASPA interviews was a raking adjustment. Raking was proposed by Deming and Stephan (1940) as a way to ensure consistency between complete counts and sample data from the 1940 U.S. census. The raking procedure typically improves the reliability of survey estimates, and also corrects for the bias due to households or persons not covered by the survey (e.g., households without telephones and households with unlisted telephone numbers belonging to zero-listed telephone banks). The raking procedure is carried out in a sequence of adjustments: first, the weights are adjusted to sum to the totals on one marginal distribution (or dimension) and then the adjusted weights are further adjusted to sum to the totals on the second marginal distribution, and so on. One sequence of adjustments to the marginal distributions is known as a cycle or iteration. The procedure is repeated until convergence of weighted totals is achieved.
The raking procedure for the ECPP and ASPA weights involved raking the nonresponse-
adjusted person-level weights to national totals obtained using the percentage distributions from the October 2003 CPS and the total number of children from the March 2004 CPS. The October 2003 CPS contains variables not available on the March 2004 CPS, but the totals in the latter are more current. In the procedure used in NHES:2005, the control total for a raking cell is the proportion in that cell from the October 2003
17 The final raking adjustments were performed independently on the ECPP and ASPA weights but were not done simultaneously.

NHES:2005 Public-Use Data File User’s Manual Volume I: Study Overview and Methodology
25
CPS multiplied by the estimate of the total number of children from the March 2004 CPS. The three raking dimensions used for the ECPP and ASPA interview weights were a cross between race/ethnicity of the child (Black, non-Hispanic alone/Hispanic/other) and household income categories ($10,000 or less/$10,001–$25,000/$25,001 or more), a cross of census region (Northeast/Midwest/South/West) and urbanicity (urban/rural), and a cross of home tenure (rent/own or other) and age or grade of child (with those enrolled in school but having no grade equivalent assigned to the modal grade for their age). These raking dimensions were used because they include important analysis variables (e.g., grade) and characteristics that have been shown to be associated with telephone coverage (e.g., race/ethnicity). Tables 3-4 and 3-5 show the control totals used for raking the ECPP and ASPA interview weights.
Once the procedures described earlier were completed, estimates were produced for the
surveys. As a standard practice in NHES, estimates are compared to other sources to assess the credibility of the NHES weights. When this comparison was done, a discrepancy was found in estimates of the number of 5-year-olds. The estimate of 3,464,442 from the combined ECPP-NHES:2005 and ASPA-NHES:2005 surveys was considerably lower than the estimate of 3,867,123 from the CPS. Concerns about a similar discrepancy between the NHES:2001 estimate and CPS estimate of the total number of 5-year-olds resulted in a detailed investigation into the reasons for this and an evaluation of alternative sets of raking dimensions; however, after reviewing the results of the evaluation, it was decided that the original weights (rather than any of the alternative weights) would be used for NHES:2001. Details of this investigation are given in Nolin et al. (2004).
As noted above, the CPS has traditionally been the source of the control totals used in the
raking adjustments for NHES surveys. In January 2003, a change was made to the CPS weighting methodology that had an effect on estimates of single year of age totals for young children. In light of the NHES:2001 evaluation of using age and grade in raking and the implications of the change in CPS weighting methodology, further evaluation was done on four sets of possible weights for ECPP and ASPA for NHES:2005.18 The only differences among the sets are the variable(s) used in the age/grade by tenure raking dimension and the sources of the control totals for that dimension. For the control totals for that dimension, an alternative source that was considered was the Census Bureau’s American Community Survey (ACS).
18 An alternative set of weights was examined for NHES:2001 using single year of age and home tenure by grade as separate dimensions but was not used due to highly variable weights and the interaction between age and grade in the raking procedure.

NHES:2005 Public-Use Data File User’s Manual Volume I: Study Overview and Methodology
26
Table 3-4. Control totals for raking the ECPP-NHES:2005 person-level weights by characteristics used in raking: 2004, 2003
Characteristics used in raking Control total
Total 20,690,936 Race/ethnicity of child by household income
Black, non-Hispanic $10,000 or less 743,810 $10,001–$25,000 813,440 $25,001 or more 1,410,170
Hispanic $10,000 or less 531,439 $10,001–$25,000 1,458,734 $25,001 or more 2,299,570
Other $10,000 or less 763,038 $10,001–$25,000 1,602,754 $25,001 or more 11,067,981
Census region1 by urbanicity
Northeast Urban 2,966,887 Rural 548,976
Midwest Urban 3,482,395 Rural 1,179,129
South Urban 5,469,663 Rural 2,039,995
West Urban 4,435,740 Rural 568,151
Home tenure by age/grade of child
Rent Age 0 1,396,397 Age 1 1,548,475 Age 2 1,465,367 Age 3–6, not enrolled 1,706,834 Nursery/preschool/Head Start 1,428,605
Own or other Age 0 2,122,795 Age 1 2,439,065 Age 2 2,627,587 Age 3–6, not enrolled 2,458,768 Nursery/preschool/Head Start 3,497,043
1 The following states and the District of Columbia are in each census region: Northeast: CT, MA, ME, NH, NJ, NY, PA, RI, VT; South: AL, AR, DC, DE, FL, GA, KY, LA, MD, MS, NC, OK, SC, TN, TX, VA, WV; Midwest: IA, IL, IN, KS, MI, MN, MO, ND, NE, OH, SD, WI; West: AK, AZ, CA, CO, HI, ID, MT, NV, NM, OR, UT, WA, WY. NOTE: ECPP-NHES:2005 is the Early Childhood Program Participation Survey of the 2005 National Household Education Surveys Program. SOURCE: U.S. Department of Commerce, Bureau of the Census, Current Population Survey (CPS), March 2004; October 2003.

NHES:2005 Public-Use Data File User’s Manual Volume I: Study Overview and Methodology
27
Table 3-5. Control totals for raking the ASPA-NHES:2005 person-level weights by characteristics used in raking: 2004, 2003
Characteristics used in raking Control total
Total 36,185,760
Race/ethnicity of child by household income
Black, non-Hispanic $10,000 or less 1,120,571 $10,001–$25,000 1,441,227 $25,001 or more 2,952,242
Hispanic $10,000 or less 640,362 $10,001–$25,000 2,021,901 $25,001 or more 3,977,191
Other $10,000 or less 1,055,447 $10,001–$25,000 2,661,649 $25,001 or more 20,315,170
Census region1 by urbanicity
Northeast Urban 5,459,121 Rural 1,010,126
Midwest Urban 6,077,109 Rural 2,057,692
South Urban 9,343,212 Rural 3,484,694
West Urban 7,759,883 Rural 993,923
Home tenure by age/grade of child
Rent Transitional kindergarten/kindergarten/pre-1st grade 1,172,709 1st grade 1,241,892 2nd grade 1,169,473 3rd grade 1,234,069 4th grade 1,201,120 5th grade 1,209,907 6th grade 1,091,350 7th grade 1,177,271 8th grade 983,442
Own or other Transitional kindergarten/kindergarten/pre-1st grade 2,544,716 1st grade 2,876,163 2nd grade 2,730,312 3rd grade 2,808,678 4th grade 2,678,220 5th grade 2,883,722 6th grade 3,055,528 7th grade 3,005,875 8th grade 3,121,313
1 The following states and the District of Columbia are in each census region: Northeast: CT, MA, ME, NH, NJ, NY, PA, RI,
VT; South: AL, AR, DC, DE, FL, GA, KY, LA, MD, MS, NC, OK, SC, TN, TX, VA, WV; Midwest: IA, IL, IN, KS, MI, MN, MO, ND, NE, OH, SD, WI; West: AK, AZ, CA, CO, HI, ID, MT, NV, NM, OR, UT, WA, WY. NOTE: ASPA-NHES:2005 is the After-School Programs and Activities Survey of the 2005 National Household Education Surveys Program. SOURCE: U.S. Department of Commerce, Bureau of the Census, Current Population Survey (CPS), March 2004; October 2003.

NHES:2005 Public-Use Data File User’s Manual Volume I: Study Overview and Methodology
28
The four sets of possible weights considered in the NHES:2005 evaluation are as follows:
• The original weights: These were computed based on the standard NHES approach of using
age for unenrolled children and grade for enrolled children. The CPS was used as the source of all control totals. Census Bureau changes for weighting very young children were reflected in the control totals.
• Alternative 2 weights: These were computed using age alone, with the CPS as the source of all control totals.
• Alternative 3 weights: These were computed using age alone, with the ACS as the source of the age distribution, and the CPS as the source of all other control totals.
• Alternative 4 weights: These were computed using age by an indicator of whether the child was above versus at or below the modal grade for his or her age, with the ACS as the source of the age by above/at or below the modal grade distribution, and the CPS as the source of all other control totals. Full sets of full-sample and jackknife replicate19 weights were produced for alternatives 2
and 3. However, the raking procedure failed to converge for alternative 4 due to an adjustment cell with no observations for a particular jackknife replicate. As part of this evaluation, a set of selected estimates was reproduced for each raking alternative. A central design feature of NHES is to allow for trend analyses. To make this possible, weighting schemes need to be consistent over time. Alternative 3 weights were the most promising substitute for the original weights. However, the ACS data from which the weights were derived were atypical for ACS. Knowledge that the ACS source data for the weights could change significantly before the next NHES was collected led to the dropping of alternative 3 from consideration for NHES:2005. Anticipating a shift to ACS-based weights in 2007 led to the decision not to pursue alternative 2 for NHES:2005 since such a change would result in three different weighting schemes across three consecutive NHES collections. Therefore, the original weights were selected for NHES:2005.
Person Weights for the AE Interview
Four adjustments were made to the household-level weight to compute the person-level weight for the AE interview. The first adjustment accounted for the probability of sampling adults in the household. As described in section 3.3, a sampling algorithm was used to limit the number of persons sampled in each household while maintaining the sampling rates required to attain the target sample sizes. For example, if there were no eligible children in the household and there were three eligible adults—one adult education participant and two adult education nonparticipants, all with less than a high school diploma—then with probability 0.5, up to two adults were sampled at the first stage.20 At the second stage, in which adults were subsampled based on adult education participation status, the adult education participant domain was sampled with probability 1, and the nonparticipant with probability 0.5. In such an example, if one adult education participant and one nonparticipant were sampled, then the domain sampling adjustment factor for the participant was 2 [=1/(0.5·1)], and the domain sampling adjustment factor for the nonparticipant was 4 [=1/(0.5·0.5)]. The second adjustment was used to account for the probability of selecting the adult from among all adults in the household in the sampled educational attainment by participation domain (e.g., adult education participants with less than a high school diploma). This adjustment depended upon the number of eligible adults in the domain and the number to be selected. In the above example, the factor for sampling an adult education participant was 1 and the factor for sampling one 19 The use of the jackknife replicate weights to compute standard errors is discussed in section 3.5. 20 The sampling of adults was done in two stages. At the first stage, adults were sampled based on educational attainment. At the second stage, adults were subsampled based on educational attainment and adult education participation status (as reported by the Screener respondent). In households without children, it was possible for two adults to be sampled.

NHES:2005 Public-Use Data File User’s Manual Volume I: Study Overview and Methodology
29
of the two adult education nonparticipants was 2 [=1/0.5]. The application of these two adjustments to the household weight created a person-level base weight for the AE interview.
The third adjustment for the AE interview person-level weights was the nonresponse adjustment. Four variables were used to create the nonresponse adjustment cells. The first was an indicator of whether the sampled adult was the Screener respondent, the second was the educational attainment of the adult (whether the adult had a high school diploma, as reported by the Screener respondent), the third was the adult education participation status of the adult (as reported by the Screener respondent), and the fourth was the sex of the adult. These variables were used because they are available for all sampled adults (both respondents and nonrespondents) and were associated with AE interview response propensity. Within each cell, the ratio of the weighted number of sampled adults to the weighted number of responding adults was computed and used to create the nonresponse-adjusted person-level weight.
The nonresponse-adjusted weight was adjusted in the final step to national totals using a raking procedure. (Refer to the subsection “Person Weights for the ECPP and ASPA Interviews” above for a general description of the raking methodology.) The control totals for raking the AE weights were obtained from the March 2004 CPS. The four dimensions for the raking cells were a cross of the adult’s race/ethnicity (Black, non-Hispanic alone/Hispanic/other) and household income ($10,000 or less/$10,001 – $25,000/$25,001 or more), a cross of age (16–29 years/30–49 years/50 years or more) and sex, a cross of Census region (Northeast/Midwest/South/West) and urbanicity (urban/rural), and a cross of home tenure (rent/own or other) and highest educational attainment (less than high school diploma/high school diploma or equivalent/some college). These raking dimensions were used because they include important analysis variables (e.g., educational attainment) and characteristics that have been shown to be associated with telephone coverage (e.g., race/ethnicity) (Anderson, Nelson, and Wilson 1998). The control totals used for raking the AE interview person-level weights are given in table 3-6. 3.5 Computing Sampling Errors
In surveys with complex sample designs, such as NHES:2005, direct estimates of the sampling errors assuming a simple random sample will typically underestimate the variability in the estimates. The NHES:2005 sample design and estimation included procedures that deviate from the assumptions of simple random sampling, such as oversampling in areas with higher concentrations of minorities, sampling persons within households with differential probabilities, and raking to control totals.
One method for computing sampling errors to reflect these aspects of the sample design and estimation is the replication method. Replication involves splitting the entire sample into a set of groups or replicates based on the actual sample design of the survey. The survey estimates can then be computed for each of the replicates by creating replicate weights that mimic the actual sample design and estimation procedures used in the full sample. The variation in the estimates computed from the replicate weights can then be used to estimate the sampling errors of the estimates from the full sample. Appendix B contains a summary of weighting and sample variance estimation variables for NHES:1991–2005.

NHES:2005 Public-Use Data File User’s Manual Volume I: Study Overview and Methodology
30
Table 3-6. Control totals for raking the AE-NHES:2005 person-level interview weights by characteristics used in raking: 2004
Characteristics used in raking Control total
Total 211,607,007
Race/ethnicity by household income
Black, non-Hispanic $10,000 or less 2,946,098 $10,001–$25,000 5,097,877 $25,001 or more 15,393,252
Hispanic $10,000 or less 1,840,879 $10,001–$25,000 5,523,643 $25,001 or more 18,736,377
Other $10,000 or less 8,320,905 $10,001–$25,000 23,218,060 $25,001 or more 130,529,916
Age by sex
16–29 years Male 22,067,398 Female 22,210,269
30–49 years Male 41,833,569 Female 43,258,146
50 years or more Male 37,694,658 Female 44,542,967
Census region1 by urbanicity
Northeast Urban 34,011,049 Rural 6,293,221
Midwest Urban 35,625,729 Rural 12,062,770
South Urban 55,175,269 Rural 20,578,462
West Urban 42,426,339 Rural 5,434,168
Home tenure by highest educational attainment
Rent Less than high school diploma 12,926,239 High school diploma or equivalent 28,662,720 Some college 14,098,478
Own or other Less than high school diploma 18,925,344 High school diploma or equivalent 80,402,073 Some college 56,592,153
1 The following states and the District of Columbia are in each census region: Northeast: CT, MA, ME, NH, NJ, NY, PA, RI, VT; South: AL, AR, DC, DE, FL, GA, KY, LA, MD, MS, NC, OK, SC, TN, TX, VA, WV; Midwest: IA, IL, IN, KS, MI, MN, MO, ND, NE, OH, SD, WI; West: AK, AZ, CA, CO, HI, ID, MT, NV, NM, OR, UT, WA, WY. NOTE: AE-NHES:2005 is the Adult Education Survey of the 2005 National Household Education Surveys Program. SOURCE: U.S. Department of Commerce, Bureau of the Census, Current Population Survey (CPS), March 2004.

NHES:2005 Public-Use Data File User’s Manual Volume I: Study Overview and Methodology
31
A total of 80 replicates were defined for NHES:2005 based on the sampling of telephone
numbers. This number was chosen to provide reliable estimates of sampling errors with reasonable data processing costs. The specific replication procedure used for NHES:2005 was a jackknife replication method (Wolter 1985). It involved dividing the sample into 80 random subsamples (replicates) for the computation of the replicate weights. Replicate weights were created for each of the 80 replicates using the same estimation procedures that were used for the full sample. These replicate weights are included in the ECPP file as FEWT1 through FEWT80. In the ASPA interview file, they are FSWT1 through FSWT80, and in the AE interview file, they are FAWT1 through FAWT80. The computation of the sampling errors using these replicate weights can be done easily using the Windows-based software packages WesVar Complex Samples Software, SUDAAN (Shah et al. 1995), AM Statistical Software, or Stata; in WesVar, SUDAAN, or AM the replication method should be specified as JK1; in Stata, the “jackknife” option should be used with the “syvset” statement. The current version of WesVar Complex Samples (version 4) is available from Westat. Information can be obtained at http://www.westat.com/wesvar. A previous version of WesVarPC (version 2.12) is available free of charge at that website or by sending an e-mail message to [email protected]. Please note that version 2.12 of WesVarPC is no longer being updated or revised. Information on obtaining SUDAAN can be found at http://www.rti.org/sudaan, the AM software is available at http://am.air.org (the software is free of charge), and information about the Stata software is available at http://www.stata.com.
Another approach to the valid estimation of sampling errors for complex sample designs is to
use a Taylor series approximation to compute sampling errors. To produce standard errors using a Taylor series program, such as SUDAAN or the survey data analysis procedures (PROC SURVEYMEANS and PROC SURVEYREG) in SAS version 8, two variables are required to identify the stratum and the primary sampling unit (PSU). The stratum-level variable is the indicator of the variance estimation stratum from which the unit (telephone number or sampled person) was selected. The PSU is an arbitrary numeric identification number for the unit within the stratum. The PSU and stratum variables appear on each of the extended interview files. On the ECPP data file, the PSU and stratum variables are called EPSU and ESTRATUM; on the ASPA data file, they are SPSU and SSTRATUM; and on the AE data file, they are APSU and ASTRATUM. These variables can be used in SUDAAN to produce standard errors by specifying that the design is a “with replacement” sample (DESIGN = WR) and that the sampling levels are given by the appropriate stratum and PSU variables. For example, for estimates from the ASPA interview file, use SSTRATUM SPSU in the NEST statement. In the SAS version 8 survey procedures, the stratum and PSU variables are specified in the STRATA and CLUSTER statements, respectively. (Information on obtaining SAS version 8 can be found at http://www.sas.com.)
Stata, another software package that uses Taylor series methods, also uses the PSU and stratum
variables to define the units needed for computation. (Information on obtaining Stata is available at http://www.stata.com.) To specify the stratum, PSU, and weight variables in Stata use the svyset strata, svyset psu, and svyset pweight commands. For example, for estimates from the ASPA interview file, use the following commands to specify these design parameters:
svyset strata sstratum svyset psu spsu svyset pweight fswt The full sample weight to be used for analysis of the ECPP interview file is FEWT. For the
ASPA interview file, the full sample weight is FSWT. For the AE interview file, the full sample weight is FAWT.
Additionally, both SPSS Complex Samples and AM Statistical Software can be used to compute
standard errors using a Taylor series approximation.

NHES:2005 Public-Use Data File User’s Manual Volume I: Study Overview and Methodology
32
Data users should be aware that the use of different approaches or software packages in the
calculation of standard errors may result in slightly different standard errors. Standard errors computed using the replication method and the Taylor series method are nearly always very similar, but not identical. For a discussion of this issue see Broene and Rust (2000). 3.6 Approximate Sampling Errors
Although calculating the sampling errors using the methods described earlier is recommended for many applications, simple approximations of the sampling errors may be valuable for some purposes. One such approximation is discussed next.
Most statistical software packages compute standard errors of the estimates based upon simple random sampling assumptions. The standard error from this type of statistical software can be adjusted for the complexity of the sample design to approximate the standard error of the estimate under the actual sample design used in the survey. For example, the variance of an estimated proportion in a simple random sample is the estimated proportion (p) times its complement (l-p) divided by the sample size (n). The standard error is the square root of this quantity. This estimate can be adjusted to more closely approximate the standard error for the estimates from NHES:2005.
A simple approximation of the impact of the sample design on the standard errors of the estimates that has proved useful in previous NHES surveys and in many other surveys is to adjust the simple random sample standard error estimate by the root design effect (DEFT). The DEFT is the ratio of the standard error of the estimate computed using the replication method discussed earlier to the standard error of the estimate under the assumptions of simple random sampling. An average DEFT is computed by estimating the DEFT for a number of estimates and then averaging. A standard error for an estimate can then be approximated by multiplying the simple random sample standard error estimate by the mean DEFT.
In complex sample designs, like NHES:2005, the DEFT is typically greater than 1 due to the clustering of the sample and the differential weights attached to the observations. In NHES:2005, both of these factors contributed to making the average DEFT greater than 1. (See appendix B for the DEFT for each data file of NHES:1991–2005.)
The average DEFT computed for estimates from the three surveys in NHES:2005 ranged from 1.3 to 1.7. For the ECPP survey, the average DEFT was 1.4 overall. For estimates by path of child (infant or preschooler), the average DEFT was 1.4 for infants and 1.3 for preschoolers. For estimates by race/ethnicity (White, non-Hispanic; Black, non-Hispanic; Hispanic), the average DEFT for each race/ethnicity subgroup was 1.4. Therefore, a DEFT of 1.4 is recommended to approximate the standard error of overall estimates from the ECPP survey. For estimates by race/ethnicity or by path, a DEFT of 1.4 is also recommended, with the exception of estimates of characteristics of preschoolers; for this subgroup, a DEFT of 1.3 is recommended.
The average DEFT for estimates from the ASPA survey was 1.4. For estimates by path of student (grades kindergarten through 8 or homeschoolers), the average DEFT was 1.4 for children enrolled in grades kindergarten through 8 in regular school, and 1.3 for homeschoolers. For estimates by race/ethnicity, the average DEFT was 1.3 for White, non-Hispanics; 1.5 for Black, non-Hispanics; and 1.4 for Hispanics. Therefore, a DEFT of 1.4 is recommended to approximate the standard error of overall estimates from the ASPA survey, and the recommended DEFTs for subgroup estimates are those stated here.

NHES:2005 Public-Use Data File User’s Manual Volume I: Study Overview and Methodology
33
For estimates from the AE survey, the average DEFT was 1.6. For estimates by race/ethnicity, the average DEFT was 1.5 for White, non-Hispanics and for Black, non-Hispanics; and 1.6 for Hispanics. For estimates by adult education participation status, the average DEFT was 1.5 for nonparticipants and 1.6 for participants. For estimates by educational attainment, the average DEFT was 1.4 for adults with exactly a high school diploma or equivalent and for adults with a bachelor’s degree or higher; 1.5 for adults with an associate’s degree; and 1.7 for adults with less than a high school diploma. Therefore, a DEFT of 1.6 is recommended to approximate the standard error of overall estimates from the AE survey, and the recommended DEFTs for subgroup estimates are those stated here.
As stated earlier, the average DEFT can be used to approximate the standard error of an
estimate. An example of how to do this on a percentage estimate derived using a statistical package like SAS21 or SPSS is as follows. If a weighted estimate of 44 percent is obtained for some characteristic in the AE file (suppose that 44 percent of adults participated in adult education activities, excluding full-time credential programs), then an approximate standard error can be developed in a few steps. First, obtain the simple random sample standard error for the estimate using the weighted estimate in the numerator and the unweighted sample size in the denominator: the standard error for this 44 percent statistic would be 0.53 percent (the square root of (44 x 56)/8,904, where the weighted estimate (p) is 44 percent, 56 is 100 minus the estimated percent (1-p), and the unweighted sample size (n) is 8,904). The approximate standard error of the estimate from NHES:2005 is this quantity (the simple random sample standard error) multiplied by the DEFT for the AE file estimates of 1.6. In this example, the approximate standard error would be 0.84 percent (1.6 x 0.53 percent).
The approximate standard error for a mean can be developed using a related procedure. The three steps required to do so are demonstrated using an example from the ASPA file. First, the mean is estimated using the full sample weight and a standard statistical package like SAS or SPSS. Second, the simple random sample standard error is obtained through a similar, but unweighted, analysis. Third, the standard error from the unweighted analysis is multiplied by the mean DEFT for the ASPA file estimates of 1.4 to approximate the standard error of the estimate under the NHES:2005 design. For example, suppose the average total number of hours per week students in kindergarten through eighth grade spend in self-care after school is 4.6 hours and the simple random sampling standard error (unweighted) is 0.11 hours. Then, the approximate standard error for the estimate would be 0.15 hours (0.11 hours x 1.4).
Users who wish to adjust the standard errors for estimates of parameters in regression models
should follow a procedure similar to that discussed for means, above. Specifically, the parameters in the model can be estimated using a weighted analysis in a standard statistical software package such as SAS or SPSS. A similar, but unweighted, analysis will provide the simple random sample standard errors for these parameter estimates. The standard errors can then be multiplied by the DEFT to arrive at an approximate standard error for the NHES:2005 design. For example, if a given parameter in a model involving items from the ECPP file has a weighted estimate of 2.33 and an unweighted simple random sample standard error of 0.45, then the approximate standard error would be 1.4 x 0.45 = 0.63.
Alternatively, the final weight can be adjusted to reflect the DEFT before the parameter
estimates are calculated in a standard statistical software package such as SAS or SPSS. To do this, first sum the values of the final weights for the sample of interest. For instance, for an analysis of all infants and preschoolers, sum the final weights for all 7,209 cases on the ECPP file. Next, divide this sum by the number of cases to generate an average final weight. (In this example, the number of cases is 7,209.) Third, multiply the average final weight by the square of the DEFT for the population of interest. (In the above example, the average final weight would be multiplied by the square of 1.4, or 1.96.) Fourth, divide the final weight by the adjusted average weight and save the quotient as a new final weight. (In the above example, the new final weight is equal to the final weight divided by the product of 1.96 and the average
21 Here, the reference to “SAS” applies to SAS version 6.12 or earlier versions, or the nonsurvey procedures in SAS version 8 or higher.

NHES:2005 Public-Use Data File User’s Manual Volume I: Study Overview and Methodology
34
final weight.) Finally, weight the analysis by this new final weight. The standard errors generated in the analysis will approximate the standard errors correctly adjusted for design effects.
It should be noted that direct computation of the standard errors is always recommended when the statistical significance of statements would be affected by small differences in the standard errors. 3.7 Imputation
In NHES:2005, as in most surveys, the responses to some data items were not obtained for all interviews. There are numerous reasons for item nonresponse. Some respondents do not know the answer for the item or do not wish to respond for other reasons. Some item nonresponse arises when an interview is interrupted and not continued later, leaving items at the end of the interview blank. Item nonresponse may also be encountered because responses provided by the respondent are not internally consistent, and this inconsistency is not discovered until after the interview is completed. In these cases, the items that were not internally consistent were set to missing.
For most of the data items collected in NHES:2005, the item response rate was very high. The median item response rate for items from the ECPP interview was 99.35 percent; for the ASPA interview data, 99.19 percent; and for the AE interview, 98.80 percent. (Item response rates are discussed in more detail in chapter 4.) Despite the high item response rates, data items with missing data on the file were imputed. The imputations were done for two reasons. First, complete responses were needed for the variables used in developing the sampling weights. Second, users will be computing estimates employing a variety of methods and complete responses should aid their analyses.
A hot-deck procedure was used to impute missing responses (Kalton and Kasprzyk 1986). In this approach, for each item that was imputed, the entire file was sorted into cells defined by characteristics of households or respondents that are likely to be associated with the item. The variables used in the sorting also included any variables involved in the skip pattern for the item. Many of these sort order variables were created solely for imputation purposes and are not on the data files.
The standard set of sort order variables for the household-level items collected in the ECPP, ASPA, and AE surveys consisted of the following:
• CENREG—the census region in which the household was located;
• HINCMRNG or HINCOME—household income category (broad or specific, respectively);
• KIDINHH—a variable derived specifically for imputation from the age (AGE) of household members indicating whether or not children under age 18 resided in the household; and
• HOWNHOME—whether the home was rented versus owned or another arrangement. The standard sort order variables for the person-level items on the ECPP and ASPA interview files were as follows:
• ALLGRADR—a variable derived specifically for imputation that indicates the grade/grade equivalent of the sampled child;
• SEX—sex of the sampled child;
• PARGRADS—a variable derived specifically for imputation that indicates the highest education level attained by either parent in the household as less than high school diploma,

NHES:2005 Public-Use Data File User’s Manual Volume I: Study Overview and Methodology
35
high school diploma but no bachelor’s degree, or college graduate. This variable was derived from MOMGRADE, MOMDIPL, DADGRADE, and DADDIPL; and
• HHPARNS—a variable derived specifically for imputation from HHMOM and HHDAD indicating whether there were two parents in the household or not.
The standard sort order variables for the person-level items from the AE interview file were as follows:
• PARTIC—a variable derived for specifically for imputation that indicates whether the adult participated in any adult education activities (including full-time postsecondary credential programs) in the last year;
• EDUC—a variable derived specifically for imputation that indicates whether or not the adult has at least a high school diploma or the equivalent;
• AGECAT—a variable derived specifically for imputation from AGE for the respondent with the categories 18 through 29 years, 30 through 49 years, and 50 or older;
• ARACETH—a variable derived specifically for imputation that classifies the respondent as Black, non-Hispanic; Hispanic; or other; and
• HINCOME—the specific household income category.
All of the observations were sorted into cells defined by the responses to the sort variables, and then divided into two classes within the cell depending on whether or not the item was missing. For an observation with a missing value, a value from a randomly selected donor (an observation in the same cell but with the item completed) was used to replace the missing value. After the imputation was completed, edit programs were run to ensure the imputed responses did not violate skip patterns or edit rules. If any violations occurred, the program was adjusted and imputation was rerun, or if only a few cases were affected, they were manually imputed.
For items in repeating segments (i.e., child care arrangement-level items such as NCPLACE1-
NCPLACE4 on the ECPP and ASPA data files and course-level items such as WRCURR1-WRCURR4 on the AE data file), the items were imputed without regard to the segment number. That is, all segments were combined prior to imputation. In the absence of a compelling reason to distinguish among segments, this approach allowed for a larger donor pool to be used.
For some items, the missing values were imputed manually rather than using the hot-deck procedure. In NHES:2005, hand imputation was done (1) to impute certain person-level demographic characteristics that involved complex relationships that would have required extensive programming to impute using a hot-deck procedure; (2) to impute whether a child is homeschooled, attends regular school for some classes, and the number of hours attending regular school; (3) to correct for a small number of inconsistent imputed values; and (4) to impute for a few cases when no donors with matching sort variable values could be found.
For hand imputation of the person-level demographic items and of the homeschooling items, the following three sort variables were used to ensure that all household members were grouped together: state, the three-digit ZIP Code, and the person identification number.
After values had been imputed for all observations with missing values, the distribution of the item prior to imputation, (i.e., the respondents’ distribution) was compared to the post-imputation distributions of the imputed values alone and of the imputed values together with the observed values. There were 75 items (of 612 imputed items) in the ECPP file with response rates of less than 90 percent, 62

NHES:2005 Public-Use Data File User’s Manual Volume I: Study Overview and Methodology
36
items (of 679 imputed items) in the ASPA file, and 63 items (of 484 imputed items) in the AE file. The comparisons revealed similar item distributions pre- and post-imputation. This comparison is an important step in assessing the potential impact of item nonresponse bias and ensuring that the imputation procedure reduces this bias, particularly for items with relatively low response rates (less than 90 percent).
For each data item for which any values were imputed, an imputation flag variable was created.
If the response for the item was not imputed, the imputation flag was set equal to 0. If the response was imputed, the flag was set to either 1, 2, 3, or 4. The value of the imputation flag indicates the specific procedure used to impute the missing value. The assignment of these values is described below.
The procedure for hot-deck imputation only recognizes missing value codes as those that need to be replaced by imputed values. For NHES:2005, these missing codes were -7 = refused, -8 = don’t know, and -9 = not ascertained. Therefore, in some cases, variables that originally equaled -1 (inapplicable) had to be recoded to a missing value code (i.e., -9 = not ascertained) prior to being imputed using the standard hot-deck approach. This was done so that data were consistent with the skip patterns of the questionnaire. For these cases the imputation flag was set to 2. For example, in the ASPA file, if the value of SCHOICE (SD2) equaled -8 for a child, then SDISRCT (SD3) was never asked and thus equaled -1 (inapplicable). During the imputation process for this child, if SCHOICE was imputed to equal 2 (chosen), then SDISRCT had to first be recoded from -1 (inapplicable) to -9 (not ascertained) before the imputation procedure would recognize SDISRCT as a variable that should be imputed to equal either 1 (school is in assigned school district) or 2 (school is not in assigned school district). In this case, the imputation flag for SDISRCT would be set to 2. If an item was imputed manually, the flag was set to 3. The imputation flag was set to 4 if the reported value was “don’t know” prior to imputation using the standard hot-deck approach. In all other cases in which an item was imputed, the imputation flag was set to 1.
The imputation flags were created to enable users to identify imputed values. Users can employ the imputation flag to delete the imputed values, use alternative imputation procedures, or account for the imputation in computation of the reliability of the estimates produced from the dataset. For example, some users might wish to analyze the data with the missing values rather than the imputed values. If there is no imputation flag corresponding to the variable, no values for that variable were imputed. If the imputation flag corresponding to the variable is equal to 1, 2, 3, or 4, the user can replace the imputed response with a missing value to accomplish this goal. This method could also be used to replace the imputed value with a value imputed by some user-defined imputation approach. Finally, if the user wishes to account for the fact that some of the data were imputed when computing sampling errors for the estimates, the missing values could be imputed using multiple imputation methods (Rubin 1987) or imputed so that the Rao and Shao (1992) variance procedures could be used.

NHES:2005 Public-Use Data File User’s Manual Volume I: Study Overview and Methodology
37
4. DATA COLLECTION METHODS AND RESPONSE RATES
4.1 Data Collection Procedures The following sections discuss the procedures used in the data collection phase of the National Household Education Surveys Program of 2005 (NHES:2005), including the use of computer-assisted telephone interviewing (CATI), staff training, interviewer assignments and contact procedures, and quality control. 4.1.1 Special Precollection Procedures Before the beginning of data collection, special procedures were implemented to remove business and nonworking telephone numbers from the sample, and specific subsampling was done that reduced the number of telephone numbers from the full sample of 349,998 telephone numbers originally drawn to the final sample of 240,999 telephone numbers22 that was fielded. In addition, an advance mailing was conducted.
Identification of business and nonworking numbers. In NHES:2005, as in previous NHES administrations, procedures were used prior to data collection to reduce the number of unproductive calls. Prior to NHES:2001, Marketing Systems Group’s (MSG’s) Genesys ID process was used.23 The Genesys ID process included tritone24 checks for nonworking numbers and purging of listed business numbers (i.e., numbers listed in the yellow pages but not in the white pages). In NHES:2001 and NHES:2003, a more extensive procedure, the Genesys ID-PLUS process, was used prior to the field period. With the ID-PLUS utility, a telephone number was dialed by Genesys and allowed to ring up to two times (compared with one ring in the Genesys ID tritone test). If the telephone call was answered, a representative was available to speak to the respondent. In such cases, the representative attempted to ascertain whether the telephone number was a business number.25 For NHES:2005, a more comprehensive prescreening procedure, the Genesys Comprehensive Sample Screening (Genesys-CSS) procedure, was used. Like the Genesys ID and ID-PLUS utilities, the Genesys-CSS utility also included the white and yellow pages matches. The primary differences between Genesys-CSS and the ID-PLUS procedure were enhanced identification of all types of wireless numbers and the predialing of numbers listed in the white pages.26 With the Genesys-CSS utility, each telephone number was classified into one of the following categories:
LB (Listed Business) UR (Unlisted Residence) UB (Unlisted Business) FM (Fax/Modem) LA (Language Barrier)
22 This includes the original sample of 206,999 telephone numbers, plus an additional reserve sample of 34,000 numbers that was released during the field period due to lower-than-expected residency rates. 23 MSG is the vendor that provides the sampling frame for the selection of telephone numbers. Genesys is the name of the system that generates the sampling frame. 24 A tritone is the three-note sound heard when dialing a nonworking telephone number. 25 With the ID-PLUS utility, the telephone numbers in the NHES:2001 and NHES:2003 samples were dialed by Genesys representatives prior to the beginning of the field period in order to help ascertain whether they were nonworking or business numbers. 26 With Genesys-CSS, all telephone numbers not identified as business numbers (including listed residential numbers) are dialed and allowed to ring up to two times, in order to identify business, cellular, and nonworking numbers. The dialing is done during the hours of 9 a.m. to 5 p.m. local time by specially trained agents. All calls are done in English.

NHES:2005 Public-Use Data File User’s Manual Volume I: Study Overview and Methodology
38
NR (No Ring Back) NW (Nonworking) BX (Blocked Exchanges) PM (Privacy Manager27) WR (Wireless) CP (Cell Phone) DK (Undetermined: Residential/No Answer/Busy)
Because the Genesys-CSS method was more comprehensive than the ID-PLUS process, Genesys-CSS was used. Telephone numbers identified by Genesys-CSS as LB, NW, WR, or CP, as well as UB telephone numbers for which no mailing address could be obtained were excluded from dialing. These exclusions amounted to 35 percent of the sample of telephone numbers. All telephone numbers that were not excluded from dialing as a result of the Genesys-CSS results were sent to up to two address vendors to obtain mailing addresses.
Subsampling of telephone numbers. Stratified two-phase sampling was used to select telephone numbers for the final NHES:2005 sample in order to produce more reliable national estimates. In the first phase, a sample of 349,998 telephone numbers was drawn, with telephone numbers in areas with high percentages of Black and Hispanic residents sampled at nearly twice the rates of those in areas with low percentages28 of Black and Hispanic residents. In the second phase, within each minority stratum, the sampled telephone numbers were stratified as mailable or nonmailable according to whether they could be matched to a mailing address.29 Within each of the four strata defined by the combinations of minority concentration and mailable status, telephone numbers were subsampled at different rates. Within each of the minority strata, telephone numbers in the mailable substratum were sampled at rates roughly twice the rate of numbers in the nonmailable substratum. This process resulted in a sample of 206,999 telephone numbers for NHES:2005. During data collection, an additional reserve sample of 34,000 telephone numbers was subsampled using the same rates as for the original sample and was released.
Further subsampling of the original sample was conducted for nonresponse followup. Prior to
data collection, 60 percent of the original sample (called “wave 1”) was designated for nonresponse followup, including refusal conversion, a higher number of calls for noncontact cases, and a higher maximum call limit for telephone numbers at which contact with a household member had been made. The remaining 40 percent of the original sample and the entire reserve sample were not subject to refusal conversion efforts and had a call limit of 14. Advance mailing. Previous NHES experience demonstrates that notifying sampled households in advance of calling them increases cooperation. In an effort to increase Screener-level response, a mailing was conducted for sampled telephone numbers for which an address was obtained from either of two commercial firms. In all, 127,935 telephone numbers were matched with listed addresses; 124,070 telephone numbers with matched addresses were in the final NHES:2005 sample.30 To coordinate the arrival of the letter with the initial call into the household, the mailing to the original sample was conducted in two waves. A brief letter was mailed to the wave 1 sample (approximately 60 percent of the households in the original sample for which addresses had been obtained) during the last week of December 2004. The advance mailing to the second release group (the remaining 40 percent of the original sample) was conducted in mid-January 2005. A later advance mailing was sent to the reserve sample shortly before that sample was released in March 2005. The advance letter was printed on U.S. Department of Education
27 Privacy Manager is a device that works with caller ID to screen and manage incoming calls. 28 High minority areas were defined as having a population that was 20 percent Black or 20 percent Hispanic. 29 Telephone numbers identified as nonworking or business numbers by the Genesys-CSS prescreening process were assigned to the nonmailable stratum. 30 The remaining 3,865 telephone numbers with matched addresses were in the portion of the phase 1 sample that was not released.

NHES:2005 Public-Use Data File User’s Manual Volume I: Study Overview and Methodology
39
(ED) stationery and explained the purpose of NHES:2005, encouraged participation in the study, and offered respondents $5 for calling in on the toll free number to complete a Screener or schedule a callback. Common respondent questions and their answers were printed on the back of the letter. There was no incentive payment in the advance letter; however, if a sampled household refused, the refusal conversion procedure involved sending a first class refusal conversion letter along with a $5 cash incentive prior to the first refusal conversion attempt. The incentive approach taken appeared to be the optimal approach using relatively small incentives based on the NHES:2003 experiment (Brick et al. 2005). 4.1.2 CATI System Applications The use of a CATI system for NHES:2005 included a number of applications that facilitated the implementation of the survey. Briefly, the most salient features of the CATI system for NHES:2005 were as follows:
• Sampling: The use of online sampling through CATI eliminated the need for separate screening and interviewing calls, reducing the cost and the burden on respondents.
• Scheduling: The CATI system was used to feed telephone numbers to the interviewers, maintain a schedule of callback appointments, and reschedule unsuccessful contact attempts to the appropriate day and time.
• Skip patterns: The CATI system was programmed to automatically guide interviewers through the complex skip patterns in the questionnaire, reducing the potential for interviewer error and shortening the questionnaire administration time.
• Copying responses: The CATI system was used to copy responses from one interview to another to prevent unnecessary repetition of questions. For example, when two children with the same parents were sampled in a household, the parent characteristics series and household information items were asked only once. This helped to reduce response burden.
• Monitoring survey progress: The CATI system was programmed to provide automatic status reports throughout data collection. This allowed ongoing monitoring of the survey’s progress.
• Online help: The CATI system was programmed to provide an online help screen for each item in the Screener and extended interviews. These screens, which could be accessed with a keystroke by the interviewer, clarified terminology, explained the intent of questions, and helped the interviewer obtain correct information.
4.1.3 Interviewer Training Interviewers were trained in groups that ranged in size from 18 to 42. Groups were scheduled for training beginning in mid-December 2004 and continuing into the beginning of January 2005. Prior to the NHES:2005 project training, all interviewers had participated in a basic training in general interviewing techniques and the use of the CATI system and automated training in the coding of contact outcomes that typically lasted 8 hours. The first stage of the NHES project training involved a home study video and accompanying materials. The home study component provided an overview of NHES:2005 and each instrument was demonstrated in the video. Interviewers completed a home study exercise covering key study concepts. The classroom portion of interviewer training was conducted using the CATI system. The trainees entered information in the CATI system during training presentations, providing them with hands-

NHES:2005 Public-Use Data File User’s Manual Volume I: Study Overview and Methodology
40
on experience prior to beginning data collection. The topics covered in the training session included an introduction to the study, interactive lectures based on each of the survey questionnaires, details about survey procedures, and techniques for gaining respondent cooperation. Prior to live interviewing, trainees practiced interviews in pairs using several role-play scripts. The majority of classroom training time was spent on interactive lectures and practice interviews using role-play scripts. Most of the remaining time was spent on procedures for contacting households and respondents and techniques for gaining cooperation. Each training group had an assigned time for the first interviewing shift so that their work could be closely monitored. Experienced interviewers received 8.5 hours of project-specific training, including home study and classroom hours, and inexperienced interviewers received 13.5 hours of training, including home study and classroom hours.31 In total, 287 interviewers were trained for the study. The survey staff included 48 interviewers bilingual in English and Spanish. These interviewers received the same training in English as did all other interviewers. They were then trained to conduct the interviews in Spanish. All of the CATI screens were translated into Spanish, and these screens were available to bilingual interviewers at a keystroke, so they could interview in either English or Spanish when placing an initial call into a household. Handling of language problem cases is discussed in section 4.1.4. 4.1.4 Interviewing Procedures Cases were released for dialing in three waves. The first release group contained 60 percent of the original sample and the second release group contained 40 percent of the original sample. In addition, because the residency rate was lower than expected, a reserve sample was released for dialing. Cases in the reserve sample received the same calling protocol as those cases in the second original sample release group. The CATI system generally scheduled cases automatically, based on an algorithm that was customized for the NHES:2005 survey. In special circumstances, such as when the initial call was to follow the arrival of a prenotification mailout, the order of cases were manually arranged. Usually, however, the system assigned cases to interviewers in the following order of priority:
1. Cases that had specific appointments;
2. Cases that had resulted in busy signals 15 minutes earlier;
3. Cases that had unspecified appointment/general callback times for the time period;
4. Cases that had resulted in noncontact at a scheduled appointment time;
5. Cases dialed but not yet answered by a person;
6. Cases previously contacted with no subsequent contact; and
7. Cases not yet dialed.
Cases that were coded as problems were referred to a telephone supervisor to discuss appropriate methods of completing an interview (e.g., holding a case for some time and releasing it for additional attempts later in the data collection period). Below is an overview of the specific calling strategies used during the NHES:2005 data collection and their results. Because most nonresponse in a random digit dial (RDD) survey occurs at the screening level, these procedures emphasized increasing the Screener unit response rate.
31 Experienced interviewers were those that had worked on Westat CATI studies previously.

NHES:2005 Public-Use Data File User’s Manual Volume I: Study Overview and Methodology
41
In order to make initial contact with sampled telephone numbers, call attempts were made on 1 weekday, 2 weekday evenings, and 1 weekend day. If no contact was made, the case was held for 1 week and then calls were made on 2 weekend evenings and a weekend day. If the case remained in noncontact status, these cycles were repeated. Wave 1 was randomly split into two halves. Noncontact cases in the first half that were either matched with an address or coded as having an answering machine were designated for up to 21 attempts; those cases that were not matched to an address or coded as having an answering machine were designated for 14 attempts. Cases in the second half of wave 1 that were either matched with an address or coded as having an answering machine were designated for 28 attempts; the remaining wave 1 cases were designated for 21 attempts. Cases in the second release group and the reserve cases were all designated for up to 14 attempts to make initial contact. When a Screener was completed and household members were selected for extended interviews, the interviewer would first attempt to complete any interviews for which the Screener respondent was selected, because he or she was already on the telephone. If other household members were selected, the interviewer asked to speak with them after completing any applicable interviews (or making a callback appointment) with the Screener respondent. Callback attempts were made as necessary to make contact with respondents to extended interviews. Noncontact Cases. Telephone numbers that were not contacted after completion of the protocol described above were classified as one of two types. Those telephone numbers for which contact was made with an answering machine, but not with a person, were classified as no answer-answering machine cases. Those telephone numbers at which no contact was made with either a person or an answering machine were classified as no answer cases. Maximum Call Cases. Telephone numbers at which a person had been contacted and 9 Screener call attempts had been made without completion of the Screener were held for 1 week and were released for additional call attempts. A total of 20 attempts were made to complete the Screener with wave 1 cases before classifying a case as a maximum call case; up to 14 Screener call attempts were made for wave 2 and reserve sample cases. At the extended interview level, up to 24 call attempts were made for each extended interview prior to classifying the case as a maximum call case; the same maximum call rule was used for extended interviews in wave 1 and wave 2. Note that refusals generally received fewer call attempts because they were finalized after the third refusal (refusal procedures are described below). Procedures for non-English speakers. NHES:2005 was conducted primarily in English, but provisions were made to interview persons who spoke only Spanish. As was noted above, the questionnaires were translated into Spanish, the Spanish versions of the CATI instruments were programmed, and bilingual interviewers were trained to complete the interview in either English or Spanish. When the person answering the telephone was not able to speak English, and the interviewer was not bilingual and was not able to identify an English-speaking household member, the interviewer coded the case as a “language problem” and further specified the case as either “hearing/speech problem,” “Spanish,” or “language other than English or Spanish.” There were 578 Screeners that were classified by at least one interviewer as a hearing or speech problem; 182 of these cases were completed. Bilingual interviewers were the only ones who could access cases coded Spanish or another language for follow-up. If a bilingual interviewer encountered a Spanish-speaking respondent on an initial call into a household, the interviewer could immediately begin to conduct the interview in Spanish without ever coding the case as a language problem. A total of 4,672 Screeners were classified by the first interviewer who made contact as Spanish-speaking. About 61 percent of all these cases were finalized as completes, and about 96 percent of these completed cases, or 59 percent of the total, were completed in Spanish. About 20 percent of the Screener cases identified as Spanish language were finalized as refusals, 3

NHES:2005 Public-Use Data File User’s Manual Volume I: Study Overview and Methodology
42
percent as language problem cases, and about 17 percent were given other nonresponse status codes, such as maximum call. About 13 percent of the 1,477 Screeners with respondents identified by the initial interviewer as speaking some language other than English or Spanish were completed. Most were completed in English; only about 23 percent of the completed cases were completed in Spanish. Sixty-three percent (928) of the cases in households identified as non-English/non-Spanish were finalized as language problems and the rest were refusals (13 percent) or other nonresponse (10 percent). Answering machines. The first time an answering machine was reached, the interviewer left a brief message explaining the nature of the call, providing a toll-free telephone number for the prospective respondent, and explaining that an interviewer would call again at a later time. A different message was left upon reaching an answering machine only if the case changed strategy, for instance, became a refusal or language problem case. At the end of the data collection period, additional messages may have been left in an attempt to gain the cooperation of the household. In 19,568 households with a completed Screener (34 percent), one message was left. In 6,758 households (12 percent), two or three messages were left. Fifty households received four messages. There were no households that received more than four messages. 4.1.5 Special Data Collection Procedures Refusal conversion. Additional efforts were made to gain cooperation from households who had initially refused to complete a Screener and who were in the wave 1 subsample (i.e., the first 60 percent of the original sample) and for all ECPP, ASPA, and AE refusals. Unless an interviewer indicated that the initial refusal was “hostile” (e.g., profane or abusive), up to two refusal conversion attempts were made for each Screener or extended interview refusal. Cases classified as hostile were reviewed by a supervisor to determine whether another attempt should be made. For most of the field period, a 13-day hold was placed on initial refusals before a conversion attempt was made. This period was decreased near the end of data collection to facilitate survey closeout while maximizing response rates. In order to increase the likelihood of successful refusal conversion attempts at the Screener level, a letter was sent to first refusal households in wave 1 for which an address had been obtained. Like the advance letters, these were printed on ED stationery and provided information about the study. The letters were sent by first class mail with a $5 bill. A total of 24,994 such letters were mailed, and 9,980 of these cases or 40 percent were completed, versus 27 percent of the 2,953 cases to which a letter was not mailed. Twenty-two percent of all completed Screeners were completed in those households that received first refusal conversion letters. An additional refusal conversion attempt was made in cases which had twice refused to participate in the Screener interview and were in wave 1. The cases included in this effort were those for which neither the first nor second refusal received a code of hostile. All of the households with mailable addresses for which an additional refusal conversion attempt was made were sent a letter in order to draw the attention of potential respondents to the importance of the study. An experiment was done to compare second refusal conversion rates based on whether the letter was mailed via FedEx versus Priority Mail. Approximately half of the households with mailable addresses were randomly assigned to receive a second refusal letter via FedEx letter and the other half were randomly assigned to receive a second refusal letter via Priority Mail.32 Households that were sent the FedEx letter had a higher second refusal conversion rate (31.1 percent, with a standard error of 0.74 percent) than households that were sent a Priority Mail letter (25.5 percent, with a standard error of 0.69 percent).
32 The exception is that letters to rural route or Post Office box addresses were sent via Priority Mail only; these cases were excluded from the analysis of this experiment.

NHES:2005 Public-Use Data File User’s Manual Volume I: Study Overview and Methodology
43
A total of 11,157 second refusal letters were mailed and 2,895 of these cases or 26 percent were completed, versus 16 percent of the 2,198 refielded second refusal cases to which a letter was not mailed. Five percent of the completed Screeners were completed in households that received second refusal conversion letters. In total, 13,118 Screeners that refused twice were released for additional attempts; 3,120 (or 24 percent) of these were completed. All Screener refusals were considered to be final if a third refusal was received. Refusal conversion efforts were successful at the extended interview level as well; 219 Early Childhood Program Participation (ECPP) interviews, 440 After-School Programs and Activities (ASPA) interviews, and 625 Adult Education (AE) interviews were completed as a result of initial conversion attempts. An additional refusal conversion attempt was also made on extended interview cases for which two refusals had been received, provided neither of the refusals received a code of hostile. This effort resulted in the completion of 64 ECPP interviews out of 409 refielded for a second time; 128 completed ASPA interviews out of 788 refielded for a second time; and 201 AE completed interviews out of 1,304 refielded for a second time. Four percent of completed ECPP interviews and 5 percent of completed ASPA interviews were conducted with respondents who had refused and were converted. Among completed AE interviews, 11 percent were conducted with adults who had refused and were converted. In summary, the refusal conversion activities for NHES:2005 were productive. Forty percent of the Screener refusal cases that were mailed a First Class letter with a $5 bill, and 27 percent of the cases called after an initial refusal but not mailed a First Class letter were completed after calling back the household. Twenty-six percent of the second refusal cases that were mailed a FedEx or Priority Mail letter, and 16 percent of the cases called after a second refusal but not mailed a FedEx or Priority Mail letter were completed after calling back the household. Of the extended interviews released for a first refusal conversion attempt, from 23 to 26 percent were completed. Fifteen to 16 percent of extended cases refielded for a second refusal conversion attempt were completed, depending upon the survey. 4.1.6 Data Collection Quality Control Data collection quality control efforts began during the CATI development period. As the CATI system was programmed, extensive testing of the system was conducted. This testing included review by project research staff, telephone interviewing staff, data preparation staff, statistical staff, and the programmers themselves. The testing by staff members representing different aspects of the project was designed to ensure that the system was working properly from all of these perspectives. Field test. A field test was conducted in households prior to data collection to ensure that the CATI system was working properly and the timing and flow of the instruments was as expected. A total of 1,627 households were screened, and extended interviews for all three surveys were administered: 215 ECPP interviews, 213 ASPA interviews, and 289 AE interviews were conducted from July 12 through August 3, 2004. Interviewer training and monitoring. Quality control activities continued during training and data collection. During interviewer training, interviewers paired with one another conducted role-play interviews monitored by supervisors. When interviewers began actual data collection, they were monitored on an ongoing basis by telephone center supervisors. Project research staff also monitored the interviewers, especially during the beginning weeks of data collection. Data preparation staff reviewed the cases from the CATI system as they were completed and referred problems to the project staff for resolution. Interviewer memos were posted and distributed when any observations indicated that reminders to the interviewers were appropriate. Additional training was provided to interviewers as necessary.

NHES:2005 Public-Use Data File User’s Manual Volume I: Study Overview and Methodology
44
Throughout data collection, supervisors and telephone monitors (experienced telephone interviewers who were trained for monitoring) listened for about 10 minutes at a time to the interviewers from either a monitoring room or from a carrel on the floor of the telephone center. The monitors completed a special monitoring form that covered five major areas of telephone interviewing:
• Voice quality and reading skills;
• Listening, probing, and clarifying skills;
• Technical skills;
• Gaining respondent cooperation; and
• Interview management.
The monitors recorded their assessments of the interviewer’s skills and abilities along with suggestions for improvement. Interviewers were individually coached by supervisors, and any who had exhibited difficulty were intensively monitored to make sure the difficulties were resolved. If the problems continued, then the interviewers were released from the NHES:2005 interviewing pool. Over 18,527 monitoring sheets were completed for NHES:2005 interviewers. Only eight interviewers were released because of inadequate performance. In addition, at least once a week, the CATI management system produced computer-generated reports that displayed unit response rates, refusal rates, and refusal conversion rates for each NHES:2005 interviewer. These reports assisted telephone center supervisors in identifying differences in interviewer performance. Supervisors relied on both monitoring sheets and standard reports to make staff assignments. For example, standard reports might have shown that some interviewers were more effective in refusal conversion and monitoring those interviewers could have revealed persons particularly skilled in gaining cooperation from the elderly who could be assigned to conduct refusal conversion on those cases. Adult Education Survey Reinterview. A random subsample of AE respondents was called about 2 to 3 weeks after the interview was initially conducted and asked to participate in a 5-minute followup interview. The reinterview was conducted for three purposes: to identify survey questions that may not have been reliable (i.e. the two interviews did not elicit the same response); to quantify the magnitude of the response variance for groups of questions collected from the same respondent at two different times; and to provide feedback to improve the design of questions for future surveys. Respondents were re-administered a subgroup of items from the AE survey (approximately 20 items). Administered items included questions that were new to the AE-NHES:2005 survey and items central to planned analyses, including distance education items and informal learning activities for personal interest items. The reinterview also included items that eased the flow from one question to the next. Six hundred forty-nine respondents participated in the AE reinterview. 4.2 Unit Response Rates A unit response rate is the ratio of the number of units with completed interviews (e.g., the units could be telephone numbers, households, or persons) to the number of units sampled and eligible for the interview. In some cases, these rates are easily defined and computed, while in other cases the numerator or denominator of the ratio must be estimated. For reporting the results from NHES:2005, the overall unit response rate indicates the percentage of possible interviews completed taking all survey stages into account, while the unit response rate measures the percentage of interviews completed for a specific stage of the survey. For example, household members

NHES:2005 Public-Use Data File User’s Manual Volume I: Study Overview and Methodology
45
were identified for interviews in a two-stage process. Screener interviews were conducted to enumerate and sample household members, and then questionnaires were administered for the sampled members. If the first-stage Screener was not completed, no members could be sampled for other interviews. Under this design, the unit response rate for the second stage (ECPP, ASPA, or AE interviews) is the percentage of sampled persons who completed these interviews. The overall unit response rate is the product of the first- and second-stage unit response rates. The overall unit response rates for the Screener, the ECPP Survey, the ASPA Survey, and the AE Survey are 66.9 percent, 56.4 percent, 56.3 percent, and 47.6 percent, respectively (further discussion on these rates appears later in this section). Unit response rates and overall unit response rates can be either unweighted or weighted. The unweighted rate, computed using the raw number of cases, provides a useful description of the success of the operational aspects of the survey. The weighted rate, computed by summing the weights (usually the reciprocals of the probability of selecting the units) for both the numerator and denominator, gives a better description of the success of the survey with respect to the population sampled, since the weights allow for inference of the sample data (including response status) to the population level. Both rates are usually similar unless the probabilities of selection and the unit response rates in the categories with different selection probabilities vary considerably. All of the unit response rates discussed below are weighted unless noted specifically in the text. Unit response rates and overall unit response rates are identical for the first stage of sampling and interviewing (i.e., the Screener). The next section discusses the unit response rate for the Screener and provides a profile of the characteristics of the respondents. The discussion of unit response and overall unit response rates for ECPP, ASPA, and AE interviews are given in the sections that follow. 4.2.1 Screener Unit Response Rate Table 4-1 shows the disposition of the 240,999 telephone numbers that were sampled for NHES:2005. The three major categories of residential status are those identified as numbers for residential households, those identified as nonresidential numbers (primarily nonworking and business telephone numbers), and those numbers that, despite numerous attempts, could not be classified as either residential or nonresidential. Calculation of unit response rates is complex because of the possible ways residential status can be assigned to these numbers. Table 4-1. Number and percentage of telephone numbers dialed, by screener response status:
2005
Screener response status Number Percentage of
all numbers Percentage of
residential numbers
Total 240,999 100.0 †
Identified as residential 101,553 42.1 100.0
Responded 58,140 24.1 57.3 Did not respond1 43,413 18.0 42.7
Identified as nonresidential 119,164 49.4 † Unknown residential status 20,282 8.4 †
† Not applicable. 1 The unweighted proportion of nonrespondents in the sample is higher than in previous NHES administrations due to the subsampling of cases for nonresponse followup in NHES:2005. SOURCE: U.S. Department of Education, National Center for Education Statistics, National Household Education Surveys Program (NHES), 2005.
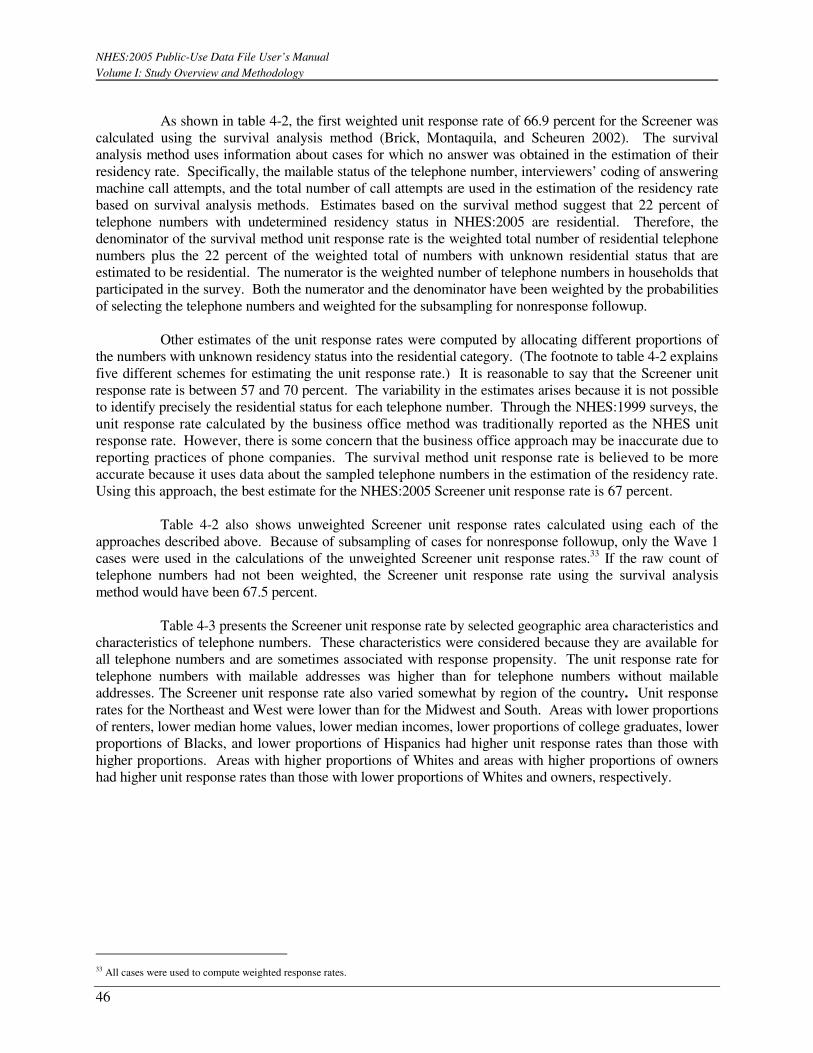
NHES:2005 Public-Use Data File User’s Manual Volume I: Study Overview and Methodology
46
As shown in table 4-2, the first weighted unit response rate of 66.9 percent for the Screener was calculated using the survival analysis method (Brick, Montaquila, and Scheuren 2002). The survival analysis method uses information about cases for which no answer was obtained in the estimation of their residency rate. Specifically, the mailable status of the telephone number, interviewers’ coding of answering machine call attempts, and the total number of call attempts are used in the estimation of the residency rate based on survival analysis methods. Estimates based on the survival method suggest that 22 percent of telephone numbers with undetermined residency status in NHES:2005 are residential. Therefore, the denominator of the survival method unit response rate is the weighted total number of residential telephone numbers plus the 22 percent of the weighted total of numbers with unknown residential status that are estimated to be residential. The numerator is the weighted number of telephone numbers in households that participated in the survey. Both the numerator and the denominator have been weighted by the probabilities of selecting the telephone numbers and weighted for the subsampling for nonresponse followup. Other estimates of the unit response rates were computed by allocating different proportions of the numbers with unknown residency status into the residential category. (The footnote to table 4-2 explains five different schemes for estimating the unit response rate.) It is reasonable to say that the Screener unit response rate is between 57 and 70 percent. The variability in the estimates arises because it is not possible to identify precisely the residential status for each telephone number. Through the NHES:1999 surveys, the unit response rate calculated by the business office method was traditionally reported as the NHES unit response rate. However, there is some concern that the business office approach may be inaccurate due to reporting practices of phone companies. The survival method unit response rate is believed to be more accurate because it uses data about the sampled telephone numbers in the estimation of the residency rate. Using this approach, the best estimate for the NHES:2005 Screener unit response rate is 67 percent. Table 4-2 also shows unweighted Screener unit response rates calculated using each of the approaches described above. Because of subsampling of cases for nonresponse followup, only the Wave 1 cases were used in the calculations of the unweighted Screener unit response rates.33 If the raw count of telephone numbers had not been weighted, the Screener unit response rate using the survival analysis method would have been 67.5 percent. Table 4-3 presents the Screener unit response rate by selected geographic area characteristics and characteristics of telephone numbers. These characteristics were considered because they are available for all telephone numbers and are sometimes associated with response propensity. The unit response rate for telephone numbers with mailable addresses was higher than for telephone numbers without mailable addresses. The Screener unit response rate also varied somewhat by region of the country. Unit response rates for the Northeast and West were lower than for the Midwest and South. Areas with lower proportions of renters, lower median home values, lower median incomes, lower proportions of college graduates, lower proportions of Blacks, and lower proportions of Hispanics had higher unit response rates than those with higher proportions. Areas with higher proportions of Whites and areas with higher proportions of owners had higher unit response rates than those with lower proportions of Whites and owners, respectively.
33 All cases were used to compute weighted response rates.
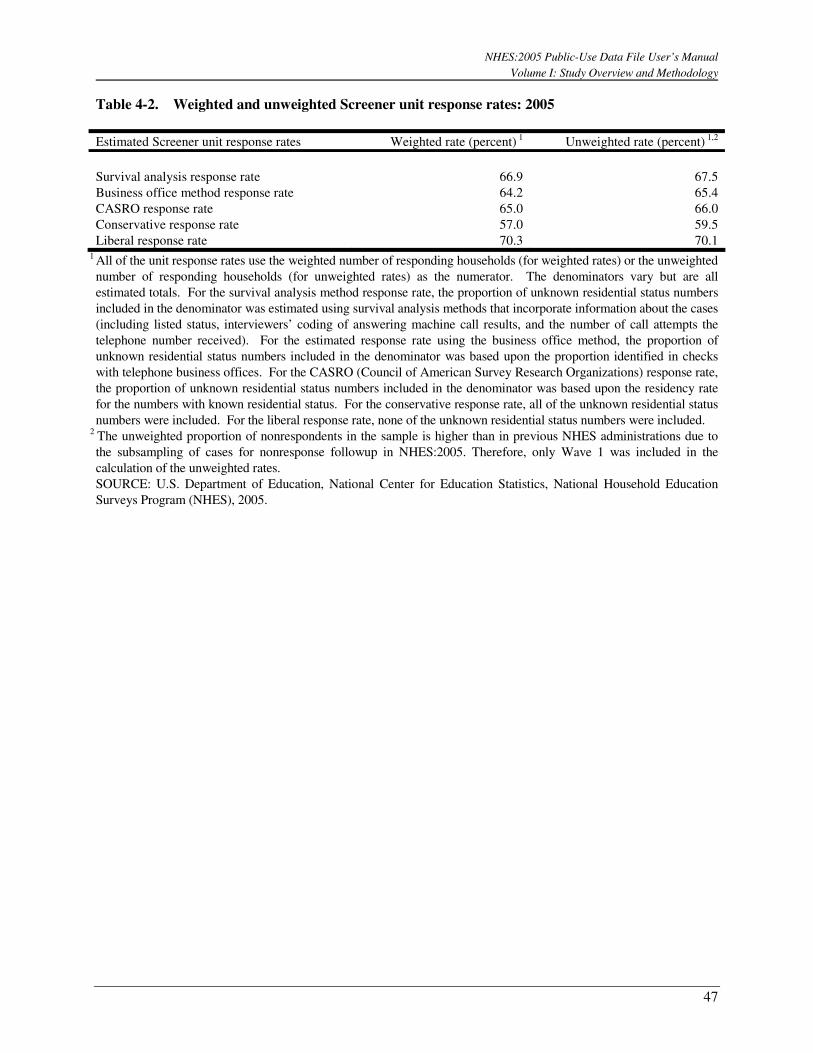
NHES:2005 Public-Use Data File User’s Manual Volume I: Study Overview and Methodology
47
Table 4-2. Weighted and unweighted Screener unit response rates: 2005 Estimated Screener unit response rates Weighted rate (percent) 1 Unweighted rate (percent) 1,2
Survival analysis response rate 66.9 67.5 Business office method response rate 64.2 65.4 CASRO response rate 65.0 66.0 Conservative response rate 57.0 59.5 Liberal response rate 70.3 70.1
1 All of the unit response rates use the weighted number of responding households (for weighted rates) or the unweighted number of responding households (for unweighted rates) as the numerator. The denominators vary but are all estimated totals. For the survival analysis method response rate, the proportion of unknown residential status numbers included in the denominator was estimated using survival analysis methods that incorporate information about the cases (including listed status, interviewers’ coding of answering machine call results, and the number of call attempts the telephone number received). For the estimated response rate using the business office method, the proportion of unknown residential status numbers included in the denominator was based upon the proportion identified in checks with telephone business offices. For the CASRO (Council of American Survey Research Organizations) response rate, the proportion of unknown residential status numbers included in the denominator was based upon the residency rate for the numbers with known residential status. For the conservative response rate, all of the unknown residential status numbers were included. For the liberal response rate, none of the unknown residential status numbers were included.
2 The unweighted proportion of nonrespondents in the sample is higher than in previous NHES administrations due to the subsampling of cases for nonresponse followup in NHES:2005. Therefore, only Wave 1 was included in the calculation of the unweighted rates. SOURCE: U.S. Department of Education, National Center for Education Statistics, National Household Education Surveys Program (NHES), 2005.

NHES:2005 Public-Use Data File User’s Manual Volume I: Study Overview and Methodology
48
Table 4-3. Number of telephone numbers dialed in the Screener, by response status, weighted unit
response rate, and characteristics of the telephone number and the geographic area based on the telephone exchange: 2005
Residential
Characteristic Total Responded Did not
respond1 Non-
residential
Unknown residential
status
Estimated unit response rate
(percent)2
Total 240,999 58,140 43,413 119,164 20,282 66.9
Census region
Northeast 43,311 10,353 8,626 19,993 4,339 63.0 Midwest 49,071 12,643 7,800 25,061 3,567 72.3 South 94,126 22,018 16,791 47,766 7,551 66.4 West 54,491 13,126 10,196 26,344 4,825 65.7
Mailable status
Mailable address 121,785 53,209 37,513 19,855 11,208 71.9 No mailable address 119,214 4,931 5,900 99,309 9,074 46.1
Answering machine message indicator
Message left 61,003 26,376 21,492 6,230 6,905 61.9 No message left 179,996 31,764 21,921 112,934 13,377 72.3
Percent White
Less than 30 percent 29,635 5,904 6,033 15,282 2,416 56.9 30 to 49 percent 31,486 6,388 5,516 16,807 2,775 61.0 50 to 69 percent 52,778 11,523 9,191 27,457 4,607 63.6 70 to 89 percent 59,373 14,846 10,669 28,591 5,267 66.4 90 percent or more 67,727 19,479 12,004 31,027 5,217 71.8
Metro status
In an MSA with a center city 186,399 44,180 33,942 92,133 16,144 65.9 In an MSA that has no center city 11,478 2,561 2,425 5,251 1,241 59.8 Not in an MSA 43,122 11,399 7,046 21,780 2,897 72.2
Median home value
1st through 7th deciles 169,154 42,155 29,974 84,038 12,987 68.7 8th through 10th deciles 71,845 15,985 13,439 35,126 7,295 62.7
Median income
1st through 3rd deciles 129,303 30,721 22,542 66,474 9,566 68.3 4th through 10th deciles 111,696 27,419 20,871 52,690 10,716 65.5
Percent college graduates
Less than 20 percent 48,010 11,360 8,745 24,603 3,302 67.3 20 to 29 percent 89,642 22,404 16,498 43,758 6,982 68.4 30 to 39 percent 55,236 13,504 10,196 26,516 5,020 66.1 40 to 59 percent 43,724 10,008 7,316 21,965 4,435 64.9 60 percent or more 4,387 864 658 2,322 543 62.4
See notes at end of table.

NHES:2005 Public-Use Data File User’s Manual Volume I: Study Overview and Methodology
49
Table 4-3. Number of telephone numbers dialed in the Screener, by response status, weighted unit response rate, and characteristics of the telephone number and the geographic area based on the telephone exchange: 2005—Continued
Residential
Characteristic Total Responded Did not
respond1 Non-
residential
Unknown residential
status
Estimated unit response rate
(percent)2
Percent Black Less than 50 percent 217,063 53,389 39,245 106,030 18,399 67.2 50 to 59 percent 7,419 1,555 1,280 3,953 631 62.9 60 percent or more 16,517 3,196 2,888 9,181 1,252 60.5
Percent Hispanic
Less than 20 percent 163,840 41,413 28,664 80,334 13,429 68.5 20 to 39 percen 44,855 9,826 8,378 22,526 4,125 62.0 40 to 59 percent 17,755 3,762 3,354 9,102 1,537 61.5 60 percent or more 14,549 3,139 3,017 7,202 1,191 59.0
Percent renters
Less than 30 percent 54,184 15,326 10,182 24,574 4,102 70.7 30 to 59 percent 150,199 37,022 27,339 73,340 12,498 66.9 60 percent or more 36,616 5,792 5,892 21,250 3,682 55.2
Percent owners
Less than 40 percent 20,372 3,228 3,423 11,616 2,105 53.1 40 to 69 percent 98,967 21,309 16,958 52,003 8,697 64.4 70 percent or more 121,660 33,603 23,032 55,545 9,480 69.4
1 The unweighted proportion of nonrespondents in the sample is higher than in previous NHES administrations due to the subsampling of cases for nonresponse followup in NHES:2005. 2 The estimated unit response rate is the survival method response rate (i.e., the number of completed interviews divided by the sum of the number of completed interviews, nonresponses, and 22 percent of telephone numbers with an unknown residency status, weighted by the probability of selection). SOURCE: U.S. Department of Education, National Center for Education Statistics, National Household Education Surveys Program (NHES), 2005.
4.2.2 Extended Interview Unit Response Rates
The number of persons enumerated and sampled, and those with completed interviews for each survey of NHES:2005, are given in table 4-4. Of the 9,623 enumerated children eligible for sampling for the ECPP interview, a sample of 8,482 children was selected. About 1.6 percent of the sampled children were not actually in the age and grade range eligible for the survey according to the reports of the ECPP interview respondent; 0.3 percent were eligible for the ASPA survey and had completed ASPA interviews, and 1.3 percent of the children were classified as ineligible. Completed ECPP interviews were obtained for 7,209 of the sampled children (27 of whom were initially sampled for ASPA interviews) for an estimated 84 percent unit response rate and an overall unit response rate of 56 percent. The bulk of the unit nonresponse for the ECPP interview was due to refusal of the parent/guardian to respond (47.9 percent of nonresponse). Other reasons for ECPP interview nonresponse were inability to make contact with the parent/guardian (36.0 percent of nonresponse), language problems (2.9 percent of nonresponse), and other miscellaneous reasons such as the parent/guardian being unavailable for an interview during the field period (13.2 percent of nonresponse).
The number of children enumerated, sampled, and the final status of each sampled child for the ASPA interview are also given in table 4-4. About 69 percent of the 19,732 enumerated children in kindergarten through grade 8 were sampled for the ASPA interview. About 0.5 percent of the sampled students were classified as ineligible for the ASPA survey because the parent respondent reported that they were not actually enrolled in grades K through 8; 0.2 percent were determined to be eligible for the ECPP survey and had completed ECPP interviews, and 0.3 percent were ineligible for both the ECPP and ASPA surveys. In all, 11,684 ASPA interviews were completed with parents or guardians of sampled children,

NHES:2005 Public-Use Data File User’s Manual Volume I: Study Overview and Methodology
50
including 25 who were initially sampled for an ECPP interview. The estimated unit response rate for the ASPA interview is 84 percent, and the overall unit response rate is 56 percent. The main reason for ASPA interview nonresponse was the refusal of the parent/guardian to complete the interview (50.7 percent of ASPA interview nonresponse). Other reasons for nonresponse to the ASPA interview were inability to make contact with the parent/guardian respondent (34.4 percent of ASPA interview nonresponse), language problems (3.1 percent of ASPA interview nonresponse), and other miscellaneous reasons for nonresponse such as the parent/guardian being unavailable for an interview during the field period (11.8 percent of nonresponse).
Table 4-4. Number of enumerated children and adults, completed interviews, and weighted unit response and overall unit response rates, by type of extended interview: 2005
Type of interview Number
Estimated unit response rate
(percent)
Estimated overall unit response rate
(percent)1
ECPP interview † 84.4 56.4
Enumerated 9,623 † † Sampled for ECPP 8,482 † † Sampled for ECPP and eligible for ECPP 8,348 † † Did not respond 1,166 † † Sampled as ECPP, completed as ECPP 7,182 † † Sampled as ASPA, completed as ECPP 27 † † Sampled as ECPP, completed as ASPA 25 † †
ASPA interview † 84.1 56.3
Enumerated 19,732 † † Sampled for ASPA 13,609 † † Sampled for ASPA and eligible for ASPA 13,539 † † Did not respond 1,880 † † Sampled as ASPA, completed as ASPA 11,659 † † Sampled as ECPP, completed as ASPA 25 † † Sampled as ASPA, completed as ECPP 27 † †
AE interview † 71.2 47.6
Enumerated 46,408 † † Sampled 11,842 † † Eligible 11,810 † † Did not respond 2,906 † † Complete 8,904 † †
† Not applicable. 1 The estimated overall unit response rate is computed by multiplying the Screener unit response rate of 66.9 percent by the appropriate extended interview unit response rate. Due to rounding, the product of the reported Screener unit response rate and the reported extended interview unit response rate may not match the estimated overall unit response rate given. SOURCE: U.S. Department of Education, National Center for Education Statistics, Early Childhood Program Participation (ECPP) Survey of the National Household Education Surveys Program (NHES), 2005; After-School Programs and Activities (ASPA) Survey of NHES, 2005; and Adult Education (AE) Survey of NHES, 2005.

NHES:2005 Public-Use Data File User’s Manual Volume I: Study Overview and Methodology
51
The bottom section of table 4-4 gives the numbers of adults enumerated and sampled, and the final status of the AE interview for sampled adults. Adults were enumerated in only a subsample of households. Of the 46,408 enumerated adults, 11,842 were sampled for AE interviews. A total of 8,904 adults completed the AE interview. The estimated unit response rate for the AE interview is 71 percent and the overall unit response rate is 48 percent. Almost all of those sampled were eligible for the interview; those classified as ineligible were either in the military or currently enrolled in high school. For the AE interview, the bulk of the nonresponse was due to refusal of the sampled adult to respond (53.5 percent of nonresponse). Other reasons for AE interview nonresponse were inability to make contact with the sampled adult (27.8 percent of nonresponse), language problems with the sampled adult (4.8 percent of nonresponse), and other miscellaneous reasons such as the sampled adult being unavailable for an interview during the field period (13.9 percent of nonresponse). The unit response rates for the ECPP, ASPA, and AE surveys can only be examined by variables available for both respondents and nonrespondents. For persons sampled for extended interviews in the NHES:2005 surveys, such variables are those available on the sampling frame and those available from the Screener. The variables shown for the ECPP interview are census region (based on the telephone number) and nursery/preschool enrollment status of the sampled child. Enrollment and grade were collected during the Screener. Table 4-5 shows the number of sampled children by response status and the unit response rate for each of these variables. The unit response rates vary slightly by census region, with the highest unit response rate in the Midwest (86 percent) and the lowest in the South (83 percent). There are no differences in unit response rates according to whether the child was enrolled in nursery school/preschool. For the ASPA interview, census region, obtained based on the telephone number; grade, collected in the Screener; and type of schooling (regular or home school, also collected in the Screener), were used to examine unit response rates. The distribution of cases for these variables and the unit response rates are shown in table 4-6. There are slight differences in unit response rates by census region, with the highest unit response rate in the Midwest (87 percent) and the lowest in the South (83 percent). There is little variation in the unit response rates by grade for students whose grade is known. Table 4-5. Number of sampled ECPP interviews, by response status, and weighted unit response
rates: 2005
ECPP interviews Total Responded Did not respond Ineligible
Estimated unit response rate
(percent)
Total 8,482 7,207 1,166 109 84.4
Census region
Northeast 1,443 1,201 220 22 83.9 Midwest 1,824 1,579 218 27 85.8 South 3,060 2,582 440 38 83.1 West 2,155 1,845 288 22 85.3
Enrollment status of child (Screener) Not enrolled 6,015 5,075 837 103 84.2 Nursery/Preschool 2,463 2,128 329 6 84.8 Unknown 4 4 0 0 100.0
SOURCE: U.S. Department of Education, National Center for Education Statistics, Early Childhood Program Participation (ECPP) Survey of the National Household Education Surveys Program (NHES), 2005.

NHES:2005 Public-Use Data File User’s Manual Volume I: Study Overview and Methodology
52
Table 4-6. Number of sampled ASPA interviews, by response status, and weighted unit response rates: 2005
ASPA interviews Total Responded Did not respond Ineligible
Estimated unit response rate
(percent)
Total 13,609 11,686 1,880 43 84.1
Census region
Northeast 2,381 2,048 331 2 84.8 Midwest 2,822 2,494 319 9 86.7 South 4,951 4,210 728 13 82.6 West 3,455 2,934 502 19 83.6
Grade of child (Screener) Kindergarten 1,308 1,107 198 3 83.2 1st grade 1,229 1,081 145 3 86.5 2nd grade 1,195 1,026 163 6 84.5 3rd grade 1,249 1,064 184 1 84.8 4th grade 1,321 1,142 178 1 83.4 5th grade 1,336 1,141 194 1 84.1 6th grade 1,981 1,700 278 3 83.7 7th grade 1,956 1,678 270 8 84.1 8th grade 1,977 1,718 247 12 85.1 Other/unknown1 57 29 23 5 39.4
School (Screener) Regular school/unknown 13,592 11,673 1,877 42 84.1 Homeschool 17 13 3 1 84.3
1 Other includes ungraded, special education, and unknown. SOURCE: U.S. Department of Education, National Center for Education Statistics, After-School Programs and Activities (ASPA) Survey of the National Household Education Surveys Program (NHES), 2005. For the AE interview, four variables were considered in examining the response profile: sex (from the Screener), adult education participation status as reported by the Screener respondent, an indicator of whether the sampled adult was the Screener respondent, and educational attainment as reported by the Screener respondent (table 4-7). The unit response rate for females is higher than that for males (76 percent vs. 66 percent), and the unit response rate for adults reported by the Screener respondent to be adult education participants is higher than the unit response rate for those reported to be nonparticipants (74 percent vs. 69 percent). Sampled adults who were the Screener respondents completed the AE interview at a higher rate (84 percent) than those who were not the Screener respondents (57 percent). The unit response rate for adults reported by the Screener respondent to have at least a high school diploma was higher (72 percent) than for those reported to have less than a high school diploma (63 percent).

NHES:2005 Public-Use Data File User’s Manual Volume I: Study Overview and Methodology
53
Table 4-7. Number of sampled AE interviews, by response status, and weighted unit response rates: 2005
AE interviews Total Responded Did not respond Ineligible
Estimated unit response rate (percent)
Total 11,842 8,904 2,906 32 71.2
Screener respondent
Sampled adult 7,183 6,134 1,039 10 84.4 Person other than sampled adult 4,659 2,770 1,867 22 56.7
Adult’s educational attainment (Screener)
High school diploma/equivalent or higher
9,518
7,383
2,117
18
72.3
Less than high school diploma 2,324 1,521 789 14 62.8 Adult education participation status (Screener)
Participant 5,278 4,158 1,107 13 74.3 Nonparticipant 6,564 4,746 1,799 19 69.5
Sex (Screener) Female 6,625 5,246 1,363 16 76.0 Male 5,217 3,658 1,543 16 65.9
Census region (Screener) Northeast 2,118 1,546 568 4 67.1 Midwest 2,515 1,947 563 5 75.0 South 4,557 3,365 1,178 14 70.0 West 2,652 2,046 597 9 72.9
SOURCE: U.S. Department of Education, National Center for Education Statistics, Adult Education (AE) Survey of the National Household Education Surveys Program (NHES), 2005.
4.2.3 Unit Nonresponse Bias
The estimates from the NHES:2005 surveys are subject to potential bias because of unit nonresponse to the Screener and the extended interview components. Generally speaking, the best approach to minimizing nonresponse bias is to plan and implement data collection procedures aimed at achieving high cooperation rates. For NHES:2005, such procedures included extensive training of the interviewers, advance mailings to the respondents, effective call scheduling strategies, and, where necessary, refusal conversion methods that included recontacting households by both telephone and mail if mailable addresses could be obtained, and monetary incentives. However, because some unit nonresponse occurs even with the best strategies, weighting adjustments are necessary to minimize potential unit nonresponse bias. The term bias has a specific technical definition in this context. Bias is the expected difference between the estimate from the survey and the actual population value. For example, if all households were included in the survey (i.e., if a census was conducted rather than a sample survey), the difference between the estimate from the survey and the actual population value (which includes persons who did not respond to the survey) is the bias due to unit nonresponse. Since NHES is based on a sample, the bias is defined as the expected or average value of this difference over all possible samples.

NHES:2005 Public-Use Data File User’s Manual Volume I: Study Overview and Methodology
54
Unit nonresponse bias, the bias due to the failure of some persons or households in the sample to respond to the survey, can be substantial when two conditions hold. First, the differences between the characteristics of respondents and nonrespondents must be relatively large. For example, consider estimating the percentage of adults who participated in an adult education activity in the past year. If the participation rate is nearly identical for both respondents and nonrespondents, then the unit nonresponse bias of the estimate will be negligible. Second, the unit nonresponse rate must be relatively high. If the nonresponse rate is very low relative to the magnitude of the estimates, then the unit nonresponse bias in the estimates will be small, even if the differences in the characteristics between respondents and nonrespondents are relatively large. For example, if the unit nonresponse rate is only 2 percent, then estimates of totals that compose 20 or 30 percent of the population will not be greatly affected by nonresponse, even if the differences in these characteristics between respondents and nonrespondents are relatively large. It is important to realize that this condition requires the unit nonresponse rate to be large relative to the size of the estimates. If the estimate is for a small domain or subgroup, then even a relatively low overall rate of nonresponse can result in important biases if the differences between respondents and nonrespondents are large. A nonresponse bias analysis was undertaken to examine nonresponse and the potential bias associated with unit nonresponse in NHES:1999 (Nolin et al. 2000). This study involved an examination of response rates as a whole and for various subgroups, an analysis to determine characteristics that are associated with Screener unit nonresponse, an examination of the potential usefulness of household-level data from an external source in reducing unit nonresponse bias, and a comparison of estimates based on adjusted and unadjusted weights. Similar studies were undertaken for NHES:2003 and NHES:2005 to examine bias in estimates of characteristics of children and adults. These analyses of nonresponse bias showed no evidence of bias in estimates from the NHES:1999, NHES:2003, or NHES:2005 surveys. The statistical adjustments used in weighting may have corrected at least partially for biases that might have existed due to differential unit nonresponse. Of course, nonresponse bias may still be present in other variables that were not studied. Roth and Montaquila (forthcoming) present the analysis for NHES:2005.
4.3 Item Response Rates For most of the data items collected in NHES:2005, the item response rate was very high. The tables in this section show the item response rates and total response rates34 for a representative group of items for each interview. The items included were selected to represent key items and to represent the range of item response rates. The number of cases for which each item was attempted and the percentage of cases for which a valid response was obtained are shown. Imputation flags are available for items that initially contained missing values; these are discussed further in Volumes II, III, and IV. Table 4-8 shows the item response rates and total response rates for a representative group of items from the ECPP interview. ASPA interview item response rates and total response rates for selected items are represented in table 4-9; table 4-10 presents the selected AE interview item response rates and total response rates. For the ECPP, ASPA, and AE surveys, the median item response rates were 99.35 percent, 99.19 percent, and 98.80 percent, respectively, and the median total response rates were 56.03 percent, 55.84 percent, and 47.03 percent, respectively. For items that are rarely asked (e.g., the items pertaining to the fourth relative care arrangement in the ECPP interview), a small number of missing values could result in a low item response rate. For most of the selected items across the three surveys, item response rates were very high.
34 The total response rate for an item is the product of the item response rate and the overall unit response rate for the survey.

NHES:2005 Public-Use Data File User’s Manual Volume I: Study Overview and Methodology
55
Table 4-8. Item response rates and total response rates for selected items in the ECPP interview: 2005
Item Number
attempted Item response rate (percent)
Total responserate (percent)1
Current school status
Child enrolled/attending school 3,354 100.00 56.4 Child being schooled at home 424 100.00 56.4
Early childhood care/programs and perceptions of quality/factors in parental choice
Child receives regular care from a relative 7,209 99.97 56.4 Child receives regular care from a nonrelative 7,209 100.00 56.4 Number of children cared for by nonrelative, program 1 1,013 98.82 55.7 Child attends center-based program 7,209 99.99 56.4 Program 1 located at parent workplace 2,687 99.74 56.3 Number of days per week child attends program 1 2,825 99.82 56.3 Any arrangement is Head Start 4,503 99.71 56.2 Difficulty finding care 4,570 99.58 56.2
Home activities and emerging literacy and numeracy
Number of times read to child in past week 7,209 99.89 56.3 Taught child letters/words/numbers in past week 3,354 99.76 56.3 Visited library with child in past month 3,354 99.88 56.3 Child recognizes letters 4,684 99.44 56.1 How high child can count 4,684 98.93 55.8
Health and disability
Child is developmentally delayed 7,209 99.83 56.3 Child has learning disability 3,354 99.94 56.4 Disability affects ability to learn 643 97.20 54.8
Parent and household items
Highest grade mother completed 7,087 99.07 55.9 Mother worked for pay last week 7,087 99.53 56.1 Highest grade father completed 5,995 97.75 55.1 Father worked for pay last week 5,995 99.33 56.0 Own home, rent, or other arrangement 7,209 99.32 56.0 Total household income range (detailed) 7,209 89.67 50.6
1The total response rate for an item is the product of the item response rate and the overall unit response rate for the survey. SOURCE: U.S. Department of Education, National Center for Education Statistics, Early Childhood Program Participation (ECPP) Survey of the National Household Education Surveys Program (NHES), 2005.

NHES:2005 Public-Use Data File User’s Manual Volume I: Study Overview and Methodology
56
Table 4-9. Item response rates and total response rates for selected items in the ASPA interview: 2005
Item Number
attempted Item response rate (percent)
Total response rate (percent)1
Current school status
Child enrolled/attending school 11,684 100.00 56.3 School characteristics
Child attends public/private school 11,429 99.82 56.2 Child attends church-related school 1,414 99.65 56.1 Lowest grade taught at child’s school 11,429 98.52 55.5 Child’s grades across all subjects 11,429 98.32 55.4
After-school arrangements
Child receives regular care from a relative 11,415 99.89 56.2 Child receives regular care from a nonrelative 11,415 99.88 56.2 Child attends a school- or center-based program 11,415 99.89 56.2 Child regularly participates in activities after school 11,415 99.91 56.3 Child is regularly responsible for himself/herself after school 11,415 99.77 56.2
Perceptions of quality and factors in parental choice
Importance of cost when choosing arrangement for child 4,291 97.95 55.2 Health and disability
Child has deafness or another hearing impairment 11,684 99.85 56.2 Child receives services for disability from local school district 2,906 99.24 55.9
Parent and household items
First language mother learned to speak 11,239 99.42 56.0 Child care affected by father’s job choice 8,148 98.43 55.4 Family received benefits from Medicaid 11,684 98.88 55.7 Total household income range (detailed) 11,684 89.93 50.6
1The total response rate for an item is the product of the item response rate and the overall unit response rate for the survey. SOURCE: U.S. Department of Education, National Center for Education Statistics, After-School Programs and Activities (ASPA) Survey of the National Household Education Surveys Program (NHES), 2005.

NHES:2005 Public-Use Data File User’s Manual Volume I: Study Overview and Methodology
57
Table 4-10. Item response rates and total response rates for selected items in the AE interview: 2005
Item Number
attempted Item response rate (percent)
Total response rate (percent)1
Background
Highest grade completed 8,904 99.42 47.3 Worked at job in past 12 months 8,904 99.96 47.6 Highest grade before moving to U.S. 1,012 92.19 43.9
English as a second language
Took ESL classes 1,248 99.84 47.5 Worked while taking ESL classes 43 95.35 45.4 Employer required to take ESL 39 94.87 45.2 How well reads English 1,248 95.35 45.4 How well writes English 1,248 95.35 45.4
Basic skills and GED preparation classes
Basis skills classes 1,700 99.41 47.3 GED preparation classes 1,700 99.29 47.3 Other high school equivalency program 1,700 99.41 47.3 ABE/GED was part of family literacy program 128 92.19 43.9
College/vocational credential programs
College or university degree program 8,904 99.98 47.6 Enrolled part time/full time/both, program 1 929 98.39 46.8 Worked while taking program 1 779 98.46 46.9 Vocational or technical diploma program 8,904 99.89 47.6
Apprenticeship
Apprenticeship program 8,904 99.91 47.6 Employer provided apprenticeship program 72 95.83 45.6
Work-related courses/informal learning activities/distance education
Currently taking work related course 1 2,815 99.82 47.5 Maintain or improve skills/knowledge, course 1 2,815 99.96 47.6 Personal interest course total hours/year, course 1 2,223 96.09 45.7 Instruction by mail (e.g., correspondence course) 4,732 99.98 47.6 Attended book, sport, health club/group 8,904 99.94 47.6
Household characteristics
Own, rent home, or other arrangement 8,904 97.90 46.6 Total household income range (detailed) 8,904 78.61 37.4
1The total response rate for an item is the product of the item response rate and the overall unit response rate for the survey. SOURCE: U.S. Department of Education, National Center for Education Statistics, Adult Education (AE) Survey of the National Household Education Surveys Program (NHES), 2005.

NHES:2005 Public-Use Data File User’s Manual Volume I: Study Overview and Methodology
58
This page is intentionally blank.

NHES:2005 Public-Use Data File User’s Manual Volume I: Study Overview and Methodology
59
5. DATA PREPARATION 5.1 Disclosure Risk Analysis Central to the mission of the National Center for Education Statistics (NCES) is a commitment to protecting the identity of respondents to its various data collections. Surveys that make up the National Household Education Surveys Program (NHES) are designed to protect respondent identity. This design includes an extensive respondent disclosure risk analysis. As in past NHES collections, results from this analysis led to modifications to some data included on the data files. The modifications included coarsening of response categories and swapping of certain data items between respondents. These confidentiality edits modify respondent data in order to prevent positive identification of individual respondents. Tests on the modified data were conducted to assure that the data remain accurate and useful. Under law, public-use data collected and distributed by NCES may be used only for statistical purposes. Any effort to determine the identity of any reported case by public-use data users is prohibited by law. Violations are subject to Class E felony charges of a fine up to $250,000, a prison term up to 5 years, or both. NCES does all it can to assure that the identity of data subjects cannot be disclosed. All direct identifiers, as well as any characteristics that might lead to identification, are omitted or modified in the dataset to protect the true characteristics of individuals. Any intentional identification or disclosure of a person violates the assurances of confidentiality given to the providers of the information. Therefore, users must adhere to the following:
• Use the data in this dataset for statistical purposes only. • Make no use of the identity of any person discovered inadvertently, and advise NCES of
any such discovery. • Not link this dataset with individually identifiable data from other NCES or non-NCES
datasets. • Signify their agreement to comply with the above-stated statutorily based requirements to
proceed. 5.2 Coding and Editing Specifications Most of the NHES:2005 interview data were coded by the interviewers during the interview using the computer-assisted telephone interviewing (CATI) system. As the interviewers entered the number of the response option given by the respondent, this number was written to the data file. Range and logic edits were developed for relevant items to maximize coding accuracy. 5.2.1 Range Specifications The ranges of most of the items were determined by the codes available for responses (closed-ended responses). However, some items such as age did not have predefined response codes and required an entry by the interviewer (open-ended responses). To help assure that reasonable entries were made for open-ended responses, reasonable ranges were defined.

NHES:2005 Public-Use Data File User’s Manual Volume I: Study Overview and Methodology
60
Range edits included both hard- and soft-range edits. A soft range is one that represents the reasonable expected range of values but does not include all possible values. Responses outside the soft range were confirmed with the respondent and had to be entered a second time. For example, the number of hours each week a child attended center-based care had a soft range of 1 to 50. A value outside this range could be entered and confirmed as correct by the interviewer as long as it was within the hard range of values (1 to 70). Hard ranges are those that have a finite set of parameters for the values that can be entered into the CATI system. Out-of-hard-range values for either open- or closed-ended questions were not accepted. If the respondent insisted that a response outside the hard range was correct, the interviewer could enter the information in a comments data file. These comments were reviewed by data preparation and project staff. Out-of-hard-range values were accepted if the comments supported the response. Otherwise, the values were left as missing and later imputed. After data collection was completed, range edits were rerun against the entire database to ensure that no outliers were inadvertently introduced during the post-data-collection updating process or during imputation. Therefore, any outliers that exist in the data files were reviewed during the data preparation process and originated from information entered into the comments data file. 5.2.2 Consistency Checks (Logic Edits) Consistency or logic checks examine the relationships between responses to ensure that they do not conflict with one another or that the response to one item does not make the response to another unlikely. Logic specifications for the NHES:2005 interviews were contained within the CATI system. For example, the CATI system was programmed to control skip patterns so that inappropriate items were not asked. Additional consistency (logic) checks for the NHES:2005 interviews also were included. For example, a parent/guardian may have reported that a child was attending a grade that was outside the normal range of grades for his age. If the logic check was violated, an error message appeared that explained that the response was out of the soft range and allowed the interviewer to enter a correction. If the interviewer passed through the error screen once and information was still outside the soft range, but within the hard range, the interviewer was asked to re-verify the information. After the second attempt, the inconsistent information was accepted. However, if an initial response was outside the hard range, the error message appeared and continued to reappear unless a response within the hard range was entered. If the respondent confirmed an answer outside of a hard range, the interviewer entered it as a comment. These verified responses were allowed in the data file. At several points during data collection, logic edits were also checked against the entire database. Cases violating the edits were examined by data preparation and project staff and either the information violating the edit was kept or it was coded to “not ascertained” and later replaced with imputed data. Data were kept in circumstances where the data were judged to be plausible even though they violated the edit. In such circumstances, there was supporting information available in the comments data file. 5.2.3 Structural Edits Because of the surveys’ complexity, the CATI database was a highly complex, hierarchical file. The relationships of database records were often dependent on values of variables contained in other database records; therefore, structural edit specifications were developed to check the structural integrity of the database. This ensured that all variables that should exist did exist and those that should not exist did not exist in the database. For example, if there was a completed Early Childhood Program Participation (ECPP) interview for a child, the data record that contained the child items must have existed in the database. Structural edits were run against the entire database during data preparation.

NHES:2005 Public-Use Data File User’s Manual Volume I: Study Overview and Methodology
61
5.2.4 Frequency and Cross-Tabulation Review The frequencies of responses to all data items (both individually and in conjunction with related data items) were reviewed to ensure that appropriate skip patterns were followed. Members of the data preparation team checked each item to make sure the correct number of responses was represented for all items. If a discrepancy was discovered, the problem case was identified and reviewed. If necessary, the audit trail for the interview, which provided a keystroke-by-keystroke record of an interview, was retrieved to determine the appropriate response. If the audit trail revealed no additional information, either a call back was made to the household to obtain the information or the item was coded as “not ascertained,” and later imputed. 5.2.5 Review of “Other, specify” Items
The “other, specify” open-ended text responses were reviewed to determine if they should be coded into one of the existing code categories. When a respondent selected an “other” response, the interviewer entered text into a “specify” overlay that appeared on the screen. The “specify” responses were reviewed by the data preparation staff and, where appropriate, coded into one of the existing response categories. Review of the open-ended text responses revealed that no particular text item occurred frequently enough to warrant the creation of a new response category. 5.2.6 Coding of Open-Ended Items In the Adult Education (AE) interview, open-ended items that were coded related to the industry and occupation of jobs reported by respondents, the major field of study for participants in postsecondary credential programs, and sampled courses. Codes for industry and occupation are included in the data file (FNAICS for industry; FSOC for occupation). The coding manual for industry and occupation is found in appendix G of Volume IV of this manual. Codes for major field of study are also included in the data file (CIPF) and the major field of study coding manual is found in appendix H of Volume IV of this manual. Up to four work-related courses (WRCRS1-WRCRS4) and up to two personal interest courses (SACRS1-SACRS4) were also coded. Verbatim strings used in coding industry and occupation, major field of study, and courses are included in the restricted-use data file of AE-NHES:2005.

NHES:2005 Public-Use Data File User’s Manual Volume I: Study Overview and Methodology
62
This page is intentionally blank.

NHES:2005 Public-Use Data File User’s Manual Volume I: Study Overview and Methodology
63
REFERENCES
Anderson, J.E., Nelson, D.E., and Wilson, R.W. (1998). Telephone Coverage and Measurement Coverage of Health Risk Indicators: Data from the National Health Interview Survey. American Journal of Public Health, 88(9): 1392–1395.
Blumberg, S.J., Luke, J.V., and Cynamon, M.L. (in press). Telephone Coverage and Health Survey Estimates: Is Concern About Wireless Substitution Warranted? American Journal of Public Health.
Brick, J.M. (1996). Undercoverage Bias in Estimates of Adults and 0- to 2-Year-Olds in the 1995 National Household Education Survey (NHES:95) (NCES 92–101). U.S. Department of Education. Washington, DC: National Center for Education Statistics.
Brick, J.M., Burke, J., and West, J. (1992). Telephone Undercoverage Bias of 14- to 21-Year-Olds and 3- to 5-Year-Olds (NCES 92–101). U.S. Department of Education. Washington, DC: National Center for Education Statistics.
Brick, J.M., Celebuski, C.A., Collins, M.A., and West, J. (1992). Overview of the NHES Field Test. Technical Report No. 1 (NCES 92–099). U.S. Department of Education. Washington, DC: National Center for Education Statistics.
Brick, J.M., Hagedorn, M.C., Montaquila, J., and Brock-Roth, S. (2005). Impact of Monetary Incentives and Mailing Procedures: An Experiment in a Federally Sponsored Telephone Survey (NCES 2005–090). U.S. Department of Education. Washington, DC: National Center for Education Statistics.
Brick, J.M., Montaquila, J., and Scheuren, F. (2002). Estimating Residency Rates for Undetermined Telephone Numbers. Public Opinion Quarterly, 66(1), 18–39.
Brick, J.M., Tubbs, E., Collins, M.A., Nolin, M.J., Cantor, D., Levin, K., and Carnes, Y. (1997). Telephone Coverage Bias and Recorded Interviews in the 1993 National Household Education Survey (NHES:93) (NCES 96–029). U.S. Department of Education. Washington, DC: National Center for Education Statistics.
Brick, J.M., and Waksberg, J. (1991). Avoiding Sequential Sampling With Random Digit Dialing. Survey Methodology, 17(1), 27–42.
Brick, J.M., Waksberg, J., Kulp, D., and Starer, A. (1995). Bias in List-Assisted Telephone Samples. Public Opinion Quarterly, 59(2): 218–235.
Broene, P., and Rust, K. (2000). Strengths and Limitations of Using SUDAN, Stata, and WesVar PC for Computing Variance from NCES Data Sets (NCES 2000–03). U.S. Department of Education. Washington, DC: National Center of Education Statistics.
Casady, R.J., and Lepkowski, J.M. (1993). Stratified Telephone Survey Designs. Survey Methodology, 19(1), 103–113.
Collins, M.A., Brick, J.M., Kim, K., Gilmore, S., and Stowe, P. (1996). National Household Education Survey of 1995: Adult Education Data File User’s Manual (NCES 96–826). U.S. Department of Education. Washington, DC: National Center for Education Statistics.
Deming, W.E., and Stephan, F.F. (1940). On a Least Square Adjustment of a Sampled Frequency Table When the Expected Marginal Totals Are Known. Annals of Mathematical Statistics, 11, 427–444.
Kalton, G., and Kasprzyk, D. (1986). The Treatment of Missing Survey Data. Survey Methodology, 12(1), 1–16.

NHES:2005 Public-Use Data File User’s Manual Volume I: Study Overview and Methodology
64
Kass, G. (1980). An Exploratory Technique for Investigating Large Quantities of Categorical Data. Applied Statistics, 29(2), 119–127.
Montaquila, J.M., Brick, J.M., and Brock, S.P. (1997). Undercoverage Bias in Estimates of Characteristics of Households and Adults in the 1996 National Household Education Survey (NCES 97–39). U.S. Department of Education. Washington, DC: National Center for Education Statistics.
Nolin, M.J., Montaquila, J., Nicchitta, P., Hagedorn, M.C., and Chapman, C. (2004). National Household Education Surveys Program: 2001: Methodology Report (NCES 2005–071). U.S. Department of Education. Washington, DC: National Center for Education Statistics.
Nolin, M.J., Montaquila, J., Nicchitta, P., Kim, K., Kleiner, B., Lennon, J., Chapman, C., Creighton, S., and Bielick, S. (2000). National Household Education Survey of 1999: Methodology Report (NCES 2000–078). U.S. Department of Education. Washington, DC: National Center for Education Statistics.
Rao, J.N.K., and Shao, J. (1992). Jackknife Variance Estimation with Survey Data Under Hot Deck Imputation. Biometrika, 79, 811–822.
Roth, S.B., and Montaquila, J.M. (forthcoming). Nonresponse Bias in the 2005 National Household Education Surveys Program. U.S Department of Education. Washington, DC: National Center for Education Statistics.
Rubin, D.R. (1987). Multiple Imputation for Nonresponse in Surveys. New York: John Wiley & Sons.
Shah, B.V., Barnwell, B.G., Hunt, P.N., and LaVange, L.M. (1995). SUDAAN User’s Manual. Research Triangle Park, NC: Research Triangle Institute.
Waksberg, J. (1978). Sampling Methods for Random Digit Dialing, Journal of the American Statistical Association, 73(361), 40–46.
Wolter, K. (1985). Introduction to Variance Estimation. New York: Springer-Verlag, Chapter 4.

APPENDIX A
NHES:2005 SCREENER, ECPP, ASPA, AND AE QUESTIONNAIRES

This page is intentionally blank.

APPENDIX B
SUMMARY OF WEIGHTING AND
SAMPLE VARIANCE ESTIMATION VARIABLES

This page is intentionally blank.

B-1
Table B-1. Summary of weighting and sample variance estimation variables: 1991-2005 Computing sampling errors
Replication method
(WesVar, SUDAAN, STATA, AM1)
Taylor series method (SUDAAN, Stata, SAS 82,AM,
SPSS Complex Samples)
NHES data file Full sample
weight Respondent ID Replicate weights
Jackknife method Sample design
Nesting variables
DEFT (Average Root Design
Effect) for approximating sampling errors
NHES:1991 Early Childhood Education Primary file Preprimary file
EWGT EWGT
PERSID EWREPL1 – EWREPL50 EWREPL1 – EWREPL50
JK1 JK1
WR WR
VSTRAT PSU VSTRAT PSU
1.2 1.2
NHES:1991 Adult Education Adult file Course file3
AEWT AEWT
PERSID CLASID
AEREPL1-AEREPL50 AEREPL1-AEREPL50
JK1 JK1
WR WR
VSTRAT PSU VSTRAT PSU
2.1 Full Sample 1.5 Participants 1.7 Nonparticipants 2.0 Black (non-Hispanic) 1.8 Hispanic 1.7 White (non-Hispanic) 1.6 Other races
NHES:1993 School Readiness FWGT0 ENUMID FWGT1 - FWGT60 JK2 WR STRATUM PSU
1.3
NHES:1993 School Safety & Discipline Parent interviews only Parent & Emancipated Youth (EY) interviews Youth interviews
(including Emancipated Youth)
FWGT0 FWGT0 (for parents) & PFWGT0 (for EY) FWGT0
BASMID BASMID ENUMID
FWGT1-FWGT60 FWGT1-FWGT60, PFWGT1-PFWGT60 FWGT1-FWGT60
JK2 JK2 JK2
WR WR WR
STRATUM PSU STRATUM PSU STRATUM PSU
1.4
1.4
1.5
NHES:1995 Early Childhood Program Participation EWEIGHT ENUMID ERPL1 - ERPL50 JK1 WR
STRATUM PSU 1.2
NHES:1995 Adult Education4 AEWEIGHT BASMID ARPL1 - ARPL50 JK1 WR STRATUM PSU
1.3
NHES:1996 Screener/Household & Library
FHWT BASEID FHWTR1-FHWTR80 JK1 WR HSTRATUM HPSU
1.1
NHES:1996 Parent PFI/CI FPWT BASMID FPWTR1-FPWTR80 JK1 WR PSTRATUM PPSU
1.3
See notes at end of table.

B-2
Table B-1. Summary of weighting and sample variance estimation variables: 1991-2005—Continued
Computing sampling errors
Replication method (WesVar, SUDAAN, STATA, AM1)
Taylor series method (SUDAAN, Stata, SAS 82, AM,
SPSS Complex Samples)
NHES data file Full sample
weight Respondent ID Replicate weights Jackknife
method Sample design Nesting
variables
DEFT (Average Root Design
Effect) for approximating sampling errors
NHES:1996 Youth CI FYWT BASMID FYWTR1-FYWTR80 JK1 WR YSTRATUM YPSU
1.4
NHES:1996 Adult CI FAWT BASMID FAWTR1-FAWTR80 JK1 WR ASTRATUM APSU
1.2
NHES:1999 Parent Interview FPWT BASMID FPWT1-FPWT80 JK1 WR PSTRATUM PPSU
1.3
NHES:1999 Youth Interview FYWT BASMID FYWT1-FYWT80 JK1 WR YSTRATUM YPSU
1.3
NHES:1999 Adult Education Interview
FAWT BASMID FAWT1-FAWT80 JK1 WR ASTRATUM APSU
1.3 Full sample 1.4 Participants 1.5 Black, non-Hispanic
NHES:2001 Early Childhood Program Participation
FEWT BASMID FEWT1-FEWT80 JK1 WR ESTRATUM EPSU
1.2 Full sample 1.3 Black, non-Hispanic
NHES:2001 Before- and After-School Programs and Activities
FSWT BASMID FSWT1-FSWT80 JK1 WR SSTRATUM SPSU
1.3 Full sample 1.4 Black, non-Hispanic
NHES:2001 Adult Education FAWT BASMID FAWT1-FAWT80 JK1 WR ASTRATUM APSU
1.3
NHES:2003 Parent and Family Involvement in Education
FPWT BASMID FPWT1-FPWT80 JK1 WR PSTRATUM PPSU
1.3 Full sample 1.4 Race/ethnicity
subgroups NHES:2003 Adult Education for Work-Related Reasons
FAWT BASMID FAWT1-FAWT80 JK1 WR ASTRATUM APSU
1.3 Full sample 1.4 Hispanics 1.4 Work-related adult
education participants
See notes at end of table.

B-3
Table B-1. Summary of weighting and sample variance estimation variables: 1991-2005—Continued
Computing sampling errors
Replication method (WesVar, SUDAAN, STATA, AM1)
Taylor series method (SUDAAN, Stata, SAS 82, AM,
SPSS Complex Samples)
NHES data file Full sample
weight Respondent ID Replicate weights Jackknife
method Sample design Nesting
variables
DEFT (Average Root Design
Effect) for approximating sampling errors
NHES:2005 Early Childhood Program Participation
FEWT BASMID FEWT1-FEWT80 JK1 WR ESTRATUM EPSU
1.4 Full sample 1.3 Preschoolers
NHES:2005 After-School Programs and Activities
FSWT BASMID FSWT1-FSWT80 JK1 WR SSTRATUM SPSU
1.4 Full sample 1.3 Home schoolers 1.3 White, non-Hispanic 1.5 Black, non-Hispanic
NHES:2005 Adult Education FAWT BASMID FAWT1-FAWT80 JK1 WR ASTRATUM APSU
1.6 Full sample 1.5 White, non-Hispanic 1.5 Black, non-Hispanic 1.5 Nonparticipants 1.7 Less than high school 1.4 High school diploma/
equiv. 1.4 Bachelors or higher 1.5 Associates degree
1 WesVar Complex Samples software, version 4, is available from Westat (www.westat.com). Information on SUDAAN can be obtained at www.rti.org. SUDAAN performs replication using the JK1 procedure but not the JK2 procedure. Information on Stata can be obtained at www.stata.com. Information on AM can be obtained at www.am.air.org.
2 Information on SUDAAN can be obtained at www.rti.org. Information on Stata can be obtained at www.stata.com. Additionally, SAS version 8 includes survey procedures that use the Taylor series method for variance estimation. (See www.sas.com.) Information on AM can be obtained at www.am.air.org. Information on SPSS Complex Samples can be obtained at www.spss.com/complex_samples.
3 Unlike the NHES:1995 Adult Education data file, no course weights are provided in the NHES:1991 course file. The full sample weight and variables for computing sampling errors are provided in the course file for making adult-level estimates. Information as to the total number of courses that adults took is also available, and procedures similar to those described in the NHES:1995 Adult Education Data File User’s Manual (Collins et al. 1996) could be used to create weights for making course-related estimates. However, it is important to note that the course information collected in the NHES:1991 pertains to the four most recent courses taken, rather than a random sample of courses as was the case in the NHES:1995. 4 This data file contains weights for making “person-course” estimates pertaining to work-related and other formal structured courses. A simple way of doing this is to create a new variable that is the product of the course weight and the variable of interest. The standard weight and variance estimation methods are then applied to the new variable. The weight variables are called WRWGT, for adjusting for the courses adults took in work-related classes, and SAWGT, for adjusting for personal development courses. Weights are required for these types of courses because course-related data were collected only for a random subsample of courses. See the NHES:1995 Adult Education Data File User’s Manual (Collins et al. 1996) for more details. SOURCE: U.S. Department of Education, National Center for Education Statistics, National Household Surveys Program (NHES), 1991-2005.

This page is intentionally blank.

APPENDIX C
NHES:2005 REASONABLENESS TABLES

This page is intentionally blank.

C-1
Table C-1. Percentage distribution for age of subjects of interviews: ECPP-NHES:2005, ASPA-NHES:2005, AE-NHES:2005, and CPS:2003
ECPP-NHES:2005, ASPA-NHES:2005,
and AE-NHES:20051 CPS: 2004
Age category Percent s.e. Percent s.e. 0 through 2 years ........................ 4 # 4 0.1
3 through 5 years ........................ 4 # 5 0.1
6 through 9 years ........................ 6 # 6 0.1
10 through 15 years2................... 7 # 7 0.1
16 through 19 years3................... 3 0.3 3 0.1
20 through 29 years .................... 13 0.3 14 0.1
30 through 39 years .................... 15 0.5 15 0.1
40 through 49 years .................... 17 0.5 16 0.1
50 through 59 years .................... 13 0.4 13 0.1
60 or more years......................... 17 0.4 17 0.1 # Rounds to zero. 1 Estimates of children (age 0 through 15 and enrolled in 8th grade or below) were obtained from the Early Childhood Program Participation (ECPP) Survey, and the After-School Programs and Activities (ASPA) Survey. Estimates of adults (age 16 and older and not enrolled in 12th grade or below) were obtained from the Adult Education (AE) Survey. Parent respondents to the ECPP and ASPA Surveys are not included in calculations for adult estimates. 2 Age category 10 through 15 years only includes students enrolled in grade 8 or below. 3 Age category 16 through 19 years only includes persons not enrolled in grade 12 or below. NOTE: s.e. is standard error. SOURCE: U.S. Department of Education, National Center for Education Statistics, Early Childhood Program Participation (ECPP) Survey of the National Household Education Surveys Program (NHES), 2005; After-School Programs and Activities (ASPA) Survey of the NHES, 2005; and Adult Education (AE) Survey of the NHES, 2005. U.S. Department of Commerce, Bureau of the Census, Current Population Survey (CPS), October 2003.

C-2
Table C-2. Percentage distribution of children ages 0 through 15 not enrolled in school or enrolled in 8th grade or below: ECPP-NHES:2005, ASPA-NHES:2005, and CPS:2003
Child’s current grade
Child’s age
Number of children
(thousands)
Not enrolled
Pre-school/nursery school K 1 2 3 4 5 6 7 8
NHES:2005
0 ....................... 4,487 100
1 ....................... 4,102 100
2 ....................... 3,934 95 5 #
3 ....................... 4,218 56 43 1
4 ....................... 3,859 26 67 7 #
5 ....................... 3,464 2 10 81 7
6 ....................... 3,978 # # 14 81 5 # #
7 ....................... 3,910 # 17 77 5 #
8 ....................... 3,896 # 17 79 4 #
9 ....................... 3,772 # 20 74 5 # #
10 ..................... 4,175 # # # 19 74 6 #
11 ..................... 3,963 # 2 18 75 5 #
12 ..................... 4,335 1 2 21 71 5
13 ..................... 3,837 1 21 78
14 ..................... 896 # 6 94
15 ..................... 51 2 13 85
See notes at end of table.

C-3
Table C-2. Percentage distribution of children ages 0 through 15 not enrolled in school or enrolled in 8th grade or below: ECPP-NHES:2005, ASPA-NHES:2005, and CPS:2003—Continued
Child’s current grade
Child’s age
Number of children
(thousands)
Not enrolled
Pre-school/nursery school K 1 2 3 4 5 6 7 8
CPS:2003
0 ....................... 3,521 100
1 ....................... 3,989 100
2 ....................... 4,095 100
3 ....................... 4,260 58 40 3
4 ....................... 4,076 32 61 7
5 ....................... 3,867 8 17 69 5 1
6 ....................... 3,863 3 2 16 75 4 1
7 ....................... 3,951 1 20 72 6 1
8 ....................... 3,891 4 20 70 4 1
9 ....................... 3,863 2 2 22 66 7 1
10 ..................... 3,898 1 4 24 67 5 1
11 ..................... 4,175 1 4 25 65 4 1
12 ..................... 4,026 1 3 25 66 5
13 ..................... 4,119 1 4 27 68
14 ..................... 1,177 4 16 80
15 ..................... 131 26 74
# Rounds to zero. NOTE: For the NHES, kindergarten (K) includes grades classified as kindergarten, transitional kindergarten, and prefirst grade. Age in the NHES:2005 was recalculated to match the CPS definition of the child’s age as of September 30. Infants born in October, November, or December 2004 were included with 0-year-olds. Homeschoolers are excluded from the NHES estimates, but not the CPS estimates. Detail may not sum to totals because of rounding. SOURCE: U.S. Department of Education, National Center for Education Statistics, Early Childhood Program Participation (ECPP) Survey of the National Household Education Surveys Program (NHES), 2005; After-School Programs and Activities (ASPA) Survey of the NHES, 2005; U.S. Department of Commerce, Bureau of the Census, Current Population Survey (CPS), October 2003.

C-4
Table C-2A. Standard errors of the percentage distribution of children ages 0 through 15 not enrolled in school or enrolled in 8th grade or below: ECPP-NHES:2005, ASPA-NHES:2005, and CPS:2003
Child’s current grade
Child’s age
Number of
children (thousands)
Not enrolled
Center-based
care K 1 2 3 4 5 6 7 8
NHES:2005
0 ....................... 4,487 0
1 ....................... 4,102 0
2 ....................... 3,934 0.6 0.6
3 ....................... 4,218 1.1 1.1 0.3
4 ....................... 3,859 1.5 1.6 0.9
5 ....................... 3,464 0.7 1.3 2.0 1.6
6 ....................... 3,978 1.3 1.3 0.7
7 ....................... 3,910 1.2 1.2 0.8
8 ....................... 3,896 1.3 1.4 0.7
9 ....................... 3,772 1.4 1.5 0.7
10 ..................... 4,175 1.1 1.5 1.0
11 ..................... 3,963 0.7 1.4 1.5 0.7
12 ..................... 4,335 0.3 0.5 1.2 1.3 0.6
13 ..................... 3,837 0.2 1.2 1.2
14 ..................... 896 1.2 1.2
15 ..................... 51 2.0 8.3 8.2
See notes at end of table.

C-5
Table C-2A. Standard errors of the percentage distribution of children ages 0 through 15 not enrolled in school or enrolled in 8th grade or below: ECPP-NHES:2005, ASPA-NHES:2005, and CPS:2003—Continued
Child’s current grade
Child’s age
Number of children
(thousands)
Not enrolled
Pre-school/nursery school K 1 2 3 4 5 6 7 8
CPS:2003
0 ....................... 3,521 0
1 ....................... 3,989 0
2 ....................... 4,095 0
3 ....................... 4,260 1.3 1.3 0.4
4 ....................... 4,076 1.3 1.3 0.7
5 ....................... 3,867 0.8 1.0 1.3 0.6 0.2
6 ....................... 3,863 0.5 0.4 1.0 1.2 0.5 0.3
7 ....................... 3,951 0.3 1.1 1.2 0.7 0.3
8 ....................... 3,891 0.6 1.1 1.3 0.6 0.3
9 ....................... 3,863 0.4 0.4 1.2 1.3 0.7 0.3
10 ..................... 3,898 0.2 0.5 1.2 1.3 0.6 0.2
11 ..................... 4,175 0.3 0.5 1.2 1.3 0.5 0.3
12 ..................... 4,026 0.2 0.5 1.2 1.3 0.6
13 ..................... 4,119 0.3 0.5 1.2 1.3
14 ..................... 1,177 1.0 1.8 2.0
15 ..................... 131 6.7 6.7
NOTE: Blank cells in the table represent estimates that round to zero. Standard errors are not provided for estimates of less than 1 percent. Standard errors increase for children who are 14 and 15 years old. This is because there are small numbers of those children in the grade categories shown above. SOURCE: U.S. Department of Education, National Center for Education Statistics, Early Childhood Program Participation (ECPP) Survey of the National Household Education Surveys Program (NHES), 2005; After-School Programs and Activities (ASPA) Survey of the NHES, 2005; U.S. Department of Commerce, Bureau of the Census, Current Population Survey (CPS), October 2003.

C-6
Table C-3. Number of children age 3 through 8th grade, by school type and by student grade level: ECPP-NHES:2005, ASPA-NHES:2005, and CPS:2003
NHES:2005 CPS:2003
School type and grade
Number(thousands)
s.e. (thousands)1
Number (thousands)
s.e. (thousands)
Total number of children age 3 through 8th grade ................................................................. 45,277 0 45,298 336
School type2
Public ................................................................... 31,341 166 32,227 279
Private .................................................................. 3,970 150 3,976 108 Student grade level
Not enrolled ......................................................... 4,166 0 4,166 110
Preschool/nursery school ..................................... 4,926 0 4,928 120
K .......................................................................... 3,717 0 3,719 104
1 ........................................................................... 4,118 0 4,102 110
2 ........................................................................... 3,900 0 3,902 107
3 ........................................................................... 4,043 0 4,045 109
4 ........................................................................... 3,879 0 3,881 106
5 ........................................................................... 4,094 0 4,096 109
6 ........................................................................... 4,147 0 4,149 110
7 ........................................................................... 4,183 0 4,185 110
8 ........................................................................... 4,105 0 4,107 109 1A value of zero for the standard error indicates that there was no variability in the data given that grade was used as a raking dimension with NHES totals for each grade raked to the CPS. 2 Preschoolers and children who are homeschooled are not included. NOTE: s.e. is standard error. Age in the NHES:2005 estimates was recalculated to match the CPS definition of the child’s age as of September 30. Detail may not sum to totals because of rounding. SOURCE: U.S. Department of Education, National Center for Education Statistics, Early Childhood Program Participation (ECPP) Survey of the National Household Education Surveys Program, (NHES), 2005; After-School Programs and Activities (ASPA) Survey of the NHES, 2005; U.S. Department of Commerce, Bureau of the Census, Current Population Survey (CPS), October 2003.

C-7
Table C-4. Number and percentage of children in kindergarten through 8th grade enrolled in public and private schools: ASPA-NHES:2005 and CPS:2003
School type
Public Private Child’s current grade
Number (thousands) Percent s.e.
Number (thousands) Percent s.e.
ASPA-NHES:2005
K ................................... 3,157 86 1.2 496 14 1.2
1 .................................... 3,554 89 1.2 425 11 1.2
2 .................................... 3,376 89 1.2 437 11 1.2
3 .................................... 3,487 89 1.1 442 11 1.1
4 .................................... 3,399 89 1.4 404 11 1.4
5 .................................... 3,538 89 1.5 451 11 1.5
6 .................................... 3,590 89 1.0 446 11 1.0
7 .................................... 3,727 91 0.9 383 9 0.9
8 .................................... 3,549 88 0.9 494 12 0.9 CPS:2003
K ................................... 3,098 83 1.1 622 17 1.1
1 .................................... 3,646 89 0.9 474 12 0.9
2 .................................... 3,482 89 0.9 420 11 0.9
3 .................................... 3,594 89 0.9 450 11 0.9
4 .................................... 3,495 90 0.8 386 10 0.8
5 .................................... 3,659 89 0.8 437 11 0.8
6 .................................... 3,741 90 0.8 408 10 0.8
7 .................................... 3,784 90 0.8 401 10 0.8
8 .................................... 3,728 91 0.8 378 9 0.8
NOTE: s.e. is standard error. For NHES:2005, kindergarten (K) includes grades reported as kindergarten, transitional kindergarten, and prefirst grade. Grades reported as nursery school, preschool, or prekindergarten are not included. Preschoolers and children who are home schooled are not included. SOURCE: U.S. Department of Education, National Center for Education Statistics, After-School Programs and Activities (ASPA) Survey of the National Household Education Surveys Program (NHES), 2005; U.S. Department of Commerce, Bureau of the Census, Current Population Survey (CPS), October 2003.

C-8
Table C-5. Percentage of children ages 0 through 5 not yet enrolled in kindergarten, by household income: ECPP-NHES:2005 and CPS:2003
ECPP-NHES:2005 CPS:2003
Household income Percent s.e. Percent s.e.
$5,000 or less................................................. 4 0.4 3 0.4
$5,001 to $10,000.......................................... 6 0.4 6 0.5
$10,001 to $15,000........................................ 5 0.4 6 0.5
$15,001 to $20,000........................................ 6 0.4 7 0.5
$20,001 to $25,000........................................ 7 0.4 7 0.5
$25,001 to $30,000........................................ 5 0.4 6 0.5
$30,001 to $35,000........................................ 6 0.4 6 0.5
$35,001 to $40,000........................................ 6 0.4 9 0.6
$40,001 to $50,000........................................ 8 0.4 6 0.5
$50,001 to $60,000........................................ 9 0.5 9 0.6
$60,001 to $75,000........................................ 12 0.5 11 0.6
Over $75,000................................................. 25 0.6 24 0.8
NOTE: s.e. is standard error. CPS estimates exclude cases with missing income data. Details may not sum to totals because of rounding. SOURCE: U.S. Department of Education, National Center for Education Statistics, Early Childhood Program Participation (ECPP) Survey of the National Household Education Surveys Program (NHES), 2005; U.S. Department of Commerce, Bureau of the Census, Current Population Survey (CPS), October 2003.

C-9
Table C-6. Number and percentage of children ages 0 through 5 not yet in kindergarten, by household income level and race/ethnicity: ECPP-NHES:2005 and CPS:2003
Household income
Less than $15,000
$15,001 to $ 30,000
$30,001 to $50,000
More than $50,000
Race/ethnicity
Number of
children (thousands) Percent s.e. Percent s.e. Percent s.e. Percent s.e.
ECPP-NHES:2005
White, non-Hispanic ........ 11,488 8 0.5 12 0.6 21 0.8 59 0.9
Black, non-Hispanic......... 2,962 32 1.1 27 1.6 19 1.7 22 1.5
Hispanic ........................... 4,283 23 1.0 32 1.3 20 1.2 25 1.2
Other ................................ 1,933 12 1.6 18 2.0 18 2.3 51 2.8 CPS:2003
White, non-Hispanic ........ 11,768 8 0.7 14 0.9 21 1.0 57 1.3
Black, non-Hispanic......... 2,951 35 2.6 26 2.4 17 2.1 22 2.3
Hispanic ........................... 4,252 25 2.1 33 2.3 23 2.1 19 2.0
Other ................................ 1,552 18 3.0 19 3.0 15 2.8 50 3.9
NOTE: s.e. is standard error. CPS percentage estimates exclude cases with missing income data. Detail may not sum to totals because of rounding. SOURCE: U.S. Department of Education, National Center for Education Statistics, Early Childhood Program Participation (ECPP) Survey of the National Household Education Surveys Program (NHES), 2005; U.S. Department of Commerce, Bureau of the Census, Current Population Survey (CPS), October 2003.

C-10
Table C-7. Percentage of children in kindergarten through 8th grade, by household income: ASPA-NHES:2005 and CPS:2003
ASPA-NHES:2005 CPS:2003
Household income Percent s.e. Percent s.e.
$5,000 or less.............................................. 4 0.2 3 0.2
$5,001 to $10,000....................................... 4 0.2 6 0.2
$10,001 to $15,000..................................... 5 0.3 5 0.2
$15,001 to $20,000..................................... 5 0.3 6 0.2
$20,001 to $25,000..................................... 7 0.3 6 0.2
$25,001 to $30,000..................................... 6 0.3 7 0.2
$30,001 to $35,000..................................... 6 0.4 6 0.2
$35,001 to $40,000..................................... 5 0.3 9 0.3
$40,001 to $50,000..................................... 9 0.3 6 0.2
$50,001 to $60,000..................................... 9 0.4 10 0.3
$60,001 to $75,000..................................... 12 0.3 10 0.3
Over $75,000.............................................. 29 0.5 27 0.4
NOTE: s.e. is standard error. CPS estimates exclude cases with missing income data. Detail may not sum to totals because of rounding. SOURCE: U.S. Department of Education, National Center for Education Statistics, After-School Programs and Activities (ASPA) Survey of the National Household Education Surveys Program (NHES), 2005; U.S. Department of Commerce, Bureau of the Census, Current Population Survey (CPS), October 2003.

C-11
Table C-8. Number and percentage of children in kindergarten through 8th grade, by household income and race/ethnicity: ASPA-NHES:2005 and CPS:2003
Household income
Less than $15,000
$15,001 to $30,000
$30,001 to $50,000
More than $50,000
Race/ethnicity
Number of
children (thousands) Percent s.e. Percent s.e. Percent s.e. Percent s.e.
ASPA-NHES:2005
White, non-Hispanic ........ 20,934 7 0.4 12 0.5 19 0.7 62 0.7
Black, non-Hispanic......... 5,515 29 0.9 27 1.5 19 1.3 26 1.5
Hispanic ........................... 6,639 19 0.8 29 1.1 22 1.0 30 1.0
Other ................................ 3,098 11 1.3 17 1.9 20 1.9 52 2.7 CPS:2003
White, non-Hispanic ........ 21,466 7 0.3 12 0.4 21 0.5 60 0.6
Black, non-Hispanic......... 5,517 30 1.2 26 1.1 21 1.1 24 1.1
Hispanic ........................... 6,643 21 1.1 28 1.2 27 1.2 24 1.1
Other ................................ 2,577 16 1.4 20 1.5 18 1.4 46 1.8
NOTE: s.e. is standard error. CPS percentage estimates exclude cases with missing income data. Detail may not sum to totals because of rounding. SOURCE: U.S. Department of Education, National Center for Education Statistics, After-School Programs and Activities (ASPA) Survey of the National Household Education Surveys Program (NHES), 2005; U.S. Department of Commerce, Bureau of the Census, Current Population Survey (CPS), October 2003.

C-12
Table C-9. Number and percentage of children enrolled in kindergarten through 8th grade in public and private schools, by race/ethnicity: ASPA-NHES:2005 and CPS:2003
ASPA-NHES:2005 CPS:2003
Public Private Public Private Race/ethnicity
Number of children
(thousands) Percent s.e. Percent s.e.
Number of children
(thousands) Percent s.e. Percent s.e.
White, non-Hispanic................. 20,257 86 0.6 14 0.6 21,466 89 0.4 11 0.4
Black, non-Hispanic................. 5,460 91 1.0 9 1.0 5,517 93 0.6 7 0.6
Hispanic................. 6,588 94 0.6 6 0.6 6,643 94 0.6 6 0.6
Other...................... 3,050 91 1.3 9 1.3 2,577 86 1.0 14 1.0
NOTE: s.e. is standard error. Percentages include only those students for whom public/private enrollment was reported, that is, children whose parents indicated they were enrolled in school. SOURCE: U.S. Department of Education, National Center for Education Statistics, After-School Programs and Activities (ASPA) Survey of the National Household Education Surveys Program (NHES), 2005; U.S. Department of Commerce, Bureau of the Census, Current Population Survey (CPS), October 2003.

C-13
Table C-10. Percentage distribution of the adult population, by sex and age: AE-NHES:2005 and CPS:2004
AE-NHES:2005 CPS:2004
Male Female Male Female Age Estimate s.e. Estimate s.e. Estimate s.e. Estimate s.e.
Total number of adults1 (thousands)............................. 101,596 0 110,011 0 101,596 — 110,011 —
16 to 24 years ............................ 6 0.4 6 0.3 6 0.1 6 0.1
25 to 34 years ............................ 9 0.5 9 0.4 9 0.1 9 0.1
35 to 44 years ............................ 10 0.4 10 0.4 10 0.1 10 0.1
45 to 54 years ............................ 9 0.4 11 0.4 9 0.1 10 0.1
55 years and older...................... 14 0.3 16 0.3 13 0.1 16 0.1
— Not available; computation of approximate standard errors estimated using generalized variance formulas (GVFs) resulted in negative values for the variance estimates. 1 Includes civilian, noninstitutionalized adults, age 16 or older, not enrolled in elementary or secondary school at the time of the interview. NOTE: s.e. is standard error. The percentages provided in this table are cell percentages and sum to 100 over females and males for each dataset. SOURCE: U.S. Department of Education, National Center for Education Statistics, Adult Education (AE) Survey of the National Household Education Surveys Program (NHES), 2005; U.S. Department of Commerce, Bureau of the Census, Current Population Survey (CPS), March 2004.

C-14
Table C-11. Percentage distribution of the adult population by highest educational attainment and race/ethnicity: AE-NHES:2005 and CPS:2004
Highest educational attainment
Less than high school
High school diploma
Associate’s or some college
Bachelor’s or higher
Race/ethnicity
Number of
adults (thousands) Percent s.e. Percent s.e. Percent s.e. Percent s.e.
AE-NHES:2005
Total adults1........................ 211,607 31,017 226 64,334 1,081 58,545 1,366 57,711 814
White, non-Hispanic .............. 146,614 10 0.4 31 0.8 28 0.8 31 0.5
Black, non-Hispanic............... 23,467 19 1.7 35 2.3 27 2.4 19 2.0
Hispanic ................................. 26,101 37 2.1 27 2.2 23 2.3 13 1.5
All other races ........................ 15,427 12 2.3 23 2.9 33 3.4 32 2.8 CPS:2004
Total adults1........................ 211,607 31,852 278 67,850 348 58,092 337 53,813 341
White, non-Hispanic .............. 149,446 10 0.1 33 0.2 29 0.2 28 0.2
Black, non-Hispanic............... 23,437 19 0.5 37 0.6 28 0.5 16 0.4
Hispanic ................................. 26,101 41 0.6 28 0.6 21 0.5 10 0.4
All other races ........................ 12,623 13 0.5 23 0.6 36 0.7 38 0.7 1 Includes civilian, noninstitutionalized adults, age 16 or older, not enrolled in elementary or secondary school at the time of the interview. NOTE: s.e. is standard error. Detail may not sum to totals because of rounding. SOURCE: U.S. Department of Education, National Center for Education Statistics, Adult Education (AE) Survey of the National Household Education Surveys Program (NHES), 2005; U.S. Department of Commerce, Bureau of the Census, Current Population Survey (CPS), March 2004.

C-15
Table C-12. Percentage of children ages 0 through 5 not yet in kindergarten participating in different care arrangements, by race/ethnicity: ECPP-NHES:2005, ECPP-NHES:2001, Parent-NHES:1999, and ECPP-NHES:1995
Type of arrangement
Relative care Nonrelative care Center- or school-
based program
Child’s race/ethnicity
Number of
children (thousands) Percent s.e. Percent s.e. Percent s.e.
ECPP-NHES:2005
White, non-Hispanic ........ 11,488 21 0.9 17 0.9 38 0.9
Black, non-Hispanic......... 2,962 28 2.8 10 1.4 44 2.4
Hispanic ........................... 4,283 21 1.0 10 1.0 25 1.3
Other ................................ 1,933 24 2.6 9 1.3 38 2.7
ECPP-NHES:2001
White, non-Hispanic ........ 12,353 20 0.8 19 0.7 35 0.7
Black, non-Hispanic......... 2,988 35 2.3 13 1.3 40 2.0
Hispanic ........................... 3,693 23 1.3 12 1.1 21 0.9
Other ................................ 1,219 23 2.5 15 2.2 37 2.6 Parent-NHES:1999
White, non-Hispanic ........ 12,515 20 0.8 19 0.8 35 0.7
Black, non-Hispanic......... 2,867 36 2.2 13 1.3 43 2.0
Hispanic ........................... 3,496 26 1.6 13 1.0 23 1.1
Other ................................ 1,347 29 3.2 12 1.6 34 2.7 ECPP-NHES:1995
White, non-Hispanic ........ 13,996 28 0.7 21 0.7 33 0.8
Black, non-Hispanic......... 3,344 31 1.8 12 1.2 33 1.8
Hispanic ........................... 2,838 23 1.3 12 1.0 17 1.1
Other ................................ 1,243 25 2.7 12 1.8 28 2.6
NOTE: s.e. is standard error. Center-based programs include nursery schools, preschools, center-based Head Start programs, and prekindergartens. Relative and nonrelative care could also have been designated as Head Start in 2001 and 2005. Row percentages do not sum to 100 because children may participate in more than one child care arrangement or program or no arrangements or programs. SOURCE: U.S. Department of Education, National Center for Education Statistics, Early Childhood Program Participation (ECPP) Survey of the National Household Education Surveys Program (NHES), 2005; ECPP Survey of the NHES, 2001; Parent Survey of the NHES, 1999; and ECPP Survey of the NHES, 1995.

C-16
Table C-13. Percentage of children ages 3 through 5 not yet in kindergarten participating in center-based programs, by high and low income: ECPP-NHES:2005, ECPP-NHES:2001, Parent-NHES:1999, PFI/CI-NHES:1996, ECPP-NHES:1995, and SR-NHES:1993
ECPP-
NHES:2005 ECPP-
NHES:2001 Parent-
NHES:1999 PFI/CI-
NHES:1996 ECPP-
NHES:1995 SR-
NHES:1993 Income level Percent s.e. Percent s.e. Percent s.e. Percent s.e. Percent s.e. Percent s.e.
High income ... 67 1.2 69 1.3 71 1.4 72 1.6 76 1.8 75 1.4
Low income.... 53 4.5 46 3.8 56 3.2 43 2.9 49 3.2 47 2.0
NOTE: s.e. is standard error. Center-based programs include nursery schools, preschools, center-based Head Start programs, and prekindergartens. High income was defined as household income of over $50,000. Low income was defined as household income of $10,000 or less. SOURCE: U.S. Department of Education, National Center for Education Statistics, Early Childhood Program Participation (ECPP) Survey of the National Household Education Surveys Program (NHES), 2005; ECPP Survey of the NHES, 2001; Parent Survey of the NHES, 1999; Parent and Family Involvement in Education/Civic Involvement (PFI/CI) Survey of the NHES, 1996; ECPP Survey of the NHES, 1995; and School Readiness (SR) Survey of the NHES, 1993.

C-17
Table C-14. Percentage of children ages 0 through 5 not yet in kindergarten participating in center-based programs, by household income: ECPP-NHES:2005, ECPP-NHES:2001, Parent-NHES:1999, and ECPP-NHES:1995
ECPP-NHES:2005ECPP-
NHES:2001 Parent-NHES:1999 ECPP-
NHES:1995 Household income Percent s.e. Percent s.e. Percent s.e. Percent s.e.
$10,000 or less....................... 29 2.8 25 2.2 29 2.0 17 1.5
$10,001–$20,000................... 29 2.1 30 1.5 30 1.7 18 1.4
$20,001–$30,000................... 29 2.7 27 1.6 30 1.6 21 1.2
$30,001–$40,000................... 30 2.2 30 1.9 31 1.6 23 1.6
$40,001–$50,000................... 29 2.2 26 2.0 35 1.8 31 1.8
Over $50,000......................... 44 0.9 42 0.9 42 1.1 43 1.2
NOTE: s.e. is standard error. Center-based programs include nursery schools, preschools, Head Start programs, and prekindergartens. SOURCE: U.S. Department of Education, National Center for Education Statistics, Early Childhood Program Participation (ECPP) Survey of the National Household Education Surveys Program (NHES), 2005; ECPP Survey of the NHES, 2001; Parent Survey of the NHES, 1999; and ECPP Survey of the NHES, 1995.

C-18
Table C-15. Percentage of children ages 0 through 5 not yet in kindergarten, by family structure, parents’ highest level of education, and urbanicity of ZIP Code area: ECPP-NHES:2005, ECPP-NHES:2001, Parent-NHES:1999, and ECPP-NHES:1995
ECPP-
NHES:2005 ECPP-
NHES:2001 Parent-
NHES:1999 ECPP-
NHES:1995 Family and community characteristics Percent s.e. Percent s.e. Percent s.e. Percent s.e.
Family structure
Mother and father.................... 79 0.6 77 0.5 73 0.7 73 0.5 Mother..................................... 18 0.5 20 0.5 23 0.7 24 0.6 Father ...................................... 2 0.3 2 0.2 2 0.2 1 0.1 Nonparent guardian(s) ............ 2 0.2 1 0.2 2 0.2 2 0.2
Parents’ highest education
Less than high school.............. 7 0.5 9 0.5 9 0.5 11 0.5 High school graduate .............. 25 0.8 26 0.8 26 0.6 32 0.7 Some college........................... 27 0.8 29 0.7 30 0.8 28 0.6 College graduate ..................... 22 0.6 20 0.5 20 0.6 17 0.5 Graduate school ...................... 19 0.7 16 0.5 15 0.5 13 0.6
Household urbanicity1
Urban ...................................... 79 # — — — — — — Urban, inside urbanized area... — — 64 0.5 65 0.6 65 0.6 Urban, outside urbanized area.......................................... — — 11 0.5 12 0.5 11 0.4 Rural ....................................... 21 # 24 # 23 0.5 23 0.4
— Not available. # Rounds to zero. 1 Urbanicity is reported as urban or rural in 2005. NOTE: s.e. is standard error. Mother and father refer to birth, adoptive, step, or foster parents. Detail may not sum to totals because of rounding. SOURCE: U.S. Department of Education, National Center for Education Statistics, Early Childhood Program Participation (ECPP) Survey of the National Household Education Surveys Program (NHES), 2005; ECPP Survey of the NHES, 2001; Parent Survey of the NHES, 1999; and ECPP Survey of the NHES, 1995.

C-19
Table C-16. Number and percentage of children ages 0 through 5 not yet in kindergarten, by parents’ highest level of education and race/ethnicity: ECPP-NHES:2005, ECPP-NHES:2001, Parent-NHES:1999, and ECPP-NHES:1995
Parents’ highest level of education
Less than high
school High school Some college
College
graduate Graduate school
Race/ethnicity
Number of
children
(thousands) Percent s.e. Percent s.e. Percent s.e. Percent s.e. Percent s.e.
ECPP-NHES:2005
White, non-Hispanic ........... 11,488 2 0.4 20 0.9 26 0.9 28 0.9 24 1.1
Black, non-Hispanic............ 2,962 8 1.4 37 2.7 32 2.9 16 1.7 7 1.0
Hispanic.............................. 4,283 19 1.3 35 1.6 26 1.3 11 1.0 8 0.9
Other ................................... 1,933 3 1.4 18 2.1 28 3.0 19 1.8 32 2.6
ECPP-NHES:2001
White, non-Hispanic ........... 12,353 4 0.5 23 0.9 29 0.9 24 0.8 19 0.8
Black, non-Hispanic............ 2,988 16 2.0 31 2.4 33 2.3 11 1.0 8 1.0
Hispanic.............................. 3,693 24 1.3 34 1.6 25 1.2 11 0.8 7 0.7
Other ................................... 1,219 5 1.2 24 2.8 23 2.5 20 2.2 29 2.7
Parent-NHES:1999
White, non-Hispanic ........... 12,515 3 0.4 22 0.8 30 1.0 25 0.9 19 0.8
Black, non-Hispanic............ 2,867 13 1.4 34 2.0 34 1.8 12 1.4 8 1.2
Hispanic.............................. 3,496 26 1.6 32 1.4 27 1.4 10 1.0 6 0.7
Other ................................... 1,347 10 2.2 21 2.2 25 2.3 23 2.5 21 2.4
ECPP-NHES:1995
White, non-Hispanic ........... 13,996 5 0.5 28 0.8 29 0.8 21 0.6 17 0.8
Black, non-Hispanic............ 3,344 19 2.0 41 2.1 28 1.6 8 1.1 4 0.7
Hispanic.............................. 2,838 30 1.4 35 1.4 23 1.3 6 0.6 6 0.7
Other ................................... 1,243 9 2.1 26 3.2 30 3.1 17 2.5 18 2.0
NOTE: s.e. is standard error. Detail may not sum to totals because of rounding. SOURCE: U.S. Department of Education, National Center for Education Statistics, Early Childhood Program Participation (ECPP) Survey of the National Household Education Surveys Program (NHES), 2005; ECPP Survey of the NHES, 2001; Parent Survey of the NHES, 1999; and ECPP Survey of the NHES, 1995.

C-20
Table C-17. Percentage of children ages 3 through 5 whose parents reported reading to them regularly: ECPP-NHES:2005, ECPP-NHES:2001, Parent-NHES:1999, PFI/CI-NHES:1996, ECPP-NHES:1995, and SR-NHES:1993
Survey Percent s.e.
ECPP-NHES:2005 ......................................................................... 86 0.8
ECPP-NHES:2001 ......................................................................... 84 0.8
Parent-NHES:1999 ........................................................................ 82 0.7
PFI/CI-NHES:1996........................................................................ 72 1.2
ECPP-NHES:1995 ......................................................................... 72 0.7
SR-NHES:1993.............................................................................. 66 0.8
NOTE: s.e. is standard error. Children enrolled in kindergarten or above are not included. Regularly is defined as reading every day or telling a story three times a week or more. SOURCE: U.S. Department of Education, National Center for Education Statistics, Early Childhood Program Participation (ECPP) Survey of the National Household Education Surveys Program (NHES), 2005; ECPP Survey of the NHES, 2001; Parent Survey of the NHES, 1999; Parent and Family Involvement in Education/Civic Involvement (PFI/CI) Survey of the NHES, 1996; ECPP Survey of the NHES, 1995; and School Readiness (SR) Survey of the NHES, 1993.

C-21
Table C-18. Percentage of children ages 3 through 5 with specific disabilities: ECPP-NHES:2005, ECPP-NHES:2001, Parent-NHES:1999, and PFI/CI-NHES:1996
ECPP-
NHES:2005 ECPP-
NHES:2001 Parent-
NHES:1999 PFI/CI-
NHES:1996 Disability Percent s.e. Percent s.e. Percent s.e. Percent s.e
Learning disability..................... 2 0.3 1 0.2 2 0.3 2 0.4
Mental retardation ..................... # (1) # (1) # (1) # (1)
Speech impairment .................... 10 0.6 6 0.5 7 0.5 7 0.6
Serious emotional disturbance ................................ 1 0.2 1 0.2 1 0.2 1 0.2
Deafness or another hearing impairment.................... 1 0.2 1 0.3 1 0.2 1 0.3
Blindness or another visual impairment ................................ 1 0.3 2 0.3 2 0.3 1 0.2
An orthopedic impairment......... 1 0.3 1 0.2 1 0.2 2 0.3
Another health impairment lasting 6 months or more ........... 3 0.4 5 0.5 5 0.4 6 0.6
Percent with any disability ........ 15 0.8 13 0.8 14 0.8 14 0.7
# Rounds to zero. 1 Standard errors are not provided for estimates of less than 1 percent. NOTE: s.e. is standard error. SOURCE: U.S. Department of Education, National Center for Education Statistics, Early Childhood Program Participation (ECPP) Survey of National Household Education Surveys Program (NHES), 2005; ECPP Survey of the NHES, 2001; Parent Survey of NHES, 1999; and Parent and Family Involvement/Civic Involvement (PFI/CI) Survey of NHES, 1996.

C-22
Table C-19. Percentage of children enrolled in kindergarten through 8th grade participating in various types of care arrangements or programs after school, by race/ethnicity: ASPA-NHES:2005, ASPA-NHES:2001, and Parent-NHES:1999
Type of arrangement
Relative care Nonrelative
care
Center- or school-based
program Self-care
Child’s race/ethnicity
Number of children
(thousands) Percent s.e. Percent s.e. Percent s.e. Percent s.e
ASPA-NHES:2005
White, non-Hispanic ........ 20,229 14 0.5 6 0.4 17 0.6 13 0.5
Black, non-Hispanic......... 5,457 23 2.0 5 0.9 33 2.1 18 1.3
Hispanic ........................... 6,580 15 0.9 6 0.8 24 1.3 13 0.8
Other ................................ 3,046 17 1.9 6 0.9 23 2.3 15 1.5
ASPA-NHES:2001
White, non-Hispanic ........ 22,938 15 0.6 6 0.4 15 0.6 13 0.4
Black, non-Hispanic......... 5,863 26 1.6 6 0.8 29 1.8 19 1.3
Hispanic ........................... 5,743 17 1.2 7 0.8 21 1.2 12 0.8
Other ................................ 2,135 14 1.8 4 0.8 23 2.2 14 1.7 Parent-NHES:1999
White, non-Hispanic ........ 23,273 15 0.5 7 0.4 15 0.5 11 0.4
Black, non-Hispanic......... 5,869 27 1.4 6 0.8 27 1.6 11 1.0
Hispanic ........................... 5,394 20 1.0 6 0.6 15 0.9 8 0.7
Other ................................ 1,850 21 2.4 7 1.1 20 1.9 11 1.6
NOTE: s.e. is standard error. Does not include homeschooled children. Children may have participated in more than one type of child care arrangement or program. SOURCE: U.S. Department of Education, National Center for Education Statistics, After-School Programs and Activities (ASPA) Survey of the National Household Education Surveys Program (NHES), 2005; Before- and After-School Programs and Activities (ASPA) Survey of the NHES, 2001; and Parent Survey of the NHES, 1999.

C-23
Table C-20. Percentage of students in kindergarten through 3rd grade participating in center- or school-based programs after school, by high and low income: ASPA-NHES:2005, ASPA-NHES:2001, Parent-NHES:1999, and ECPP-NHES:1995
ASPA-NHES:2005 ASPA-NHES:2001 Parent-NHES:1999 ECPP-NHES:1995 Income level Percent s.e. Percent s.e. Percent s.e. Percent s.e.
High income ............... 25 1.4 25 1.3 18 0.6 20 1.1
Low income................ 28 5.1 25 4.4 19 1.8 11 1.6
NOTE: s.e. is standard error. High income was defined as household income of over $50,000. Low income was defined as household income of $10,000 or less. SOURCE: U.S. Department of Education, National Center for Education Statistics, and After-School Programs and Activities (ASPA) Survey of the National Household Education Surveys Program (NHES), 2005; Before- and After-School Programs and Activities (ASPA) Survey of the NHES; 2001; Parent Survey of the NHES, 1999; and Early Childhood Program Participation (ECPP) Survey of NHES, 1995.

C-24
Table C-21. Percentage of children enrolled in kindergarten through 8th grade participating in center- or school-based programs after school, by household income: ASPA-NHES:2005, ASPA-NHES:2001, and Parent-NHES:1999
ASPA-NHES:2005 ASPA-NHES:2001 Parent-NHES:1999
Household income Percent s.e. Percent s.e. Percent s.e.
$10,000 or less.......................... 25 2.7 24 2.7 19 1.8
$10,001–$20,000...................... 23 1.8 22 1.6 17 1.3
$20,001–$30,000...................... 23 1.5 18 1.5 18 1.0
$30,001–$40,000...................... 22 2.1 16 1.2 17 1.0
$40,001–$50,000...................... 17 1.7 18 1.7 15 1.0
Over $50,000............................ 21 0.8 19 0.7 18 0.6
NOTE: s.e. is standard error. SOURCE: U.S. Department of Education, National Center for Education Statistics, After-School Programs and Activities (ASPA) Survey of the National Household Education Surveys Program (NHES), 2005; Before- and After-School Programs and Activities (ASPA) Survey of the NHES, 2001; and Parent Survey of the NHES, 1999.

C-25
Table C-22. Percentage of children in kindergarten through 8th grade, by family structure, parents’ highest level of education, and urbanicity of ZIP Code area: ASPA-NHES:2005, PFI-NHES:2003, ASPA-NHES:2001, Parent-NHES:1999, and PFI/CI-NHES:1996
ASPA-NHES:2005 PFI-NHES:2003 ASPA-NHES:2001 Parent-NHES:1999 PFI/CI-NHES:1996
Family and community characteristics Percent s.e. Percent s.e. Percent s.e. Percent s.e. Percent s.e.
Family structure
Mother and father.................................... 72 0.6 72 0.7 70 0.6 66 0.4 69 0.5
Mother..................................................... 21 0.6 22 0.7 24 0.5 27 0.4 25 0.4
Father ...................................................... 4 0.3 4 0.3 3 0.3 4 0.2 3 0.2
Nonparent guardian(s) ............................ 3 0.2 3 0.2 3 0.2 3 0.2 3 0.2
Parents’ highest education
Less than high school.............................. 7 0.3 7 0.4 9 0.4 9 0.3 10 0.3
High school graduate .............................. 26 0.6 25 0.7 29 0.7 28 0.5 31 0.5
Some college........................................... 29 0.6 32 0.7 29 0.6 30 0.5 30 0.6
College graduate ..................................... 21 0.5 20 0.6 18 0.5 17 0.4 15 0.4
Graduate school ...................................... 18 0.5 17 0.5 15 0.4 16 0.5 13 0.4
Household urbanicity1
Urban ...................................................... 79 # † † † † † † † †
Urban, inside urbanized area................... † † 69 0.5 63 0.5 63 0.4 62 0.5
Urban, outside urbanized area................. † † 11 0.4 12 0.5 12 0.4 14 0.5
Rural ....................................................... 21 # 20 0.3 25 0.0 25 0.4 25 0.3
† Not applicable; urbanicity is categorized as urban or rural in NHES:2005, but with the three-category (urban, inside urbanized area; urban, outside urbanized area; rural) classification prior to NHES:2005. # Rounds to zero. NOTE: s.e. is standard error. Mother and father refer to birth, adoptive, step, or foster parents. Detail may not sum to totals because of rounding. SOURCE: U.S. Department of Education, National Center for Education Statistics, After-School Programs and Activities (ASPA) Survey of the National Household Education Surveys Program (NHES), 2005; Parent and Family Involvement (PFI) Survey of the NHES, 2003; Before- and After-School Programs and Activities (ASPA) Survey of the NHES, 2001; Parent Survey of the NHES, 1999; and Parent and Family Involvement/Civic Involvement (PFI/CI) Survey of the NHES, 1996.

C-26
Table C-23. Number and percentage of students in kindergarten through 8th grade, by parents’ highest level of education and race/ethnicity: ASPA-NHES:2005, PFI-NHES:2003, ASPA-NHES:2001, Parent-NHES:1999, and PFI/CI-NHES:1996
Parents’ highest level of education
Less than high
school High school Some college
College
graduate Graduate school
Race/ethnicity
Number of
children
(thousands) Percent s.e. Percent s.e. Percent s.e. Percent s.e. Percent s.e.
ASPA-NHES:2005
White, non-Hispanic ........... 20,934 2 0.3 22 0.7 28 0.8 26 0.7 22 0.8
Black, non-Hispanic............ 5,515 10 1.1 34 1.9 33 1.8 14 1.4 10 1.1
Hispanic.............................. 6,639 23 1.0 32 1.6 25 1.2 13 1.1 8 0.7
Other ................................... 3,098 3 0.7 23 2.2 33 2.5 20 1.7 22 1.9
PFI-NHES:2003
White, non-Hispanic ........... 22,633 3 0.4 21 1.0 32 0.9 24 0.9 20 0.8
Black, non-Hispanic............ 5,963 11 1.5 33 1.8 35 1.6 12 1.2 9 1.2
Hispanic.............................. 6,048 20 1.3 32 1.5 29 1.5 10 1.0 8 0.8
Other ................................... 2,219 2 0.8 21 3.0 28 3.0 22 2.4 28 2.9
ASPA-NHES:2001
White, non-Hispanic ........... 22,938 3 0.3 26 0.8 31 0.9 22 0.7 18 0.6
Black, non-Hispanic............ 5,863 13 1.4 38 2.0 31 1.7 12 0.9 6 0.6
Hispanic.............................. 5,743 28 1.4 32 1.4 24 1.3 9 0.7 6 0.6
Other ................................... 2,135 5 1.0 23 2.5 23 2.2 20 2.2 29 2.8
Parent-NHES:1999
White, non-Hispanic ........... 23,273 3 0.3 25 0.6 32 0.7 20 0.7 20 0.6
Black, non-Hispanic............ 5,869 11 1.1 41 1.4 30 1.4 10 0.7 8 0.8
Hispanic.............................. 5,394 30 1.4 29 1.4 25 1.1 9 0.7 7 0.6
Other ................................... 1,850 5 1.2 22 2.0 27 2.7 20 1.9 25 2.5
PFI/CI-NHES:1996
White, non-Hispanic ........... 23,738 5 0.4 28 0.6 32 0.7 19 0.6 16 0.4
Black, non-Hispanic............ 5,792 15 1.1 42 1.6 30 1.4 8 0.6 5 0.6
Hispanic.............................. 4,677 31 1.4 34 1.5 21 1.3 7 0.9 7 0.8
Other ................................... 1,506 6 1.2 26 2.1 31 2.4 20 2.3 18 1.8
NOTE: s.e. is standard error. Detail may not sum to totals because of rounding. SOURCE: U.S. Department of Education, National Center for Education Statistics, After-School Programs and Activities (ASPA) Survey of the National Household Education Surveys Program (NHES), 2005; Parent and Family Involvement (PFI) Survey of NHES, 2003; Before- and After-School Programs and Activities (ASPA) Survey of NHES, 2001; Parent Survey of NHES, 1999; and Parent and Family Involvement/Civic Involvement (PFI/CI) Survey of NHES, 1996.
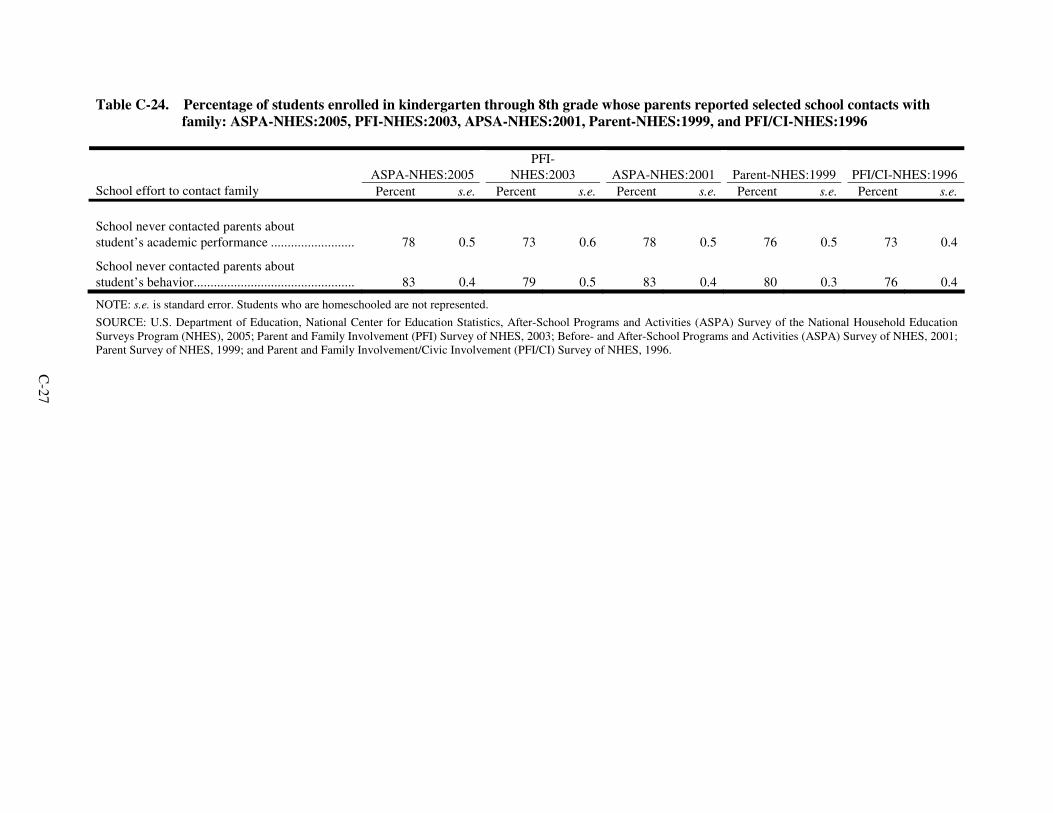
C-27
Table C-24. Percentage of students enrolled in kindergarten through 8th grade whose parents reported selected school contacts with family: ASPA-NHES:2005, PFI-NHES:2003, APSA-NHES:2001, Parent-NHES:1999, and PFI/CI-NHES:1996
ASPA-NHES:2005PFI-
NHES:2003 ASPA-NHES:2001 Parent-NHES:1999 PFI/CI-NHES:1996 School effort to contact family Percent s.e. Percent s.e. Percent s.e. Percent s.e. Percent s.e.
School never contacted parents about student’s academic performance ......................... 78 0.5 73 0.6 78 0.5 76 0.5 73 0.4
School never contacted parents about student’s behavior................................................ 83 0.4 79 0.5 83 0.4 80 0.3 76 0.4
NOTE: s.e. is standard error. Students who are homeschooled are not represented.
SOURCE: U.S. Department of Education, National Center for Education Statistics, After-School Programs and Activities (ASPA) Survey of the National Household Education Surveys Program (NHES), 2005; Parent and Family Involvement (PFI) Survey of NHES, 2003; Before- and After-School Programs and Activities (ASPA) Survey of NHES, 2001; Parent Survey of NHES, 1999; and Parent and Family Involvement/Civic Involvement (PFI/CI) Survey of NHES, 1996.

C-28
Table C-25. Percentage of children in kindergarten through 8th grade with specific disabilities: ASPA-NHES:2005, PFI-NHES:2003, ASPA-NHES:2001, Parent-NHES:1999, and PFI/CI-NHES:1996
ASPA-
NHES:2005 PFI-
NHES:2003 ASPA-
NHES:2001 Parent-
NHES:1999 PFI/CI-
NHES:1996 Disability Percent s.e. Percent s.e. Percent s.e. Percent s.e. Percent s.e
Learning disability....................................................... 7 0.3 8 0.4 9 0.4 9 0.4 9 0.4
Mental retardation ....................................................... 1 0.1 1 0.1 1 0.2 1 0.1 1 0.1
Speech impairment ...................................................... 9 0.4 7 0.3 5 0.3 5 0.3 7 0.3
Serious emotional disturbance..................................... 2 0.2 3 0.3 2 0.2 3 0.3 3 0.3
Deafness or another hearing impairment..................... 2 0.3 2 0.1 1 0.1 1 0.1 2 0.2
Blindness or another visual impairment ...................... 4 0.3 8 0.3 4 0.2 5 0.2 5 0.3
An orthopedic impairment........................................... 2 0.1 2 0.2 1 0.1 1 0.1 2 0.2
Another health impairment lasting 6 months or more............................................................................. 6 0.3 7 0.3 6 0.3 6 0.3 7 0.3
Percent with any disability .......................................... 21 0.5 25 0.5 19 0.5 21 0.4 24 0.7
NOTE: s.e. is standard error. SOURCE: U.S. Department of Education, National Center for Education Statistics, After-School Programs and Activities (ASPA) Survey of the National Household Education Surveys Program (NHES), 2005; Parent and Family Involvement (PFI) Survey of NHES, 2003; Before- and After-School Programs and Activities (ASPA) Survey of NHES, 2001; Parent Survey of the NHES, 1999; and Parent and Family Involvement/Civic Involvement (PFI/CI) Survey of NHES, 1996.

C-29
Table C-26. Percentage of adults who worked for pay or income in the past 12 months: AE-NHES:2005, AELL-NHES:2001, AE-NHES:1999, and CPS:2004
AE-NHES:2005 AELL-NHES:2001 AE-NHES:1999 CPS:2004 Worked in the past 12 months Estimate s.e. Estimate s.e. Estimate s.e. Estimate s.e.
Total number of adults1 (thousands) ............................. 211,607 † 198,803 † 194,625 † 211,607 †
Worked in the past 12 months .......................................... 72 0.5 73 0.4 76 0.6 69 0.2
Did not work in the past 12 months.................................. 28 0.5 27 0.4 24 0.6 31 0.2
† Not applicable. 1 Includes civilian, noninstitutionalized adults, age 16 or older, not enrolled in elementary or secondary school at the time of the interview.
SOURCE: U.S. Department of Education, National Center for Education Statistics, Adult Education (AE) Survey of the National Household Education Surveys Program (NHES), 2005; Adult Education and Lifelong Learning (AELL) Survey of NHES, 2001; AE Survey of NHES, 1999; U.S. Department of Commerce, Bureau of the Census, Current Population Survey (CPS), March 2004.

C-30
Table C-27. Percentage distribution of the employed adult population, by industry: AE-NHES:2005 and CPS:2004
AE-NHES:2005 CPS:2004 Industry Estimate s.e. Estimate s.e.
Total number of adults1 (thousands) ................................ 211,607 0 211,607 †
Number of adults reporting industry (thousands) ................ 152,450 1,150 143,780 252
Agriculture, forestry, and fishing ..................................... 2 0.3 2 0.1
Mining.............................................................................. # 0.1 # 0.1
Construction..................................................................... 6 0.5 8 0.1
Manufacturing.................................................................. 13 0.6 12 0.1
Transportation, public utilities, and sanitary services............................................................................. 6 0.5 5 0.1
Wholesale trade................................................................ 2 0.4 3 0.1
Retail trade....................................................................... 14 0.8 17 0.1
Finance, insurance, and real estate................................... 7 0.6 7 #
Services, except health and education.............................. 17 0.8 18 #
Health services ................................................................. 12 0.6 12 0.1
Educational services......................................................... 10 0.5 9 0.2
Public administration ....................................................... 6 0.4 5 0.2
Information ...................................................................... 3 0.3 3 0.1
Nonclassifiable establishments/not employed ................. # 0.1 # 0.1
† Not applicable. # Rounds to zero. 1 Includes civilian, noninstitutionalized adults, age 16 or older, not enrolled in elementary or secondary school at the time of the interview. NOTE: s.e. is standard error. Detail may not sum to totals because of rounding. SOURCE: U.S. Department of Education, National Center for Education Statistics, Adult Education (AE) Survey of the National Household Education Surveys Program (NHES), 2005. U.S. Department of Commerce, Bureau of the Census, Current Population Survey (CPS), March 2004.

C-31
Table C-28. Percentage distribution of the employed adult population, by occupation: AE-NHES:2005 and CPS:2004
AE-NHES:2005 CPS:2004 Occupation Estimate s.e. Estimate s.e.
Total number of adults (thousands)1 ................................ 211,607 0 211,607 †
Number of adults reporting occupation (thousands) ........... 152,450 1,150 143,780 252
Executive, administrative, and managerial occupations ......................................................................
10
0.5
14
0.2
Engineers, surveyors, and architects ................................ 1 0.2 2 # Natural scientists and mathematicians2 ............................ 3 0.3 3 0.1 Social scientists, social workers, religious workers, and lawyers ......................................................................
3
0.3
3
0.1
Education, training, and library occupations.................... 7 0.4 6 0.1 Healthcare practitioner and technical occupations .......... 5 0.4 5 0.2 Writers, artists, entertainers, and athletes......................... 2 0.3 2 0.1 Technologists and technicians, except health3 ................. 1 0.2 † † Marketing and sales occupations ..................................... 11 0.7 11 0.1
Administrative support occupations, including clerical..............................................................................
16
0.8
14
0.1
Service occupations ......................................................... 14 0.7 16 # Agricultural, forestry, and fishing occupations ................ 2 0.3 1 0.1 Mechanics and repairers................................................... 4 0.3 4 0.1 Construction and extractive occupations ......................... 6 0.5 6 0.2 Precision and production working occupations ............... 8 0.5 7 0.1 Transportation and material moving occupations ............ 6 0.5 6 0.1
Miscellaneous occupations .............................................. 1 0.1 # 0.1
† Not applicable. # Rounds to zero. 1 Includes civilian, noninstitutionalized adults, age 16 or older, not enrolled in elementary or secondary school at the time of the interview. 2 Due to the inability to disaggregate social scientists from life and physical scientists with the CPS data, social scientists are included under this category for the CPS data whereas social scientists are included under the “Social scientists, social workers, religious workers, and lawyers” category for the NHES data. 3 For the NHES data, various technicians engaged in the fields of architecture, engineering, natural science, and social science are included in this category but there is no such category for the CPS data. For the CPS data, these individuals would be categorized within corresponding occupational classifications, e.g. engineering technicians under Engineers, surveyors, and architects. NOTE: s.e. is standard error. Detail may not sum to totals because of rounding. SOURCE: U.S. Department of Education, National Center for Education Statistics, Adult Education (AE) Survey of the National Household Education Surveys Program (NHES), 2005; U.S. Department of Commerce, Bureau of the Census, Current Population Survey (CPS), March 2004.

C-32
Table C-29. Percentage of adults who participated in adult education activities in the past 12 months: AE-NHES:2005, AELL-NHES:2001, AE-NHES:1999, and AE-NHES:1995
AE-NHES:2005 AELL-NHES:2001 AE-NHES:1999 AE-NHES:1995
Types of adult education participation Estimate s.e. Estimate s.e. Estimate s.e. Estimate s.e.
Total number of adults1 (thousands) .................................................. 211,607 0 198,803 0 194,625 0 189,576 153
Participation in any adult education, including full-time credential programs only........................................................................................ 48 0.8 49 0.5 48 0.8 45 0.5
Participation in any adult education, excluding full-time credential programs only........................................................................................ 44 0.7 46 0.5 45 0.7 40 0.5 1 Includes civilian, noninstitutionalized adults, age 16 or older, not enrolled in elementary or secondary school at the time of the interview. NOTE: Adult education includes adult basic education, ESL classes, credential programs, apprenticeship programs, work-related education or training, and personal interest/development courses. SOURCE: U.S. Department of Education, National Center for Education Statistics, Adult Education (AE) Survey of the National Household Education Surveys Program (NHES) 2005; Adult Education and Lifelong Learning (AELL) Survey of NHES, 2001; AE Survey of NHES, 1999; AE Survey of NHES, 1995.

C-33
Table C-30. Number and percentage of adults who participated in adult education activities in the past 12 months, by characteristics of adults: AE-NHES:2005, AELL-NHES:2001, AE-NHES:1999, and AE-NHES:1995
Adult education participants in the past 12 months
Characteristics Number
(thousands) Number
(thousands) s.e.
(thousands) Percent s.e.
AE-NHES:2005
Total adults1 ................................................ 211,607 93,939 1,562 44 0.7 Age
16–24 years ................................................. 25,104 13,286 843 53 2.7 25–34 years ................................................. 38,784 20,229 982 52 2.2 35–44 years ................................................. 42,890 20,896 1,028 49 2.0 45–54 years ................................................. 41,840 20,032 858 48 1.5 55 years and over ........................................ 62,989 19,496 732 31 1.1
Sex
Male ............................................................ 101,596 41,724 1,215 41 1.2 Female......................................................... 110,011 52,216 1,110 47 1.0
Race/ethnicity
White, non-Hispanic ................................... 146,613 66,909 1,306 46 0.8 Black, non-Hispanic.................................... 23,467 10,878 660 46 2.8 Hispanic ...................................................... 26,101 9,824 634 38 2.4 Other race, non-Hispanic ............................ 15,426 6,328 515 41 2.6
Household income
$10,000 or less ............................................ 13,108 4,219 397 32 3.0 $10,001 to 30,000 ....................................... 46,316 13,616 742 29 1.5 $30,001 to 50,000 ....................................... 44,461 18,705 1,065 42 1.9 $50,001 to 75,000 ....................................... 47,114 22,494 1,007 48 1.7 More than $75,000...................................... 60,607 34,904 1,067 58 1.5
Marital status
Never married ............................................. 44,451 22,346 963 50 2.0 Currently married........................................ 132,008 58,748 1,337 45 0.9 Other ........................................................... 35,147 12,846 640 37 1.6
Educational attainment
Less than high school.................................. 31,017 6,851 520 22 1.7 High school ................................................. 64,334 20,955 975 32 1.5 Associate’s degree or some college ............ 58,545 30,070 1,164 51 1.4 Bachelor’s degree or higher ........................ 57,711 36,063 882 63 1.2
See notes at end of table.

C-34
Table C-30. Number and percentage of adults who participated in adult education activities in the past 12 months, by characteristics of adults: AE-NHES:2005, AELL-NHES:2001, AE-NHES:1999, and AE-NHES:1995—Continued
Adult education participants in the past 12 months
Characteristics Number
(thousands) Number
(thousands) s.e.
(thousands) Percent s.e.
AELL-NHES:2001
Total adults1 ................................................ 198,803 92,278 1,089 46 0.5 Age
16–24 years ................................................. 23,523 12,420 533 53 2.0 25–34 years ................................................. 38,325 20,432 669 53 1.6 35–44 years ................................................. 43,355 23,304 689 54 1.2 45–54 years ................................................. 38,109 20,368 664 53 1.4 55 years and over ........................................ 55,490 15,755 537 28 0.9
Sex
Male ............................................................ 94,955 40,897 788 43 0.8 Female......................................................... 103,848 51,382 808 50 0.8
Race/ethnicity
White, non-Hispanic ................................... 144,147 68,335 923 47 0.6 Black, non-Hispanic.................................... 22,186 9,605 333 43 1.5 Hispanic ...................................................... 21,537 8,984 490 42 2.3 Other race, non-Hispanic ............................ 10,932 5,355 402 49 2.5
Household income
$10,000 or less ............................................ 15,433 4,153 305 27 2.0 $10,001 to 30,000 ....................................... 52,027 17,277 597 33 1.1 $30,001 to 50,000 ....................................... 44,696 20,848 690 47 1.3 $50,001 to 75,000 ....................................... 40,725 22,699 793 56 1.5 More than $75,000...................................... 45,922 27,302 688 59 1.3
Marital status
Never married ............................................. 41,829 21,089 696 50 1.4 Currently married........................................ 121,455 57,644 984 47 0.7 Other ........................................................... 35,519 13,545 488 38 1.3
Educational attainment
Less than high school.................................. 31,343 6,957 473 22 1.5 High school ................................................. 64,606 21,692 677 34 0.9 Associate’s degree or some college ............ 52,559 30,273 815 58 1.1 Bachelor’s degree or higher ........................ 50,295 33,357 676 66 1.1
See notes at end of table.

C-35
Table C-30. Number and percentage of adults who participated in adult education activities in the past 12 months, by characteristics of adults: AE-NHES:2005, AELL-NHES:2001, AE-NHES:1999, and AE-NHES:1995—Continued
Adult education participants in the past 12 months
Characteristics Number
(thousands) Number
(thousands) s.e.
(thousands) Percent s.e.
AE-NHES:1999
Total adults1 ................................................ 194,625 86,659 1,437 45 0.7 Age
16–24 years ................................................. 23,438 11,739 740 50 2.7 25–34 years ................................................. 37,851 21,314 970 56 2.0 35–44 years ................................................. 45,299 22,781 841 50 1.8 45–54 years ................................................. 35,193 17,082 737 49 2.1 55 years and over ........................................ 52,845 13,743 700 26 1.2
Sex
Male ............................................................ 93,137 38,831 1,039 42 1.1 Female......................................................... 101,488 47,828 963 47 1.0
Race/ethnicity
White, non-Hispanic ................................... 143,201 63,589 1,224 44 0.8 Black, non-Hispanic.................................... 22,129 10,241 482 46 2.2 Hispanic ...................................................... 19,491 8,045 415 41 2.1 Other race, non-Hispanic ............................ 9,804 4,785 465 49 3.9
Household income
$10,000 or less ............................................ 14,335 3,329 381 23 2.7 $10,001 to $30,000 ..................................... 54,902 17,791 797 32 1.4 $30,001 to $50,000 ..................................... 49,496 22,985 918 46 1.6 $50,001 to $75,000 ..................................... 35,984 19,828 745 55 1.9 More than $75,000...................................... 39,909 22,726 795 57 1.7
Marital status
Never married ............................................. 40,190 19,296 826 48 1.8 Currently married........................................ 120,250 55,504 1,225 46 0.9 Other ........................................................... 34,185 11,859 543 35 1.4
Educational attainment
Less than high school.................................. 33,343 7,287 568 22 1.7 High school ................................................. 95,674 39,416 1,251 41 1.1 Associate’s degree or some college ............ 11,275 6,384 428 57 2.7 Bachelor’s degree or higher ........................ 54,332 33,572 1,183 62 1.4
See notes at end of table.

C-36
Table C-30. Number and percentage of adults who participated in adult education activities in the past 12 months, by characteristics of adults: AE-NHES:2005, AELL-NHES:2001, AE-NHES:1999, and AE-NHES:1995—Continued
Adult education participants in the past 12 months
Characteristics Number
(thousands) Number
(thousands) s.e.
(thousands) Percent s.e.
AE-NHES:1995
Total adults1 ................................................ 189,576 76,272 921 40 0.5 Age
16–24 years ................................................. 22,439 10,550 289 47 1.1 25–34 years ................................................. 40,326 19,508 449 48 1.0 35–44 years ................................................. 42,304 20,814 450 49 0.9 45–54 years ................................................. 31,807 14,592 428 46 1.2 55 years and over ........................................ 52,700 10,808 466 21 0.8
Sex
Male ............................................................ 90,275 34,453 584 38 0.7 Female......................................................... 99,301 41,818 594 42 0.6
Race/ethnicity
White, non-Hispanic ................................... 144,602 59,988 774 41 0.5 Black, non-Hispanic.................................... 20,808 7,705 302 37 1.5 Hispanic ...................................................... 15,705 5,284 187 34 1.2 Other race, non-Hispanic ............................ 8,461 3,294 210 39 2.1
Household income
$10,000 or less ............................................ 30,212 6,888 305 23 1.0 $10,001 to $30,000 ..................................... 56,851 18,336 487 32 0.9 $30,001 to $50,000 ..................................... 49,076 21,787 508 44 0.8 $50,001 to $75,000 ..................................... 29,161 15,169 460 52 0.9 More than $75,000...................................... 24,277 14,091 369 58 1.3
Marital status
Never married ............................................. 38,658 17,105 398 44 0.8 Currently married........................................ 114,680 48,200 731 42 0.6 Other ........................................................... 36,238 10,967 400 30 1.1
See notes at end of table.

C-37
Table C-30. Number and percentage of adults who participated in adult education activities in the past 12 months, by characteristics of adults: AE-NHES:2005, AELL-NHES:2001, AE-NHES:1999, and AE-NHES:1995—Continued
Adult education participants in the past 12 months
Characteristics Number
(thousands) Number
(thousands) s.e.
(thousands) Percent s.e.
Educational attainment
Less than high school.................................. 29,347 4,621 303 16 1.1 High school ................................................. 62,957 19,343 522 31 0.8 Associate’s degree or some college ............ 50,736 25,230 428 50 0.8 Bachelor’s degree or higher ........................ 46,535 27,078 560 58 1.0
1 Includes civilian, noninstitutionalized adults, age 16 or older, not enrolled in elementary or secondary school at the time of the interview. NOTE: s.e. is standard error. Adult education includes ESL classes, adult basic education, credential programs, apprenticeship programs, work-related education or training, and personal interest/development courses. Detail may not sum to totals because of rounding. SOURCE: U.S. Department of Education, National Center for Education Statistics, Adult Education (AE) Survey of the National Household Education Surveys Program (NHES), 2005; Adult Education and Lifelong Learning (AELL) Survey of NHES, 2001; AE Survey of NHES, 1999; AE Survey of NHES, 1995.

C-38
Table C-31. Number of adults who participated in basic skills education and ESL classes: AE-NHES:2005, AELL-NHES:2001, AE-NHES:1999, and 1998 Adult Education Program Facts of the Office of Vocational and Adult Education (OVAE)
Number of participants
Type of degree program Estimate s.e.
AE-NHES:2005
Basic skills education....................................................................................... 2,822,040 464,906
English as a second language........................................................................... 1,964,458 351,679 AELL-NHES:2001
Basic skills education....................................................................................... 3,214,070 310,566
English as a second language........................................................................... 2,319,004 331,430 AE-NHES:1999
Basic skills education....................................................................................... 3,259,000 392,538
English as a second language........................................................................... 1,791,436 293,928 OVAE (2004)1
Basic skills education....................................................................................... 1,504,459 —
English as a second language........................................................................... 1,172,569 —
— Not available. 1 OVAE figures represent specific publicly funded programs (program year 2003–2004) in adult basic education (ABE), adult secondary education (ASE), and English as a second language (ESL), whereas the NHES estimates include any basic skills, high school completion, GED preparation, or ESL program, regardless of sponsorship. NOTE: s.e. is standard error. SOURCE: U.S. Department of Education, National Center for Education Statistics, Adult Education (AE) Survey of the National Household Education Surveys Program (NHES), 2005; Adult Education and Lifelong Learning (AELL) Survey of NHES, 2001; AE Survey of NHES, 1999; U.S. Department of Education, Office of Vocational and Adult Education (OVAE), 2004 Adult Education Program Facts.

C-39
Table C-32. Number of adults who participated in credential programs: AE-NHES:2005, AELL-NHES:2001, AE-NHES:1999, and 1997 Integrated Postsecondary Education Data System (IPEDS)
Number of participants
Type of degree program Estimate s.e.
AE-NHES:2005
College or university........................................................................................ 22,256,240 985,452
Vocational or technical .................................................................................... 3,613,675 384,525
AELL-NHES:2001
College or university........................................................................................ 19,274,562 637,978
Vocational or technical .................................................................................... 3,650,401 273,894 AE-NHES:1999
College or university........................................................................................ 22,733,309 783,126
Vocational or technical .................................................................................... 11,644,949 693,157 2003 IPEDS1
4-year colleges and universities ....................................................................... 10,407,986 —
2-year or less than 2-year colleges ................................................................... 6,921,476 —
— Not available. 1 IPEDS reports data on fall enrollment at Title IV institutions. In contrast, NHES collects information on any college or vocational participation over the previous year and is not limited to one point in time (such as fall enrollment), nor are NHES data limited to Title IV institutions. NOTE: s.e. is standard error. SOURCE: U.S. Department of Education, National Center for Education Statistics, Adult Education (AE) Survey of the National Household Education Surveys Program (NHES), 2005; Adult Education and Lifelong Learning (AELL) Survey of NHES, 2001; AE Survey of NHES, 1999; U.S. Department of Education, National Center for Education Statistics, Integrated Postsecondary Education Data System (IPEDS), 1997.