national grid gas plc nts regulatory accounting statements...
TRANSCRIPT

National Grid Gas plc
NTS Regulatory Accounting Statements
2017/18
Company number 2006000

ContentsNational Grid Gas plc NTS Regulatory Accounting Statements
2017/18
About these regulatory accounting statements .................................................................................................................................1
Overview – About National Grid Gas plc.............................................................................................................................................2
What we do - Gas.....................................................................................3
What we do – Regulation..........................................................................4
Principal Operations – Gas Transmission.................................................6
Principal Operations – System Operator………………………………………….7
Our purpose, vision, strategy and values..................................................8
Our strategic objectives ............................................................................9
Progress against objectives - key performance indicators ......................10
Strategic Report ..................................................................................................................................................................................11
Our business environment......................................................................11
Our commitment to being a responsible business ..................................13
Internal control and risk management.....................................................17
Viability statement.............................................................................................. 21
Financial review......................................................................................22
Corporate Governance ...........................................................................27
Directors’ Report.....................................................................................33
Introduction to the financial statements ...........................................................................................................................................34
Statement of Directors’ responsibilities...................................................35
Independent Auditors’ report ..................................................................36
Basis of preparation................................................................................38
Recent accounting developments...........................................................41
Consolidated income statement..............................................................43
Consolidated statement of comprehensive income.................................44
Consolidated statement of changes in equity .........................................45
Consolidated statement of financial position...........................................46
Consolidated cash flow statement ..........................................................47
Notes to the consolidated financial statements.......................................48
Appendices......................................................................................................................................................................................... 87
Appendix 1 – Supplementary analysis of the consolidated financial statements by regulatory business ................................. 87
Regulatory consolidated income statement .......................................................... 88
Regulatory consolidated statement of comprehensive income ............................. 89
Regulatory consolidated statement of financial position ....................................... 90
Regulatory consolidated statement of changes in equity ...................................... 91
Regulatory consolidated cash flow statement....................................................... 92
Notes to the regulatory consolidated financial statements.................................... 93
Appendix 2 – Unpublished information – Analysis of charges and apportionment ................................................................... 114
Appendix 3 – Unpublished information - Supplementary analysis of the regulatory transmission business by Transmission
Owner (TO) and System Operator (SO) activities .................................................................................................. 118
Glossary and definitions………………………………....................................................................................................................... 123

National Grid Gas plc NTS Regulatory Accounting Statements 2017/18 1
About these regulatory accounting statements
National Grid Gas plc (the Company) is the holder of one gas
transporter licence in respect of its gas transmission (NTS)
business. Under Standard Special Condition A30 of the
licences, we are required to prepare and publish annual
regulatory accounting statements setting out the financial
position and performance of the regulatory business covered by
the licence.
Scope of the regulatory accounting statementsThese NTS regulatory accounting statements are for National
Grid Gas and its NTS business, which comprises gas
transmission, including liquefied natural gas (LNG) storage and
Metering.
The regulatory gas transmission business included in these
regulatory accounting statements differs in certain respects
from the gas transmission operating segment reported in the
Company’s annual report and accounts.
Content of the regulatory accounting statementsIn accordance with the licence and as agreed with the Gas and
Electricity Markets Authority (GEMA), these regulatory
accounting statements comprise:
A Strategic Report for the Company as a whole including
information on the financial performance and financial
position of our NTS business.
A Corporate Governance Statement in respect of our
regulatory gas transmission business.
A Directors’ Report in respect of the Company as a whole.
A Statement of Directors’ responsibilities for preparing
regulatory accounting statements.
The Independent Auditors’ report on the regulatory
accounting statements. This is separate to their report on
the annual report and accounts of the Company, and is to
GEMA and the Directors of the Company.
Consolidated financial statements for the Company as a
whole, including additional accounting policies in respect
of the basis of preparation of the supplementary analyses
included in these regulatory accounting statements.
Supplementary analysis of the financial statements by
regulatory business, including a reconciliation to the
financial statements for the Company as a whole and
certain information, which, in accordance with the licence,
is provided only to GEMA and is not published.
Supplementary analysis of the financial statements for our
NTS business by Transmission Owner (TO) and System
Operator (SO) activities. This extra-licence information is
provided only to GEMA and is not published.
Relationship of regulatory accounting statements
with statutory accountsThe financial information contained in these regulatory
accounting statements does not constitute statutory accounts
within the meaning of section 404 of the Companies Act 2006.
Statutory accounts for the Company for the year ended 31
March 2018, to which the financial information relates, have
been delivered to the Registrar of Companies.
The auditors have made a report under Section 495 of the
Companies Act 2006 on those statutory accounts which was
unqualified and did not contain a statement under Section
498(2) or (3) of the Act. The auditors’ opinion on the Company’s
statutory accounts is addressed to, and for the benefit of, the
members of the Company and not for any other person or
purpose. The auditors have clarified, in giving their opinion on
those statutory accounts, that it has been prepared for and only
for the Company’s members as a body in accordance with
Chapter 3 of Part 16 of the Companies Act 2006 and for no
other purpose. In giving their opinion, they do not accept or
assume responsibility for any other purposes or to any other
person to whom their audit report on the statutory accounts is
shown or into whose hands it may come save where expressly
agreed by their prior consent in writing.
The statutory accounts of the Company, and of the ultimate
parent company National Grid plc (National Grid), can be
obtained from the Company Secretary’s Office, National Grid
plc, 1-3 The Strand, London WC2N 5EH, and from the website
of National Grid plc at www.nationalgrid.com.
Basis of preparation of regulatory accounting
statementsThese regulatory accounting statements contain arbitrary
apportionments of certain revenues, costs, assets, liabilities and
shareholder’s equity of the Company which are not specifically
attributable to the regulatory businesses and activities reported
in these regulatory accounting statements, but which,
nevertheless, we are required to report against those
businesses and activities. Further details of these items are
provided in the basis of preparation on page 40.

2 National Grid Gas plc NTS Regulatory Accounting Statements 2017/18
OverviewAbout National Grid Gas plc
National Grid Gas plc (National Grid Gas) is a subsidiary of National Grid plc (National Grid), based in the UK. We own and operate
the regulated gas National Transmission System (NTS) in Great Britain, with day-to-day responsibility for balancing supply and
demand, and provide gas metering services. We play a vital role in connecting millions of people safely, reliably and efficiently to the
energy they use.
The overall management and governance of National Grid Gas is the responsibility of its Board of Directors. Strategic direction is
determined by our ultimate parent company, National Grid. Our Directors are listed on page 33.
More information on the management structure of National Grid can be found in the National Grid plc Annual Report and Accounts
2017/18 and on National Grid’s website at www.nationalgrid.com.
Financial highlights
2017/18+ 2016/17+ Percentage change
£m £m
Operating profit 647 464 39%
Adjusted operating profit1 647 573 13%
Cash generated from operations 956 723 32%
Regulated assets2 6,014 5,755 5%
1. See page 22 for further details
2. See page 24 for further details.
2017/18+ 2016/17+
£m £m
Return on equity:
Gas Transmission 10.0% 10.8%
Non-financial highlights
2017/18+ 2016/17+
Number of employees 2,134 1,925
Network reliability:
Gas Transmission 99.996151% 99.975000%
+ Represents continuing operations only.

National Grid Gas plc NTS Regulatory Accounting Statements 2017/18 3
What we do - GasThe gas industry connects producers, processors, storage and transmission and distribution network operators, as well
as suppliers to industrial, commercial and domestic users.
The UK gas industry has four main sectors.
1. Production and importation
There are seven gas reception terminals, three Liquefied
Natural Gas (LNG) importation terminals and three
interconnectors connecting Great Britain (GB) via undersea
pipes with Ireland, Belgium and the Netherlands. Importers
bring LNG from the Middle East, the Americas and other places.
We do not produce gas. Gas used is mainly sourced from gas
fields in the North and Irish seas, piped from Europe and
imported as LNG.
2. Transmission
The transmission system includes pipes and compressor
stations. They connect production and storage through
terminals to the distribution systems.
Gas enters the transmission system through importation and
reception terminals and interconnectors and may include gas
previously held in storage. Compressor stations located along
the network play a vital role in keeping large quantities of gas
flowing through the system, particularly at times of high
demand.
The gas transmission system has to be kept constantly in
balance, which is achieved by buying, selling and using stored
gas. This means that, under normal circumstances, demand
can be met. We are the sole owner and operator of gas
transmission infrastructure in Great Britain.
3. Distribution
Gas leaves the transmission system and enters the distribution
networks at high pressure. It is then transported through a
number of reducing pressure tiers until it is finally delivered to
consumers.
There are eight regional gas distribution networks in the UK,
none of which we own.
On 1 October 2016, National Grid Gas plc sold its Gas
Distribution business and associated assets to National Grid
Gas Distribution Limited, a fellow National Grid plc group
undertaking.
4. Supply
Pipeline shippers bring gas from producers to suppliers, who in
turn sell it to customers.
We do not supply gas; however we own National Grid Metering
Ltd, which provides meters and metering services to supply
companies, under contract.
Customers pay the supplier for the cost of gas and for its
transportation. We transport the gas through our network on
behalf of shippers, who pay us transportation charges.
4 National Grid Gas plc NTS Regulatory Accounting Statements 2017/18
What we do – RegulationOur business operates as a regulated monopoly. We have one
economic regulator for our business, Office of Gas and
Electricity Markets (Ofgem). The regulator safeguards
customers’ interests by setting the level of revenues we are
allowed to recover, ensuring we provide value for money while
maintaining safe and reliable networks, and deliver good
customer service.
How we make money from our regulated assets
Our licence, established under the Gas Act 1986, as amended
(the Act) requires us to develop, maintain and operate
economic and efficient networks and to facilitate competition in
the supply of gas in Great Britain. It also gives us statutory
powers. These include the right to bury our pipes under public
highways and the ability to use compulsory powers to purchase
land so we can conduct our business.
Our network is regulated by Ofgem, which has established price
control mechanisms that set the amount of revenue our
regulated businesses can earn. Price control regulation is
designed to make sure our interests, as a monopoly, are
balanced with those of our customers. Ofgem allows us to
charge reasonable, but not excessive, prices. This gives us a
future level of revenue that is sufficient to meet our statutory
duties and licence obligations, and make a reasonable return
on our investment.
The price control includes a number of mechanisms designed
to help achieve its objectives. These include financial incentives
that encourage us to:
efficiently deliver by investing and maintaining the
network outputs that customers and stakeholders
require, including reliable supplies, new connections
and infrastructure capacity;
innovate in order to continuously improve the services
we give our customers, stakeholders and communities;
and
efficiently balance the transmission networks to support
the wholesale markets.
The Gas Transmission (GT) business operates under two
separate price controls; one as transmission owner (TO) and
one as system operator (SO). In addition to the two regulated
network price controls, there is also a tariff cap price control
applied to certain elements of domestic sized metering and
daily meter reading activities carried out by National Grid
Metering.
RIIO Price Controls
The building blocks of the RIIO price control are broadly similar
to the historical price controls used in the UK. However, there
are some significant differences in the mechanics of the
calculations.
How is revenue calculated?
Outputs
Under RIIO the outputs we deliver are clearly articulated and
are integrally linked to the calculation of our allowed revenue.
These outputs have been determined through an extensive
consultation process, which has given stakeholders a greater
opportunity to influence the decisions.
The five output categories are:
Safety - ensuring the provision of a safe energy network.
Reliability (and availability) - promoting networks capable of
delivering long-term reliability, as well as minimising the number
and duration of interruptions experienced over the price control
period, and ensuring adaptation to climate change.
Environmental impact - encouraging companies to play their
role in achieving broader environmental objectives, specifically,
facilitating the reduction of carbon emissions, as well as
minimising their own carbon footprint.
Customer and stakeholder satisfaction - maintaining high
levels of customer satisfaction and stakeholder engagement,
and improving service levels.
Customer connections - encouraging networks to connect
customers quickly and efficiently.
Within each of these output categories are a number of primary
and secondary deliverables, reflecting what our stakeholders
want us to deliver over the remaining price control period. The
nature and number of these deliverables varies according to the
output category, with some being linked directly to our allowed
revenue, some linked to legislation, and others having only a
reputational impact.
Totex
Ofgem, using information we have submitted, along with
independent assessments, determines the efficient level of
expected costs necessary to deliver our outputs. Under RIIO
this is known as totex, which is our total allowable expenditure,
and is the sum of what was defined in previous price controls as
operating expenditure (opex) and capital expenditure (capex).
A number of assumptions are necessary in setting allowances
for these outputs, including the volumes of work that will be
needed and the price of the various external inputs to achieve
them. Consequently, there are a number of uncertainty
mechanisms within the RIIO framework that can result in
adjustments to totex allowances if work volumes differ from the
assumptions. These mechanisms protect us and our customers
from windfall gains and losses.
Where we under- or over-spend the allowed totex for reasons
that are not covered by uncertainty mechanisms, there is a
sharing factor. This means the under- or over-spend is shared
between us and customers through an adjustment to allowed
National Grid Gas plc NTS Regulatory Accounting Statements 2017/18 5
revenues in future years. This sharing factor provides an
incentive for us to provide the outputs efficiently, as we are able
to keep a portion of savings we make, with the remainder
benefiting our customers.
The extended length of the price control to eight years is one of
the ways that RIIO has given innovation more prominence.
Innovation refers to all the new ways of working that deliver
outputs more efficiently. This broad challenge has an impact on
everyone in our business.
Allowed revenue to fund totex costs is split between ‘fast’ and
‘slow’ money categories using specified ratios that are fixed for
the duration of the price control. Fast money represents the
amount of totex we are able to recover in the next available
year. Slow money is added to our Regulated Asset Value (RAV)
– effectively the regulatory IOU. For more details on the sharing
factors under RIIO, please see the sharing factors and fast
money section.
In addition to fast money, we are allowed to recover a portion of
the RAV (regulatory depreciation) and a return on the
outstanding RAV balance each year. Regulatory depreciation
permits recovery of RAV consistent with each addition bringing
equal real benefit to consumers for a period of up to 45 years.
We are also allowed to collect additional revenues related to
non-controllable costs and incentives. In addition to totex
sharing, RIIO incentive mechanisms can increase or decrease
our allowed revenue to reflect our performance against various
other measures related to our outputs. For example,
performance against our customer and stakeholder satisfaction
targets can have a positive or negative effect of up to 1% of
allowed annual revenues. Most of our incentives affect our
revenues two years after the year of performance.
During the eight-year period of the price control our regulator
included a provision for a mid-period review, with scope driven
by:
changes to outputs that can be justified by clear changes in
government policy; and
the introduction of new outputs that are needed to meet the
needs of consumers and other network users.
The mid-period review of the gas transmission control focused
on a removal of the need for the Avonmouth pipeline and
associated reduction in allowances of £168.8 million (in
2009/2010 prices).
Ofgem also separately reviewed the obligation to provide
additional gas entry capacity at Fleetwood. It concluded that
this additional capacity was not required, so no incremental
revenues would be payable. National Grid Gas had incurred no
incremental costs in anticipation of this obligation.
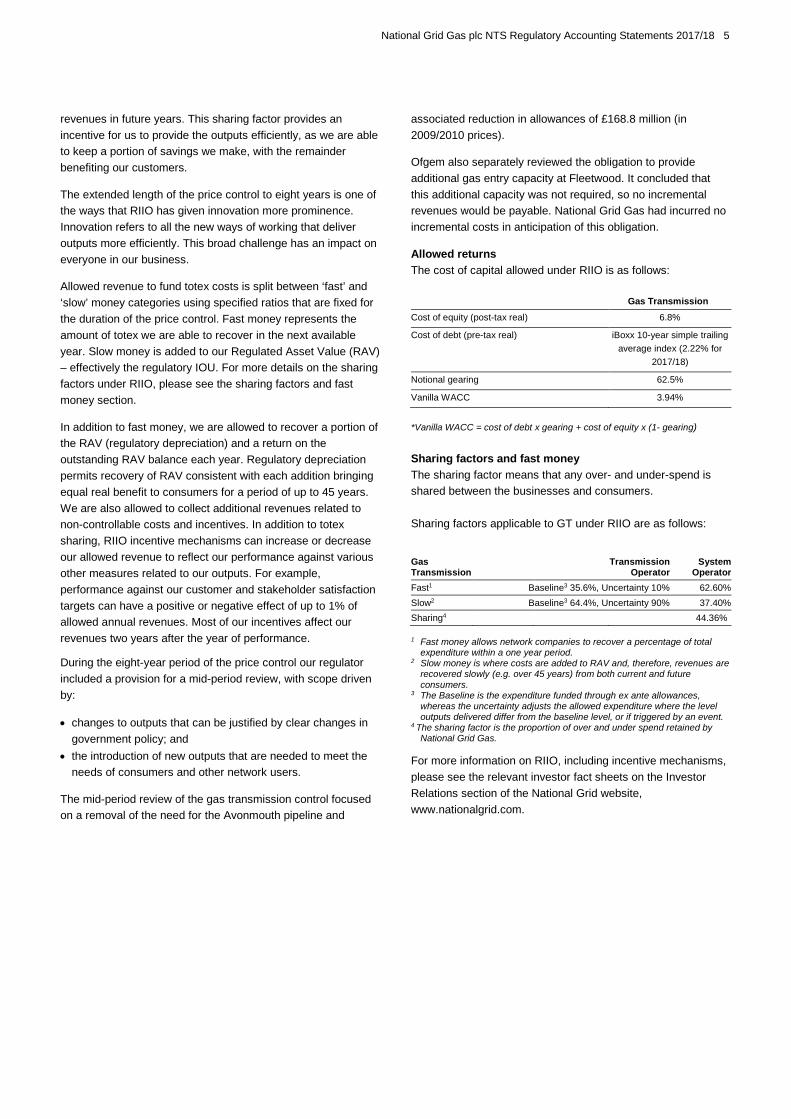
Allowed returns
The cost of capital allowed under RIIO is as follows:
Gas Transmission
Cost of equity (post-tax real) 6.8%
Cost of debt (pre-tax real) iBoxx 10-year simple trailing
average index (2.22% for
2017/18)
Notional gearing 62.5%
Vanilla WACC 3.94%
*Vanilla WACC = cost of debt x gearing + cost of equity x (1- gearing)
Sharing factors and fast money
The sharing factor means that any over- and under-spend is
shared between the businesses and consumers.
Sharing factors applicable to GT under RIIO are as follows:
GasTransmission
TransmissionOperator
SystemOperator
Fast1 Baseline3 35.6%, Uncertainty 10% 62.60%
Slow2 Baseline3 64.4%, Uncertainty 90% 37.40%
Sharing4 44.36%
1 Fast money allows network companies to recover a percentage of totalexpenditure within a one year period.
2 Slow money is where costs are added to RAV and, therefore, revenues arerecovered slowly (e.g. over 45 years) from both current and futureconsumers.
3 The Baseline is the expenditure funded through ex ante allowances,whereas the uncertainty adjusts the allowed expenditure where the leveloutputs delivered differ from the baseline level, or if triggered by an event.
4 The sharing factor is the proportion of over and under spend retained byNational Grid Gas.
For more information on RIIO, including incentive mechanisms,
please see the relevant investor fact sheets on the Investor
Relations section of the National Grid website,
www.nationalgrid.com.

6 National Grid Gas plc NTS Regulatory Accounting Statements 2017/18
Principal Operations - Gas Transmission
What we doWe own and operate the regulated gas national transmission
system, with day-to-day responsibility for balancing supply and
demand. We play a pivotal role in connecting millions of people
safely, reliably and efficiently to the energy they use. Our
network comprises approximately 4,760 miles of high-pressure
pipe and 618 above-ground installations.
Market ContextThe UK’s gas market and sources of gas are changing. The UK
now obtains less than half of it’s gas from the North Sea (or UK
Continental Shelf - UKCS). The UK receives gas from Norway,
continental Europe and further afield via LNG shipments into
three import terminals around the country.
Overall, supply capacity now exceeds peak demand by more
than 30%, giving our customers significant flexibility over which
sources of gas they choose to meet demand. Flexible sources
of supply, such as LNG importation terminals, interconnectors
and storage sites, can respond to demand more quickly than
traditional UKCS supplies. Therefore, our network needs to be
able to respond to changing day-to-day and within-day supply
and demand patterns.
We also need to prepare for an uncertain energy landscape in
the long term. UK reliance on imported gas supplies will vary
depending on the level of gas supply from the UKCS and the
development of indigenous gas sources.
We are working closely with our customers and stakeholders to
meet these operational challenges. We are focused on
continuing to develop our network and services to meet their
needs safely, reliably and efficiently.
Operational PerformanceFor the full year 2017/18 our employee lost time injury
frequency rate was 0.05 which is consistent with world-class
safety performance. Over the year we performed significantly
better than our high potential incidents target, which tracks the
events with the potential to cause more serious harm. We have
also worked hard on risk assessments both ahead of work and
at the point of work across our business.
As well as continued focus on safety, we are constantly looking
for other ways to optimise our operational performance. We met
our customer satisfaction target for 2017/18. The score for Gas
Transmission was 7.62. This exceeds our agreed target of 6.90.
We have also made positive progress in our first year using Net
Promoter Score. We are gaining more insight into the needs of
our customers (and theirs). For example, the need for greater
transparency has been a continuing theme.
To improve transparency we have a new online customer
connections platform, which is in the testing phase. We are
working with customers to identify a suitable pilot opportunity.
We have continued to provide reliable services. We report on
our key performance indicators in detail on page 10. This year
our network reliability score for Gas Transmission was
99.996151%.
We have updated many of our back-office systems to improve
data and management control. We have made substantial
progress in our asset health data collection efforts and we have
prioritised spend over the remainder of this regulatory control
period.
Our business has made good progress on Project GRAID (Gas
Robotic Agile Inspection Device), which is developing an
innovative robotic inspection device for underground pipework.
This year we have developed the robot for offline trials ahead of
live site trials later in 2018. To continue to provide low-cost
services which our customers want, we know we must innovate.
In late February, adverse weather affected the UK, leading to
high demand for energy on the system. Our networks
performed strongly, maintaining secure supplies of gas. As part
of our response we issued a Gas Deficit Warning. This signalled
to the market that we required more gas to keep the system
running safely and reliably. This is part of our standard
approach to balancing supply and demand, and worked
effectively.
Looking aheadThe current price controls are set to run for an eight-year period
and will end on 31 March 2021. Ahead of the new regulatory
framework (RIIO T2) we will continue to engage with
stakeholders and work with Ofgem to clarify the parameters of
RIIO T2. We have mobilised teams to prepare for RIIO T2
drawing on the depth of knowledge across our business. In
depth stakeholder engagement has commenced and will
continue throughout the process. National Grid has responded
to the RIIO T2 Framework Consultation document issued by
Ofgem in March 2018 and we expect the framework to be
finalised during the summer of 2018 with Ofgem publishing their
final view on the final price control allowances by the end of
2020.
Next year we will continue to focus on safe, customer-led, and
innovative operations. Achieving greater efficiency in our
businesses will be a priority for us – particularly important
considering the price cap for supply to consumers that the
Government is seeking to impose.

National Grid Gas plc NTS Regulatory Accounting Statements 2017/18 7
Principal Operations - System Operator
As Great Britain’s System Operator (SO) we make sure
supply and demand are balanced in real-time and we
facilitate the connection of assets to the transmission
system.
Market context
Sources of energy are changing. The changing location of gas
being input into the transmission system will drive greater need
for flexibility as the traditional north-south flow diminishes and
as new forms of low carbon gases are considered to support
the transition to a low carbon future.
This makes our role in matching supply and demand more
challenging, so we work with the market to make sure we have
appropriate tools in place to balance the transmission system.
We work with our customers and stakeholders to shape the
future of the energy market, providing analysis and insight into
the changing nature of energy and the role that gas and
decarbonising gas can play to support national climate
ambitions. We also facilitate changes to the market frameworks
to accommodate new technologies and ways of working, while
considering how the role of the SO should evolve over time, in a
future that could see different forms of low carbon gas, such as
hydrogen, biogas and bioSNG, alongside natural gas.
The SO is at the forefront of this debate helping to find solutions
with industry and decision makers.
Operational Performance
We continue to play a leading role in helping develop the UK’s
future energy strategy, and that of Europe. Our approach
includes working with customers and stakeholders on initiatives
such as the translation of new EU code requirements for gas,
the development of new demand side services supporting the
harmonisation of gas trading arrangements across Europe, our
Future Energy Scenarios reports, our Future of Gas programme
and System Operability Framework workshops and webinars.
We are working hard across our business to place customers at
the heart of our operations. We’re holding workshops for
customers so we can gain a more in-depth understanding of
their requirements, not just today, but potential needs in the
coming decades as a result of the low carbon transition, which
could see hydrogen and biofuels used alongside natural gas.
We have also started to examine each point of contact they
have with our Company, so we can identify where we can
improve our processes and our customers’ experience with us.
We will be testing proposed improvements with customers
before we implement them.
Priorities for the year ahead
We will continue to find better ways to provide timely, cost
effective and innovative solutions to balance supply and
demand for gas.
Market developments
We will continue to work with Ofgem and The Department for
Business Energy and Industrial Strategy (BEIS) as they develop
proposals to help meet the energy and decarbonisation
challenges of the future, so gas and decarbonised gas can
support clean growth in the UK.
Customers and stakeholders
We will continue to develop our longer-term strategy to
understand the issues that will affect our customers and
stakeholders in the future, and plan how we will best support
them building on work from our Future of Gas programme.
Delivering energy
We will continue to support the evolution of market frameworks
in the UK and Europe to enable new types of production and
importation, also for demand to come forward in response as
the energy landscape evolves.
Principal Operations – Other activitiesOther activities include National Grid Metering and other
corporate activities.
National Grid Metering
National Grid Metering (NGM) provides installation and
maintenance services to energy suppliers in the regulated
market in Great Britain. It maintains an asset base of over 12
million domestic, industrial and commercial meters.
Customer satisfaction scores for NGM remain positive for
domestic, industrial and commercial businesses. We continue
to work with our customers on areas for improvement by
exploring additional products and services so we can respond
to the rapidly changing non-domestic sector.

8 National Grid Gas plc NTS Regulatory Accounting Statements 2017/18
Our purpose, vision, strategy and values
We work within the purpose, vision, strategy and values
of the National Grid Group to ensure we are well
positioned to respond to changes in the operating
environment.
Our purposeHaving a clear sense of what we stand for as a company and
what it is that binds us all together is vitally important. This is
what we call our purpose. In simple terms it’s what drives our
desire to serve our customers and makes us proud about the
work we do.
Our purpose is to bring energy to life
Essentially, ‘Bring Energy to Life’ means getting the heat, light
and power that customers rely on to their homes and
businesses. But ‘Life’ also means supporting the communities
that we are a part of and live among to support the economic
growth and sustainability of wider society.
Our visionWe will exceed the expectations of our customers,
shareholders and communities today and make possible
the energy systems of tomorrow.
Our vision describes how we create value – not just today, but
in the future too.
The needs of our customers, shareholders and communities
are at the heart of everything we do. So, our vision statement
clearly describes the ambitious challenge we have set
ourselves – to make sure we deliver value for them every day.
Our vision also looks to the future, reminding us of the critical
role we will play for future generations. We continue to see
changes in our energy system as more renewable and
decentralised generation is introduced. To be relevant in this
future, we have to play an active role in helping shape the
energy landscape, and benefiting from what it provides.
Our strategyWe are focussed on three strategic priorities for our business,
which will set the foundations for our future success. These are
described below.
1) Find new ways of optimising our operational
performance
We will exceed the expectations of our customers, shareholders
and communities today and make possible the energy systems
of tomorrow.
Our customers want and need us to be more efficient, so we
must find ways to improve how we run our business. We have
looked at enhancing our productivity and customer experience
through more efficient and customer-focused processes. Given
the scale of our core business, even small improvements will
have a huge impact on our overall performance. Finding new
ways of optimising our operational performance will be an
important factor in our ability to compete and grow. It creates
the financial capacity and the capability for us to future-proof
our business.
2) Look for opportunities to grow our core business
Delivering strong operational performance provides us with a
foundation to pursue other opportunities. We will continue to
pursue business development opportunities that are close to
our core business. In the UK competitive onshore transmission
projects will continue to be our focus over the next decade.
3) Make sure National Grid is better equipped for the future
We need to future-proof our business against the effects of a
changing energy landscape. The operation of our networks is
already affected by changes to the generation mix, while the
needs and expectations of our customers are evolving.
Our valuesEvery day we do the right thing and will find a better way.
We know that how we deliver is as important as what we
deliver. If our purpose is the ‘why’, our values are the ‘how’.
They help shape our spirit, attitude and what guides us. We
have to adapt and develop our values to align with the
expectations of our customers and communities, without losing
sight of the things that make us strong today.
Our values build on and protect our strong foundations while
looking to the future. They are aligned to our purpose and help
our people understand how we expect to achieve our purpose
and vision for our customers and each other.
‘Do the right thing’ pulls together our foundational values –
keeping each other and the public safe; complying with all the
relevant rules, regulations and policies; respecting our
colleagues, customers and communities; and saying what we
think and challenging constructively. ‘Find a better way’
challenges us to focus on performance and continuous
improvement for our customers, our shareholders and
communities.

National Grid Gas plc NTS Regulatory Accounting Statements 2017/18 9
Our strategic objectivesWe are focused on three strategic priorities for our business, which will set the foundations for our future success. These are
described below;
Find new ways of optimising ouroperational performance
Look for opportunities to grow ourcore business
Make sure National Grid is betterequipped for the future
Why it’s important Our customers want and need us to bemore efficient, so we must find ways toimprove how we run our business.
To make possible the energysystems of tomorrow requiresinvestment in our core and manyareas close to our core.
We need to future-proof ourbusiness against the effects of achanging energy landscape. Theoperation of our networks is alreadyaffected by changes, while theneeds and expectations of ourcustomers are evolving.
What this means We have looked at enhancing ourproductivity and customer experiencethrough more efficient and customer-focused processes. Finding new ways ofoptimising our operational performance willbe an important factor in our ability tocompete and grow. It creates the financialcapacity and the capability for us to future-proof our business.
We continue to pursue businessdevelopment opportunities that areclose to our core business.
We are looking to develop newcapabilities that are essential forlong-term success.
How we measure ourselves Safety performance
Customer satisfaction scores
Network reliability
Greenhouse gas emissions reduction
Regulated asset base growth
Capital investment
Innovation investment
Skills and capabilities
The metrics below underpin all our strategic priorities:Employee engagement; Workforce diversity

10 National Grid Gas plc NTS Regulatory Accounting Statements 2017/18
Progress against objectives - key performance indicators (KPIs)Strategic objective KPI and definition Performance
Find new ways of optimising ouroperational performance
Safety – Employee lost time frequency rate (IFR)
Injuries resulting in employees taking time off work per
100,000 hours worked on a 12 month basis.
2017/18: 0.05 (Target 0.1)
2016/17: 0.11 (Target 0.1)
Network reliability
Reliability of gas network as a percentage against the
target set by Ofgem.
2017/18: 99.996151% (Target 100%)
2016/17: 99.97500% (Target 100%)
Customer satisfaction scores
Our score in customer satisfaction surveys. Ofgem set abaseline.
2017/18: 7.62 out of 10 (Target 6.9)
2016/17: 8.0 out of 10 (Target 6.9)
Figures represent our baseline targets set byOfgem for reward or penalty under RIIO.
Greenhouse gas emissions
Percentage reduction in greenhouse gas emissions.
National Grid target 2017/18 and 2016/17: 45% reductionby 2020 and 80% reduction by 2050, compared to 1990baseline emissions.
Tonnes carbon dioxide
2017/18: 672 KTCO2e
2016/17: 670 KTCO2e
National Grid plc Group has achieved a 65%reduction against the 1990 baseline to date.
Look for opportunities to grow ourcore business
Regulated asset base growth
Maintaining efficient growth in the total Regulated AssetValue (RAV) base.
2017/18: 4.5%
2016/17: 3.0%
Capital investment
Additions to Property, Plant and Equipment and IntangibleAssets.
2017/18: £340 million
2016/17: £526 million
Make sure National Grid is betterequipped for the future
Innovation investment
We are in the midst of an energy revolution with the economic landscape, developments in technology,evolving business models and consumer behaviours all changing at an unprecedented rate.
We are focussing our innovation on four value themes:
Manging assets – look for innovative ways to manage asset life
Efficient build – finding ways to reduce the cost of building new infrastructure
Service delivery – we’re exploring ways to provide value to our customers
Corporate responsibility – we’re constantly researching and developing safer working practices.
Skills and capabilities
We measure quality (>1 hour) interactions with youngpeople on STEM subjects.
We support developing the skills and capabilities of youngpeople through skills-sharing employee volunteering,especially in STEM subjects. While we have no specifictarget, our aim is to encourage many young people to getinvolved in STEM subjects.
Number of quality interactions
2017/18: 35,425
2016/17: 29,591
Figures represent performance for National Gridplc
Underpin all three strategic priorities Employee engagement index
Employee engagement index calculated using responses toNational Grid’s annual employee survey. Target is toincrease the level of engagement compared with previousyear. See pages 13 and 14 for the actions we are taking.
2017/18: 72%
2016/17: 78%
Index represents performance for National GridUK entities
Workforce diversity
We measure the percentage of women and ethnicminorities in our workforce. We aim to develop and operatea business that has an inclusive and diverse culture. Seepages 13 and 14 for the actions we are taking.
Workforce diversity %
2017/18: Women: 34.3%
Ethnic minority: 12.0%
2016/17: Women: 33.7%
Ethnic minority 9.3%
Greenhouse gas emissionsNational Grid has remained focused on greenhouse gas emissions reduction programmes to achieve the corporate commitment targets of 45% and 80% reduction
in Scope 1 and 2 emissions by 2020 and 2050 respectively from the 1990 baseline. National Grid continues to look for innovations and efficiencies that will help us
achieve targets.
National Grid measure and report in accordance with the World Resources Institute and World Business Council on Sustainable Development Greenhouse Gas
Protocol: Corporate Accounting and Reporting Standard (Revised Edition) for all six Kyoto gases, using the operational approach for emissions accounting. 100% of
National Grid plc's Scope 1 and 2 emissions and 92% of Scope 3 emissions are independently assured against ISO 14064-3 Greenhouse Gas assurance protocol.A
copy of this statement of assurance is available on the National Grid website. See the National Grid plc 2017/18 Annual Report and Accounts for further information.
National Grid Gas plc NTS Regulatory Accounting Statements 2017/18 11
Strategic ReportOur business environmentOur environment is shaped by four themes. The first three are distinct objectives that need to be met in providing energy to customers,
but which are often in tension. Choices that governments make in seeking to appropriately balance these objectives can result in
regulatory changes. The final theme is technology, which is shaping the way we respond and transform our operations for the better.
Impact on consumer bills
Commentary
Consumers expect a reliable energy system that delivers gas
when and where it is needed. They pay for the cost of this
infrastructure and improvements to it through the part of their
energy bills that covers network costs. These costs are subject
to regulatory approval.
2017/18 developments
Affordability of energy is a critical topic, as highlighted in the
2017 General Election campaign. Price caps featured in both
the Conservative and Labour manifestos and an energy price
cap bill is currently progressing through Parliament. The
Labour Party also indicated in its manifesto that it was
considering renationalising utility networks. The Government
commissioned the Cost of Energy Review in the summer of
2017. Its main findings were that the cost of energy is too high,
and that the energy policy, regulation and market design are not
fit for the purposes of the emerging low-carbon energy market.
Our response
Our regulated business continues to strive for greater efficiency,
seeking innovative ways to reduce both the time and cost to
repair or replace assets. This approach minimises the costs to
consumers. We have been able to generate £97 million of
savings for consumers in the first five years of the RIIO
arrangements.
Energy Security
Commentary
The energy system is in a phase of transition from high to low
carbon. Coal plants are closing down and being replaced with
nuclear, renewables and gas, as well as emerging battery
storage.
2017/18 developments
UK wholesale gas prices have been trending upwards as
sources of gas storage have decreased with the closure of the
Rough gas field and general global shifts in preferences from
coal to gas.
Our response
We received the first ever UK LNG cargos from the US and
Peru, highlighting our ability to help deliver a more diverse gas
supply for the UK. We also published our System Needs and
Product Strategy report, which sets the scene for future
requirements, and consults on the future balancing services
products.
Environmental sustainability
Commentary
Our world is changing as a result of human activity and its
impact on the environment. The Paris Agreement sends a clear
signal that the shift to a low-carbon economy is inevitable, and it
is now accepted that sustainable business is good business –
creating value for people, the environment and businesses. This
includes reducing greenhouse gas emissions, managing non-
renewable resources, and preserving and protecting habitats
and ecosystems.
2017/18 developments
During 2017, the UK saw a number of records broken for
renewable energy – including the first day when wind, nuclear
and solar generated more power than gas and coal. In April, the
country had its first day without coal generated energy since the
industrial revolution.
The UK Government published ‘A Green Future: Our 25 year
Plan to Improve the Environment’, setting out the UK’s long-
term approach to protecting and enhancing the natural
environment. And in July 2017 the Government announced a
ban on the sale of new petrol and diesel vehicles cars from
2040.
Our response
Reducing greenhouse gas emissions forms part of the KPIs,
see page 10. We are working with customers and stakeholders
in the UK to gather insights on the future role of gas in
managing the transition to a low-carbon future. We also
continue to work with BEIS and Ofgem on the development of
future energy systems as we respond to the shift to low-carbon
energy in the UK. National Grid’s environmental strategy, ‘Our
Contribution’, focuses on the areas where it can make the
greatest contribution.
Technology
Commentary
The interaction between the gas and electricity is changing with
more gas used to create electricity than ever before. This
transformation is being assisted by a range of factors: political
and regulatory push, consumer pull and the rapid pace of
change in digital technologies.
2017/18 developments
Digitisation of energy networks from producers and generators
to households is changing how people engage with energy. We
face the challenge of adapting our networks to meet new

12 National Grid Gas plc NTS Regulatory Accounting Statements 2017/18
demands, and making sure we act on the opportunities that will
benefit our customers and stakeholders.
Our response
We are part of the National Grid plc Group technology and
innovation team to develop our strategy with regards to new
technology, to monitor disruptive technology and business
model trends, and to act as a bridge for emerging technology
into the core regulated businesses and business development
teams.
National Grid has established a partnership with Energy Impact
Partners to gain exposure to emerging start-up companies.
We are taking advantage of the latest technological innovations
to improve our performance. For example, we are using
robotics for gas pipeline inspection, improving asset health and
lowering costs; and we continue to use digital engineering,
which also helps us lower costs.
The Impact of Brexit
We believe UK-EU cooperation on energy is positive for UK and EU consumers in terms of energy security, affordability and
decarbonisation.
We continue to keep the implications of Brexit under review, especially regarding our access to energy markets and the impacts on
revenues and costs. Based on the worst case scenario (“no deal” on free trade), we have determined that the risk of increased costs
of tariffs and any possibility that National Grid owned interconnectors may be “switched off” is low.
Throughout the year, we have been engaging with our customers and stakeholders, especially with our regulators, as we seek to
inform them of Brexit outcome we believe would be in the best interests of consumers.
National Grid Gas plc NTS Regulatory Accounting Statements 2017/18 13
Our commitment to being a responsible business
Businesses should be a force for positive social and environmental change. To do this, companies have to act responsibly in
everything they do, and the way in which they do it. This belief is fundamental to the way we work at National Grid.
Our approach
Businesses are a key part of the communities in which they
operate, and we believe they should be aiming to leave a
positive purpose-led legacy for future generations. At National
Grid Gas, we work hard to bring energy to life and exceed the
expectations of our customers, shareholders and communities.
The National Grid Group took part in the 2017 UK Social
Mobility Index and were ranked 34th out of the 98 companies
that took part. Following feedback, we have introduced changes
to our recruitment processes and the data we capture so we
can better understand and address social diversity. We are
undertaking a significant piece of work to move the focus of our
corporate responsibility activities towards supporting social
mobility in the UK. We will describe the outcomes from this work
in next year’s report.
Being a responsible business covers every aspect of our work,
both what we do and how we do it. When we are undertaking
major infrastructure projects, we work with our customers,
stakeholders and communities to gather their views to help
inform what we do. We support communities through our
employee volunteering programmes, partnering with charities
and civil society, and providing community groups with financial
support.
We report on a number of non-financial performance measures
relating to these policies. You can find details about our key
non-financial performance measures on page 10, and also on
the National Grid website, in the Responsibility and
Sustainability section.
Our priorities
Our priorities are shaped by the Group’s strategic priorities, and
a number of other factors, including the risks we face as a
business, the views of our customers and stakeholders, and the
challenges faced by the communities where we operate.
National Grid is a signatory to the United Nation’s Global
Compact and support its Sustainable Development Goals
(SDGs). These goals promote prosperity while protecting the
planet. All 17 goals are important, and there are five (see
below) that are particularly linked to our responsible business
focus areas.
Environmental sustainabilityWe know that our business operations have the potential to
affect the environment. Managing any risks, whether these are
short-term through our physical operations, such as air quality
and pollution, or long-term through our greenhouse gas
emissions or resource use, is fundamental to our approach to
environmental sustainability.
Additionally, an environmental event arising from catastrophic
asset failure is one of our operational risks. You can read more
about this on page 17, together with our approach to mitigation.
Our priorities
National Grid’s environmental strategy, ‘Our Contribution’, was
originally developed in 2012 with a wide range of internal and
external stakeholders, and has been refined over the years to
reflect changing stakeholder priorities. It focuses on three
areas: climate change, resources and caring for the natural
environment. Our strategy is delivered through our
environmental policies. We focus on:
reducing our carbon footprint;
maximising the value of resources and reducing the impact
on the environment through re-use and re-cycling; and
using our land holdings in ways that benefit our business, the
environment and the communities in which we live and work.
This is all underpinned by maintaining high environmental
management standards.
As a company, we support climate change science. Reducing
greenhouse gas emissions is an important area of focus for us,
and is one of National Grid’s KPIs. You can read more about
this on page 10.
We support the Paris Agreement and National Grid has made a
commitment to reduce National Grid’s greenhouse gas
emissions by 45% by 2020, 70% by 2030 and 80% by 2050.
This aligns with the trajectory required to meet the goal of the
Agreement: to limit global warming to a 2˚C temperature rise
from 1990 levels.
In June 2017, the Financial Stability Board released its final
report on the recommendations of the Task Force on Climate-
related Financial Disclosures (TCFD). The voluntary framework
for disclosure of climate-related information in financial filings is
structured around four themes: governance, strategy, risk
management, and metrics and targets. We recognise the
importance of these disclosures and are committed to
implementing the recommendations.
This year National Grid was delighted to win Business in the
Community’s Award for Environmental Leadership.
PeopleWe are working hard to overcome some of the biggest energy
challenges of the 21st century. We need to make sure we have
highly motivated people, with the right skills, working for us, and
helping equip us for the future.
Our focus on people covers our current and future employees.
We aim to have an engaged and diverse workforce to stimulate
14 National Grid Gas plc NTS Regulatory Accounting Statements 2017/18
innovation, reflect the communities where we work, and deliver
great customer service.
The culture we strive for stems from embracing our values of
‘Doing the right thing’ and ‘Finding a better way’. You can read
more about our values on page 8.
We also know that building sufficient capability and leadership
capacity (including effective succession planning) is an
important factor in delivering our vision and strategy. You can
read more about how we are mitigating this on page 19.
Engaging our people
Through our approach to developing our people and the wider
benefits of working at National Grid we aim to have an engaged
and productive work force. To attract and retain employees we
make sure our remuneration package is both fair and
competitive. Through a third party company, we also carry out
an annual employee survey to measure engagement levels and
to help us address areas employees believe we need to
improve. Employee engagement forms one of our KPIs – you
can read more about this and our performance on page 10.
The wellbeing of our workforce is also important. This year our
employee lost time injury frequency rate improved to 0.05. Our
KPI is to achieve a safety performance below 0.10.
Safeguarding the future
We continue to raise awareness of the career opportunities in
the energy utility industry. The need for a skilled workforce to
develop, deliver and use new technologies within the energy
sector is becoming more acute according to the EU Skills
Workforce Strategy. Science, Technology, Engineering and
Mathematics (STEM) skills underpin our business, and we
promote STEM as an exciting career path for young people
through education outreach activity such as the Big Bang Fair,
work experience, and hosting school visits to our sites.
Whistleblowing
We have confidential external whistleblowing helplines available
24/7. We publicise the contact information to our employees
and on our external website so concerns can be reported
anonymously. Our policies make it clear that we will support
and protect ‘whistle-blowers’ and any form of retaliation will not
be tolerated.
Promoting an inclusive and diverse workforceIn 2017 we implemented inclusion and diversity policies. The
purpose of the policies is to demonstrate our commitment to
providing an inclusive, equal and fair working environment
through:
driving inclusion and promoting equal opportunities for
all;
ensuring the workforce, whether part-time, full-time or
temporary, will be treated fairly and with respect;
eliminating discrimination; and
ensuring selection for employment, promotion, training,
development, benefit and reward, will be on the basis of
merit.
12% of our total workforce has declared themselves to be of
‘minority’ racial or ethnic heritage. We recognise the value a
diverse workforce and an inclusive culture bring to our business
and have many initiatives to encourage and promote this. For
example, our UK employee resource groups created our
second edition of ‘Remarkable’, which highlights the full
diversity of our people. We have implemented a diverse panel
interview approach to appoint senior leaders.
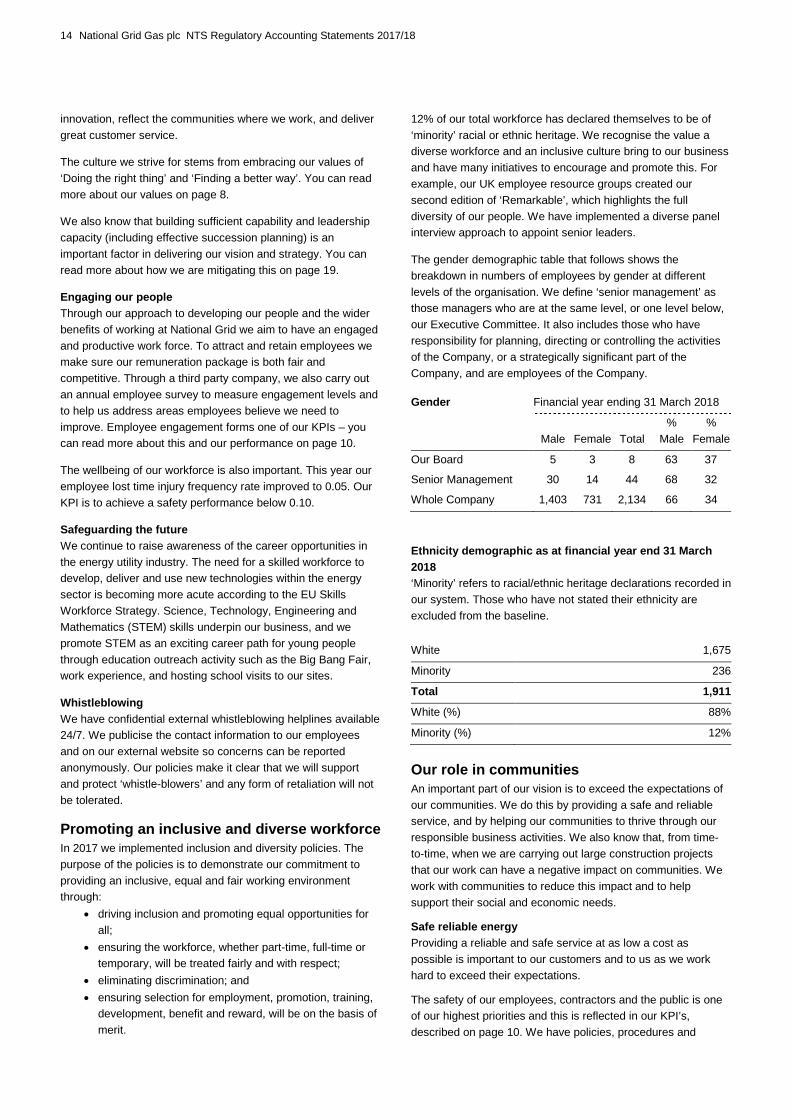
The gender demographic table that follows shows the
breakdown in numbers of employees by gender at different
levels of the organisation. We define ‘senior management’ as
those managers who are at the same level, or one level below,
our Executive Committee. It also includes those who have
responsibility for planning, directing or controlling the activities
of the Company, or a strategically significant part of the
Company, and are employees of the Company.
Gender Financial year ending 31 March 2018
Male Female Total
%
Male
%
Female
Our Board 5 3 8 63 37
Senior Management 30 14 44 68 32
Whole Company 1,403 731 2,134 66 34
Ethnicity demographic as at financial year end 31 March
2018
‘Minority’ refers to racial/ethnic heritage declarations recorded in
our system. Those who have not stated their ethnicity are
excluded from the baseline.
White 1,675
Minority 236
Total 1,911
White (%) 88%
Minority (%) 12%
Our role in communitiesAn important part of our vision is to exceed the expectations of
our communities. We do this by providing a safe and reliable
service, and by helping our communities to thrive through our
responsible business activities. We also know that, from time-
to-time, when we are carrying out large construction projects
that our work can have a negative impact on communities. We
work with communities to reduce this impact and to help
support their social and economic needs.
Safe reliable energy
Providing a reliable and safe service at as low a cost as
possible is important to our customers and to us as we work
hard to exceed their expectations.
The safety of our employees, contractors and the public is one
of our highest priorities and this is reflected in our KPI’s,
described on page 10. We have policies, procedures and

National Grid Gas plc NTS Regulatory Accounting Statements 2017/18 15
training in place to make sure we maintain our safety
performance at the high level that we expect.
The reliability of our networks is world class, running at more
than 99.9% availability. You can read more about this on page
10 as well as how we manage our operational risks on page 18.
Supporting communities to thrive
We don’t just supply power to communities, we are part of
them. As a purpose-led organisation, we believe that helping to
build strong communities is good for the people who live there,
good for our business and good for the wider economy.
We achieve this by partnering with civil society, providing
communities with one-off grants to support their social,
economic and environmental development. We encourage our
employees to pursue skills-based volunteering and fundraising
opportunities. In the future, we will be focusing on helping to
address social mobility in the UK.
National Grid voluntarily set up a £150 million Warm Home
Fund after the sale of a 61% stake in the UK Gas Distribution
business to help address fuel poverty. To date, National Grid
has given out just over £63 million to improve homes and help
people across England, Wales and Scotland by, for example,
enabling them to have central heating systems for the first time.
Our employees also support local schools and colleges with
work experience opportunities and careers advice sessions.
Last year we had more than 35,000 quality STEM interactions
with young people across the National Grid plc group.
Investing in future generations links in with one of our strategic
priorities to ensure that National Grid Gas Plc is better equipped
for the future. National Grid is part of the Government’s
Inclusive Economic Partnership, a partnership between the
business sector, Government and Civil Society. We are
supporting work in the vital areas of mental health in the
workplace and equipping people to successfully transition to the
world of work.
Preventing modern slavery
We strive to make sure that modern slavery is not taking place
anywhere in our business or in our supply chain. We recognise
that we are reliant on our suppliers to deliver our human rights
requirements within their own supply chains and we expect all
suppliers to be compliant with the Modern Slavery Act. Each
year we publish our modern slavery statement on the National
Grid website.
We work with our suppliers and peers to understand what
approach they are taking to combat modern slavery. In 2017
the group completed a desktop risk assessment of the group’s
top 250 suppliers. We are now engaging with those suppliers
that have been identified as potentially high risk and will be
working with them to complete a range of assessment
questions to develop risk mitigation plans for any identified
issues.
We are also developing a framework for our buyers so that the
sustainability risk criteria, including modern slavery, can be
embedded into the initial stages of the sourcing process and
integrated into the selection criteria. Any risks identified will be
reviewed through the contract management process.

16 National Grid Gas plc NTS Regulatory Accounting Statements 2017/18
Good business conduct
To provide an understanding of the company’s development,
performance and position, we describe our respect for human
rights, anti-corruption and anti-bribery matters below.
Human rights
Respect for human rights is incorporated into our employment
practices and our values, which are integral to our ethical
business conduct guide – the way in which we conduct
ourselves allows us to build trust with the people we work with.
We earn this trust by doing things in the right way, and by
building our reputation as an ethical company that our
stakeholders want to do business with and our employees want
to work for. However, due to the jurisdictions in which we
operate, the nature of the work we undertake, and our
associated supply chain, human rights is not considered to be a
principal risk to our business.
Although we do not have specific policies relating to human
rights, slavery or human trafficking, our procurement policies
integrate sustainability into the way we do business throughout
our supply chain, so that we create value, preserve natural
resources and respect the interests of the communities we
serve and from which we procure goods and services.
Through our Supplier Code of Conduct we expect our suppliers
to keep to all laws relating to their business, as well as adhere
to the principles of the United Nations Global Compact, the
Ethical Trading Initiative Base Code, the UK Modern Slavery
Act 2015, and the requirements of the Living Wage Foundation.
Anti-bribery and corruption
We have policies and governance in place that set and monitor
our approach to being responsible, including Our Code of
Business Conduct (covering bribery and corruption). We have a
Company-wide framework of controls designed to prevent and
detect bribery.
We investigate all allegations of ethical misconduct thoroughly,
and where appropriate, we take corrective action. We also
record trends and metrics relating to such allegations – only a
small percentage of these relate to bribery or corrupt practices,
so we do not consider them to be material for reporting
purposes. For the seventh successive year we have been
awarded the World’s Most Ethical Business title from
Ethisphere.
Governance and oversight
We regularly review and update our framework so we can make
sure our procedures remain proportionate to the principle risks
we have identified.
Our Ethics and Compliance Committee (ECC) oversees the
Code of Ethical Business Conduct and associated awareness
programmes. Any cases alleging bribery are required to be
referred immediately to the ECC so the members can satisfy
themselves that cases are investigated promptly and where
appropriate, acted upon, including ensuring any lessons learnt
are communicated across the business.
The Audit Committee receives an annual report on the
procedures currently in place to prevent and detect bribery. You
can read more about the Audit Committee’s role on pages 27
and 31. None of our investigations over the last twelve months
have identified cases of bribery.
Anti-bribery policy
the National Grid Policy Statement – Anti Fraud and Bribery
applies to all permanent employees, temporary agency staff
and contractors. It sets out our zero tolerance approach to
bribery.
To ensure compliance with the UK Bribery Act 2010, we carried
out a risk assessment across the Company so we could
highlight higher risk areas and make sure adequate procedures
were in place to address them. We introduced an e-learning
course for all employees so they can adequately understand
the Company’s zero tolerance approach to fraud, bribery or
corruption of any kind.
Ethical business conduct
We follow the National Grid Group Code of Ethical Business
Conduct, which sets out the standards and behaviours we
expect from all employees to meet our values of Do the Right
Thing and Find a Better Way. The document is issued to all
employees and is supported by a regular programme of
communications to promote a strong ethical culture.
Additionally, we provide briefings for high risk areas of the
business, such as Procurement.
SuppliersOur Supplier Code of Conduct is issued to our suppliers and
sets out our requirements that they have in place a programme
with procedures to prevent and detect bribery and corruption, in
accordance with all applicable laws or regulations, including the
UK Bribery Act 2010.
We provide specific guidance and briefings for high risk areas,
so contractors, agents and others who are acting on behalf of
National Grid Gas Plc do not engage in any illegal or improper
conduct. Our Global Procurement team carries out regular
supplier screening to identify any requirements for prosecutions
or sanctions within our supplier base.
Compliance framework
Each of our business areas are required to consider their
specific risks and maintain a compliance framework setting out
the controls they have in place to prevent bribery. Every six
months, as part of the compliance procedure, the business is
asked to self-assess the effectiveness of their controls and
provide evidence that supports their compliance.
Each year, all function heads are asked to certify the
compliance in their area, and to provide details of any
exceptions. This culminates in presentation of a Certificate of
Assurance from the National Grid plc CEO to the National Grid
plc Board (following consideration by the National Grid plc Audit
Committee).

National Grid Gas plc NTS Regulatory Accounting Statements 2017/18 17
Internal control and risk managementThe National Grid Gas Board is committed to protecting and
enhancing our reputation and assets, while safeguarding the
interests of our stakeholders. It has overall responsibility for the
Company’s system of risk management and internal control.
Managing our risks
National Grid Gas is exposed to a variety of uncertainties that
could have a material adverse effect on its financial condition,
its operational results, its reputation, and the value and liquidity
of its shares.
The National Grid Gas Board oversees the Company’s risk
management and internal control systems as it relates to our
gas operations. The Board assesses these risks and monitors
the risk management process through risk review and challenge
sessions twice a year.
Risk management process
Overall risk strategy, policy and process are set at the Group
level by National Grid plc with implementation owned by
National Grid Gas. Our enterprise risk management process
provides a framework through which we can consistently
identify, assess and prioritise, manage, monitor and report risks.
Our UK Regional risk profile, which is presented to the National
Grid Gas Board biannually, contains the most important gas
and electric risks currently facing the company as we
endeavour to achieve our strategic objectives. We agree these
top risks through implementation of our top-down/bottom-up risk
management process. The risks are reported and debated with
the National Grid UK Executive Committee every three months.
A broad range of factors are considered when determining our
most important risks. The potential for nationalisation of energy
supply networks by the UK Labour Party continues to be kept
under review. Should the UK Labour Party come into power, the
timing and route to energy supply network nationalisation
generally is uncertain, and therefore the impact upon National
Grid Gas remains unclear. Options considered have included
acquisition of the listed plc, the UK business, the transfer of
transmission assets to ‘regional communities’ and regulatory
change. The Government would have to pay compensation for
the Company’s property, which would be determined at the
time, but would be an amount reasonably related to the value of
the property taken. We have taken a number of steps, including
canvassing a wide range of stakeholders – government
officials, consumers, members of the public – to understand the
impact of nationalisation on certain stakeholder groups.
In addition to the issues above, senior leaders have also
considered certain aspects of the risks in more detail, including
cyber security and Brexit.
The UK Regional risk profile informs the National Grid Principal
Risk profile which is tested annually to establish the impact on
the company’s ability to continue operating and to meet its
liabilities over a specified assessment period The impact of
these risks are tested on a reasonable worst case basis, alone
and in clusters, the result of which is utilised to develop our
viability statement. The National Grid Board, National Grid
Group Executive Committee and other leadership teams
discuss the results of the annual testing of our principal risks at
the end of the year.
Changes during the year
Significant changes have been made to the UK Regional risk
profile as a result of UK Executive Committee workshops in
2017 including the addition of new risks, removal of existing
risks and the rewording and/or consolidation of several risks to
better reflect the current meaning of the risk. Additionally this
year, a reassessment of the Company’s risk appetite resulted in
the establishment of a system of classification of risks into
categories (Operational, Strategic, Regulatory, People and
Financial) which is utilised in our reporting.
The UK Regional risk profile as it relates to gas operations is
presented in table below.
Internal Controls
There has been a National Grid Group wide focus on internal
control improvement throughout the year. This review resulted
in observations across a number of key UK processes and
included a focus on the reliance placed on the data used in
controls and on third-party reports, and the precision of key
review controls.
In response, the UK Executive leadership defined a
comprehensive multi-year control programme to identify and
implement solutions to optimise the UK business control
environment while continuing to focus on the real-time need of
addressing the findings of the National Grid Group led SOX
refresh programme in the short term.
The UK Executive Committee and the National Grid Gas Audit
Committee has challenged management on its progress on
mitigating control observations as they arose and requested
additional insight into areas which were subject to shorter-term
fixes. The Committee sought additional context from
management on its assessment of the severity of the matters
identified, the identification of mitigating controls and the impact
on the year-end aggregation exercise.
After careful consideration the Committee concurred with
management’s overall assessment that the company’s internal
control over financial reporting is effective.

18 National Grid Gas plc NTS Regulatory Accounting Statements 2017/18
Our principal risks and uncertaintiesAccepting that it is not possible to identify, anticipate or eliminate every risk that may arise and that risk is an inherent part of doing
business, our risk management process aims to provide reasonable assurance that we understand, monitor and manage the main
uncertainties that we face in delivering our objectives. This includes consideration of inherent risks, which exist because of the nature of
day-to-day operations in our industry, and financial risks, which exist because of our financing activities. Our principal risks and a
summary of management and mitigation actions are provided in the table below.
Operational
risks
Operational risks relate to the risk of losses resulting from inadequate or failed internal processes, people and systems or due toexternal events. We normally have low appetite for such risks, as there is no strategic benefit from accepting risks which are not inline with our vision and values.
Our operational principal risks have a low likelihood of occurring but have a high level of impact should the event occur withouteffective prevention and mitigation controls. The risk owners, executive leaders, and their teams develop and monitor actions tocontrol the risks. Operational risks are managed through policy, standards, and procedure based controls, active prevention andmonitoring. The operational risks link to our strategic priority of, ‘Find new ways of optimising our operational performance’.Principal risk assessment includes reasonable worst case scenario testing – i.e. gas transmission pipeline failure, loss of licenceto operate, cyber security attack – and the financial and reputational impact should a single risk or multiple risks materialise.External events over this past year including extreme weather events, the WannaCry cyber security attack, and new data privacylegislation were considered in the assessment and testing, as well as in the development of mitigation actions.
Risks
Catastrophic major hazard asset failure results in asignificant safety event.
Risk trend:
Failure of critical national infrastructure (CNI) IS Systems.
Risk trend:
Major cyber security breach of business and CNIsystems/data.
Risk trend:
Failure of a Business Critical Enterprise (non-CNI) ISSystem or Systems.
Risk trend:
We will fail to meet gas supply and fail to deliver obligations.
Risk trend:
Our workers, contractors or members of the publicexperience an occupational safety incident that results in afatal or life-changing injury.
Risk trend:
Actions taken by management
We continue to commit significant resources and financialinvestment to maintaining the integrity and security of our assetsand data. This year, we have continued to focus on risk mitigationactions designed to reduce risk and help meet our businessobjectives. Monitoring action statuses has been incorporated intovarious business processes and senior leadership meetings.Examples of actions include:
A National Grid Group-wide process safety managementsystem is in place to make sure a robust and consistentframework of risk management exists across our higherhazard asset portfolio.
We continually invest in strategies that are commensuratewith the changing nature of the security landscape. Thisincludes collaborative working with the Centre for Protectionof National Infrastructure (CPNI) on key cyber risks, as wellas development of an enhanced CNI security strategy.
Business continuity and emergency plans are in place andpractised to ensure we quickly and effectively respond to avariety of incidents – storms, physical and cyber-relatedattacks, environmental incidents and asset failures.
Safety plans have been developed to identify key risks andmitigation actions implemented as appropriate.
We have a mature insurance strategy that uses a mix of self-insurance, captives and direct (re)insurance placements.This provides some financial protection in respect of propertydamage, business interruption and liability risks.
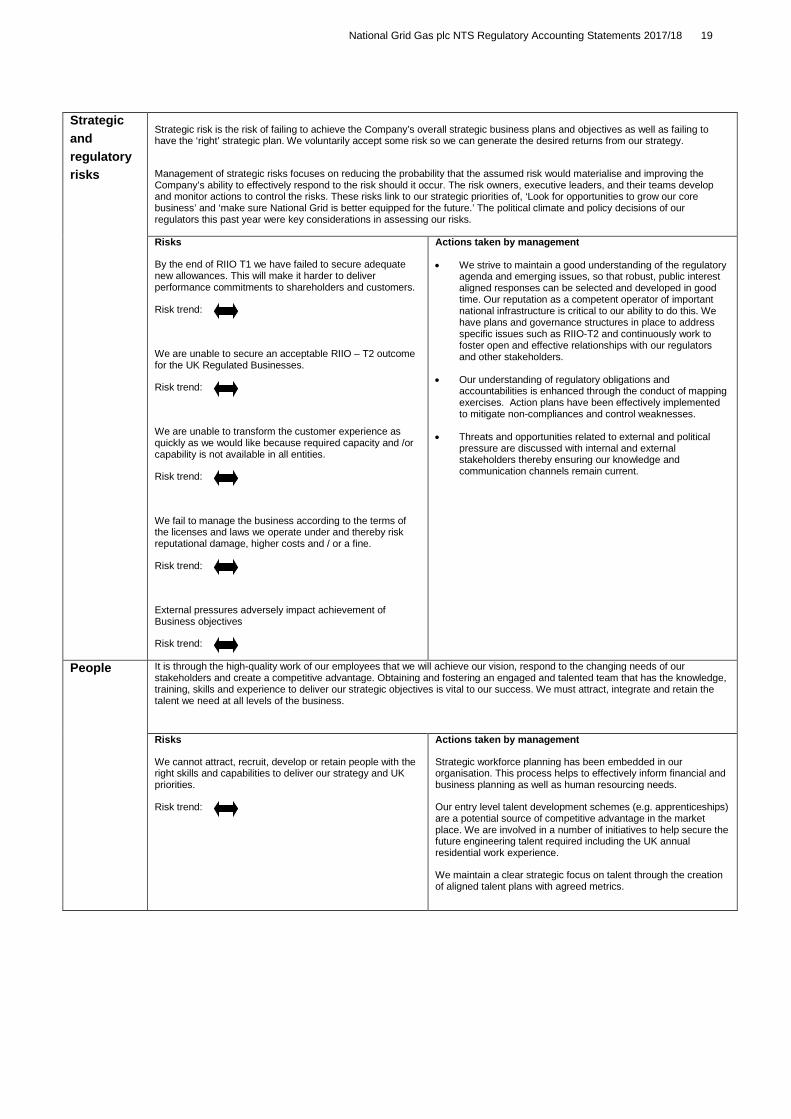
National Grid Gas plc NTS Regulatory Accounting Statements 2017/18 19
Strategic
and
regulatory
risks
Strategic risk is the risk of failing to achieve the Company’s overall strategic business plans and objectives as well as failing tohave the ‘right’ strategic plan. We voluntarily accept some risk so we can generate the desired returns from our strategy.
Management of strategic risks focuses on reducing the probability that the assumed risk would materialise and improving theCompany’s ability to effectively respond to the risk should it occur. The risk owners, executive leaders, and their teams developand monitor actions to control the risks. These risks link to our strategic priorities of, ‘Look for opportunities to grow our corebusiness’ and ‘make sure National Grid is better equipped for the future.’ The political climate and policy decisions of ourregulators this past year were key considerations in assessing our risks.
Risks
By the end of RIIO T1 we have failed to secure adequatenew allowances. This will make it harder to deliverperformance commitments to shareholders and customers.
Risk trend:
We are unable to secure an acceptable RIIO – T2 outcomefor the UK Regulated Businesses.
Risk trend:
We are unable to transform the customer experience asquickly as we would like because required capacity and /orcapability is not available in all entities.
Risk trend:
We fail to manage the business according to the terms ofthe licenses and laws we operate under and thereby riskreputational damage, higher costs and / or a fine.
Risk trend:
External pressures adversely impact achievement ofBusiness objectives
Risk trend:
Actions taken by management
We strive to maintain a good understanding of the regulatoryagenda and emerging issues, so that robust, public interestaligned responses can be selected and developed in goodtime. Our reputation as a competent operator of importantnational infrastructure is critical to our ability to do this. Wehave plans and governance structures in place to addressspecific issues such as RIIO-T2 and continuously work tofoster open and effective relationships with our regulatorsand other stakeholders.
Our understanding of regulatory obligations andaccountabilities is enhanced through the conduct of mappingexercises. Action plans have been effectively implementedto mitigate non-compliances and control weaknesses.
Threats and opportunities related to external and politicalpressure are discussed with internal and externalstakeholders thereby ensuring our knowledge andcommunication channels remain current.
People It is through the high-quality work of our employees that we will achieve our vision, respond to the changing needs of ourstakeholders and create a competitive advantage. Obtaining and fostering an engaged and talented team that has the knowledge,training, skills and experience to deliver our strategic objectives is vital to our success. We must attract, integrate and retain thetalent we need at all levels of the business.
Risks
We cannot attract, recruit, develop or retain people with theright skills and capabilities to deliver our strategy and UKpriorities.
Risk trend:
Actions taken by management
Strategic workforce planning has been embedded in ourorganisation. This process helps to effectively inform financial andbusiness planning as well as human resourcing needs.
Our entry level talent development schemes (e.g. apprenticeships)are a potential source of competitive advantage in the marketplace. We are involved in a number of initiatives to help secure thefuture engineering talent required including the UK annualresidential work experience.
We maintain a clear strategic focus on talent through the creationof aligned talent plans with agreed metrics.
20 National Grid Gas plc NTS Regulatory Accounting Statements 2017/18
Our internal control processWe have a number of processes to support our internal control
environment. These processes are managed by dedicated
specialist teams, including risk management, ethics and
compliance management, corporate audit and internal controls,
and safety, environment and health. Oversight of these activities
is provided through regular review and reporting to the Board
and appropriate Board committees as outlined in the Corporate
Governance section on pages 27 to 32.
Monitoring internal control is conducted through established
boards and committees at different levels of the National Grid plc
organisation. Deficiencies are reported and corrected at the
appropriate entity-level. The most significant risk and internal
controls issues are monitored at the Senior Executive and
National Grid plc Board level. The National Grid Audit
Committee is responsible for keeping under review and reporting
to the Board on effectiveness of reporting, internal control
policies, UK Bribery Act legislation, appropriateness of financial
disclosures and procedures for risk and compliance
management, business conduct and internal audit.
Reviewing the effectiveness of our internal control
and risk management
The Audit Committee continually monitors and assesses the
effectiveness of our internal control systems and risk
management processes covering all material systems, including
financial, operational and compliance controls, to make sure
they remain robust.
The latest review covered the financial year to 31 March 2018
and the period to the approval of this Annual Report and
Accounts. In this review, the Board considered the effectiveness
of areas such as the control environment, risk management and
internal control activities, including those described below.
Fostering a culture of integrity is an important element of our risk
management and internal controls system. National Grid’s
values: ‘do the right thing’ and ‘find a better way’ provide a
framework for reporting business conduct issues, educating
employees and promoting a culture of integrity at all levels of the
business. We have policies and procedures in place to
communicate behaviour expected from employees and third
parties, and to prevent and investigate fraud and bribery and
other business conduct issues. We monitor and address
business conduct issues through several means, including a bi-
annual review by the Audit Committee.
Overall compliance strategy, policy and frameworks are set at
the National Grid plc Group-level with implementation owned by
National Grid Gas. The business is responsible for identifying
compliance issues, continuous monitoring, and developing
actions to improve compliance performance. We monitor and
address compliance issues, through several means including
reviews leadership meetings and a bi-annual review by the Audit
Committee.
A feature of our internal controls system is our three lines of
defence model. This model is a way of explaining the
relationship between functions and how responsibilities for risk
and controls are allocated and monitored. Each business
function owns and is responsible for managing its own particular
risk and controls (the first line of defence). Central management
teams (the second line of defence) act as an advisory function
on implementing the principal risk assessments and actions
taken to mitigate and manage those risks. The internal audit
function then audits selected controls to provide independent
assessments of the effectiveness of our risk management and
internal control systems (the third line of defence).
The Certificate of Assurance (CoA) from the Chief Executive of
National Grid to the National Grid Board provides overall
assurance around the effectiveness of our risk management and
internal controls systems. The Certificate of Assurance (CoA)
process operates via a cascade system and takes place
annually in support of the financial end of year review. The
CoA’s from senior managers within National Grid provide
upwards assurance on the risk management and internal
controls systems for their areas of responsibility. The National
Grid Chief Executive’s certificate was prepared using the
information provided to him in the certificates of the National
Grid Group Executive Committee members and was the final
certificate presented to the National Grid Audit Committee and
National Grid Board for review and consideration.
The periodic reports on management’s opinion on the
effectiveness of internal controls over financial reporting are
received by the National Grid Gas Audit Committee and Board in
advance of the full-year results.
Internal control over financial reporting
We have specific internal mechanisms that govern the financial
reporting process and the preparation of the Annual Report and
Accounts. Our financial controls guidance sets out the
fundamentals of internal control over financial reporting, which
are applied across the Company. Our financial processes
include a range of system, transactional and management
oversight controls. In addition, our businesses prepare detailed
monthly management reports that include analysis of their
results, along with comparisons to relevant budgets, forecasts
and prior year results. These are presented to, and reviewed by,
senior management within our Finance function.
These reviews are supplemented by quarterly performance
reviews, attended by the UK CEO and UK CFO. The reviews
consider historical results and expected future performance and
involve senior management from both operational and financial
areas of the business. Each month, the UK CFO presents
consolidated financial report to the Board.

National Grid Gas plc NTS Regulatory Accounting Statements 2017/18 21
Viability statement
The Board’s consideration of the longer-term viability of the
Company is an extension of National Grid plc’s business
planning process. This includes financial forecasting, a robust
risk management assessment, regular budget reviews and
scenario planning incorporating industry trends and economic
conditions. Our business strategy aims to enhance our long-
term prospects by making sure our operations and finances are
sustainable.
National Grid Gas plc (NGG) is a wholly-owned subsidiary of
National Grid plc which performed a group wide business plan
that was reviewed and approved by the National Grid plc Board
and which included details of the NGG operating segment.
The Board have concluded that five years is the most
appropriate timeframe over which to assess the long-term
viability of the Company given our business model, current
regulatory clarity, other factors impacting our operating
environment, and the robustness of our business planning
process. This is in line with our five year business plan and one
year budget which are reviewed and approved by the National
Grid plc Board.
The business plan considers the significant solvency and
liquidity risks involved in delivering our business model in light
of our strategic priorities. The business plan models upside and
downside scenarios derived from the risks and opportunities
identified, and determines the impact these would have on our
results and financial position over the five-year period. We have
set out the details of the principal risks facing our Company on
pages 18 to 19, described in relation to our ability to deliver our
strategic objectives. We identify our principal risks through a
robust assessment that includes a continuous cycle of bottom
up reporting and review, and top down feedback.
The business model calls for significant capital investment to
maintain and expand our network infrastructure. To deliver this,
our business plan highlights that we will need to access capital
markets to raise additional funds from time to time. We have a
long and successful history in this regard. Our business plan
also models various KPIs used by lenders in assessing a
company’s credit worthiness. These models indicate that we
would continue to have access to capital markets at
commercially acceptable interest rates throughout the five-year
period.
The National Grid plc Board assessed our financial “headroom”,
and reviewed principal risk testing results against that
headroom. No principal risk or cluster of principal risks was
found to have an impact on the viability of the Company over
the five-year assessment period. Preventative and mitigating
controls in place to minimise the likelihood of occurrence and/or
financial and reputational impact are contained within our
assurance system.
The NGG Board review and approve the annual certificates in
respect of compliance with certain licence conditions (including
Financial Ring-fencing and Availability of Resources). The
Electricity Transmission Financial Ring-fencing certificate was
approved by the Board in March 2018, and the Availability of
Resources certificate was issued in July 2017, the next
Availability of Resources certificate will be issued in July 2018.
In assessing the impact of the principal risks on the Company,
the Board has considered the fact that we operate in stable
markets and the robust financial position of the Company,
including the ability to raise capital and suspend or reduce the
payment of dividends. It has also considered Ofgem’s legal duty
to have regard to the need to fund licenced NGG activities.
Based on the assessment described above and on page 33, the
Directors have a reasonable expectation that the Company will
be able to continue operating and meet its liabilities over the
period to June 2023.
The Strategic Report was approved by the Board of Directors
on 27 July 2018 and signed on its behalf by:
Alan Foster
UK CFO

22 National Grid Gas plc NTS Regulatory Accounting Statements 2017/18
Financial reviewWe have delivered another year of solid financial performance.
Revenue from continuing operations increased by £84 million to
£1,424 million, and adjusted operating profit increased by £74
million to £647 million.
Use of adjusted profit measuresIn considering the financial performance of our business and
segments, we use various adjusted profit measures in order to
aid comparability of results year on year.
The various measures are presented and reconciled below.
In considering the financial performance of our businesses and
segments, we analyse each of our primary financial measures
of operating profit, profit before tax and profit for the year
attributable to equity shareholders into two components.
The first of these components is referred to as an adjusted
profit measure, also known as ‘Headline’ or a’ business
performance’ measure. This is the measure used by
management that forms part of the incentive target set annually
for remunerating certain Executive Directors. Adjusted results
exclude exceptional items and remeasurements. These items
are reported collectively as the second component of the
financial measures. Note 3 explains in detail the items which
are excluded from our adjusted profit measures.
Adjusted profit measures have limitations in their usefulness
compared with the comparable total profit measures as they
exclude important elements of our financial performance.
However, we believe that by presenting our financial
performance in two components it is easier to read and interpret
financial performance between periods, as adjusted profit
measures are more comparable having removed the distorting
effect of the excluded items. Those items are more clearly
understood when separately identified and analysed.
The presentation of these two components of financial
performance is additional to, and not a substitute for, the
comparable total profit measures presented.
Management uses adjusted profit measures as the basis for
monitoring financial performance. These measures are also
used in communicating financial performance to its investors in
external presentations and announcements of financial results.
Internal financial reports, budgets and forecasts are primarily
prepared on the basis of adjusted profit measures, although
planned exceptional items, such as significant restructurings,
are also reflected in budgets and forecasts. We separately
monitor and disclose the excluded items as a component of our
overall financial performance.
Reconciliations of adjusted profit measuresReconciliation of adjusted operating profit to total
operating profit
Adjusted operating profit is presented on the face of the income
statement under the heading operating profit before exceptional
items.
Years ended 31 March
Continuing 2018 2017
£m £m
Adjusted operating profit 647 573
Exceptional items - (109)
Total operating profit 647 464
Reconciliation of adjusted operating profit to adjusted
earnings and earnings
Years ended 31 March
Continuing 2018 2017
£m £m
Adjusted operating profit 647 573
Adjusted net finance costs (196) (155)
Adjusted profit before tax 451 418
Adjusted taxation (98) (66)
Adjusted profit after tax 353 352
Attributable to non-controlling interests - -
Adjusted earnings 353 352
Exceptional items after tax - (47)
Remeasurements after tax 17 (6)
Earnings 370 299
Reconciliation of adjusted operating profit excluding timing
differences to total operating profit
Adjusted profit excluding timing differences is presented below.
Years ended 31 March
Continuing 2018 2017
£m £m
Adjusted operating profit excluding timing differences 665 511
Timing differences1 (18) 62
Adjusted operating profit 647 573
Exceptional items - (109)
Total operating profit 647 464
1 Our operating profit for the year includes a total estimated in-year
under-collection of £18 million (2016/17: £62 million over-collection).

National Grid Gas plc NTS Regulatory Accounting Statements 2017/18 23
Consolidated income statement
commentary
The commentary below describes the continuing business
results for the year ending 31 March 2018.
Years ended 31 March
2018 2017
£m £m
Revenue 1,424 1,340
Operating costs (777) (767)
Operating profit 647 573
Exceptional items - (109)
Finance income 8 5
Finance costs:
Before exceptional items and remeasurements (204) (160)
Exceptional items and remeasurements 21 (7)
Profit before tax 472 302
Taxation:
Before exceptional items and remeasurements (98) (66)
Exceptional items and remeasurements (4) 63
Profit after tax 370 299
Revenue
Revenue for the year ended 31 March 2018 increased by
£84 million to £1,424 million. The increase in revenue is
reflective of increased exit capacity allocations due to an
increase in prices, combined with an increase in sales to
Cadent which is now classified as external following the sale of
the Gas Distribution business in 2016/17.
Operating profit
Adjusted operating profit for continuing operations for the year
ended 31 March 2018 of £647 million represents an increase
against last year of £74 million.
Exceptional items of £109 million included in our operating
costs for the year ended 31 March 2017 relate to £109 million
gain on the sale of land sites, offset by the creation of £107
million of gas holder demolition provisions, £89 million of costs
incurred due to sectionalisation of the National Grid UK Pension
Scheme and £22 million of pension deficit charges.
The results for 2017/18 include a release of a one off
dilapidations provision of £11m for the demolition of the LNG
Storage site in Avonmouth. The provision was made in
2014/15 when there were plans to demolish the Avonmouth site
and remarket it as a brownfield site for sale. In 2017/18 a
number of the conditions for sale were reached and it is
expected that the remaining conditions will be met soon so it is
highly unlikely that the tanks would ever need to be demolished,
hence no dilapidation provision was retained at 31 March 2018.
Net finance costs
For the year ended 31 March 2018, net finance costs of £196
million are £41 million higher than the prior year, principally
driven by higher RPI rates during the year impacting our index
linked debt.
Taxation
The tax charge on profits before exceptional items and
remeasurements was £32 million higher than 2016/17. This was
due to the non-recurrence of one-off prior year tax credits and
increased profits in the year offset by a benefit from a 1%
reduction in the UK taxation rate.
Regulatory businessesRevenue by regulatory business
Years ended 31 March
2018 2017
£m £
NTS business 1,107 1,068
Other activities1 317 313
Inter-business - (41)
Total revenue 1,424 1,340
Adjusted operating profit by regulatory business
Years ended 31 March
2018 2017
£m £m
NTS business 474 420
Other businesses1 173 153
Adjusted operating profit 647 573
Operating profit by regulatory business
Years ended 31 March
2018 2017
£m £m
NTS business 474 331
Other businesses1 173 133
Total operating profit 647 464
1 Other activities include Metering, de-minimis activities and other activities.
2017/18 compared with 2016/17
Changes to adjusted operating profit for 2017/18 compared with
2016/17 are analysed by regulatory business in the table below.
£m
2016/17 adjusted operating profit 573
NTS business 54
Other businesses1 20
2017/18 adjusted operating profit 647
1 Other activities include Metering, de-minimis activities and other activities.

24 National Grid Gas plc NTS Regulatory Accounting Statements 2017/18
Consolidated statement of
financial position commentary
The consolidated statement of financial position sets out all the
Group’s assets and liabilities at the year end. As a capital-
intensive business, we have significant amounts of physical
assets and corresponding borrowings.
Years ended 31 March
2018 2017
£m £m
Non-current assets 9,046 8,762
Current assets 2,184 2,447
Total assets 11,230 11,209
Current liabilities (1,690) (1,787)
Non-current liabilities (5,039) (5,583)
Total liabilities (6,729) (7,370)
Net assets 4,501 3,839
Property, plant and equipment
Property, plant and equipment increased by £77 million to
£4,416 million as at 31 March 2018. This was due to capital
expenditure of £324 million, offset by £213 million of
depreciation in the year and disposals of £24 million.
Other non-current assets
Other non-current assets comprise an interest-free loan to our
immediate parent company National Grid Gas Holdings Limited
of £3,427 million, and non-current prepayments which
increased by £84 million.
Trade and other receivables
Trade and other receivables have decreased by £206 million to
£314 million at 31 March 2018. This decrease is principally due
to a decrease in amounts owed by fellow subsidiaries of £121
million and a decrease in prepayments of £92 million which is
largely as a result of reclassification to non-current.
Derivative financial instruments
The £33 million decrease in derivative value is mainly due to
foreign exchange rate movements impacting our cross currency
swaps offset by swap terminators associated with restructuring
of the financing portfolio.
Trade and other payables
Trade and other payables have increased by £18 million to
£632 million. This was mainly due to an increase in amounts
due to fellow subsidiaries of £28 million.
Current and deferred tax liabilities
Current and deferred tax liabilities have increased by £89
million to £464 million. This was mainly as a result of the
increase in the pension scheme asset.
Provisions
Provisions (both current and non-current) decreased by £88
million in the year largely relating to utilisation of provisions
relating to business set up costs and business restructuring
costs on the disposal of Gas Distribution.
Other non-current liabilities
Other non-current liabilities decreased by £12 million to £177
million due primarily to the crop and quarry accrual being
reclassified to provisions.
Other balance sheet items
During the year ended 31 March 2017 pension sectionalisation
occurred within the National Grid plc Group, with the National
Grid UK Pension Scheme being split into three parts, Sections
A, B and C. National Grid Gas became a sponsoring employer
for Section B. This has resulted in a change in National Grid
Gas from recognising a pension charge for the year and
recognising the scheme as if it were a defined contribution
scheme to recognising a net pension asset on the balance
sheet and accounting as a defined benefit scheme.
We operate pension arrangements on behalf of our employees
the majority of whom are members of the defined benefits
section which is closed to new entrants. Membership of the
defined contribution section of the National Grid Pension
Scheme is offered to all new employees.
Net pensions obligations
A summary of the total assets and liabilities and the overall net
IAS 19 (revised) accounting surplus is shown below:
Net scheme asset £m
As at 1 April 2017 45
Current service cost (18)
Net interest cost -
Administration and other (7)
Actuarial gains
on plan assets 330
on plan liabilities -
Employer contributions 62
As at 31 March 2018 412
The principal movements in the pension asset during the year
include net actuarial gains of £330 million and employer
contributions of £62 million. The overall obligation moved by
£367 million to a closing asset of £412 million.
Further information on our pensions benefit obligations can be
found in notes 19 and 26 to the consolidated financial
statements.

National Grid Gas plc NTS Regulatory Accounting Statements 2017/18 25
Cash flow statement commentary
The commentary below describes the continuing business
results for the year ending 31 March 2018.
Cash inflows and outflows are presented to allow users to
understand how they relate to the day-to-day operations of the
business (operating activities); the money that has been spent
or earned on assets in the year, including acquisitions of
physical assets or other businesses (investing activities); and
the cash raised from debt or share issues and other loan
borrowings or repayments (financing activities).
Reconciliation of cash flow to net debt 2018
£m
2017
£m
Cash generated from operations 956 723
Net capital expenditure (324) (246)
Business net cash flow 632 477
Net interest paid (92) (88)
Tax received / (paid) 16 (30)
Dividends paid - (8,100)
Discontinued operations (329) 7,249
Other 139 5,759
Net debt decrease 366 5,267
Opening net debt (3,185) (8,452)
Closing net debt (2,819) (3,185)
Cash generated from operations
Cash flows from our operations are largely stable when viewed
over the longer term. Our gas transmission operation is subject
to multi-year price control agreements with Ofgem.
For the year ended 31 March 2018, cash flow from operations
increased by £233 million to £956 million. Changes in working
capital decreased by £143 million from the prior year, principally
due to an increase in payables and current accounts.
Net capital expenditure
Net capital expenditure in the year of £324 million was
£78 million higher than the prior year.
Dividends paid
National Grid Gas did not pay any dividends in 2017/18. This
was £8,100 million lower than 2016/17 (see note 6). The
2016/17 dividends were made to ensure partial distribution of
the proceeds from the Gas Distribution business.
Discontinued operations
The Gas Disposal business contributed £7,249 million to the
cash flow in the prior year, primarily due to proceeds from the
sale and debt restructuring within investing activities of £6,585
million. Cash flows from operations were £460 million and cash
flows from financing activities were £204 million.
Regulated financial performance
Timing and Regulated Revenue Adjustments
Our allowed revenues are set in accordance with our regulatory
price controls. We calculate the tariffs we charge our customers
based on the estimated volume of energy and cost we expect
will be delivered during the coming period. The actual volumes
delivered will differ from this estimate. Therefore, our total
actual revenue will be different from our total allowed revenue.
These differences are commonly referred to as timing
differences. If we collect more than the allowed level of
revenue, the balance must be returned to customers in
subsequent periods, and if we collect less than the allowed
level of revenue we may recover the balance from customers in
subsequent periods.
In addition to the timing adjustments described above, following
the start of the RIIO price controls outperformance against
allowances as a result of the totex mechanism, together with
changes in output-related allowances included in the original
price control, will almost always be adjusted in future revenue
recoveries, typically starting in two years’ time.
Our current IFRS revenues and earnings will therefore include
these amounts that will need to be repaid or recovered in future
periods. Such adjustments will form an important part of the
continuing difference between reported IFRS results and
underlying economic performance based on our regulatory
obligations.
Return on Equity
Return on Equity for the year, using a long-run inflation rate of
3%, was 10.0% compared with a regulatory assumption, used
in calculating the original revenue allowance, of 10.0%. The
principal components are shown in the table below.
Year ended 31 March 2018 2017
Base return (including avg. 3% long-run
inflation)
10.0% 10.0%
Totex incentive mechanism (0.8)% (0.8)%
Other revenue incentives 1.2% 1.1%
Return including in year incentive
performance
10.4% 10.3%
Pre-determined additional allowances (0.4%) 0.5%
Return on Equity 10.0% 10.8%
The business performed below the targets set by the totex
incentive mechanism in the fifth year of RIIO. Totex spend was
£476m, compared to an estimated allowance, adjusted for
outputs and phasing of £438m, however this was in line with
prior year overall totex performance. The Company’s share of
this difference is expected to be £17m.

26 National Grid Gas plc NTS Regulatory Accounting Statements 2017/18
The business had another good year of incentive performance,
slightly up on 2016/17. Overall, the Gas Transmission business
delivered around 120 bps of additional returns through other
revenue incentives. The majority of this was from strong
performance on constraint management transmission support
services and shrinkage incentives. On a pre-tax basis, this
equates to an estimated £30m of additional revenue allowance,
most of which is due to be recovered in future years under the
RIIO funding mechanisms.
Cessation of legacy revenue allowances, as expected, led to
the reduction in pre-determined additional allowances.
Regulated Financial Position
RAV increased by 4.5% in the year, reflecting the impact of
inflation and a planned increase in asset health spend and
increase on the Feeder 9 project under the Humber Estuary.
Net other regulatory assets decreased by £91 million, mainly
reflecting revenues associated with Avonmouth which will start
to be repaid next year and an over-recovery on pension deficit
payments.
£m 2018 2017
Opening Regulated Asset Value
(RAV)*
5,755 5,597
Asset additions (aka slow money)
(actual)
304 201
Performance RAV or assets created (16) (11)
Inflation adjustment (actual RPI) 194 175
Depreciation and amortisation (223) (207)
Closing RAV 6,014 5,755
Opening balance of other regulated
assets and (liabilities)*
(34) 56
Movement (91) (120)
Closing balance (125) (64)
Closing Regulated Financial Position 5,889 5,691
Discontinued operations
Discontinued operations comprise the Gas Distribution and
Xoserve businesses. The results of the discounted operations
are presented below:
Years ended 31 March
2017 2016
Discontinued operations £m £m
Revenue 927 1,913
Operating costs (531) (1,056)
Operating profit 396 857
Net finance costs (77) (115)
Profit before tax 319 742
Taxation (5) (25)
Profit after tax 314 717
Gain on disposal 4,024 -
Taxation on gain on disposal 213 -
Gain on disposal 4,237 -
Total 4,551 717
In 2017/18, a profit of £17 million is reported in discontinued
operations, which relates to the reversal of provisions in respect
business restructuring costs following the sale of the Gas
Distribution business.
*2017/18 opening balances adjusted to correspond with 2016/17 regulatory filings and
calculations

National Grid Gas plc NTS Regulatory Accounting Statements 2017/18 27
CorporateGovernanceCorporate Governance Statement
National Grid Gas aims to achieve high standards of leadership
and governance. At the National Grid plc level, its Board
considers that it complied in full with the provisions of the UK
Corporate Governance Code 2016 (the Code) during the year
being reported on. National Grid Gas is not required to comply
with the Code; however, the Board is mindful of the principles of
the Code and develops its governance and oversight of the
Company considering not only its ultimate shareholder, National
Grid, but the wider range of stakeholders in its business. The
Corporate Governance Statement sets out the principal areas
of National Grid Gas Board governance together with an
explanation of areas where it considers that it has operated
consistently with the main principles of the Code.
Governance frameworkThe Board of the Company is collectively responsible for its
governance, and oversees its effective oversight of the
Company and its businesses, and compliance with all relevant
laws and regulations, including compliance with its obligations
under its Gas Transporter Licences. To facilitate this, a
comprehensive governance framework has been established.
This governance framework forms part of the wider National
Grid plc governance framework and is aligned, as required and
is applicable, to the Company. Risk management is
fundamental to delivering the long term success of the
Company and for that reason a separate section of this Annual
Report and Accounts has been dedicated to describing our
internal controls and risk management, see page 17. The day-
to-day operational and financial management of the Company’s
businesses is undertaken by committees. The committees are
operated in compliance with business separation obligations set
out in its licenses.
Reinforcing its commitment to sound corporate governance the
Board has continued to strengthen and develop both its
composition and governance framework, implementing, as
applicable, many of the best practice governance principles in
operation at the National Grid plc level.
Board compositionThe Board consists of six executive directors and two
Sufficiently Independent Directors (“SIDs”) who between them
provide a broad and diverse range of experience and technical
skills from both within and external to the organisation, from the
energy sector, other regulated industries and external bodies.
This depth and breadth of experience, and the independence
brought by the SIDs, enables the Board to engage in
constructive and challenging discussions, considering the
perspectives and interests not only of the Company’s
shareholder but the wider range of stakeholders in the
business. Details of the director positions, demonstrating their
area of responsibility within the business, can be found under
the section “How our Board operates”.
During the last financial year the Board consolidated its
composition under the leadership of the Executive Director, UK,
Nicola Shaw CBE, who became Chairman of the Board in July
2016. Nicola continues to sit as an Executive Director on the
National Grid plc Board. Through her participation at the Boards
of both companies, the Board of National Grid Gas is well
placed to identify and facilitate understanding of the views of its
ultimate shareholder.
Sufficiently Independent DirectorsThe appointment of two Sufficiently Independent Directors
(SIDs) in April 2014 has provided the Board with independent
challenge and input to the decision making process. The SIDs
bring to the Board a wealth of experience and knowledge
derived from working in other businesses in the utility sector,
government and regulatory organisations and other businesses
and organisations outside of the energy sector. Dr Catherine
Bell and Dr Clive Elphick have remained in these roles
providing continuity, and an independent voice in the
boardroom, during a period of internal change. Their input and
involvement in developing the governance framework is
demonstrated through their leadership of two committees of the
Board: the Audit Committee and Business Separation
Compliance Committee. Within the boardroom, the constructive
independent challenge and input brought by the SIDs, supports
the Board in considering the wider range of stakeholders in the
business. Outside of the boardroom, the SIDs hold an annual
meeting with the Chief Executive Officer of National Grid plc,
enabling them to strengthen their, and the Board’s, engagement
and understanding of the views of the shareholder. Additionally,
in their roles as members of the Company’s Audit Committee,
the SIDs hold an annual meeting with the Chair of the National
Grid plc Audit Committee creating a formal information flow
between the independent directors of the two committees.
The SIDs attend a range of site and operational visits and
briefing sessions throughout the year, enabling them to
strengthen their knowledge and understanding of the business
and current operational matters. These visits and briefing
sessions also provide the opportunity to create further links
between the business and the Board room.
Executive DirectorsThe executive director membership of the Board consists of the
senior managers of the gas transmission and system operator
businesses, regulatory function and financial function.
During the year the Board’s executive director composition
changed as a result of Cordi O’Hara, Director of UK System
Operator, starting a new role in the National Grid Group’s US
business. Phil Sheppard was appointed to the role of Interim
Director of UK System Operator and was appointed to the
Board in July 2017. Fintan Slye was appointed Director of UK

28 National Grid Gas plc NTS Regulatory Accounting Statements 2017/18
System Operator and a director of the Board in February 2018.
Phil Sheppard continued his directorship on the Board and was
appointed Director Gas Transmission Owner in March 2018
following the resignation of Pauline Walsh.
Following the year end, Andy Agg, Group Tax & Treasury
Director, resigned from the Board following his acceptance of a
new role within National Grid Ventures. Alexandra Lewis,
Group Treasurer, was appointed to the Board in April 2018.
All Board appointments are made in consultation with its
shareholder and in accordance with National Grid’s Procedure
for the Appointment of Directors to Subsidiary Companies
Director induction and developmentDirector training on the statutory duties and responsibilities of
directors has been made available to new and existing directors
and reference material has been placed in the online document
library.
Continuing director training and development is delivered both
within and outside of the boardroom. A programme of head
office and operational site visits, briefings and internal
conferences and events aims to strengthen and refresh the
Board’s knowledge and understanding of the Company’s
operations, the external business and regulatory environment
and specific technical briefings to support the directors in
fulfilling their roles on both the Board and Board Committees.
The visits and briefings provide an opportunity for the directors
to support and reinforce the Company’s culture, values and
ethics and promote a culture of openness between Board
members and employees and add depth and knowledge to the
discussions in the boardroom.
Within the boardroom, the Board receive updates and
presentations on current operational matters and specific
initiatives within the business and wider National Grid group.
These presentations also provide an opportunity for the
individual executive directors to benefit from the input of other
Board members on matters within their area of the business.
How our Board operatesThe Board maintains a schedule of matters specifically reserved
for its consideration and decision. This is aligned, as
appropriate, to that of the National Grid plc board with additional
responsibilities as required by licence obligations. The matters
reserved cover matters categorised as: Strategy, Management
and Finance, Director and Employee Issues, Corporate
Governance, Financial and Regulatory Reporting and
Shareholders and includes oversight of the relationship with the
regulatory bodies, including Ofgem, Department for Business,
Energy and Industrial Strategy and the Health and Safety
Executive.
To support the Board, there is an established framework of
Committees, to which the Board delegates defined duties under
Terms of Reference and within a framework of Delegations of
Authority. Further detail on the work of the Committees can be
found below.
The Board’s accountability for financial and business reporting
and risk management and internal control is undertaken within
the wider Group governance framework and processes. As a
regulated entity, the Board has responsibility for the annual
regulatory accounts to which it applies the same rigorous
governance processes as that of the statutory accounts, and it
involves the work of the Audit Committee. Reporting on the
regulatory regime is overseen by the Board, and further detail
can be found in the section “What we do – Regulation”.
Board meetings are scheduled and communicated a minimum
of one year in advance providing all directors with sufficient
notice to attend meetings. The matters to be considered
throughout the annual board meeting schedule fulfil the Board’s
responsibilities in line with its statutory duties, licence
obligations, its matters reserved for the Board and its authority
under the Group Delegations of Authority from National Grid
plc. The Board’s supervision of the Company’s operations is
fulfilled through standing agenda items on safety matters,
business overviews from the transmission owner and system
operator and financial performance. The Board’s consideration
of health and safety matters covers all parts of the operational
business and takes into account the health and safety of
employees. Throughout the year, the Board has allocated
additional time to focus on the potential impact that the
Company’s operations may have on the health and safety of
members of the public. In addition to this the Board receives a
suite of management reports, in line with Group reporting,
providing updates on different aspects of the business.
In its steering role, providing leadership to the business, the
Board receive papers requesting their input and decision on
matters, aligned to the matters reserved to it. The Board
regularly reviews the annual business schedule, and amends
this to take account of changes in the external and internal
environment, enabling it to provide effective, time appropriate
leadership and oversight of matters affecting the business.
To enable the Board to be effective and efficient within the
boardroom a number of procedures have been established:
papers supporting each agenda item are distributed in advance,
typically a week before the meeting; training and briefings on
specific matters are scheduled prior to the board meeting; and
the Chairman holds a short meeting with the SIDs, before each
meeting to discuss the focus of the upcoming meeting. After
each meeting the Chairman and SIDs meet to share feedback
and discuss the dynamics of the meeting, enabling a process of
continuous improvement for the operation of future board
meetings.

National Grid Gas plc NTS Regulatory Accounting Statements 2017/18 29
Board performance evaluation
Following the externally facilitated board evaluation in June
2015 (the “2015 Evaluation”) progress against the actions has
continued, developing and enhancing the performance of the
Board. The Board has undertaken an evaluation process during
February and March 2018, led by Nicola Shaw in her role as
Chair of the Board. The process built on the 2015 Evaluation
and focused on three key topics: the Board’s effectiveness; the
coverage of the Board at its meetings; and change
management in key strategic areas over the next three to five
years. The evaluation process consisted of a structured
questionnaire and one-to-one interviews between the Chair and
each director. The Board plans to review the results of the
evaluation process later in 2018 before agreeing an agreed
action plan aimed to further develop and enhance performance
of the Board.
Board membership and attendance
Six Board meetings were scheduled and held during the last
financial year. Board membership and attendance at the
meetings is set out below. Attendance is expressed as the
number of meetings attended out of the number possible or
applicable for the individual Director during the year to 31
March 2018.
Attendance
Nicola Shaw CBE (Chair) Executive Director UK 6 of 6
Andy Agg1 Group Tax & Treasury
Director
5 of 6
Alan Foster UK CFO 5 of 6
Pauline Walsh2 Director Gas
Transmission Owner
5 of 5
Cordi O’Hara3 Director of UK System
Operator
1 of 1
Fintan Slye4 Director of UK System
Operator
1 of 1
Phil Sheppard5 Director Gas
Transmission Owner
5 of 5
Chris Bennett Director UK Regulation 6 of 6
Catherine Bell Sufficiently Independent
Director
6 of 6
Clive Elphick Sufficiently Independent
Director
6 of 6
1. Resigned 13 April 2018
2. Resigned 9 March 2018
3. Resigned 16 July 2017
4. Appointed 7 February 2018
5. Appointed 17 July 2017
For those meetings where an executive Director was unable to
attend, alternative arrangements were put in place to ensure
the Board had representation from the relevant functional area.
This was either through the attendance of a senior manager
from within the applicable functional area or a written briefing
provided by the Director to the Chairman.
Board remuneration
The Directors of the Company are not separately remunerated
in that capacity with the exception of the SIDs. The
remuneration of any Director who is also a member of the
Board of National Grid, is determined by the Remuneration
Committee of the Board of National Grid, as set out in its annual
report and accounts. The remuneration of other Directors is
determined in accordance with National Grid’s remuneration
policies for employees. As required by Section 33f of the Gas
Act 1986, the Company has provided to Ofgem details of the
linkages between Directors’ remuneration and service
standards.
CommitteesThe Board has established a number of committees and sub-
committees which assist it in its activities and operate within
agreed Terms of Reference and a framework of Delegations of
Authority. The Committees of the Board are listed below:
Gas Transmission Executive Committee
System Operator Executive Committee
Business Separation Compliance Committee
Finance Committee
Audit Committee
The Company does not have a Nominations or Remuneration
Committee as these functions are provided by National Grid plc.
See the Annual Report and Accounts of National Grid plc for
further information about these committees.
Gas Transmission Executive Committee
The purpose of the Gas Transmission Executive Committee
(GTEC) is to direct the affairs of the Gas Transmission Owner
business on behalf of its Board and to perform an assurance
role within the context of the overall RIIO networks governance
framework and oversee the performance of any sub-committees
reporting to it. The Committee’s remit extends to approving the
Gas Transmission strategies and business objectives for
managing the RIIO contract and for approving opportunities to
deliver value within that contract in accordance with published
Delegation of Authority (DoA) limits.
Additionally, the Committee performs assurance responsibilities
for the Gas Transmission Owner business performance
frameworks including the monitoring of performance against the
RIIO contract, financial targets, high-level risks and audit
outcomes. To this end the Committee receives summary
reports from Process Performance Meetings, Regulatory
Commercial Committees and Business Partner Functions.
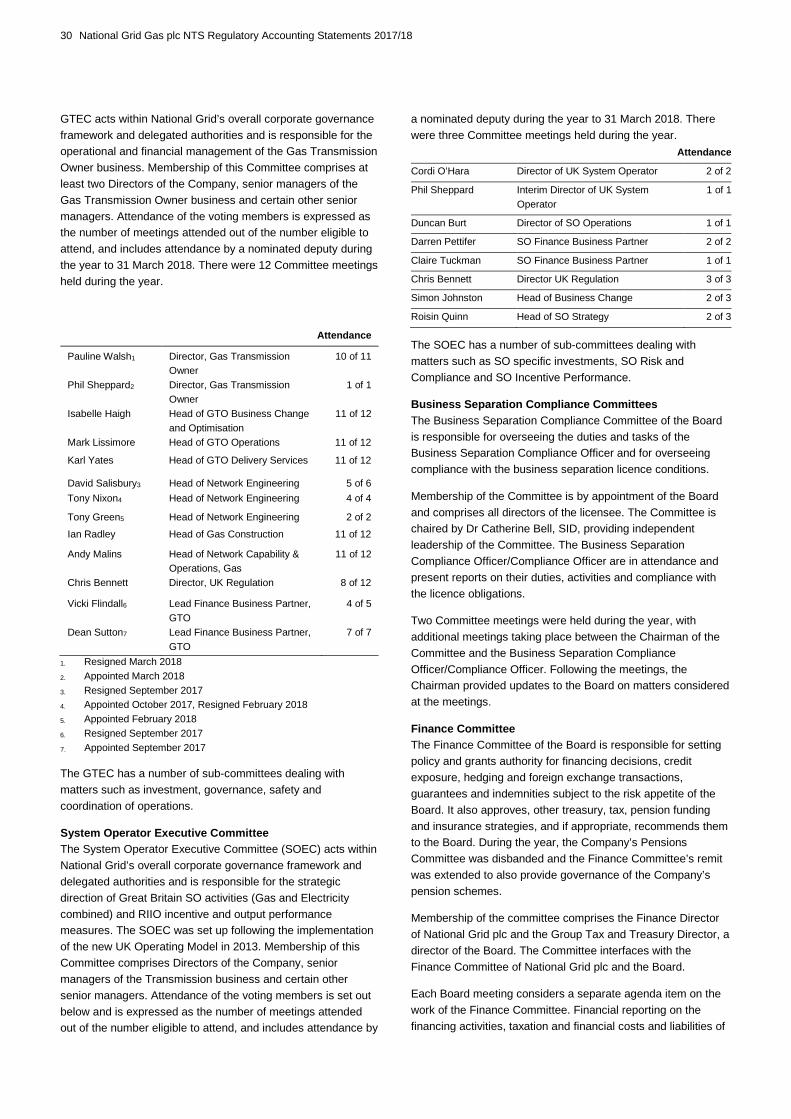
30 National Grid Gas plc NTS Regulatory Accounting Statements 2017/18
GTEC acts within National Grid’s overall corporate governance
framework and delegated authorities and is responsible for the
operational and financial management of the Gas Transmission
Owner business. Membership of this Committee comprises at
least two Directors of the Company, senior managers of the
Gas Transmission Owner business and certain other senior
managers. Attendance of the voting members is expressed as
the number of meetings attended out of the number eligible to
attend, and includes attendance by a nominated deputy during
the year to 31 March 2018. There were 12 Committee meetings
held during the year.
1. Resigned March 2018
2. Appointed March 2018
3. Resigned September 2017
4. Appointed October 2017, Resigned February 2018
5. Appointed February 2018
6. Resigned September 2017
7. Appointed September 2017
The GTEC has a number of sub-committees dealing with
matters such as investment, governance, safety and
coordination of operations.
System Operator Executive Committee
The System Operator Executive Committee (SOEC) acts within
National Grid’s overall corporate governance framework and
delegated authorities and is responsible for the strategic
direction of Great Britain SO activities (Gas and Electricity
combined) and RIIO incentive and output performance
measures. The SOEC was set up following the implementation
of the new UK Operating Model in 2013. Membership of this
Committee comprises Directors of the Company, senior
managers of the Transmission business and certain other
senior managers. Attendance of the voting members is set out
below and is expressed as the number of meetings attended
out of the number eligible to attend, and includes attendance by
a nominated deputy during the year to 31 March 2018. There
were three Committee meetings held during the year.
Attendance
Cordi O’Hara Director of UK System Operator 2 of 2
Phil Sheppard Interim Director of UK System
Operator
1 of 1
Duncan Burt Director of SO Operations 1 of 1
Darren Pettifer SO Finance Business Partner 2 of 2
Claire Tuckman SO Finance Business Partner 1 of 1
Chris Bennett Director UK Regulation 3 of 3
Simon Johnston Head of Business Change 2 of 3
Roisin Quinn Head of SO Strategy 2 of 3
The SOEC has a number of sub-committees dealing with
matters such as SO specific investments, SO Risk and
Compliance and SO Incentive Performance.
Business Separation Compliance Committees
The Business Separation Compliance Committee of the Board
is responsible for overseeing the duties and tasks of the
Business Separation Compliance Officer and for overseeing
compliance with the business separation licence conditions.
Membership of the Committee is by appointment of the Board
and comprises all directors of the licensee. The Committee is
chaired by Dr Catherine Bell, SID, providing independent
leadership of the Committee. The Business Separation
Compliance Officer/Compliance Officer are in attendance and
present reports on their duties, activities and compliance with
the licence obligations.
Two Committee meetings were held during the year, with
additional meetings taking place between the Chairman of the
Committee and the Business Separation Compliance
Officer/Compliance Officer. Following the meetings, the
Chairman provided updates to the Board on matters considered
at the meetings.
Finance Committee
The Finance Committee of the Board is responsible for setting
policy and grants authority for financing decisions, credit
exposure, hedging and foreign exchange transactions,
guarantees and indemnities subject to the risk appetite of the
Board. It also approves, other treasury, tax, pension funding
and insurance strategies, and if appropriate, recommends them
to the Board. During the year, the Company’s Pensions
Committee was disbanded and the Finance Committee’s remit
was extended to also provide governance of the Company’s
pension schemes.
Membership of the committee comprises the Finance Director
of National Grid plc and the Group Tax and Treasury Director, a
director of the Board. The Committee interfaces with the
Finance Committee of National Grid plc and the Board.
Each Board meeting considers a separate agenda item on the
work of the Finance Committee. Financial reporting on the
financing activities, taxation and financial costs and liabilities of
Attendance
Pauline Walsh1 Director, Gas Transmission
Owner
10 of 11
Phil Sheppard2 Director, Gas Transmission
Owner
1 of 1
Isabelle Haigh Head of GTO Business Change
and Optimisation
11 of 12
Mark Lissimore Head of GTO Operations 11 of 12
Karl Yates Head of GTO Delivery Services 11 of 12
David Salisbury3 Head of Network Engineering 5 of 6
Tony Nixon4 Head of Network Engineering 4 of 4
Tony Green5 Head of Network Engineering 2 of 2
Ian Radley Head of Gas Construction 11 of 12
Andy Malins Head of Network Capability &
Operations, Gas
11 of 12
Chris Bennett Director, UK Regulation 8 of 12
Vicki Flindall6 Lead Finance Business Partner,
GTO
4 of 5
Dean Sutton7 Lead Finance Business Partner,
GTO
7 of 7

National Grid Gas plc NTS Regulatory Accounting Statements 2017/18 31
the pension schemes is provided through the regular financial
management reports discussed at each board meeting.
Audit Committee
The Audit Committee’s role is to keep the Company’s financial
reporting and the effectiveness of its internal controls under
review, together with its risk management processes. It also
reviews the external audit plan and the external auditors’
findings.
Membership of this Committee is comprised of three Board
directors: the two SIDs and an executive director, the Group
Tax and Treasury Director. The Committee is chaired by Dr
Clive Elphick, SID, providing independent leadership. Financial
experience is provided by both Clive and the Group Tax and
Treasury Director. In addition to the members of the Committee,
individuals such as representatives of the external auditors,
Head of UK Audit, representatives of the Assurance function,
UK Chief Financial Officer and other representatives of the
finance function and the UK General Counsel and Company
Secretary may be invited to attend by the Committee and
normally attend each meeting. Other Directors, representatives
of the business and external advisors may be invited to attend
as and when considered appropriate by the Committee and in
respect of items that are relevant to them.
Since its inception in November 2014, the Audit Committee’s
role has been developed and enhanced, providing the
assurance required by the Board on matters within its authority.
The Chairman provides a report on each meeting to the
following Board meeting, and where applicable makes
recommendations to the Board. The Board considers these
recommendations and, where required, seeks further
assurance and details to be brought to the Board.
To strengthen the governance links to National Grid, the SIDs
hold an annual meeting with the Chairman of the National Grid
plc Audit Committee.
The preparation and management of the Audit Committee’s
annual meeting schedule follows the same governance
processes as those for the Board. Technical briefings and
meetings with the UK Chief Financial Officer and members of
the financial function are held before meetings, as required, to
provide further details on matters to be discussed during the
meetings.
Five meetings took place during the last financial year.
Committee membership and attendance at meetings is set out
below. Attendance is expressed as the number of meetings
attended out of the number possible or applicable for the
individual Director during the year to 31 March 2018.
Attendance
Clive Elphick (Chair) Sufficiently Independent
Director
5 of 5
Catherine Bell Sufficiently Independent
Director
5 of 5
Andy Agg Group Tax and Treasury
Director
5 of 5
Following the year end, Andy Agg resigned as director of the
Board and was replaced by Alexandra Lewis, Group Treasurer;
it followed that Alexandra also replaced Andy as a member of
the Audit Committee at the same time.
Areas of focus
The Audit Committee meetings considered a programme of
matters comprising those which were aligned to that of the
National Grid plc Audit Committee and specific matters as they
related to the Company, as a listed and regulated entity and as
defined in the Terms of Reference for the Committee. Examples
of key areas of focus included:
Statutory and regulatory accounting statements
Going concern statements
Fair, balanced and understandable statements
Financial reporting
Internal controls and processes
Regulatory to RIIO accounts transition
Risk management processes
Compliance matters, including compliance with licence
obligations
Internal (corporate) audit plan
Business conduct, including whistleblowing
Significant issues
The most significant issues the Committee considered during
the year were matters relating to internal controls and
processes, compliance and judgements made in the
preparation of the year-end financial statements, including
assumptions used in the calculation of provisions and pension
liabilities.
Looking forward, the Committee will continue to focus on the
effectiveness of the internal control environment, providing input
to the Group wide process.
In terms of financial reporting changes, the Committee will
continue to focus on the changes in the regulatory accounting
reporting for the implementation of RIIO accounts.
External audit
The Committee is responsible for overseeing relations with the
external auditors, as part of the Group wide external audit
arrangements. Each Committee meeting is preceded by a
meeting between the SIDs and the external auditor, without
management present, to allow independent discussions on any
matters the auditors would like to bring to the attention of the
Committee.
The Committee reviews the audit plan and audit findings in
respect of the audit of the statutory and regulatory accounts.
The Committee also engages on auditor recommendations for
improvements around internal controls. Through regular
management reporting on internal controls, the Committee is
able to monitor progress of the actions being taken.
Following the National Grid plc Audit Committee audit tender
process, Deloitte LLP was appointed by shareholders as the
Group’s statutory auditors at the AGM in July 2017.

32 National Grid Gas plc NTS Regulatory Accounting Statements 2017/18
Auditor transition
Deloitte’s transition plan focused on developing a deeper
understanding of the Company’s business, processes and
control, and leveraging the experience and knowledge of
PricewaterhouseCoopers (PwC) during the shadowing period.
Deloitte shadowed PwC during 2016/17 year end close process
and attended Audit Committee meetings in June and July 2017.
They also undertook a review of the PwC audit files and held
meetings with key management. The Committee received
regular updates on the status of the transition during the year.
Internal (corporate) audit
The Company does not have a separate internal audit team.
This function is provided by National Grid's Corporate Audit
function which provides independent and objective assurance
to the National Grid Gas Audit Committee, Safety, Environment
and Health Committee (SEH) and Executive Committees on
whether our existing control and governance frameworks are
operating effectively in order to meet National Grid's strategic
objectives. Assurance work is conducted and managed in
accordance with the IIA international standards for the
Professional Practice of Internal Auditing and Code of Ethics.
Inputs to the audit plan include principal risks, risk registers,
corporate priorities, and external research of emerging risks
and trends, and discussions with senior management to make
sure the plan aligns with the Committee and Company’s view of
risk. The audit plan is considered and approved by the
Committee annually and progress against the plan is monitored
throughout the year.
The Committee receive regular controls updates from the
Corporate Audit team. Management actions on audit findings
have continued to be a focus at Executive meetings resulting in
greater visibility of audit findings, increased ownership of
actions and greater engagement by senior management.
Auditors’ independence and objectivity
Mindset, integrity and objectivity enable auditors to undertake
their role with professional scepticism while maintaining
effective working relationships with those subject to audit i.e.
management and other employees.
As highlighted in National Grid's Annual Report and Accounts
for 2017/18 the independence of the external auditors is
essential to the provision of an objective opinion on the true and
fair view presented in the financial statements.
Following consideration of the auditors’ independence and
objectivity, the audit quality and the auditors’ performance, the
Committee was satisfied with the effectiveness, independence
and objectivity of Deloitte and recommended to the Board their
reappointment for the year ended 31 March 2019. A resolution
to re-appoint Deloitte and giving authority to the Directors to
determine their remuneration will be submitted to shareholders
at the 2018 AGM.

National Grid Gas plc NTS Regulatory Accounting Statements 2017/18 33
Directors’ Report
The information in this Directors’ Report does not comprise a
Directors’ Report within the meaning of the Companies Acts
and UK Listing Authority’s Listing, Disclosure and Transparency
Rules. Such a report for the company is included in its annual
report and accounts.
As the NTS businesses reported on within these regulatory
accounting statements do not comprise a legal entity the
following information is provided for the company as a whole.
Further details of matters required to be included in the
Directors’ Report are incorporated by reference into this report,
as detailed below.
Directors
The Directors of the company who were in office during the
year and up to the date of signing the financial statements
were:
Andy Agg Resigned 13 April 2018
Catherine Bell CB (SID)*
Chris Bennett
Clive Elphick (SID)*
Alan Foster
Alexandra Lewis Appointed 13 April 2018
Cordi O’Hara Resigned 16 July 2017
Nicola Shaw CBE
Phil Sheppard Appointed 17 July 2017
Fintan Slye Appointed 7 February 2018
Pauline Walsh Resigned 9 March 2018
*Sufficiently Independent Director
The Company has arranged, in accordance with the Companies
Act 2006 and the Articles, qualifying third party indemnities
against financial exposure that Directors may incur in the
course of their professional duties. Equivalent qualifying third
party indemnities were, and remain, in force for the benefit of
those Directors who stood down from the Board during the year
ended 31 March 2018. Alongside these indemnities, the
Company places Directors’ and Officers’ liability insurance
cover for each Director.
Principal activities and business review
A full description of the Company’s principal activities,
businesses, key performance indicators and principal risks and
uncertainties is contained in the Strategic Report on pages 9 to
17, which are incorporated by reference into this report.
Material interests in shares
National Grid Gas plc is a wholly owned subsidiary undertaking
of National Grid Gas Holdings Limited. The ultimate parent
company of National Grid Gas plc is National Grid plc.
Dividends
During the year, no interim dividend was paid (2016/17: £8,100
million interim dividend). The Directors have not proposed a
final dividend.
Share capital
Share capital remains unchanged. See note 21 to the
consolidated financial statement for further details.
Research and development
Expenditure on research and development was £4 million
during the year (2016/17: £4 million).
Financial instruments
Details on the use of financial instruments and financial risk
management are included in note 25 to the consolidated
financial statements.
Future developments
Details of future developments are contained in the Strategic
Report.
Employee involvement
Details of how the Company involves its employees are
contained in the Strategic Report on pages 13 and 14, which
are incorporated by reference into this report.
Audit information
Having made the requisite enquiries, so far as the Directors in
office at the date of the signing of this report are aware, there is
no relevant audit information of which the auditors are unaware
and each Director has taken all reasonable steps to make
themselves aware of any relevant audit information and to
establish that the auditors are aware of that information.
Annual General Meeting
Notice of the National Grid Gas’s Annual General Meeting for
2018 will be issued separately to the shareholder.
Going concern
Having made enquiries and reviewed management’s
assessment of the going concern assumption, the Directors
consider it appropriate to prepare the financial statements on a
going concern basis. The going concern basis presumes that
the Company has adequate resources to remain in operation,
and that the Directors intend it to do so, for at least one year
from the date the financial statements are signed. More detail
on our financial risks, including liquidity and solvency, is
provided in note 25 to the consolidated financial statements.
There have been no major changes to the liquidity and solvency
risks in the year. Although not assessed over the same period,
the viability has been assessed on page 21.
On behalf of the Board
Alan FosterUK CFO27 July 2018National Grid Gas plc,1-3 Strand, London WC2N 5EHRegistered in England and Wales Number 2006000

34 National Grid Gas plc NTS Regulatory Accounting Statements 2017/18
Introduction to the financial statements
Throughout these regulatory accounting statements we have
provided explanations of the disclosures and why they are
important to the understanding of our financial performance and
position.
NotesNotes to the regulatory accounting statements provide
additional information required by statute, accounting standards
or other regulations to assist in a more detailed understanding
of the primary financial statements. In many notes we have
included an accounting policy that describes how the
transactions or balance in that note have been measured,
recognised and disclosed. The basis of preparation section
provides details of accounting policies that apply to transactions
and balances in general.

National Grid Gas plc NTS Regulatory Accounting Statements 2017/18 35
Statement of Directors’ responsibilities
The directors are obliged by Standard Special Condition A30 of
the Company’s NTS Gas Transporter Licence to prepare
regulatory accounting statements for each financial year which
comply with the requirements set out in Standard Special
Condition A30, as amended by consents received from Ofgem
(the ‘Requirement’). Under the Requirements, the Directors
have responsibility for ensuring that:
the Company and its related undertakings keep accounting
records in such a form that the revenues, costs, assets,
liabilities, reserves and provisions of, or reasonably
attributable to, each of the regulatory businesses are
separately identifiable in the books of the Company and its
related undertakings from those of any other business;
the regulatory accounting statements fairly present the
financial position, financial performance and cash flows of,
or reasonably attributable to, each regulatory business; so
far as is reasonably practicable, the regulatory accounting
statements have the same content and format in respect of
the businesses to which they relate as the equivalent
statutory accounts of the Company and that they comply
with all relevant accounting and reporting standards
currently in force which have been issued or adopted by
the International Accounting Standards Board;
the regulatory accounting statements include for each
regulatory business and for the regulatory businesses in
total, an income statement, a statement of changes in
equity and, if appropriate, a statement of comprehensive
income, a balance sheet and a cash flow statement,
including notes thereto and the basis of preparation and
introduction to the financial statements;
the regulatory accounting statements include, for the
regulatory businesses in total, a corporate governance
statement, a directors’ report and a strategic review; and
the regulatory accounting statements show separately and
in appropriate detail the amounts of any revenues, costs,
assets, liabilities, reserves or provisions that have been
charged from or to any other business of National Grid
(other than the Company or its subsidiaries), or that have
been determined by apportionment, where they relate to
goods or services received or supplied for the purposes of
the regulatory businesses.
In addition, in preparing the regulatory accounting statements,
the Directors are required to:
select suitable accounting policies and then apply the
consistently;
make judgements and accounting estimates that are
reasonable and prudent;
state whether applicable UK Accounting Standards have
been followed, subject to any material departures disclosed
and explained in the regulatory accounting statements; and
prepare the regulatory accounting statements on a going
concern basis unless it is inappropriate to presume that the
company will continue in business.
The Directors, having prepared the regulatory accounting
statements, have requested the Auditors to take whatever steps
and to undertake whatever inspections they consider to be
appropriate for the purpose of enabling them to give their audit
report.
The directors also responsible for safeguarding the assets of
the Company and hence for taking reasonable steps for the
prevention and detection of fraud and other irregularities.
Each of the Directors, whose names are listed in the Directors’
Report on page 29 and who in office at the date of signing this
report, confirms that to the best of their knowledge, the
regulatory accounting statements have been:
prepared in accordance with the Requirements and fairly
present the assets, liabilities, financial position of the
Company’s DN businesses, metering business, meter
reading business, de-minimis activities and other activities;
and
that the Audit Committee of National Grid Gas plc continues
to review the adequacy of the system of internal financial
controls adopted by the Company.
On behalf of the Board
Nicola Shaw
Chair
27 July 2018

36 National Grid Gas plc NTS Regulatory Accounting Statements 2017/18
Independent Auditors’ reportIndependent Auditors’ report to the Gas and Electricity Markets Authority (the “Regulator”) and to
National Grid Gas plc “NGG”
Report on the regulatory accounting statements
Our opinion
We have audited the financial statements of National Grid Gas
plc which comprise:
the consolidated income statement;
the consolidated statement of comprehensive income;
the consolidated statement of changes in equity;
the consolidated statement of financial position;
the consolidated cash flow statement;
the related notes 1 to 28 of the consolidated financial
statements; and
the supplementary appendices.
These regulatory accounting statements have been prepared
under the accounting policies set out therein. The financial
reporting framework that has been applied in their preparation
is Standard Condition A30 of the Regulatory Licence the
accounting policies set out in the principal accounting policies
on pages [x] to [x].
In our opinion, NGG regulatory accounting statements present
fairly, in all material respects, in accordance with Standard
Condition A30 of the Regulatory Licence and the Company’s
accounting policies.
Basis of our opinion
We conducted our audit in accordance with International
Standards on Auditing (UK) (“ISAs (UK)”), including ISA (UK)
800, and applicable law, and having regard to the guidance
contained in ICAEW Technical Release Tech 02/16 AAF
‘Reporting to Regulators on Regulatory Accounts’ issued by the
Institute of Chartered Accountants in England & Wales.
Our responsibilities under ISAs (UK) are further described in the
Auditor’s responsibilities for the audit of the regulatory
accounting statements section of our report. We are
independent of the company in accordance with the ethical
requirements that are relevant to our audit of the regulatory
accounting statements in the UK, including the Financial
Reporting Council’s Ethical Standard, and we have fulfilled our
ethical responsibilities in accordance with these requirements.
We believe that the audit evidence we have obtained is
sufficient and appropriate to provide a basis for our opinion.
Emphasis of matter – special purpose basis of preparation
We draw your attention to Note [x] of the regulatory accounting
statements, which describes the basis of accounting. The
regulatory accounting statements are separate from the
statutory financial statements of the Company and are to meet
the requirements of Standard Condition A30 of the Regulatory
Licence. As a result, the regulatory accounting statements may
not be suitable for another purpose. Our opinion is not modified
in respect of this matter.
Conclusions relating to going concern
We have nothing to report in respect of the following matters in
relation to which ISAs (UK) require us to report to you when:
the directors’ use of the going concern basis of accounting in
the preparation of the regulatory accounting statements is not
appropriate; or
the directors have not disclosed in the regulatory accounting
statements any identified material uncertainties that may cast
significant doubt about the company’s ability to continue to
adopt the going concern basis of accounting for a period of at
least twelve months from the date when the regulatory
accounting statements are authorised for issue.
Other information
The other information comprises all of the information in the
annual report other than the regulatory accounting statements
and our auditor’s report thereon. The directors are responsible
for the other information. Our opinion on the regulatory
accounting statements does not cover the other information
and, accordingly, we do not express an audit opinion or any
form of assurance thereon.
In connection with our audit of the regulatory accounting
statements, our responsibility is to read the other information
and, in doing so, consider whether the other information is
materially inconsistent with the regulatory accounting
statements or our knowledge obtained in the audit, or otherwise
appears to be materially misstated. If we identify an apparent
material inconsistency or material misstatement, we are
required to perform procedures to conclude whether there is a
material misstatement of the regulatory accounting statements
or a material misstatement of the other information. If, based on
the work we have performed, we conclude that there is a
material misstatement or inconsistency of this other information,
we are required to report that fact.
We have nothing to report based on these responsibilities.
Responsibilities of the Directors
As explained more fully in the Statement of Directors’
Responsibilities set out on page 35, the directors are
responsible for the preparation of the Regulatory Accounts in
accordance with Standard Condition A30 of the Regulatory
Licence and the Company’s accounting policies.
The directors are also responsible for such internal control as
they determine is necessary to enable the preparation of the

National Grid Gas plc NTS Regulatory Accounting Statements 2017/18 37
regulatory accounting statements that are free from material
misstatement, whether due to fraud or error.
In preparing the regulatory accounting statements, the directors
are responsible for assessing the company’s ability to continue
as a going concern, disclosing as applicable, matters related to
going concern and using the going concern basis of accounting
unless the directors either intend to liquidate the company or to
cease operations, or have no realistic alternative but to do so.
Auditors’ responsibilities for the Audit of the regulatory
accounts statements
Our objectives are to obtain reasonable assurance about
whether the regulatory accounting statements as a whole are
free from material misstatement, whether due to fraud or error,
and to issue an auditor’s report that includes our opinion.
Reasonable assurance is a high level of assurance, but is not a
guarantee that an audit conducted in accordance with ISAs
(UK) will always detect a material misstatement when it exists.
Misstatements can arise from fraud or error and are considered
material if, individually or in the aggregate, they could
reasonably be expected to influence the economic decisions of
users taken on the basis of these regulatory accounting
statements.
A further description of our responsibilities for the audit of the
financial statements is located on the FRC’s website at:
www.frc.org.uk/auditorsresponsibilities. This description forms
part of our auditor’s report.
Use of this report
This report is made, on terms that have been agreed, solely to
the Company and the Regulator in order to meet the
requirements of Standard Condition A30 of the Regulatory
Licence. Our audit work has been undertaken so that we might
state to the Company and the Regulator those matters that we
have agreed to state to them in an independent auditor’s report,
in order (a) to assist the company to meet its obligation under
the Regulatory Licence to procure such a report and (b) to
facilitate the carrying out by the Regulator of its regulatory
functions, and for no other purpose. To the fullest extent
permitted by law, we do not accept or assume responsibility to
anyone other than the company and the Regulator, for our audit
work, for this report or for the opinions we have formed.
Our opinion on the regulatory accounting statements within the
annual report is separate from our opinion on the statutory
financial statements of the Company for the year ended 31
March 2018 on which we reported on 22 June 2018, which are
prepared for a different purpose. Our audit report in relation to
the statutory financial statements of the Company (our
“Statutory audit”) was made solely to the Company’s members,
as a body, in accordance with Chapter 3 of Part 16 of the
Companies Act 2006.
Our Statutory audit work was undertaken so that we might state
to the Company’s members those matters we are required to
state to them in a statutory audit report and for no other
purpose. In these circumstances, to the fullest extent permitted
by law, we do not accept or assume responsibility for any other
purpose or to any other person to whom our Statutory audit
report is shown or into whose hands it may come save where
expressly agreed by our prior consent in writing
Jane Whitlock, Senior Statutory Auditor
for and on behalf of Deloitte LLP
Statutory auditor
Birmingham, United Kingdom
27 July 2018
38 National Grid Gas plc NTS Regulatory Accounting Statements 2017/18
Basis of preparation(for National Grid Gas plc)
Accounting policies describe our approach to recognising and
measuring transactions and balances in the year. Accounting
policies applicable across the financial statements are shown
below. Accounting policies that are specific to a component of
the financial statements have been incorporated into the
relevant note.
This section also shows areas of judgement and key sources of
estimation uncertainty in these financial statements. In addition,
we summarise new IASB and EU endorsed accounting
standards, amendments and interpretations and whether these
are effective in 2018 or later years, explaining how significant
changes are expected to affect our reported results.
A. Basis of preparation of regulatory accounting
statements under IFRSNational Grid Gas’s principal activities involve the transmission
of gas and the provision of gas metering services within Great
Britain. The Company is a public limited company incorporated
and domiciled in England, with its registered office at 1-3
Strand, London WC2N 5EH.
These regulatory accounting statements were approved for
issue by the Board of Directors on 27 July 2018.
These regulatory accounting statements have been prepared in
accordance with Standard Special Condition A30 (the condition)
of the Company’s NTS gas transporter licence issued under the
Utilities Act 2000 (the licence), and where relevant, in
accordance with International Accounting Standards (IAS) and
International Financial Reporting Standards (IFRS) and related
interpretations as issued by the International Accounting
Standards Board (IASB) and IFRS as adopted by the EU. They
are prepared on the basis of all IFRS accounting standards and
interpretations that are mandatory for periods ending 31 March
2018 and in accordance with the Companies Act 2006
applicable to companies reporting under IFRS and Article 4 of
the EU IAS Regulation. The comparative financial information
has also been prepared on this basis.
The regulatory accounting statements have been prepared on a
historical cost basis, except for the recording of pension assets
and liabilities, the revaluation of derivative financial instruments
and investments classified as available-for-sale.
These consolidated financial statements are presented in
pounds sterling, which is also the functional currency of the
Company.
The preparation of regulatory financial statements requires
management to make estimates and assumptions that affect
the reported amounts of assets and liabilities, disclosures of
contingent assets and liabilities and the reported amounts of
revenue and expenses during the reporting period (see
accounting policy E).
Attribution of revenues, costs, assets, liabilities and equity
The condition requires that all the revenues, costs, assets,
liabilities and equity of the Company are attributed to the
businesses and activities reported in the regulatory accounting
statements. Those revenues, costs, assets, liabilities and equity
which are not directly attributable to specific businesses or
activities have been apportioned between the businesses and
activities according to whether they are related items or
unrelated items.
Allocations between the System Operator and the Transmission
Owner have been done on the assumption that both operations
are part of National Grid Gas plc, consistent with prior years.
Related items
Related items comprise all those revenues, costs, assets and
liabilities of the Company which are not directly attributable to a
specific business or activity, but where there is a reasonable
basis for apportioning those revenues, costs, assets or liabilities
between businesses and activities.
These revenues, costs, assets and liabilities are apportioned
between businesses and activities in accordance with the
activities giving rise to the income, costs, assets or liabilities.
Unrelated items
Unrelated items comprise all those revenues, costs, assets,
liabilities and equity of the Company which are not directly
attributable to a specific business or activity, and where there is
no reasonable basis for apportioning those revenues, costs,
assets, liabilities and equity between the businesses and
activities. These items mainly comprise corporate activities,
financial items, taxation, dividends, share capital and reserves.
These revenues, costs, assets, liabilities and equity are
apportioned between businesses and activities using the
following arbitrary bases:
Corporate costs charged to the Company by National Grid
are apportioned using the same metrics as National Grid
uses to determine the allocated charge to the Company.
These metrics take into account relative revenue, operating
profit, employees and net assets.
The non-current amount owed by National Grid Gas Holdings
Limited is apportioned between the regulatory businesses in
the ratio of their estimated regulatory asset values.
Net debt at 1 April 2005 (the first balance sheet date for this
format of regulatory accounting statements), which comprises
borrowings and bank overdrafts, less cash, cash equivalents
and financial investments at that date, was apportioned
between regulatory businesses in the ratio of estimated
regulatory asset values at that date.
National Grid Gas plc NTS Regulatory Accounting Statements 2017/18 39
No amounts were apportioned to the de-minimis business or
to other activities.
The amounts at subsequent period ends have been
determined by separately adjusting these initially apportioned
amounts by the cash generated or used by each regulatory
business, movements in fair value of net debt allocated to
each business and other funding movements.
Movements in fair value and other funding movements are
initially apportioned between the regulatory businesses
relative to the net debt at the start of the period in which the
movements occurred. A further reallocation of funding
between regulatory businesses is then applied so that the
overall allocation ratio for closing net debt across our
regulatory businesses reflects their individual estimated
maximum debt potential, taking into account RAV gearing
ratios.
Interest is apportioned between the regulatory businesses
according to the relative level of net debt determined
according to the principles set out above.
Current and deferred taxation are apportioned relative to the
results of undertaking notional current and deferred tax
computations for each business and activity, commencing
from 1 April 2005. Prior year tax adjustments substantially
relating to transactions which occurred prior to 1 April 2005
are apportioned in the ratio of estimated regulatory asset
values at that date. The estimated capital allowances pools at
1 April 2005 were apportioned between the regulatory
businesses in the ratio of estimated regulatory asset values
at that date. Current tax liabilities have been apportioned
relative to current tax charges and tax paid or recovered is
determined by balance.
Equity dividends primarily funded from profits for the year
have been apportioned on the basis of profits for the year.
Equity dividends primarily funded from retained earnings
have been apportioned on the basis of relative regulatory
asset values.
The apportionment of the total equity of the Company at 1
April 2005, comprising called up share capital, share premium
account, retained profits and other reserves, was determined
as a balancing item at that date. The amounts at subsequent
period ends are determined by separately adjusting these
initially apportioned amounts by the equity movements
derived for each business or activity as a consequence of all
other allocations and funding movements.
B. Going concernThe Directors considered it appropriate to prepare the
regulatory accounting statements on a going concern basis.
The going concern basis presumes that the Group has
adequate resources to remain in operation, and that the
Directors intend it to do so, for at least one year from the date
the regulatory accounting statements are signed.
C. Basis of consolidationThe consolidated regulatory accounting statements incorporate
the regulatory accounting statements of the Company and its
subsidiaries. A subsidiary is defined as an entity controlled by
the Company. Control is achieved where the Company has the
power to affect the returns of an entity to which it is exposed or
to which it has rights.
Where necessary, adjustments are made to bring the
accounting policies used in the individual regulatory accounting
statements of the Company and its subsidiaries into line with
those used by the Company in its consolidated financial
statements under IFRS. Inter-company transactions are
eliminated.
The results of subsidiaries and associates acquired or disposed
of during the year are included in the consolidated income
statement from the effective date of acquisition, or up to the
effective date of disposal, as appropriate.
D. Foreign currenciesTransactions in currencies other than the functional currency of
the Company or subsidiary concerned are recorded at the rates
of exchange prevailing on the dates of the transactions. At each
reporting date, monetary assets and liabilities that are
denominated in foreign currencies are retranslated at closing
exchange rates. Non-monetary assets are not retranslated
unless they are carried at fair value.
Gains and losses arising on the retranslation of monetary
assets and liabilities are included in the income statement,
except where the adoption of hedge accounting requires
inclusion in other comprehensive income see note 11.
E. Areas of judgement and key sources of
estimation uncertaintyThe preparation of financial statements requires management
to make estimates and assumptions that affect the reported
amounts of assets and liabilities, disclosures of contingent
assets and liabilities and the reported amounts of revenue and
expenses during the reporting period. Actual results could differ
from these estimates. Information about such judgements and
estimations is contained in the notes to the financial statements,
and the key areas are summarised below.
Areas of judgement that have the most significant effect on the
amounts recognised in the financial statements are as follows:
Concerning the sale of UK Gas Distribution – note 7:
the allocation of financing costs between the continuing
Group and discontinued operations; and
the identification and classification of costs associated with
the disposal.

40 National Grid Gas plc NTS Regulatory Accounting Statements 2017/18
the categorisation of certain items as exceptional items, and
the definition of adjusted earnings – note 3.
environmental and decommissioning provisions – note 20.
IFRS provides certain options available within accounting
standards. Choices we have made, and continue to make,
include the following:
Presentational formats: we use the nature of expense
method for our income statement and aggregate our
statement of financial position to net assets and total equity.
In the income statement, we present subtotals of total
operating profit, profit before tax and profit from continuing
operations, together with additional subtotals excluding
exceptional items and remeasurements. Exceptional items
and remeasurements are presented separately on the face of
the income statement.
Customer contributions: contributions received prior to 1
July 2009 towards capital expenditure are recorded as
deferred income and amortised in line with the depreciation
on the associated asset.
Financial instruments: we normally opt to apply hedge
accounting in most circumstances where this is permitted.
Key sources of estimation uncertainty that have significant risk
of causing a material adjustment to the carrying amounts of
assets and liabilities within the next financial year are as
follows:
review of residual lives, carrying values and impairment
charges for other intangible assets and property, plant and
equipment – notes 8 and 9.
estimation of asset/liabilities for pensions and other post-
retirement benefits – note 19.
valuation of financial instruments and derivatives – notes 11
and 25.
revenue recognition and assessment of unbilled revenue –
note 1.
environmental and decommissioning provisions – note 20.
In order to illustrate the impact that changes in assumptions
could have on our results and financial position, we have
included sensitivity analysis in note 26.

National Grid Gas plc NTS Regulatory Accounting Statements 2017/18 41
Recent accounting developments
New IFRS accounting standards and
interpretations not yet adoptedThe Company enters into a significant number of transactions
that fall within the scope of IFRS 9 ‘Financial Instruments’(IFRS
9), IFRS 15 ‘Revenue from Contracts with Customers’ (IFRS
15) and IFRS 16 ‘Leases’(IFRS 16). We are assessing the likely
impact of these standards on the Group’s financial statements.
i) IFRS 15 ‘Revenue from Contracts with Customers’
IFRS 15 ‘Revenue from Contracts with Customers’ is effective
for National Grid Gas plc for the year ending 31 March 2019.
The new standard provides enhanced detail and a five step
revenue recognition approach to reflect the transfer of goods
and services to customers. The core principle of IFRS 15 is that
an entity recognises revenue related to the transfer of promised
goods or services when control of the goods or services passes
to customers.
The amount of revenue recognised should reflect the
consideration to which the entity expects to be entitled in
exchange for those goods or services. This differs from the
principle under the current revenue standard that requires an
assessment of when risks and rewards of goods and services
are transferred rather than control of those goods or services.
Detailed reviews of revenue arrangements have been
undertaken prior to our transition to IFRS 15 on 1 April 2018.
We will adopt the modified retrospective approach whereby the
historical cumulative transition adjustment is reflected through
retained earnings.
There are two types of revenue arrangements that will be
impacted on transition to IFRS 15. The financial impacts and
the transition adjustment to retained earnings are described
further:
There are certain pass-through revenues, principally amounts
collected on a monthly basis from the distribution networks
and paid to the pension fund, where the principal/agency
assessment changes on transition to IFRS 15. In moving from
a risk and reward model to a control model, we will no longer
record these amounts collected as revenues, as we do not
control amounts collected and paid to the pension fund. If we
had adopted IFRS 15 in 2017/18, both revenues and
operating costs would have been £66 million lower, with no
impact to profit as a result of this change. There will be no
resulting transition adjustment as a result of this change; and
Our customers provide contributions for certain capital works
(e.g. connections) which we continue to own on completion of
the works. In our Gas Transmission business, we recognise
customer contributions when the connection is completed
(the contractual conditions of the connection agreement do
not explicitly require connections to be maintained over the
life of the connection).
Under IFRS 15, connection contributions will be deferred and
released into the income statement as revenue over the life of
the network. We have reached this conclusion because our
customers cannot benefit from a connection without the use of
our utility network; access to our network through the
connection is satisfied over time.
We also have arrangements where our customers make
contributions for diversions. These are currently deferred over
the life of our network. Under IFRS 15, these revenues are
recognised on completion of the diversion as there are no
ongoing performance obligations to satisfy.
Had we adopted IFRS 15 in 2017/18, revenues would have
been circa £4 million lower, as revenues from Gas
Transmission connections that were previously recognised up-
front would have been deferred over the life of the network.
Additionally, operating expenses would have been £2 million
higher, due to the fact that releases of deferred income in
respect of historic diversions would not have been made. Thus
the total decrease in profit after tax would have been £6 million.
The transition adjustment through retained earnings of £61
million will result in a decrease to deferred revenues of
approximately £76 million and a corresponding deferred tax
impact of £15 million.
ii) IFRS 16 ‘Leases’
IFRS 16 ‘Leases’ is effective for National Grid Gas plc for the
year ending 31 March 2020. The company enters into a
significant number of operating lease transactions. Under IFRS
16, our operating leases will be accounted for on the balance
sheet as ‘right-of-use’ assets. This treatment will increase both
our assets and liabilities and subsequently, will result in an
increase in finance costs and depreciation and a reduction in
rental costs. The outcome of our conclusions will have an
impact on how we account for our operating leases. We are
also performing an assessment of our revenue, service
contracts and power purchase contracts to determine whether
we have the right to use assets under those contracts and
whether they fall within the scope of IFRS 16. We plan to apply
IFRS 16 using the modified retrospective approach, whereby
comparatives will not be restated on adoption of the new
standard but instead a cumulative adjustment will be reflected
in retained earnings.
iii) IFRS 9 ‘Financial Instruments’
IFRS 9 ‘Financial Instruments’ (IFRS 9) is effective for National
Grid Gas plc in the year ending 31 March 2019. The changes to
IFRS 9 principally impact the accounting for the classification of
financial instruments, impairment of financial instruments and
hedge accounting.

42 National Grid Gas plc NTS Regulatory Accounting Statements 2017/18
We have elected not to restate comparatives on initial
application of IFRS 9. The full impact of adopting IFRS 9 will
depend on the financial instruments that the Group has during
the year ending 31 March 2019 as well as on economic
conditions and judgements made as at the year end. The
Group has performed a preliminary assessment of the potential
impact of adopting IFRS 9 based on the financial instruments
and hedging relationships as at the date of adoption of IFRS 9
(1 April 2018).
Classification and measurement: financial assets
The number of categories of financial assets has been reduced
under IFRS 9 compared to IAS 39. Under IFRS 9 the
classification of financial assets is based on the business model
within which the asset is held and the contractual terms of the
asset. There are three principal classification categories for
financial assets that are debt instruments: (i) amortised cost, (ii)
fair value through other comprehensive income (FVOCI) and
(iii) fair value through profit or loss (FVTPL). Equity investments
are either classified as (i) FVTPL or (ii) FVOCI. If measured at
FVOCI, realised gains on equity investments are not recycled to
the income statement but instead are transferred directly to
retained profits.
The change to the asset classification rules will have no impact
in reported group net assets, although there will be some
changes to reserves at transition. These changes are not
material.
Classification and measurement: financial liabilities
Under IFRS 9 financial liabilities can be designated at FVTPL to
eliminate an accounting mismatch. Where financial liabilities
are designated at FVTPL, changes in their fair value due to
credit risk are presented in other comprehensive income.
With effect from 1 April 2018 the group has taken the fair value
option for one issued zero coupon liability to reduce the
measurement mismatch against some derivatives. The effect of
this election at transition is the establishment of an own credit
reserve of £9m and an overall reduction in reported net assets
of c£32m.
Impairment
The impairment model under IFRS 9 reflects expected credit
losses, as opposed to only incurred losses under IAS 39. The
new impairment model will apply to the group’s financial assets
that are debt instruments measured at amortised cost or FVOCI
as well as the group’s trade receivables.
Other investments in debt instruments that are subject to the
IFRS 9 impairment model are determined to be low credit risk at
31 March 2018. We intend to apply the low credit risk
simplification in IFRS 9 which allows the company to assume
that there has not been a significant increase in credit risk since
initial recognition of these assets and therefore recognise a loss
allowance for only 12-month expected credit losses as at 1 April
2018. The adjustment to the opening reserves in respect of this
is not expected to be significant.
Hedge accounting
On initial application of IFRS 9, an entity may choose to
continue to apply the hedge accounting requirements of IAS 39
instead of those of IFRS 9. The group has elected to apply the
hedge IFRS 9 accounting requirements because they more
closely align with the group’s risk management policies.
As assessment of the group’s hedging relationships under IAS
39 has been performed and it has been determined that the
relationships will qualify as continuing hedge relationships
under IFRS 9. We do not anticipate the application of IFRS 9
hedge accounting requirements will have a material impact on
the financial statements.
iv) Other
In addition, the following new accounting standards and
amendments to existing standards have been issued but are
not yet effective have not yet been endorsed by the EU:
Amendments to IFRS 2 ‘Share Based Payments’;
IFRIC 22 ‘Foreign Currency Transactions and Advance
Consideration;
IFRIC 23 ‘Uncertainty over Income Tax’;
Amendments to IAS 40 ‘Investment Property’;
Amendments to IAS 28: Long-term interests in Associates
and Joint Ventures;
Annual improvements to IFRS standards 2015-2017 Cycle
IFRS 17 ‘Insurance Contracts’; and
Amendments to IAS 19 ‘Employee Benefits’.
Effective dates remain subject to the EU endorsement process.
The company is currently assessing the impact of the above
standards, but they are not expected to have a material impact.
The company has not early adopted any other standard,
amendment or interpretation that was issued but is not yet
effective.

National Grid Gas plc NTS Regulatory Accounting Statements 2017/18 43
Consolidated income statementfor the years ended 31 March
2018 2018 2017 2017
Notes £m £m £m £m
Continuing operations
Revenue 1 (a) 1,424 1,340
Operating costs 2 (777) (876)
Operating profit
Before exceptional items 1 (b) 647 573
Exceptional items 3 - (109)
Total operating profit 1 (b) 647 464
Finance income 4 8 5
Finance costs
Before exceptional items and remeasurements 4 (204) (160)
Exceptional items and remeasurements 3, 4 21 (7)
Total finance costs 4 (183) (167)
Profit before taxBefore exceptional items and remeasurements 451 418Exceptional items and remeasurements 3 21 (116)
Total profit before tax 472 302Tax
Before exceptional items and remeasurements 5 (98) (66)Exceptional items and remeasurements 3, 5 (4) 63
Total tax 5 (102) (3)
Profit after tax
Before exceptional items and remeasurements 353 352
Exceptional items and remeasurements 3 17 (53)
Profit after tax from continuing operations 370 299
Profit after tax from discontinued operations 7 17 314
Gain on disposal of discontinued operations after tax 7 - 4,237
17 4,551
Total profit for the year (continuing and discontinued) 387 4,850
Attributable to:Equity shareholders of the parent 387 4,847
Non-controlling interests - 3
387 4,850

44 National Grid Gas plc NTS Regulatory Accounting Statements 2017/18
Consolidated statement of comprehensive incomefor the years ended 31 March
2018 2017
Notes £m £m
Profit for the year 387 4,850
Other comprehensive income from continuing operations:
Items from continuing operations that will never be reclassified to profit or loss
Remeasurement gains of pension assets 19 330 134
Tax on items that will never be reclassified to profit or loss 5 (55) (23)
Total items from continuing operations that will never be reclassified to profit or loss 275 111
Other comprehensive income from continuing operations:
Items from continuing operations that may be reclassified subsequently to profit or loss
Net losses in respect of cash flow hedges1(8) (2)
Transferred to profit or loss on cash flow hedges 5 7
Tax on items that may be reclassified subsequently to profit or loss 5 - (2)
Total items from continuing operations that may be reclassified subsequently to profit or loss (3) 3
Other comprehensive income for the year, net of tax from continuing operations 272 114
Other comprehensive income for the year, net of tax from discontinued operations - 51
Other comprehensive income for the year, net of tax 272 165
Total comprehensive income for the year from continuing operations 642 413
Total comprehensive income for the year from discontinued operations 17 4,602
Total comprehensive income for the year 659 5,015
Total comprehensive income for the year
Attributable to:
Equity shareholders of the parent
From continuing operations 642 413
From discontinued operations 17 4,599
659 5,012
Non-controlling interests
From discontinued operations - 3
- 3
659 5,015
1
This unaudited commentary does not form part of the financial statements.
The value of derivatives held to hedge cash flows is affected by changes in expected interest rates and in exchange rates. The net loss for the
year was £8m (2017: net loss of £2m).
Unaudited commentary on consolidated statement of comprehensive income
Net losses in respect of cash flow hedges
The value of derivatives held to hedge cash flows is impacted by changes in expected interest rates and in exchange rates. The net loss for the year
was £35m (2014: £25m loss).

National Grid Gas plc NTS Regulatory Accounting Statements 2017/18 45
Consolidated statement of changes in equity
Share Cash flow Non-
Share premium Retained hedge Other Shareholders' controlling Total
capital account earnings reserve reserves equity interests equity
£m £m £m £m £m £m £m £m
As at 1 April 2016 45 204 5,401 (61) 1,332 6,921 2 6,923
Profit for the year - - 4,847 - - 4,847 3 4,850
Total other comprehensive income for the year - - 111 54 - 165 - 165
Total comprehensive income for the year - - 4,958 54 - 5,012 3 5,015
Equity dividends - - (8,100) - - (8,100) - (8,100)
Other movements in non-controlling interests - - - - - - (5) (5)
Share-based payments - - 7 - - 7 - 7
Tax on share-based payments - - (1) - - (1) - (1)- - -
As at 31 March 2017 45 204 2,265 (7) 1,332 3,839 - 3,839
Profit for the year - - 387 - - 387 - 387
Total other comprehensive income for the year - - 275 (3) - 272 - 272
Total comprehensive income for the year - - 662 (3) - 659 - 659
Share-based payments - - 3 - - 3 - 3
At 31 March 2018 45 204 2,930 (10) 1,332 4,501 - 4,501
The consolidated statement of changes in equity shows the additions (where it came from) and reductions (where it went) to equity. For us,
The Company is prohibited from declaring a dividend or other distribution unless it has certified that it is in compliance in all material respects with
certain regulatory obligations, including a requirement to ensure it has sufficient financial resources and facilities to enable it to carry on its business
and a requirement to use all reasonable endeavours to maintain an investment grade credit rating.
The cash flow hedge reserve will be continuously transferred to the income statement until the borrowings are repaid. The amount due to be released
from reserves to the income statement next year is £8m (2017: £5m), and the remainder to be released with the same maturity profile as borrowings
due after more than one year.
Other reserves comprise the capital redemption reserve arising from the refinancing and restructuring of the Lattice Group in 1999. It represents the
amount of the reduction in the share capital of the Company as a consequence of that restructuring. As the amounts included in other reserves are
not attributable to any of the other classes of equity presented, they have been disclosed as a separate classification of equity.
Unaudited commentary on consolidated statement of changes in equity
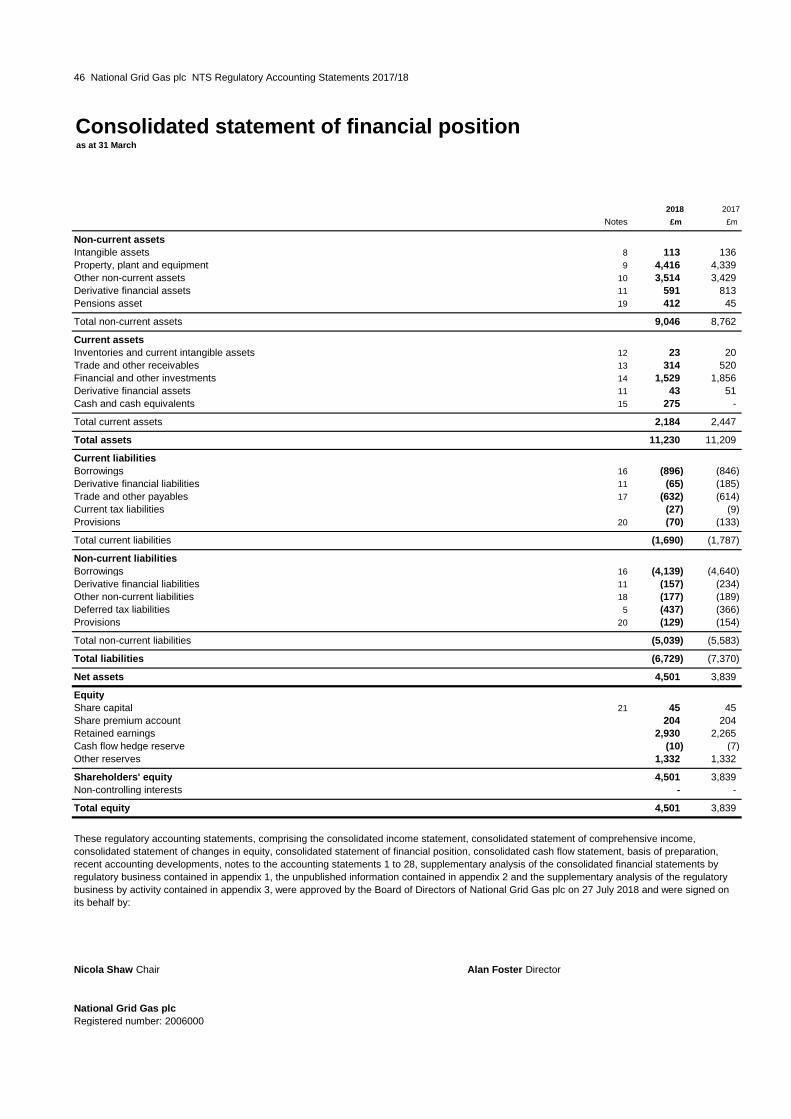
46 National Grid Gas plc NTS Regulatory Accounting Statements 2017/18
Consolidated statement of financial positionas at 31 March
2018 2017
Notes £m £m
Non-current assets
Intangible assets 8 113 136
Property, plant and equipment 9 4,416 4,339
Other non-current assets 10 3,514 3,429
Derivative financial assets 11 591 813
Pensions asset 19 412 45
Total non-current assets 9,046 8,762
Current assets
Inventories and current intangible assets 12 23 20
Trade and other receivables 13 314 520
Financial and other investments 14 1,529 1,856
Derivative financial assets 11 43 51
Cash and cash equivalents 15 275 -
Total current assets 2,184 2,447
Total assets 11,230 11,209
Current liabilities
Borrowings 16 (896) (846)
Derivative financial liabilities 11 (65) (185)
Trade and other payables 17 (632) (614)
Current tax liabilities (27) (9)
Provisions 20 (70) (133)
Total current liabilities (1,690) (1,787)
Non-current liabilities
Borrowings 16 (4,139) (4,640)
Derivative financial liabilities 11 (157) (234)
Other non-current liabilities 18 (177) (189)
Deferred tax liabilities 5 (437) (366)
Provisions 20 (129) (154)
Total non-current liabilities (5,039) (5,583)
Total liabilities (6,729) (7,370)
Net assets 4,501 3,839
Equity
Share capital 21 45 45
Share premium account 204 204
Retained earnings 2,930 2,265
Cash flow hedge reserve (10) (7)
Other reserves 1,332 1,332
Shareholders' equity 4,501 3,839
Non-controlling interests - -
Total equity 4,501 3,839
Nicola Shaw Chair Alan Foster Director
National Grid Gas plc
Registered number: 2006000
These regulatory accounting statements, comprising the consolidated income statement, consolidated statement of comprehensive income,
consolidated statement of changes in equity, consolidated statement of financial position, consolidated cash flow statement, basis of preparation,
recent accounting developments, notes to the accounting statements 1 to 28, supplementary analysis of the consolidated financial statements by
regulatory business contained in appendix 1, the unpublished information contained in appendix 2 and the supplementary analysis of the regulatory
business by activity contained in appendix 3, were approved by the Board of Directors of National Grid Gas plc on 27 July 2018 and were signed on
its behalf by:
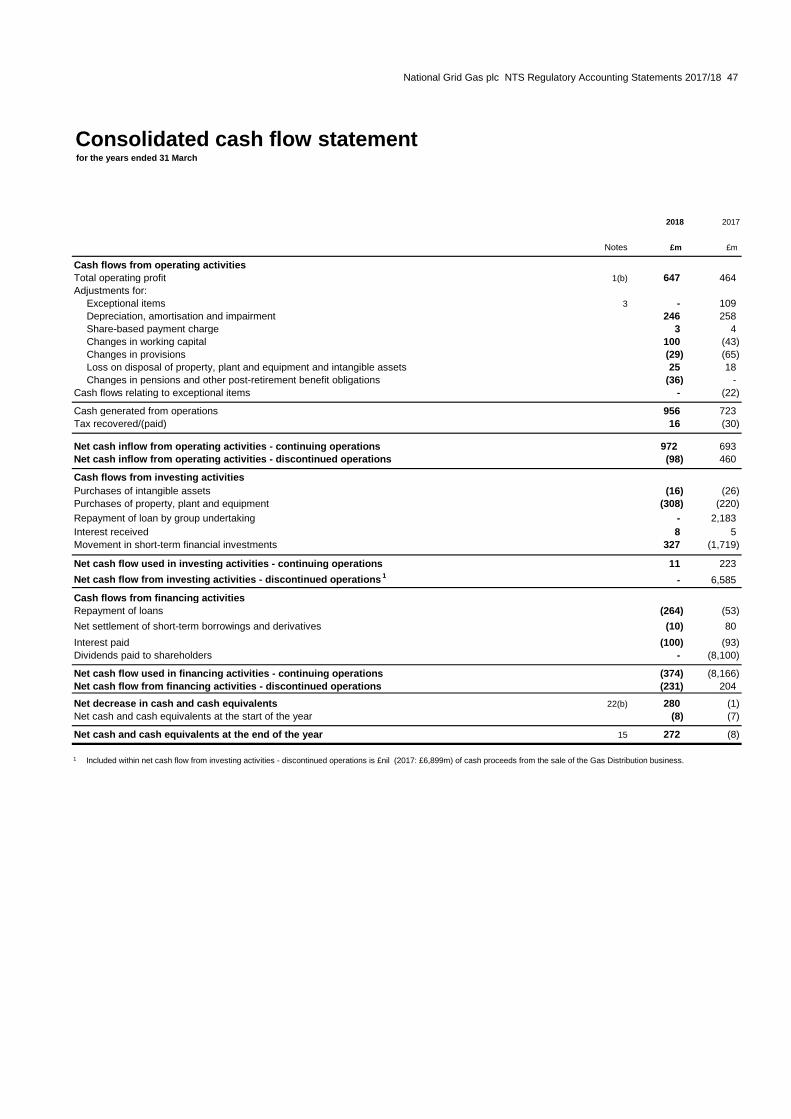
National Grid Gas plc NTS Regulatory Accounting Statements 2017/18 47
Consolidated cash flow statementfor the years ended 31 March
2018 2017
Notes £m £m
Cash flows from operating activities
Total operating profit 1(b) 647 464
Adjustments for:
Exceptional items 3 - 109
Depreciation, amortisation and impairment 246 258
Share-based payment charge 3 4
Changes in working capital 100 (43)
Changes in provisions (29) (65)
Loss on disposal of property, plant and equipment and intangible assets 25 18
Changes in pensions and other post-retirement benefit obligations (36) -
Cash flows relating to exceptional items - (22)
Cash generated from operations 956 723
Tax recovered/(paid) 16 (30)
Net cash inflow from operating activities - continuing operations 972 693
Net cash inflow from operating activities - discontinued operations (98) 460
Cash flows from investing activities
Purchases of intangible assets (16) (26)
Purchases of property, plant and equipment (308) (220)
Repayment of loan by group undertaking - 2,183
Interest received 8 5
Movement in short-term financial investments 327 (1,719)
Net cash flow used in investing activities - continuing operations 11 223
Net cash flow from investing activities - discontinued operations 1- 6,585
Cash flows from financing activities
Repayment of loans (264) (53)
Net settlement of short-term borrowings and derivatives (10) 80
Interest paid (100) (93)
Dividends paid to shareholders - (8,100)
Net cash flow used in financing activities - continuing operations (374) (8,166)
Net cash flow from financing activities - discontinued operations (231) 204
Net decrease in cash and cash equivalents 22(b) 280 (1)
Net cash and cash equivalents at the start of the year (8) (7)
Net cash and cash equivalents at the end of the year 15 272 (8)
1 Included within net cash flow from investing activities - discontinued operations is £nil (2017: £6,899m) of cash proceeds from the sale of the Gas Distribution business.

48 National Grid Gas plc NTS Regulatory Accounting Statements 2017/18
Notes to the consolidated financial statements -analysis of items in the primary statements
1. Segmental analysis
1.
2.
(a) Revenue
2018 2017
Sales Sales Sales Sales
Total between to third Total between to third
sales segments parties sales segments parties
£m £m £m £m £m £m
Operating segment
Gas Transmission 1,091 (4) 1,087 1,095 (41) 1,054
Other activities 342 (5) 337 286 - 286
Continuing operations 1,433 (9) 1,424 1,381 (41) 1,340
Discontinued operations - - - 943 (16) 927
Analysis of revenue by major customer:
2018 2017
£m £m
Customer A 142 153
We present revenue and the results of the business analysed by operating segment, based on the information the Board of Directors uses internally
for the purposes of evaluating the performance of operating segments and determining resource allocation between operating segments. The Board
is National Grid Gas plc's chief operating decision-making body (as defined by IFRS 8 'Operating Segments') and assesses the performance of
operations principally on the basis of operating profit before exceptional items and remeasurements (see note 3).
There has been no change to the way in which our businesses have reported internally during the year. The following are the main activities for each
operating segment:
Gas Transmission - The gas transmission network in Great Britain and liquefied natural gas (LNG) storage activities.
Other activities - Relate to the gas metering business, which provides regulated gas metering activities in the UK, together with corporate
activities.
Sales between businesses are priced having regard to the regulatory and legal requirements that the businesses are subject to, which include
requirements to avoid cross-subsidies.
This note sets out the financial performance for the year split into the different parts of the business (operating segments). We monitor and
manage the performance of these operating segments on a day-to-day basis.
We work with our regulators to obtain robust regulatory agreements that balance the risks we face with the opportunity to deliver reasonable returns
for our investors. Our regulated businesses earn revenue for the transmission and distribution (discontinued) services they have provided during the
year. In any one year, the revenue recognised may differ from the revenue allowed under our regulatory agreements and any such timing differences
are adjusted against future prices.
Revenue primarily represents the sales value derived from the transmission and distribution (discontinued) of gas and the provision of gas metering
services during the year including an assessment of the value of services provided, but not invoiced, at the year end. It excludes value added tax
and intra-group sales.
The sales value for the transmission and distribution (discontinued) of gas is largely determined from the amount of system capacity sold for the
year, and the amount of gas transported for the year, evaluated at contractual prices on a monthly basis. The sales value for the provision of gas
metering services is largely derived from monthly charges for the provision of individual meters under contractual arrangements.
Where revenue for the year exceeds the maximum amount permitted by regulatory agreement, and adjustments will be made to future prices to
reflect this over-recovery, a liability for the over-recovery is not recognised because such an adjustment to future prices relates to the provision of
future services. Similarly, an asset is not recognised where a regulatory agreement permits adjustments to be made to future prices in respect of an
under-recovery.
Revenue includes income arising from the sale of properties as a result of property management activities, from the sale of emission allowances and
from the recovery of pension deficit from other gas transporters under regulatory arrangement.
No other single customer contributed 10% or more to the Group's revenue in either 2018 or 2017.

National Grid Gas plc NTS Regulatory Accounting Statements 2017/18 49
1. Segmental analysis (continued)
(b) Operating profit
2018 2017 2018 2017
£m £m £m £m
Operating segment
Gas Transmission 493 419 493 330
Other activities 154 154 154 134
Continuing operations 647 573 647 464
Discontinued operations - 396 17 396
Reconciliation to profit before tax from continuing operations:
Operating profit 647 573 647 464
Finance income 8 5 8 5
Finance costs (204) (160) (183) (167)
Profit before tax from continuing operations 451 418 472 302
Profit before tax from discontinued operations - 328 17 319
(c) Property, plant and equipment and intangible assets
Depreciation, impairment
intangible assets Capital expenditure and amortisation
2018 2017 2018 2017 2018 2017
£m £m £m £m £m £m
Operating segments
Gas Transmission 4,286 4,165 310 214 188 182
Other activities 243 310 30 28 58 76
Continuing operations 4,529 4,475 340 242 246 258
Discontinued operations1- - - 284 - 158
Continuing operations by asset type
Property, plant and equipment 4,416 4,339 324 216 216 229
Intangible assets 113 136 16 26 30 29
4,529 4,475 340 242 246 258
Discontinued operations by asset type1
Property, plant and equipment - - - 284 - 135Intangible assets - - - - - 23
- - - 284 - 1581
Net book value of
property, plant and
equipment and
Comparative discontinued operations amounts relate to the Gas Distribution business disposed of last year.
A reconciliation of the operating segments' measure of profit to total profit before tax is provided below. Further details of the exceptional items and
remeasurements are provided in note 3.
Before exceptional items After exceptional items
and remeasurements and remeasurements
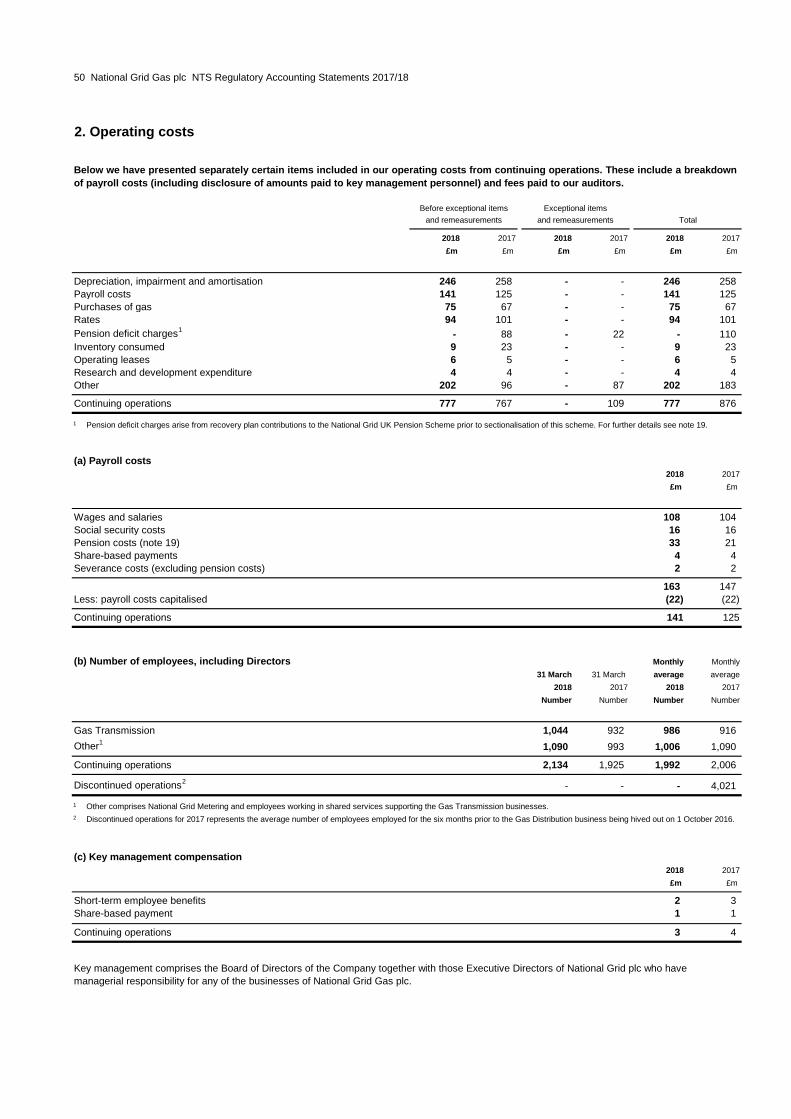
50 National Grid Gas plc NTS Regulatory Accounting Statements 2017/18
2. Operating costs
Total
2018 2017 2018 2017 2018 2017
£m £m £m £m £m £m
Depreciation, impairment and amortisation 246 258 - - 246 258
Payroll costs 141 125 - - 141 125
Purchases of gas 75 67 - - 75 67
Rates 94 101 - - 94 101
Pension deficit charges1- 88 - 22 - 110
Inventory consumed 9 23 - - 9 23
Operating leases 6 5 - - 6 5
Research and development expenditure 4 4 - - 4 4
Other 202 96 - 87 202 183
Continuing operations 777 767 - 109 777 876
1
(a) Payroll costs
2018 2017
£m £m
Wages and salaries 108 104
Social security costs 16 16
Pension costs (note 19) 33 21
Share-based payments 4 4
Severance costs (excluding pension costs) 2 2
163 147
Less: payroll costs capitalised (22) (22)
Continuing operations 141 125
(b) Number of employees, including Directors Monthly Monthly
31 March 31 March average average
2018 2017 2018 2017
Number Number Number Number
Gas Transmission 1,044 932 986 916
Other11,090 993 1,006 1,090
Continuing operations 2,134 1,925 1,992 2,006
Discontinued operations2- - - 4,021
1
2
(c) Key management compensation
2018 2017
£m £m
Short-term employee benefits 2 3
Share-based payment 1 1-
Continuing operations 3 4
Below we have presented separately certain items included in our operating costs from continuing operations. These include a breakdown
of payroll costs (including disclosure of amounts paid to key management personnel) and fees paid to our auditors.
Other comprises National Grid Metering and employees working in shared services supporting the Gas Transmission businesses.
Discontinued operations for 2017 represents the average number of employees employed for the six months prior to the Gas Distribution business being hived out on 1 October 2016.
Key management comprises the Board of Directors of the Company together with those Executive Directors of National Grid plc who have
managerial responsibility for any of the businesses of National Grid Gas plc.
Before exceptional items Exceptional items
and remeasurements and remeasurements
Pension deficit charges arise from recovery plan contributions to the National Grid UK Pension Scheme prior to sectionalisation of this scheme. For further details see note 19.
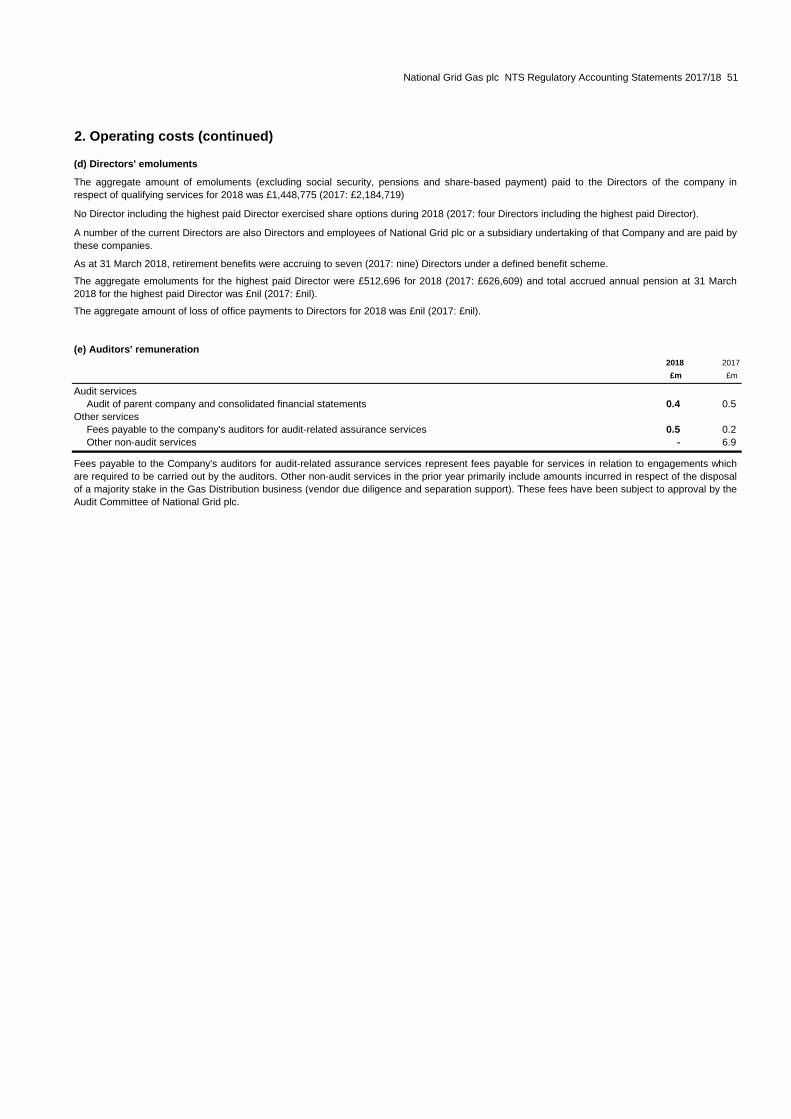
National Grid Gas plc NTS Regulatory Accounting Statements 2017/18 51
2. Operating costs (continued)
(d) Directors' emoluments
(e) Auditors' remuneration
2018 2017
£m £m
Audit services
Audit of parent company and consolidated financial statements 0.4 0.5
Other services
Fees payable to the company's auditors for audit-related assurance services 0.5 0.2
Other non-audit services - 6.9
The aggregate amount of emoluments (excluding social security, pensions and share-based payment) paid to the Directors of the company in
respect of qualifying services for 2018 was £1,448,775 (2017: £2,184,719)
No Director including the highest paid Director exercised share options during 2018 (2017: four Directors including the highest paid Director).
A number of the current Directors are also Directors and employees of National Grid plc or a subsidiary undertaking of that Company and are paid by
these companies.
As at 31 March 2018, retirement benefits were accruing to seven (2017: nine) Directors under a defined benefit scheme.
The aggregate emoluments for the highest paid Director were £512,696 for 2018 (2017: £626,609) and total accrued annual pension at 31 March
2018 for the highest paid Director was £nil (2017: £nil).
The aggregate amount of loss of office payments to Directors for 2018 was £nil (2017: £nil).
Fees payable to the Company's auditors for audit-related assurance services represent fees payable for services in relation to engagements which
are required to be carried out by the auditors. Other non-audit services in the prior year primarily include amounts incurred in respect of the disposal
of a majority stake in the Gas Distribution business (vendor due diligence and separation support). These fees have been subject to approval by the
Audit Committee of National Grid plc.

52 National Grid Gas plc NTS Regulatory Accounting Statements 2017/18
3. Exceptional items and remeasurements
2018 2017
£m £m
Included within operating profit:
Exceptional items:
Profit on disposal of land and buildings1- 109
Gas holder demolition costs1- (107)
Pension sectionalisation2- (89)
Pension deficit charges3- (22)
- (109)
Included within finance costs:
Remeasurements:
Net gains/(losses) on derivative financial instruments 21 (7)
21 (7)
Total included within profit before tax 21 (116)
Included within taxation:
Exceptional credit arising on items not included in profit before tax:
Deferred tax credit arising on the reduction in the UK tax rate 4- 18
Tax on exceptional items - 44
Tax on remeasurements (4) 1`
(4) 63
Total exceptional items and remeasurements after tax 17 (53)
Analysis of total exceptional items and remeasurements after tax:Total exceptional items after tax - (47)Total remeasurements after tax 17 (6)
Total exceptional items and remeasurements from continuing operations 17 (53)
To monitor our financial performance, we use a profit measure that excludes certain income and expenses. We call that measure ‘business
performance’ or 'adjusted profit'. We exclude items from business performance because we believe these items are individually important
to understanding our financial performance. If included, these items could distort understanding of our performance for the year and the
comparability between periods. This note analyses these items, which are included in our results for the year but are excluded from
business performance.
Our financial performance is analysed into two components: business performance, which excludes exceptional items and remeasurements;
and exceptional items and remeasurements. Business performance is used by management to monitor financial performance as it is
considered that it improves the comparability of our reported financial performance from year to year. Business performance subtotals are
presented on the face of the income statement or in the notes to the financial statements.
Management utilises an exceptional items framework that has been discussed and approved by the National Grid Gas plc Audit Committee.
This follows a three-step process which considers the nature of the event, the financial materiality involved and any particular facts and
circumstances. In considering the nature of the event, management focuses on whether the event is within the Group’s control and how
frequently such an event typically occurs. In determining the facts and circumstances management considers factors such as ensuring
consistent treatment between favourable and unfavourable transactions, precedent for similar items, number of periods over which costs will
be spread or gains earned and the commercial context for the particular transaction.
Items of income or expense that are considered by management for designation as exceptional items include such items as significant
restructurings, write-downs or impairments of non-current assets, significant changes in environmental or decommissioning provisions,
integration of acquired businesses, gains or losses on disposals of businesses or investments and debt redemption costs as a consequence
of transactions such as significant disposals or issues of equity.
Remeasurements comprise gains or losses recorded in the income statement arising from changes in the fair value of derivative financial
instruments to the extent that hedge accounting is not achieved or is not effective. These fair values increase or decrease because of
changes in financial indices and prices over which we have no control.

National Grid Gas plc NTS Regulatory Accounting Statements 2017/18 53
3. Exceptional items and remeasurements (continued)
1
2
3
4
Remeasurements
Net gains/losses arising from derivative instrument fair value movement reported in the income statement. These exclude gains and losses for which
hedge accounting has been effective, which have been recognised directly in other comprehensive income or which are offset by adjustments to the
carrying value of debt.
Further detail of exceptional items specific to 2017:
During October 2016, following the sale of the Gas Distribution business, the company sold 78 surplus land sites to a number of fellow National
Grid Group undertakings, recognising a gain on disposal of £109m. A legal agreement was entered into with these National Grid Group
companies to demolish the non-operational gas holders on these sites, creating a constructive obligation for the Company. As a result a provision
of £107m was recognised at 31 March 2017.
With effect from 1 January 2017, sectionalisation of the National Grid UK Pension Scheme was carried out, resulting in separation of the scheme
into three sections, each of which are legally and actuarially separate. Section B is included within National Grid Gas plc and the associated costs
of £89m were recognised as exceptional in 2017, see note 19 for further details.
Pension deficit charges arise from the recovery plan contributions to the National Grid UK Pension Scheme for certain employees in other
activities which were incurred prior to sectionalisation of the scheme, see note 19.
The Finance No. 2 Bill 2015 resulted in a reduction in the UK corporation tax rate from 20% to 19% for the year beginning 1 April 2017, with a
further reduction from 19% to 18% for the year beginning 1 April 2020. A further reduction to 17% with effect from 1 April 2020 was enacted in the
Finance Act 2016. Deferred taxes at the reporting date have been measured using these enacted tax rates and reflected in these financial
statements, resulting in a deferred tax credit. This credit was presented as exceptional, reflecting its nature.
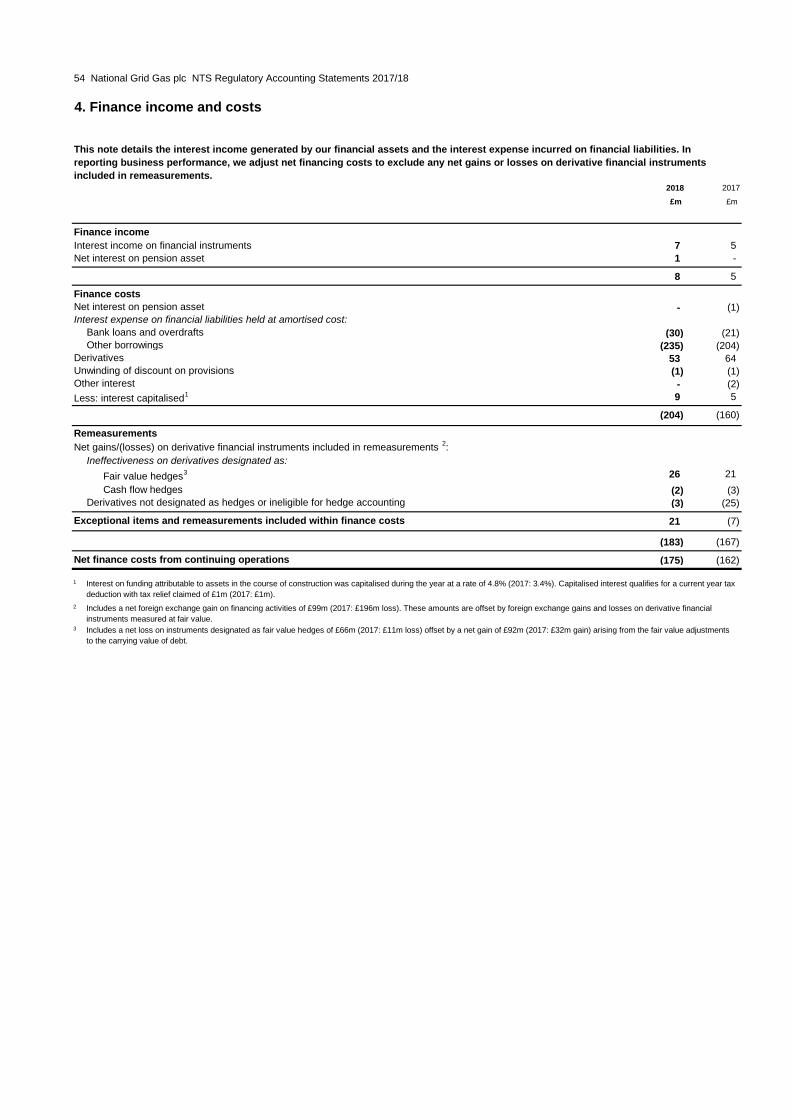
54 National Grid Gas plc NTS Regulatory Accounting Statements 2017/18
4. Finance income and costs
2018 2017
£m £m
Finance income
Interest income on financial instruments 7 5
Net interest on pension asset 1 -
8 5
Finance costs
Net interest on pension asset - (1)Interest expense on financial liabilities held at amortised cost:
Bank loans and overdrafts (30) (21)Other borrowings (235) (204)
Derivatives 53 64Unwinding of discount on provisions (1) (1)Other interest - (2)
Less: interest capitalised1 9 5
(204) (160)
Remeasurements
Net gains/(losses) on derivative financial instruments included in remeasurements 2:
Ineffectiveness on derivatives designated as:
Fair value hedges3 26 21
Cash flow hedges (2) (3)Derivatives not designated as hedges or ineligible for hedge accounting (3) (25)
Exceptional items and remeasurements included within finance costs 21 (7)
(183) (167)
Net finance costs from continuing operations (175) (162)
1
2
3
This note details the interest income generated by our financial assets and the interest expense incurred on financial liabilities. In
reporting business performance, we adjust net financing costs to exclude any net gains or losses on derivative financial instruments
included in remeasurements.
Interest on funding attributable to assets in the course of construction was capitalised during the year at a rate of 4.8% (2017: 3.4%). Capitalised interest qualifies for a current year tax
deduction with tax relief claimed of £1m (2017: £1m).
Includes a net foreign exchange gain on financing activities of £99m (2017: £196m loss). These amounts are offset by foreign exchange gains and losses on derivative financial
instruments measured at fair value.
Includes a net loss on instruments designated as fair value hedges of £66m (2017: £11m loss) offset by a net gain of £92m (2017: £32m gain) arising from the fair value adjustments
to the carrying value of debt.

National Grid Gas plc NTS Regulatory Accounting Statements 2017/18 55
5. Taxation
Tax charged/(credited) to the income statement - continuing operations 2018 2017
£m £m
Tax before exceptional items and remeasurements 98 66
Exceptional tax on items not included in profit before tax (note 3) - (18)
Tax on other exceptional items and remeasurements 4 (45)
Tax on total exceptional items and remeasurements (note 3) 4 (63)
Total tax charge from continuing operations 102 3
Taxation as a percentage of profit before tax
% %
Before exceptional items and remeasurements - continuing operations 21.7 15.8
After exceptional items and remeasurements - continuing operations 21.6 1.0
The tax charge for the year can be analysed as follows: 2018 2017
£m £m
Current tax
UK corporation tax at 19% (2017: 20%) 88 106
UK corporation tax adjustment in respect of prior years - (25)
Total current tax from continuing operations 88 81
Deferred tax
UK deferred tax 13 (65)
UK deferred tax adjustment in respect of prior years 1 (13)
Total deferred tax from continuing operations 14 (78)
Total tax charge from continuing operations 102 3
Current tax assets and liabilities are measured at the amounts expected to be recovered from or paid to the taxation authorities. The tax rates and
tax laws used to compute the amounts are those that are enacted or substantively enacted by the reporting date.
The calculation of the Group’s total tax charge involves a degree of estimation and judgement, and management periodically evaluates positions
taken in tax returns with respect to situations in which applicable tax regulation is subject to interpretation and establishes provisions where
appropriate on the basis of amounts expected to be paid to the tax authorities.
Deferred tax is provided for using the balance sheet liability method and is recognised on temporary differences between the carrying amount of
assets and liabilities in the financial statements and the corresponding tax bases used in the computation of taxable profit.
Deferred tax liabilities are generally recognised on all taxable temporary differences and deferred tax assets are recognised to the extent that it is
probable that taxable profits will be available against which deductible temporary differences can be utilised. However, deferred tax assets and
liabilities are not recognised if the temporary differences arise from the initial recognition of goodwill or from the initial recognition of other assets and
liabilities in a transaction (other than a business combination) that affects neither the accounting nor taxable profit or loss.
Deferred tax liabilities are recognised on taxable temporary differences arising on investments in subsidiaries and jointly controlled entities, except
where the Group is able to control the reversal of the temporary difference and it is probable that the temporary difference will not reverse in the
foreseeable future.
Deferred tax is calculated at the tax rates that are expected to apply in the period when the liability is settled or the asset is realised, based on the tax
rates and tax laws that have been enacted or substantively enacted by the reporting date.
This note gives further details of the tax charge and tax liabilities, including current and deferred tax. The current tax charge is the tax
payable on this year’s taxable profits. Deferred tax is an accounting adjustment to provide for tax that is expected to arise in the future due
to differences in accounting and tax bases.
The tax charge for the period is recognised in the income statement, the statement of comprehensive income or directly in equity, according to the
accounting treatment of the related transaction. The tax charge comprises both current and deferred tax.
The carrying amount of deferred tax assets is reviewed at each reporting date and reduced to the extent that it is no longer probable that sufficient
taxable profits will be available to allow all or part of the deferred tax asset to be recovered. Unrecognised deferred tax assets are reassessed at
each reporting date and are recognised to the extent that it has become probable that future taxable profits will allow the deferred tax asset to be
recovered.
Deferred tax assets and liabilities are offset when there is a legally enforceable right to set off current tax assets against current tax liabilities and
when they relate to income taxes levied by the same taxation authority and the Company and its subsidiaries intend to settle their current tax assets
and liabilities on a net basis.

56 National Grid Gas plc NTS Regulatory Accounting Statements 2017/18
5. Taxation (continued)
Tax (credited)/charged to other comprehensive income and equity 2018 2017
£m £m
Current tax
Share-based payments (2) (2)
Deferred tax
Share-based payments 2 1
Remeasurements of net retirement benefit obligations 55 23
Cash flow hedges - 2
55 24
Total tax recognised in the statement of comprehensive income from continuing operations 55 25
Total tax recognised in the statement of comprehensive income from discontinued operations - 11
Total tax relating to share-based payments recognised directly in equity from continuing operations - (1)55
55 35
Before After Before After
exceptional exceptional exceptional exceptional
items and items and items and items and
remeasure- remeasure- remeasure- remeasure-
ments ments ments ments
2018 2018 2017 2017
£m £m £m £m
Profit before tax
Before exceptional items and remeasurements 451 451 418 418
Exceptional items and remeasurements - 21 - (116)
Profit before tax from continuing operations 451 472 418 302
86 90 84 60
Effects of:
Adjustments in respect of prior years 1 1 (38) (38)
Expenses not deductible for tax purposes 14 14 26 26
Non-taxable income (1) (1) (6) (27)
Deferred tax impact of change in UK tax rate (2) (2) - (18)
Total tax from continuing operations 98 102 66 3
% % % %
Effective tax rate - continuing operations 21.7 21.6 15.8 1.0
Factors that may affect future tax charges
The Finance Act 2016 which was enacted on 15 September 2016 reduced the main rate of UK corporation tax to 17% with effect from 1 April 2020.
Deferred tax balances have been calculated at this rate.
Taxation included within the statement of financial position
The tax charge for the year after exceptional items and remeasurements is higher (2017: lower) than the standard rate of corporation tax in the UK of
19% (2017: 20%):
Profit before tax from continuing operations multiplied by UK corporation tax rate of 19% (2017:
20%)
The following are the major deferred tax assets and liabilities recognised, and the movements thereon, during the current and prior reporting periods:

National Grid Gas plc NTS Regulatory Accounting Statements 2017/18 57
5. Taxation (continued)
Deferred tax (assets)/liabilities Accelerated Share- Other net
tax based Financial temporary
Pensions depreciation payment instruments differences Total
£m £m £m £m £m £m
Deferred tax assets at 31 March 2016 - - (5) (7) (6) (18)Deferred tax liabilities at 31 March 2016 - 1,557 - - 9 1,566
At 1 April 2016 - 1,557 (5) (7) 3 1,548
Credited to income statement (15) (124) - (4) (12) (155)
Charged to other comprehensive income and equity 23 - 1 12 - 36
Discontinued Operations - (1,065) - - 2 (1,063)
At 31 March 2017 8 368 (4) 1 (7) 366
Deferred tax assets at 31 March 2017 - - (4) - (10) (14)Deferred tax liabilities at 31 March 2017 8 368 - 1 3 380
At 1 April 2017 8 368 (4) 1 (7) 366
Charged to income statement 6 3 1 (1) 5 14
Charged/(credited) to other comprehensive income and equity 55 - 2 - - 57
At 31 March 2018 69 371 (1) - (2) 437
Deferred tax assets at 31 March 2018 - - (1) - (6) (7)Deferred tax liabilities at 31 March 2018 69 371 - - 4 444
At 31 March 2018 69 371 (1) - (2) 437
6. Dividends
The following table shows the dividends paid to equity shareholders:
pence pence
(per ordinary (per ordinary
share) £m share) £m
Ordinary dividends
Interim dividend paid in the year - - 205.38 8,100
No dividends were paid by National Grid Gas plc during the year (2017: Interim dividend A: £5,917m and interim dividend B: £2,183m together, the
interim dividends). The prior year interim dividends were made to ensure partial distribution of the proceeds from the Gas Distribution business.
Deferred tax assets and liabilities are only offset where there is a legally enforceable right of offset and there is an intention to settle the balances
net. The deferred tax balances (after offset) for statement of financial position purposes consist solely of deferred tax liabilities of £437m (2017:
£366m). At the balance sheet date there were no material current deferred tax assets or liabilities (2017: £nil).
Dividends represents the return of profits to shareholders. Dividends are paid as an amount per ordinary share held. We retain part of the
profits generated in the year to meet future growth plans and meet our gearing target, and pay out the remainder in accordance with our
dividend policy.
Interim dividends are recognised when they become payable to the Company’s shareholders. Final dividends are recognised when they are
approved by shareholders.
2018 2017
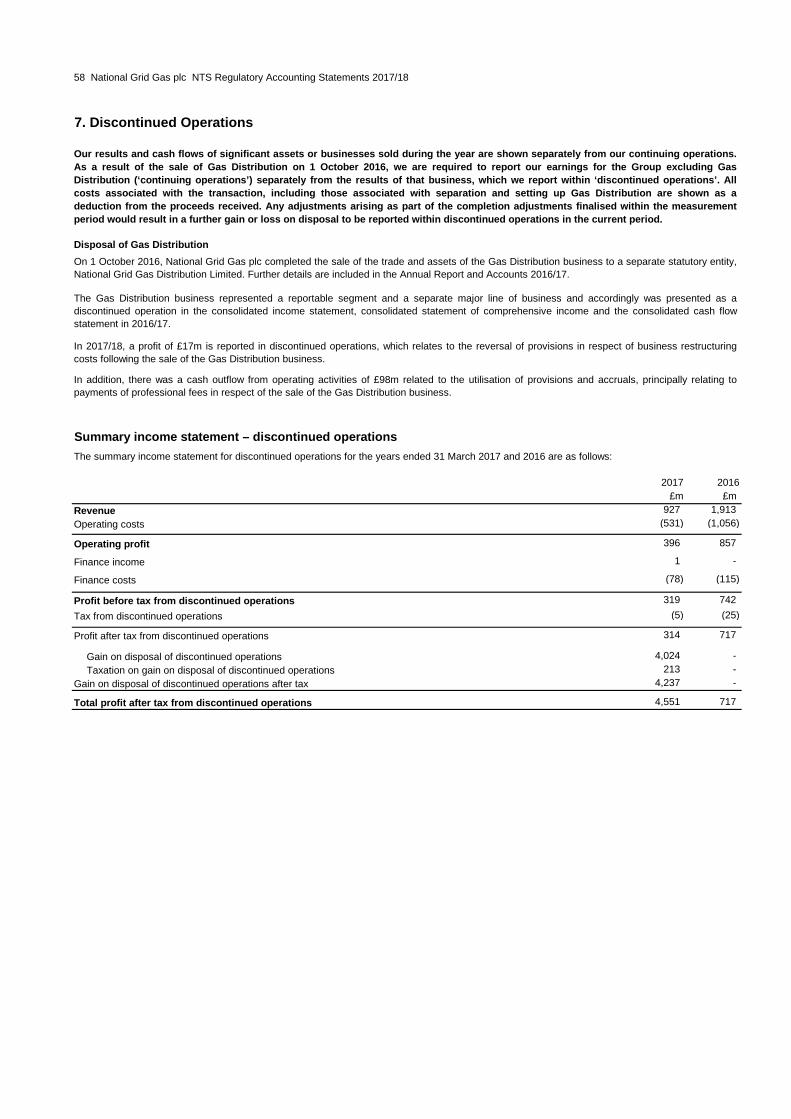
58 National Grid Gas plc NTS Regulatory Accounting Statements 2017/18
7. Discontinued Operations
Disposal of Gas Distribution
Summary income statement – discontinued operations
The summary income statement for discontinued operations for the years ended 31 March 2017 and 2016 are as follows:
2017 2016
£m £m
Revenue 927 1,913
Operating costs (531) (1,056)
Operating profit 396 857
Finance income 1 -
Finance costs (78) (115)
Profit before tax from discontinued operations 319 742
Tax from discontinued operations (5) (25)
Profit after tax from discontinued operations 314 717
Gain on disposal of discontinued operations 4,024 -
Taxation on gain on disposal of discontinued operations 213 -
Gain on disposal of discontinued operations after tax 4,237 -
Total profit after tax from discontinued operations 4,551 717
Our results and cash flows of significant assets or businesses sold during the year are shown separately from our continuing operations.
As a result of the sale of Gas Distribution on 1 October 2016, we are required to report our earnings for the Group excluding Gas
Distribution (‘continuing operations’) separately from the results of that business, which we report within ‘discontinued operations’. All
costs associated with the transaction, including those associated with separation and setting up Gas Distribution are shown as a
deduction from the proceeds received. Any adjustments arising as part of the completion adjustments finalised within the measurement
period would result in a further gain or loss on disposal to be reported within discontinued operations in the current period.
On 1 October 2016, National Grid Gas plc completed the sale of the trade and assets of the Gas Distribution business to a separate statutory entity,
National Grid Gas Distribution Limited. Further details are included in the Annual Report and Accounts 2016/17.
The Gas Distribution business represented a reportable segment and a separate major line of business and accordingly was presented as a
discontinued operation in the consolidated income statement, consolidated statement of comprehensive income and the consolidated cash flow
statement in 2016/17.
In 2017/18, a profit of £17m is reported in discontinued operations, which relates to the reversal of provisions in respect of business restructuring
costs following the sale of the Gas Distribution business.
In addition, there was a cash outflow from operating activities of £98m related to the utilisation of provisions and accruals, principally relating to
payments of professional fees in respect of the sale of the Gas Distribution business.

National Grid Gas plc NTS Regulatory Accounting Statements 2017/18 59
8. Intangible assets
Software
£m
Cost at 1 April 2016 630
Additions 26
Reclassifications13
Disposals (10)
Disposal of discontinued operations (300)
Cost at 31 March 2017 349
Additions 16
Reclassifications12
Disposals (21)
Transfers2(10)
Cost at 31 March 2018 336
Accumulated amortisation at 1 April 2016 (378)
Amortisation charge for the year (52)
Disposals 9
Disposal of discontinued operations 208
Accumulated amortisation at 31 March 2017 (213)
Amortisation charge for the year (30)
Disposals 20Reclassifications -
Accumulated amortisation at 31 March 2018 (223)
Net book value at 31 March 2018 113
Net book value at 31 March 2017 136
1 Reclassifications represents amounts transferred from property, plant and equipment, see note 9.
2 Transfers represents assets transferred to a fellow group undertaking in the year.
Intangible assets relate to software, which is written down (amortised) over the period we expect to receive a benefit from the asset.
Identifiable intangible assets are recorded at cost less accumulated amortisation and any provision for impairment. Intangible assets are tested for
impairment only if there is some indication that the carrying value of the assets may have been impaired.
Impairments of assets are calculated as the difference between the carrying value of the asset and the recoverable amount, if lower. Where such an
asset does not generate cash flows that are independent from other assets, the recoverable amount of the cash generating unit to which that asset
belongs is estimated. Impairments are recognised in the income statement and are disclosed separately. Any assets which suffered impairment in a
previous period are reviewed for possible reversal of the impairment at each reporting date.
Internally generated intangible assets, such as software, are recognised only if: an asset is created that can be identified; it is probable that the asset
created will generate future economic benefits; and that the development cost of the asset can be measured reliably. Where no internally generated
intangible asset can be recognised, development expenditure is recorded as an expense in the period in which it is incurred.
Intangible assets under development are not amortised. Other non-current intangible assets are amortised on a straight-line basis over their
estimated useful economic lives. The amortisation period for software is up to eight years.

60 National Grid Gas plc NTS Regulatory Accounting Statements 2017/18
9. Property, plant and equipment
Years
5 to 50
5 to 60
5 to 50
3 to 10
We operate a gas transmission business and therefore have a significant physical asset base. We continue to invest in our network to maintain
reliability, create new customer connections and ensure our networks are flexible and resilient. Our business plan envisages these additional
investments will be funded through a mixture of cash generated from operations and the issue of new debt.
Property, plant and equipment is recorded at cost, less accumulated depreciation and any impairment losses.
Cost includes the purchase price of the asset, any payroll and finance costs incurred which are directly attributable to the construction of property,
plant and equipment, as well as the cost of any associated asset retirement obligations.
Property, plant and equipment includes assets in which the Company’s interest comprises legally protected statutory or contractual rights of use.
Additions represent the purchase or construction of new assets, including capital expenditure for safety and environmental assets, and extensions to,
enhancements to, or replacement of existing assets.
All contributions received prior to 1 July 2009 towards the cost of property, plant and equipment and contributions received post 1 July 2009 towards
the altering, diverting or relocating a tangible fixed asset are included in trade and other payables as deferred income and credited on a straight-line
basis to the income statement over the estimated useful economic lives of the assets to which they relate.
Contributions received post 1 July 2009 towards the cost of tangible fixed assets from customers for connections to the gas transmission and
distribution networks are initially recognised as deferred income and credited to revenue once the connection has been completed. Contributions
received post 1 July 2009 towards the provision of ongoing access to a supply of services are recognised initially as deferred income and revenue is
subsequently recognised over the period in which the service is provided.
This note shows the physical assets controlled by us. The cost of these assets primarily represents the amount initially paid for them. A
depreciation expense is charged to the income statement to reflect annual wear and tear and the reduced value of the asset over time.
Depreciation is calculated by estimating the number of years we expect the asset to be used (useful economic life) and charging the cost
of the asset to the income statement equally over this period.
Motor vehicles and office equipment
Gains and losses on disposals are determined by comparing the proceeds with the carrying amount and are recognised within operating profit in the
income statement.
Items within property, plant and equipment are tested for impairment if there is some indication that the carrying value of the assets may have been
impaired.
Impairments of assets are calculated as the difference between the carrying value of the asset and the recoverable amount, if lower. Where such an
asset does not generate cash flows that are independent from other assets, the recoverable amount of the cash generating unit to which that asset
belongs is estimated.
Impairments are recognised in the income statement and material impairments are disclosed separately.
Any assets which suffered impairment in a previous period are reviewed for possible reversal of the impairment at each reporting date.
No depreciation is provided on freehold land or assets in the course of construction. Other items of property, plant and equipment are depreciated,
on a straight-line basis, at rates estimated to write off their book values over their estimated useful economic lives. In assessing estimated useful
economic lives, consideration is given to any contractual arrangements and operational requirements relating to particular assets. The assessment
of estimated useful economic lives and residual values of assets are performed annually. Unless otherwise determined by operational requirements,
the depreciation periods for the principal categories of property, plant and equipment are, in general, as shown in the table below:
Depreciation periods
Freehold and leasehold buildings
Plant and Machinery
- mains, services and regulating equipment
- other

National Grid Gas plc NTS Regulatory Accounting Statements 2017/18 61
9. Property, plant and equipment (continued)Assets Motor
in the vehicles
Land and Plant and course of and office
buildings machinery construction equipment Total
£m £m £m £m £m
Cost at 1 April 2016 447 19,513 266 577 20,803
Additions 10 319 144 27 500
Disposals (21) (248) (5) (111) (385)
Disposal of discontinued operations (62) (11,612) (75) (286) (12,035)
Reclassifications 1(11) 49 (61) 20 (3)
Cost at 31 March 2017 363 8,021 269 227 8,880
Additions 6 124 188 6 324
Disposals2(4) (47) (8) (11) (70)
Reclassifications1(68) 109 (47) 4 (2)
Transfers3(4) - - (1) (5)
Cost at 31 March 2018 293 8,207 402 225 9,127
Accumulated depreciation at 1 April 2016 (221) (7,443) - (485) (8,149)
Depreciation charge for the year (37) (302) - (25) (364)
Disposals 17 240 - 111 368
Accumulated depreciation on disposal of discontinued operations 27 3,375 - 202 3,604
Accumulated depreciation at 31 March 2017 (214) (4,130) - (197) (4,541)
Depreciation charge for the year (20) (185) - (8) (213)
Disposals23 32 - 11 46
Reclassifications 148 (48) - - -
Impairment - (3) - - (3)
Accumulated depreciation at 31 March 2018 (183) (4,334) - (194) (4,711)
Net book value at 31 March 2018 110 3,873 402 31 4,416
Net book value at 31 March 2017 149 3,891 269 30 4,339
1 Represents amounts transferred between categories and also to intangible assets (see note 8).
2 Disposals includes £20m of nil net book value assets written off.
3 Transfers represents assets transferred to a fellow group undertaking in the year.
2018 2017
£m £m
Information in relation to property, plant and equipment
Capitalised interest included within cost 239 229
Contributions to cost of property, plant and equipment included within:
Trade and other payables 3 3
Non-current liabilities 138 140
10. Other non-current assets
2018 2017
£m £m
Loans and receivables - amounts owed by parent undertaking 13,427 3,426
Prepayments 87 3
3,514 3,429
1
Other non-current assets includes assets that do not fall into any other non-current asset category (such as property, plant and equipment)
and the benefit to be received from the asset is not due to be received until after 31 March 2019.
The amount owed by parent undertaking is non-contractual, and its fair value is approximate to book value.

62 National Grid Gas plc NTS Regulatory Accounting Statements 2017/18
11. Derivative financial instruments
2018 2017
Asset Liabilities Total Asset Liabilities Total
£m £m £m £m £m £m
Interest rate swaps 291 (94) 197 363 (151) 212
Cross-currency interest rate swaps 338 (7) 331 486 (7) 479
Foreign exchange forward contracts1- - - 8 (4) 4
Inflation linked swaps 5 (121) (116) 7 (257) (250)
634 (222) 412 864 (419) 445
1 Included within the foreign excange forward contracts balance is £nil (2017: £4m) of derivatives in relation to capital expenditure.
The maturity profile of derivative financial instruments is as follows:
2018 2017
Assets Liabilities Total Assets Liabilities Total
£m £m £m £m £m £m
Current
Less than 1 year 43 (65) (22) 51 (185) (134)
43 (65) (22) 51 (185) (134)
Non-current
In 1 - 2 years 42 (15) 27 69 (52) 17
In 2 - 3 years - - - 76 (30) 46
In 3 - 4 years 337 (5) 332 - - -
In 4 - 5 years 9 - 9 412 (7) 405
More than 5 years 203 (137) 66 256 (145) 111
591 (157) 434 813 (234) 579
634 (222) 412 864 (419) 445
2018 2017
£m £m
Interest rate swaps (2,473) (3,173)
Cross-currency interest rate swaps (751) (728)
Foreign exchange forward contracts (3) (56)
Inflation linked swaps (696) (784)
(3,923) (4,741)
1 The notional contract amounts of derivatives indicate the gross nominal value of transactions outstanding at the reporting date.
For each class of derivative the notional contract amounts 1 are as follows:
Derivatives are financial instruments that derive their value from the price of an underlying item such as interest rates, foreign exchange
rates, credit spreads, equity or other indices. In accordance with the Board approved policies, derivatives are transacted generally to
manage our exposure to fluctuations in interest rate and foreign exchange rate on borrowings and other contractual cash flows.
Specifically, we use derivatives to manage these risks from our financing portfolio to optimise the overall cost of accessing the debt
capital markets. These derivatives are analysed below.
Derivative financial instruments are initially recognised at fair value and subsequently remeasured at fair value at each reporting date. Changes in
fair values are recorded in the period they arise, in either the income statement or other comprehensive income as required by IAS 39. Where the
fair value of a derivative is positive it is carried as a derivative asset, and where negative as a derivative liability.
We calculate the fair value of financial derivatives by discounting all future cash flows using the market yield curve at the reporting date. The market
yield curve for each currency is obtained from external sources for interest and foreign exchange rates. In the absence of sufficient market data, fair
values would be based on the quoted market price of similar derivatives. Analysis of these derivatives and the various methods used to calculate
their respective fair values is detailed below and in note 25.
For each class of derivative instrument type the fair value amounts are as follows:
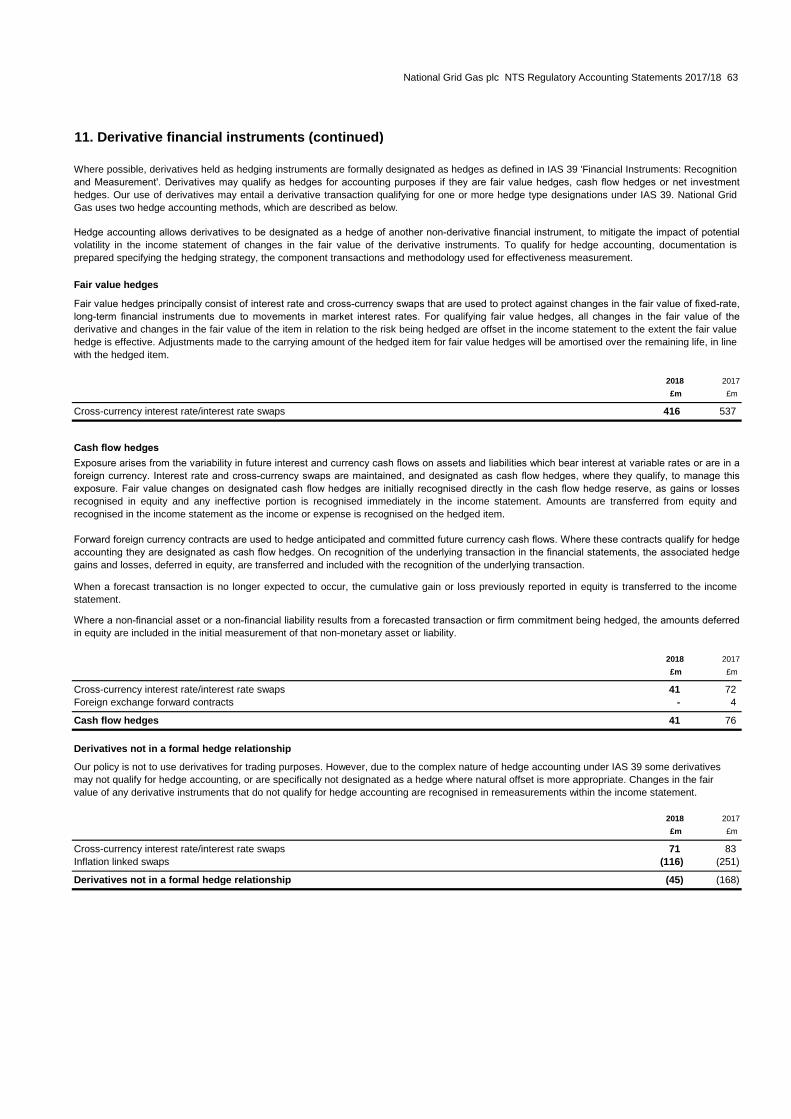
National Grid Gas plc NTS Regulatory Accounting Statements 2017/18 63
11. Derivative financial instruments (continued)
Fair value hedges
2018 2017
£m £m
Cross-currency interest rate/interest rate swaps 416 537
Cash flow hedges
2018 2017
£m £m
Cross-currency interest rate/interest rate swaps 41 72
Foreign exchange forward contracts - 4
Cash flow hedges 41 76
Derivatives not in a formal hedge relationship
2018 2017
£m £m
Cross-currency interest rate/interest rate swaps 71 83
Inflation linked swaps (116) (251)
Derivatives not in a formal hedge relationship (45) (168)
Where possible, derivatives held as hedging instruments are formally designated as hedges as defined in IAS 39 'Financial Instruments: Recognition
and Measurement'. Derivatives may qualify as hedges for accounting purposes if they are fair value hedges, cash flow hedges or net investment
hedges. Our use of derivatives may entail a derivative transaction qualifying for one or more hedge type designations under IAS 39. National Grid
Gas uses two hedge accounting methods, which are described as below.
Hedge accounting allows derivatives to be designated as a hedge of another non-derivative financial instrument, to mitigate the impact of potential
volatility in the income statement of changes in the fair value of the derivative instruments. To qualify for hedge accounting, documentation is
prepared specifying the hedging strategy, the component transactions and methodology used for effectiveness measurement.
Fair value hedges principally consist of interest rate and cross-currency swaps that are used to protect against changes in the fair value of fixed-rate,
long-term financial instruments due to movements in market interest rates. For qualifying fair value hedges, all changes in the fair value of the
derivative and changes in the fair value of the item in relation to the risk being hedged are offset in the income statement to the extent the fair value
hedge is effective. Adjustments made to the carrying amount of the hedged item for fair value hedges will be amortised over the remaining life, in line
with the hedged item.
Exposure arises from the variability in future interest and currency cash flows on assets and liabilities which bear interest at variable rates or are in a
foreign currency. Interest rate and cross-currency swaps are maintained, and designated as cash flow hedges, where they qualify, to manage this
exposure. Fair value changes on designated cash flow hedges are initially recognised directly in the cash flow hedge reserve, as gains or losses
recognised in equity and any ineffective portion is recognised immediately in the income statement. Amounts are transferred from equity and
recognised in the income statement as the income or expense is recognised on the hedged item.
Forward foreign currency contracts are used to hedge anticipated and committed future currency cash flows. Where these contracts qualify for hedge
accounting they are designated as cash flow hedges. On recognition of the underlying transaction in the financial statements, the associated hedge
gains and losses, deferred in equity, are transferred and included with the recognition of the underlying transaction.
When a forecast transaction is no longer expected to occur, the cumulative gain or loss previously reported in equity is transferred to the income
statement.
Where a non-financial asset or a non-financial liability results from a forecasted transaction or firm commitment being hedged, the amounts deferred
in equity are included in the initial measurement of that non-monetary asset or liability.
Our policy is not to use derivatives for trading purposes. However, due to the complex nature of hedge accounting under IAS 39 some derivatives
may not qualify for hedge accounting, or are specifically not designated as a hedge where natural offset is more appropriate. Changes in the fair
value of any derivative instruments that do not qualify for hedge accounting are recognised in remeasurements within the income statement.
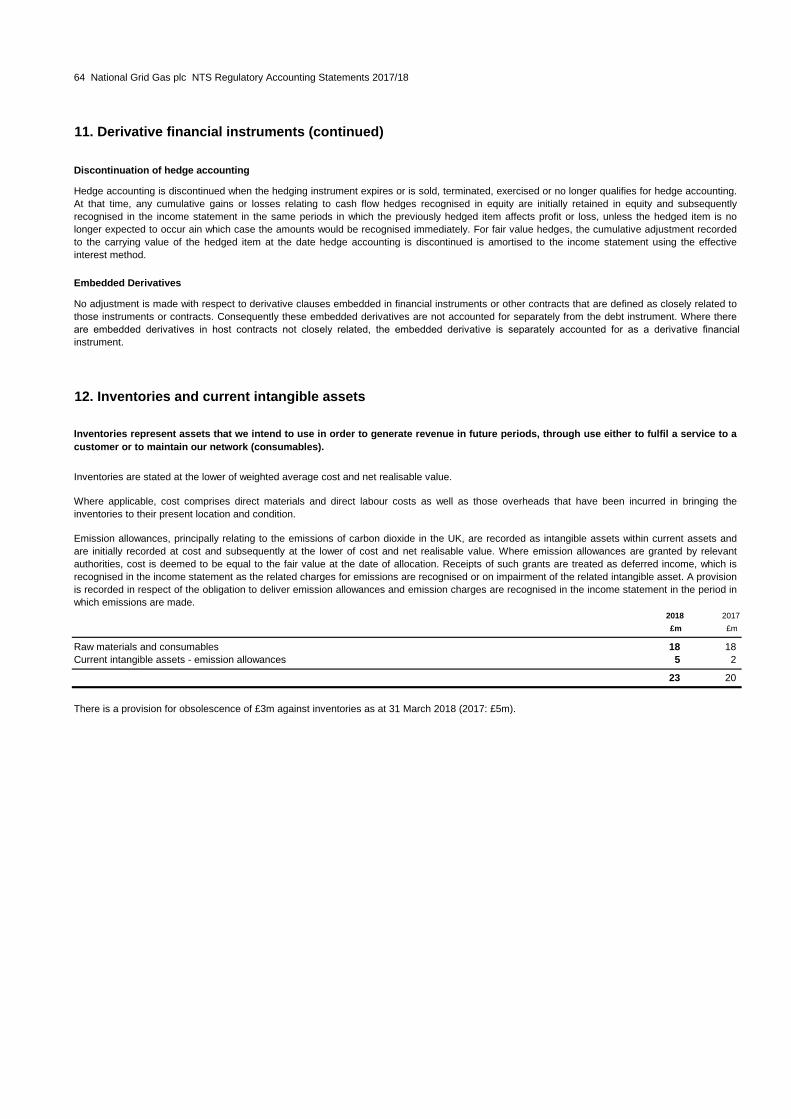
64 National Grid Gas plc NTS Regulatory Accounting Statements 2017/18
11. Derivative financial instruments (continued)
12. Inventories and current intangible assets
2018 2017
£m £m
Raw materials and consumables 18 18
Current intangible assets - emission allowances 5 2
23 20
There is a provision for obsolescence of £3m against inventories as at 31 March 2018 (2017: £5m).
Embedded Derivatives
No adjustment is made with respect to derivative clauses embedded in financial instruments or other contracts that are defined as closely related to
those instruments or contracts. Consequently these embedded derivatives are not accounted for separately from the debt instrument. Where there
are embedded derivatives in host contracts not closely related, the embedded derivative is separately accounted for as a derivative financial
instrument.
Inventories represent assets that we intend to use in order to generate revenue in future periods, through use either to fulfil a service to a
customer or to maintain our network (consumables).
Inventories are stated at the lower of weighted average cost and net realisable value.
Where applicable, cost comprises direct materials and direct labour costs as well as those overheads that have been incurred in bringing the
inventories to their present location and condition.
Emission allowances, principally relating to the emissions of carbon dioxide in the UK, are recorded as intangible assets within current assets and
are initially recorded at cost and subsequently at the lower of cost and net realisable value. Where emission allowances are granted by relevant
authorities, cost is deemed to be equal to the fair value at the date of allocation. Receipts of such grants are treated as deferred income, which is
recognised in the income statement as the related charges for emissions are recognised or on impairment of the related intangible asset. A provision
is recorded in respect of the obligation to deliver emission allowances and emission charges are recognised in the income statement in the period in
which emissions are made.
Discontinuation of hedge accounting
Hedge accounting is discontinued when the hedging instrument expires or is sold, terminated, exercised or no longer qualifies for hedge accounting.
At that time, any cumulative gains or losses relating to cash flow hedges recognised in equity are initially retained in equity and subsequently
recognised in the income statement in the same periods in which the previously hedged item affects profit or loss, unless the hedged item is no
longer expected to occur ain which case the amounts would be recognised immediately. For fair value hedges, the cumulative adjustment recorded
to the carrying value of the hedged item at the date hedge accounting is discontinued is amortised to the income statement using the effective
interest method.
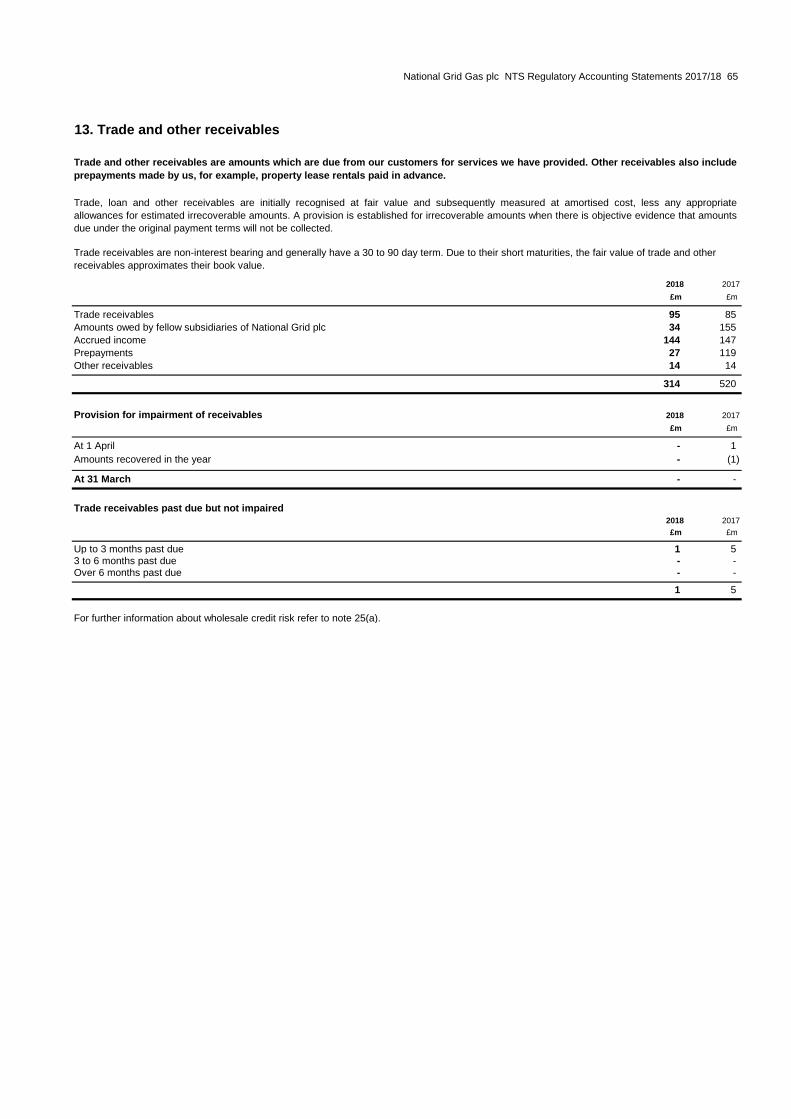
National Grid Gas plc NTS Regulatory Accounting Statements 2017/18 65
13. Trade and other receivables
2018 2017
£m £m
Trade receivables 95 85
Amounts owed by fellow subsidiaries of National Grid plc 34 155
Accrued income 144 147
Prepayments 27 119
Other receivables 14 14
314 520
Provision for impairment of receivables 2018 2017
£m £m
At 1 April - 1
Amounts recovered in the year - (1)
At 31 March - -
Trade receivables past due but not impaired2018 2017
£m £m
Up to 3 months past due 1 53 to 6 months past due - -Over 6 months past due - -
1 5
For further information about wholesale credit risk refer to note 25(a).
Trade and other receivables are amounts which are due from our customers for services we have provided. Other receivables also include
prepayments made by us, for example, property lease rentals paid in advance.
Trade, loan and other receivables are initially recognised at fair value and subsequently measured at amortised cost, less any appropriate
allowances for estimated irrecoverable amounts. A provision is established for irrecoverable amounts when there is objective evidence that amounts
due under the original payment terms will not be collected.
Trade receivables are non-interest bearing and generally have a 30 to 90 day term. Due to their short maturities, the fair value of trade and other
receivables approximates their book value.
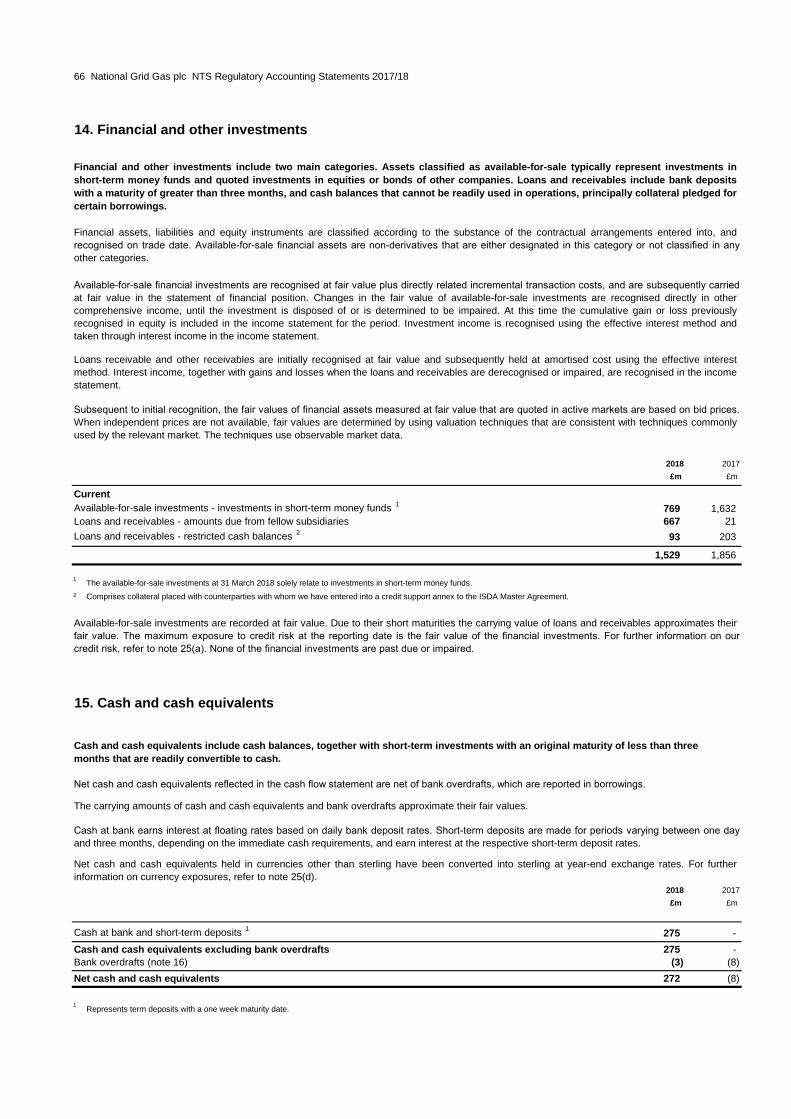
66 National Grid Gas plc NTS Regulatory Accounting Statements 2017/18
14. Financial and other investments
2018 2017
£m £m
Current
Available-for-sale investments - investments in short-term money funds 1769 1,632
Loans and receivables - amounts due from fellow subsidiaries 667 21
Loans and receivables - restricted cash balances 293 203
1,529 1,856
1
2
15. Cash and cash equivalents
2018 2017
£m £m
Cash at bank and short-term deposits 1275 -
Cash and cash equivalents excluding bank overdrafts 275 -
Bank overdrafts (note 16) (3) (8)
Net cash and cash equivalents 272 (8)
1
Loans receivable and other receivables are initially recognised at fair value and subsequently held at amortised cost using the effective interest
method. Interest income, together with gains and losses when the loans and receivables are derecognised or impaired, are recognised in the income
statement.
Subsequent to initial recognition, the fair values of financial assets measured at fair value that are quoted in active markets are based on bid prices.
When independent prices are not available, fair values are determined by using valuation techniques that are consistent with techniques commonly
used by the relevant market. The techniques use observable market data.
The available-for-sale investments at 31 March 2018 solely relate to investments in short-term money funds.
Comprises collateral placed with counterparties with whom we have entered into a credit support annex to the ISDA Master Agreement.
Available-for-sale investments are recorded at fair value. Due to their short maturities the carrying value of loans and receivables approximates their
fair value. The maximum exposure to credit risk at the reporting date is the fair value of the financial investments. For further information on our
credit risk, refer to note 25(a). None of the financial investments are past due or impaired.
Financial and other investments include two main categories. Assets classified as available-for-sale typically represent investments in
short-term money funds and quoted investments in equities or bonds of other companies. Loans and receivables include bank deposits
with a maturity of greater than three months, and cash balances that cannot be readily used in operations, principally collateral pledged for
certain borrowings.
Financial assets, liabilities and equity instruments are classified according to the substance of the contractual arrangements entered into, and
recognised on trade date. Available-for-sale financial assets are non-derivatives that are either designated in this category or not classified in any
other categories.
Available-for-sale financial investments are recognised at fair value plus directly related incremental transaction costs, and are subsequently carried
at fair value in the statement of financial position. Changes in the fair value of available-for-sale investments are recognised directly in other
comprehensive income, until the investment is disposed of or is determined to be impaired. At this time the cumulative gain or loss previously
recognised in equity is included in the income statement for the period. Investment income is recognised using the effective interest method and
taken through interest income in the income statement.
Cash and cash equivalents include cash balances, together with short-term investments with an original maturity of less than three
months that are readily convertible to cash.
Net cash and cash equivalents reflected in the cash flow statement are net of bank overdrafts, which are reported in borrowings.
The carrying amounts of cash and cash equivalents and bank overdrafts approximate their fair values.
Cash at bank earns interest at floating rates based on daily bank deposit rates. Short-term deposits are made for periods varying between one day
and three months, depending on the immediate cash requirements, and earn interest at the respective short-term deposit rates.
Net cash and cash equivalents held in currencies other than sterling have been converted into sterling at year-end exchange rates. For further
information on currency exposures, refer to note 25(d).
Represents term deposits with a one week maturity date.
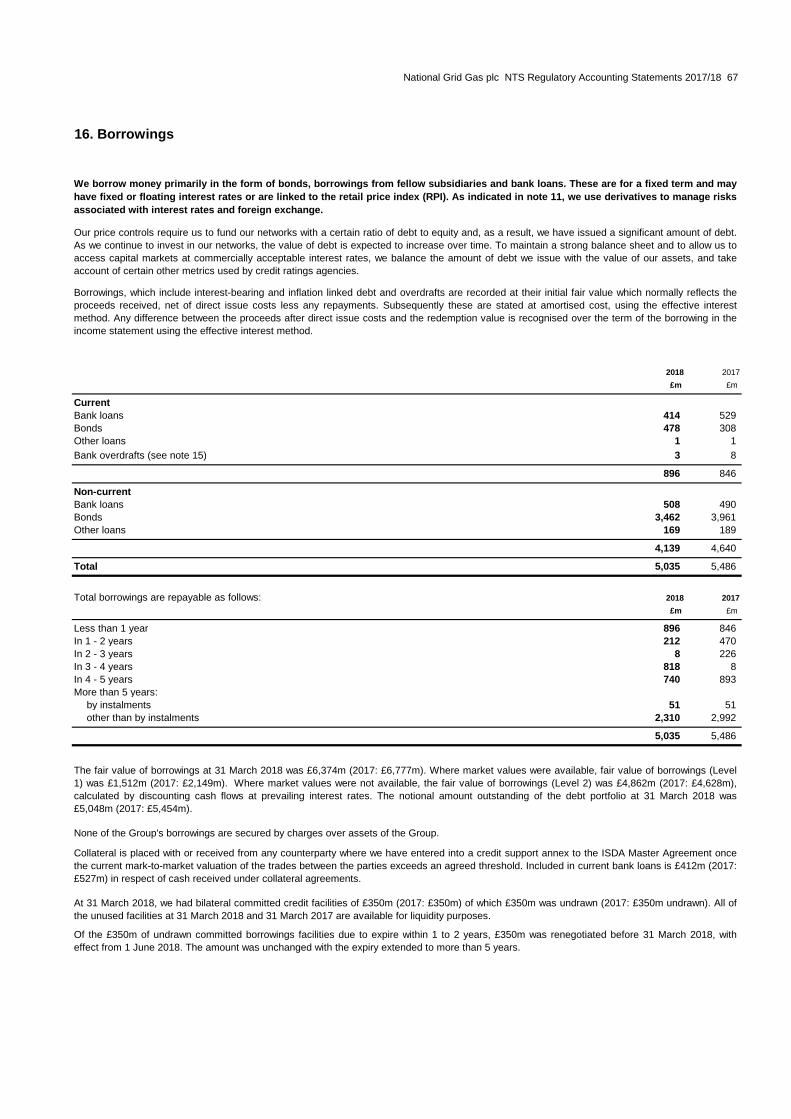
National Grid Gas plc NTS Regulatory Accounting Statements 2017/18 67
16. Borrowings
2018 2017
£m £m
Current
Bank loans 414 529
Bonds 478 308
Other loans 1 1
Bank overdrafts (see note 15) 3 8
896 846
Non-current
Bank loans 508 490
Bonds 3,462 3,961
Other loans 169 189
4,139 4,640
Total 5,035 5,486
Total borrowings are repayable as follows: 2018 2017
£m £m
Less than 1 year 896 846
In 1 - 2 years 212 470
In 2 - 3 years 8 226
In 3 - 4 years 818 8
In 4 - 5 years 740 893
More than 5 years:
by instalments 51 51
other than by instalments 2,310 2,992
5,035 5,486
We borrow money primarily in the form of bonds, borrowings from fellow subsidiaries and bank loans. These are for a fixed term and may
have fixed or floating interest rates or are linked to the retail price index (RPI). As indicated in note 11, we use derivatives to manage risks
associated with interest rates and foreign exchange.
Our price controls require us to fund our networks with a certain ratio of debt to equity and, as a result, we have issued a significant amount of debt.
As we continue to invest in our networks, the value of debt is expected to increase over time. To maintain a strong balance sheet and to allow us to
access capital markets at commercially acceptable interest rates, we balance the amount of debt we issue with the value of our assets, and take
account of certain other metrics used by credit ratings agencies.
Borrowings, which include interest-bearing and inflation linked debt and overdrafts are recorded at their initial fair value which normally reflects the
proceeds received, net of direct issue costs less any repayments. Subsequently these are stated at amortised cost, using the effective interest
method. Any difference between the proceeds after direct issue costs and the redemption value is recognised over the term of the borrowing in the
income statement using the effective interest method.
The fair value of borrowings at 31 March 2018 was £6,374m (2017: £6,777m). Where market values were available, fair value of borrowings (Level
1) was £1,512m (2017: £2,149m). Where market values were not available, the fair value of borrowings (Level 2) was £4,862m (2017: £4,628m),
calculated by discounting cash flows at prevailing interest rates. The notional amount outstanding of the debt portfolio at 31 March 2018 was
£5,048m (2017: £5,454m).
None of the Group's borrowings are secured by charges over assets of the Group.
Collateral is placed with or received from any counterparty where we have entered into a credit support annex to the ISDA Master Agreement once
the current mark-to-market valuation of the trades between the parties exceeds an agreed threshold. Included in current bank loans is £412m (2017:
£527m) in respect of cash received under collateral agreements.
At 31 March 2018, we had bilateral committed credit facilities of £350m (2017: £350m) of which £350m was undrawn (2017: £350m undrawn). All of
the unused facilities at 31 March 2018 and 31 March 2017 are available for liquidity purposes.
Of the £350m of undrawn committed borrowings facilities due to expire within 1 to 2 years, £350m was renegotiated before 31 March 2018, with
effect from 1 June 2018. The amount was unchanged with the expiry extended to more than 5 years.

68 National Grid Gas plc NTS Regulatory Accounting Statements 2017/18
17. Trade and other payables
2018 2017
£m £m
Trade payables 228 240
Amounts owed to fellow subsidiaries of National Grid plc 265 237
Deferred income 30 20
Social security and other taxes 55 68
Other payables 54 49
632 614
18. Other non-current liabilities
2018 2017
£m £m
Trade payables 6 -
Deferred income 33 177
Other payables 138 12
177 189
Other non-current liabilities include deferred income which will not be recognised as income until after 31 March 2018. It also includes
payables that are not due until after that date.
All other non-current liabilities are recorded at amortised cost. There is no material difference between the fair value and the carrying value of other
non-current liabilities.
Trade and other payables includes amounts owed to suppliers, tax authorities and other parties which are due to be settled within 12
months. The total also includes deferred income, which represents monies received from customers but for which we have not yet
delivered the associated service. These amounts are recognised as revenue when the service is provided.
Trade payables are initially recognised at fair value and subsequently measured at amortised cost. Due to their short maturities, the fair value of
trade and other payables approximates their book value.
National Grid Gas plc NTS Regulatory Accounting Statements 2017/18 69
19. Pensions and other post-employment benefit obligations
Risks
We have employees who are members of the National Grid UK Pension Scheme (Section B) which is a defined benefit scheme closed to
new entrants. Membership of the National Grid YouPlan (YouPlan) defined contribution trust is offered to all new employees. YouPlan was
launched in 2013 and under the rules of the plan, National Grid double matches contributions to YouPlan up to a maximum of 6% of
employee salary. YouPlan is the qualifying scheme used for automatic enrolment and new hires are enroled into YouPlan.
The fair value of defined benefit scheme assets and present value of defined benefit obligations are updated annually in accordance with
IAS 19 (revised).
During the year ended 31 March 2017, in order for the Gas Distribution business to be sold externally, the National Grid UK Pension Scheme was
split into three sections. Pension benefits for National Grid Gas plc are included with section B. This has resulted in a change in National Grid Gas
from recognising a pension charge for the year and recognising the scheme as if it were a defined contribution scheme to recognising a net pension
asset on the statement of financial position and accounting as a defined benefit scheme.
Below we provide a more detailed analysis of the amounts recorded in the primary financial statements.
Remeasurements of net retirement obligations are recognised in full in the period in which they occur in the statement of other comprehensive
income.
The defined benefit pension obligations are exposed to the primary risks outlined below.
Liabilities are calculated using discount rates set with reference to yields on high-quality corporate bonds prevailing in the US and UK debt markets
and will fluctuate as yields change. Scheme funds are invested in a variety of asset classes, principally: equities, government securities, corporate
bonds and property. Consequently, actual returns will differ from the underlying discount rate adopted and therefore have an impact on the net
balance sheet liability.
Changes in inflation will affect both current and future pension payments and are partially mitigated through investment in inflation matching assets
and hedging instruments.
Longevity is also a key driver of liabilities and changes in expected mortality will have a direct impact on liabilities. The liabilities are, in aggregate,
relatively mature which serves to mitigate this risk to some extent.
For the defined contribution plan (DC), the Group pays contributions into a separate fund on behalf of the employee and has no further obligations to
employees. The risks associated with this type of plan are assumed by the member.
For the defined benefit retirement scheme, members receive benefits on retirement, the value of which is dependent on factors such as salary and
length of pensionable service. The Group underwrites both financial and demographic risks associated with this type of scheme.
The cost of providing benefits in a defined benefit scheme is determined using the projected unit method, with actuarial valuations being carried out
at each reporting date by a qualified actuary. This valuation method is an accrued benefits valuation method that makes allowance for projected
earnings.
The Group’s obligation in respect of the defined benefit pension scheme is calculated separately by projecting the estimated amount of future benefit
payments that employees have earned for their pensionable service in the current and prior periods. These future benefit payments are discounted
to determine the present value of the liabilities and the fair value of plan assets and any unrecognised past service cost is then deducted. The
discount rate used is the yield at the valuation date on high-quality corporate bonds.
The Group takes advice from an independent actuary relating to the appropriateness of any key assumptions applied which include life expectancy of
members, expected salary and pension increases, and inflation. It should be noted that comparatively small changes in the assumptions used may
have a significant effect on the amounts recognised in the income statement and the statement of other comprehensive income and the net liability
recognised in the statement of financial position.
The scheme's investment strategy seeks to balance the level of investment return sought with the aim of reducing volatility and risk. In undertaking
this approach reference is made both to the maturity of the liabilities and the funding level. A number of further strategies are employed to manage
underlying risks, including liability matching asset strategies, diversification of asset portfolios, interest rate hedging and active management of
foreign exchange exposure.
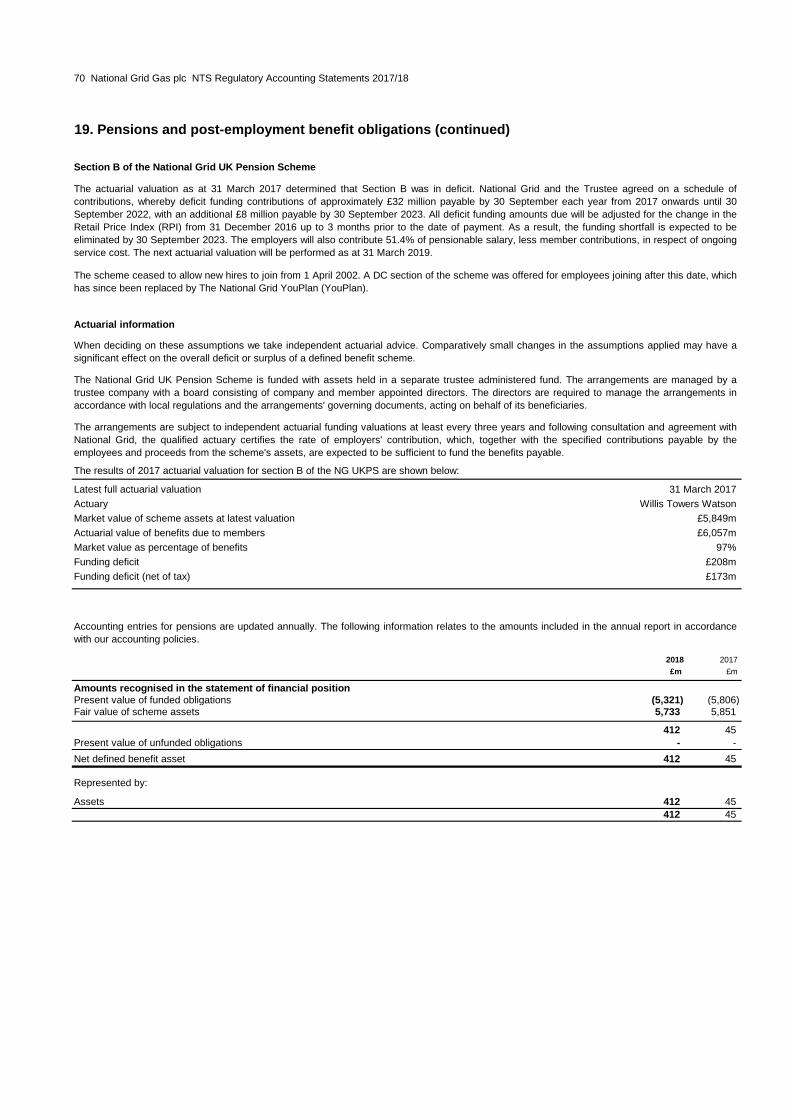
70 National Grid Gas plc NTS Regulatory Accounting Statements 2017/18
19. Pensions and post-employment benefit obligations (continued)
Section B of the National Grid UK Pension Scheme
Actuarial information
Latest full actuarial valuation 31 March 2017
Actuary Willis Towers Watson
Market value of scheme assets at latest valuation £5,849m
Actuarial value of benefits due to members £6,057m
Market value as percentage of benefits 97%
Funding deficit £208m
Funding deficit (net of tax) £173m
2018 2017
£m £m
Amounts recognised in the statement of financial positionPresent value of funded obligations (5,321) (5,806)Fair value of scheme assets 5,733 5,851
412 45
Present value of unfunded obligations - -
Net defined benefit asset 412 45
Represented by:
Assets 412 45
412 45
The National Grid UK Pension Scheme is funded with assets held in a separate trustee administered fund. The arrangements are managed by a
trustee company with a board consisting of company and member appointed directors. The directors are required to manage the arrangements in
accordance with local regulations and the arrangements' governing documents, acting on behalf of its beneficiaries.
The arrangements are subject to independent actuarial funding valuations at least every three years and following consultation and agreement with
National Grid, the qualified actuary certifies the rate of employers' contribution, which, together with the specified contributions payable by the
employees and proceeds from the scheme's assets, are expected to be sufficient to fund the benefits payable.
The results of 2017 actuarial valuation for section B of the NG UKPS are shown below:
Accounting entries for pensions are updated annually. The following information relates to the amounts included in the annual report in accordance
with our accounting policies.
The actuarial valuation as at 31 March 2017 determined that Section B was in deficit. National Grid and the Trustee agreed on a schedule of
contributions, whereby deficit funding contributions of approximately £32 million payable by 30 September each year from 2017 onwards until 30
September 2022, with an additional £8 million payable by 30 September 2023. All deficit funding amounts due will be adjusted for the change in the
Retail Price Index (RPI) from 31 December 2016 up to 3 months prior to the date of payment. As a result, the funding shortfall is expected to be
eliminated by 30 September 2023. The employers will also contribute 51.4% of pensionable salary, less member contributions, in respect of ongoing
service cost. The next actuarial valuation will be performed as at 31 March 2019.
The scheme ceased to allow new hires to join from 1 April 2002. A DC section of the scheme was offered for employees joining after this date, which
has since been replaced by The National Grid YouPlan (YouPlan).
When deciding on these assumptions we take independent actuarial advice. Comparatively small changes in the assumptions applied may have a
significant effect on the overall deficit or surplus of a defined benefit scheme.

National Grid Gas plc NTS Regulatory Accounting Statements 2017/18 71
19. Pensions and post-employment benefit obligations (continued)
2018 2017
Amounts recognised in the income statement and the statement of other comprehensive income £m £m
Included within operating costs
Administration costs 3 1
Included within payroll costs
Defined contribution scheme costs 10 14
Defined benefit scheme costs:
Current service cost 18 5
Special termination benefit cost - redundancies 5 1
33 20
Total of operating costs (defined benefit and defined contribution) 36 21
Included within finance income and costs
Interest (credit)/cost (1) 1
Total included in the income statement 35 22
Actuarial gain on defined benefit obligation in the period 336 51
Return on assets (less)/greater than discount rate (6) 83
Total included in the statement of other comprehensive income 330 134
Reconciliation of the net defined benefit asset
2018 2017
£m £m
Opening defined benefit asset/(liability) at 1 April 45 (89)
Net cost recognised in the income statement (25) (8)
Remeasurement effects recognised in the statement of other comprehensive income 330 134
Employer contributions 62 8
Closing net defined benefit asset at 31 March 412 45

72 National Grid Gas plc NTS Regulatory Accounting Statements 2017/18
19. Pensions and post-employment benefit obligations (continued)
2018 2017
£m £m
Changes in the present value of defined benefit obligations (including unfunded obligations)
Opening defined benefit obligations at 1 April (5,806) (5,878)
Defined benefit operating costs (26) (5)
Interest on defined benefit obligation (136) (37)
Remeasurement of the defined benefit obligations 336 51
Special termination benefit cost - redundancies - (1)
Administration costs 3 -
Benefits paid 218 64
Net transfers 90
Closing defined benefit obligations at 31 March (5,321) (5,806)
Changes in the fair value of scheme assets
Opening fair value of scheme assets at 1 April 5,851 5,789
Interest on assets 137 36
Return on assets (less)/greater than assumed (6) 83
Administration costs (3) (1)
Employer contributions 62 8
Benefits paid (218) (64)
Net transfers (90) -
Closing fair value of scheme assets at 31 March 5,733 5,851
Actual return on scheme assets 131 119
Expected contributions to defined benefit scheme in the following year 56 50
Asset allocations
2018 2018 2018 2017 2017 2017
Quoted Unquoted Total Quoted Unquoted Total£m £m £m £m £m £m
Equities 602 228 830 798 237 1,035
Corporate bonds 1,709 - 1,709 1,657 - 1,657
Government securities 2,418 - 2,418 2,389 - 2,389
Property - 339 339 - 294 294
Diversified alternatives 1- 329 329 - 299 299
Other - 108 108 - 177 177
4,729 1,004 5,733 4,844 1,007 5,851
1
Within the asset allocations below there is significant diversification across regions, asset managers, currencies and bond categories.
Includes return seeking non-conventional asset classes.

National Grid Gas plc NTS Regulatory Accounting Statements 2017/18 73
19. Pensions and post-employment benefit obligations (continued)
Target asset allocations
2018 2017
% %
Equities 14 18
Other 86 82
100 100
Actuarial assumptions
2018 2017
% %
Discount rate1 – past service22.60 2.40
Discount rate1 – future service22.65 2.65
Rate of increase in salaries33.40 3.50
Rate of increase in RPI – past service43.15 3.20
Rate of increase in RPI – future service43.10 3.15
1
2
3
4
For sensitivity analysis, see note 26.
Assumed life expectations for a retiree age 65. 2018 2017
years years
Today:
Males 22.3 22.8
Females 23.9 24.6
In 20 years:
Males 23.7 25.0
Females 25.5 26.8
In the UK, the 2017 discount rate was 2.4% p.a. for both accrued (past service) benefits and for accruing (future service) benefits based on an expected duration of scheme liabilities
of 17 years. For 2018, National Grid has adopted a different discount rate assumption by increasing the duration of scheme liabilities to 25 years for future service obligations. This has
led to a future service discount rate in the UK of 2.65% p.a. for both the 2017 and 2018 year-ends.
A promotional scale has also been used where appropriate. The UK assumption stated is that relating to service prior to 1 April 2013. The UK assumption for the rate of increase in
salaries for past service after this date is 2.20% (2017: 2.20%)and for future service 2.15% (2017: 2.20%). The rates of increase stated are not indicative of historical increases
awarded or a guarantee of future increases, but merely an appropriate assumption utilised in assessing DB liabilities.
This is the key assumption that determines assumed increases in pensions in payment and deferment in the UK only. Consistent with the derivation of the discount rate, the RPI
assumption reflects the duration of the active liabilities to be adopted in the calculation of the future service obligations. This approach leads to a RPI assumption for the future service
rate of 3.10% p.a. at reporting date (2017: 3.15%), as compared to the 2017 published assumption of 3.20% for both past service and future service.
National Grid UK (Section B) Pension Scheme’s investment strategy is formulated specifically in order to manage risk, through investment in
diversified asset classes, including the use of liability matching assets and where appropriate through the employment of interest rate and inflation
hedging instruments. The target asset allocation of the scheme as at 31 March 2018 is as follows:
The following financial assumptions have been applied in assessing defined benefit liabilities.
The discount rates for pension liabilities have been determined by reference to appropriate yields on high-quality corporate bonds prevailing in the UK debt markets at the reporting
date.

74 National Grid Gas plc NTS Regulatory Accounting Statements 2017/18
20. Provisions
Total
Decommissioning Environmental Restructuring Other provisions
£m £m £m £m
At 1 April 2016 47 64 18 53 182
Additions 107 3 1 138 249
Unused amounts reversed - (19) (1) (3) (23)
Unwinding of discount - 1 - - 1
Utilised (10) - (15) (3) (28)
Disposal as a result of discontinued operations (26) (27) - (41) (94)
At 31 March 2017 118 22 3 144 287
Additions - - 5 6 11
Reclassifications i- - - 34 34
Unused amounts reversed (11) - (3) (33) (47)
Unwinding of discount 1 1 - - 2
Utilised (4) - - (84) (88)
At 31 March 2018 104 23 5 67 199
1
2018 2017
£m £m
Current 70 133
Non-current 129 154
199 287
Decommissioning provision
We make provisions when an obligation exists, resulting from a past event and it is probable that cash will be paid to settle it, but the
amount of cash required can only be estimated.
The main estimates relate to environmental remediation and decommissioning costs for various sites we own or have owned and other
provisions.
Reclassification of £34m relates to an in year reclassification of the prior year Crop and Quarry accrual to provision.
The decommissioning provision represents expenditure relating to the demolition of gas and LNG storage facilities expected to be incurred until
2026. Unused amounts reversed of £11m represents the release of a provision for the demolition of LNG storage facilities.
During October 2016, following the sale of the Gas Distribution business, the company sold 78 surplus land sites to a number of fellow National Grid
Group undertakings, recognising a gain on disposal of £109m. A legal agreement was entered into with these National Grid Gas Group companies to
demolish the non-operational gas holders on these sites, creating a constructive obligation for the Company.
We are committed to the protection and enhancement of the environment. However, we have acquired, owned and operated a number of assets
which have, during the course of their operations, created an environmental impact. Therefore we have a provision that reflects the expected cost to
remediate these sites. Current operations will seldom result in new sites with significant expected costs being added to the provision.
Provisions are recognised where a legal or constructive obligation exists at the reporting date, as a result of a past event, where the amount of the
obligation can be reliably estimated and where the outflow of economic benefit is probable.
Provision is made for decommissioning and environmental costs, based on future estimated expenditures, discounted to present values. An initial
estimate of decommissioning and environmental costs attributable to property, plant and equipment is recorded as part of the original cost of the
related property, plant and equipment.
Changes in the provision arising from revised estimates or discount rates or changes in the expected timing of expenditures that relate to property,
plant and equipment are recorded as adjustments to their carrying value and depreciated prospectively over their remaining estimated useful
economic lives; otherwise such changes are recognised in the income statement.
The unwinding of the discount is included within the income statement as a financing charge.

National Grid Gas plc NTS Regulatory Accounting Statements 2017/18 75
20. Provisions (continued)
Environmental provision
Restructuring provision
Other provisions
21. Share capital
Number Number
of shares of shares
2018 2017 2018 2017
millions millions £m £m
At 31 March - ordinary shares of 12/15p each at3,944 3,944 45 45
The environmental provision represents the estimated restoration and remediation costs relating to old gas manufacturing sites owned by the
Company (discounted using a real rate of 1.0%). Cash flows are expected to be incurred between 2018 and 2075.
A number of uncertainties affect the calculation of the provision including the impact of regulation, the accuracy of the site surveys, unexpected
contaminants, transportation costs, the impact of alternative technologies and changes in the discount rate. The provision incorporates our best
estimate of the financial effect of these uncertainties, but future material changes in any of the assumptions could materially impact the calculation of
the provision. The undiscounted amount of the provision at 31 March 2018 was £28m (2017: £27m), being the undiscounted best estimate of the
liability having regard to these uncertainties.
The restructuring provision principally relates to business reorganisation costs in the UK and is expected to be incurred until 2019.
Other provisions at 31 March 2018 include £40m (2017: £134m) in respect of business set up costs and business restructuring costs. We expect the
majority of this provision to be utilised within one year. Unused amounts reversed of £33m principally represents amounts released from the crop
and quarry provision of £14m and amounts released in respect of business set up and restructuring costs of £17m. Amounts utilised of £84m
principally relates to the utilisation of provisions in respect of business set up and restructuring costs.
Ordinary share capital represents the total number of shares issued.
Share capital is accounted for as an equity instrument. An equity instrument is any contract that includes a residual interest in the consolidated
assets of the Company after deducting all its liabilities and is recorded at the proceeds received, net of direct issue costs, with an amount equal to
the nominal amount of the shares issued included in the share capital account and the balance recorded in the share premium account.
Allotted, called-up and fully paid
In line with the provisions of the Companies Act 2006, the Company amended its Articles of Association and ceased to have authorised share
capital.
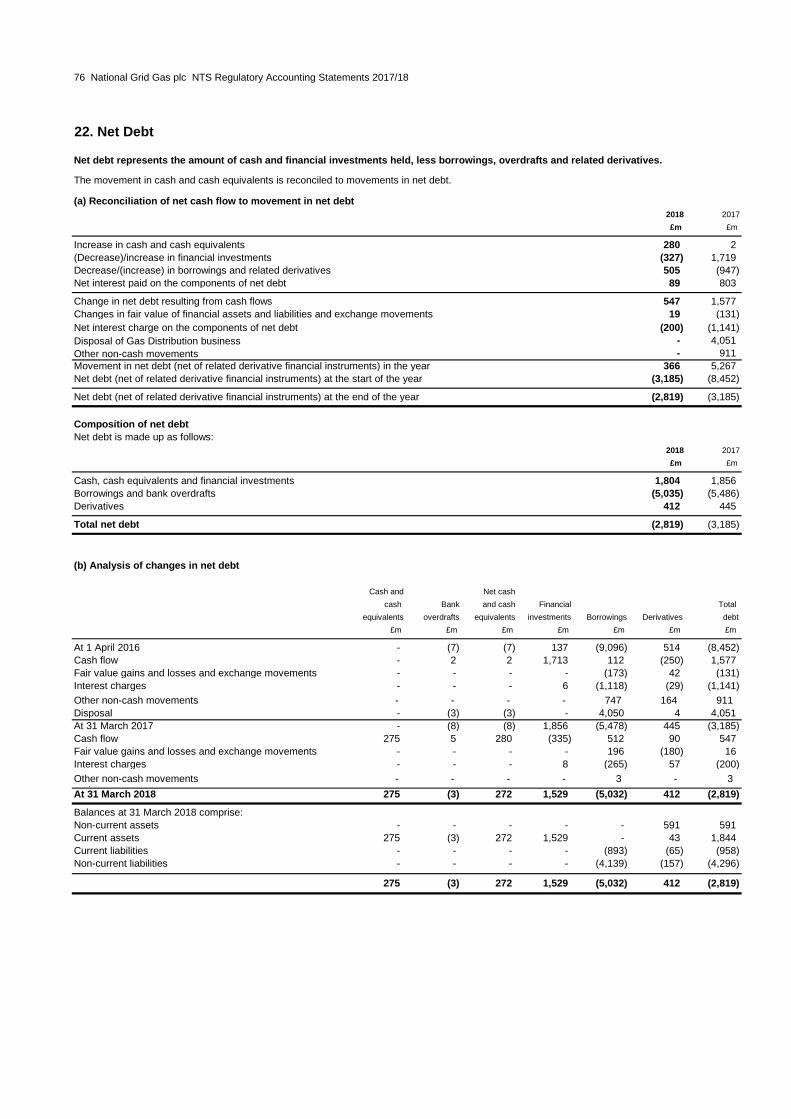
76 National Grid Gas plc NTS Regulatory Accounting Statements 2017/18
22. Net Debt
(a) Reconciliation of net cash flow to movement in net debt
2018 2017
£m £m
Increase in cash and cash equivalents 280 2
(Decrease)/increase in financial investments (327) 1,719
Decrease/(increase) in borrowings and related derivatives 505 (947)
Net interest paid on the components of net debt 89 803
Change in net debt resulting from cash flows 547 1,577
Changes in fair value of financial assets and liabilities and exchange movements 19 (131)
Net interest charge on the components of net debt (200) (1,141)
Disposal of Gas Distribution business - 4,051
Other non-cash movements - 911
Movement in net debt (net of related derivative financial instruments) in the year 366 5,267
Net debt (net of related derivative financial instruments) at the start of the year (3,185) (8,452)
Net debt (net of related derivative financial instruments) at the end of the year (2,819) (3,185)
Composition of net debt
Net debt is made up as follows:
2018 2017
£m £m
Cash, cash equivalents and financial investments 1,804 1,856
Borrowings and bank overdrafts (5,035) (5,486)
Derivatives 412 445
Total net debt (2,819) (3,185)
(b) Analysis of changes in net debt
Cash and Net cash
cash Bank and cash Financial Total
equivalents overdrafts equivalents investments Borrowings Derivatives debt
£m £m £m £m £m £m £m
At 1 April 2016 - (7) (7) 137 (9,096) 514 (8,452)
Cash flow - 2 2 1,713 112 (250) 1,577
Fair value gains and losses and exchange movements - - - - (173) 42 (131)
Interest charges - - - 6 (1,118) (29) (1,141)
Other non-cash movements - - - - 747 164 911
Disposal - (3) (3) - 4,050 4 4,051
At 31 March 2017 - (8) (8) 1,856 (5,478) 445 (3,185)
Cash flow 275 5 280 (335) 512 90 547
Fair value gains and losses and exchange movements - - - - 196 (180) 16
Interest charges - - - 8 (265) 57 (200)
Other non-cash movements - - - - 3 - 3Disposal - - - - - - -
At 31 March 2018 275 (3) 272 1,529 (5,032) 412 (2,819)
Balances at 31 March 2018 comprise:
Non-current assets - - - - - 591 591
Current assets 275 (3) 272 1,529 - 43 1,844
Current liabilities - - - - (893) (65) (958)
Non-current liabilities - - - - (4,139) (157) (4,296)
275 (3) 272 1,529 (5,032) 412 (2,819)
The movement in cash and cash equivalents is reconciled to movements in net debt.
Net debt represents the amount of cash and financial investments held, less borrowings, overdrafts and related derivatives.
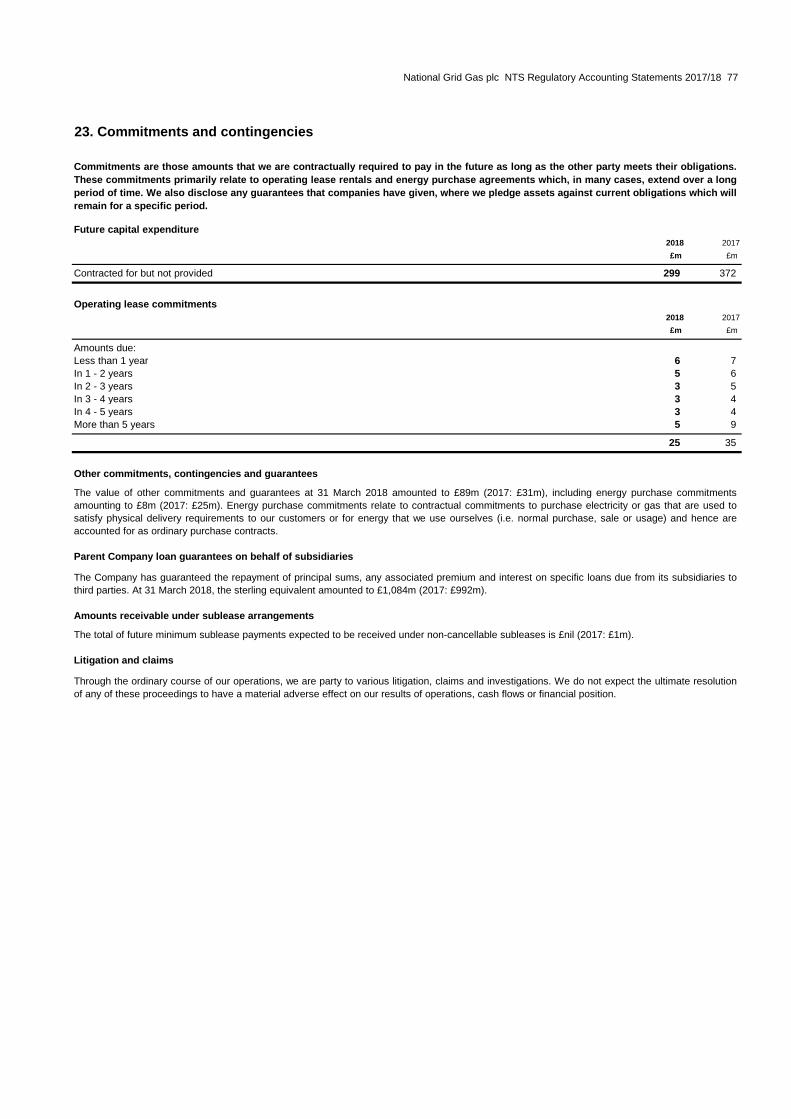
National Grid Gas plc NTS Regulatory Accounting Statements 2017/18 77
23. Commitments and contingencies
Future capital expenditure
2018 2017
£m £m
Contracted for but not provided 299 372
Operating lease commitments
2018 2017
£m £m
Amounts due:
Less than 1 year 6 7
In 1 - 2 years 5 6
In 2 - 3 years 3 5
In 3 - 4 years 3 4
In 4 - 5 years 3 4
More than 5 years 5 9
25 35
Other commitments, contingencies and guarantees
Parent Company loan guarantees on behalf of subsidiaries
Amounts receivable under sublease arrangements
The total of future minimum sublease payments expected to be received under non-cancellable subleases is £nil (2017: £1m).
Litigation and claims
Commitments are those amounts that we are contractually required to pay in the future as long as the other party meets their obligations.
These commitments primarily relate to operating lease rentals and energy purchase agreements which, in many cases, extend over a long
period of time. We also disclose any guarantees that companies have given, where we pledge assets against current obligations which will
remain for a specific period.
The value of other commitments and guarantees at 31 March 2018 amounted to £89m (2017: £31m), including energy purchase commitments
amounting to £8m (2017: £25m). Energy purchase commitments relate to contractual commitments to purchase electricity or gas that are used to
satisfy physical delivery requirements to our customers or for energy that we use ourselves (i.e. normal purchase, sale or usage) and hence are
accounted for as ordinary purchase contracts.
The Company has guaranteed the repayment of principal sums, any associated premium and interest on specific loans due from its subsidiaries to
third parties. At 31 March 2018, the sterling equivalent amounted to £1,084m (2017: £992m).
Through the ordinary course of our operations, we are party to various litigation, claims and investigations. We do not expect the ultimate resolution
of any of these proceedings to have a material adverse effect on our results of operations, cash flows or financial position.
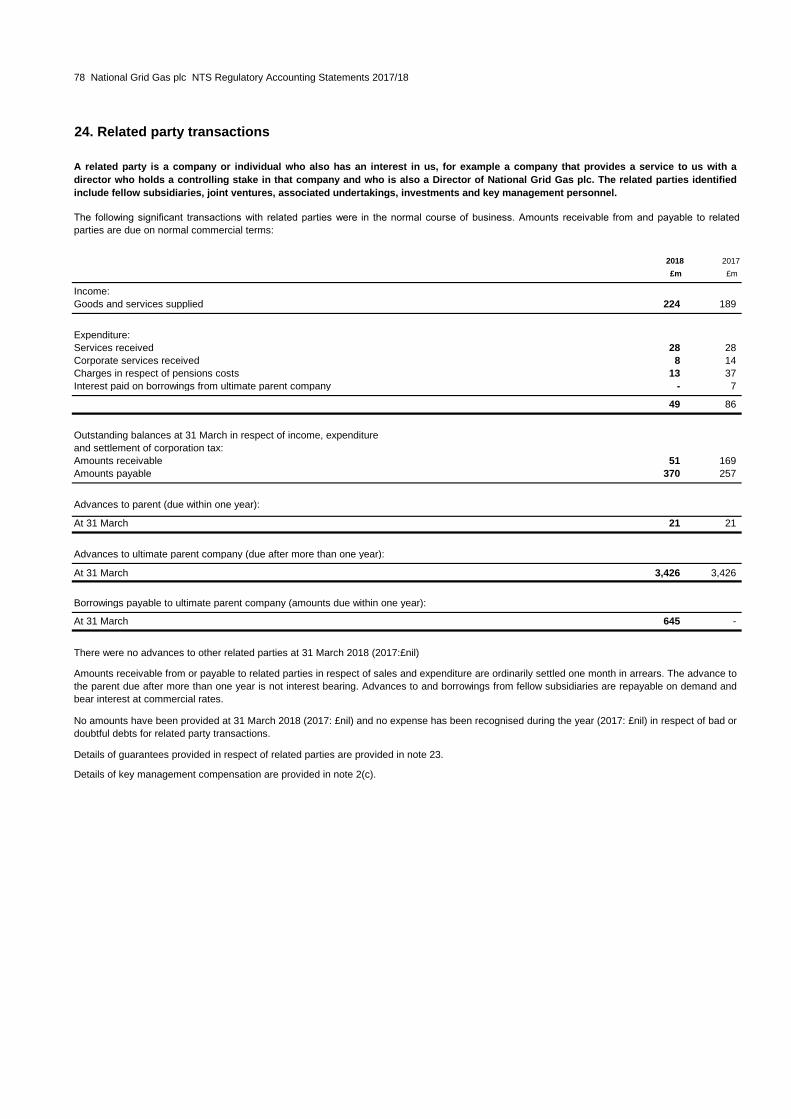
78 National Grid Gas plc NTS Regulatory Accounting Statements 2017/18
24. Related party transactions
2018 2017
£m £m
Income:
Goods and services supplied 224 189
Expenditure:
Services received 28 28
Corporate services received 8 14
Charges in respect of pensions costs 13 37
Interest paid on borrowings from ultimate parent company - 7
49 86
Outstanding balances at 31 March in respect of income, expenditure
and settlement of corporation tax:
Amounts receivable 51 169
Amounts payable 370 257
Advances to parent (due within one year):
At 31 March 21 21
Advances to ultimate parent company (due after more than one year):
At 31 March 3,426 3,426
Borrowings payable to ultimate parent company (amounts due within one year):
At 31 March 645 -
Details of key management compensation are provided in note 2(c).
A related party is a company or individual who also has an interest in us, for example a company that provides a service to us with a
director who holds a controlling stake in that company and who is also a Director of National Grid Gas plc. The related parties identified
include fellow subsidiaries, joint ventures, associated undertakings, investments and key management personnel.
The following significant transactions with related parties were in the normal course of business. Amounts receivable from and payable to related
parties are due on normal commercial terms:
There were no advances to other related parties at 31 March 2018 (2017:£nil)
Amounts receivable from or payable to related parties in respect of sales and expenditure are ordinarily settled one month in arrears. The advance to
the parent due after more than one year is not interest bearing. Advances to and borrowings from fellow subsidiaries are repayable on demand and
bear interest at commercial rates.
No amounts have been provided at 31 March 2018 (2017: £nil) and no expense has been recognised during the year (2017: £nil) in respect of bad or
doubtful debts for related party transactions.
Details of guarantees provided in respect of related parties are provided in note 23.

National Grid Gas plc NTS Regulatory Accounting Statements 2017/18 79
25. Financial risk management
We have exposure to the following risks, which are described in more detail below:
• credit risk;
• liquidity risk;
• interest rate risk;
• currency risk; and
• capital risk.
(a) Credit risk
Treasury credit risk
Customer credit risk
Offsetting financial assets and liabilities
Our activities expose us to a variety of financial risks including currency risk, interest rate risk, credit risk, capital risk and liquidity risk.
Our risk management programme focuses on the unpredictability of financial markets and seeks to minimise potential volatility of financial
performance from these risks. We use financial instruments, including derivative financial instruments, to manage risks of this type.
This note describes our approach to managing risk, including an analysis of assets and liabilities by currency type and an analysis of
interest rate category for our net debt. We are required by accounting standards to also include a number of specific disclosures, (such as
a maturity analysis of contractual undiscounted cash flows) and have included these requirements below.
Risk management related to financing activities is carried out by a central treasury department under policies approved by the Finance Committee of
the National Grid plc Board. The objective of the treasury department is to manage funding and liquidity requirements, including managing
associated financial risks, to within acceptable boundaries. The Finance Committee provides written principles for overall risk management, as well
as written policies covering specific areas such as foreign exchange risk, interest rate risk, credit risk, liquidity risk, use of derivative financial
instruments and non-derivative financial instruments, and investment of excess liquidity.
We are exposed to the risk of loss resulting from counterparties’ default on their commitments including failure to pay or make a delivery on a
contract. This risk is inherent in our commercial business activities. We are exposed to credit risk on our cash and cash equivalents, derivative
financial instruments, deposits with banks and financial institutions, as well as credit exposures to customers, including outstanding receivables and
committed transactions.
National Grid Gas has similar arrangements in relation to bank account balances and bank overdrafts; and trade payables and trade receivables
which are subject to general terms and conditions. However, these balances are immaterial.
Counterparty risk arises from the investment of surplus funds and from the use of derivative instruments. Our limits are managed by the central
treasury department of National Grid plc.
As at 31 March 2017 and 2018, we had a number of exposures to individual counterparties. In accordance with our treasury policies, counterparty
credit exposure utilisations are monitored daily against the counterparty credit limits. Counterparty credit ratings and market conditions are reviewed
continually with limits being revised and utilisation adjusted, if appropriate. Management does not expect any significant losses from non
performance by these counterparties.
Our principal commercial exposure is governed by the credit rules within the Uniform Network Code. These set out the level of credit relative to the
regulatory asset value (RAV) for each credit rating. Our credit policies and practices are designed to limit credit exposure by collecting security
deposits prior to providing utility services, or after utility service has commenced if certain applicable regulatory requirements are met. Collection
activities are managed on a daily basis. The utilisation of credit limits is regularly monitored and collateral is collected against these accounts when
necessary. Management does not expect any significant losses of receivables that have not been provided for as shown in note 13.
The following tables set out financial assets and liabilities which are subject to offset and to enforceable master netting arrangements or similar
agreements. The tables show the amounts which are offset and reported net in the statement of financial position. Amounts which cannot be offset
under IFRS, but which could be settled net under terms of master netting agreements if certain conditions arise, and with collateral received or
pledged, are shown to present National Grid Gas's net exposure.
Financial assets and liabilities on different transactions are only reported net if the transactions are with the same counterparty, a legal right of offset
exists and the cash flows are intended to be settled on a net basis.
Amounts which do not meet the criteria for offsetting on the statement of financial position but could be settled net in certain circumstances
principally relate to derivative transactions under ISDA (International Swaps and Derivatives Association) agreements where each party has the
option to settle amounts on a net basis in the event of default of the other party.

80 National Grid Gas plc NTS Regulatory Accounting Statements 2017/18
25. Financial risk management (continued)
Related amounts available
to be offset but not offset in
statement of financial position
Net amount
presented Cash
Gross Gross in statement collateral
carrying amounts of financial Financial received/
amounts offset position instruments pledged Net amount
As at 31 March 2018 £m £m £m £m £m £m
Assets
Derivative financial instruments 634 - 634 (95) (407) 132
634 - 634 (95) (407) 132
Liabilities
Derivative financial instruments (222) - (222) 95 87 (40)
(222) - (222) 95 87 (40)
Total 412 - 412 - (320) 92
Related amounts available
to be offset but not offset in
statement of financial position
Net amount
presented Cash
Gross Gross in statement collateral
carrying amounts of financial Financial received/
amounts offset position instruments pledged Net amount
As at 31 March 2017 £m £m £m £m £m £m
Assets
Derivative financial instruments 864 - 864 (157) (518) 189
864 - 864 (157) (518) 189
Liabilities
Derivative financial instruments (419) - (419) 157 201 (61)
(419) - (419) 157 201 (61)
Total 445 - 445 - (317) 128

National Grid Gas plc NTS Regulatory Accounting Statements 2017/18 81
25. Financial risk management (continued)
(b) Liquidity risk
Due Due Due
Due between between 3 years
within 1 and 2 2 and 3 and
1 year years years beyond Total
At 31 March 2018 £m £m £m £m £m
Non-derivative financial liabilities
Borrowings (857) (208) (8) (3,972) (5,045)
Interest payments on borrowings 1(104) (98) (89) (1,138) (1,429)
Other non-interest bearing liabilities (548) (144) - - (692)
Derivative financial liabilities
Derivative contracts - receipts 430 370 65 29 894
Derivative contract - payments (315) (50) (31) (128) (524)
Total at 31 March 2018 (1,394) (130) (63) (5,209) (6,796)
Due Due Due
Due between between 3 years
within 1 and 2 2 and 3 and
1 year years years beyond Total
At 31 March 2017 £m £m £m £m £m
Non-derivative financial liabilities
Borrowings (798) (464) (217) (3,975) (5,454)
Interest payments on borrowings 1(121) (106) (100) (1,247) (1,574)
Other non-interest bearing liabilities (289) (12) - - (301)
Derivative financial liabilities
Derivative contract - receipts 143 450 457 102 1,152
Derivative contract - payments (210) (308) (57) (164) (739)
Total at 31 March 2017 (1,275) (440) 83 (5,284) (6,916)
1
Our policy is to determine our liquidity requirements by the use of both short-term and long-term cash flow forecasts. These forecasts are
supplemented by a financial headroom analysis which is used to assess funding requirements for at least a 24 month period and maintain adequate
liquidity for a continuous 12 month period.
We believe our contractual obligations, including those shown in commitments and contingencies in note 23 can be met from existing cash and
investments, operating cash flows and internal or external financing that we reasonably expect to be able to secure in the future, together with the
use of committed facilities if required.
Our debt agreements and banking facilities contain covenants, including those relating to the periodic and timely provision of financial information by
the issuing entity, and financial covenants, such as maintaining current rating levels. Failure to comply with these covenants, or to obtain waivers of
those requirements, could in some cases trigger a right, at the lender’s discretion, to require repayment of some of our debt, and may restrict our
ability to draw upon our facilities to access the capital markets.
The following is an analysis of the contractual undiscounted cash flows payable under financial liabilities and derivative assets and liabilities as at the
reporting date:
The interest on borrowings is calculated based on borrowings held at 31 March without taking account of future issues. Floating rate interest is estimated using a forward interest rate
curve as at 31 March. Payments are included on the basis of the earliest date on which the Company can be required to settle.

82 National Grid Gas plc NTS Regulatory Accounting Statements 2017/18
25. Financial risk management (continued)
(c) Interest rate risk
2018
Fixed Floating
rate rate RPI Other 1Total
£m £m £m £m £m
Cash and cash equivalents - 275 - - 275
Financial investments - 1,508 - 21 1,529
Borrowings (1,453) (415) (3,167) - (5,035)
Pre-derivative position (1,453) 1,368 (3,167) 21 (3,231)
Derivative effect 982 (721) 151 - 412
Net debt (471) 647 (3,016) 21 (2,819)
2017
Fixed Floating
rate rate RPI Other 1Total
£m £m £m £m £m
Cash and cash equivalents - 1,835 - 21 1,856
Borrowings (1,891) (535) (3,060) - (5,486)
Pre-derivative position (1,891) 1,300 (3,060) 21 (3,630)
Derivative effect 1,549 (1,117) 13 - 445-342 183 -3047 21 -3185
Net debt (342) 183 (3,047) 21 (3,185)
1
During 2018 and 2017, net debt was managed using derivative instruments to hedge interest rate risk as follows:
Represents financial instruments which are not directly affected by interest rate risk, including investments in equity or other non-interest bearing instruments.
Interest rate risk arises from our long-term borrowings. Borrowings issued at variable rates expose us to cash flow interest rate risk, partially offset by
cash held at variable rates. Borrowings issued at fixed rates expose us to fair value interest rate risk.
Our interest rate risk management policy is to seek to minimise total financing costs (being interest costs and changes in the market value of debt)
subject to constraints. We do this by using fixed and floating rate debt and derivative financial instruments including interest rate swaps, swaptions
and forward rate agreements.
We hold some borrowings on issue that are inflation linked. We believe that these provide a partial economic offset to the inflation risk associated
with our UK inflation linked revenues.
The table in note 16 (borrowings) sets out the carrying amount, by contractual maturity, of borrowings that are exposed to interest rate risk before
taking into account interest rate swaps.

National Grid Gas plc NTS Regulatory Accounting Statements 2017/18 83
25. Financial risk management (continued)
(d) Currency risk
2018
Sterling Euro Dollar Other Total
£m £m £m £m £m
Cash and cash equivalents 275 - - - 275
Financial investments 1,529 - - - 1,529
Borrowings (3,714) (232) (790) (299) (5,035)
Pre-derivative position (1,910) (232) (790) (299) (3,231)
Derivative effect (874) 199 788 299 412
Net debt position (2,784) (33) (2) - (2,819)
2017
Sterling Euro Dollar Other Total
£m £m £m £m £m
Financial investments 1,856 - - - 1,856
Borrowings (4,015) (226) (906) (339) (5,486)
Pre-derivative position (2,159) (226) (906) (339) (3,630)
Derivative effect (995) 190 912 338 445
Net debt position (3,154) (36) 6 (1) (3,185)
25. Financial risk management (continued)
(e) Capital risk management
(f) Fair value analysis
Level 1 Level 2 Level 3 Total Level 1 Level 2 Level 3 Total
£m £m £m £m £m £m £m £m
Assets
Available-for-sale investments 769 - - 769 1,632 - - 1,632
Derivative financial instruments - 634 - 634 - 864 - 864
769 634 - 1,403 1,632 864 - 2,496
Liabilities
Derivative financial instruments - (141) (81) (222) - (206) (213) (419)
Total 769 493 (81) 1,181 1,632 658 (213) 2,077
We are exposed to foreign exchange risk arising from non-sterling future commercial transactions and non-sterling recognised assets and liabilities.
Our policy for managing foreign exchange risk is to hedge contractually committed foreign currency cash flows over a prescribed minimum size.
Where foreign currency cash forecasts are less certain, our policy is to hedge a proportion of the cash flows based on the probability of those cash
flows occurring. Instruments used to manage foreign exchange transaction risk include foreign exchange forward contracts and foreign exchange
swaps.
During 2018 and 2017, derivative financial instruments were used to manage foreign currency risk as follows:
There was no significant currency exposure on other financial instruments, including trade receivables and payables, and other receivables and
payables.
The capital structure of the Group consists of shareholders’ equity, as disclosed in the consolidated statement of changes in equity, and net debt
(note 22). Our objectives when managing capital are: to safeguard our ability to continue as a going concern, to remain within regulatory constraints
of our regulated operating company and to maintain an efficient mix of debt and equity funding thus achieving an optimal capital structure and cost of
capital. We regularly review and manage the capital structure as appropriate in order to achieve these objectives.
Maintaining appropriate credit ratings for our regulated company is an important aspect of our capital risk management strategy and balance sheet
efficiency. We monitor our balance sheet efficiency by regulatory asset value (RAV) gearing calculated as net debt expressed as a percentage of
RAV, which indicates the level of debt employed to fund our regulated business. It is compared with the level of RAV gearing indicated by Ofgem as
being appropriate for our business, at around 62.5 - 65%. The RAV gearing ratio at 31 March 2018 was 58% (2017: 55%).
Included in the statement of financial position are financial instruments which have been measured at fair value. These fair values can be
categorised into hierarchy levels that are representative of the inputs used in measuring the fair value. The best evidence of fair value is a quoted
price in an actively traded market. In the event that the market for a financial instrument is not active, a valuation technique is used.
2018 2017
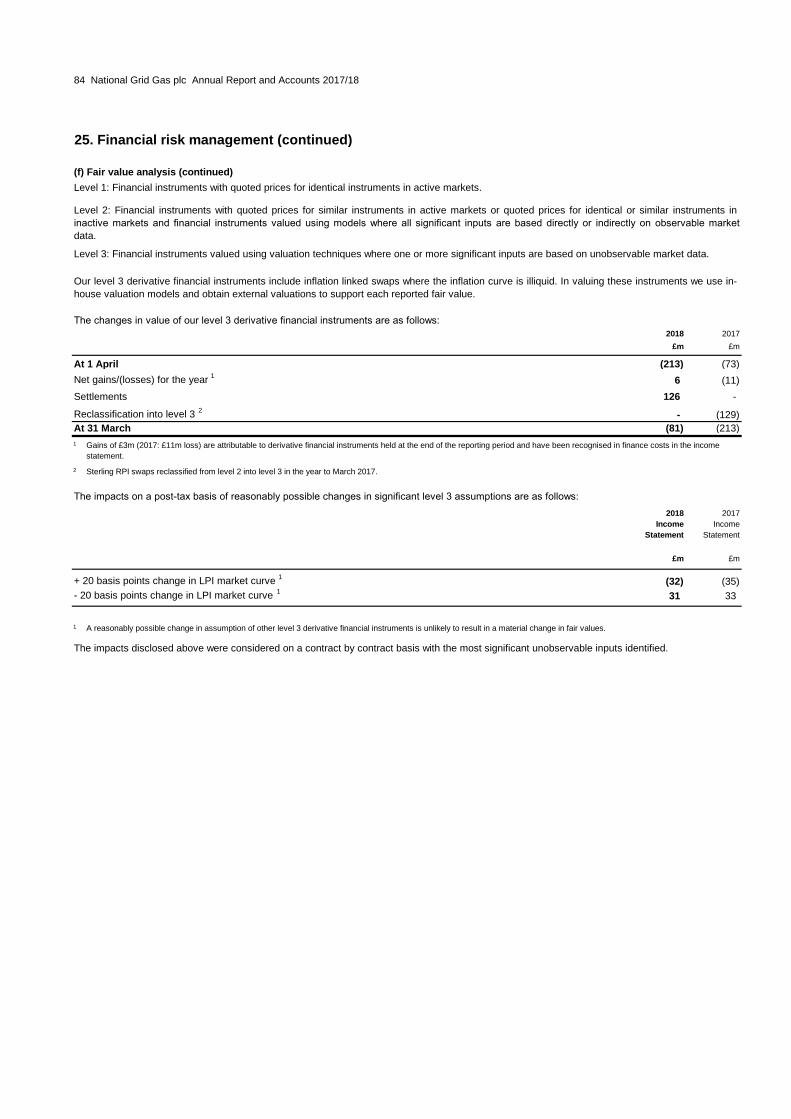
84 National Grid Gas plc Annual Report and Accounts 2017/18
25. Financial risk management (continued)
(f) Fair value analysis (continued)
2018 2017
£m £m
At 1 April (213) (73)
Net gains/(losses) for the year 16 (11)
Settlements 126 -
Reclassification into level 3 2- (129)
At 31 March (81) (213)
1
2
2018 2017
Income Income
Statement Statement
£m £m
+ 20 basis points change in LPI market curve 1(32) (35)
- 20 basis points change in LPI market curve 131 33
1 A reasonably possible change in assumption of other level 3 derivative financial instruments is unlikely to result in a material change in fair values.
Level 3: Financial instruments valued using valuation techniques where one or more significant inputs are based on unobservable market data.
Our level 3 derivative financial instruments include inflation linked swaps where the inflation curve is illiquid. In valuing these instruments we use in-
house valuation models and obtain external valuations to support each reported fair value.
The changes in value of our level 3 derivative financial instruments are as follows:
Gains of £3m (2017: £11m loss) are attributable to derivative financial instruments held at the end of the reporting period and have been recognised in finance costs in the income
statement.
Sterling RPI swaps reclassified from level 2 into level 3 in the year to March 2017.
The impacts on a post-tax basis of reasonably possible changes in significant level 3 assumptions are as follows:
Level 1: Financial instruments with quoted prices for identical instruments in active markets.
Level 2: Financial instruments with quoted prices for similar instruments in active markets or quoted prices for identical or similar instruments in
inactive markets and financial instruments valued using models where all significant inputs are based directly or indirectly on observable market
data.
The impacts disclosed above were considered on a contract by contract basis with the most significant unobservable inputs identified.
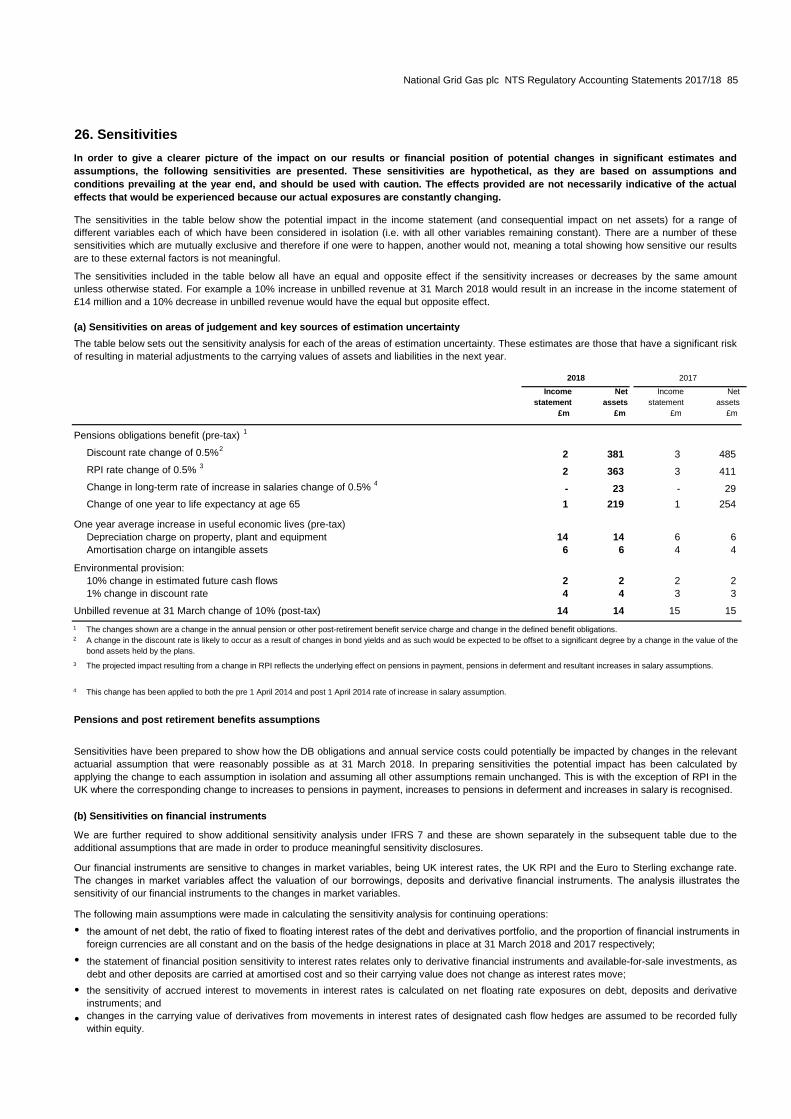
National Grid Gas plc NTS Regulatory Accounting Statements 2017/18 85
26. Sensitivities
(a) Sensitivities on areas of judgement and key sources of estimation uncertainty
Income Net Income Net
statement assets statement assets
£m £m £m £m
Pensions obligations benefit (pre-tax) 1
Discount rate change of 0.5%22 381 3 485
RPI rate change of 0.5% 32 363 3 411
Change in long-term rate of increase in salaries change of 0.5% 4- 23 - 29
Change of one year to life expectancy at age 65 1 219 1 254
One year average increase in useful economic lives (pre-tax)
Depreciation charge on property, plant and equipment 14 14 6 6
Amortisation charge on intangible assets 6 6 4 4
Environmental provision:
10% change in estimated future cash flows 2 2 2 2
1% change in discount rate 4 4 3 3
Unbilled revenue at 31 March change of 10% (post-tax) 14 14 15 15
1
2
3
4
Pensions and post retirement benefits assumptions
(b) Sensitivities on financial instruments
•
•
•
•
The table below sets out the sensitivity analysis for each of the areas of estimation uncertainty. These estimates are those that have a significant risk
of resulting in material adjustments to the carrying values of assets and liabilities in the next year.
2018 2017
The changes shown are a change in the annual pension or other post-retirement benefit service charge and change in the defined benefit obligations.
A change in the discount rate is likely to occur as a result of changes in bond yields and as such would be expected to be offset to a significant degree by a change in the value of the
bond assets held by the plans.
The projected impact resulting from a change in RPI reflects the underlying effect on pensions in payment, pensions in deferment and resultant increases in salary assumptions.
In order to give a clearer picture of the impact on our results or financial position of potential changes in significant estimates and
assumptions, the following sensitivities are presented. These sensitivities are hypothetical, as they are based on assumptions and
conditions prevailing at the year end, and should be used with caution. The effects provided are not necessarily indicative of the actual
effects that would be experienced because our actual exposures are constantly changing.
The sensitivities in the table below show the potential impact in the income statement (and consequential impact on net assets) for a range of
different variables each of which have been considered in isolation (i.e. with all other variables remaining constant). There are a number of these
sensitivities which are mutually exclusive and therefore if one were to happen, another would not, meaning a total showing how sensitive our results
are to these external factors is not meaningful.
The sensitivities included in the table below all have an equal and opposite effect if the sensitivity increases or decreases by the same amount
unless otherwise stated. For example a 10% increase in unbilled revenue at 31 March 2018 would result in an increase in the income statement of
£14 million and a 10% decrease in unbilled revenue would have the equal but opposite effect.
the statement of financial position sensitivity to interest rates relates only to derivative financial instruments and available-for-sale investments, as
debt and other deposits are carried at amortised cost and so their carrying value does not change as interest rates move;
the sensitivity of accrued interest to movements in interest rates is calculated on net floating rate exposures on debt, deposits and derivative
instruments; and
changes in the carrying value of derivatives from movements in interest rates of designated cash flow hedges are assumed to be recorded fully
within equity.
This change has been applied to both the pre 1 April 2014 and post 1 April 2014 rate of increase in salary assumption.
Sensitivities have been prepared to show how the DB obligations and annual service costs could potentially be impacted by changes in the relevant
actuarial assumption that were reasonably possible as at 31 March 2018. In preparing sensitivities the potential impact has been calculated by
applying the change to each assumption in isolation and assuming all other assumptions remain unchanged. This is with the exception of RPI in the
UK where the corresponding change to increases to pensions in payment, increases to pensions in deferment and increases in salary is recognised.
We are further required to show additional sensitivity analysis under IFRS 7 and these are shown separately in the subsequent table due to the
additional assumptions that are made in order to produce meaningful sensitivity disclosures.
Our financial instruments are sensitive to changes in market variables, being UK interest rates, the UK RPI and the Euro to Sterling exchange rate.
The changes in market variables affect the valuation of our borrowings, deposits and derivative financial instruments. The analysis illustrates the
sensitivity of our financial instruments to the changes in market variables.
The following main assumptions were made in calculating the sensitivity analysis for continuing operations:
the amount of net debt, the ratio of fixed to floating interest rates of the debt and derivatives portfolio, and the proportion of financial instruments in
foreign currencies are all constant and on the basis of the hedge designations in place at 31 March 2018 and 2017 respectively;

86 National Grid Gas plc NTS Regulatory Accounting Statements 2017/18
26. Sensitivities (continued)
(b) Sensitivities on financial instruments (continued)
Other Other
Income equity Income equity
statement reserves statement reserves
£m £m £m £m
Financial risk (post-tax)
UK RPI rate change of 0.5% 113 - 12 -
UK interest rate changes of 0.50% 1 2 3 3
Assets and liabilities carried at fair value (pre-tax)
Income Net Income Net
statement assets statement assets
£m £m £m £m
10% fair value change in derivative financial instruments 241 41 45 45
1
2
27. Ultimate parent company
28. Subsidiary undertakings, and joint ventures
Subsidiary undertakings
The list below contains all subsidiaries included within the National Grid Gas plc Group.
Principal activity Holding
British Transco Capital Inc. (incorporated in the US) Financing 100%
British Transco Finance Inc. (incorporated in the US) Financing 100%
British Transco Finance (No. 1) Limited (incorporated in the Cayman Islands) Financing 100%
British Transco Finance (No. 2) Limited (incorporated in the Cayman Islands) Financing 100%
British Transco International Finance BV (incorporated in the Netherlands) Financing 100%
National Grid Metering Limited (incorporated in England and Wales) Gas metering services 100%
Joint ventures
The list below contains all joint ventures included within the National Grid Gas plc Group.
Principal activity Holding
Joint Radio Company Limited (incorporated in England and Wales) Consultancy services 50%
Joint Radio Company Limited is based at 52 Dean Bradley House, Horseferry Road, London, SW1P 2AF.
2018 2017
National Grid Gas plc’s immediate parent company is National Grid Gas Holdings Limited. The ultimate parent company and controlling party is
National Grid plc. Both of these companies are incorporated in Great Britain and are registered in England and Wales. National Grid plc consolidates
the financial statements of National Grid Gas plc. Copies of the consolidated financial statements of National Grid plc may be obtained from the
Company Secretary, 1-3 Strand, London WC2N 5EH.
While we present consolidated results in these financial statements as if we were one company, our legal structure is such that there are a
number of different operating and holding companies that contribute to the overall result. Our structure has evolved through acquisitions
as well as regulatory requirements to have certain activities within separate legal entities.
2018 2017
Excludes sensitivities to LPI curve. Further details on sensitivities are provided in note 25(f).
The effect of a 10% change in fair value assumes no hedge accounting.
This note shows the immediate and ultimate parent companies for these consolidated financial statements.

National Grid Gas plc NTS Regulatory Accounting Statements 2017/18 87
AppendicesAppendix 1 – Supplementary analysis of the consolidatedfinancial statements by regulatory business
The schedules in this appendix provide a supplementary analysis of the primary financial statements by regulatory
business together with relevant supporting notes. This appendix should be read in conjunction with the
consolidated financial statements of the Company, set out on pages 43 to 86, which provide details in respect of
the Company in total not included in this appendix.
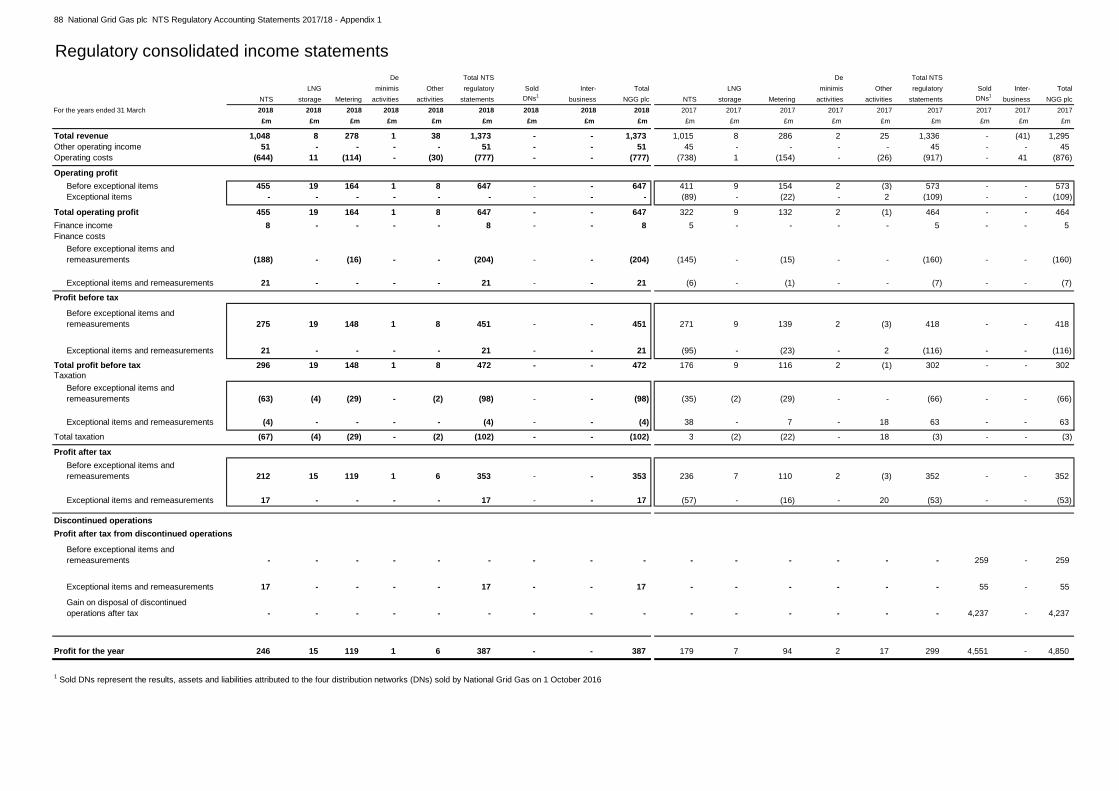
88 National Grid Gas plc NTS Regulatory Accounting Statements 2017/18 - Appendix 1
Regulatory consolidated income statements
De Total NTS De Total NTS
LNG minimis Other regulatory Sold Inter- Total LNG minimis Other regulatory Sold Inter- Total
NTS storage Metering activities activities statements DNs1business NGG plc NTS storage Metering activities activities statements DNs1
business NGG plc
For the years ended 31 March 2018 2018 2018 2018 2018 2018 2018 2018 2018 2017 2017 2017 2017 2017 2017 2017 2017 2017
£m £m £m £m £m £m £m £m £m £m £m £m £m £m £m £m £m £m
Total revenue 1,048 8 278 1 38 1,373 - - 1,373 1,015 8 286 2 25 1,336 - (41) 1,295
Other operating income 51 - - - - 51 - - 51 45 - - - - 45 - - 45
Operating costs (644) 11 (114) - (30) (777) - - (777) (738) 1 (154) - (26) (917) - 41 (876)
Operating profit
Before exceptional items 455 19 164 1 8 647 - - 647 411 9 154 2 (3) 573 - - 573
Exceptional items - - - - - - - - - (89) - (22) - 2 (109) - - (109)- -
Total operating profit 455 19 164 1 8 647 - - 647 322 9 132 2 (1) 464 - - 464
Finance income 8 - - - - 8 - - 8 5 - - - - 5 - - 5
Finance costs
(188) - (16) - - (204) - - (204) (145) - (15) - - (160) - - (160)
21 - - - - 21 - - 21 (6) - (1) - - (7) - - (7)
Profit before tax
275 19 148 1 8 451 - - 451 271 9 139 2 (3) 418 - - 418
21 - - - - 21 - - 21 (95) - (23) - 2 (116) - - (116)
Total profit before tax 296 19 148 1 8 472 - - 472 176 9 116 2 (1) 302 - - 302Taxation
(63) (4) (29) - (2) (98) - - (98) (35) (2) (29) - - (66) - - (66)
(4) - - - - (4) - - (4) 38 - 7 - 18 63 - - 63
Total taxation (67) (4) (29) - (2) (102) - - (102) 3 (2) (22) - 18 (3) - - (3)
Profit after tax
212 15 119 1 6 353 - - 353 236 7 110 2 (3) 352 - - 352
17 - - - - 17 - - 17 (57) - (16) - 20 (53) - - (53)
Discontinued operations
Profit after tax from discontinued operations
- - - - - - - - - - - - - - - 259 - 259
17 - - - - 17 - - 17 - - - - - - 55 - 55
- - - - - - - - - - - - - - - 4,237 - 4,237
Profit for the year 246 15 119 1 6 387 - - 387 179 7 94 2 17 299 4,551 - 4,850
1 Sold DNs represent the results, assets and liabilities attributed to the four distribution networks (DNs) sold by National Grid Gas on 1 October 2016
Before exceptional items and
remeasurements
Exceptional items and remeasurements
Before exceptional items and
remeasurements
Exceptional items and remeasurements
Before exceptional items and
remeasurements
Exceptional items and remeasurements
Before exceptional items and
remeasurements
Exceptional items and remeasurements
Before exceptional items and
remeasurements
Gain on disposal of discontinued
operations after tax
Exceptional items and remeasurements
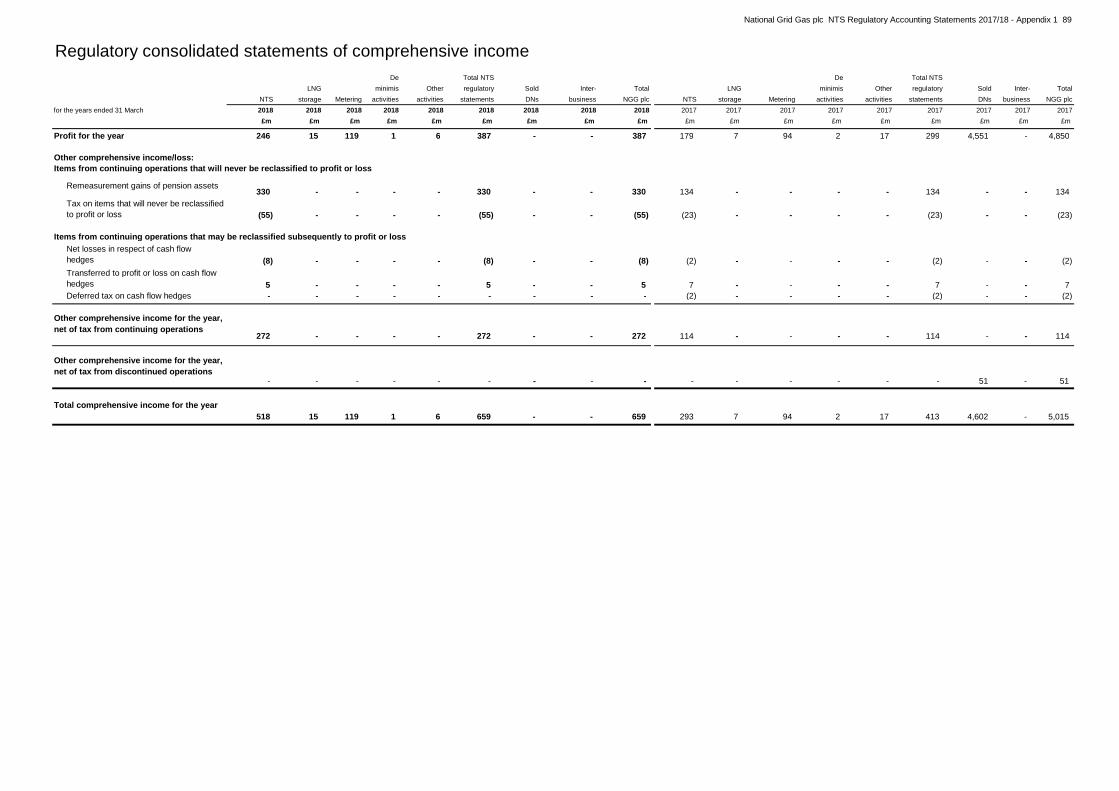
National Grid Gas plc NTS Regulatory Accounting Statements 2017/18 - Appendix 1 89
Regulatory consolidated statements of comprehensive income
De Total NTS De Total NTS
LNG minimis Other regulatory Sold Inter- Total LNG minimis Other regulatory Sold Inter- Total
NTS storage Metering activities activities statements DNs business NGG plc NTS storage Metering activities activities statements DNs business NGG plc
for the years ended 31 March 2018 2018 2018 2018 2018 2018 2018 2018 2018 2017 2017 2017 2017 2017 2017 2017 2017 2017
£m £m £m £m £m £m £m £m £m £m £m £m £m £m £m £m £m £m
Profit for the year 246 15 119 1 6 387 - - 387 179 7 94 2 17 299 4,551 - 4,850
Other comprehensive income/loss:
Items from continuing operations that will never be reclassified to profit or loss
330 - - - - 330 - - 330 134 - - - - 134 - - 134
(55) - - - - (55) - - (55) (23) - - - - (23) - - (23)
Items from continuing operations that may be reclassified subsequently to profit or loss
(8) - - - - (8) - - (8) (2) - - - - (2) - - (2)
5 - - - - 5 - - 5 7 - - - - 7 - - 7
Deferred tax on cash flow hedges - - - - - - - - - (2) - - - - (2) - - (2)
272 - - - - 272 - - 272 114 - - - - 114 - - 114
- - - - - - - - - - - - - - - 51 - 51
518 15 119 1 6 659 - - 659 293 7 94 2 17 413 4,602 - 5,015
Remeasurement gains of pension assets
Tax on items that will never be reclassified
to profit or loss
Other comprehensive income for the year,
net of tax from continuing operations
Other comprehensive income for the year,
net of tax from discontinued operations
Total comprehensive income for the year
Net losses in respect of cash flow
hedges
Transferred to profit or loss on cash flow
hedges
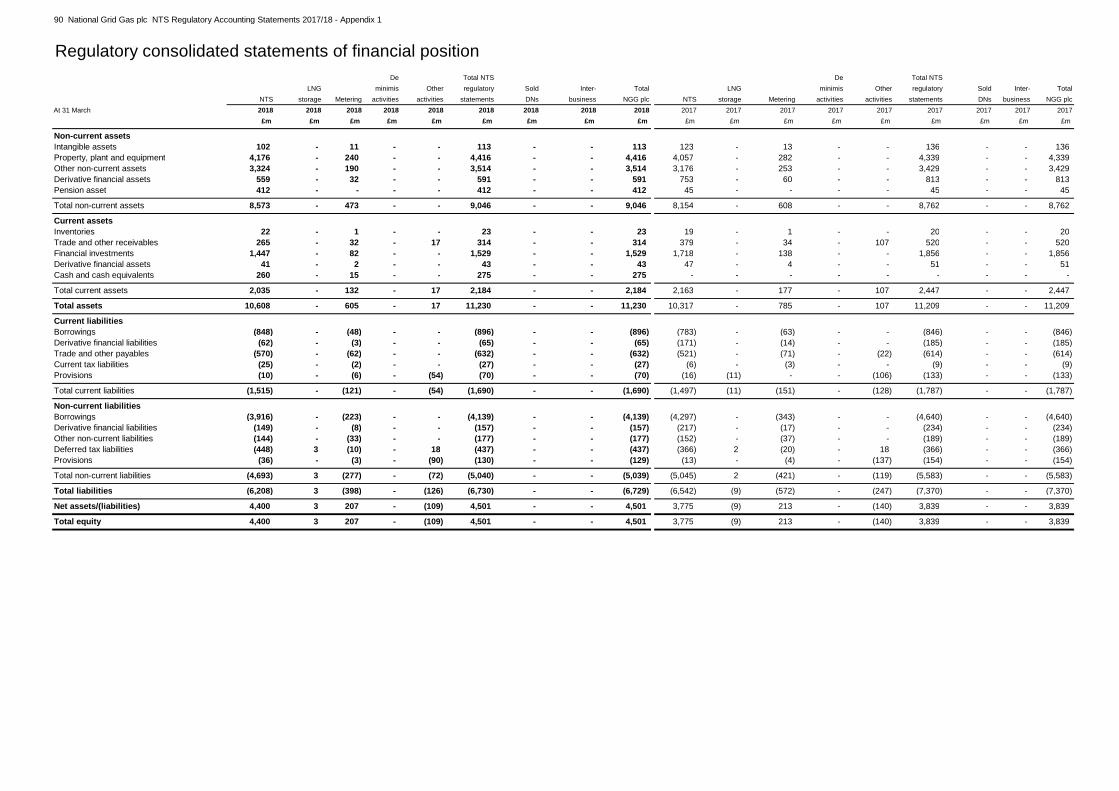
90 National Grid Gas plc NTS Regulatory Accounting Statements 2017/18 - Appendix 1
Regulatory consolidated statements of financial position
De Total NTS De Total NTS
LNG minimis Other regulatory Sold Inter- Total LNG minimis Other regulatory Sold Inter- Total
NTS storage Metering activities activities statements DNs business NGG plc NTS storage Metering activities activities statements DNs business NGG plc
At 31 March 2018 2018 2018 2018 2018 2018 2018 2018 2018 2017 2017 2017 2017 2017 2017 2017 2017 2017
£m £m £m £m £m £m £m £m £m £m £m £m £m £m £m £m £m £m
Non-current assets
Intangible assets 102 - 11 - - 113 - - 113 123 - 13 - - 136 - - 136
Property, plant and equipment 4,176 - 240 - - 4,416 - - 4,416 4,057 - 282 - - 4,339 - - 4,339
Other non-current assets 3,324 - 190 - - 3,514 - - 3,514 3,176 - 253 - - 3,429 - - 3,429
Derivative financial assets 559 - 32 - - 591 - - 591 753 - 60 - - 813 - - 813
Pension asset 412 - - - - 412 - - 412 45 - - - - 45 - - 45
Total non-current assets 8,573 - 473 - - 9,046 - - 9,046 8,154 - 608 - - 8,762 - - 8,762
Current assets
Inventories 22 - 1 - - 23 - - 23 19 - 1 - - 20 - - 20
Trade and other receivables 265 - 32 - 17 314 - - 314 379 - 34 - 107 520 - - 520
Financial investments 1,447 - 82 - - 1,529 - - 1,529 1,718 - 138 - - 1,856 - - 1,856
Derivative financial assets 41 - 2 - - 43 - - 43 47 - 4 - - 51 - - 51
Cash and cash equivalents 260 - 15 - - 275 - - 275 - - - - - - - - -
Total current assets 2,035 - 132 - 17 2,184 - - 2,184 2,163 - 177 - 107 2,447 - - 2,447
Total assets 10,608 - 605 - 17 11,230 - - 11,230 10,317 - 785 - 107 11,209 - - 11,209
Current liabilities
Borrowings (848) - (48) - - (896) - - (896) (783) - (63) - - (846) - - (846)
Derivative financial liabilities (62) - (3) - - (65) - - (65) (171) - (14) - - (185) - - (185)
Trade and other payables (570) - (62) - - (632) - - (632) (521) - (71) - (22) (614) - - (614)
Current tax liabilities (25) - (2) - - (27) - - (27) (6) - (3) - - (9) - - (9)
Provisions (10) - (6) - (54) (70) - - (70) (16) (11) - - (106) (133) - - (133)
Total current liabilities (1,515) - (121) - (54) (1,690) - - (1,690) (1,497) (11) (151) - (128) (1,787) - - (1,787)
Non-current liabilities
Borrowings (3,916) - (223) - - (4,139) - - (4,139) (4,297) - (343) - - (4,640) - - (4,640)
Derivative financial liabilities (149) - (8) - - (157) - - (157) (217) - (17) - - (234) - - (234)
Other non-current liabilities (144) - (33) - - (177) - - (177) (152) - (37) - - (189) - - (189)
Deferred tax liabilities (448) 3 (10) - 18 (437) - - (437) (366) 2 (20) - 18 (366) - - (366)
Provisions (36) - (3) - (90) (130) - - (129) (13) - (4) - (137) (154) - - (154)
Total non-current liabilities (4,693) 3 (277) - (72) (5,040) - - (5,039) (5,045) 2 (421) - (119) (5,583) - - (5,583)
Total liabilities (6,208) 3 (398) - (126) (6,730) - - (6,729) (6,542) (9) (572) - (247) (7,370) - - (7,370)
Net assets/(liabilities) 4,400 3 207 - (109) 4,501 - - 4,501 3,775 (9) 213 - (140) 3,839 - - 3,839
Total equity 4,400 3 207 - (109) 4,501 - - 4,501 3,775 (9) 213 - (140) 3,839 - - 3,839

National Grid Gas plc NTS Regulatory Accounting Statements 2017/18 - Appendix 1 91
Regulatory consolidated statements of changes in equity
De Total NTS
LNG minimis Other regulatory Sold Inter- Total
NTS storage Metering activities activities statements DNs business NGG plc
£m £m £m £m £m £m £m £m £m£m £m£m £m £m £m £m £m £m £m £m £m £m £m
At 1 April 2016 2,440 (13) 100 (6) 2,521 4,402 - 6,923
Profit for the year 179 7 94 2 17 299 4,551 - 4,850
Total other comprehensive loss for the year 114 - - - - 114 51 - 165
Total comprehensive income for the year 293 7 94 2 17 413 4,602 - 5,015
Equity dividends (523) (21) (258) (3) (50) (855) (7,245) - (8,100)
Other movements in non-controlling interests - - - - - - (5) - (5)
Share-based payments 4 - - - - 4 3 - 7
Tax on share-based payments (1) - - - - (1) - - (1)
Transfers (i) 1,562 18 277 1 (101) 1,757 (1,757) - -
At 31 March 2017 3,775 (9) 213 - (140) 3,839 - - 3,839
Profit for the year 246 15 119 1 6 387 - - 387
Total other comprehensive income for the year 272 - - - - 272 - - 272
Total comprehensive income for the year 518 15 119 1 6 659 - - 659
Share-based payments 3 - - - - 3 - - 3
Transfers (i) 104 (3) (125) (1) 25 - - - -
At 31 March 2018 4,400 3 207 - (109) 4,501 - - 4,501
(i) Transfers largely comprise the reallocation of funding between regulatory businesses and changes in the allocation of other assets and liabilities between regulatory businesses over the financial year
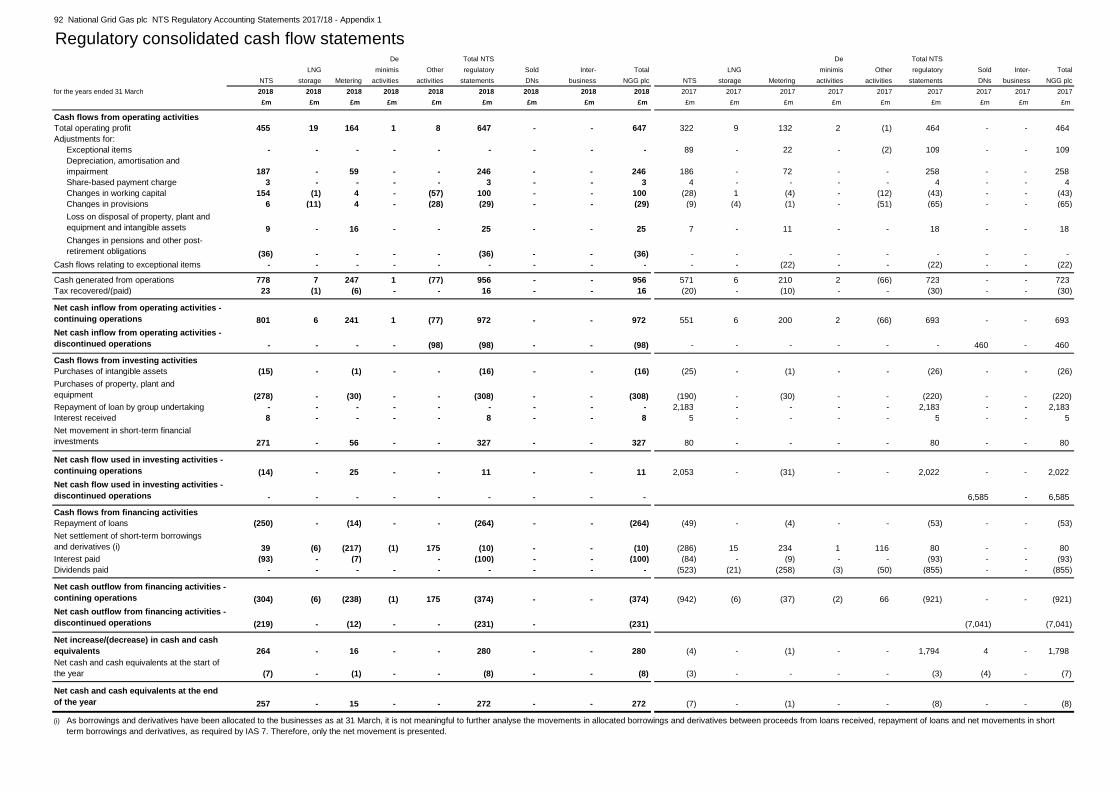
92 National Grid Gas plc NTS Regulatory Accounting Statements 2017/18 - Appendix 1
Regulatory consolidated cash flow statementsDe Total NTS De Total NTS
LNG minimis Other regulatory Sold Inter- Total LNG minimis Other regulatory Sold Inter- Total
NTS storage Metering activities activities statements DNs business NGG plc NTS storage Metering activities activities statements DNs business NGG plc
for the years ended 31 March 2018 2018 2018 2018 2018 2018 2018 2018 2018 2017 2017 2017 2017 2017 2017 2017 2017 2017
£m £m £m £m £m £m £m £m £m £m £m £m £m £m £m £m £m £m
Cash flows from operating activities
Total operating profit 455 19 164 1 8 647 - - 647 322 9 132 2 (1) 464 - - 464
Adjustments for:
Exceptional items - - - - - - - - - 89 - 22 - (2) 109 - - 109
187 - 59 - - 246 - - 246 186 - 72 - - 258 - - 258
Share-based payment charge 3 - - - - 3 - - 3 4 - - - - 4 - - 4
Changes in working capital 154 (1) 4 - (57) 100 - - 100 (28) 1 (4) - (12) (43) - - (43)
Changes in provisions 6 (11) 4 - (28) (29) - - (29) (9) (4) (1) - (51) (65) - - (65)
9 - 16 - - 25 - - 25 7 - 11 - - 18 - - 18
(36) - - - - (36) - - (36) - - - - - - - - -
Cash flows relating to exceptional items - - - - - - - - - - - (22) - - (22) - - (22)
Cash generated from operations 778 7 247 1 (77) 956 - - 956 571 6 210 2 (66) 723 - - 723
Tax recovered/(paid) 23 (1) (6) - - 16 - - 16 (20) - (10) - - (30) - - (30)
801 6 241 1 (77) 972 - - 972 551 6 200 2 (66) 693 - - 693
- - - - (98) (98) - - (98) - - - - - - 460 - 460
Cash flows from investing activities
Purchases of intangible assets (15) - (1) - - (16) - - (16) (25) - (1) - - (26) - - (26)
(278) - (30) - - (308) - - (308) (190) - (30) - - (220) - - (220)
Repayment of loan by group undertaking - - - - - - - - - 2,183 - - - - 2,183 - - 2,183
Interest received 8 - - - - 8 - - 8 5 - - - - 5 - - 5
271 - 56 - - 327 - - 327 80 - - - - 80 - - 80
(14) - 25 - - 11 - - 11 2,053 - (31) - - 2,022 - - 2,022
- - - - - - - - - 6,585 - 6,585
Cash flows from financing activities
Repayment of loans (250) - (14) - - (264) - - (264) (49) - (4) - - (53) - - (53)
39 (6) (217) (1) 175 (10) - - (10) (286) 15 234 1 116 80 - - 80
Interest paid (93) - (7) - (100) - - (100) (84) - (9) - - (93) - - (93)
Dividends paid - - - - - - - - - (523) (21) (258) (3) (50) (855) - - (855)
(304) (6) (238) (1) 175 (374) - - (374) (942) (6) (37) (2) 66 (921) - - (921)
(219) - (12) - - (231) - (231) (7,041) (7,041)
264 - 16 - - 280 - - 280 (4) - (1) - - 1,794 4 - 1,798
(7) - (1) - - (8) - - (8) (3) - - - - (3) (4) - (7)
257 - 15 - - 272 - - 272 (7) - (1) - - (8) - - (8)
(i)
Net cash flow used in investing activities -
discontinued operations
Purchases of property, plant and
equipment
Net movement in short-term financial
investments
Changes in pensions and other post-
retirement obligations
Net settlement of short-term borrowings
and derivatives (i)
Net cash outflow from financing activities -
contining operations
Net cash outflow from financing activities -
discontinued operations
Net increase/(decrease) in cash and cash
equivalents
Net cash and cash equivalents at the end
of the year
Net cash and cash equivalents at the start of
the year
As borrowings and derivatives have been allocated to the businesses as at 31 March, it is not meaningful to further analyse the movements in allocated borrowings and derivatives between proceeds from loans received, repayment of loans and net movements in short
term borrowings and derivatives, as required by IAS 7. Therefore, only the net movement is presented.
Loss on disposal of property, plant and
equipment and intangible assets
Net cash inflow from operating activities -
continuing operations
Net cash inflow from operating activities -
discontinued operations
Net cash flow used in investing activities -
continuing operations
Depreciation, amortisation and
impairment

National Grid Gas plc NTS Regulatory Accounting Statements 2017/18 - Appendix 1 93
Notes to the regulatory accounting statements
A. Operating costs
De Total NTS De Total NTS
LNG minimis Other regulatory Sold Inter- Total LNG minimis Other regulatory Sold Inter- Total
NTS storage Metering activities activities statements DNs business NGG plc NTS storage Metering activities activities statements DNs business NGG plc
Continuing 2018 2018 2018 2018 2018 2018 2018 2018 2018 2017 2017 2017 2017 2017 2017 2017 2017 2017
£m £m £m £m £m £m £m £m £m £m £m £m £m £m £m £m £m £m
Before exceptional items
Depreciation and amortisation 187 - 59 - - 246 - - 246 186 - 72 - - 258 - - 258
Payroll costs 128 - 13 - - 141 - - 141 115 1 9 - - 125 - - 125
Purchases of gas 75 - - - - 75 - - 75 66 - - - - 66 - - 66
Rates 93 1 - - - 94 - - 94 101 - - - - 101 - - 101
Other 161 (12) 42 - 30 221 - - 221 181 (2) 51 - 28 258 - (41) 2170 -0 -
644 (11) 114 - 30 777 - - 777 649 (1) 132 - 28 808 - (41) 767
Exceptional items
Other operating charges - - - - - - - - - 89 - 22 - (2) 109 - - 1090 -0 -
- - - - - - - - - 89 - 22 - (2) 109 - - 109
Total
Depreciation and amortisation 187 - 59 - - 246 - - 246 186 - 72 - - 258 - - 258
Payroll costs 128 - 13 - - 141 - - 141 115 1 9 - - 125 - - 125
Purchases of gas 75 - - - - 75 - - 75 66 - - - - 66 - - 66
Rates 93 1 - - - 94 - - 94 101 - - - - 101 - - 101
Other 161 (12) 42 - 30 221 - - 221 270 (2) 73 - 26 367 - (41) 3260 -0 -
644 (11) 114 - 30 777 - - 777 738 (1) 154 - 26 917 - (41) 876
(a) Payroll costs
De Total NTS De Total NTS
LNG minimis Other regulatory Sold Inter- Total LNG minimis Other regulatory Sold Inter- Total
NTS storage Metering activities activities statements DNs business NGG plc NTS storage Metering activities activities statements DNs business NGG plc
Continuing 2018 2018 2018 2018 2018 2018 2018 2018 2018 2017 2017 2017 2017 2017 2017 2017 2017 2017
£m £m £m £m £m £m £m £m £m £m £m £m £m £m £m £m £m £m
Wages and salaries 102 - 6 - - 108 - - 108 98 1 5 - - 104 - - 104
Social security costs 14 - 2 - - 16 - - 16 14 - 2 - - 16 - - 16
Other pension costs 31 - 2 - - 33 - - 33 19 - 2 - - 21 - - 21
Share-based payment 3 - 1 - - 4 - - 4 4 - - - - 4 - - 4
- - 2 - - 2 - - 2 2 - - - - 2 - - 2
150 - 13 - - 163 - - 163 137 1 9 - - 147 - - 147
Less: payroll costs capitalised (22) - - - - (22) - - (22) (22) - - - - (22) - - (22)
128 - 13 - - 141 - - 141 115 1 9 - - 125 - - 125
(b) Average number of employees
De Total NTS De Total NTS
LNG minimis Other regulatory Sold Inter- Total LNG minimis Other regulatory Sold Inter- Total
NTS storage Metering activities activities statements DNs business NGG plc NTS storage Metering activities activities statements DNs business NGG plc
Continuing 2018 2018 2018 2018 2018 2018 2018 2018 2018 2017 2017 2017 2017 2017 2017 2017 2017 2017
UK 1,886 1 105 - - 1,992 - - 1,992 1,892 12 102 - - 2,006 - - 2,006
Severance costs (excluding pension costs)
Total employee numbers have been apportioned between regulatory businesses relative to wages and salaries.

94 National Grid Gas plc NTS Regulatory Accounting Statements 2017/18 - Appendix 1
B. Exceptional items and remeasurements
De Total NTS De Total NTS
LNG minimis Other regulatory Sold Inter- Total LNG minimis Other regulatory Sold Inter- Total
NTS storage Metering activities activities statements DNs business NGG plc NTS storage Metering activities activities statements DNs business NGG plc
Continuing 2018 2018 2018 2018 2018 2018 2018 2018 2018 2017 2017 2017 2017 2017 2017 2017 2017 2017
£m £m £m £m £m £m £m £m £m £m £m £m £m £m £m £m £m £m
Included within operating profit
Exceptional items -
Profit on disposal of land and buildings - - - - - - - - - - - - - 109 109 - - 109
Gas holder demolition costs - - - - - - - - - - - - - (107) (107) - - (107)
Pension sectionalisation - - - - - - - - - (89) - - - - (89) - - (89)
Pension deficit charges - - - - - - - - - - - (22) - - (22) - - (22)
- - - - - - - - - (89) - (22) - 2 (109) - - (109)
Included within finance costs:
Remeasurements:
21 - - - - 21 - - 21 (6) - (1) - - (7) - - (7)
21 - - - - 21 - - 21 (6) - (1) - - (7) - - (7)
21 - - - - 21 - - 21 (95) - (23) - 2 (116) - - (116)
Included within taxation:
Exceptional credits arising on items not included in profit before tax
- - - - - - - - - 19 - 2 - (3) 18 - - 18
Tax on exceptional items - - - - - - - - - 18 - 5 - 21 44 - - 44
Tax on remeasurements (4) - - - (4) - - (4) 1 - - - 1 - - 1
(4) - - - - (4) - - (4) 38 - 7 - 18 63 - - 63
17 - - - - 17 - 17 (57) - (16) - 20 (53) - (53)
Total exceptional items after tax - - - - - - - - - (52) - (15) - 20 (47) - - (47)Total remeasurements after tax 17 - - - - 17 - - 17 (5) - (1) - - (6) - - (6)
17 - - - - 17 - - 17 (57) - (16) - 20 (53) - - (53)
Net gains/(losses) on derivative financial
instruments
Deferred tax credit arising on the reduction
in the UK tax rate
Total included within profit before tax
Total exceptional items and
remeasurements after tax
Total exceptional items and
remeasurements from continuing
operations

National Grid Gas plc NTS Regulatory Accounting Statements 2017/18 - Appendix 1 95
C. Finance income and costs
De Total NTS De Total NTS
LNG minimis Other regulatory Sold Inter- Total LNG minimis Other regulatory Sold Inter- Total
NTS storage Metering activities activities statements DNs business NGG plc NTS storage Metering activities activities statements DNs business NGG plc
Continuing 2018 2018 2018 2018 2018 2018 2018 2018 2018 2017 2017 2017 2017 2017 2017 2017 2017 2017
£m £m £m £m £m £m £m £m £m £m £m £m £m £m £m £m £m £m
Finance incomeInterest income on financial instruments 7 - - - - 7 - - 7 5 - - - - 5 - - 5
Net interest on pension asset 1 - - - - 1 - - 1 - - - - - - - - -
Finance income 8 - - - - 8 - - 8 5 - - - - 5 - - 5
Finance costs
Net interest on pension asset - - - - - - - - (1) - - - - (1) - (1)
(245) - (20) - - (265) - - (265) (204) - (21) - - (225) - - (225)
Interest on derivatives 49 - 4 - - 53 - - 53 58 - 6 - - 64 - - 64
Other interest - - - - - - - - - (2) - - - - (2) - - (2)
Unwinding of discount on provisions (1) - - - - (1) - - (1) (1) - - - - (1) - - (1)
Less: interest capitalised 9 - - - - 9 - - 9 5 - - - - 5 - - 5
(188) - (16) - - (204) - - (204) (145) - (15) - - (160) - - (160)
Remeasurements
Net gains/(losses) on derivative financial instruments included in remeasurements:
Ineffectiveness on derivatives designated as:
Fair value hedges 24 - 2 - - 26 - - 26 19 - 2 - - 21 - - 21
Cash flow hedges (2) - - - - (2) - - (2) (3) - - - - (3) - - (3)
(2) - (1) - - (3) - - (3) (22) - (3) - - (25) - - (25)
20 - 1 - - 21 - - 21 (6) - (1) - - (7) - - (7)
20 - 1 - - 21 - - 21 (6) - (1) - - (7) - - (7)
(168) - (15) - - (183) - - (183) (151) - (16) - - (167) - - (167)
(160) - (15) - - (175) - - (175) (146) - (16) - - (162) - - (162)
Finance costs before exceptional items
and remeasurements
Derivatives not designated as hedges or
ineligible for hedge accounting
Interest expense on financial liabilities held at
amortised cost
Exceptional items and remeasurements
included within finance costs
Interest expense and other finance costs
Net finance costs
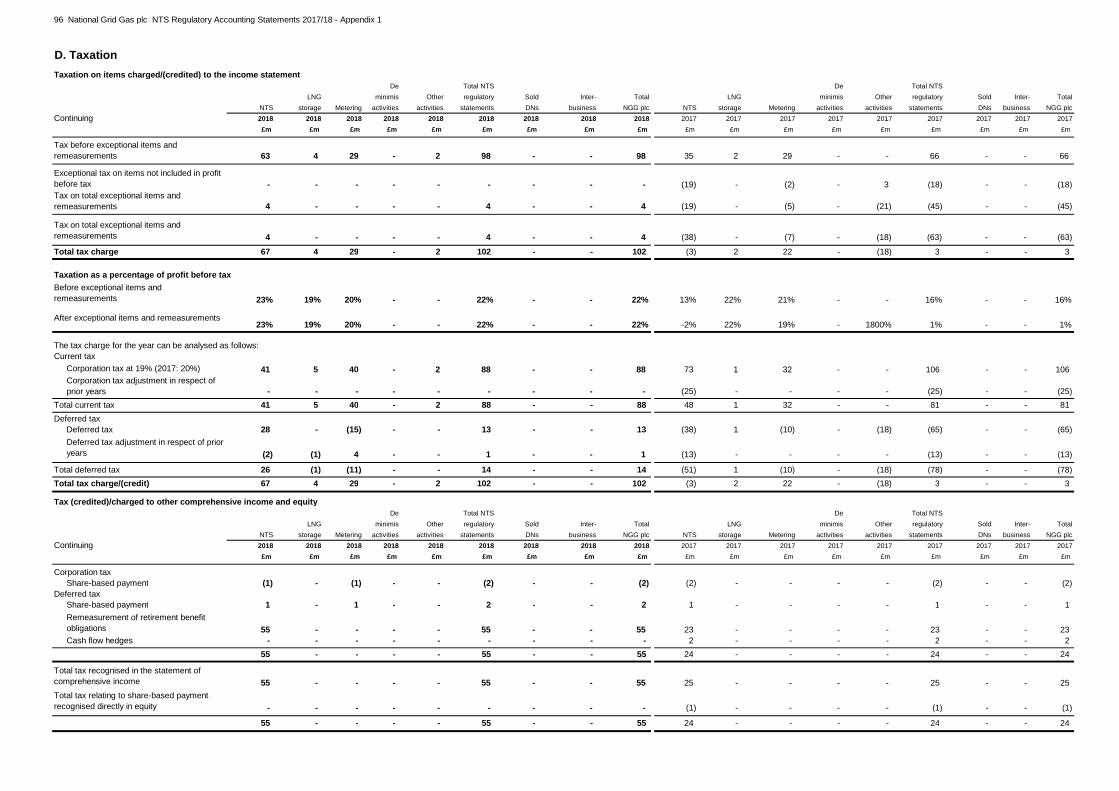
96 National Grid Gas plc NTS Regulatory Accounting Statements 2017/18 - Appendix 1
D. Taxation
Taxation on items charged/(credited) to the income statement
De Total NTS De Total NTS
LNG minimis Other regulatory Sold Inter- Total LNG minimis Other regulatory Sold Inter- Total
NTS storage Metering activities activities statements DNs business NGG plc NTS storage Metering activities activities statements DNs business NGG plc
Continuing 2018 2018 2018 2018 2018 2018 2018 2018 2018 2017 2017 2017 2017 2017 2017 2017 2017 2017
£m £m £m £m £m £m £m £m £m £m £m £m £m £m £m £m £m £m£m £m£m £m£m £m£m £m
63 4 29 - 2 98 - - 98 35 2 29 - - 66 - - 66
- - - - - - - - - (19) - (2) - 3 (18) - - (18)
4 - - - - 4 - - 4 (19) - (5) - (21) (45) - - (45)
4 - - - - 4 - - 4 (38) - (7) - (18) (63) - - (63)
Total tax charge 67 4 29 - 2 102 - - 102 (3) 2 22 - (18) 3 - - 3
Taxation as a percentage of profit before tax
23% 19% 20% - - 22% - - 22% 13% 22% 21% - - 16% - - 16%
23% 19% 20% - - 22% - - 22% -2% 22% 19% - 1800% 1% - - 1%
The tax charge for the year can be analysed as follows:
Current tax
41 5 40 - 2 88 - - 88 73 1 32 - - 106 - - 106
- - - - - - - - - (25) - - - - (25) - - (25)
Total current tax 41 5 40 - 2 88 - - 88 48 1 32 - - 81 - - 81
Deferred tax
Deferred tax 28 - (15) - - 13 - - 13 (38) 1 (10) - (18) (65) - - (65)
(2) (1) 4 - - 1 - - 1 (13) - - - - (13) - - (13)
Total deferred tax 26 (1) (11) - - 14 - - 14 (51) 1 (10) - (18) (78) - - (78)
Total tax charge/(credit) 67 4 29 - 2 102 - - 102 (3) 2 22 - (18) 3 - - 3
Tax (credited)/charged to other comprehensive income and equity
De Total NTS De Total NTS
LNG minimis Other regulatory Sold Inter- Total LNG minimis Other regulatory Sold Inter- Total
NTS storage Metering activities activities statements DNs business NGG plc NTS storage Metering activities activities statements DNs business NGG plc
Continuing 2018 2018 2018 2018 2018 2018 2018 2018 2018 2017 2017 2017 2017 2017 2017 2017 2017 2017
£m £m £m £m £m £m £m £m £m £m £m £m £m £m £m £m £m £m
Corporation tax
Share-based payment (1) - (1) - - (2) - - (2) (2) - - - - (2) - - (2)
Deferred tax
Share-based payment 1 - 1 - - 2 - - 2 1 - - - - 1 - - 1
55 - - - - 55 - - 55 23 - - - - 23 - - 23
Cash flow hedges - - - - - - - - - 2 - - - - 2 - - 2
55 - - - - 55 - - 55 24 - - - - 24 - - 24
55 - - - - 55 - - 55 25 - - - - 25 - - 25
- - - - - - - - - (1) - - - - (1) - - (1)
55 - - - - 55 - - 55 24 - - - - 24 - - 24
Deferred tax adjustment in respect of prior
years
Remeasurement of retirement benefit
obligations
Before exceptional items and
remeasurements
After exceptional items and remeasurements
Corporation tax at 19% (2017: 20%)
Corporation tax adjustment in respect of
prior years
Total tax recognised in the statement of
comprehensive income
Total tax relating to share-based payment
recognised directly in equity
Tax on total exceptional items and
remeasurements
Tax before exceptional items and
remeasurements
Exceptional tax on items not included in profit
before tax
Tax on total exceptional items and
remeasurements

National Grid Gas plc NTS Regulatory Accounting Statements 2017/18 - Appendix 1 97
D. Taxation (continued)
De Total NTS De Total NTS
LNG minimis Other regulatory Sold Inter- Total LNG minimis Other regulatory Sold Inter- Total
NTS storage Metering activities activities statements DNs business NGG plc NTS storage Metering activities activities statements DNs business NGG plc
Continuing 2018 2018 2018 2018 2018 2018 2018 2018 2018 2017 2017 2017 2017 2017 2017 2017 2017 2017
£m £m £m £m £m £m £m £m £m £m £m £m £m £m £m £m £m £m
Before exceptional items and remeasurements
275 19 148 1 8 451 - - 451 271 9 139 2 (3) 418 - - 418
52 4 28 - 2 86 - - 86 54 2 28 - 84 - - 84
Effects of:
Adjustments in respect of previous years 1 - - - - 1 - - 1 (38) - - - - (38) - - (38)
13 - 1 - - 14 - - 14 25 - 1 - - 26 - - 26
Non-taxable income (1) - - - - (1) - - (1) (6) - - - - (6) - - (6)
Impact of change in UK tax rate (2) - - - - (2) - - (2) - - - - - - - - -
63 4 29 - 2 98 - - 98 35 2 29 - - 66 - - 66
Effective tax rate 23% 19% 20% - 19% 22% - - 22% 13% 22% 21% - 0% 16% - - 16%
De Total NTS De Total NTS
LNG minimis Other regulatory Sold Inter- Total LNG minimis Other regulatory Sold Inter- Total
NTS storage Metering activities activities statements DNs business NGG plc NTS storage Metering activities activities statements DNs business NGG plc
Continuing 2018 2018 2018 2018 2018 2018 2018 2018 2018 2017 2017 2017 2017 2017 2017 2017 2017 2017
£m £m £m £m £m £m £m £m £m £m £m £m £m £m £m £m £m £m
After exceptional items and remeasurements
296 19 148 1 8 472 - - 472 176 9 116 2 (1) 302 - - 302
56 4 28 - 2 90 - - 90 35 2 23 - - 60 - - 60
Effects of:
Adjustments in respect of previous years 1 - - - - 1 - - 1 (38) - - - - (38) - - (38)
13 - 1 - - 14 - - 14 25 - 1 - - 26 - - 26
Non-taxable income (1) - - - - (1) - - (1) (6) - - - (21) (27) - - (27)
Impact of change in UK tax rate (2) - - - - (2) - - (2) (19) - (2) - 3 (18) - - (18)
Total tax 67 4 29 - 2 102 - - 102 (3) 2 22 - (18) 3 - - 3
Effective tax rate 23% 19% 20% - 19% 22% - - 22% -2% 22% 19% - 1800% 1% - - 1%
Profit before tax after exceptional items and
remeasurements
Multiplied by the UK corporation tax rate of
19% (2017: 20%)
Expenses not deductible for tax purposes
Total tax before exceptional items and
remeasurements
Multiplied by the UK corporation tax rate of
19% (2017: 20%)
Expenses not deductible for tax purposes
Profit before tax before exceptional items and
remeasurements
The tax charge for the year after exceptional items and remeasurements is higher (2017: lower) than the standard rate of corporation tax in the UK of 19% (2017: 20%). The differences are explained below:

98 National Grid Gas plc NTS Regulatory Accounting Statements 2017/18 - Appendix 1
D. Taxation (continued)
Deferred tax (assets)/liabilities Accelerated Employee Other net Total NTS
tax Financial share temporary regulatory Sold Total
depreciation Instruments options differences statements DNs NGG plc
£m £m £m £m £m £m £m
Deferred tax assets at 31 March 2016 - (4) (5) - (9) (9) (18)
Deferred tax liabilities at 31 March 2016 420 1 - 3 424 1,142 1,566
At 1 April 2016 420 (3) (5) 3 415 1,133 1,548
(Credited)/charged to income statement (55) 2 - (25) (78) (77) (155)
Charged to other comprehensive income and equity - 2 1 23 26 10 36
Transfer in relation to discontinued operations 3 - - - 3 (1,066) (1,063)
At 31 March 2017 368 1 (4) 1 366 - 366
Deferred tax assets at 31 March 2017 - - (4) (10) (14) - (14)
Deferred tax liabilities at 31 March 2017 368 1 - 11 380 - 380
At 1 April 2017 368 1 (4) 1 366 - 366
Charged/(credited) to income statement 3 (1) 1 11 14 - 14
Charged to other comprehensive income and equity - - 2 55 57 - 57
At 31 March 2018 371 - (1) 67 437 - 437
Deferred tax assets at 31 March 2018 - - (1) (6) (7) - (7)
Deferred tax liabilities at 31 March 2018 371 - - 73 444 - 444
At 31 March 2018 371 - (1) 67 437 - 437
Deferred tax (assets)/liabilities by business De Total NTS
LNG Metering minimis Other regulatory Sold Inter- Total
NTS storage Metering activities activities statements DNs business NGG plc
£m £m £m £m £m £m £m £m £m
Deferred tax assets at 31 March 2016 (8) - (1) - - (9) (9) - (18)
Deferred tax liabilities at 31 March 2016 396 (3) 31 - - 424 1,142 - 1,566
At 1 April 2016 388 (3) 30 - - 415 1,133 - 1,548
Credited to income statement (51) 1 (10) - (18) (78) (77) - (155)
Charged to other comprehensive income and equity 26 - - - - 26 10 - 36
Transfer in relation to discontinued operations 3 - - - - 3 (1,066) - (1,063)
At 31 March 2017 366 (2) 20 - (18) 366 - - 366
Deferred tax assets at 31 March 2017 (10) - (4) - - (14) - - (14)
Deferred tax liabilities at 31 March 2017 376 (2) 24 - (18) 380 - - 380
At 1 April 2017 366 (2) 20 - (18) 366 - - 366
(Credited)/charged to income statement 26 (1) (11) - - 14 - - 14
Charged to other comprehensive income and equity 56 - 1 - - 57 - - 57
At 31 March 2018 448 (3) 10 - (18) 437 - - 437
Deferred tax assets at 31 March 2018 (5) - (2) - - (7) - - (7)
Deferred tax liabilities at 31 March 2018 453 (3) 12 - (18) 444 - - 444
At 31 March 2018 448 (3) 10 - (18) 437 - - 437

National Grid Gas plc NTS Regulatory Accounting Statements 2017/18 - Appendix 1 99
E. Dividends
De Total NTS De Total NTS
LNG minimis Other regulatory Sold Inter- Total LNG minimis Other regulatory Sold Inter- Total
NTS storage Metering activities activities statements DNs business NGG plc NTS storage Metering activities activities statements DNs business NGG plc
Continuing 2018 2018 2018 2018 2018 2018 2018 2018 2018 2017 2017 2017 2017 2017 2017 2017 2017 2017
£m £m £m £m £m £m £m £m £m £m £m £m £m £m £m £m £m £m
Ordinary dividends
Interim dividend - - - - - - - - - 523 21 258 3 50 855 - - 855
F. Intangible assets
De Total NTS De Total NTS
LNG minimis Other regulatory Sold Inter- Total LNG minimis Other regulatory Sold Inter- Total
NTS storage Metering activities activities statements DNs business NGG plc NTS storage Metering activities activities statements DNs business NGG plc
2018 2018 2018 2018 2018 2018 2018 2018 2018 2017 2017 2017 2017 2017 2017 2017 2017 2017
£m £m £m £m £m £m £m £m £m £m £m £m £m £m £m £m £m £m
Cost at 1 April 323 - 26 - - 349 - - 349 236 - 28 - - 264 366 - 630
Additions 15 - 1 - - 16 - - 16 25 - 1 - - 26 - - 26
Disposals (21) - - - (21) - - (21) (7) - (3) - - (10) (300) - (310)
Reclassifications between categories 2 - - - - 2 - - 2 69 - - - - 69 (66) - 3
Transfers (10) - - - - (10) - - (10) - - - - - - - - -
Cost at 31 March 309 - 27 - 336 - - 336 323 - 26 - - 349 - - 349
Accumulated amortisation at 1 April (200) - (13) - - (213) - - (213) (129) - (12) - - (141) (237) - (378)
Amortisation charge for the year (27) - (3) - - (30) - - (30) (24) - (4) - - (28) (24) - (52)
Disposals 20 - - - - 20 - - 20 3 - 3 - - 6 211 - 217
Reclassifications between categories - - - - - - - - - (50) - - - - (50) 50 - --11 -11
Accumulated amortisation at 31 March (207) - (16) - - (223) - - (223) (200) - (13) - - (213) - - (213)16 16
Net book value at 31 March 102 - 11 - 113 - - 113 123 - 13 - - 136 - - 136

100 National Grid Gas plc NTS Regulatory Accounting Statements 2017/18 - Appendix 1
G. Property, plant and equipment
Land and buildings De Total NTS De Total NTS
LNG minimis Other regulatory Sold Inter- Total LNG minimis Other regulatory Sold Inter- Total
NTS storage Metering activities activities statements DNs business NGG plc NTS storage Metering activities activities statements DNs business NGG plc
2018 2018 2018 2018 2018 2018 2018 2018 2018 2017 2017 2017 2017 2017 2017 2017 2017 2017
£m £m £m £m £m £m £m £m £m £m £m £m £m £m £m £m £m £m
Cost at 1 April 350 10 3 - - 363 - - 363 322 10 3 - - 335 112 - 447
Additions 6 - - - - 6 - - 6 3 - - - - 3 7 - 10
Disposals (4) - - - - (4) - - (4) (4) - - - - (4) (79) - (83)
Reclassifications between categories (68) - - - - (68) - - (68) 29 - - - - 29 (40) - (11)
Transfers (4) - - - - (4) - - (4) - - - - - - - - -
Cost at 31 March 280 10 3 - - 293 - - 293 350 10 3 - - 363 - - 363
Accumulated depreciation at 1 April (204) (10) - - - (214) - - (214) (149) (10) - - - (159) (62) - (221)
Depreciation charge for the year (20) - - - - (20) - - (20) (33) - - - - (33) (4) - (37)
Disposals 3 - - - - 3 - - 3 2 - - - - 2 42 - 44
Reclassifications between categories 48 - - - - 48 - - 48 (24) - - - - (24) 24 - -
Accumulated depreciation at 31 March (173) (10) - - - (183) - - (183) (204) (10) - - - (214) - - (214)
Net book value at 31 March 107 - 3 - - 110 - - 110 146 - 3 - - 149 - - 149
Plant and machinery De Total NTS De Total NTS
LNG minimis Other regulatory Sold Inter- Total LNG minimis Other regulatory Sold Inter- Total
NTS storage Metering activities activities statements DNs business NGG plc NTS storage Metering activities activities statements DNs business NGG plc
2018 2018 2018 2018 2018 2018 2018 2018 2018 2017 2017 2017 2017 2017 2017 2017 2017 2017
£m £m £m £m £m £m £m £m £m £m £m £m £m £m £m £m £m £m
Cost at 1 April 5,749 143 2,119 - - 8,011 - 10 8,021 5,683 142 2,127 - - 7,952 11,551 10 19,513
Additions 96 - 28 - - 124 - - 124 52 1 27 - - 80 239 - 319
Disposals (7) - (40) - - (47) - - (47) (5) - (35) - - (40) (11,820) - (11,860)
Reclassifications between categories 109 - - - - 109 - - 109 19 - - - - 19 30 - 49
Cost at 31 March 5,947 143 2,107 - - 8,197 - 10 8,207 5,749 143 2,119 - - 8,011 - 10 8,021
Accumulated depreciation at 1 April (2,146) (143) (1,841) - - (4,130) - - (4,130) (2,045) (143) (1,798) - - (3,986) (3,457) - (7,443)
Depreciation charge for the year (130) - (55) - - (185) - - (185) (121) - (68) - - (189) (113) - (302)
Disposals 7 - 25 - - 32 - - 32 (5) - 25 - - 20 3,595 - 3,615
Reclassifications between categories (48) - - - - (48) - - (48) 25 - - - - 25 (25) - -
Impairment (3) (3) (3)
Accumulated depreciation at 31 March (2,320) (143) (1,871) - - (4,334) - - (4,334) (2,146) (143) (1,841) - - (4,130) - - (4,130)
Net book value at 31 March 3,627 - 236 - - 3,863 - 10 3,873 3,603 - 278 - - 3,881 - 10 3,891
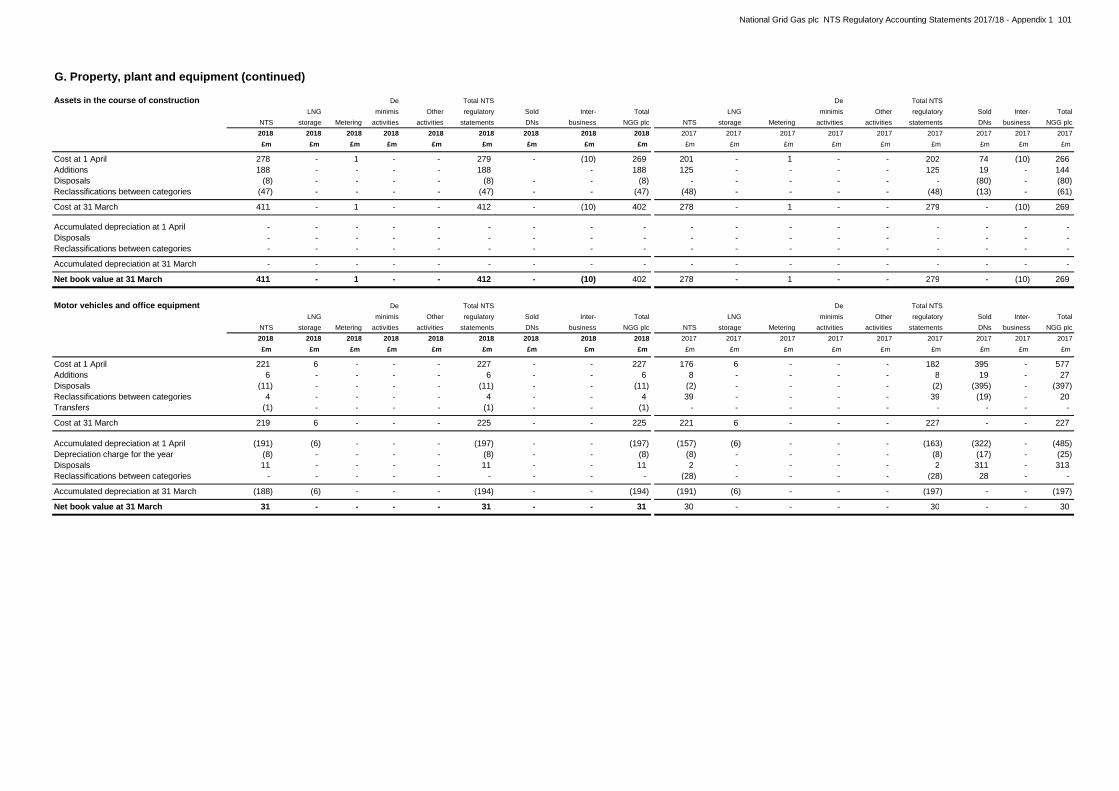
National Grid Gas plc NTS Regulatory Accounting Statements 2017/18 - Appendix 1 101
G. Property, plant and equipment (continued)
Assets in the course of construction De Total NTS De Total NTS
LNG minimis Other regulatory Sold Inter- Total LNG minimis Other regulatory Sold Inter- Total
NTS storage Metering activities activities statements DNs business NGG plc NTS storage Metering activities activities statements DNs business NGG plc
2018 2018 2018 2018 2018 2018 2018 2018 2018 2017 2017 2017 2017 2017 2017 2017 2017 2017
£m £m £m £m £m £m £m £m £m £m £m £m £m £m £m £m £m £m
Cost at 1 April 278 - 1 - - 279 - (10) 269 201 - 1 - - 202 74 (10) 266
Additions 188 - - - - 188 - 188 125 - - - - 125 19 - 144
Disposals (8) - - - - (8) - - (8) - - - - - - (80) - (80)
Reclassifications between categories (47) - - - - (47) - - (47) (48) - - - - (48) (13) - (61)
Cost at 31 March 411 - 1 - - 412 - (10) 402 278 - 1 - - 279 - (10) 269
Accumulated depreciation at 1 April - - - - - - - - - - - - - - - - - -
Disposals - - - - - - - - - - - - - - - - - -
Reclassifications between categories - - - - - - - - - - - - - - - - - -
Accumulated depreciation at 31 March - - - - - - - - - - - - - - - - - -
Net book value at 31 March 411 - 1 - - 412 - (10) 402 278 - 1 - - 279 - (10) 269
Motor vehicles and office equipment De Total NTS De Total NTS
LNG minimis Other regulatory Sold Inter- Total LNG minimis Other regulatory Sold Inter- Total
NTS storage Metering activities activities statements DNs business NGG plc NTS storage Metering activities activities statements DNs business NGG plc
2018 2018 2018 2018 2018 2018 2018 2018 2018 2017 2017 2017 2017 2017 2017 2017 2017 2017
£m £m £m £m £m £m £m £m £m £m £m £m £m £m £m £m £m £m
Cost at 1 April 221 6 - - - 227 - - 227 176 6 - - - 182 395 - 577
Additions 6 - - - - 6 - - 6 8 - - - - 8 19 - 27
Disposals (11) - - - - (11) - - (11) (2) - - - - (2) (395) - (397)
Reclassifications between categories 4 - - - - 4 - - 4 39 - - - - 39 (19) - 20
Transfers (1) - - - - (1) - - (1) - - - - - - - - -
Cost at 31 March 219 6 - - - 225 - - 225 221 6 - - - 227 - - 227
Accumulated depreciation at 1 April (191) (6) - - - (197) - - (197) (157) (6) - - - (163) (322) - (485)
Depreciation charge for the year (8) - - - - (8) - - (8) (8) - - - - (8) (17) - (25)
Disposals 11 - - - - 11 - - 11 2 - - - - 2 311 - 313
Reclassifications between categories - - - - - - - - - (28) - - - - (28) 28 - -
Accumulated depreciation at 31 March (188) (6) - - - (194) - - (194) (191) (6) - - - (197) - - (197)
Net book value at 31 March 31 - - - - 31 - - 31 30 - - - - 30 - - 30

102 National Grid Gas plc NTS Regulatory Accounting Statements 2017/18 - Appendix 1
G. Property, plant and equipment (continued)Total property, plant and equipment De Total NTS De Total NTS
LNG minimis Other regulatory Sold Inter- Total LNG minimis Other regulatory Sold Inter- Total
NTS storage Metering activities activities statements DNs business NGG plc NTS storage Metering activities activities statements DNs business NGG plc
2018 2018 2018 2018 2018 2018 2018 2018 2018 2017 2017 2017 2017 2017 2017 2017 2017 2017
£m £m £m £m £m £m £m £m £m £m £m £m £m £m £m £m £m £m
Cost at 1 April 6,598 159 2,123 - - 8,880 - - 8,880 6,382 158 2,131 - - 8,671 12,132 - 20,803
Additions 296 - 28 - - 324 - - 324 188 1 27 - - 216 284 - 500
Disposals (30) - (40) - - (70) - - (70) (11) - (35) - - (46) (12,374) - (12,420)
Reclassifications between categories (2) - - - - (2) - - (2) 39 - - - - 39 (42) - (3)
Transfers (5) - - - - (5) - - (5) - - - - - - - - -
Cost at 31 March 6,857 159 2,111 - - 9,127 - - 9,127 6,598 159 2,123 - - 8,880 - - 8,880
Accumulated depreciation at 1 April (2,541) (159) (1,841) - - (4,541) - - (4,541) (2,351) (159) (1,798) - - (4,308) (3,841) - (8,149)
Depreciation charge for the year (158) - (55) - - (213) - - (213) (162) - (68) - - (230) (134) - (364)
Disposals 21 - 25 - - 46 - - 46 (1) - 25 - - 24 3,948 - 3,972
Reclassifications between categories - - - - - - - - - (27) - - - - (27) 27 - -
Impairment (3) - - - - (3) - - (3) - - - - - - - - -
Accumulated depreciation at 31 March (2,681) (159) (1,871) - - (4,711) - - (4,711) (2,541) (159) (1,841) - - (4,541) - - (4,541)
Net book value at 31 March 4,176 - 240 - - 4,416 - - 4,416 4,057 - 282 - - 4,339 - - 4,339
Information in relation to property, plant and equipment
Capitalised interest included within cost 239 - - - - 239 - - 239 229 - - - - 229 - - 229
Contributions to cost of property, plant and equipment included within cost:
Trade and other 3 - - - - 3 - - 3 3 - - - - 3 - - 3
Non-current liabilities 138 - - - - 138 - - 138 140 - - - - 140 - - 140
H. Other non-current assets
De Total NTS De Total NTS
LNG minimis Other regulatory Sold Inter- Total LNG minimis Other regulatory Sold Inter- Total
NTS storage Metering activities activities statements DNs business NGG plc NTS storage Metering activities activities statements DNs business NGG plc
2018 2018 2018 2018 2018 2018 2018 2018 2018 2017 2017 2017 2017 2017 2017 2017 2017 2017
£m £m £m £m £m £m £m £m £m £m £m £m £m £m £m £m £m £m
3,242 - 185 - - 3,427 - - 3,427 3,173 - 253 - - 3,426 - - 3,426
Prepayments 82 - 5 - - 87 - - 87 3 - - - - 3 - - 3
3,324 - 190 - - 3,514 - - 3,514 3,176 - 253 - - 3,429 - - 3,429
Loans and receivables - amounts owed by
parent
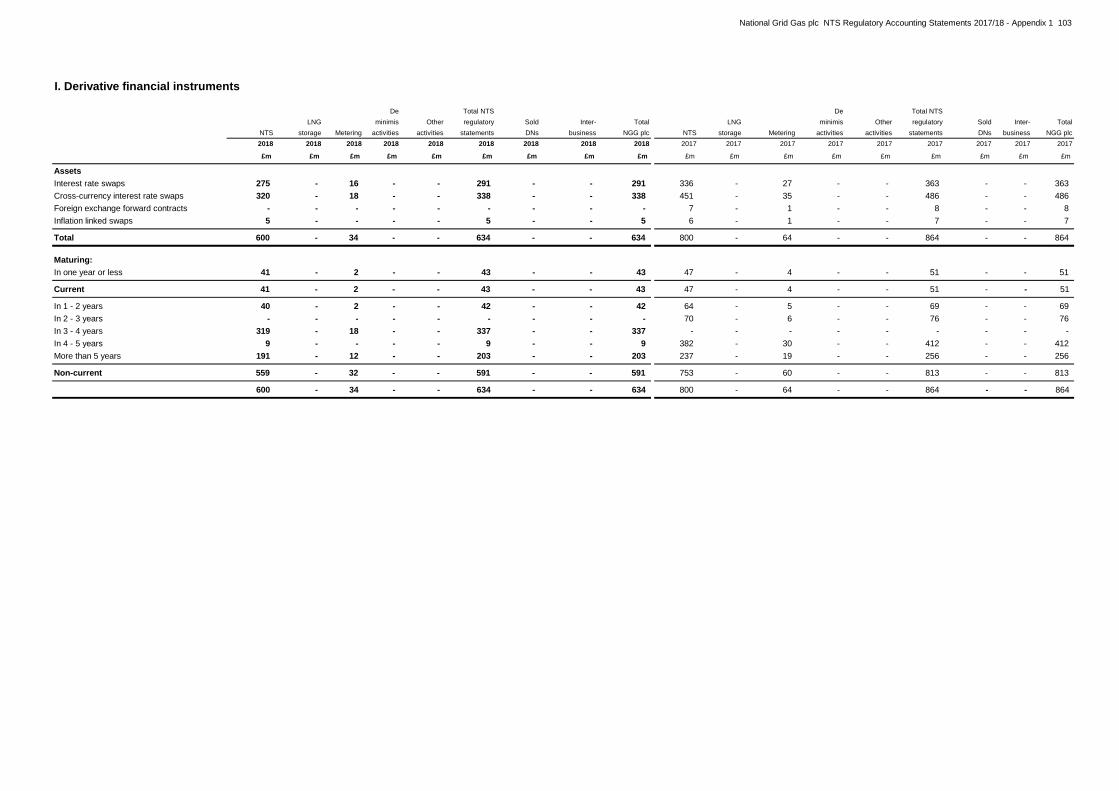
National Grid Gas plc NTS Regulatory Accounting Statements 2017/18 - Appendix 1 103
I. Derivative financial instruments
De Total NTS De Total NTS
LNG minimis Other regulatory Sold Inter- Total LNG minimis Other regulatory Sold Inter- Total
NTS storage Metering activities activities statements DNs business NGG plc NTS storage Metering activities activities statements DNs business NGG plc
2018 2018 2018 2018 2018 2018 2018 2018 2018 2017 2017 2017 2017 2017 2017 2017 2017 2017
£m £m £m £m £m £m £m £m £m £m £m £m £m £m £m £m £m £m
Assets
Interest rate swaps 275 - 16 - - 291 - - 291 336 - 27 - - 363 - - 363
Cross-currency interest rate swaps 320 - 18 - - 338 - - 338 451 - 35 - - 486 - - 486
Foreign exchange forward contracts - - - - - - - - - 7 - 1 - - 8 - - 8
Inflation linked swaps 5 - - - - 5 - - 5 6 - 1 - - 7 - - 7
Total 600 - 34 - - 634 - - 634 800 - 64 - - 864 - - 864
Maturing:
In one year or less 41 - 2 - - 43 - - 43 47 - 4 - - 51 - - 51
Current 41 - 2 - - 43 - - 43 47 - 4 - - 51 - - 51
In 1 - 2 years 40 - 2 - - 42 - - 42 64 - 5 - - 69 - - 69
In 2 - 3 years - - - - - - - - - 70 - 6 - - 76 - - 76
In 3 - 4 years 319 - 18 - - 337 - - 337 - - - - - - - - -
In 4 - 5 years 9 - - - - 9 - - 9 382 - 30 - - 412 - - 412
More than 5 years 191 - 12 - - 203 - - 203 237 - 19 - - 256 - - 256
Non-current 559 - 32 - - 591 - - 591 753 - 60 - - 813 - - 813
600 - 34 - - 634 - - 634 800 - 64 - - 864 - - 864
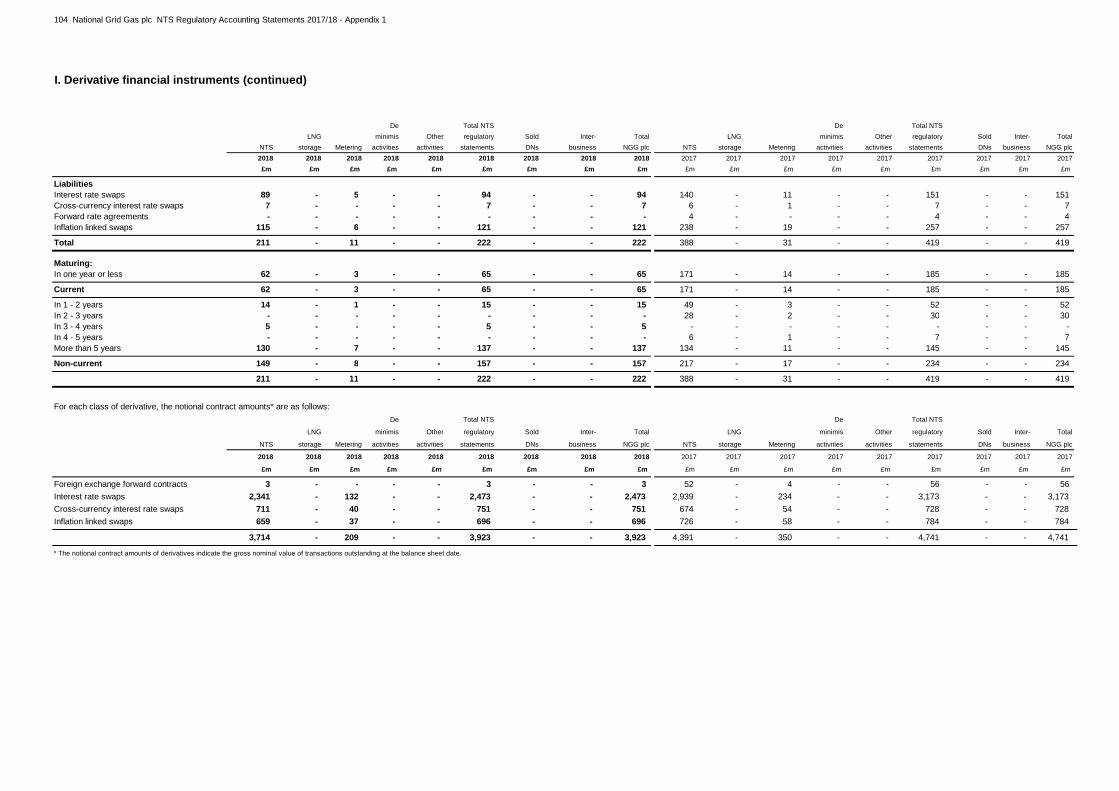
104 National Grid Gas plc NTS Regulatory Accounting Statements 2017/18 - Appendix 1
I. Derivative financial instruments (continued)
De Total NTS De Total NTS
LNG minimis Other regulatory Sold Inter- Total LNG minimis Other regulatory Sold Inter- Total
NTS storage Metering activities activities statements DNs business NGG plc NTS storage Metering activities activities statements DNs business NGG plc
2018 2018 2018 2018 2018 2018 2018 2018 2018 2017 2017 2017 2017 2017 2017 2017 2017 2017
£m £m £m £m £m £m £m £m £m £m £m £m £m £m £m £m £m £m
Liabilities
Interest rate swaps 89 - 5 - - 94 - - 94 140 - 11 - - 151 - - 151
Cross-currency interest rate swaps 7 - - - - 7 - - 7 6 - 1 - - 7 - - 7
Forward rate agreements - - - - - - - - - 4 - - - - 4 - - 4
Inflation linked swaps 115 - 6 - - 121 - - 121 238 - 19 - - 257 - - 257- -- -
Total 211 - 11 - - 222 - - 222 388 - 31 - - 419 - - 419
Maturing:
In one year or less 62 - 3 - - 65 - - 65 171 - 14 - - 185 - - 185- -- -
Current 62 - 3 - - 65 - - 65 171 - 14 - - 185 - - 185- -- -
In 1 - 2 years 14 - 1 - - 15 - - 15 49 - 3 - - 52 - - 52
In 2 - 3 years - - - - - - - - - 28 - 2 - - 30 - - 30
In 3 - 4 years 5 - - - - 5 - - 5 - - - - - - - - -
In 4 - 5 years - - - - - - - - - 6 - 1 - - 7 - - 7
More than 5 years 130 - 7 - - 137 - - 137 134 - 11 - - 145 - - 145- -- -
Non-current 149 - 8 - - 157 - - 157 217 - 17 - - 234 - - 234- -- -
211 - 11 - - 222 - - 222 388 - 31 - - 419 - - 419
For each class of derivative, the notional contract amounts* are as follows:
De Total NTS De Total NTS
LNG minimis Other regulatory Sold Inter- Total LNG minimis Other regulatory Sold Inter- Total
NTS storage Metering activities activities statements DNs business NGG plc NTS storage Metering activities activities statements DNs business NGG plc
2018 2018 2018 2018 2018 2018 2018 2018 2018 2017 2017 2017 2017 2017 2017 2017 2017 2017
£m £m £m £m £m £m £m £m £m £m £m £m £m £m £m £m £m £m
Foreign exchange forward contracts 3 - - - - 3 - - 3 52 - 4 - - 56 - - 56
Interest rate swaps 2,341 - 132 - - 2,473 - - 2,473 2,939 - 234 - - 3,173 - - 3,173
Cross-currency interest rate swaps 711 - 40 - - 751 - - 751 674 - 54 - - 728 - - 728
Inflation linked swaps 659 - 37 - - 696 - - 696 726 - 58 - - 784 - - 784- - - -- - - -
3,714 - 209 - - 3,923 - - 3,923 4,391 - 350 - - 4,741 - - 4,741-
* The notional contract amounts of derivatives indicate the gross nominal value of transactions outstanding at the balance sheet date.

National Grid Gas plc NTS Regulatory Accounting Statements 2017/18 - Appendix 1 105
J. Inventories and current intangible assets
De Total NTS De Total NTS
LNG minimis Other regulatory Sold Inter- Total LNG minimis Other regulatory Sold Inter- Total
NTS storage Metering activities activities statements DNs business NGG plc NTS storage Metering activities activities statements DNs business NGG plc
2018 2018 2018 2018 2018 2018 2018 2018 2018 2017 2017 2017 2017 2017 2017 2017 2017 2017
£m £m £m £m £m £m £m £m £m £m £m £m £m £m £m £m £m £m
Raw materials and consumables 17 - 1 - - 18 - - 18 17 - 1 - - 18 - - 18
5 - - - - 5 - - 5 2 - - - - 2 - - 20 0 - - - - - -0 0 - - - - - -
22 - 1 - - 23 - - 23 19 - 1 - - 20 - - 20
K. Trade and other receivables
De Total NTS De Total NTS
LNG minimis Other regulatory Sold Inter- Total LNG minimis Other regulatory Sold Inter- Total
NTS storage Metering activities activities statements DNs business NGG plc NTS storage Metering activities activities statements DNs business NGG plc
2018 2018 2018 2018 2018 2018 2018 2018 2018 2017 2017 2017 2017 2017 2017 2017 2017 2017
£m £m £m £m £m £m £m £m £m £m £m £m £m £m £m £m £m £m
Trade receivables 86 - 9 - - 95 - - 95 84 - 1 - - 85 - - 85
Amounts owed by fellow subsidiaries 32 - 2 - - 34 - - 34 144 - 11 - - 155 - - 155
Other receivables 14 - - - - 14 - - 14 14 - - - - 14 - - 14
Prepayments and accrued income 133 - 21 - 17 171 - - 171 137 - 22 - 107 266 - - 266
265 - 32 - 17 314 - - 314 379 - 34 - 107 520 - - 520
Current intangible assets - emission
allowances

106 National Grid Gas plc NTS Regulatory Accounting Statements 2017/18 - Appendix 1
L. Financial investments
De Total NTS De Total NTS
LNG minimis Other regulatory Sold Inter- Total LNG minimis Other regulatory Sold Inter- Total
NTS storage Metering activities activities statements DNs business NGG plc NTS storage Metering activities activities statements DNs business NGG plc
2018 2018 2018 2018 2018 2018 2018 2018 2018 2017 2017 2017 2017 2017 2017 2017 2017 2017
£m £m £m £m £m £m £m £m £m £m £m £m £m £m £m £m £m £m
Current
728 - 41 - - 769 - - 769 1,511 - 121 - - 1,632 - - 1,632
631 - 36 - - 667 - - 667 19 - 2 - - 21 - - 21
88 - 5 - - 93 - - 93 188 - 15 - - 203 - - 203
1,447 - 82 - - 1,529 - - 1,529 1,718 - 138 - - 1,856 - - 1,856
M. Cash and cash equivalents
De Total NTS De Total NTS
LNG minimis Other regulatory Sold Inter- Total LNG minimis Other regulatory Sold Inter- Total
NTS storage Metering activities activities statements DNs business NGG plc NTS storage Metering activities activities statements DNs business NGG plc
2018 2018 2018 2018 2018 2018 2018 2018 2018 2017 2017 2017 2017 2017 2017 2017 2017 2017
£m £m £m £m £m £m £m £m £m £m £m £m £m £m £m £m £m £m
Cash at bank and short-term deposits 260 - 15 - - 275 - - 275 - - - - - - - - -
260 - 15 - - 275 - - 275 - - - - - - - - -
Bank overdrafts (3) - - - - (3) - - (3) (7) - (1) - - (8) - - (8)
Net cash and cash equivalents 257 - 15 - - 272 - - 272 (7) - (1) - - (8) - - (8)
Cash and cash equivalents excluding bank
overdrafts
Available-for-sale investments - restricted
balances
Loans and receivables - amounts due from
fellow subsidiaries
Loans and receivables - restricted cash
balances

National Grid Gas plc NTS Regulatory Accounting Statements 2017/18 - Appendix 1 107
N. Borrowings
De Total NTS De Total NTS
LNG minimis Other regulatory Sold Inter- Total LNG minimis Other regulatory Sold Inter- Total
NTS storage Metering activities activities statements DNs business NGG plc NTS storage Metering activities activities statements DNs business NGG plc
2018 2018 2018 2018 2018 2018 2018 2018 2018 2017 2017 2017 2017 2017 2017 2017 2017 2017
£m £m £m £m £m £m £m £m £m £m £m £m £m £m £m £m £m £m
Current
Bank loans 392 - 22 - - 414 - - 414 490 - 39 - - 529 - - 529
Bonds 452 - 26 - - 478 - - 478 285 - 23 - - 308 - - 308
Other loans 1 - - - - 1 - - 1 1 - - - - 1 - - 1
Bank overdrafts 3 - - - - 3 - - 3 7 - 1 - - 8 - - 8
848 - 48 - - 896 - - 896 783 - 63 - - 846 - - 846
Non-current
Bank loans 481 - 27 - - 508 - - 508 454 - 36 - - 490 - - 490
Bonds 3,277 - 185 - - 3,462 - - 3,462 3,668 - 293 - - 3,961 - - 3,961
Other loans 158 - 11 - - 169 - - 169 175 - 14 - - 189 - - 189
3,916 - 223 - - 4,139 - - 4,139 4,297 - 343 - - 4,640 - - 4,640
Total borrowings 4,764 - 271 - - 5,035 - - 5,035 5,080 - 406 - - 5,486 - - 5,486
Allocated total borrowings are repayable as follows:
Less than 1 year 848 - 48 - - 896 - - 896 783 - 63 - - 846 - - 846
In 1 - 2 years 201 - 11 - - 212 - - 212 435 - 35 - - 470 - - 470
In 2 - 3 years 8 - - - - 8 - - 8 209 - 17 - - 226 - - 226
In 3 - 4 years 774 - 44 - - 818 - - 818 7 - 1 - - 8 - - 8
In 4 - 5 years 700 - 40 - - 740 - - 740 827 - 66 - - 893 - - 893
More than 5 years 2,233 - 128 - - 2,361 - - 2,361 2,819 - 224 - - 3,043 - - 3,043
4,764 - 271 - - 5,035 - - 5,035 5,080 - 406 - - 5,486 - - 5,486
O. Trade and other payables
De Total NTS De Total NTS
LNG minimis Other regulatory Sold Inter- Total LNG minimis Other regulatory Sold Inter- Total
NTS storage Metering activities activities statements DNs business NGG plc NTS storage Metering activities activities statements DNs business NGG plc
2018 2018 2018 2018 2018 2018 2018 2018 2018 2017 2017 2017 2017 2017 2017 2017 2017 2017
£m £m £m £m £m £m £m £m £m £m £m £m £m £m £m £m £m £m
Trade payables 208 - 20 - - 228 - - 228 193 - 25 - 22 240 - - 240
Amounts owed to fellow subsidiaries 250 - 14 - - 264 - - 264 219 - 18 - - 237 - - 237
Social security and other taxes 44 - 11 - - 55 - - 55 57 - 11 - - 68 - - 68
Other payables 51 - 3 - - 54 - - 54 45 - 4 - - 49 - - 49
Deferred income 17 - 13 - - 30 - - 30 7 - 13 - - 20 - - 20
570 - 61 - - 631 - - 631 521 - 71 - 22 614 - - 614

108 National Grid Gas plc NTS Regulatory Accounting Statements 2017/18 - Appendix 1
P. Other non-current liabilities
De Total NTS De Total NTS
LNG minimis Other regulatory Sold Inter- Total LNG minimis Other regulatory Sold Inter- Total
NTS storage Metering activities activities statements DNs business NGG plc NTS storage Metering activities activities statements DNs business NGG plc
2018 2018 2018 2018 2018 2018 2018 2018 2018 2017 2017 2017 2017 2017 2017 2017 2017 2017
£m £m £m £m £m £m £m £m £m £m £m £m £m £m £m £m £m £m
Trade payables 6 - - - - 6 - - 6
Deferred income - - 33 - - 33 - - 33 140 - 37 - - 177 - - 177
Other payables 138 - - - - 138 - - 138 12 - - - - 12 - - 12
144 - 33 - - 177 - - 177 152 - 37 - - 189 - - 189
Q Pensions
Amounts recognised in the statement of financial position
De Total NTS
LNG minimis Other regulatory Sold Inter- Total
NTS storage Metering activities activities statements DNs business NGG plc
2018 2018 2018 2018 2018 2018 2018 2018 2018
£m £m £m £m £m £m £m £m £m
Present value of funded obligations (5,321) - - - - (5,321) - - (5,321)
Fair value of plan assets 5,733 - - - - 5,733 - - 5,733
Defined beneift asset 412 - - - - 412 - - 412
Present value of unfunded obligations - - - - - - - - -
Net defined benefit asset 412 - - - - 412 - - 412
Represented by:
Assets 412 - - - - 412 - - 412
Amounts recognised in the consolidated income statement and statement of other comprehensive income:
De Total NTS
LNG minimis Other regulatory Sold Inter- Total
NTS storage Metering activities activities statements DNs business NGG plc
2018 2018 2018 2018 2018 2018 2018 2018 2018
£m £m £m £m £m £m £m £m £m
Included within operating costs
Administration costs 3 - - - - 3 - - 3
Included within payroll costs
Defined contribution scheme costs 10 - - - - 10 - - 10
Defined benefit scheme costs:
Current service cost 18 - - - - 18 - - 18
Special termination benefit cost - redundancies 5 - - - - 5 - - 5
36 - - - - 36 - - 36
Included within finance income and costs
Interest (credit)/cost (1) - - - - (1) - - (1)
35 - - - - 35 - - 35
Remeasurements of net retirement benefit asset 330 - - - - 330 - - 330
Total included in statement of other comprehensive income 330 - - - - 330 - - 330
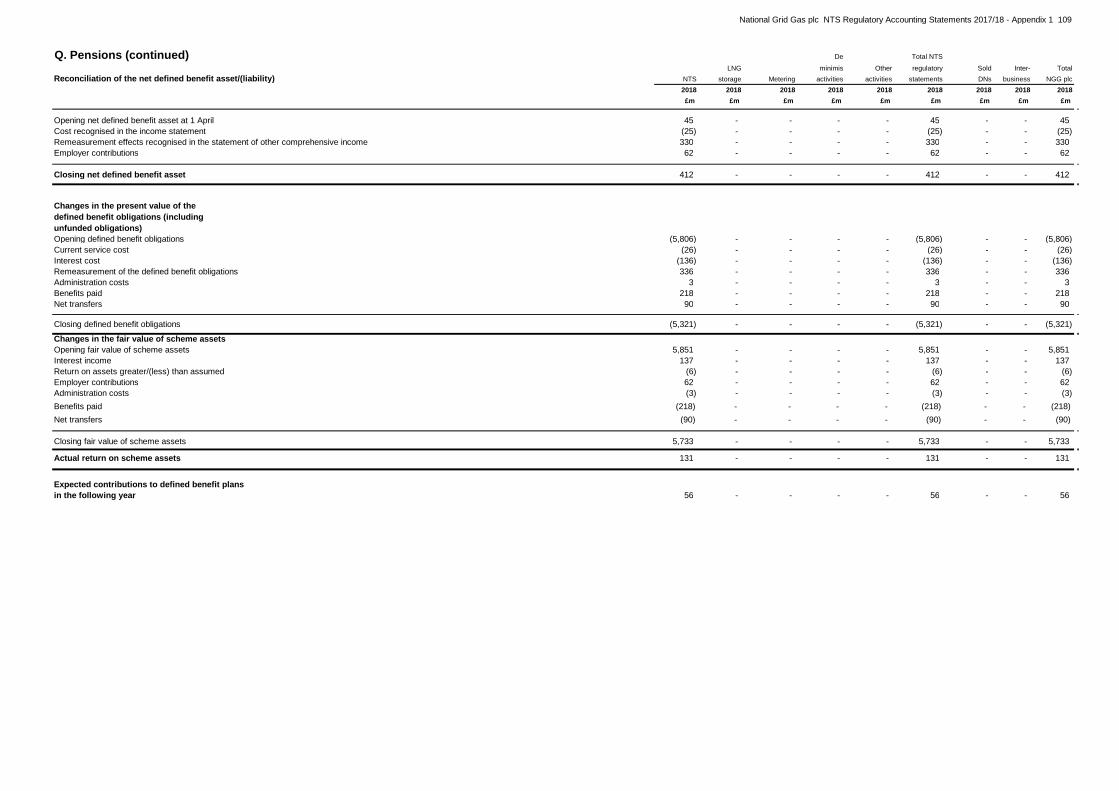
National Grid Gas plc NTS Regulatory Accounting Statements 2017/18 - Appendix 1 109
Q. Pensions (continued) De Total NTS
LNG minimis Other regulatory Sold Inter- Total
Reconciliation of the net defined benefit asset/(liability) NTS storage Metering activities activities statements DNs business NGG plc
2018 2018 2018 2018 2018 2018 2018 2018 2018
£m £m £m £m £m £m £m £m £m
Opening net defined benefit asset at 1 April 45 - - - - 45 - - 45
Cost recognised in the income statement (25) - - - - (25) - - (25)
Remeasurement effects recognised in the statement of other comprehensive income 330 - - - - 330 - - 330
Employer contributions 62 - - - - 62 - - 62
Closing net defined benefit asset 412 - - - - 412 - - 412
Opening defined benefit obligations (5,806) - - - - (5,806) - - (5,806)
Current service cost (26) - - - - (26) - - (26)
Interest cost (136) - - - - (136) - - (136)
Remeasurement of the defined benefit obligations 336 - - - - 336 - - 336
Administration costs 3 - - - - 3 - - 3
Benefits paid 218 - - - - 218 - - 218
Net transfers 90 - - - - 90 - - 90
Closing defined benefit obligations (5,321) - - - - (5,321) - - (5,321)
Changes in the fair value of scheme assets
Opening fair value of scheme assets 5,851 - - - - 5,851 - - 5,851
Interest income 137 - - - - 137 - - 137
Return on assets greater/(less) than assumed (6) - - - - (6) - - (6)
Employer contributions 62 - - - - 62 - - 62
Administration costs (3) - - - - (3) - - (3)
Benefits paid (218) - - - - (218) - - (218)
Net transfers (90) - - - - (90) - - (90)
Closing fair value of scheme assets 5,733 - - - - 5,733 - - 5,733
Actual return on scheme assets 131 - - - - 131 - - 131
Expected contributions to defined benefit plans
in the following year 56 - - - - 56 - - 56
Changes in the present value of the
defined benefit obligations (including
unfunded obligations)

110 National Grid Gas plc NTS Regulatory Accounting Statements 2017/18 - Appendix 1
R. Provisions
De Total NTS De Total NTS
LNG minimis Other regulatory Sold Inter- Total LNG minimis Other regulatory Sold Inter- Total
NTS storage Metering activities activities statements DNs business NGG plc NTS storage Metering activities activities statements DNs business NGG plc
2018 2018 2018 2018 2018 2018 2018 2018 2018 2017 2017 2017 2017 2017 2017 2017 2017 2017
£m £m £m £m £m £m £m £m £m £m £m £m £m £m £m £m £m £m
Decommissioning
At 1 April - 11 - - 107 118 - - 118 - 13 - - - 13 34 - 47
Additions - - - - - - - - - - - - - 107 107 - - 107
Release of unused amounts - (11) - - - (11) - - (11) - - - - - - - - -
Unwinding of discount - - - - 1 1 - - 1 - - - - - - - - -
Utilised - - - - (4) (4) - - (4) - (2) - - - (2) (8) - (10)
Reclassification between categories - - - - - - - - - - - - - - - - - -
Disposal of discontinued operations - - - - - - - - - - - - - - - (26) - (26)
At 31 March - - - - 104 104 - - 104 - 11 - - 107 118 - - 118
Environmental
At 1 April 22 - - - - 22 - - 22 16 - - - - 16 48 - 64
Additions - - - - - - - - - 3 - - - - 3 - - 3
Release of unused amounts - - - - - - - - - - - - - - - (19) - (19)
Unwinding of discount 1 - - - - 1 - - 1 1 - - - - 1 - - 1
Utilised - - - - - - - - - - - - - - - - - -
Reclassification between categories - - - - - - - - - 2 - - - - 2 (2) - -
Disposal of discontinued operations - - - - - - - - - - - - - - - (27) - (27)
At 31 March 23 - - - - 23 - - 23 22 - - - - 22 - - 22
Restructuring
At 1 April 3 - - - - 3 - - 3 4 2 - - 2 8 10 - 18
Additions 1 - 4 - - 5 - - 5 1 - - - - 1 - - 1
Release of unused amounts (3) - - - - (3) - - (3) - - - - - - (1) - (1)
Unwinding of discount - - - - - - - - - - - - - - - - - -
Utilised - - - - - - - - - (8) (2) - - (5) (15) - - (15)
Reclassification between categories - - - - - - - - - 6 - - - 3 9 (9) - -
Disposal of discontinued operations - - - - - - - - - - - - - - - - - -
At 31 March 1 - 4 - - 5 - - 5 3 - - - - 3 - - 3
Other
At 1 April 4 - 4 - 136 144 - - 144 1 - 4 - - 5 48 - 53
Additions 5 - 1 - - 6 - - 6 2 - - - 136 138 - - 138
Release of unused amounts (14) - - - (19) (33) - - (33) (2) - - - - (2) (1) - (3)
Utilised (7) - - - (77) (84) - - (84) - - - - - - (3) - (3)
Reclassification between categories 34 - - - - 34 - - 34 3 - - - - 3 (3) - -
Disposal of discontinued operations - - - - - - - - - - - - - - - (41) - (41)
At 31 March 22 - 5 - 40 67 - - 67 4 - 4 - 136 144 - - 144
Total
At 1 April 29 11 4 - 243 287 - - 287 21 15 4 - 2 42 140 - 182
Additions 6 - 5 - - 11 - - 11 6 - - - 243 249 - - 249
Release of unused amounts (17) (11) - - (19) (47) - - (47) (2) - - - - (2) (21) - (23)
Unwinding of discount 1 - - - 1 2 - - 2 1 - - - - 1 - - 1
Utilised (7) - - - (81) (88) - - (88) (8) (4) - - (5) (17) (11) - (28)
Reclassification between categories 34 - - - - 34 - - 34 11 - - - 3 14 (14) - -
Disposal of discontinued operations - - - - - - - - - - - - - - - (94) - (94)
At 31 March 46 - 9 - 144 199 - - 199 29 11 4 - 243 287 - - 287
Provisions have been analysed between current and non-current as follows:
Current 10 - 6 - 54 70 - - 70 16 11 - - 106 133 - - 133
Non-current 36 - 3 - 90 129 - - 129 13 - 4 - 137 154 - - 154
46 - 9 - 144 199 - - 199 29 11 4 - 243 287 - - 287
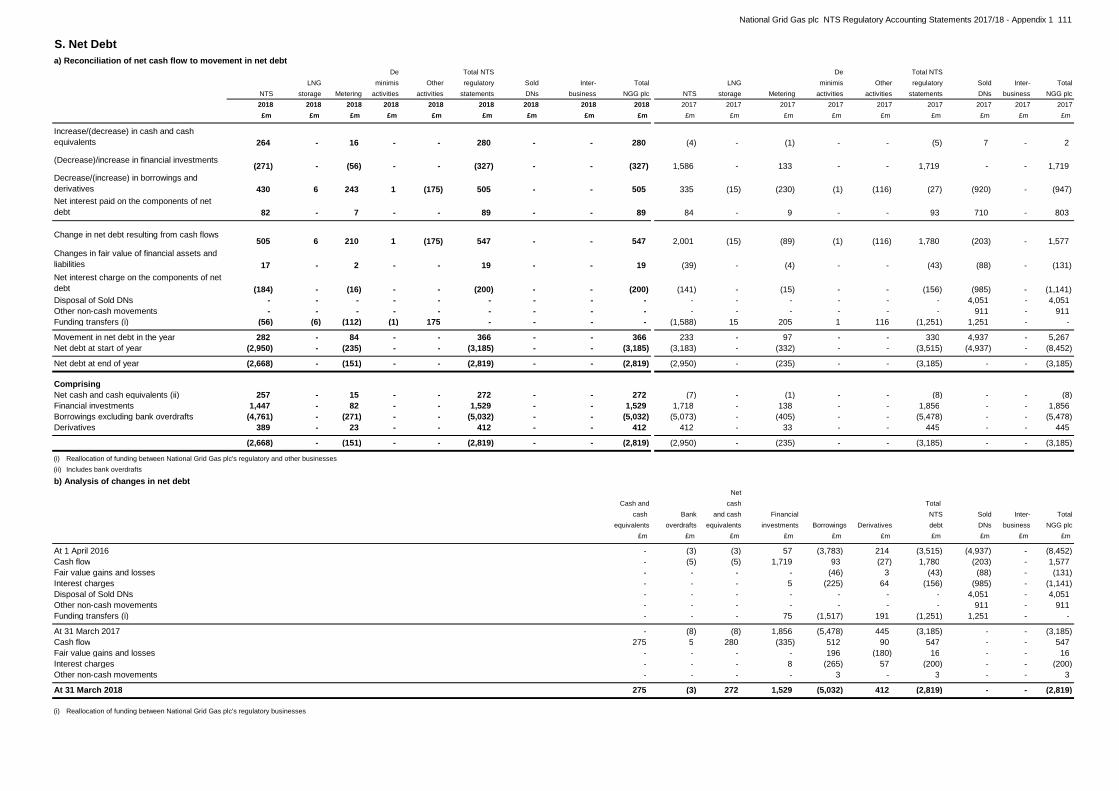
National Grid Gas plc NTS Regulatory Accounting Statements 2017/18 - Appendix 1 111
S. Net Debt
a) Reconciliation of net cash flow to movement in net debt
De Total NTS De Total NTS
LNG minimis Other regulatory Sold Inter- Total LNG minimis Other regulatory Sold Inter- Total
NTS storage Metering activities activities statements DNs business NGG plc NTS storage Metering activities activities statements DNs business NGG plc
2018 2018 2018 2018 2018 2018 2018 2018 2018 2017 2017 2017 2017 2017 2017 2017 2017 2017
£m £m £m £m £m £m £m £m £m £m £m £m £m £m £m £m £m £m
264 - 16 - - 280 - - 280 (4) - (1) - - (5) 7 - 2
(271) - (56) - - (327) - - (327) 1,586 - 133 - - 1,719 - - 1,719
430 6 243 1 (175) 505 - - 505 335 (15) (230) (1) (116) (27) (920) - (947)
82 - 7 - - 89 - - 89 84 - 9 - - 93 710 - 803
505 6 210 1 (175) 547 - - 547 2,001 (15) (89) (1) (116) 1,780 (203) - 1,577
17 - 2 - - 19 - - 19 (39) - (4) - - (43) (88) - (131)
(184) - (16) - - (200) - - (200) (141) - (15) - - (156) (985) - (1,141)
Disposal of Sold DNs - - - - - - - - - - - - - - - 4,051 - 4,051
Other non-cash movements - - - - - - - - - - - - - - - 911 - 911
Funding transfers (i) (56) (6) (112) (1) 175 - - - - (1,588) 15 205 1 116 (1,251) 1,251 - -
Movement in net debt in the year 282 - 84 - - 366 - - 366 233 - 97 - - 330 4,937 - 5,267
Net debt at start of year (2,950) - (235) - - (3,185) - - (3,185) (3,183) - (332) - - (3,515) (4,937) - (8,452)
Net debt at end of year (2,668) - (151) - - (2,819) - - (2,819) (2,950) - (235) - - (3,185) - - (3,185)
Comprising
Net cash and cash equivalents (ii) 257 - 15 - - 272 - - 272 (7) - (1) - - (8) - - (8)
Financial investments 1,447 - 82 - - 1,529 - - 1,529 1,718 - 138 - - 1,856 - - 1,856
Borrowings excluding bank overdrafts (4,761) - (271) - - (5,032) - - (5,032) (5,073) - (405) - - (5,478) - - (5,478)
Derivatives 389 - 23 - - 412 - - 412 412 - 33 - - 445 - - 445
(2,668) - (151) - - (2,819) - - (2,819) (2,950) - (235) - - (3,185) - - (3,185)
(i) Reallocation of funding between National Grid Gas plc's regulatory and other businesses
(ii) Includes bank overdrafts
b) Analysis of changes in net debt
Net
Cash and cash Total
cash Bank and cash Financial NTS Sold Inter- Total
equivalents overdrafts equivalents investments Borrowings Derivatives debt DNs business NGG plc
£m £m £m £m £m £m £m £m £m £m
At 1 April 2016 - (3) (3) 57 (3,783) 214 (3,515) (4,937) - (8,452)
Cash flow - (5) (5) 1,719 93 (27) 1,780 (203) - 1,577
Fair value gains and losses - - - - (46) 3 (43) (88) - (131)
Interest charges - - - 5 (225) 64 (156) (985) - (1,141)
Disposal of Sold DNs - - - - - - - 4,051 - 4,051
Other non-cash movements - - - - - - - 911 - 911
Funding transfers (i) - - - 75 (1,517) 191 (1,251) 1,251 - -
At 31 March 2017 - (8) (8) 1,856 (5,478) 445 (3,185) - - (3,185)
Cash flow 275 5 280 (335) 512 90 547 - - 547
Fair value gains and losses - - - - 196 (180) 16 - - 16
Interest charges - - - 8 (265) 57 (200) - - (200)
Other non-cash movements - - - - 3 - 3 - - 3
At 31 March 2018 275 (3) 272 1,529 (5,032) 412 (2,819) - - (2,819)
(i) Reallocation of funding between National Grid Gas plc's regulatory businesses
Net interest charge on the components of net
debt
Increase/(decrease) in cash and cash
equivalents
(Decrease)/increase in financial investments
Decrease/(increase) in borrowings and
derivatives
Net interest paid on the components of net
debt
Change in net debt resulting from cash flows
Changes in fair value of financial assets and
liabilities

112 National Grid Gas plc NTS Regulatory Accounting Statements 2017/18 - Appendix 1
T. Commitments and contingenciesa) Future capital expenditure
The following analyses commitments for future capital expenditure by regulatory business:
De Total NTS De Total NTS
LNG minimis Other regulatory Sold Inter- Total LNG minimis Other regulatory Sold Inter- Total
NTS storage Metering activities activities statements DNs business NGG plc NTS storage Metering activities activities statements DNs business NGG plc
2018 2018 2018 2018 2018 2018 2018 2018 2018 2017 2017 2017 2017 2017 2017 2017 2017 2017
£m £m £m £m £m £m £m £m £m £m £m £m £m £m £m £m £m £m
Contracted for but not provided 297 - 2 - - 299 - - 299 372 - - - - 372 - - 372
b) Lease commitments
Total commitments under non-cancellable operating leases by regulatory business were as follows:
De Total NTS De Total NTS
LNG minimis Other regulatory Sold Inter- Total LNG minimis Other regulatory Sold Inter- Total
NTS storage Metering activities activities statements DNs business NGG plc NTS storage Metering activities activities statements DNs business NGG plc
2018 2018 2018 2018 2018 2018 2018 2018 2018 2017 2017 2017 2017 2017 2017 2017 2017 2017
£m £m £m £m £m £m £m £m £m £m £m £m £m £m £m £m £m £m
Amounts due:
Less than 1 year 6 - - - - 6 - - 6 7 - - - - 7 - - 7
In 1 - 2 years 5 - - - - 5 - - 5 6 - - - - 6 - - 6
In 2 - 3 years 3 - - - - 3 - - 3 5 - - - - 5 - - 5
In 3 - 4 years 3 - - - - 3 - - 3 4 - - - - 4 - - 4
In 4 - 5 years 3 - - - - 3 - - 3 4 - - - - 4 - - 4
More than 5 years 5 - - - - 5 - - 5 9 - 1 - (1) 9 - - 9
25 - - - - 25 - - 25 35 - 1 - (1) 35 - - 35

National Grid Gas plc NTS Regulatory Accounting Statements 2017/18 - Appendix 1 113
U. Related party transactions
De Total NTS De Total NTS
LNG minimis Other regulatory Sold Inter- Total LNG minimis Other regulatory Sold Inter- Total
NTS storage Metering activities activities statements DNs business NGG plc NTS storage Metering activities activities statements DNs business NGG plc
2018 2018 2018 2018 2018 2018 2018 2018 2018 2017 2017 2017 2017 2017 2017 2017 2017 2017
£m £m £m £m £m £m £m £m £m £m £m £m £m £m £m £m £m £m
Income
Goods and services supplied 221 - 3 - - 224 - - 224 73 - - - 109 182 7 - 189
Expenditure
Services received 9 - 19 - - 28 - - 28 20 - - - - 20 8 - 28
Corporate services received 6 - 2 - - 8 - - 8 14 - - - - 14 - - 14
Charges in respect of pension costs 13 - - - - 13 - - 13 28 - 1 - - 29 8 - 37
- - - - - - - - - 7 - - - - 7 - - 7
28 - 21 - - 49 - - 49 69 - 1 - - 70 16 - 86
Outstanding balances at 31 March in respect of income, expenditure
and settlement of corporation tax
Amounts receivable 47 - 4 - - 51 - - 51 158 - 11 - - 169 - - 169
Amounts payable (346) - (24) - - (370) - - (370) (229) - (18) - - (247) (10) - (257)
Advances to parent (due within one year)
At 31 March 20 - 1 - - 21 - - 21 20 - 1 - - 21 - - 21
Advances to ultimate parent company (due after more than one year)
At 31 March 3,173 - 253 - - 3,426 - - 3,426 3,173 - 253 - - 3,426 - - 3,426
Borrowings payable to ultimate parent company (amounts due within one year)
At 31 March 610 - 35 - - 645 - - 645 - - - - - - - - -
Interest paid on borrowings from fellow
subsidiaries

114 National Grid Gas plc NTS Regulatory accounting statements 2017/18 - Appendix 2
-
Appendix 2 - Unpublished information
De minimis activities and other activities
In accordance with the Regulatory licence, Condition A30, paragraph 24, this information does not form part of the published regulatory accounting statements.
This appendix comprises information which the Company is required to include in its regulatory statements, but which under the terms of Special Standard Condition A30 it is not requiredto publish.

National Grid Gas plc NTS Regulatory accounting statements 2017/18 - Appendix 2 115
Charges and apportionments
In accordance with the Regulatory licence, Condition A30, paragraph 24, this information does not form part of the published regulatory accounting statements.

116 National Grid Gas plc NTS Regulatory accounting statements 2017/18 - Appendix 2
Charges and apportionments continued
In accordance with the Regulatory licence, Condition A30, paragraph 24, this information does not form part of the published regulatory accounting statements.

National Grid Gas plc NTS Regulatory accounting statements 2017/18 - Appendix 2 117
W. Charges and apportionments continued
In accordance with the Regulatory licence, Condition A30, paragraph 24, this information does not form part of the published regulatory accounting statements.
118 National Grid Gas plc NTS Regulatory accounting statements 2017/18 - Appendix 3
Appendix 3 - Supplementary analysis of the regulatory NTS business by activity
Income statement
The information in this appendix is provided only to Ofgem

National Grid Gas plc NTS Regulatory accounting statements 2017/18 - Appendix 3 119
Statement of financial position
The information in this appendix is provided only to Ofgem

120 National Grid Gas plc NTS Regulatory accounting statements 2017/18 - Appendix 3
Cash flow statement
The information in this appendix is provided only to Ofgem

National Grid Gas plc NTS Regulatory accounting statements 2017/18 - Appendix 3 121
Notes to the supplementary analysis
The information in this appendix is provided only to Ofgem

122 National Grid Gas plc NTS Regulatory accounting statements 2017/18 - Appendix 3
Notes to the supplementary analysis continued
The information in this appendix is provided only to Ofgem
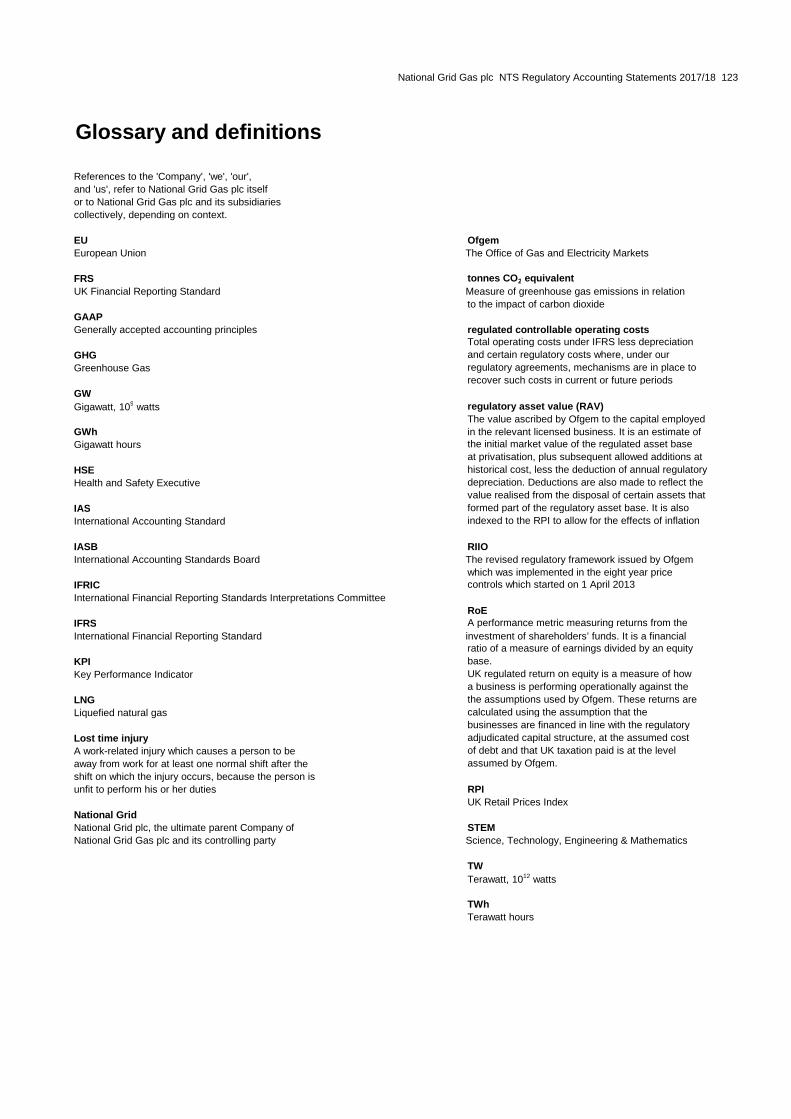
National Grid Gas plc NTS Regulatory Accounting Statements 2017/18 123
Glossary and definitions
References to the 'Company', 'we', 'our',
and 'us', refer to National Grid Gas plc itself
or to National Grid Gas plc and its subsidiaries
collectively, depending on context.
EU Ofgem
European Union The Office of Gas and Electricity Markets
FRS tonnes CO2 equivalent
UK Financial Reporting Standard Measure of greenhouse gas emissions in relation
to the impact of carbon dioxide
GAAP
Generally accepted accounting principles regulated controllable operating costsTotal operating costs under IFRS less depreciation
GHG and certain regulatory costs where, under our
Greenhouse Gas regulatory agreements, mechanisms are in place to
recover such costs in current or future periods
GW
Gigawatt, 109 watts regulatory asset value (RAV)
The value ascribed by Ofgem to the capital employed
GWh in the relevant licensed business. It is an estimate of
Gigawatt hours the initial market value of the regulated asset base
at privatisation, plus subsequent allowed additions at
HSE historical cost, less the deduction of annual regulatory
Health and Safety Executive depreciation. Deductions are also made to reflect the
value realised from the disposal of certain assets that
IAS formed part of the regulatory asset base. It is also
International Accounting Standard indexed to the RPI to allow for the effects of inflation
IASB RIIO
International Accounting Standards Board The revised regulatory framework issued by Ofgem
which was implemented in the eight year price
IFRIC controls which started on 1 April 2013
International Financial Reporting Standards Interpretations Committee
RoE
IFRS A performance metric measuring returns from the
International Financial Reporting Standard investment of shareholders’ funds. It is a financialratio of a measure of earnings divided by an equity
KPI base.
Key Performance Indicator UK regulated return on equity is a measure of how
a business is performing operationally against the
LNG the assumptions used by Ofgem. These returns are
Liquefied natural gas calculated using the assumption that the
businesses are financed in line with the regulatory
Lost time injury adjudicated capital structure, at the assumed cost
A work-related injury which causes a person to be of debt and that UK taxation paid is at the level
away from work for at least one normal shift after the assumed by Ofgem.
shift on which the injury occurs, because the person is
unfit to perform his or her duties RPI
UK Retail Prices Index
National Grid
National Grid plc, the ultimate parent Company of STEM
National Grid Gas plc and its controlling party Science, Technology, Engineering & Mathematics
TW
Terawatt, 1012 watts
TWh
Terawatt hours

National Grid Gas plc
1-3 Strand, London WC2N 5EH, United Kingdom
Registered in England and Wales Company number 2006000