national functional guidelines for organic …. document organization ... organic data review...
TRANSCRIPT

&EPA Office of Superfund Remediation and Technology Innovation (OSRTI) United States Environmental Protection Agency (EPA) Washington, DC 20460
NATIONALFUNCTIONALGUIDELINES for Organic Superfund Methods Data Review
OLEM 9355.0-136 EPA-540-R-2017-002 January 2017

January 2017 ii
This page is intentionally left blank.
January 2017 iii
NOTICE
The policies and procedures set forth here are intended as guidance to the United States Environmental Protection Agency (EPA) and other governmental employees. They do not constitute rule-making by the EPA, and may not be relied upon to create a substantive or procedural right enforceable by any other person. The Government may take action that is at a variance with the policies and procedures in this manual. This document can be obtained from the EPA’s Superfund Analytical Services and Contract Laboratory Program website at:
https://www.epa.gov/clp/contract-laboratory-program-national-functional-guidelines-data-review

January 2017 iv
This page is intentionally left blank.

January 2017 v
TABLE OF CONTENTS
LIST OF TABLES .................................................................................................................................... vii
ACRONYMS AND ABBREVIATIONS .................................................................................................. ix
I. Terminology ..................................................................................................................................... ix
INTRODUCTION ....................................................................................................................................... 1
I. Purpose of Document ........................................................................................................................ 1 II. Limitations of Use ............................................................................................................................. 1 III. Document Organization ..................................................................................................................... 1 IV. For Additional Information ............................................................................................................... 1
PART A: GENERAL DATA REVIEW .................................................................................................... 3
I. Preliminary Review ........................................................................................................................... 5 II. Data Qualifier Definitions ................................................................................................................. 6 III. Data Review Narrative ...................................................................................................................... 7
PART B: METHOD-SPECIFIC DATA REVIEW .................................................................................. 9
TRACE VOLATILE DATA REVIEW ................................................................................................... 11
I. Preservation and Holding Times ..................................................................................................... 13 II. Gas Chromatograph/Mass Spectrometer Instrument Performance Check ...................................... 15 III. Initial Calibration ............................................................................................................................. 23 IV. Initial Calibration Verification ........................................................................................................ 28 V. Continuing Calibration Verification ................................................................................................ 31 VI. Blanks .............................................................................................................................................. 34 VII. Deuterated Monitoring Compound .................................................................................................. 37 VIII. Matrix Spike/Matrix Spike Duplicate .............................................................................................. 40 IX. Internal Standard ............................................................................................................................. 42 X. Target Analyte Identification........................................................................................................... 45 XI. Target Analyte Quantitation and Reported Contract Required Quantitation Limit ......................... 47 XII. Tentatively Identified Compounds .................................................................................................. 48 XIII. System Performance ........................................................................................................................ 51 XIV. Performance Evaluation Sample ..................................................................................................... 52 XV. Regional Quality Assurance and Quality Control ........................................................................... 54 XVI. Overall Assessment of Data ............................................................................................................ 55
LOW/MEDIUM VOLATILE DATA REVIEW .................................................................................... 57
I. Preservation and Holding Times ..................................................................................................... 59 II. Gas Chromatograph/Mass Spectrometer Instrument Performance Check ...................................... 63 III. Initial Calibration ............................................................................................................................. 71 IV. Initial Calibration Verification ........................................................................................................ 76 V. Continuing Calibration Verification ................................................................................................ 79 VI. Blanks .............................................................................................................................................. 82 VII. Deuterated Monitoring Compound .................................................................................................. 85 VIII. Matrix Spike/Matrix Spike Duplicate .............................................................................................. 88 IX. Internal Standard ............................................................................................................................. 90 X. Target Analyte Identification........................................................................................................... 93 XI. Target Analyte Quantitation and Reported Contract Required Quantitation Limit ......................... 95 XII. Tentatively Identified Compounds .................................................................................................. 97 XIII. System Performance ...................................................................................................................... 100 XIV. Performance Evaluation Sample ................................................................................................... 101 XV. Regional Quality Assurance and Quality Control ......................................................................... 103 XVI. Overall Assessment of Data .......................................................................................................... 104
January 2017 vi
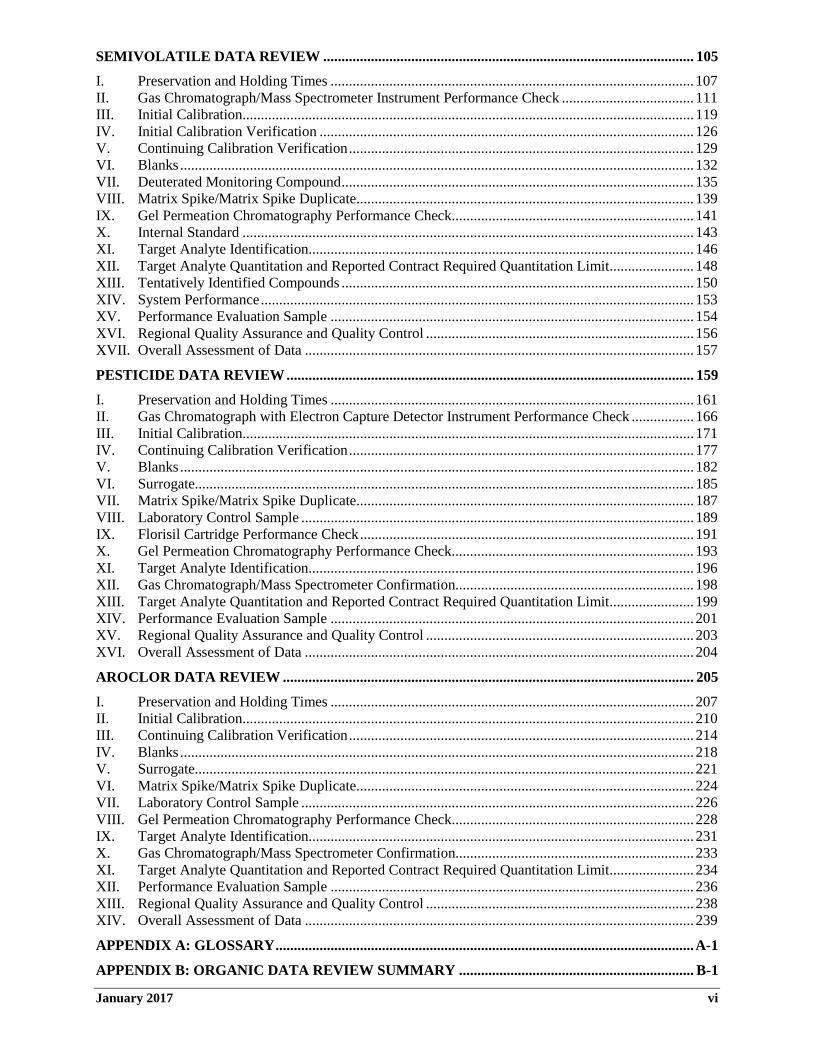
SEMIVOLATILE DATA REVIEW ..................................................................................................... 105
I. Preservation and Holding Times ................................................................................................... 107 II. Gas Chromatograph/Mass Spectrometer Instrument Performance Check .................................... 111 III. Initial Calibration ........................................................................................................................... 119 IV. Initial Calibration Verification ...................................................................................................... 126 V. Continuing Calibration Verification .............................................................................................. 129 VI. Blanks ............................................................................................................................................ 132 VII. Deuterated Monitoring Compound ................................................................................................ 135 VIII. Matrix Spike/Matrix Spike Duplicate ............................................................................................ 139 IX. Gel Permeation Chromatography Performance Check .................................................................. 141 X. Internal Standard ........................................................................................................................... 143 XI. Target Analyte Identification......................................................................................................... 146 XII. Target Analyte Quantitation and Reported Contract Required Quantitation Limit ....................... 148 XIII. Tentatively Identified Compounds ................................................................................................ 150 XIV. System Performance ...................................................................................................................... 153 XV. Performance Evaluation Sample ................................................................................................... 154 XVI. Regional Quality Assurance and Quality Control ......................................................................... 156 XVII. Overall Assessment of Data .......................................................................................................... 157
PESTICIDE DATA REVIEW ............................................................................................................... 159
I. Preservation and Holding Times ................................................................................................... 161 II. Gas Chromatograph with Electron Capture Detector Instrument Performance Check ................. 166 III. Initial Calibration ........................................................................................................................... 171 IV. Continuing Calibration Verification .............................................................................................. 177 V. Blanks ............................................................................................................................................ 182 VI. Surrogate........................................................................................................................................ 185 VII. Matrix Spike/Matrix Spike Duplicate ............................................................................................ 187 VIII. Laboratory Control Sample ........................................................................................................... 189 IX. Florisil Cartridge Performance Check ........................................................................................... 191 X. Gel Permeation Chromatography Performance Check .................................................................. 193 XI. Target Analyte Identification......................................................................................................... 196 XII. Gas Chromatograph/Mass Spectrometer Confirmation................................................................. 198 XIII. Target Analyte Quantitation and Reported Contract Required Quantitation Limit ....................... 199 XIV. Performance Evaluation Sample ................................................................................................... 201 XV. Regional Quality Assurance and Quality Control ......................................................................... 203 XVI. Overall Assessment of Data .......................................................................................................... 204
AROCLOR DATA REVIEW ................................................................................................................ 205
I. Preservation and Holding Times ................................................................................................... 207 II. Initial Calibration ........................................................................................................................... 210 III. Continuing Calibration Verification .............................................................................................. 214 IV. Blanks ............................................................................................................................................ 218 V. Surrogate........................................................................................................................................ 221 VI. Matrix Spike/Matrix Spike Duplicate ............................................................................................ 224 VII. Laboratory Control Sample ........................................................................................................... 226 VIII. Gel Permeation Chromatography Performance Check .................................................................. 228 IX. Target Analyte Identification......................................................................................................... 231 X. Gas Chromatograph/Mass Spectrometer Confirmation................................................................. 233 XI. Target Analyte Quantitation and Reported Contract Required Quantitation Limit ....................... 234 XII. Performance Evaluation Sample ................................................................................................... 236 XIII. Regional Quality Assurance and Quality Control ......................................................................... 238 XIV. Overall Assessment of Data .......................................................................................................... 239
APPENDIX A: GLOSSARY .................................................................................................................. A-1
APPENDIX B: ORGANIC DATA REVIEW SUMMARY ................................................................ B-1
Organic Data Review
January 2017 vii
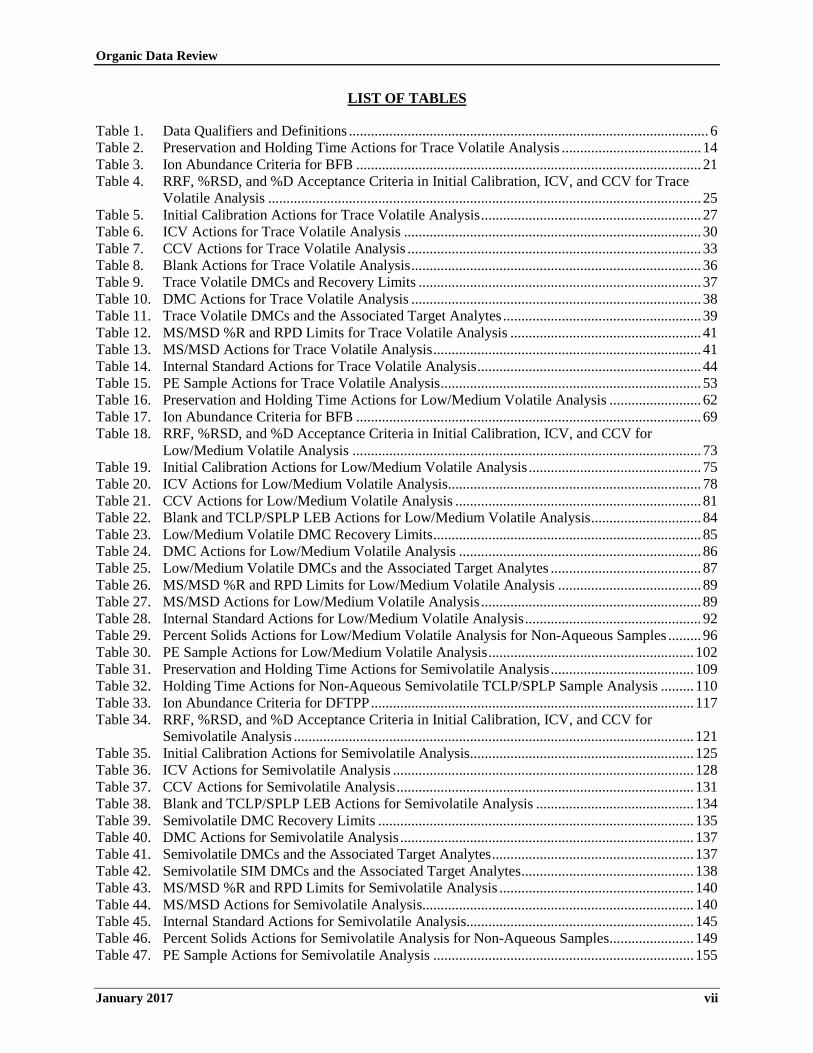
LIST OF TABLES
Table 1. Data Qualifiers and Definitions .................................................................................................. 6 Table 2. Preservation and Holding Time Actions for Trace Volatile Analysis ...................................... 14 Table 3. Ion Abundance Criteria for BFB .............................................................................................. 21 Table 4. RRF, %RSD, and %D Acceptance Criteria in Initial Calibration, ICV, and CCV for Trace
Volatile Analysis ...................................................................................................................... 25 Table 5. Initial Calibration Actions for Trace Volatile Analysis ............................................................ 27 Table 6. ICV Actions for Trace Volatile Analysis ................................................................................. 30 Table 7. CCV Actions for Trace Volatile Analysis ................................................................................ 33 Table 8. Blank Actions for Trace Volatile Analysis ............................................................................... 36 Table 9. Trace Volatile DMCs and Recovery Limits ............................................................................. 37 Table 10. DMC Actions for Trace Volatile Analysis ............................................................................... 38 Table 11. Trace Volatile DMCs and the Associated Target Analytes ...................................................... 39 Table 12. MS/MSD %R and RPD Limits for Trace Volatile Analysis .................................................... 41 Table 13. MS/MSD Actions for Trace Volatile Analysis ......................................................................... 41 Table 14. Internal Standard Actions for Trace Volatile Analysis ............................................................. 44 Table 15. PE Sample Actions for Trace Volatile Analysis ....................................................................... 53 Table 16. Preservation and Holding Time Actions for Low/Medium Volatile Analysis ......................... 62 Table 17. Ion Abundance Criteria for BFB .............................................................................................. 69 Table 18. RRF, %RSD, and %D Acceptance Criteria in Initial Calibration, ICV, and CCV for
Low/Medium Volatile Analysis ............................................................................................... 73 Table 19. Initial Calibration Actions for Low/Medium Volatile Analysis ............................................... 75 Table 20. ICV Actions for Low/Medium Volatile Analysis ..................................................................... 78 Table 21. CCV Actions for Low/Medium Volatile Analysis ................................................................... 81 Table 22. Blank and TCLP/SPLP LEB Actions for Low/Medium Volatile Analysis .............................. 84 Table 23. Low/Medium Volatile DMC Recovery Limits ......................................................................... 85 Table 24. DMC Actions for Low/Medium Volatile Analysis .................................................................. 86 Table 25. Low/Medium Volatile DMCs and the Associated Target Analytes ......................................... 87 Table 26. MS/MSD %R and RPD Limits for Low/Medium Volatile Analysis ....................................... 89 Table 27. MS/MSD Actions for Low/Medium Volatile Analysis ............................................................ 89 Table 28. Internal Standard Actions for Low/Medium Volatile Analysis ................................................ 92 Table 29. Percent Solids Actions for Low/Medium Volatile Analysis for Non-Aqueous Samples ......... 96 Table 30. PE Sample Actions for Low/Medium Volatile Analysis ........................................................ 102 Table 31. Preservation and Holding Time Actions for Semivolatile Analysis ....................................... 109 Table 32. Holding Time Actions for Non-Aqueous Semivolatile TCLP/SPLP Sample Analysis ......... 110 Table 33. Ion Abundance Criteria for DFTPP ........................................................................................ 117 Table 34. RRF, %RSD, and %D Acceptance Criteria in Initial Calibration, ICV, and CCV for
Semivolatile Analysis ............................................................................................................. 121 Table 35. Initial Calibration Actions for Semivolatile Analysis ............................................................. 125 Table 36. ICV Actions for Semivolatile Analysis .................................................................................. 128 Table 37. CCV Actions for Semivolatile Analysis ................................................................................. 131 Table 38. Blank and TCLP/SPLP LEB Actions for Semivolatile Analysis ........................................... 134 Table 39. Semivolatile DMC Recovery Limits ...................................................................................... 135 Table 40. DMC Actions for Semivolatile Analysis ................................................................................ 137 Table 41. Semivolatile DMCs and the Associated Target Analytes ....................................................... 137 Table 42. Semivolatile SIM DMCs and the Associated Target Analytes ............................................... 138 Table 43. MS/MSD %R and RPD Limits for Semivolatile Analysis ..................................................... 140 Table 44. MS/MSD Actions for Semivolatile Analysis.......................................................................... 140 Table 45. Internal Standard Actions for Semivolatile Analysis.............................................................. 145 Table 46. Percent Solids Actions for Semivolatile Analysis for Non-Aqueous Samples ....................... 149 Table 47. PE Sample Actions for Semivolatile Analysis ....................................................................... 155

Organic Data Review
January 2017 viii
Table 48. Preservation and Holding Time Actions for Pesticide Analysis ............................................. 164 Table 49. Holding Time Actions for Non-Aqueous Pesticide TCLP/SPLP Sample Analysis ............... 165 Table 50. Resolution Check Mixture ...................................................................................................... 166 Table 51. Performance Evaluation Mixture (PEM) ................................................................................ 166 Table 52. Individual Standard Mixtures A and B ................................................................................... 167 Table 53. Individual Standard Mixture C ............................................................................................... 168 Table 54. GC/ECD Instrument Performance Check Actions ................................................................. 170 Table 55. Concentration Levels of Calibration Standards ...................................................................... 171 Table 56. Initial Calibration Sequence 1 ................................................................................................ 173 Table 57. Initial Calibration Sequence 2 ................................................................................................ 173 Table 58. Initial Calibration Action for Pesticide Analysis .................................................................... 176 Table 59. CCV Actions for Pesticide Analysis ....................................................................................... 181 Table 60. Blank and TCLP/SPLP LEB Actions for Pesticide Analysis ................................................. 184 Table 61. Surrogate Actions for Pesticide Analysis ............................................................................... 186 Table 62. MS/MSD %R and RPD Limits for Pesticide Analysis ........................................................... 188 Table 63. MS/MSD Actions for Pesticide Analysis ............................................................................... 188 Table 64. LCS %R Limits for Pesticide Analysis................................................................................... 189 Table 65. LCS Actions for Pesticide Analysis ....................................................................................... 190 Table 66. Florisil Cartridge Performance Check Actions ....................................................................... 192 Table 67. GPC Performance Check Actions for Pesticide Analysis ...................................................... 195 Table 68. GC/MS Confirmation Actions ................................................................................................ 198 Table 69. Percent Solids Actions for Pesticide Analysis for Non-Aqueous Samples ............................ 200 Table 70. PE Sample Actions for Pesticide Analysis ............................................................................. 202 Table 71. Preservation and Holding Time Actions for Aroclor Analysis ............................................... 209 Table 72. Initial Calibration Sequence ................................................................................................... 211 Table 73. Initial Calibration Action for Aroclor Analysis ...................................................................... 213 Table 74. CCV Actions for Aroclor Analysis ......................................................................................... 217 Table 75. Blank Actions for Aroclor Analysis ....................................................................................... 220 Table 76. Surrogate Actions for Aroclor Analysis ................................................................................. 223 Table 77. MS/MSD %R and RPD Limits for Aroclor Analysis ............................................................. 225 Table 78. MS/MSD Actions for Aroclor Analysis ................................................................................. 225 Table 79. LCS %R Limits for Aroclor Analysis..................................................................................... 226 Table 80. LCS Actions for Aroclor Analysis ......................................................................................... 227 Table 81. GPC Performance Check Actions for Aroclor Analysis ........................................................ 230 Table 82. GC/MS Confirmation Actions ................................................................................................ 233 Table 83. Percent Solids Actions for Aroclor Analysis for Non-Aqueous Samples .............................. 235 Table 84. PE Sample Actions for Aroclor Analysis ............................................................................... 237

Organic Data Review
January 2017 ix
ACRONYMS AND ABBREVIATIONS
I. Terminology
The following acronyms and abbreviations may be found throughout this document. For definitions, see Appendix A: Glossary at the end of the document.
ARO Aroclors
BFB Bromofluorobenzene
CAS Chemical Abstracts Service
CCS Contract Compliance Screening
CCV Continuing Calibration Verification
CF Calibration Factor
CF���� Mean Calibration Factor
CLP Contract Laboratory Program
COR Contracting Officer’s Representative
CRQL Contract Required Quantitation Limit
CS3 Mid-point Calibration Standard
CSF Complete SDG File
DCB Decachlorobiphenyl
DFTPP Decafluorotriphenylphosphine
DMC Deuterated Monitoring Compound
DQA Data Quality Assessment
DQO Data Quality Objective
EDM EXES Data Manager
EPA United States Environmental Protection Agency
EXES Electronic Data Exchange and Evaluation System
GC Gas Chromatograph or Gas Chromatography
GC/ECD Gas Chromatograph/Electron Capture Detector GC/MS Gas Chromatograph/Mass Spectrometer or Gas Chromatography/Mass
Spectrometry GPC Gel Permeation Chromatography
ICAL Initial Calibration
ICV Initial Calibration Verification
INDA Individual Standard Mixture A
INDB Individual Standard Mixture B
INDC Individual Standard Mixture C
IUPAC International Union of Pure and Applied Chemistry
LCS Laboratory Control Sample
LEB Leachate Extraction Blank

Organic Data Review
January 2017 x
MS Mass Spectrometer or Mass Spectrometry
MS Matrix Spike
MSD Matrix Spike Duplicate
NFG National Functional Guidelines
NIH National Institutes of Health
NIST National Institute of Standards and Technology
OSRTI Office of Superfund Remediation and Technology Innovation
%Breakdown Percent Breakdown
%D Percent Difference
%R Percent Recovery
%Resolution Percent Resolution
%RSD Percent Relative Standard Deviation
%Solids Percent Solids
PAH Polycyclic Aromatic Hydrocarbon
PCP Pentachlorophenol
PCBs Polychlorinated Biphenyls
PE Performance Evaluation
PEM Performance Evaluation Mixture
PEST Pesticides
P/T Purge-and-trap
QA Quality Assurance
QAPP Quality Assurance Project Plan
QC Quality Control
RESC Resolution Check Mixture
RFQ Request for Quote
RIC Reconstructed Ion Chromatogram
RPD Relative Percent Difference
RRF Relative Response Factor
RRF������ Mean Relative Response Factor
RRT Relative Retention Time
RT Retention Time
RT���� Mean Retention Time
SAP Sampling and Analysis Plan
SDG Sample Delivery Group
SEDD Staged Electronic Data Deliverable
SIM Selected Ion Monitoring
SMO Sample Management Office
Organic Data Review
January 2017 xi
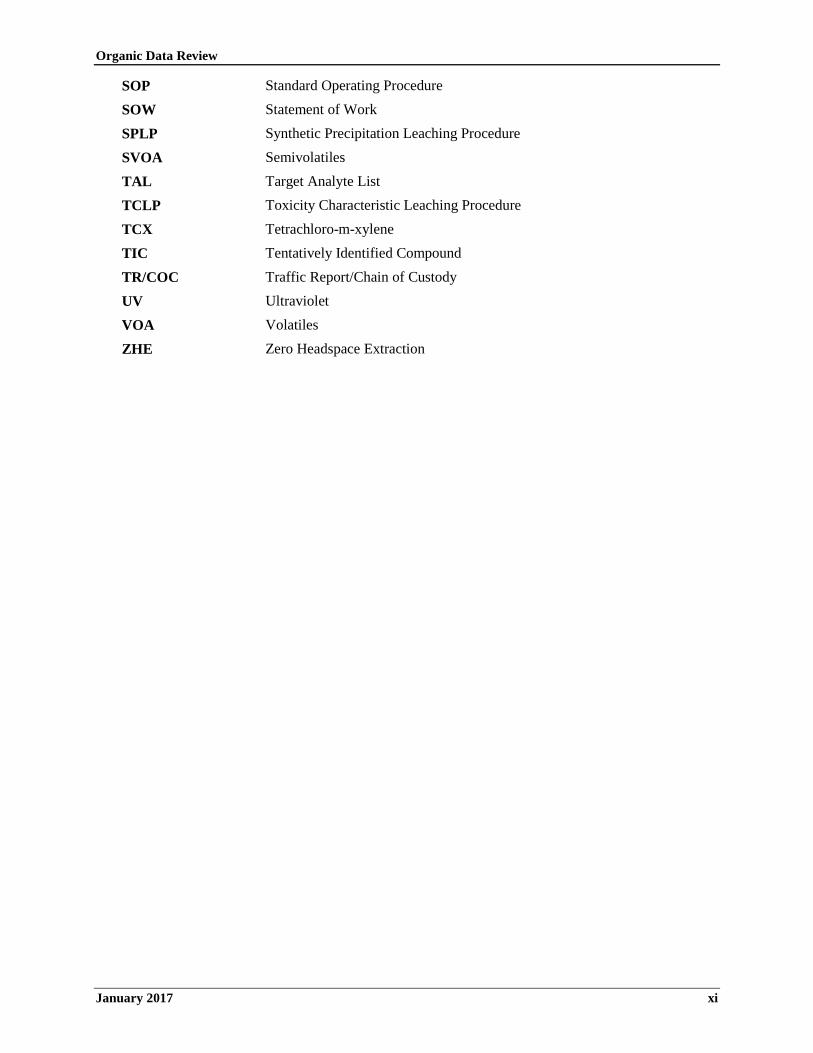
SOP Standard Operating Procedure
SOW Statement of Work
SPLP Synthetic Precipitation Leaching Procedure
SVOA Semivolatiles
TAL Target Analyte List
TCLP Toxicity Characteristic Leaching Procedure
TCX Tetrachloro-m-xylene
TIC Tentatively Identified Compound
TR/COC Traffic Report/Chain of Custody
UV Ultraviolet
VOA Volatiles
ZHE Zero Headspace Extraction

Organic Data Review
January 2017 xii
This page is intentionally left blank.

Organic Data Review Introduction
January 2017 1
INTRODUCTION
I. Purpose of Document
This document contains guidance to aid the data reviewer in determining the usability of analytical data generated using the United States Environmental Protection Agency (EPA) Contract Laboratory Program (CLP) Statement of Work (SOW) for Organic Superfund Methods (Multi-Media, Multi-Concentration) SOM02.4. The SOW includes analytical methods for Trace Volatiles (Trace VOA), Low-Medium Volatiles (Low/Med VOA), Semivolatiles (SVOA), Pesticides (PEST), and Aroclors (ARO).
The guidelines presented in this document are designed to assist the data reviewer in evaluating: (a) whether the analytical data meet the technical and Quality Control (QC) criteria specified in the SOW, and (b) the usability and extent of bias of any data not meeting these criteria. This document contains definitive guidance in areas such as blanks, calibration standards, QC audit samples, and instrument performance checks, in which performance is fully under a laboratory’s control. General guidance is provided to aid the reviewer in making subjective judgments regarding the use of data that are affected by site conditions (e.g., sample matrix effects) and do not meet SOW-specific requirements.
II. Limitations of Use
This guidance is specific to the review of analytical data generated using CLP SOW SOM02.4. It applies to the current version of the SOW, as well as future versions that contain editorial changes. To use this document effectively, the reviewer should have an understanding of the analytical methods and a general overview of the Sample Delivery Group (SDG) or Case at hand. This guidance is not appropriate for use in conducting contract compliance reviews and should be used with caution in reviewing data generated using methods other than the CLP SOW SOM02.4, although the general types of QC checks, the evaluation procedures, and the decisions made after consideration of the evaluation criteria may be applicable to data from any similar method.
While this document is a valuable aid in the data review process, other sources of guidance and information, along with professional judgment, are useful in determining the ultimate usability of the data. This is particularly critical in those cases where all data do not meet SOW-specific technical and QC criteria. To make the appropriate judgments, the reviewer needs to gain a complete understanding of the intended use of the data, and is strongly encouraged to establish a dialogue with the data user prior to and following the data review, to discuss usability issues and resolve questions regarding the review.
III. Document Organization
Following this introduction, the document is presented in two major parts: Part A – General Data Review, which applies to all methods; and Part B – Method-Specific Data Review. In Part B, each method is addressed individually in a stand-alone format. A complete list of acronyms used in this document appears preceding this Introduction, and a Glossary is appended as Appendix A.
IV. For Additional Information
For additional information regarding the CLP and the services it provides, refer to EPA’s Superfund Analytical Services and Contract Laboratory Program website at https://www.epa.gov/clp.
Organic Data Review
January 2017 2
This page is intentionally left blank.

Organic Data Review General
January 2017 3
PART A: GENERAL DATA REVIEW

Organic Data Review General
January 2017 4
This page is intentionally left blank.

Organic Data Review General
January 2017 5
I. Preliminary Review
A preliminary review should be performed on the data, prior to embarking on the method-specific review (see Part B). During this process, the reviewer should compile the necessary data package elements to ensure that all of the information needed to determine data usability is available. The preliminary review also allows the reviewer to obtain an overview of the Case or Sample Delivery Group (SDG) under review.
This initial review should include, but is not limited to, verification of the exact number of samples, their assigned number and matrices, and the Contractor laboratory name. It should take into consideration all the documentation specific to the sample data package, which may include Modified Analysis requests, the Traffic Report/Chain of Custody (TR/COC) Record, the SDG Narrative, and other applicable documents.
The reviewer should be aware that minor modifications to the Statement of Work (SOW) that have been made through a Modified Analysis request, to meet site-specific requirements, could affect certain validation criteria such as the Contract Required Quantitation Limits (CRQLs), initial calibration (ICAL) levels, and Target Analyte Lists (TALs). Therefore, these modifications should be applied during the method-specific review (Part B) process.
The Cases or SDGs routinely have unique field quality control (QC) samples that may affect the outcome of the review. These include field and trip blanks, field duplicates, and Performance Evaluation (PE) samples which must be identified in the sampling records. The reviewer should verify that the following information is identified in the sampling records (e.g., TR/COC Records, field logs, and/or Contractor tables):
1. The United States Environmental Protection Agency (EPA) Region where the samples were collected; and
2. The complete list of samples with information on:
a. Sample matrix
b. Field blanks and trip blanks (if applicable)
c. Field duplicates (if applicable)
d. Field spikes (if applicable)
e. PE samples (if applicable)
f. Sampling dates
g. Sampling times
h. Shipping dates
i. Preservatives
j. Types of analysis
k. Contractor laboratory
The laboratory’s SDG Narrative is another source of general information, which includes notable problems with matrices; insufficient sample volume for analysis or reanalysis; samples received in broken containers; preservation information; and unusual events. The reviewer should also inspect any email or telephone/communication logs in the data package detailing any discussion of sample logistics, preparation, and/or analysis issues between the laboratory, the Contract Laboratory Program (CLP) Sample Management Office (SMO), and the EPA Region.
Organic Data Review General
January 2017 6
The reviewer should also have a copy of the Quality Assurance Project Plan (QAPP), or similar document, for the project for which samples were analyzed, to assist in the determination of final usability of the analytical data. The reviewer should contact the appropriate EPA Regional CLP Contracting Officer’s Representative (EPA Regional CLP COR) to obtain copies of the QAPP and relevant site information.
For data obtained through the CLP, the Staged Electronic Data Deliverable (SEDD) generated by the CLP laboratories is subjected to the following reviews via the Electronic Data Exchange and Evaluation System (EXES): 1) automated data assessment for Contract Compliance Screening (CCS) based on the technical and QC criteria in CLP SOW SOM02.4, and 2) automated data validation based on the criteria in the EPA CLP National Functional Guidelines for Organic Superfund Methods Data Review. In addition, completeness checks are manually performed on the hardcopy data. The automated CCS results and hardcopy data issues are subsequently included in a CCS defect report that is provided to the laboratory. The laboratory may then submit a reconciliation package for any missing items or to correct noncompliant data identified in the report. The automated data validation results are summarized in criteria-based National Functional Guidelines (NFG) reports that are provided to the EPA Regions. The data reviewer can access the CCS and NFG reports through the EXES Data Manager (EDM) via the Superfund Analytical Services SMO Portal and may use them in determining data usability.
For access to the Superfund Analytical Services SMO Portal, refer to the following EPA Superfund Analytical Services and Contract Laboratory Program web page to contact the EPA Regional CLP COR from the EPA Region where the data review is being performed and obtain the necessary username and password information:
https://www.epa.gov/clp/forms/contact-us-about-superfund-analytical-services-or-contract-laboratory-program#tab-3
For concerns or questions regarding the data package, contact the EPA Regional CLP COR from the EPA Region where the samples were collected.
II. Data Qualifier Definitions
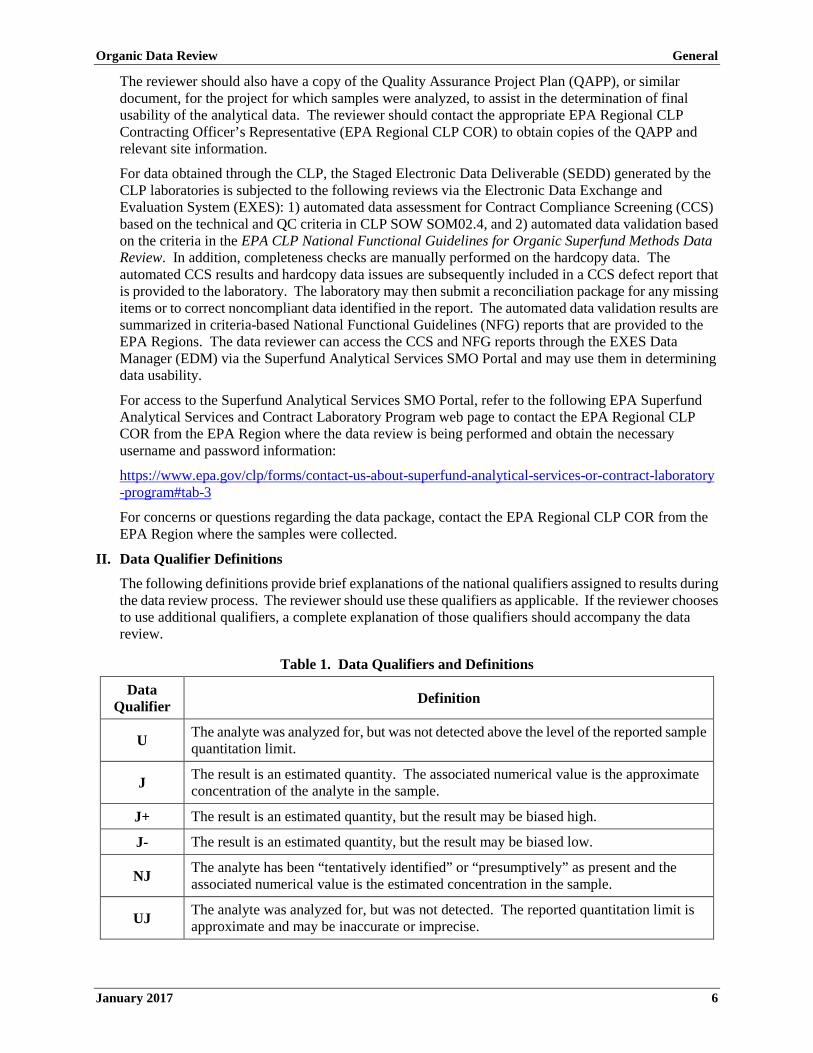
The following definitions provide brief explanations of the national qualifiers assigned to results during the data review process. The reviewer should use these qualifiers as applicable. If the reviewer chooses to use additional qualifiers, a complete explanation of those qualifiers should accompany the data review.
Table 1. Data Qualifiers and Definitions
Data Qualifier Definition
U The analyte was analyzed for, but was not detected above the level of the reported sample quantitation limit.
J The result is an estimated quantity. The associated numerical value is the approximate concentration of the analyte in the sample.
J+ The result is an estimated quantity, but the result may be biased high.
J- The result is an estimated quantity, but the result may be biased low.
NJ The analyte has been “tentatively identified” or “presumptively” as present and the associated numerical value is the estimated concentration in the sample.
UJ The analyte was analyzed for, but was not detected. The reported quantitation limit is approximate and may be inaccurate or imprecise.
Organic Data Review General
January 2017 7
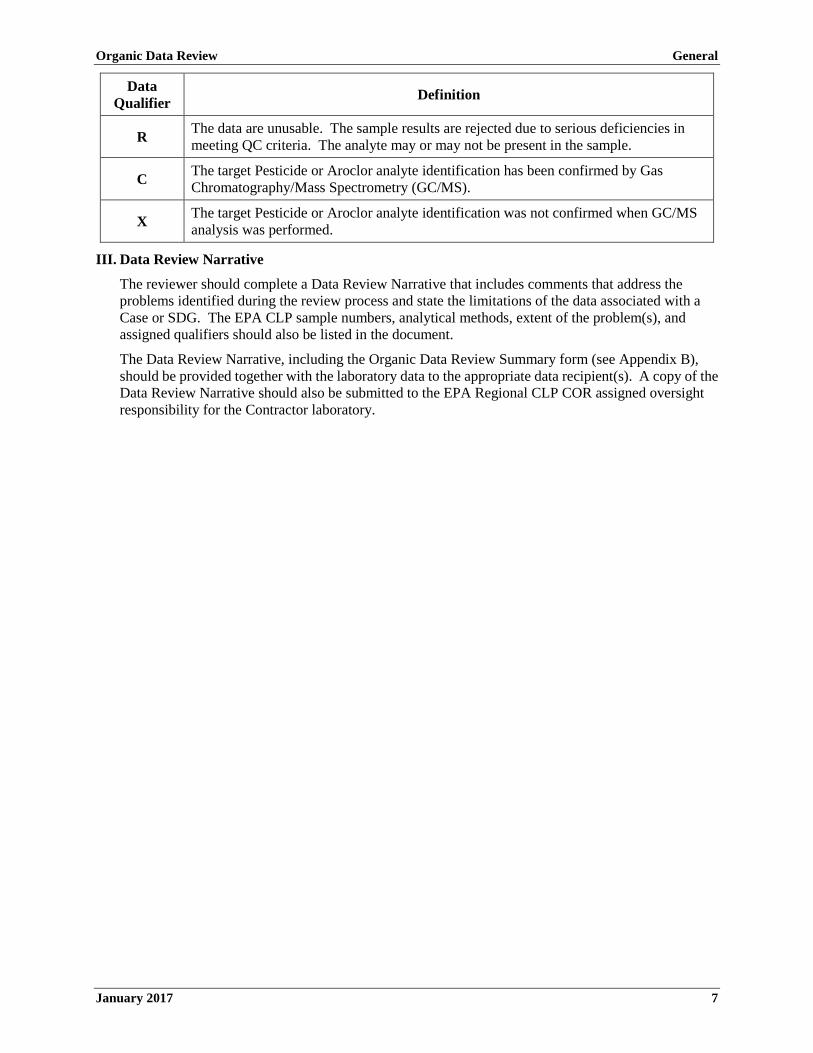
Data Qualifier Definition
R The data are unusable. The sample results are rejected due to serious deficiencies in meeting QC criteria. The analyte may or may not be present in the sample.
C The target Pesticide or Aroclor analyte identification has been confirmed by Gas Chromatography/Mass Spectrometry (GC/MS).
X The target Pesticide or Aroclor analyte identification was not confirmed when GC/MS analysis was performed.
III. Data Review Narrative
The reviewer should complete a Data Review Narrative that includes comments that address the problems identified during the review process and state the limitations of the data associated with a Case or SDG. The EPA CLP sample numbers, analytical methods, extent of the problem(s), and assigned qualifiers should also be listed in the document.
The Data Review Narrative, including the Organic Data Review Summary form (see Appendix B), should be provided together with the laboratory data to the appropriate data recipient(s). A copy of the Data Review Narrative should also be submitted to the EPA Regional CLP COR assigned oversight responsibility for the Contractor laboratory.

Organic Data Review
January 2017 8
This page is intentionally left blank.
Organic Data Review
January 2017 9
PART B: METHOD-SPECIFIC DATA REVIEW

Organic Data Review
January 2017 10
This page is intentionally left blank.

Organic Data Review Trace VOA
January 2017 11
TRACE VOLATILE DATA REVIEW
The Trace Volatile organic data requirements to be reviewed during validation are listed below:
I. Preservation and Holding Times ..................................................................................................... 13
II. Gas Chromatograph/Mass Spectrometer Instrument Performance Check ...................................... 15
III. Initial Calibration ............................................................................................................................. 23
IV. Initial Calibration Verification ........................................................................................................ 28
V. Continuing Calibration Verification ................................................................................................ 31
VI. Blanks .............................................................................................................................................. 34
VII. Deuterated Monitoring Compound .................................................................................................. 37
VIII. Matrix Spike/Matrix Spike Duplicate .............................................................................................. 40
IX. Internal Standard ............................................................................................................................. 42
X. Target Analyte Identification........................................................................................................... 45
XI. Target Analyte Quantitation and Reported Contract Required Quantitation Limit ......................... 47
XII. Tentatively Identified Compounds .................................................................................................. 48
XIII. System Performance ........................................................................................................................ 51
XIV. Performance Evaluation Sample ..................................................................................................... 52
XV. Regional Quality Assurance and Quality Control ........................................................................... 54
XVI. Overall Assessment of Data ............................................................................................................ 55

Organic Data Review Trace VOA
January 2017 12
This page is intentionally left blank.
Organic Data Review Trace VOA
January 2017 13
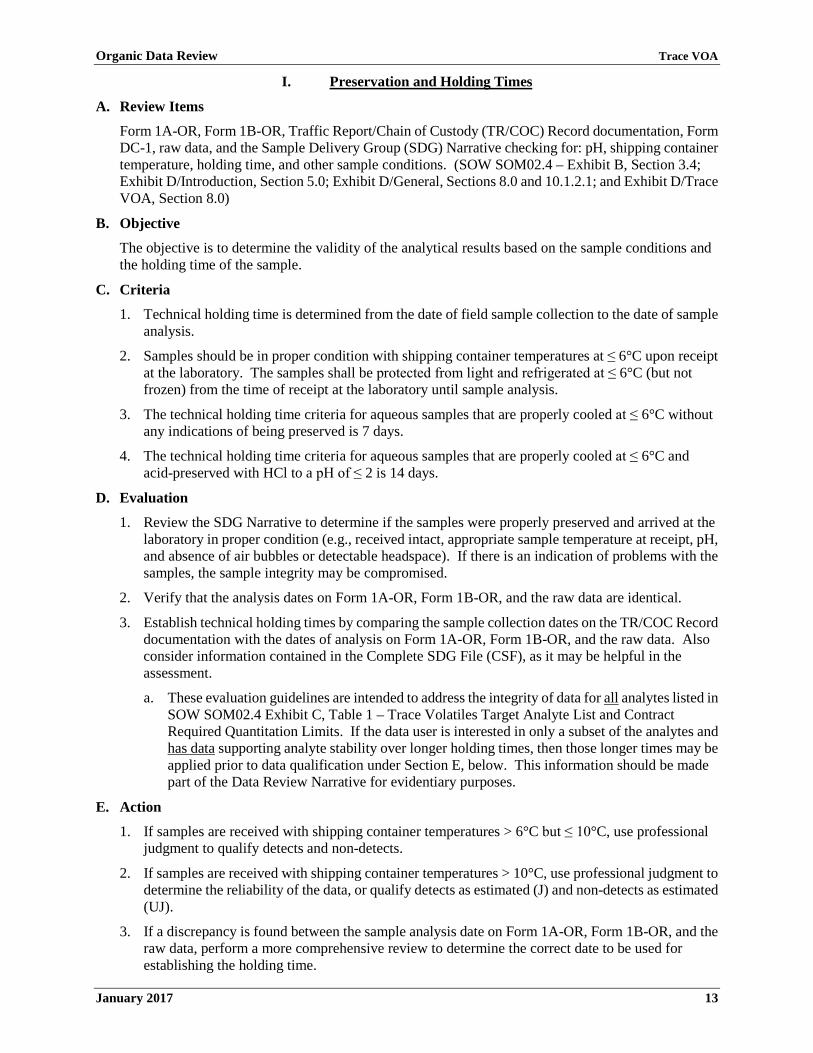
I. Preservation and Holding Times
A. Review Items
Form 1A-OR, Form 1B-OR, Traffic Report/Chain of Custody (TR/COC) Record documentation, Form DC-1, raw data, and the Sample Delivery Group (SDG) Narrative checking for: pH, shipping container temperature, holding time, and other sample conditions. (SOW SOM02.4 – Exhibit B, Section 3.4; Exhibit D/Introduction, Section 5.0; Exhibit D/General, Sections 8.0 and 10.1.2.1; and Exhibit D/Trace VOA, Section 8.0)
B. Objective
The objective is to determine the validity of the analytical results based on the sample conditions and the holding time of the sample.
C. Criteria
1. Technical holding time is determined from the date of field sample collection to the date of sample analysis.
2. Samples should be in proper condition with shipping container temperatures at ≤ 6°C upon receipt at the laboratory. The samples shall be protected from light and refrigerated at ≤ 6°C (but not frozen) from the time of receipt at the laboratory until sample analysis.
3. The technical holding time criteria for aqueous samples that are properly cooled at ≤ 6°C without any indications of being preserved is 7 days.
4. The technical holding time criteria for aqueous samples that are properly cooled at ≤ 6°C and acid-preserved with HCl to a pH of ≤ 2 is 14 days.
D. Evaluation
1. Review the SDG Narrative to determine if the samples were properly preserved and arrived at the laboratory in proper condition (e.g., received intact, appropriate sample temperature at receipt, pH, and absence of air bubbles or detectable headspace). If there is an indication of problems with the samples, the sample integrity may be compromised.
2. Verify that the analysis dates on Form 1A-OR, Form 1B-OR, and the raw data are identical.
3. Establish technical holding times by comparing the sample collection dates on the TR/COC Record documentation with the dates of analysis on Form 1A-OR, Form 1B-OR, and the raw data. Also consider information contained in the Complete SDG File (CSF), as it may be helpful in the assessment.
a. These evaluation guidelines are intended to address the integrity of data for all analytes listed in SOW SOM02.4 Exhibit C, Table 1 – Trace Volatiles Target Analyte List and Contract Required Quantitation Limits. If the data user is interested in only a subset of the analytes and has data supporting analyte stability over longer holding times, then those longer times may be applied prior to data qualification under Section E, below. This information should be made part of the Data Review Narrative for evidentiary purposes.
E. Action
1. If samples are received with shipping container temperatures > 6°C but ≤ 10°C, use professional judgment to qualify detects and non-detects.
2. If samples are received with shipping container temperatures > 10°C, use professional judgment to determine the reliability of the data, or qualify detects as estimated (J) and non-detects as estimated (UJ).
3. If a discrepancy is found between the sample analysis date on Form 1A-OR, Form 1B-OR, and the raw data, perform a more comprehensive review to determine the correct date to be used for establishing the holding time.

Organic Data Review Trace VOA
January 2017 14
4. If samples are not properly preserved but are analyzed within the technical holding time of 7 days, detects and non-detects should not be qualified.
5. If samples are not properly preserved and are analyzed outside of the technical holding time of 7 days, qualify detects as estimated (J) and non-detects as unusable (R).
6. If samples are properly preserved and are analyzed within the technical holding time of 14 days, detects and non-detects should not be qualified.
7. If samples are properly preserved, but are analyzed outside of the technical holding time of 14 days, qualify detects as estimated (J) and non-detects as unusable (R).
8. When the holding times are exceeded, annotate in the Data Review Narrative any possible consequences for the analytical results.
9. If holding times are grossly exceeded, qualify detects as estimated (J) and non-detects as unusable (R). Note this for United States Environmental Protection Agency Regional Contract Laboratory Program Contracting Officer’s Representative (EPA Regional CLP COR) action. Annotate the effect of the holding time exceedance on the resulting data in the Data Review Narrative, whenever possible.
Table 2. Preservation and Holding Time Actions for Trace Volatile Analysis
Criteria Action
Detect Non-detect
Sample temperature > 6°C but ≤ 10°C upon receipt at the laboratory
Use professional judgment
Use professional judgment
Sample temperature > 10°C upon receipt at the laboratory
Use professional judgment
J*
Use professional judgment
UJ
Sample not preserved but analyzed within the 7-day technical holding time No qualification No qualification
Samples not preserved and analyzed outside the 7-day technical holding time J* R
Sample properly preserved and analyzed within the 14-day technical holding time No qualification No qualification
Sample properly preserved but analyzed outside the 14-day technical holding time J* R
Holding time grossly exceeded J* R
* The true direction of any bias may be unknown in this case. Use caution in determining whether some detected analytes should be qualified as estimated low (J-) or as estimated high (J+), based on knowledge of individual analyte stability or interactions (i.e., dehydrohalogenation).

Organic Data Review Trace VOA
January 2017 15
II. Gas Chromatograph/Mass Spectrometer Instrument Performance Check
A. Review Items
Form 5-OR, bromofluorobenzene (BFB) mass spectra, and mass listing. (SOW SOM02.4 – Exhibit B, Section 3.4 and Exhibit D/Trace VOA, Section 9.2)
B. Objective
The objective of performing Gas Chromatograph/Mass Spectrometer (GC/MS) instrument performance checks is to ensure adequate mass resolution, identification, and to some degree, sensitivity, and to document this level of performance prior to analyzing any sequence of standards or samples.
C. Criteria
1. A sufficient amount of the BFB instrument performance check solution (up to 50 ng BFB on-column) must be injected once at the beginning of each 12-hour period, during which samples, blanks, or standards are to be analyzed. The 12-hour period begins with the injection of BFB; however, in cases where a closing Continuing Calibration Verification (CCV) can be used as an opening CCV, the 12-hour period begins with the injection of the opening CCV.
Listed below are examples of acceptable analytical sequences incorporating the use of the opening and/or closing CCV. Use these examples as a guide for the possible analytical sequences that can be expected.
Conditions for When Example Sequence is
Appropriate:
Acceptable Criteria That Must Be Met: Notes:
Use Example 1 if time remains on the 12-hour clock after the initial calibration sequence.
• BFB tunes meet instrument performance criteria.
• The five Initial Calibration standards meet initial calibration criteria.
• Initial Calibration Verification (ICV) meets ICV criteria.
• CCV A meets both opening and closing CCV criteria.
• CCV B meets closing CCV criteria.
The requirement of starting the new 12-hour clock for Analytical Sequence 2 with a new BFB tune is waived if CCV A meets opening CCV criteria. If CCV B meets opening CCV criteria, a method blank and subsequent samples may be analyzed immediately after CCV B.
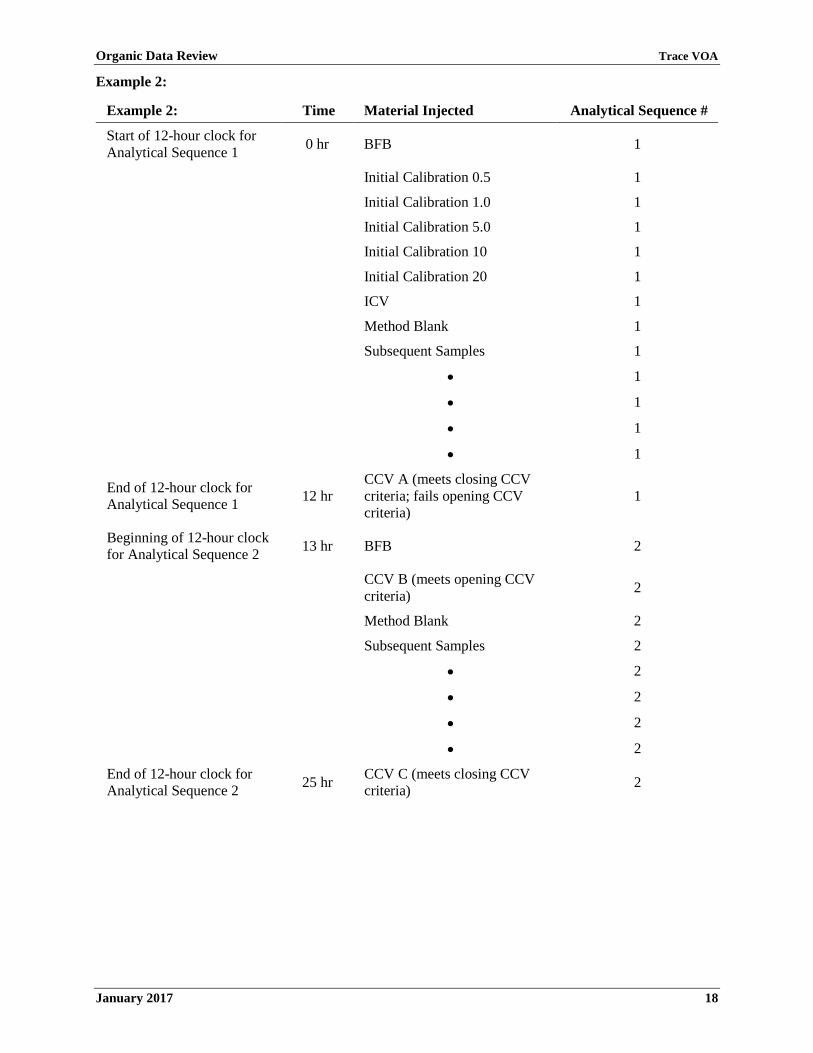
Use Example 2 if time remains on the 12-hour clock after the initial calibration sequence.
• BFB tunes meet instrument performance criteria.
• The five Initial Calibration standards meet initial calibration criteria.
• ICV meets ICV criteria. • CCV A meets closing CCV
criteria (but does not meet opening CCV criteria).
• CCV B meets opening CCV criteria.
• CCV C meets closing CCV criteria.
CCV A does not meet opening CCV criteria. Therefore, a new BFB tune must be performed, immediately followed by CCV B, before a method blank and any samples may be analyzed. In this case, the new 12-hour clock and Analytical Sequence 2 begins with the injection of the new BFB tune.

Organic Data Review Trace VOA
January 2017 16
Conditions for When Example Sequence is
Appropriate:
Acceptable Criteria That Must Be Met: Notes:
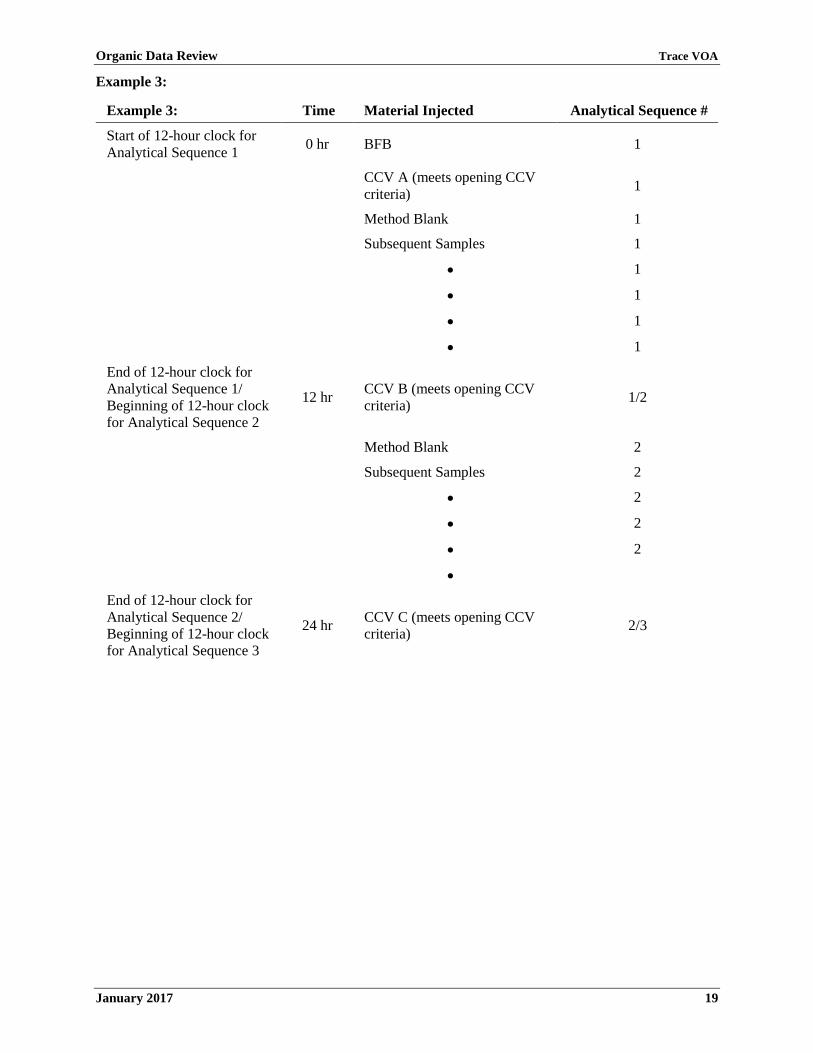
Use Example 3 if more than 12 hours have elapsed since the most recent initial calibration or closing CCV, OR if the most recent closing CCV was not or could not be used as an opening CCV.
• BFB tunes meet instrument performance criteria.
• CCV A meets opening CCV criteria.
• CCV B meets both opening and closing CCV criteria.
• CCV C meets both opening and closing CCV criteria.
The requirement of starting the new 12-hour clock for Analytical Sequence 2 with a new BFB tune is waived if CCV B meets opening CCV criteria. If CCV C meets opening CCV criteria, a method blank and subsequent samples may be analyzed immediately after CCV B.
Use Example 4 if more than 12 hours have elapsed since the most recent initial calibration or closing CCV, OR if the most recent closing CCV was not or could not be used as an opening CCV.
• BFB tunes meet instrument performance criteria.
• CCV A meets opening CCV criteria.
• CCV B meets closing CCV criteria (but does not meet opening CCV criteria).
• CCV C meets opening CCV criteria.
• CCV D meets both opening and closing CCV criteria.
CCV B does not meet opening CCV criteria. Therefore, a new BFB tune must be performed, immediately followed by CCV C, before a method blank and any samples may be analyzed. In this case, the new 12-hour clock and Analytical Sequence 2 begins with the injection of the new BFB tune. The requirement of starting the new 12-hour clock for Analytical Sequence 3 with a new BFB tune is waived if CCV D meets opening CCV criteria. If CCV D meets opening CCV criteria, a method blank and subsequent samples may be analyzed immediately after CCV D.

Organic Data Review Trace VOA
January 2017 17
Example 1:
Example 1: Time Material Injected Analytical Sequence #
Start of 12-hour clock for Analytical Sequence 1 0 hr BFB 1
Initial Calibration 0.5 1
Initial Calibration 1.0 1
Initial Calibration 5.0 1
Initial Calibration 10 1
Initial Calibration 20 1
ICV 1
Method Blank 1
Subsequent Samples 1
• 1
• 1
• 1
• 1
End of 12-hour clock for Analytical Sequence 1/ Beginning of 12-hour clock for Analytical Sequence 2
12 hr CCV A (meets opening CCV criteria) 1/2
Method Blank 2
Subsequent Samples 2
• 2
• 2
• 2
• 2
End of 12-hour clock for Analytical Sequence 2/ Beginning of 12-hour clock for Analytical Sequence 3
24 hr CCV B (meets opening CCV criteria) 2/3
Organic Data Review Trace VOA
January 2017 18
Example 2:
Example 2: Time Material Injected Analytical Sequence #
Start of 12-hour clock for Analytical Sequence 1 0 hr BFB 1
Initial Calibration 0.5 1
Initial Calibration 1.0 1
Initial Calibration 5.0 1
Initial Calibration 10 1
Initial Calibration 20 1
ICV 1
Method Blank 1
Subsequent Samples 1
• 1
• 1
• 1
• 1
End of 12-hour clock for Analytical Sequence 1 12 hr
CCV A (meets closing CCV criteria; fails opening CCV criteria)
1
Beginning of 12-hour clock for Analytical Sequence 2 13 hr BFB 2
CCV B (meets opening CCV criteria) 2
Method Blank 2
Subsequent Samples 2
• 2
• 2
• 2
• 2
End of 12-hour clock for Analytical Sequence 2 25 hr CCV C (meets closing CCV
criteria) 2
Organic Data Review Trace VOA
January 2017 19
Example 3:
Example 3: Time Material Injected Analytical Sequence #
Start of 12-hour clock for Analytical Sequence 1 0 hr BFB 1
CCV A (meets opening CCV criteria) 1
Method Blank 1
Subsequent Samples 1
• 1
• 1
• 1
• 1
End of 12-hour clock for Analytical Sequence 1/ Beginning of 12-hour clock for Analytical Sequence 2
12 hr CCV B (meets opening CCV criteria) 1/2
Method Blank 2
Subsequent Samples 2
• 2
• 2
• 2
•
End of 12-hour clock for Analytical Sequence 2/ Beginning of 12-hour clock for Analytical Sequence 3
24 hr CCV C (meets opening CCV criteria) 2/3

Organic Data Review Trace VOA
January 2017 20
Example 4:
Example 4: Time Material Injected Analytical Sequence #
Start of 12-hour clock for Analytical Sequence 1 0 hr BFB 1
CCV A (meets opening CCV criteria) 1
Method Blank 1
Subsequent Samples 1
• 1
• 1
• 1
•
End of 12-hour clock for Analytical Sequence 1 12 hr
CCV B (meets closing CCV criteria; fails opening CCV criteria)
1
Beginning of 12-hour clock for Analytical Sequence 2 13 hr BFB 2
CCV C (meets opening CCV criteria) 2
Method Blank 2
Subsequent Samples 2
• 2
• 2
• 2
•
End of 12-hour clock for Analytical Sequence 2/ Beginning of 12-hour clock for Analytical Sequence 3
25 hr CCV D (meets opening CCV criteria) 2/3

Organic Data Review Trace VOA
January 2017 21
2. The BFB instrument performance check must meet the ion abundance criteria listed in Table 3.
Table 3. Ion Abundance Criteria for BFB
Mass Ion Abundance Criteria
50 15.0 - 40.0% of mass 95
75 30.0 - 80.0% of mass 95
95 Base peak, 100% relative abundance
96 5.0 - 9.0% of mass 95*
173 Less than 2.0% of mass 174
174 50.0% - 120% of mass 95
175 5.0 - 9.0% of mass 174
176 95.0 - 101% of mass 174
177 5.0 - 9.0% of mass 176
* All ion abundances must be normalized to m/z 95, the nominal base peak, even though the ion abundance of m/z 174 may be up to 120% that of m/z 95.
D. Evaluation
1. Verify that the BFB Instrument Performance Check is analyzed at the specified frequency and sequence.
2. Compare the data presented on Form 5-OR for each Instrument Performance Check with each mass listing submitted to ensure the following:
a. Form 5-OR is present and completed for each required BFB at the specified frequency.
b. The laboratory has not made transcription errors between the data and the form. If there are major differences between the mass listing and Form 5-OR, a more in-depth review of the data is required. This may include obtaining and reviewing additional information from the laboratory.
c. The appropriate number of significant figures has been reported (number of significant figures given for each ion in the Ion Abundance Criteria column) and that rounding is correct.
d. The laboratory has not made any calculation errors.
3. Verify from the raw data (mass listing) that the mass assignment is correct and that the mass listing is normalized to the specified m/z of 95, 174, and 176, respectively.
4. Verify that the ion abundance criteria are met. The ion abundance for m/z 173, 175, 176, and 177 are calculated by normalizing to the specified m/z. The critical ion abundance criteria for BFB are the relative abundance ratios of m/z 95/96, 174/175, 174/176, and 176/177. The relative abundance ratios of m/z 50 and 75 are of lower importance for target analytes than for Tentatively Identified Compounds (TICs).
5. If possible, verify that spectra are generated using appropriate background subtraction techniques. Since the BFB spectrum is obtained from chromatographic peaks that should be free from co-elution problems, background subtraction should be performed in accordance with the following procedure:
a. Three scans (the peak apex scan and the scans immediately preceding and following the apex) are acquired and averaged.

Organic Data Review Trace VOA
January 2017 22
b. Background subtraction must be accomplished using a single scan acquired within 20 scans of the elution of BFB, but the BFB peak must not be subtracted as part of the background.
NOTE: All mass spectrometer instrument conditions must be identical to those used for sample analysis. Background subtraction actions resulting in spectral distortions for the sole purpose of meeting the method specifications are contrary to the Quality Assurance (QA) objectives, and are therefore unacceptable.
NOTE: For data obtained from the CLP, information regarding noncompliant BFB instrument performance checks can be obtained from the National Functional Guidelines (NFG) reports and may be used as part of the evaluation process.
E. Action
1. If the instrument performance check is not analyzed at the specified frequency and sequence, qualify detects and non-detects in the associated samples as unusable (R). The EPA Regional CLP COR should be contacted to arrange for reanalysis of all affected samples.
a. In the event that samples cannot be reanalyzed, examine all calibrations associated with the sequence to evaluate whether proper qualitative criteria were achievable. If so, it may be possible to salvage usable data from the sequence. Otherwise, qualify the data as unusable (R).
2. If minor transcription errors are found to be insignificant to data quality and can be corrected on a copy of the form, no further action is required.
3. If the laboratory failed to provide the correct forms, or if significant transcription or calculation errors are found, notify the EPA Regional CLP COR, who may contact the laboratory to request the necessary information. If the information is not available, use professional judgment to assess the data, and notify the EPA Regional CLP COR.
4. If the mass assignment is in error (e.g., m/z 96 is indicated as the base peak rather than m/z 95), qualify detects and non-detects in the associated samples as unusable (R).
5. If the ion abundance criteria in Table 3 are not met, use professional judgment to qualify detects and non-detects in the associated samples.
6. Annotate decisions to use analytical data associated with noncompliant BFB instrument performance checks in the Data Review Narrative.
7. If the instrument performance check criteria are achieved using techniques other than those described in Section II.D.5, obtain additional information to evaluate the performance and procedures. Note any concerns (e.g., use of inappropriate technique for background subtraction) or questions for EPA Regional CLP COR action.

Organic Data Review Trace VOA
January 2017 23
III. Initial Calibration
A. Review Items
Form 6A-OR, quantitation reports, and chromatograms. (SOW SOM02.4 – Exhibit B, Section 3.4 and Exhibit D/Trace VOA, Sections 7.2.2.1 and 9.3)
B. Objective
The objective of initial calibration (ICAL) is to ensure that the instrument is capable of producing acceptable qualitative and quantitative data.
C. Criteria
1. ICAL should be performed at the specified frequency and sequence. Each GC/MS system must be calibrated with a minimum of five concentrations to determine instrument sensitivity and the linearity of GC/MS response for the purgeable target analytes and Deuterated Monitoring Compounds (DMCs).
a. ICAL standards must be analyzed prior to any analysis of the ICV, samples, and required blanks and within 12 hours of the associated instrument performance check at the beginning of each analytical sequence, or as necessary if the CCV acceptance criteria are not met.
b. ICAL standards must contain all required target analytes and DMCs at concentrations of 0.50, 1.0, 5.0, 10, and 20 µg/L for non-ketones, and 5.0, 10, 50, 100, and 200 µg/L for ketones.
c. All three xylene isomers (o-, m-, and p-xylene) must be present in calibration standards.
d. Concentrations for o-xylene must be at 0.50, 1.0, 5.0, 10, and 20 µg/L, while the total concentrations of the m- plus the p-xylene isomers must be at 0.50, 1.0, 5.0, 10, and 20 µg/L.
2. The Relative Response Factor (RRF), Mean RRF (RRF������), and Percent Relative Standard Deviation (%RSD) must be calculated for each target analyte and DMC according to the SOW.
3. The RRF for each target analyte and DMC in each ICAL standard must be ≥ Minimum RRF value in Table 4.
4. The %RSD of the ICAL RRF for each target analyte and DMC must be ≤ Maximum %RSD value in Table 4.
NOTE: The technical acceptance criteria specified in a “Request for Quote (RFQ) for Solicitation” of a Modified Analysis may impact some of the preceding evaluation criteria. A copy of this document should be present in the CSF, when applicable.
D. Evaluation
1. Verify that the ICAL is performed at the specified frequency and sequence.
2. Verify that the correct concentrations of the target analytes and DMCs are used in each ICAL standard.
3. Verify that the RRF, RRF������, and %RSD for each target analyte and DMC are reported on Form 6A-OR. Recalculate the RRFs, RRF������s, and %RSDs for at least one target analyte and DMC associated with each internal standard, and verify that the recalculated values agree with the laboratory reported values on Form 6A-OR.
4. Verify that the RRF is ≥ Minimum RRF value in Table 4 for each target analyte and DMC.
5. Verify that the %RSD is ≤ Maximum %RSD value in Table 4 for each target analyte and DMC.
NOTE: For data obtained from the CLP, information regarding noncompliant ICALs can be obtained from the NFG reports and may be used as part of the evaluation process.

Organic Data Review Trace VOA
January 2017 24
E. Action
1. If the ICAL is not performed at the specified frequency and sequence, use professional judgment to qualify detects and non-detects in the associated samples as unusable (R).
2. If the ICAL is not performed at the specified concentrations, qualify detects in the associated samples as estimated (J) and non-detects in the associated samples as estimated (UJ).
3. If errors are detected in the calculations of the RRFs, RRF������s, or %RSDs, perform a more comprehensive recalculation.
4. If the RRF is < Minimum RRF value in Table 4 for any target analyte, use professional judgment to qualify detects in the associated samples as estimated high (J+) or unusable (R), and non-detects in the associated samples as unusable (R).
5. If the RRF is ≥ Minimum RRF value in Table 4 for any target analyte, detects and non-detects in the associated samples should not be qualified.
6. If the %RSD is > Maximum %RSD value in Table 4 for any target analyte, qualify detects in the associated samples as estimated (J). Use professional judgment to qualify non-detects in the associated samples.
7. If the %RSD is ≤ Maximum %RSD value in Table 4 for any target analyte, detects and non-detects in the associated samples should not be qualified.
8. No qualification of the data is necessary based on the DMC RRF, RRF������, and %RSD data alone. Use professional judgment to evaluate the DMC RRF, RRF������, and %RSD data in conjunction with the DMC recoveries to determine the need for data qualification.
9. Based on the project-specific Data Quality Objectives (DQOs), a more in-depth review may be necessary. The following guidelines are recommended:
a. If the %RSD criteria of any target analyte are not met and the %RSD criteria are still not satisfied after eliminating either the high or the low-point of the ICAL:
i. Qualify detects in the associated samples as estimated (J).
ii. Use professional judgment to qualify non-detects in the associated samples.
b. If the high-point of the ICAL curve is outside of the %RSD criteria (e.g., due to saturation):
i. Qualify detects in the associated samples with analyte concentrations greater than the high-point concentration as estimated (J).
ii. Detects in the associated samples with analyte concentrations within the calibration range should not be qualified.
iii. Non-detects in the associated samples should not be qualified.
c. If the low-point of the ICAL curve is outside of the %RSD criteria:
i. Qualify detects in the associated samples with analyte concentrations in the non-linear range as estimated (J).
ii. Detects in the associated samples with analyte concentrations within the calibration range should not be qualified.
iii. For non-detects in the associated samples, use the lowest point of the linear portion of the ICAL curve to determine the new quantitation limit.
10. If the laboratory failed to provide adequate calibration information, notify the EPA Regional CLP COR, who may contact the laboratory to request the necessary information. If the information is not available, use professional judgment to assess the data.

Organic Data Review Trace VOA
January 2017 25
11. Annotate the potential effects on the reported data due to exceeding the ICAL criteria in the Data Review Narrative.
12. If the ICAL criteria are grossly exceeded, note this for EPA Regional CLP COR action.
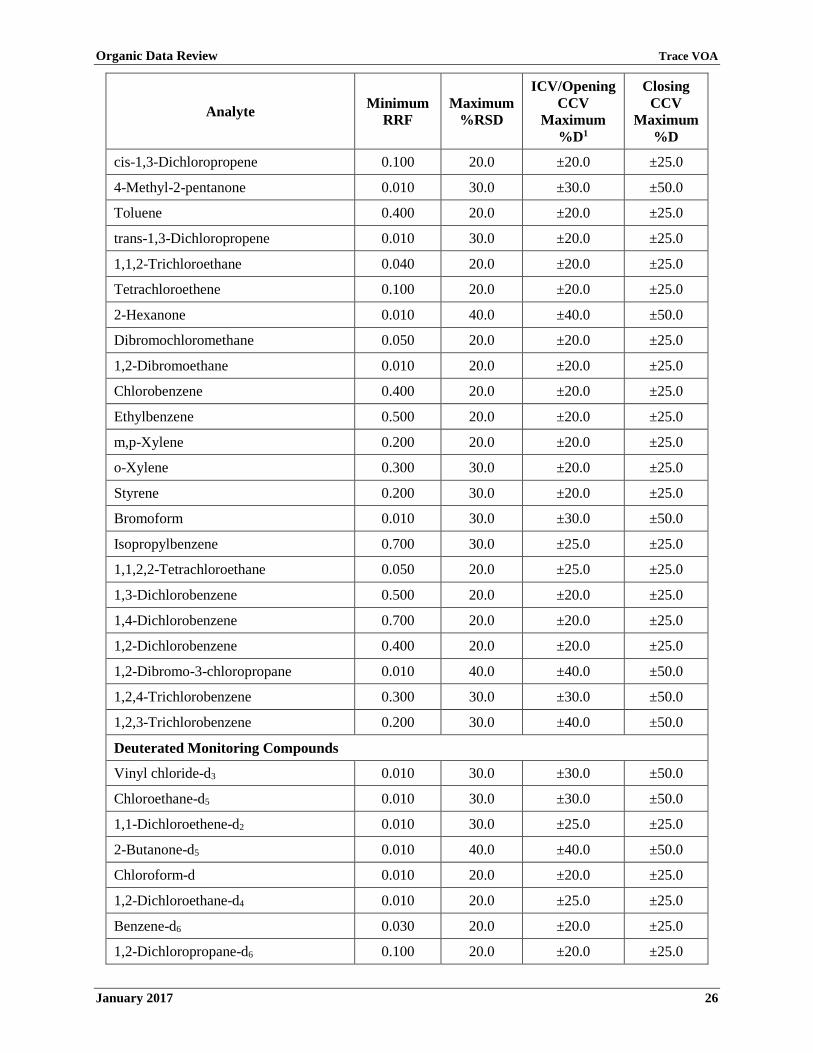
Table 4. RRF, %RSD, and %D Acceptance Criteria in Initial Calibration, ICV, and CCV for Trace Volatile Analysis
Analyte Minimum RRF
Maximum %RSD
ICV/Opening CCV
Maximum %D1
Closing CCV
Maximum %D
Dichlorodifluoromethane 0.010 30.0 ±40.0 ±50.0
Chloromethane 0.010 30.0 ±30.0 ±50.0
Vinyl chloride 0.010 30.0 ±30.0 ±50.0
Bromomethane 0.010 40.0 ±30.0 ±50.0
Chloroethane 0.010 30.0 ±30.0 ±50.0
Trichlorofluoromethane 0.010 30.0 ±30.0 ±50.0
1,1-Dichloroethene 0.020 30.0 ±20.0 ±25.0
1,1,2-Trichloro-1,2,2-trifluoroethane 0.010 30.0 ±30.0 ±50.0
Acetone 0.010 40.0 ±40.0 ±50.0
Carbon disulfide 0.010 20.0 ±25.0 ±25.0
Methyl acetate 0.010 40.0 ±40.0 ±50.0
Methylene chloride 0.010 40.0 ±30.0 ±50.0
trans-1,2-Dichloroethene 0.070 20.0 ±20.0 ±25.0
Methyl tert-butyl ether 0.010 30.0 ±30.0 ±50.0
1,1-Dichloroethane 0.100 20.0 ±20.0 ±25.0
cis-1,2-Dichloroethene 0.100 20.0 ±20.0 ±25.0
2-Butanone 0.010 40.0 ±40.0 ±50.0
Bromochloromethane 0.020 20.0 ±20.0 ±25.0
Chloroform 0.040 20.0 ±20.0 ±25.0
1,1,1-Trichloroethane 0.050 30.0 ±20.0 ±25.0
Cyclohexane 0.100 30.0 ±25.0 ±50.0
Carbon tetrachloride 0.020 20.0 ±25.0 ±50.0
Benzene 0.300 20.0 ±20.0 ±25.0
1,2-Dichloroethane 0.010 20.0 ±25.0 ±50.0
Trichloroethene 0.100 20.0 ±20.0 ±25.0
Methylcyclohexane 0.200 30.0 ±25.0 ±50.0
1,2-Dichloropropane 0.100 20.0 ±20.0 ±25.0
Bromodichloromethane 0.090 20.0 ±20.0 ±25.0
Organic Data Review Trace VOA
January 2017 26
Analyte Minimum RRF
Maximum %RSD
ICV/Opening CCV
Maximum %D1
Closing CCV
Maximum %D
cis-1,3-Dichloropropene 0.100 20.0 ±20.0 ±25.0
4-Methyl-2-pentanone 0.010 30.0 ±30.0 ±50.0
Toluene 0.400 20.0 ±20.0 ±25.0
trans-1,3-Dichloropropene 0.010 30.0 ±20.0 ±25.0
1,1,2-Trichloroethane 0.040 20.0 ±20.0 ±25.0
Tetrachloroethene 0.100 20.0 ±20.0 ±25.0
2-Hexanone 0.010 40.0 ±40.0 ±50.0
Dibromochloromethane 0.050 20.0 ±20.0 ±25.0
1,2-Dibromoethane 0.010 20.0 ±20.0 ±25.0
Chlorobenzene 0.400 20.0 ±20.0 ±25.0
Ethylbenzene 0.500 20.0 ±20.0 ±25.0
m,p-Xylene 0.200 20.0 ±20.0 ±25.0
o-Xylene 0.300 30.0 ±20.0 ±25.0
Styrene 0.200 30.0 ±20.0 ±25.0
Bromoform 0.010 30.0 ±30.0 ±50.0
Isopropylbenzene 0.700 30.0 ±25.0 ±25.0
1,1,2,2-Tetrachloroethane 0.050 20.0 ±25.0 ±25.0
1,3-Dichlorobenzene 0.500 20.0 ±20.0 ±25.0
1,4-Dichlorobenzene 0.700 20.0 ±20.0 ±25.0
1,2-Dichlorobenzene 0.400 20.0 ±20.0 ±25.0
1,2-Dibromo-3-chloropropane 0.010 40.0 ±40.0 ±50.0
1,2,4-Trichlorobenzene 0.300 30.0 ±30.0 ±50.0
1,2,3-Trichlorobenzene 0.200 30.0 ±40.0 ±50.0
Deuterated Monitoring Compounds
Vinyl chloride-d3 0.010 30.0 ±30.0 ±50.0
Chloroethane-d5 0.010 30.0 ±30.0 ±50.0
1,1-Dichloroethene-d2 0.010 30.0 ±25.0 ±25.0
2-Butanone-d5 0.010 40.0 ±40.0 ±50.0
Chloroform-d 0.010 20.0 ±20.0 ±25.0
1,2-Dichloroethane-d4 0.010 20.0 ±25.0 ±25.0
Benzene-d6 0.030 20.0 ±20.0 ±25.0
1,2-Dichloropropane-d6 0.100 20.0 ±20.0 ±25.0

Organic Data Review Trace VOA
January 2017 27
Analyte Minimum RRF
Maximum %RSD
ICV/Opening CCV
Maximum %D1
Closing CCV
Maximum %D
Toluene-d8 0.200 20.0 ±20.0 ±25.0
trans-1,3-Dichloropropene-d4 0.010 30.0 ±25.0 ±25.0
2-Hexanone-d5 0.010 40.0 ±40.0 ±50.0
1,1,2,2- Tetrachloroethane-d2 0.010 20.0 ±25.0 ±25.0
1,2-Dichlorobenzene-d4 0.060 20.0 ±20.0 ±25.0 1 If a closing CCV is acting as an opening CCV, all target analytes must meet the requirements for an
opening CCV.
Table 5. Initial Calibration Actions for Trace Volatile Analysis
Criteria Action
Detect Non-detect
Initial Calibration not performed at the specified frequency and sequence
Use professional judgment
R
Use professional judgment
R
Initial Calibration not performed at the specified concentrations J UJ
RRF < Minimum RRF in Table 4 for target analyte
Use professional judgment J+ or R
R
RRF ≥ Minimum RRF in Table 4 for target analyte No qualification No qualification
%RSD > Maximum %RSD in Table 4 for target analyte J Use professional
judgment
%RSD ≤ Maximum %RSD in Table 4 for target analyte No qualification No qualification
Organic Data Review Trace VOA
January 2017 28
IV. Initial Calibration Verification
A. Review Items
Form 7A-OR, quantitation reports, and chromatograms. (SOW SOM02.4 – Exhibit B, Section 3.4 and Exhibit D/Trace VOA, Sections 7.2.2.2 and 9.4)
B. Objective
The objective is to ensure that the instrument is calibrated accurately to produce acceptable qualitative and quantitative data throughout each analytical sequence by the use of a second-source check standard.
C. Criteria
1. The accuracy of the calibration for each GC/MS system used for analysis must be verified at the frequency of one ICV standard analysis per initial calibration analytical sequence. The ICV is analyzed after the last ICAL standard analysis and prior to a blank, sample, or an applicable CCV analysis.
2. The ICV standard must contain all required target analytes, from an alternate source or a different lot than that used for the ICAL standards and the DMCs, at or near the mid-point concentration (CS3) of the ICAL.
3. For an ICV, the RRF for each target analyte and DMC must be ≥ the Minimum RRF value in Table 4.
4. The Percent Difference (%D) between the ICAL RRF������ and the ICV RRF must be within the ICV/Opening CCV Maximum %D limits in Table 4 for each target analyte and DMC.
D. Evaluation
1. Verify that the ICV standard is analyzed at the specified frequency and sequence, and that it is associated with the correct ICAL. Also verify that the correct ICAL is represented in the data package and meets SOW criteria, as described in Section III.
2. Verify that the concentrations of the target analytes and the DMCs in the ICV are at or near the mid-point standard CS3 from the ICAL.
3. Verify that the RRF and %D for each target analyte and DMC are reported on Form 7A-OR. Recalculate the RRF and %D for at least one target analyte and DMC associated with each internal standard, and verify that the recalculated values agree with the laboratory reported values on Form 7A-OR.
4. Verify that the RRFs for each target analyte and DMC in the ICV are ≥ Minimum RRF values in Table 4.
5. Verify that the %Ds are within the ICV/Opening CCV Maximum %D limits in Table 4 for each target analyte and DMC.
NOTE: For data obtained from the CLP, information regarding a noncompliant ICV can be obtained from the NFG reports and may be used as part of the evaluation process.
E. Action
1. If the ICV is not performed at the specified frequency, use professional judgment to qualify detects and non-detects. Contact the EPA Regional CLP COR to request that the laboratory repeat the analysis, if holding times have not expired and there are remaining sample vials. If reanalysis is not possible, carefully evaluate all other available information, including the quality of analyte peak shapes and mass spectral matches, the stability of internal standard Retention Times (RTs) and areas in each affected sample, and compare to the most recent calibration performed on the same instrument under the same conditions. Using this information and professional judgment, the reviewer may be able to justify unqualified acceptance of qualitative results.

Organic Data Review Trace VOA
January 2017 29
2. If the ICV is not performed at the specified concentration, use professional judgment to qualify detects and non-detects. Special consideration should be given to sample results at the opposite extreme of the calibration range if this defect is noted.
3. If errors are detected in the calculations of either the RRF or the %D, perform a more comprehensive recalculation.
4. If the RRF in an ICV is < Minimum RRF value in Table 4 for any target analyte, carefully evaluate the qualitative data associated with positively identified analytes and use professional judgment to qualify detects as estimated (J) or unusable (R), and qualify non-detects as unusable (R).
a. Take special note of any extreme deviation in the RRF and evaluate RT data, peak shapes, and areas of the target analytes and associated internal standards for inconsistencies that may indicate a chromatographic co-elution. If this is suspected, the contaminant may also be present in samples and blanks. Also review the documentation of the preparation of the ICV standard. Use professional judgment to qualify affected data appropriately.
5. If the RRF in an ICV is ≥ Minimum RRF value in Table 4 for any target analyte, detects and non-detects should not be qualified.
6. If the %D in an ICV is outside the ICV/Opening CCV Maximum %D limits in Table 4 for any target analyte, qualify detects as estimated (J) and non-detects as estimated (UJ).
7. If the %D in an ICV is within the inclusive range of the ICV/Opening CCV Maximum %D limits in Table 4 for any target analyte, detects and non-detects should not be qualified.
8. No qualification of the data is necessary based on the DMC RRF and/or %D alone. Use professional judgment to evaluate the DMC RRF and %D data in conjunction with the DMC recoveries to determine the need for data qualification.
9. If the laboratory has failed to provide adequate calibration information, contact the EPA Regional CLP COR, who may contact the laboratory to request the necessary information. If the information is not available, use professional judgment to assess the data. Refer to E.1, above, for additional steps.
10. Note the potential effects on the data due to ICV criteria exceedance in the Data Review Narrative.
11. If the ICV criteria are grossly exceeded, note this for EPA Regional CLP COR action.
Organic Data Review Trace VOA
January 2017 30
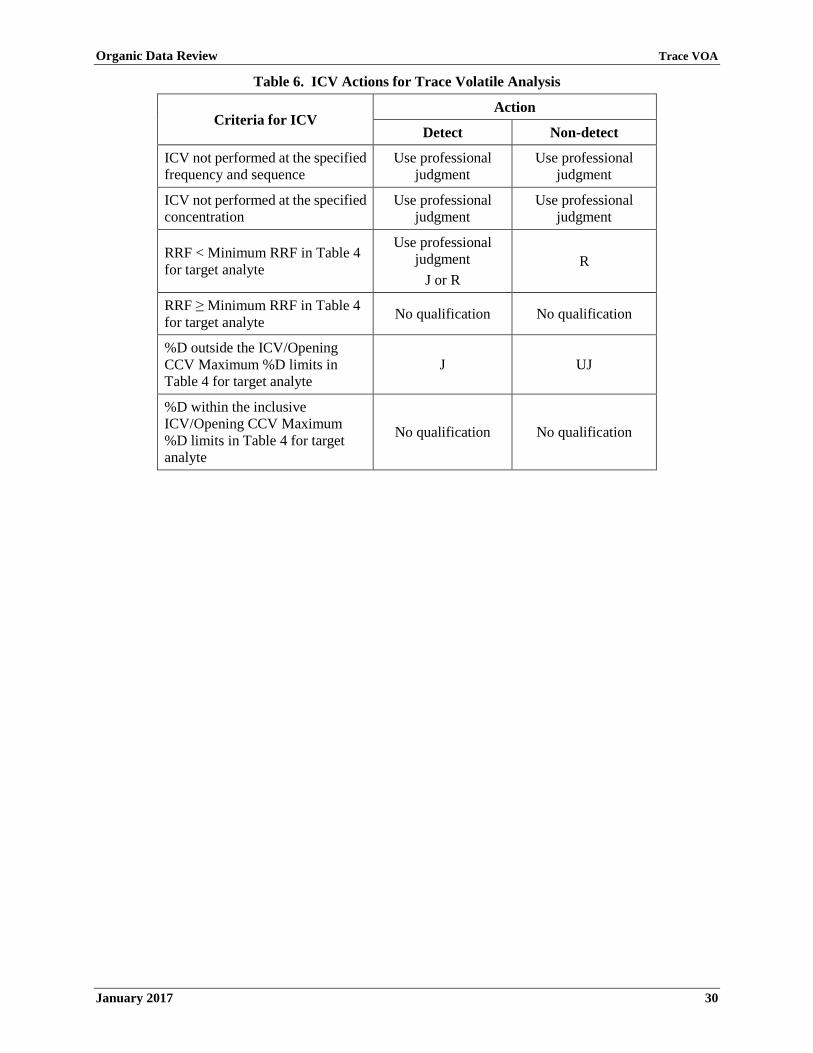
Table 6. ICV Actions for Trace Volatile Analysis
Criteria for ICV Action
Detect Non-detect
ICV not performed at the specified frequency and sequence
Use professional judgment
Use professional judgment
ICV not performed at the specified concentration
Use professional judgment
Use professional judgment
RRF < Minimum RRF in Table 4 for target analyte
Use professional judgment
J or R R
RRF ≥ Minimum RRF in Table 4 for target analyte No qualification No qualification
%D outside the ICV/Opening CCV Maximum %D limits in Table 4 for target analyte
J UJ
%D within the inclusive ICV/Opening CCV Maximum %D limits in Table 4 for target analyte
No qualification No qualification

Organic Data Review Trace VOA
January 2017 31
V. Continuing Calibration Verification
A. Review Items
Form 7A-OR, quantitation reports, and chromatograms. (SOW SOM02.4 – Exhibit B, Section 3.4 and Exhibit D/Trace VOA, Sections 7.2.2.1 and 9.5)
B. Objective
The objective is to ensure that the instrument continues to meet the sensitivity and linearity criteria to produce acceptable qualitative and quantitative data throughout each analytical sequence.
C. Criteria
1. The calibration for each GC/MS system used for analysis must be verified at the beginning and end of every 12-hour period of operation. The 12-hour period begins with the injection of BFB, followed by the injection of the opening CCV solution. After the injection of all samples and required blanks, and before the end of the 12-hour period, injection of the closing CCV is required. The closing CCV used to bracket the end of a 12-hour analytical sequence may be used as the opening CCV for a new 12-hour analytical sequence, provided that all technical acceptance criteria for an opening CCV are met.
2. The CCV standards must contain all required target analytes and DMCs at or near the mid-point concentration (CS3) of the ICAL.
3. For an opening or a closing CCV, the RRF for each target analyte and DMC must be ≥ the Minimum RRF value in Table 4.
4. The %D between the ICAL RRF������ and the opening CCV RRF must be within the ICV/Opening CCV Maximum %D limits in Table 4 for each target analyte and DMC.
5. For a closing CCV, the %D between the ICAL RRF������ and the CCV RRF must be within the Closing CCV Maximum %D limits in Table 4 for each target analyte and DMC.
D. Evaluation
1. Verify that the CCV is analyzed at the specified frequency and sequence, and that it is associated with the correct ICAL. Also verify that the correct ICAL is represented in the data package and meets SOW criteria, as described in Section III.
2. Verify that the mid-point standard CS3 from the ICAL is used as an opening or closing CCV.
3. Verify that the RRF and %D for each target analyte and DMC are reported on Form 7A-OR. Recalculate the RRF and %D for at least one target analyte and DMC associated with each internal standard, and verify that the recalculated values agree with the laboratory reported values on Form 7A-OR.
4. For an opening or a closing CCV, verify that the RRFs for each target analyte and DMC are ≥ Minimum RRF values in Table 4.
5. For an opening CCV, verify that the %Ds are within the ICV/Opening CCV Maximum %D limits in Table 4 for each target analyte and DMC.
6. For a closing CCV, verify that the %Ds are within the Closing CCV Maximum %D limits in Table 4 for each target analyte and DMC.
NOTE: For data obtained from the CLP, information regarding noncompliant CCVs can be obtained from the NFG reports and may be used as part of the evaluation process.

Organic Data Review Trace VOA
January 2017 32
E. Action
1. If the CCV is not performed at the specified frequency, qualify detects and non-detects as unusable (R). Contact the EPA Regional CLP COR to request that the laboratory repeat the analysis, if holding times have not expired and there are remaining sample vials. If reanalysis is not possible, carefully evaluate all other available information, including the quality of analyte peak shapes and mass spectral matches, the stability of internal standard RTs and areas in each affected sample, and compare to the most recent calibration performed on the same instrument under the same conditions. Using this information and professional judgment, the reviewer may be able to justify unqualified acceptance of qualitative results and qualification of all quantitative results as estimated (J). Otherwise, qualify all detects and non-detects as unusable (R).
2. If the CCV is not performed at the specified concentration, use professional judgment to qualify detects and non-detects. Special consideration should be given to sample results at the opposite extreme of the calibration range if this defect is noted.
3. If errors are detected in the calculations of either the RRF or the %D, perform a more comprehensive recalculation.
4. For an opening or a closing CCV, if the RRF is < Minimum RRF value in Table 4 for any target analyte, carefully evaluate the qualitative data associated with positively identified analytes and use professional judgment to qualify detects as estimated (J) or unusable (R), and qualify non-detects as unusable (R).
a. Take special note of any extreme deviation in the RRF and evaluate RT data, peak shapes, and areas of the target analytes and associated internal standards for inconsistencies that may indicate a chromatographic co-elution. If this is suspected, the contaminant may also be present in samples and blanks. Also review the documentation of the preparation of the CCV standard. Use professional judgment to qualify affected data appropriately.
5. For an opening or a closing CCV, if the RRF is ≥ Minimum RRF value in Table 4 for any target analyte, detects and non-detects should not be qualified.
6. For an opening CCV, if the %D is outside the ICV/Opening CCV Maximum %D limits in Table 4 for any target analyte, qualify detects as estimated (J) and non-detects as estimated (UJ).
7. For a closing CCV, if the %D is outside the Closing CCV Maximum %D limits in Table 4 for any target analyte, qualify detects as estimated (J) and non-detects as estimated (UJ).
8. For an opening CCV, if the %D is within the inclusive range of the ICV/Opening CCV Maximum %D limits in Table 4 for any target analyte, detects and non-detects should not be qualified.
9. For a closing CCV, if the %D is within the inclusive range of the Closing CCV Maximum %D limits in Table 4 for any target analyte, detects and non-detects should not be qualified.
10. No qualification of the data is necessary based on the DMC RRF and/or %D alone. Use professional judgment to evaluate the DMC RRF and %D data in conjunction with the DMC recoveries to determine the need for data qualification.
11. If the laboratory has failed to provide adequate calibration information, contact the EPA Regional CLP COR, who may contact the laboratory to request the necessary information. If the information is not available, use professional judgment to assess the data. Refer to E.1, above, for additional steps.
12. Note the potential effects on the data due to CCV criteria exceedance in the Data Review Narrative.
13. If the CCV criteria are grossly exceeded, note this for EPA Regional CLP COR action.

Organic Data Review Trace VOA
January 2017 33
Table 7. CCV Actions for Trace Volatile Analysis
Criteria for Opening CCV Criteria for Closing CCV Action
Detect Non-detect
CCV not performed at the specified frequency and sequence
CCV not performed at the specified frequency
Use professional judgment
J or R
Use professional judgment UJ or R
CCV not performed at the specified concentration
CCV not performed at the specified concentration
Use professional judgment
Use professional judgment
RRF < Minimum RRF in Table 4 for target analyte
RRF < Minimum RRF in Table 4 for target analyte
Use professional judgment
J or R R
RRF ≥ Minimum RRF in Table 4 for target analyte
RRF ≥ Minimum RRF in Table 4 for target analyte No qualification No qualification
%D outside the ICV/Opening CCV Maximum %D limits in Table 4 for target analyte
%D outside the Closing CCV Maximum %D limits in Table 4 for target analyte
J UJ
%D within the inclusive ICV/Opening CCV Maximum %D limits in Table 4 for target analyte
%D within the inclusive Closing CCV Maximum %D limits in Table 4 for target analyte
No qualification No qualification

Organic Data Review Trace VOA
January 2017 34
VI. Blanks
A. Review Items
Form 1A-OR, Form 1B-OR, Form 4-OR, chromatograms, and quantitation reports. (SOW SOM02.4 – Exhibit B, Section 3.4 and Exhibit D/Trace VOA, Section 12.1)
B. Objective
The objective of a blank analysis results assessment is to determine the existence and magnitude of contamination resulting from laboratory (or field) activities.
C. Criteria
The criteria for evaluation of blanks should apply to any blank associated with the samples (e.g., method blanks, storage blank, field blanks, etc.). If problems with any blank exist, all associated data must be carefully evaluated to determine whether or not there is an inherent variability in the data or if the problem is an isolated occurrence not affecting other data.
1. Method blank analyses must be performed at the specified frequency and sequence. A method blank must be analyzed once every 12-hour period and prior to any sample analysis, and after all ICAL standards, the ICV, or the opening CCV. The method blank must be analyzed on each GC/MS system used for sample analysis within an entire analytical sequence.
2. The method blank, like any other sample in the SDG, must meet the technical acceptance criteria for sample analysis.
3. A storage blank analysis must be performed at the specified frequency and sequence. A storage blank must be prepared upon receipt of the first samples from an SDG, and stored with the samples until analysis. The storage blank must be analyzed once per SDG after all sample analyses within an SDG are completed.
4. An instrument blank must be analyzed immediately after any sample that has target analytes exceeding the calibration range or non-target compounds exceeding 100 µg/L.
5. The concentration of a target analyte in any blank must not exceed its Contract Required Quantitation Limit (CRQL) (2x CRQLs for Methylene chloride, Acetone, and 2-Butanone). TIC concentration in any blank must be ≤ 0.5 µg/L.
D. Evaluation
1. Verify that method blanks are analyzed at the specified frequency and sequence. The Method Blank Summary (Form 4-OR) may be used to identify the samples associated with each method blank.
2. Verify that a storage blank has been analyzed at the specified frequency and sequence.
3. Verify that the instrument blank analysis has been performed following any sample analysis where a target analyte(s) is/are reported at high concentration(s).
4. Review the results of all associated blanks on the forms and raw data (chromatograms and quantitation reports) to evaluate the presence of target analytes and non-target compounds in the blanks.
5. Data concerning the field blanks are not evaluated as part of the Contract Compliance Screening (CCS) process. Evaluate field or trip blanks in a manner similar to that used for the method blanks.
NOTE: For data obtained from the CLP, the preceding criteria are evaluated as part of the CCS process. Information regarding the noncompliant blank can be obtained from the NFG reports and may be used as part of the evaluation process.
Organic Data Review Trace VOA
January 2017 35
E. Action
1. If the appropriate blanks are not analyzed at the correct frequency, use professional judgment to determine if the associated sample data should be qualified. Obtain additional information from the laboratory, if necessary. Record the situation in the Data Review Narrative and note it for EPA Regional CLP COR action.
2. Action regarding unsuitable blank results depends on the circumstances and origin of the blank. Verify that data qualification decisions based on field quality control (QC) are supported by the project Quality Assurance Project Plan (QAPP) or EPA Regional Standard Operating Procedure (SOP). At a minimum, contamination found in field blanks should be documented in the Data Review Narrative. In instances where more than one blank is associated with a given sample, qualification should be based upon a comparison with the associated blank having the highest concentration of a contaminant. Do not correct the results by subtracting any blank value.
3. For any blank (including method blank), if a target analyte is detected, but is not detected in the sample, non-detects should not be qualified.
4. For any method blank reported with results < CRQLs, report sample results that are < CRQLs at the CRQLs and qualify as non-detect (U). For any method blank reported with results that are < CRQLs, use professional judgment to qualify sample results that are ≥ CRQLs (≥ 2x result in method blank for Methylene chloride, Acetone, and 2-Butanone). Positive results in samples, especially those near but above the CRQL, may be biased high by low level contamination in the method blank, and should be considered as estimated (J+).
5. For any method blank reported with results ≥ CRQLs, report sample results that are < CRQLs at the CRQLs and qualify as non-detect (U).
6. For any method blank reported with results ≥ CRQLs, report sample results that are ≥ CRQLs but < Blank Results at sample results and qualify as non-detect (U) or as unusable (R). Use professional judgment to qualify sample results that are ≥ CRQLs and ≥ Blank Results or ≥ 2x result in method blank for Methylene chloride, Acetone, and 2-Butanone.
7. If an instrument blank is not analyzed following a sample analysis which contains analyte(s) at high concentration(s) exceeding the calibration range, evaluate the analyte(s) concentration(s) in the samples analyzed immediately after the sample with high analyte(s) concentration(s) for carryover. Use professional judgment to determine if instrument cross-contamination has affected any positive target analyte identification(s). If instrument cross-contamination is suggested and suspected of having an effect on the sample results or calibration performance, note it for EPA Regional CLP COR action.
8. If any analytes are detected in the storage, field, or trip blanks, the following is recommended:
a. Review the associated method blank data to determine if the same analytes are also detected in the method blank.
i. If the analytes are detected at comparable levels in the method blank, the source of the contamination may be in the analytical system. Apply the recommended actions for the method blank.
ii. If the analytes are not detected in the method blank, the source of contamination may be in the storage area or in the field, or contamination may have occurred during sample transport. Consider all associated samples for possible cross-contamination.
iii. For storage, field, or trip blanks, the sample result qualifications listed in Table 8 should apply.
9. If gross contamination exists with blank results that are > ICAL CS5 concentrations, qualify detects as unusable (R). If the contamination is suspected of having an effect on the sample results, note it for EPA Regional CLP COR action.
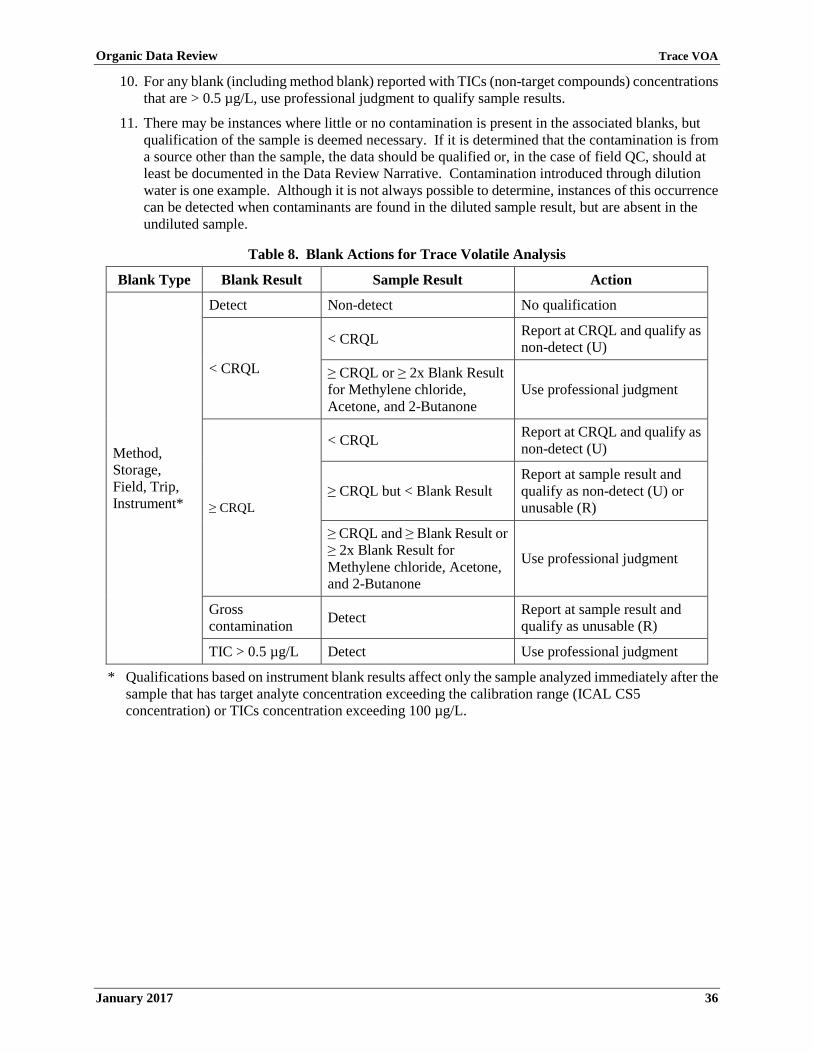
Organic Data Review Trace VOA
January 2017 36
10. For any blank (including method blank) reported with TICs (non-target compounds) concentrations that are > 0.5 µg/L, use professional judgment to qualify sample results.
11. There may be instances where little or no contamination is present in the associated blanks, but qualification of the sample is deemed necessary. If it is determined that the contamination is from a source other than the sample, the data should be qualified or, in the case of field QC, should at least be documented in the Data Review Narrative. Contamination introduced through dilution water is one example. Although it is not always possible to determine, instances of this occurrence can be detected when contaminants are found in the diluted sample result, but are absent in the undiluted sample.
Table 8. Blank Actions for Trace Volatile Analysis
Blank Type Blank Result Sample Result Action
Method, Storage, Field, Trip, Instrument*
Detect Non-detect No qualification
< CRQL
< CRQL Report at CRQL and qualify as non-detect (U)
≥ CRQL or ≥ 2x Blank Result for Methylene chloride, Acetone, and 2-Butanone
Use professional judgment
≥ CRQL
< CRQL Report at CRQL and qualify as non-detect (U)
≥ CRQL but < Blank Result Report at sample result and qualify as non-detect (U) or unusable (R)
≥ CRQL and ≥ Blank Result or ≥ 2x Blank Result for Methylene chloride, Acetone, and 2-Butanone
Use professional judgment
Gross contamination Detect Report at sample result and
qualify as unusable (R)
TIC > 0.5 µg/L Detect Use professional judgment
* Qualifications based on instrument blank results affect only the sample analyzed immediately after the sample that has target analyte concentration exceeding the calibration range (ICAL CS5 concentration) or TICs concentration exceeding 100 µg/L.
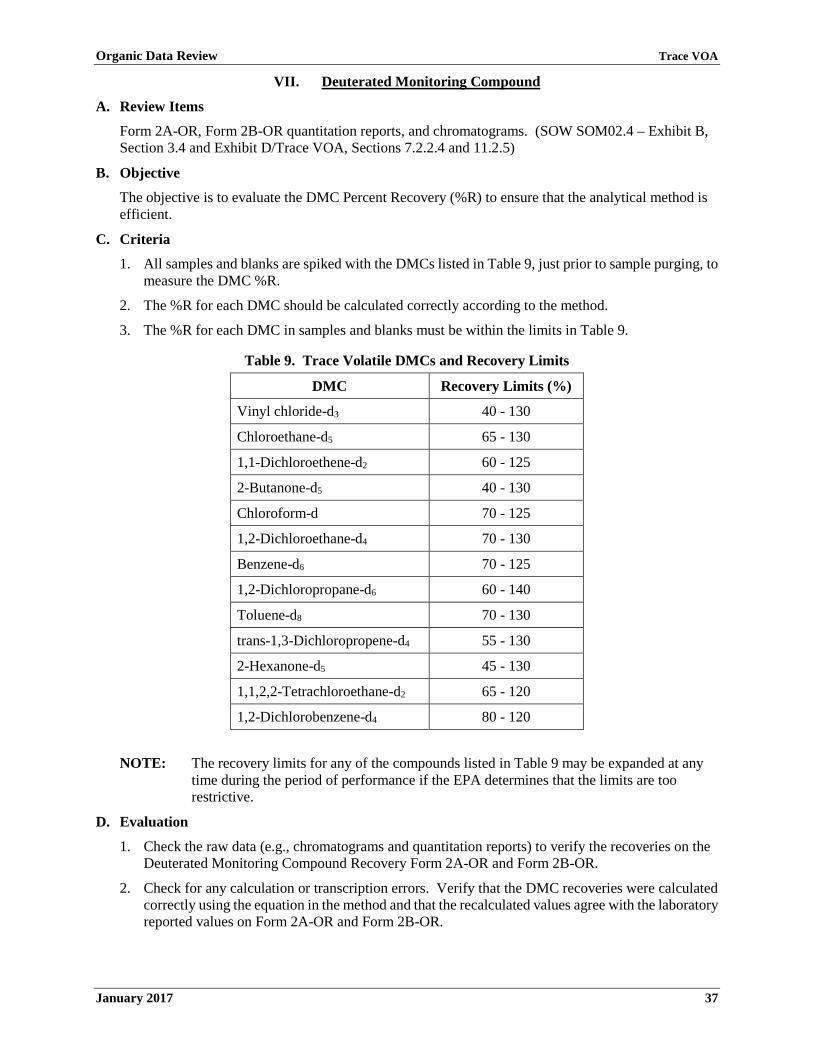
Organic Data Review Trace VOA
January 2017 37
VII. Deuterated Monitoring Compound
A. Review Items
Form 2A-OR, Form 2B-OR quantitation reports, and chromatograms. (SOW SOM02.4 – Exhibit B, Section 3.4 and Exhibit D/Trace VOA, Sections 7.2.2.4 and 11.2.5)
B. Objective
The objective is to evaluate the DMC Percent Recovery (%R) to ensure that the analytical method is efficient.
C. Criteria
1. All samples and blanks are spiked with the DMCs listed in Table 9, just prior to sample purging, to measure the DMC %R.
2. The %R for each DMC should be calculated correctly according to the method.
3. The %R for each DMC in samples and blanks must be within the limits in Table 9.
Table 9. Trace Volatile DMCs and Recovery Limits
DMC Recovery Limits (%)
Vinyl chloride-d3 40 - 130
Chloroethane-d5 65 - 130
1,1-Dichloroethene-d2 60 - 125
2-Butanone-d5 40 - 130
Chloroform-d 70 - 125
1,2-Dichloroethane-d4 70 - 130
Benzene-d6 70 - 125
1,2-Dichloropropane-d6 60 - 140
Toluene-d8 70 - 130
trans-1,3-Dichloropropene-d4 55 - 130
2-Hexanone-d5 45 - 130
1,1,2,2-Tetrachloroethane-d2 65 - 120
1,2-Dichlorobenzene-d4 80 - 120
NOTE: The recovery limits for any of the compounds listed in Table 9 may be expanded at any time during the period of performance if the EPA determines that the limits are too restrictive.
D. Evaluation
1. Check the raw data (e.g., chromatograms and quantitation reports) to verify the recoveries on the Deuterated Monitoring Compound Recovery Form 2A-OR and Form 2B-OR.
2. Check for any calculation or transcription errors. Verify that the DMC recoveries were calculated correctly using the equation in the method and that the recalculated values agree with the laboratory reported values on Form 2A-OR and Form 2B-OR.

Organic Data Review Trace VOA
January 2017 38
3. Whenever there are two or more analyses for a particular sample, use professional judgment to determine which analysis has the most acceptable data to report. Considerations include, but are not limited to:
a. DMC recovery (marginal versus gross deviation).
b. Technical holding times.
c. Comparison of the target analyte results reported in each sample analysis.
d. Other QC information, such as performance of internal standards.
NOTE: For data obtained from the CLP, the preceding criteria are evaluated as part of the CCS process. Information regarding the noncompliant DMC %Rs can be obtained from the NFG reports and may be used as part of the evaluation process.
E. Action
1. If a DMC was not added to the samples and blanks, or the concentrations of DMCs in the samples and blanks are not as specified, use professional judgment to qualify detects and non-detects. The EPA Regional CLP COR should be contacted to arrange for reanalysis, if possible.
2. If errors are detected in the calculations of %R, perform a more comprehensive recalculation. It may be necessary to have the laboratory resubmit the data after making corrections.
3. If any DMC %R is outside the limits (Table 9) in samples, qualify the associated target analytes listed in Table 11 considering the existence of interference in the raw data. Considerations include, but are not limited to:
a. If the DMC %R is < 10%, qualify detects as estimated low (J-) and non-detects as unusable (R).
b. If the DMC %R is ≥ 10% and < lower acceptance limit, qualify detects as estimated low (J-) and non-detects as estimated (UJ).
c. If the DMC %R is ≥ lower acceptance limit and ≤ upper acceptance limit, detects and non-detects should not be qualified.
d. If the DMC %R is > upper acceptance limit, qualify detects as estimated high (J+). Non-detects should not be qualified.
4. If any DMC %R is outside the limits (Table 9) in a blank, special consideration should be taken to evaluate the validity of the associated sample data. The basic concern is whether the blank problems represent an isolated problem with the blank alone, or whether there is a fundamental problem with the analytical process.
For example, if one or more samples in the analytical sequence show acceptable DMC %Rs, the blank problem may be considered as an isolated occurrence. However, even if this judgment allows some use of the affected data, note analytical problems for EPA Regional CLP COR action.
Table 10. DMC Actions for Trace Volatile Analysis
Criteria Action
Detect Non-detect
%R < 10% J- R
10% ≤ %R < Lower Acceptance Limit J- UJ
Lower Acceptance Limit ≤ %R ≤ Upper Acceptance Limit No qualification No qualification
%R > Upper Acceptance Limit J+ No qualification

Organic Data Review Trace VOA
January 2017 39
Table 11. Trace Volatile DMCs and the Associated Target Analytes
Vinyl chloride-d3 (DMC-1) Chloroethane-d5 (DMC-2) 1,1-Dichloroethene-d2 (DMC-3) Vinyl chloride Dichlorodifluoromethane trans-1,2-Dichloroethene Chloromethane cis-1,2-Dichloroethene Bromomethane 1,1-Dichloroethene Chloroethane Carbon disulfide 2-Butanone-d5 (DMC-4) Chloroform-d (DMC-5) 1,2-Dichloroethane-d4 (DMC-6) Acetone 1,1-Dichloroethane Trichlorofluoromethane 2-Butanone Bromochloromethane 1,1,2-Trichloro-1,2,2-trifluoroethane Chloroform Methyl acetate Dibromochloromethane Methylene chloride Bromoform Methyl-tert-butyl ether 1,1,1-Trichloroethane Carbon tetrachloride 1,2-Dibromoethane 1,2-Dichloroethane Benzene-d6 (DMC-7) 1,2-Dichloropropane-d6
(DMC-8) Toluene-d8 (DMC-9)
Benzene Cyclohexane Trichloroethene Methylcyclohexane Toluene 1,2-Dichloropropane Tetrachloroethene Bromodichloromethane Ethylbenzene o-Xylene m,p-Xylene Styrene Isopropylbenzene trans-1,3-Dichloropropene-d4 (DMC-10)
2-Hexanone-d5 (DMC-11) 1,1,2,2-Tetrachloroethane-d2 (DMC-12)
cis-1,3-Dichloropropene 4-Methyl-2-pentanone 1,1,2,2,-Tetrachloroethane trans-1,3-Dichloropropene 2-Hexanone 1,2-Dibromo-3-chloropropane 1,1,2-Trichloroethane 1,2-Dichlorobenzene-d4 (DMC-13)
Chlorobenzene 1,3-Dichlorobenzene 1,4-Dichlorobenzene 1,2-Dichlorobenzene 1,2,4-Trichlorobenzene 1,2,3-Trichlorobenzene
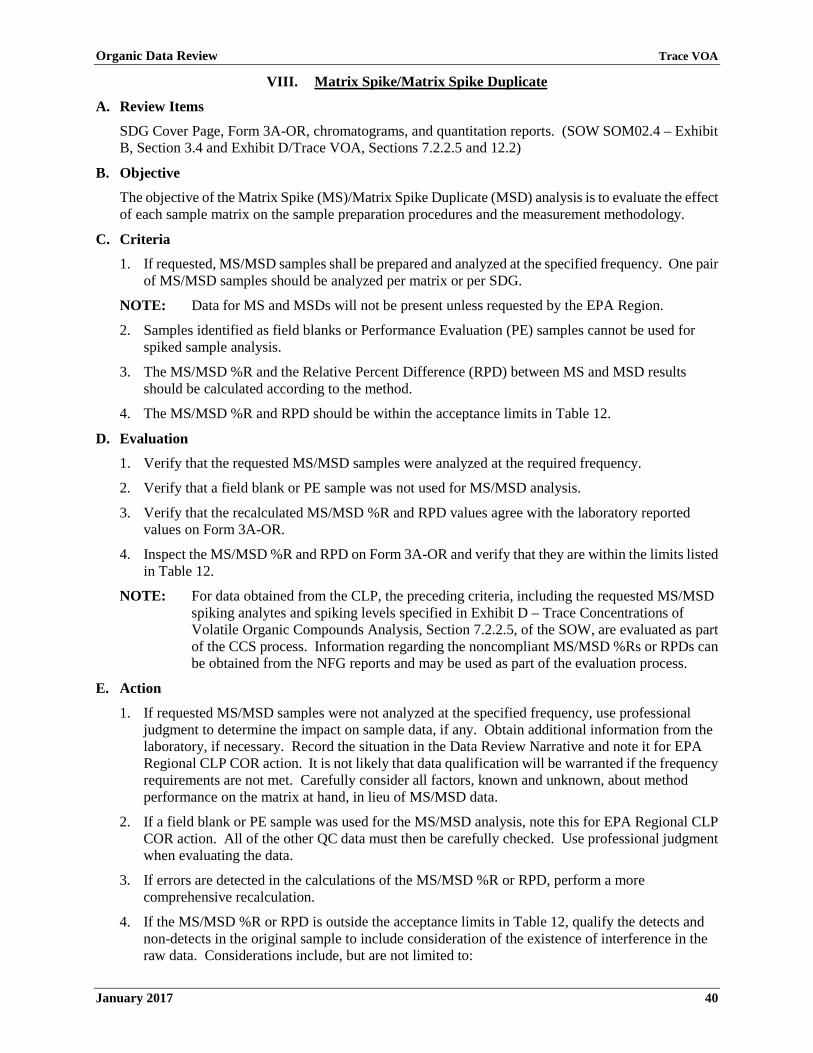
Organic Data Review Trace VOA
January 2017 40
VIII. Matrix Spike/Matrix Spike Duplicate
A. Review Items
SDG Cover Page, Form 3A-OR, chromatograms, and quantitation reports. (SOW SOM02.4 – Exhibit B, Section 3.4 and Exhibit D/Trace VOA, Sections 7.2.2.5 and 12.2)
B. Objective
The objective of the Matrix Spike (MS)/Matrix Spike Duplicate (MSD) analysis is to evaluate the effect of each sample matrix on the sample preparation procedures and the measurement methodology.
C. Criteria
1. If requested, MS/MSD samples shall be prepared and analyzed at the specified frequency. One pair of MS/MSD samples should be analyzed per matrix or per SDG.
NOTE: Data for MS and MSDs will not be present unless requested by the EPA Region.
2. Samples identified as field blanks or Performance Evaluation (PE) samples cannot be used for spiked sample analysis.
3. The MS/MSD %R and the Relative Percent Difference (RPD) between MS and MSD results should be calculated according to the method.
4. The MS/MSD %R and RPD should be within the acceptance limits in Table 12.
D. Evaluation
1. Verify that the requested MS/MSD samples were analyzed at the required frequency.
2. Verify that a field blank or PE sample was not used for MS/MSD analysis.
3. Verify that the recalculated MS/MSD %R and RPD values agree with the laboratory reported values on Form 3A-OR.
4. Inspect the MS/MSD %R and RPD on Form 3A-OR and verify that they are within the limits listed in Table 12.
NOTE: For data obtained from the CLP, the preceding criteria, including the requested MS/MSD spiking analytes and spiking levels specified in Exhibit D – Trace Concentrations of Volatile Organic Compounds Analysis, Section 7.2.2.5, of the SOW, are evaluated as part of the CCS process. Information regarding the noncompliant MS/MSD %Rs or RPDs can be obtained from the NFG reports and may be used as part of the evaluation process.
E. Action
1. If requested MS/MSD samples were not analyzed at the specified frequency, use professional judgment to determine the impact on sample data, if any. Obtain additional information from the laboratory, if necessary. Record the situation in the Data Review Narrative and note it for EPA Regional CLP COR action. It is not likely that data qualification will be warranted if the frequency requirements are not met. Carefully consider all factors, known and unknown, about method performance on the matrix at hand, in lieu of MS/MSD data.
2. If a field blank or PE sample was used for the MS/MSD analysis, note this for EPA Regional CLP COR action. All of the other QC data must then be carefully checked. Use professional judgment when evaluating the data.
3. If errors are detected in the calculations of the MS/MSD %R or RPD, perform a more comprehensive recalculation.
4. If the MS/MSD %R or RPD is outside the acceptance limits in Table 12, qualify the detects and non-detects in the original sample to include consideration of the existence of interference in the raw data. Considerations include, but are not limited to:
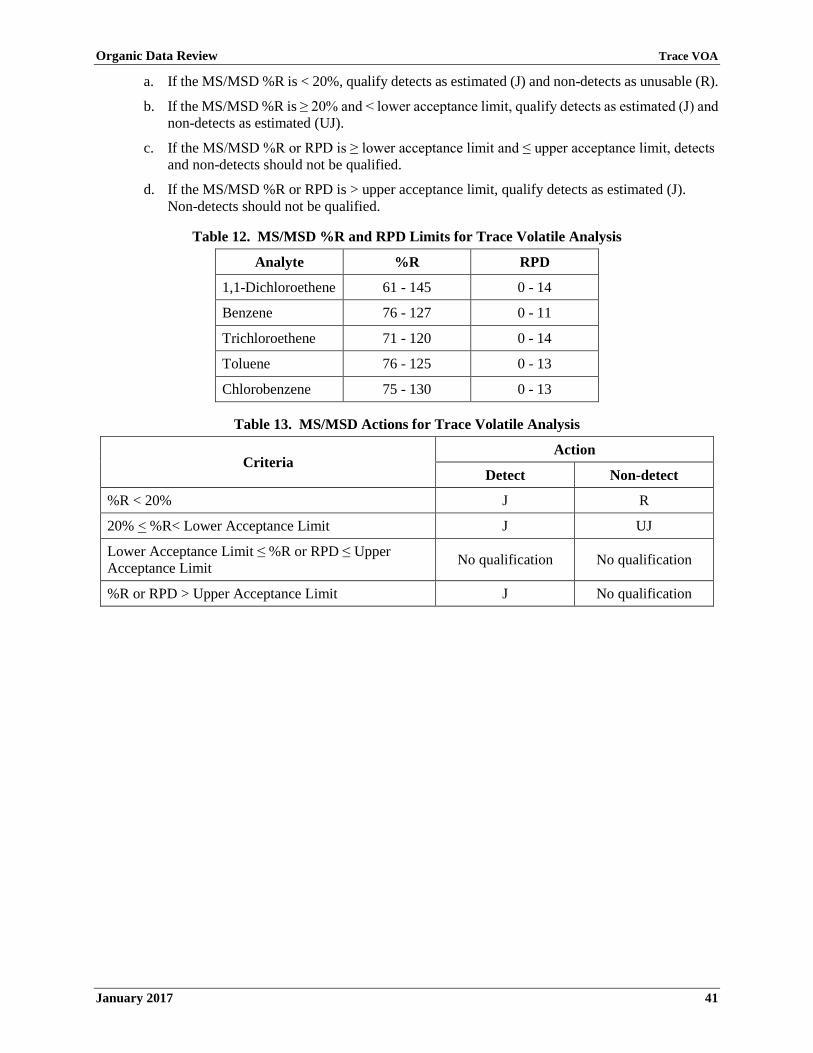
Organic Data Review Trace VOA
January 2017 41
a. If the MS/MSD %R is < 20%, qualify detects as estimated (J) and non-detects as unusable (R).
b. If the MS/MSD %R is ≥ 20% and < lower acceptance limit, qualify detects as estimated (J) and non-detects as estimated (UJ).
c. If the MS/MSD %R or RPD is ≥ lower acceptance limit and ≤ upper acceptance limit, detects and non-detects should not be qualified.
d. If the MS/MSD %R or RPD is > upper acceptance limit, qualify detects as estimated (J). Non-detects should not be qualified.
Table 12. MS/MSD %R and RPD Limits for Trace Volatile Analysis
Analyte %R RPD
1,1-Dichloroethene 61 - 145 0 - 14
Benzene 76 - 127 0 - 11
Trichloroethene 71 - 120 0 - 14
Toluene 76 - 125 0 - 13
Chlorobenzene 75 - 130 0 - 13
Table 13. MS/MSD Actions for Trace Volatile Analysis
Criteria Action
Detect Non-detect
%R < 20% J R
20% < %R< Lower Acceptance Limit J UJ
Lower Acceptance Limit ≤ %R or RPD ≤ Upper Acceptance Limit No qualification No qualification
%R or RPD > Upper Acceptance Limit J No qualification

Organic Data Review Trace VOA
January 2017 42
IX. Internal Standard
A. Review Items
Form 8A-OR, quantitation reports, and chromatograms. (SOW SOM02.4 – Exhibit B, Section 3.4 and Exhibit D/Trace VOA, Sections 7.2.2.6, 11.3.5, and 11.3.6)
B. Objective
The objective is to evaluate the internal standard performance to ensure that GC/MS sensitivity and response are stable during each analysis.
C. Criteria
1. The internal standard solution must be added to all samples and blanks at the specified concentration. The internal standard solution must contain all internal standard compounds specified in the method.
2. The area response of each internal standard compound in all samples and blanks must be within the inclusive ranges of 50-200% of the area response of the same internal standard compound from the associated opening CCV or the mid-point standard CS3 from the associated ICAL.
3. The RT of the internal standard compound in the sample or blank must not vary more than ±10.0 seconds from the RT of the same internal standard compound in the associated opening CCV or mid-point standard CS3 from the associated ICAL.
D. Evaluation
1. Verify that all required internal standard compounds were added to sample and blank analyses at the specified concentrations.
2. Check the raw data (e.g., chromatograms and quantitation reports) to verify that the RT and area response of each internal standard compound in a sample or blank are reported on Form 8A-OR.
3. Verify that the RTs and area responses for all internal standard compounds are within the specified criteria. If internal standard RTs are significantly different from the associated CCV or ICAL midpoint (i.e., more than 10 seconds), the internal standard peak may have been misidentified, but most likely a change in the chromatographic system should be suspected. This could be an improper desorb/injection cycle, a leak in the purge/trap/GC system, or the effect of a highly contaminated matrix. Normally, the area counts will also suffer in this situation, but even if they appear unaffected, both quantitative and qualitative results should be considered highly suspect.
4. If there is a reanalysis for a particular sample, determine which analysis is the best data to report. Considerations include, but are not limited to:
a. Magnitude and direction of the internal standard area response shift.
b. Magnitude and direction of the internal standard RT shift.
c. Technical holding times.
d. Comparison of the values of the target analytes reported in each method.
e. Other QC information.
NOTE: For data obtained from the CLP, the preceding criteria are evaluated as part of the CCS process. Information regarding the noncompliant internal standard area response or RT can be obtained from the NFG reports and may be used as part of the evaluation process.

Organic Data Review Trace VOA
January 2017 43
E. Action
NOTE: Apply the action to the target analytes in the samples or blanks that are associated to the noncompliant internal standard compound in Table 14. The internal standard and the associated target analytes are in Exhibit D – Trace Concentrations of Volatile Organic Compounds Analysis, Table 9, of the SOW.
1. If the required internal standard compounds were not added to a sample or blank, qualify detects and non-detects as unusable (R).
2. If the required internal standard compound was not analyzed at the specified concentration in a sample or blank, use professional judgment to qualify detects and non-detects.
3. If the area response of an internal standard compound in a sample or blank is < 20% of the area response of the same internal standard compound in the associated opening CCV or mid-point standard CS3 from the associated ICAL, qualify detects as estimated high (J+) and non-detects as unusable (R).
4. If the area response of an internal standard compound in a sample or blank is ≥ 20 % and < 50% of the area response of the same internal standard compound in the associated opening CCV or mid-point standard CS3 from the associated ICAL, qualify detects as estimated high (J+) and non-detects as estimated (UJ).
5. If the area response of an internal standard compound in a sample or blank is within the inclusive range of 50-200% of the area response of the same internal standard compound in the associated opening CCV or mid-point standard CS3 from the associated ICAL, detects and non-detects should not be qualified.
6. If the area response of an internal standard compound in a sample or blank is > 200% of the area response of the same internal standard compound in the associated opening CCV or mid-point standard CS3 from the associated ICAL, qualify detects as estimated low (J-). Non-detects should not be qualified.
7. If the RT shift between sample/blank and the associated opening CCV or mid-point standard CS3 from the associated ICAL of an internal standard compound is > 10.0 seconds, qualify detects and non-detects as unusable (R). The EPA Regional CLP COR should be contacted to arrange for reanalysis.
8. If the RT shift between sample/blank and the associated opening CCV or mid-point standard CS3 from the associated ICAL of an internal standard compound is < 10.0 seconds, detects and non-detects should not be qualified.
9. If the internal standard performance criteria are grossly exceeded, annotate the potential effects on the data in the Data Review Narrative and note it for EPA Regional CLP COR action.

Organic Data Review Trace VOA
January 2017 44
Table 14. Internal Standard Actions for Trace Volatile Analysis
Criteria Action
Detect Non-detect
Area response < 20% of the opening CCV or mid-point standard CS3 from ICAL J+ R
20% ≤ Area response < 50% of the opening CCV or mid-point standard CS3 from ICAL J+ UJ
50% ≤ Area response ≤ 200% of the opening CCV or mid-point standard CS3 from ICAL No qualification No qualification
Area response > 200% of the opening CCV or mid-point standard CS3 from ICAL J- No qualification
RT shift between sample/blank and opening CCV or mid-point standard CS3 from ICAL > 10.0 seconds R R
RT shift between sample/blank and opening CCV or mid-point standard CS3 from ICAL < 10.0 seconds No qualification No qualification

Organic Data Review Trace VOA
January 2017 45
X. Target Analyte Identification
A. Review Items
Form 1A-OR, quantitation reports, mass spectra, and chromatograms. (SOW SOM02.4 – Exhibit B, Section 3.4 and Exhibit D/Trace VOA, Section 11.1.1)
B. Objective
The objective is to provide acceptable GC/MS qualitative analysis to minimize the number of erroneous analyte identifications.
C. Criteria
1. The mass spectrum of the analyte from the sample analysis must match that of the same analyte in the associated opening CCV or mid-point standard CS3 from the associated ICAL according to the following criteria:
a. All ions present in the calibration standard mass spectrum must be present in the sample spectrum at a relative intensity > 10%.
b. The relative intensities of these ions must agree within ±20% between the standard and sample spectra (e.g., for an ion with an abundance of 50% in the standard spectrum, the corresponding sample ion abundance must be between 30-70%).
c. Ions present at > 10% in the sample mass spectrum, but not present in the standard spectrum, must be evaluated by a reviewer experienced in mass spectral interpretation.
2. The Relative Retention Time (RRT) for a positively identified target analyte must be within ±0.06 RRT units of the RRT for the same analyte in the associated opening CCV or mid-point standard CS3 from the associated ICAL.
D. Evaluation
1. Verify that the positively identified target analyte mass spectrum meets the specified criteria. If not, examine the sample target analyte spectra for the presence of interference at one or more mass fragment peaks. Although the presence of a co-eluting interferent may preclude positive identification of the analyte, the presumptive evidence of its presence may be useful information to include in the Data Review Narrative.
2. Verify that the RRT of the positively identified target analyte is within ±0.06 RRT units of the RRT for the same analyte in the associated opening CCV or mid-point standard CS3 from the associated ICAL.
3. Be aware of situations when sample carryover is a possibility and use professional judgment to determine if instrument cross-contamination has affected any positive analyte identification. An instrument blank must be analyzed after a sample containing target analytes with concentrations exceeding the ICAL range (20 μg/L for non-ketones, 200 μg/L for ketones), non-target compounds at concentrations > 100 μg/L, or saturated ions from an analyte (excluding the analyte peaks in the solvent front).
4. Verify that peaks are correctly identified as target analytes, TICs, DMCs, or internal standards on the chromatogram for samples and blanks.
5. Verify that there is no erroneous analyte identification, either false positive or false negative, for each target analyte. The positively identified target analytes can be more easily detected for false positives than false negatives. More information is available for false positives due to the requirement for submittal of data supporting positive identifications. Non-detected target analytes, on the other hand, are more difficult to assess. One example of the detection of false negatives is reporting a target analyte as a TIC.

Organic Data Review Trace VOA
January 2017 46
NOTE: For data obtained from the CLP, the preceding criteria are evaluated as part of the CCS process. Information regarding the noncompliant TICs can be obtained from the CCS report and may be used as part of the evaluation process.
NOTE: A target analyte reported as a false negative may not have the best match in a TIC search of a contaminated sample, but its mass spectrum may be present under that of a reported TIC.
E. Action
1. If the positively identified target analyte mass spectrum does not meet the specified criteria, qualify detect as unusable (R), or report the result at the CRQL and qualify as non-detect (U).
2. If the RRT for a positively identified target analyte is outside the specified RRT windows, qualify detect as unusable (R), or report the result at the CRQL and qualify as non-detect (U).
3. If it is determined that cross-contamination has occurred, use professional judgment to qualify detects. Annotate any changes made to the reported analytes due to either false positive or negative identifications, or concerns regarding target analyte identifications, in the Data Review Narrative. Note the necessity for numerous or significant changes for EPA Regional CLP COR action.

Organic Data Review Trace VOA
January 2017 47
XI. Target Analyte Quantitation and Reported Contract Required Quantitation Limit
A. Review Items
Form 1A-OR, sample preparation sheets, SDG Narrative, quantitation reports, and chromatograms. (SOW SOM02.4 – Exhibit B, Section 3.4 and Exhibit D/Trace VOA, Sections 11.2.1, 11.2.2, and 11.2.4)
B. Objective
The objective is to ensure that the reported results and CRQLs for target analytes are accurate.
C. Criteria
1. Target analyte results and sample-specific CRQLs must be calculated according to the correct equations.
2. Target analyte RRF must be calculated using the correct associated internal standard, as listed in the method. Quantitation must be based on the quantitation ion (m/z) specified in the method for both the internal standards and target analytes. Target analyte result must be calculated using the RRF������ from the associated ICAL.
D. Evaluation
1. Verify that the results for all positively identified analytes are calculated and reported by the laboratory.
2. Verify that the CRQLs are calculated for the non-detects and reported accordingly.
3. Verify that the correct internal standard, quantitation ion, and RRF������ are used to calculate the reported results.
4. Verify that the same internal standard, quantitation ion, and RRF������ are used consistently.
5. Verify that the sample-specific CRQLs have been calculated and adjusted to reflect original sample mass/volume and any applicable dilutions.
NOTE: For data obtained from the CLP, the preceding criteria are evaluated as part of the CCS process. Information regarding the noncompliant results or CRQLs can be obtained from the CCS report and may be used as part of the evaluation process.
E. Action
1. If any discrepancies are found, contact the EPA Regional CLP COR, who may contact the laboratory to obtain additional information that could resolve any differences. If a discrepancy remains unresolved, use professional judgment to decide which value is the most accurate and to determine whether qualification of the data is warranted. Annotate the reasons for any data qualification in the Data Review Narrative.
2. If errors are detected in results and CRQL calculations, perform a more comprehensive recalculation.
3. If sample results are < CRQLs and ≥ MDLs, qualify as estimated (J).
4. Note numerous or significant failures to accurately quantify the target analytes, or to properly evaluate and adjust CRQLs, for EPA Regional CLP COR action.

Organic Data Review Trace VOA
January 2017 48
XII. Tentatively Identified Compounds
A. Review Items
Form 1B-OR, chromatograms, library search printouts, and spectra for the TIC candidates. (SOW SOM02.4 – Exhibit B, Section 3.4 and Exhibit D/Trace VOA, Sections 11.1.2 and 11.2.3)
B. Objective
The objective is to provide tentative identifications to chromatographic peaks that are not identified as target analytes, DMCs, or internal standards.
C. Criteria
For each sample, the laboratory must conduct a mass spectral search of the National Institute of Standards and Technology (NIST) (2011 release or later), Wiley (2011 release or later), or equivalent mass spectral library, and report the possible identity for up to 30 of the largest peaks that are not DMCs, internal standards, or target analytes. The peak for a TIC should have an area or height > 10% of the area or height of the nearest internal standard. The estimated concentration for a TIC is calculated similarly to that for a target analyte, using total ion areas for the TIC and the internal standard, and assuming an RRF of 1.0.
1. Guidelines for tentative identification are as follows:
a. Major ions (> 10% Relative Intensity) in the reference spectrum should be present in the sample spectrum.
b. The relative intensities of the major ions should agree within ±20% between the sample and the reference spectra.
c. Molecular ions present in the reference spectrum should be present in the sample spectrum.
d. Non-target compounds receiving a library search match of 85% or higher are considered a “probable match”. The compound should be reported unless the mass spectral interpretation specialist feels there is evidence not to report the compound as identified by the library search program. The laboratory should include the justification for not reporting a compound as listed by the search program in the SDG Narrative.
e. If the library search produces more than one compound ≥ 85%, the compound with the highest percent match (report first compound if percent match is the same for two or more compounds) should be reported, unless the mass spectral interpretation specialist feels that the highest match compound should not be reported, or another compound with a lower match should be reported. The laboratory should include the justification for not reporting the compound with the highest spectral match within the SDG Narrative. DMCs, internal standards, and target analytes should not be reported as TICs.
f. If the library search produces a series of obvious isomer compounds with library search matches ≥ 85%, the compound with the highest library search percent match (or the first compound if the library search matches are the same) should be reported. The laboratory should note in the SDG Narrative that the exact isomer configuration, as reported, may not be accurate.
g. If the library search produces no match ≥ 85%, and in the technical judgment of the mass spectral interpretation specialist no valid tentative identification can be made, the compound should be reported as “unknown”. The mass spectral specialist should give additional classification of the unknown compound, if possible (e.g., “unknown aromatic”, “unknown hydrocarbon”, “unknown acid type”, “unknown chlorinated compound”). If probable molecular weights can be distinguished, they should be included.

Organic Data Review Trace VOA
January 2017 49
h. The Chemical Abstracts Service (CAS) registry number is the unique identifier for each chemical compound. As the rules of chemical nomenclature have changed over time, each chemical substance is liable to have several names or synonyms [i.e., trade or brand name(s); generic or common name(s); trivial or systematic; or International Union of Pure and Applied Chemistry (IUPAC) name(s)]. Whether synonyms or other names are created for this compound, the CAS registry number will remain unchanged. The CAS registry number is simply an identifier which has no structural significance. Regardless of RTs, if the library search produces two or more compounds at or above 85% with the same CAS Number, the compound with the highest percent match (report first compound if the percent match is the same for two or more compounds) should be reported unless the mass spectral interpretation specialist feels there is just evidence not to report the compound with the highest match.
i. If the library search produces only one and the same compound (i.e., the same CAS registry number) with the match at or above 85% at two different RTs, the compound having the highest percent match should be reported as TIC and the other one could be reported as unknown. If both TICs have the same percent match for the same compound, one of the TICs could be reported as unknown. Such justifications should be included in the SDG Narrative.
j. Alkanes are not to be reported as TICs on Form 1B-OR. An alkane is defined as any hydrocarbon with the generic formula CnH2n+2 (straight-chain or branched) or CnH2n (cyclic) that contains only C-H and C-C single bonds. When the preceding alkanes are tentatively identified, the concentration(s) should be estimated and the analytes reported as alkanes by class (i.e., straight-chain, branched, cyclic, as a series, or as applicable) in the SDG Narrative. Total alkanes concentration should be reported on Form 1B-OR.
D. Evaluation
1. Verify that the laboratory has generated a library search for all required peaks in the chromatograms for samples and blanks.
2. Verify that TIC peaks present in samples are not found in blanks. When a low-level, non-target compound that is a common artifact or laboratory contaminant is detected in a sample, a thorough check of blank chromatograms may require looking for peaks which are < 10% of the internal standard height, but present in the blank chromatogram at a similar RRT.
3. Verify that mass spectra for all reported TICs are present for every sample and blank.
4. Review ions present in the sample spectrum, but not in the reference spectrum, for possible background contamination, interference, or presence of coeluting compounds.
5. Review ions present in the reference spectrum, but not in the sample spectrum, for possible subtraction from the sample spectrum because of background contamination or coeluting compounds. Data system library reduction programs can sometimes create these discrepancies.
6. Consider all reasonable choices since TIC library searches often yield several candidate compounds having a close matching score.
7. Be aware of common laboratory artifacts/contaminants and their sources (e.g., Aldol condensation products, solvent preservatives, and reagent contaminants). These may be present in blanks and not reported as sample TICs, such as:
a. Common laboratory contaminants include CO2 (m/z 44), siloxanes (m/z 73), diethyl ether, hexane, certain freons, and phthalates at levels < 100 µg/L.
b. Solvent preservatives include cyclohexene (a methylene chloride preservative). Related by-products include cyclohexanone, cyclohexenone, cyclohexanol, cyclohexenol, chlorocyclohexene, and chlorocyclohexanol.
c. Aldol condensation reaction products of acetone include 4-hydroxy-4-methyl-2-pentanone, 4-methyl-2-penten-2-one, and 5,5-dimethyl-2(5H)-furanone.

Organic Data Review Trace VOA
January 2017 50
8. A target analyte may be identified by non-target library search procedures, even though it is not identified as a target analyte (false negative). If the total area quantitation method is used, request that the laboratory recalculate the result using the proper quantitation ion and RRF.
a. A non-target compound may be incorrectly identified by the instrument’s target analyte data processor as a target analyte (false positive). When this happens, the non-target library search procedure will not detect the false positive as a TIC. In this case, request that the laboratory properly identify the analyte as a TIC and recalculate the result using the total area quantitation method and an RRF of 1.0.
b. Evaluate other sample chromatograms and check for both false negatives and false positives to determine if the occurrence is isolated or systematic.
9. Verify that the TIC concentration is calculated using an RRF of 1.0.
E. Action
1. If the library search match for a TIC is ≥ 85%, qualify the TIC as tentatively identified with estimated concentration (NJ).
2. If the library search match for a TIC is < 85%, qualify the TIC as unknown with estimated concentration (J).
3. General actions related to the review of TIC results are as follows:
a. If it is determined that a tentative identification of a non-target compound is unacceptable, change the tentative identification to “unknown” or another appropriate identification, and qualify the result as estimated (J).
b. If a library search or proper calculation was not performed for all contractually-required peaks, the EPA Regional CLP COR may request the data from the laboratory.
c. Use professional judgment to determine whether a library search result for a TIC represents a reasonable identification. If there is more than one possible match, report the result as “either compound X or compound Y”. If there is a lack of isomer specificity, change the TIC result to a non-specific isomer result (e.g., 1,3,5-trimethyl benzene to trimethyl benzene isomer) or to a compound class (e.g., 2-methyl, 3-ethyl benzene to a substituted aromatic compound).
d. Other Case factors may influence TIC judgments. If a sample TIC match is poor, but other samples have a TIC with a valid library match, similar RRT, and the same ions, infer identification information from the other sample TIC results.
4. Note any changes made to the reported data or any concerns regarding TIC identifications in the Data Review Narrative.
5. Note any failure to properly evaluate and report TICs for EPA Regional CLP COR action.

Organic Data Review Trace VOA
January 2017 51
XIII. System Performance
A. Review Items
Form 8A-OR and chromatograms. (SOW SOM02.4 – Exhibit B, Section 3.4 and Exhibit D/Trace VOA, Section 11.1)
B. Objective
The objective is to ensure that the system is stable during the analytical sequence to produce quality data.
C. Criteria
There are no specific criteria for system performance.
D. Evaluation
1. Abrupt discrete shifts in the Reconstructed Ion Chromatogram (RIC) baseline may indicate a change in the instrument’s sensitivity or in the zero setting. A baseline “shift” could indicate a decrease in sensitivity in the instrument or an increase in the instrument zero, possibly causing target compounds at or near the detection limit to miss detection. A baseline “rise” could indicate problems such as a change in the instrument zero, a leak, or degradation of the column.
2. Poor chromatographic performance affects both qualitative and quantitative results. Indications of substandard performance include:
a. High RIC background levels or shifts in absolute RTs of internal standards.
b. Excessive baseline rise at elevated temperature.
c. Extraneous peaks.
d. Loss of resolution.
e. Peak tailing or peak splitting that may result in inaccurate quantitation.
3. A drift in instrument sensitivity may occur during the 12-hour period and may be an indication of possible internal standard spiking problems. This could be discerned by examination of the internal standard area on Form 8A-OR for trends such as a continuous or near-continuous increase or decrease in the internal standard area over time.
E. Action
1. Use professional judgment to qualify the data if it is determined that system performance has degraded during sample analyses.
2. Note any degradation of system performance which significantly affected the data for EPA Regional CLP COR action.

Organic Data Review Trace VOA
January 2017 52
XIV. Performance Evaluation Sample
A. Review Items
Form 1A-OR, TR/COC Record documentation, preparation logs, instrument printouts, and raw data. (SOW SOM02.4 – Exhibit B, Section 3.4 and Exhibit F, Section 4.1)
B. Objective
The objective is to determine the validity of the analytical results based on the recovery of the PE sample(s).
C. Criteria
1. Matrix-specific PE samples shall be analyzed utilizing the same analytical methods and Quality Assurance/Quality Control (QA/QC) procedures as employed for the samples, at a frequency to be determined by each EPA Region for each site. PE samples must be analyzed in an SDG containing field samples for the Case, using the same procedures, reagents, and instrumentation.
D. Evaluation
1. Verify, using Form 1A-OR, preparation logs, and raw data, that the PE samples were analyzed with the field samples and field blanks in the SDG.
2. Verify, using Form 1A-OR, that the PE sample results are within the warning limits (95% confidence interval) and action limits (99% confidence interval).
3. If a significant number (i.e., half or more) of the analytes in the PE samples fall outside of the 95% warning or 99% action criteria, or a number of false positive results are reported, evaluate the overall impact on the data.
E. Action
NOTE: If the PE sample criteria are not met, the laboratory performance and method accuracy are in question. Use professional judgment to determine if the data should be qualified or rejected. The following guidance is suggested for qualifying sample data associated with a PE sample that does not meet the required criteria.
For a PE sample that does not meet the technical criteria, apply the action to all samples in the same preparation batch. If the concentration of any analyte in a PE sample is not comparable to the analyte’s concentration in the field samples or field blanks (i.e., it is much higher or much lower than the concentration in these samples), the action may be applied to only those samples in which the analyte’s concentration is comparable to the PE sample concentration.
1. If the PE sample was not analyzed with the field samples and field blanks, use professional judgment to determine if the associated sample results should be qualified. Obtain additional information from the laboratory, if necessary. If a laboratory fails to analyze the PE sample(s) provided with field samples and field blanks, or if a laboratory consistently fails to generate acceptable PE sample results, record the situation in the Data Review Narrative, and note it for EPA Regional CLP COR action.
2. If the PE sample results are outside the lower warning limits but inside the lower action limits, qualify detects as estimated low (J-) and non-detects as estimated (UJ).
3. If the PE sample results are outside the lower action limits, qualify detects as estimated low (J-) and non-detects as unusable (R).
4. If the PE sample results are within the limits, detects and non-detects should not be qualified.
5. If the PE sample results are outside the upper warning limits but inside the upper action limits, qualify detects as estimated high (J+). Non-detects should not be qualified.

Organic Data Review Trace VOA
January 2017 53
6. If the PE sample results are outside the upper action limits, qualify detects as estimated high (J+). Non-detects should not be qualified.
7. Annotate the potential effects on the data due to out-of-control PE sample results in the Data Review Narrative.
Table 15. PE Sample Actions for Trace Volatile Analysis
Criteria Action
Detect Non-detect PE sample results outside lower warning limits but inside lower action limits J- UJ
PE sample results outside lower action limits J- R PE sample results within limits No qualification No qualification PE sample results outside upper warning limits but inside upper action limits J+ No qualification
PE sample results outside upper action limits J+ No qualification

Organic Data Review Trace VOA
January 2017 54
XV. Regional Quality Assurance and Quality Control
A. Review Items
Form 1A-OR, chromatograms, TR/COC Record documentation, quantitation reports, and other raw data from QA/QC samples. (SOW SOM02.4 – Exhibit B, Sections 2.4 and 3.4)
B. Objective
The objective is to use results from the analysis of EPA Regional QA/QC samples such as field duplicates, blind spikes, and blind blanks to determine the validity of the analytical results.
C. Criteria
Criteria are determined by each EPA Region.
1. The frequency of EPA Regional QA/QC samples should be defined in the project QAPP.
2. Performance criteria for EPA Regional QA/QC samples should also be defined in the projectQAPP.
3. The EPA Region may provide the laboratory with PE samples to be analyzed with each SDG.These samples may include blind spikes and/or blind blanks. The laboratory must analyze a PEsample when provided by the EPA Region. Refer to Section VI, above, for blanks criteria. Refer toSection XIV, above, for PE samples criteria.
4. The RPD between field duplicates shall fall within the specific limits in the EPA Region’s SOP orproject QAPP.
D. Evaluation
1. Evaluation procedures must follow the EPA Region’s SOP for data review.
2. Determine whether the results of EPA Regional QA/QC samples impact all samples in the projector only those directly associated (i.e., in the same SDG, collected on the same day, preparedtogether, or contained in the same analytical sequence).
3. Calculate the RPD between field duplicates and provide this information in the Data ReviewNarrative. Also verify that the value falls within the specific limits in the EPA Region’s SOP orproject QAPP.
4. Determine whether poor precision is the fault of the laboratory, or a result of samplenon-homogeneity in the field. Laboratory observations of sample appearance may becomeimportant in these situations.
E. Action
1. Any action must be in accordance with EPA Regional specifications and the criteria for acceptablefield duplicate sample results.
2. Note unacceptable results for field duplicate samples for EPA Regional CLP COR action.
3. In general, for EPA Regional QA/QC performance not within QAPP specification, qualify detects as estimated (J) and non-detects as estimated (UJ). The impact on overall data quality should be assessed after consultation with the data user and/or field personnel. Contact the EPA Regional CLP COR if reanalysis of samples is required.

Organic Data Review Trace VOA
January 2017 55
XVI. Overall Assessment of Data
A. Review Items
Entire data package, data review results, and (if available) the QAPP and Sampling and Analysis Plan (SAP).
B. Objective
The objective is to provide the overall assessment on data quality and usability.
C. Criteria
1. Review all available materials to assess the overall quality of the data, keeping in mind the additive nature of analytical problems.
2. Reported analyte concentrations must be quantitated according to the appropriate equations, as listed in the method. All sample results must be within the linear calibration ranges per the methods.
D. Evaluation
Examine the raw data to verify that the correct calculation of the sample results was reported by the laboratory. Analysis logs, instrument printouts, etc., should be compared to the reported sample results recorded on the appropriate Organic Data Reporting Forms (Form 1A-OR through Form 8A-OR).
1. Evaluate any technical problems which have not been previously addressed.
2. Examine the raw data for any anomalies (e.g., baseline shift).
3. Verify that the appropriate method is used in sample analysis.
4. Verify that there are no transcription or reduction errors.
5. Verify that target analyte results fall within the calibrated ranges.
6. If appropriate information is available, use professional judgment to assess the usability of the data in order to assist the data user in avoiding inappropriate use of the data. Review all available information, including the QAPP (specifically the acceptance and performance criteria), SAP, and communication with the data user that concerns the intended use and desired quality of these data.
E. Action
1. Use professional judgment to determine if there is any need to qualify data which were not qualified based on the QC criteria previously discussed.
2. Use professional judgment to qualify sample results and non-detects if the MDL exceeds the CRQL.
3. If a sample is not diluted properly when sample results exceed the upper limit of the calibration range, qualify sample results as estimated (J).
4. Write a brief Data Review Narrative to give the user an indication of the limitations of the analytical data.
5. Note any inconsistency of the data with the SDG Narrative for EPA Regional CLP COR action. If sufficient information on the intended use and required quality of the data is available, include an assessment of the usability of the data within the given context. This may be used as part of a formal Data Quality Assessment (DQA).
Organic Data Review Trace VOA
January 2017 56
This page is intentionally left blank.
Organic Data Review Low/Medium VOA
January 2017 57
LOW/MEDIUM VOLATILE DATA REVIEW
The Low/Medium Volatile organic data requirements to be reviewed during validation are listed below:
I. Preservation and Holding Times ..................................................................................................... 59
II. Gas Chromatograph/Mass Spectrometer Instrument Performance Check ...................................... 63
III. Initial Calibration ............................................................................................................................. 71
IV. Initial Calibration Verification ........................................................................................................ 76
V. Continuing Calibration Verification ................................................................................................ 79
VI. Blanks .............................................................................................................................................. 82
VII. Deuterated Monitoring Compound .................................................................................................. 85
VIII. Matrix Spike/Matrix Spike Duplicate .............................................................................................. 88
IX. Internal Standard ............................................................................................................................. 90
X. Target Analyte Identification........................................................................................................... 93
XI. Target Analyte Quantitation and Reported Contract Required Quantitation Limit ......................... 95
XII. Tentatively Identified Compounds .................................................................................................. 97
XIII. System Performance ...................................................................................................................... 100
XIV. Performance Evaluation Sample ................................................................................................... 101
XV. Regional Quality Assurance and Quality Control ......................................................................... 103
XVI. Overall Assessment of Data .......................................................................................................... 104
Organic Data Review Low/Medium VOA
January 2017 58
This page is intentionally left blank.

Organic Data Review Low/Medium VOA
January 2017 59
I. Preservation and Holding Times
A. Review Items
Form 1A-OR, Form 1B-OR, Traffic Report/Chain of Custody (TR/COC) Record documentation, Form DC-1, preparation sheet, raw data, and the Sample Delivery Group (SDG) Narrative checking for: pH, shipping container temperature, holding time, and other sample conditions. (SOW SOM02.4 – Exhibit B, Section 3.4; Exhibit D/Introduction, Section 5.0; Exhibit D/General, Sections 8.0, 10.1.2.1, and 10.2.2.4.4; and Exhibit D/Low/Med VOA, Section 8.0)
B. Objective
The objective is to determine the validity of the analytical results based on the sample conditions and the holding time of the sample.
C. Criteria
1. Technical holding time is determined from the date of sample collection to the date of sample analysis for aqueous and non-aqueous (soil and sediment) samples that are not designated for Toxicity Characteristic Leaching Procedure (TCLP)/Synthetic Precipitation Leaching Procedure (SPLP) Zero Headspace Extraction (ZHE) procedures. The extraction technical holding time for samples designated for TCLP/SPLP is determined from the date of sample collection to the date of sample extraction.
2. For TCLP/SPLP leachate samples, technical holding time is determined from the date of TCLP/SPLP ZHE completion to the date of TCLP/SPLP leachate sample analysis.
3. Samples should be in proper condition with shipping container temperatures at ≤ 6°C upon receipt at the laboratory. Aqueous samples, TCLP/SPLP aqueous and aqueous filtrate samples, TCLP/SPLP leachate samples, and preserved non-aqueous samples shall be protected from light and refrigerated at ≤ 6°C (but not frozen) from the time of receipt at the laboratory. Unpreserved soil samples and samples received in field core sampling/storage containers (EncoreTM or equivalent) shall be protected from light and stored at < -7ºC from the time of receipt at the laboratory.
4. The extraction technical holding time criteria for samples designated for TCLP/SPLP is 14 days.
5. The technical holding time criteria for aqueous samples that are properly cooled at ≤ 6°C, but without any indications of being preserved, is 7 days.
6. The technical holding time criteria for TCLP/SPLP aqueous filtrate samples and TCLP/SPLP leachate samples that are properly cooled at ≤ 6°C is 7 days.
7. The technical holding time criteria for aqueous samples that are properly cooled at ≤ 6°C, and acid-preserved with HCl to a pH of ≤ 2, is 14 days.
8. Samples received in field core sampling/storage containers should be transferred, immediately upon receipt, to a pre-prepared closed-system purge-and-trap (P/T) vial and either be analyzed within 24 hours of sample receipt, or stored at < -7°C and analyzed within 14 days.
9. The technical holding time criteria for non-aqueous samples that are frozen at < -7°C, but not preserved with NaHSO, is 14 days.
10. The technical holding time criteria for non-aqueous samples that are properly cooled at ≤ 6°C (but not frozen), and preserved with NaHSO, is 14 days.
11. The technical holding time criteria for non-aqueous samples that are properly cooled at ≤ 6°C (but not frozen), and preserved with methanol, is 14 days.
12. Samples received in field core sampling/storage containers should be transferred, immediately upon receipt, to a pre-prepared closed system P/T vial and analyzed or frozen within 24 hours of receipt.

Organic Data Review Low/Medium VOA
January 2017 60
D. Evaluation
1. Review the SDG Narrative to determine if the samples were properly preserved and arrived at the laboratory in proper condition (e.g., received intact, appropriate sample temperature at receipt, pH, and absence of air bubbles or detectable headspace). If there is an indication of problems with the samples, the sample integrity may be compromised.
2. Establish the TCLP/SPLP ZHE procedure technical holding times by comparing the sample collection dates on the TR/COC Record documentation with the dates of extraction in the preparation sheet. Also consider information contained in the Complete SDG File (CSF), as it may be helpful in the assessment.
3. Verify that the analysis dates on Form 1A-OR, Form 1B-OR, and the raw data are identical.
4. Establish technical holding times for TCLP/SPLP leachate samples by comparing the dates on the extraction sheet with the dates of analysis on Form 1A-OR and Form 1B-OR.
5. Establish technical holding times by comparing the sample collection dates on the TR/COC Record documentation with the dates of analysis on Form 1A-OR, Form 1B-OR, and the raw data. Also consider information contained in the CSF, as it may be helpful in the assessment.
a. These evaluation guidelines are intended to address the integrity of data for all analytes listed in SOW SOM02.4 Exhibit C, Table 2 – Low/Medium Volatiles Target Analyte List and Contract Required Quantitation Limits. If the data user is interested in only a subset of the analytes and has data supporting analyte stability over longer holding times, then those longer times may be applied prior to data qualification under Section E, below. This information should be made part of the Data Review Narrative for evidentiary purposes.
E. Action
1. If samples are received with shipping container temperatures > 6°C but ≤ 10°C, use professional judgment to qualify detects and non-detects.
2. If samples are received with shipping container temperatures > 10°C, use professional judgment to determine the reliability of the data, or qualify detects as estimated (J) and non-detects as estimated (UJ).
3. If the TCLP/SPLP ZHE procedure is performed within the extraction technical holding time of 14 days, detects and non-detects should not be qualified.
4. If the TCLP/SPLP ZHE procedure is performed outside the extraction technical holding time of 14 days, qualify detects as estimated (J) and non-detects as unusable (R).
5. If a discrepancy is found between the sample analysis date on Form 1A-OR, Form 1B-OR, and the raw data, perform a more comprehensive review to determine the correct date for establishing the holding time.
6. If aqueous samples are not properly preserved, but the samples are analyzed within the technical holding time of 7 days, detects and non-detects should not be qualified.
7. If TCLP/SPLP aqueous filtrate samples and TCLP/SPLP leachate samples are analyzed within the technical holding time of 7 days, detects and non-detects should not be qualified.
8. If aqueous samples are not properly preserved and are analyzed outside of the technical holding time of 7 days, qualify detects as estimated (J) and non-detects as unusable (R).
9. If TCLP/SPLP aqueous filtrate samples and TCLP/SPLP leachate samples are analyzed outside of the technical holding time of 7 days, qualify detects as estimated (J) and non-detects as unusable (R).
10. If aqueous samples are properly preserved and are analyzed within the technical holding time of 14 days, detects and non-detects should not be qualified.
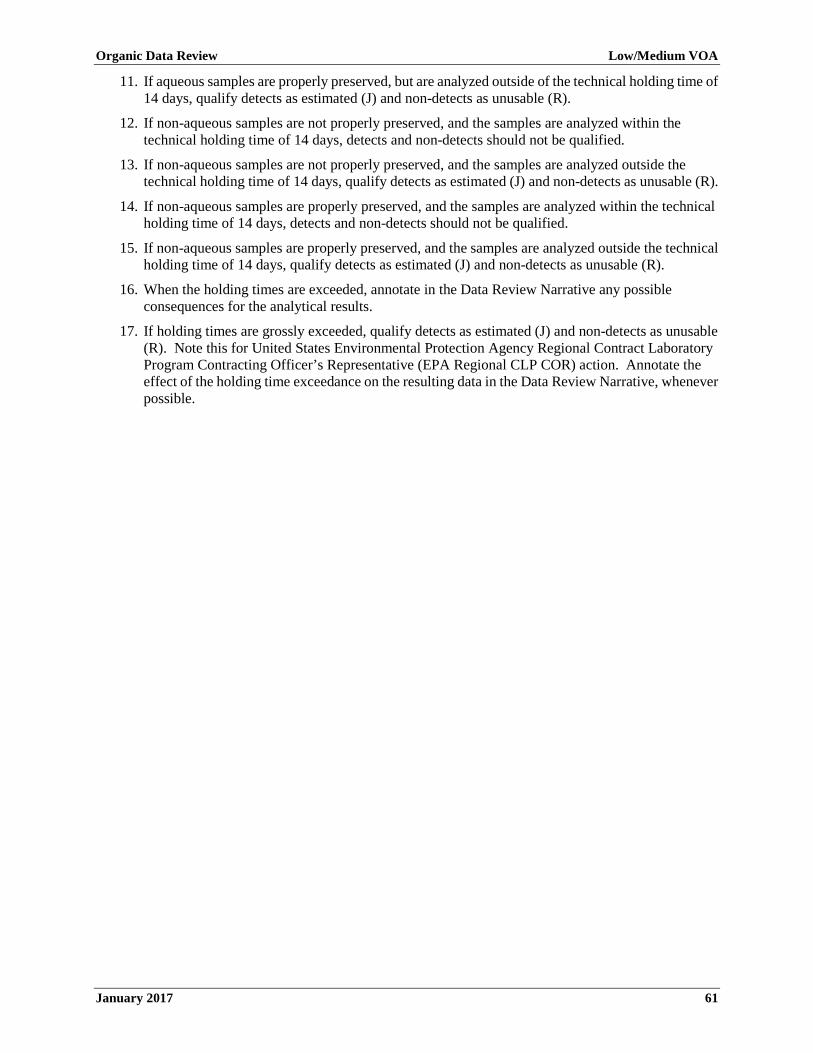
Organic Data Review Low/Medium VOA
January 2017 61
11. If aqueous samples are properly preserved, but are analyzed outside of the technical holding time of 14 days, qualify detects as estimated (J) and non-detects as unusable (R).
12. If non-aqueous samples are not properly preserved, and the samples are analyzed within the technical holding time of 14 days, detects and non-detects should not be qualified.
13. If non-aqueous samples are not properly preserved, and the samples are analyzed outside the technical holding time of 14 days, qualify detects as estimated (J) and non-detects as unusable (R).
14. If non-aqueous samples are properly preserved, and the samples are analyzed within the technical holding time of 14 days, detects and non-detects should not be qualified.
15. If non-aqueous samples are properly preserved, and the samples are analyzed outside the technical holding time of 14 days, qualify detects as estimated (J) and non-detects as unusable (R).
16. When the holding times are exceeded, annotate in the Data Review Narrative any possible consequences for the analytical results.
17. If holding times are grossly exceeded, qualify detects as estimated (J) and non-detects as unusable (R). Note this for United States Environmental Protection Agency Regional Contract Laboratory Program Contracting Officer’s Representative (EPA Regional CLP COR) action. Annotate the effect of the holding time exceedance on the resulting data in the Data Review Narrative, whenever possible.

Organic Data Review Low/Medium VOA
January 2017 62
Table 16. Preservation and Holding Time Actions for Low/Medium Volatile Analysis
Criteria Action
Detect Non-detect
Sample temperature > 6°C but ≤ 10°C upon receipt at the laboratory
Use professional judgment
Use professional judgment
Sample temperature > 10°C upon receipt at the laboratory
Use professional judgment
J*
Use professional judgment
UJ
TCLP/SPLP ZHE procedure performed within the 14-day technical holding time No qualification No qualification
TCLP/SPLP ZHE procedure performed outside the 14-day technical holding time J* R
Aqueous sample not preserved but analyzed within the 7-day technical holding time No qualification No qualification
TCLP/SPLP aqueous filtrate sample and TCLP/SPLP leachate sample analyzed within 7-day technical holding time
No qualification No qualification
Aqueous sample not preserved and analyzed outside the 7-day technical holding time J* R
TCLP/SPLP aqueous filtrate sample and TCLP/SPLP leachate sample analyzed outside 7-day technical holding time
J* R
Aqueous sample properly preserved and analyzed within the 14-day technical holding time No qualification No qualification
Aqueous sample properly preserved but analyzed outside the 14-day technical holding time J* R
Non-aqueous sample preserved and analyzed within the 14-day technical holding time No qualification No qualification
Non-aqueous sample properly preserved but analyzed outside the 14-day technical holding time J* R
Non-aqueous sample not properly preserved but analyzed within the 14-day technical holding time No qualification No qualification
Non-aqueous sample not properly preserved and analyzed outside the 14-day technical holding time J* R
Holding time grossly exceeded J* R
* The true direction of any bias may be unknown in this case. Use caution in determining whether some detected analytes should be qualified as estimated low (J-) or as estimated high (J+), based on knowledge of individual analyte stability or interactions (i.e., dehydrohalogenation).

Organic Data Review Low/Medium VOA
January 2017 63
II. Gas Chromatograph/Mass Spectrometer Instrument Performance Check
A. Review Items
Form 5-OR, bromofluorobenzene (BFB) mass spectra, and mass listing. (SOW SOM02.4 – Exhibit B, Section 3.4 and Exhibit D/Low/Med VOA, Section 9.2)
B. Objective
The objective of performing Gas Chromatograph/Mass Spectrometer (GC/MS) instrument performance checks is to ensure adequate mass resolution, identification, and to some degree, sensitivity, and to document this level of performance prior to analyzing any sequence of standards or samples.
C. Criteria
1. A sufficient amount of the BFB instrument performance check solution (up to 50 ng BFB on-column) must be injected once at the beginning of each 12-hour period, during which samples, blanks, or standards are to be analyzed. The 12-hour period begins with the injection of BFB; however, in cases where a closing Continuing Calibration Verification (CCV) can be used as an opening CCV, the 12-hour clock begins with the injection of the opening CCV.
Listed below are examples of acceptable analytical sequences incorporating the use of the opening and/or closing CCV. Use these examples as a guide for the possible analytical sequences that can be expected.
Conditions for When Example Sequence is
Appropriate:
Acceptable Criteria That Must Be Met: Notes:
Use Example 1 if time remains on the 12-hour clock after the initial calibration sequence.
• BFB tunes meet instrument performance criteria.
• The five Initial Calibration standards meet initial calibration criteria.
• Initial Calibration Verification (ICV) meets ICV criteria.
• CCV A meets both opening and closing CCV criteria.
• CCV B meets closing CCV criteria.
The requirement of starting the new 12-hour clock for Analytical Sequence 2 with a new BFB tune is waived if CCV A meets opening CCV criteria. If CCV B meets opening CCV criteria, a method blank and subsequent samples may be analyzed immediately after CCV B.
Use Example 2 if time remains on the 12-hour clock after the initial calibration sequence.
• BFB tunes meet instrument performance criteria.
• The five Initial Calibration standards meet initial calibration criteria.
• ICV meets ICV criteria. • CCV A meets closing CCV
criteria (but does not meet opening CCV criteria).
• CCV B meets opening CCV criteria.
• CCV C meets closing CCV criteria.
CCV A does not meet opening CCV criteria. Therefore, a new BFB tune must be performed, immediately followed by CCV B, before the method blank and any samples may be analyzed. In this case, the new 12-hour clock and Analytical Sequence 2 begins with the injection of the new BFB tune.

Organic Data Review Low/Medium VOA
January 2017 64
Conditions for When Example Sequence is
Appropriate:
Acceptable Criteria That Must Be Met: Notes:
Use Example 3 if more than 12 hours have elapsed since the most recent initial calibration or closing CCV, OR if the most recent closing CCV was not or could not be used as an opening CCV.
• BFB tunes meet instrument performance criteria.
• CCV A meets opening CCV criteria.
• CCV B meets both opening and closing CCV criteria.
• CCV C meets both opening and closing CCV criteria.
The requirement of starting the new 12-hour clock for Analytical Sequence 2 with a new BFB tune is waived if CCV B meets opening CCV criteria. If CCV C meets opening CCV criteria, a method blank and subsequent samples may be analyzed immediately after CCV B.
Use Example 4 if more than 12 hours have elapsed since the most recent initial calibration or closing CCV, OR if the most recent closing CCV was not or could not be used as an opening CCV.
• BFB tunes meet instrument performance criteria.
• CCV A meets opening CCV criteria.
• CCV B meets closing CCV criteria (but does not meet opening CCV criteria).
• CCV C meets opening CCV criteria.
• CCV D meets both opening and closing CCV criteria.
CCV B does not meet opening CCV criteria. Therefore, a new BFB tune must be performed, immediately followed by CCV C, before the method blank and any samples may be analyzed. In this case, the new 12-hour clock and Analytical Sequence 2 begins with the injection of the new BFB tune. The requirement of starting the new 12-hour clock for Analytical Sequence 3 with a new BFB tune is waived if CCV D meets opening CCV criteria. If CCV D meets opening CCV criteria, a method blank and subsequent samples may be analyzed immediately after CCV D.
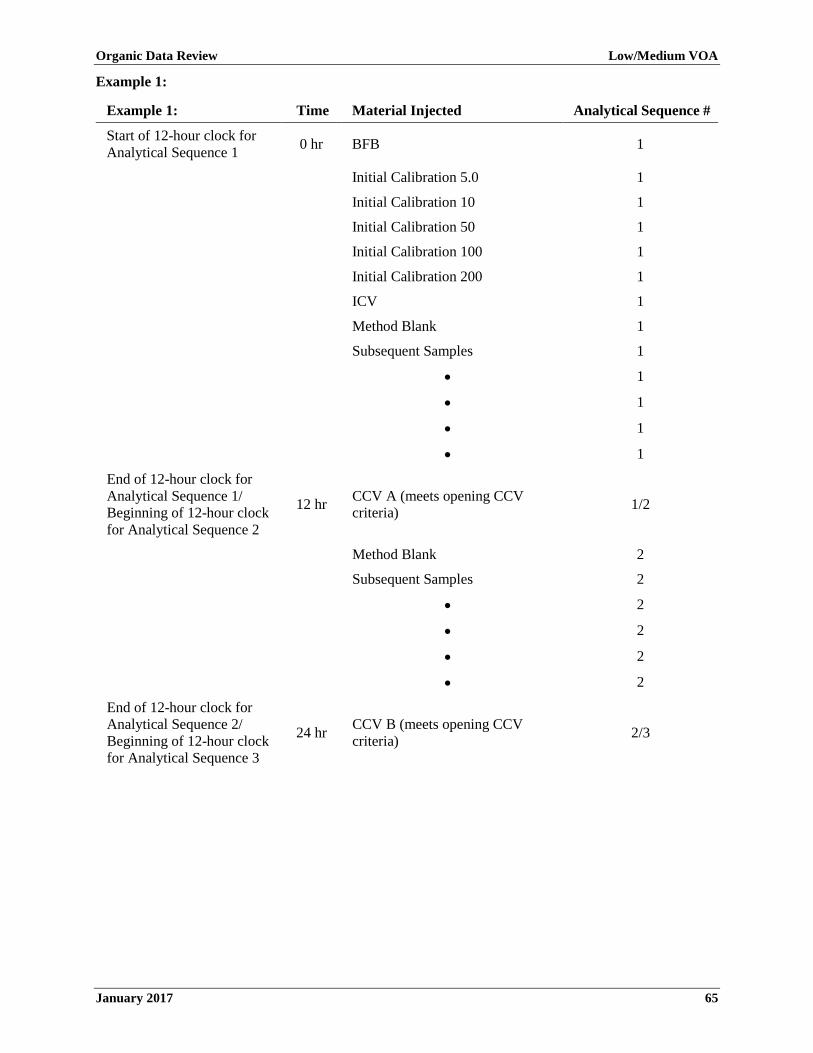
Organic Data Review Low/Medium VOA
January 2017 65
Example 1:
Example 1: Time Material Injected Analytical Sequence #
Start of 12-hour clock for Analytical Sequence 1 0 hr BFB 1
Initial Calibration 5.0 1
Initial Calibration 10 1
Initial Calibration 50 1
Initial Calibration 100 1
Initial Calibration 200 1
ICV 1
Method Blank 1
Subsequent Samples 1
• 1
• 1
• 1
• 1
End of 12-hour clock for Analytical Sequence 1/ Beginning of 12-hour clock for Analytical Sequence 2
12 hr CCV A (meets opening CCV criteria) 1/2
Method Blank 2
Subsequent Samples 2
• 2
• 2
• 2
• 2
End of 12-hour clock for Analytical Sequence 2/ Beginning of 12-hour clock for Analytical Sequence 3
24 hr CCV B (meets opening CCV criteria) 2/3

Organic Data Review Low/Medium VOA
January 2017 66
Example 2:
Example 2: Time Material Injected Analytical Sequence #
Start of 12-hour clock for Analytical Sequence 1 0 hr BFB 1
Initial Calibration 5.0 1
Initial Calibration 10 1
Initial Calibration 50 1
Initial Calibration 100 1
Initial Calibration 200 1
ICV 1
Method Blank 1
Subsequent Samples 1
• 1
• 1
• 1
• 1
End of 12-hour clock for Analytical Sequence 1 12 hr
CCV A (meets closing CCV criteria, fails opening CCV criteria)
1
Beginning of 12-hour clock for Analytical Sequence 2 13 hr BFB 2
CCV B (meets opening CCV criteria) 2
Method Blank 2
Subsequent Samples 2
• 2
• 2
• 2
• 2
End of 12-hour clock for Analytical Sequence 2 25 hr CCV C (meets closing CCV
criteria) 2
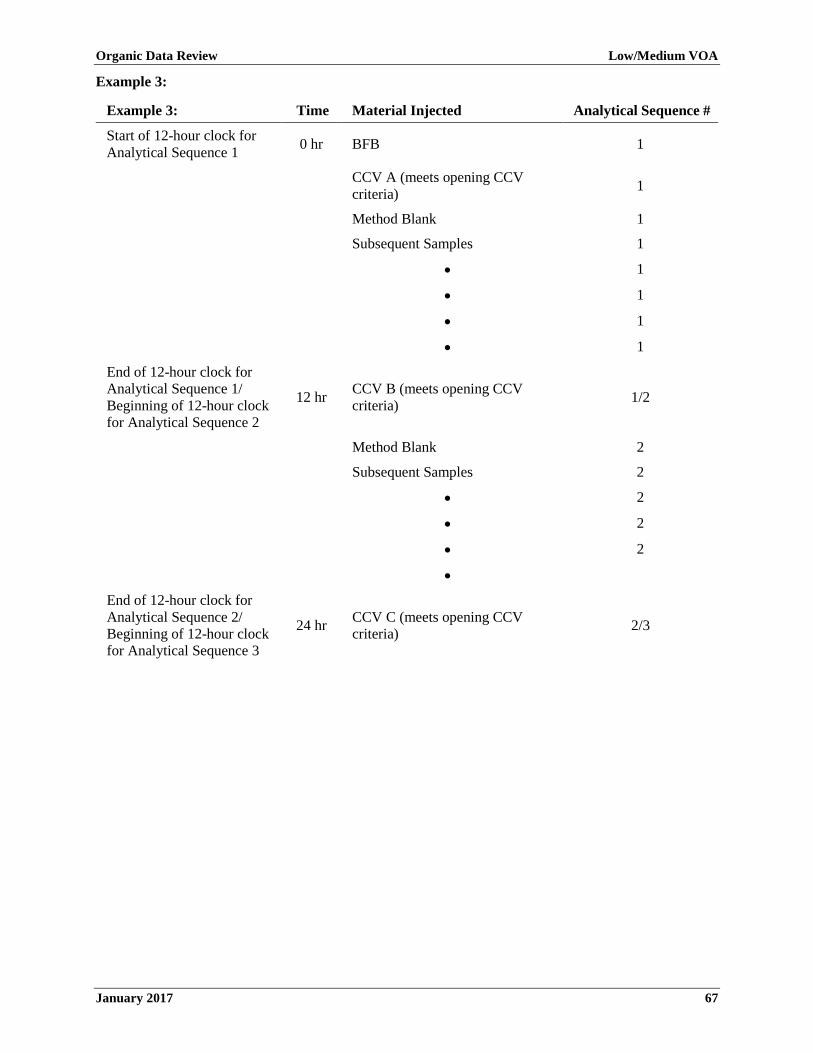
Organic Data Review Low/Medium VOA
January 2017 67
Example 3:
Example 3: Time Material Injected Analytical Sequence #
Start of 12-hour clock for Analytical Sequence 1 0 hr BFB 1
CCV A (meets opening CCV criteria) 1
Method Blank 1
Subsequent Samples 1
• 1
• 1
• 1
• 1
End of 12-hour clock for Analytical Sequence 1/ Beginning of 12-hour clock for Analytical Sequence 2
12 hr CCV B (meets opening CCV criteria) 1/2
Method Blank 2
Subsequent Samples 2
• 2
• 2
• 2
•
End of 12-hour clock for Analytical Sequence 2/ Beginning of 12-hour clock for Analytical Sequence 3
24 hr CCV C (meets opening CCV criteria) 2/3

Organic Data Review Low/Medium VOA
January 2017 68
Example 4:
Example 4: Time Material Injected Analytical Sequence #
Start of 12-hour clock for Analytical Sequence 1 0 hr BFB 1
CCV A (meets opening CCV criteria) 1
Method Blank 1
Subsequent Samples 1
• 1
• 1
• 1
• 1
End of 12-hour clock for Analytical Sequence 1 12 hr
CCV B (meets closing CCV criteria, fails opening CCV criteria)
1
Beginning of 12-hour clock for Analytical Sequence 2 13 hr BFB 2
CCV C (meets opening CCV criteria) 2
Method Blank 2
Subsequent Samples 2
• 2
• 2
• 2
•
End of 12-hour clock for Analytical Sequence 2/ Beginning of 12-hour clock for Analytical Sequence 3
25 hr CCV D (meets opening CCV criteria) 2/3

Organic Data Review Low/Medium VOA
January 2017 69
2. The BFB instrument performance check must meet the ion abundance criteria listed in Table 17.
Table 17. Ion Abundance Criteria for BFB
Mass Ion Abundance Criteria
50 15.0 - 40.0% of mass 95
75 30.0 - 80.0% of mass 95
95 Base peak, 100% relative abundance
96 5.0 - 9.0% of mass 95*
173 Less than 2.0% of mass 174
174 50.0% - 120% of mass 95
175 5.0 - 9.0% of mass 174
176 95.0 - 101% of mass 174
177 5.0 - 9.0% of mass 176
* All ion abundances must be normalized to m/z 95, the nominal base peak, even though the ion abundance of m/z 174 may be up to 120% that of m/z 95.
D. Evaluation
1. Verify that the BFB Instrument Performance Check is analyzed at the specified frequency and sequence.
2. Compare the data presented on Form 5-OR for each Instrument Performance Check with each mass listing submitted to ensure the following:
a. Form 5-OR is present and completed for each required BFB at the specified frequency.
b. The laboratory has not made transcription errors between the data and the form. If there are major differences between the mass listing and Form 5-OR, a more in-depth review of the data is required. This may include obtaining and reviewing additional information from the laboratory.
c. The appropriate number of significant figures has been reported (number of significant figures given for each ion in the Ion Abundance Criteria column) and that rounding is correct.
d. The laboratory has not made any calculation errors.
3. Verify from the raw data (mass listing) that the mass assignment is correct and that the mass listing is normalized to the specified m/z of 95, 174, and 176, respectively.
4. Verify that the ion abundance criteria are met. The ion abundance for m/z 173, 175, 176, and 177 are calculated by normalizing to the specified m/z. The critical ion abundance criteria for BFB are the relative abundance ratios of m/z 95/96, 174/175, 174/176, and 176/177. The relative abundance ratios of m/z 50 and 75 are of lower importance for target analytes than for Tentatively Identified Compounds (TICs).
5. If possible, verify that spectra are generated using appropriate background subtraction techniques. Since the BFB spectrum is obtained from chromatographic peaks that should be free from co-elution problems, background subtraction should be performed in accordance with the following procedure:
a. Three scans (the peak apex scan and the scans immediately preceding and following the apex) are acquired and averaged.

Organic Data Review Low/Medium VOA
January 2017 70
b. Background subtraction must be accomplished using a single scan acquired within 20 scans ofthe elution of BFB, but the BFB peak must not be subtracted as part of the background.
NOTE: All mass spectrometer instrument conditions must be identical to those used for sample analysis. Background subtraction actions resulting in spectral distortions for the sole purpose of meeting the method specifications are contrary to the Quality Assurance (QA) objectives, and are therefore unacceptable.
NOTE: For data obtained from the CLP, information regarding noncompliant BFB instrument performance check can be obtained from the National Functional Guidelines (NFG) reports and may be used as part of the evaluation process.
E. Action
1. If the instrument performance check is not analyzed at the specified frequency and sequence,qualify detects and non-detects in the associated samples as unusable (R). The EPA Regional CLPCOR should be contacted to arrange for reanalysis of all affected samples.
a. In the event the samples cannot be reanalyzed, examine all calibrations associated with thesequence to evaluate whether proper qualitative criteria were achievable. If so, it may bepossible to salvage usable data from the sequence. Otherwise, qualify the data as unusable (R).
2. If minor transcription errors are found to be insignificant to data quality and can be corrected on acopy of the form, no further action is required.
3. If the laboratory failed to provide the correct forms, or if significant transcription or calculationerrors are found, notify the EPA Regional CLP COR, who may contact the laboratory to request thenecessary information. If the information is not available, use professional judgment to assess thedata, and notify the EPA Regional CLP COR.
4. If the mass assignment is in error (e.g., m/z 96 is indicated as the base peak rather than m/z 95),qualify detects and non-detects in the associated samples as unusable (R).
5. If the ion abundance criteria in Table 17 are not met, use professional judgment to qualify detectsand non-detects in the associated samples.
6. Annotate decisions to use analytical data associated with noncompliant BFB instrumentperformance checks in the Data Review Narrative.
7. If the instrument performance check criteria are achieved using techniques other than thosedescribed in Section II.D.5, obtain additional information to evaluate the performance andprocedures. Note any concerns (e.g., use of inappropriate technique for background subtraction) orquestions for EPA Regional CLP COR action.
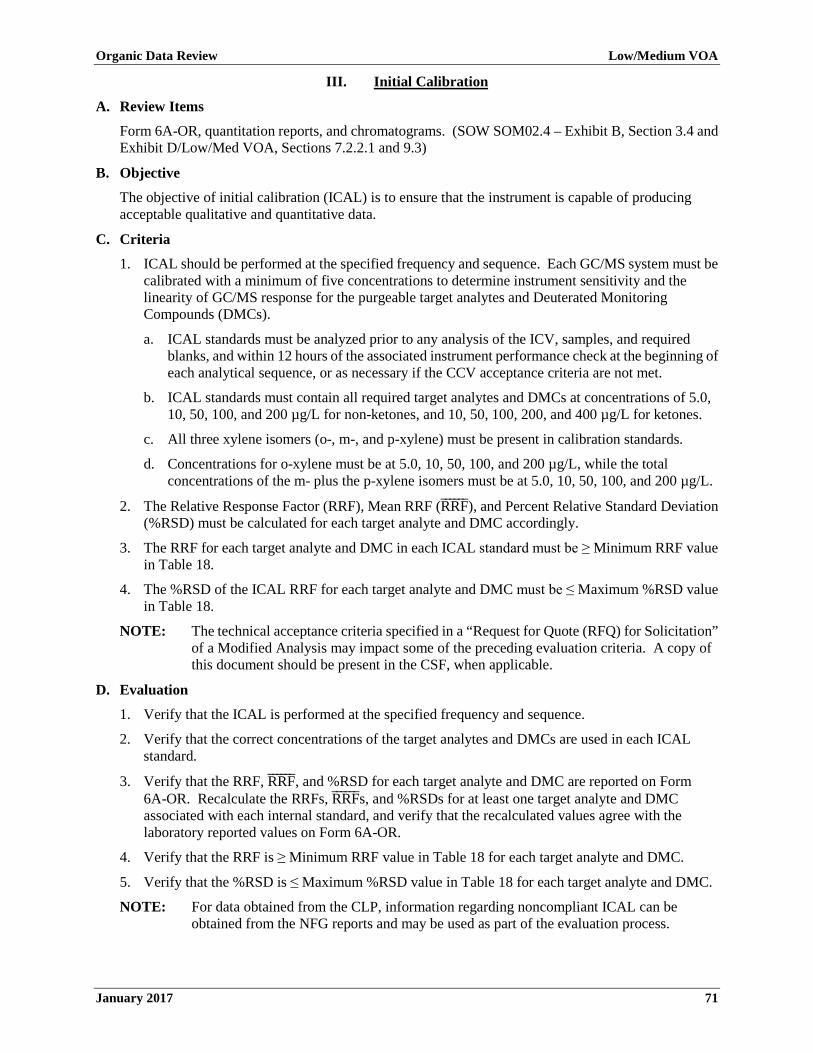
Organic Data Review Low/Medium VOA
January 2017 71
III. Initial Calibration
A. Review Items
Form 6A-OR, quantitation reports, and chromatograms. (SOW SOM02.4 – Exhibit B, Section 3.4 and Exhibit D/Low/Med VOA, Sections 7.2.2.1 and 9.3)
B. Objective
The objective of initial calibration (ICAL) is to ensure that the instrument is capable of producing acceptable qualitative and quantitative data.
C. Criteria
1. ICAL should be performed at the specified frequency and sequence. Each GC/MS system must be calibrated with a minimum of five concentrations to determine instrument sensitivity and the linearity of GC/MS response for the purgeable target analytes and Deuterated Monitoring Compounds (DMCs).
a. ICAL standards must be analyzed prior to any analysis of the ICV, samples, and required blanks, and within 12 hours of the associated instrument performance check at the beginning of each analytical sequence, or as necessary if the CCV acceptance criteria are not met.
b. ICAL standards must contain all required target analytes and DMCs at concentrations of 5.0, 10, 50, 100, and 200 µg/L for non-ketones, and 10, 50, 100, 200, and 400 µg/L for ketones.
c. All three xylene isomers (o-, m-, and p-xylene) must be present in calibration standards.
d. Concentrations for o-xylene must be at 5.0, 10, 50, 100, and 200 µg/L, while the total concentrations of the m- plus the p-xylene isomers must be at 5.0, 10, 50, 100, and 200 µg/L.
2. The Relative Response Factor (RRF), Mean RRF (RRF������), and Percent Relative Standard Deviation (%RSD) must be calculated for each target analyte and DMC accordingly.
3. The RRF for each target analyte and DMC in each ICAL standard must be ≥ Minimum RRF value in Table 18.
4. The %RSD of the ICAL RRF for each target analyte and DMC must be ≤ Maximum %RSD value in Table 18.
NOTE: The technical acceptance criteria specified in a “Request for Quote (RFQ) for Solicitation” of a Modified Analysis may impact some of the preceding evaluation criteria. A copy of this document should be present in the CSF, when applicable.
D. Evaluation
1. Verify that the ICAL is performed at the specified frequency and sequence.
2. Verify that the correct concentrations of the target analytes and DMCs are used in each ICAL standard.
3. Verify that the RRF, RRF������, and %RSD for each target analyte and DMC are reported on Form 6A-OR. Recalculate the RRFs, RRF������s, and %RSDs for at least one target analyte and DMC associated with each internal standard, and verify that the recalculated values agree with the laboratory reported values on Form 6A-OR.
4. Verify that the RRF is ≥ Minimum RRF value in Table 18 for each target analyte and DMC.
5. Verify that the %RSD is ≤ Maximum %RSD value in Table 18 for each target analyte and DMC.
NOTE: For data obtained from the CLP, information regarding noncompliant ICAL can be obtained from the NFG reports and may be used as part of the evaluation process.

Organic Data Review Low/Medium VOA
January 2017 72
E. Action
1. If the ICAL is not performed at the specified frequency and sequence, use professional judgment to qualify detects and non-detects in the associated samples as unusable (R).
2. If the ICAL is not performed at the specified concentrations, qualify detects in the associated samples as estimated (J) and non-detects in the associated samples as estimated (UJ).
3. If errors are detected in the calculations of the RRFs, RRF������s, or %RSDs, perform a more comprehensive recalculation.
4. If the RRF is < Minimum RRF value in Table 18 for any target analyte, use professional judgment to qualify detects in the associated samples as estimated high (J+) or unusable (R), and non-detects in the associated samples as unusable (R).
5. If the RRF is ≥ Minimum RRF value in Table 18 for any target analyte, detects and non-detects in the associated samples should not be qualified.
6. If the %RSD is > Maximum %RSD value in Table 18 for any target analyte, qualify detects in the associated samples as estimated (J). Use professional judgment to qualify non-detects in the associated samples.
7. If the %RSD is ≤ Maximum %RSD value in Table 18 for any target analyte, detects and non-detects in the associated samples should not be qualified.
8. No qualification of the data is necessary based on the DMC RRF, RRF������, and %RSD data alone. Use professional judgment to evaluate the DMC RRF, RRF������, and %RSD data in conjunction with the DMC recoveries to determine the need for data qualification.
9. Based on the project-specific Data Quality Objectives (DQOs), a more in-depth review may be necessary. The following guidelines are recommended:
a. If the %RSD criteria of any target analytes are not met and the %RSD criteria are still not satisfied after eliminating either the high or the low-point of the ICAL:
i. Qualify detects in the associated samples as estimated (J).
ii. Use professional judgment to qualify non-detects in the associated samples.
b. If the high-point of the ICAL curve is outside of the %RSD criteria (e.g., due to saturation):
i. Qualify detects in the associated samples with analyte concentrations greater than the high-point concentration as estimated (J).
ii. Detects in the associated samples with analyte concentrations within the calibration range should not be qualified.
iii. Non-detects in the associated samples should not be qualified.
c. If the low-point of the ICAL curve is outside of the %RSD criteria:
i. Qualify detects in the associated samples with analyte concentrations in the non-linear range as estimated (J).
ii. Detects in the associated samples with analyte concentrations within the calibration range should not be qualified.
iii. For non-detects in the associated samples, use the lowest point of the linear portion of the ICAL curve to determine the new quantitation limit.
10. If the laboratory failed to provide adequate calibration information, notify the EPA Regional CLP COR, who may contact the laboratory to request the necessary information. If the information is not available, use professional judgment to assess the data.

Organic Data Review Low/Medium VOA
January 2017 73
11. Annotate the potential effects on the reported data due to exceeding the ICAL criteria in the DataReview Narrative.
12. If the ICAL criteria are grossly exceeded, note this for EPA Regional CLP COR action.
Table 18. RRF, %RSD, and %D Acceptance Criteria in Initial Calibration, ICV, and CCV for Low/Medium Volatile Analysis
Analyte Minimum RRF
Maximum %RSD
ICV/Opening CCV
Maximum %D1
Closing CCV
Maximum %D
Dichlorodifluoromethane 0.010 25.0 ±40.0 ±50.0
Chloromethane 0.010 20.0 ±30.0 ±50.0
Vinyl chloride 0.010 20.0 ±25.0 ±50.0
Bromomethane 0.010 40.0 ±30.0 ±50.0
Chloroethane 0.010 40.0 ±25.0 ±50.0
Trichlorofluoromethane 0.010 40.0 ±30.0 ±50.0
1,1-Dichloroethene 0.060 20.0 ±20.0 ±25.0
1,1,2-Trichloro-1,2,2-trifluoroethane 0.050 25.0 ±25.0 ±50.0
Acetone 0.010 40.0 ±40.0 ±50.0
Carbon disulfide 0.100 20.0 ±25.0 ±25.0
Methyl acetate 0.010 40.0 ±40.0 ±50.0
Methylene chloride 0.010 40.0 ±30.0 ±50.0
trans-1,2-Dichloroethene 0.100 20.0 ±20.0 ±25.0
Methyl tert-butyl ether 0.100 40.0 ±25.0 ±50.0
1,1-Dichloroethane 0.300 20.0 ±20.0 ±25.0
cis-1,2-Dichloroethene 0.200 20.0 ±20.0 ±25.0
2-Butanone 0.010 40.0 ±40.0 ±50.0
Bromochloromethane 0.100 20.0 ±20.0 ±25.0
Chloroform 0.300 20.0 ±20.0 ±25.0
1,1,1-Trichloroethane 0.050 20.0 ±25.0 ±25.0
Cyclohexane 0.010 40.0 ±25.0 ±50.0
Carbon tetrachloride 0.100 20.0 ±25.0 ±25.0
Benzene 0.200 20.0 ±20.0 ±25.0
1,2-Dichloroethane 0.070 20.0 ±20.0 ±25.0
Trichloroethene 0.200 20.0 ±20.0 ±25.0
Methylcyclohexane 0.050 40.0 ±25.0 ±50.0
1,2-Dichloropropane 0.200 20.0 ±20.0 ±25.0
Bromodichloromethane 0.300 20.0 ±20.0 ±25.0
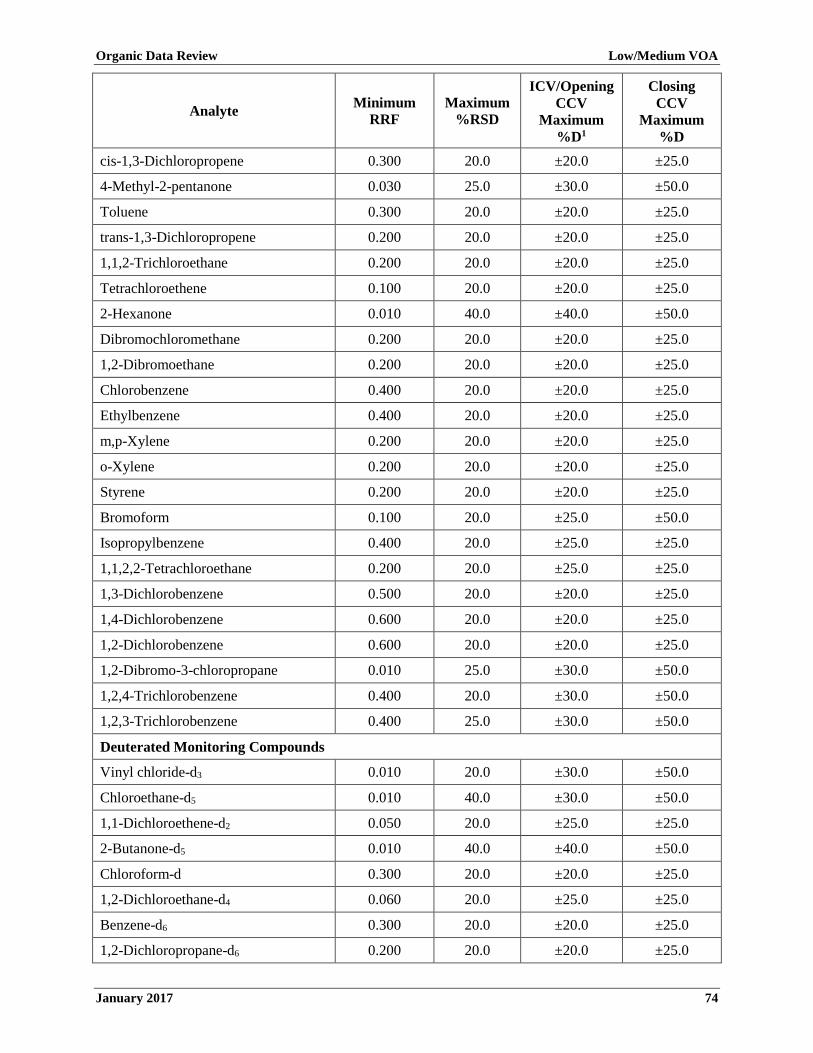
Organic Data Review Low/Medium VOA
January 2017 74
Analyte Minimum RRF
Maximum %RSD
ICV/Opening CCV
Maximum %D1
Closing CCV
Maximum %D
cis-1,3-Dichloropropene 0.300 20.0 ±20.0 ±25.0
4-Methyl-2-pentanone 0.030 25.0 ±30.0 ±50.0
Toluene 0.300 20.0 ±20.0 ±25.0
trans-1,3-Dichloropropene 0.200 20.0 ±20.0 ±25.0
1,1,2-Trichloroethane 0.200 20.0 ±20.0 ±25.0
Tetrachloroethene 0.100 20.0 ±20.0 ±25.0
2-Hexanone 0.010 40.0 ±40.0 ±50.0
Dibromochloromethane 0.200 20.0 ±20.0 ±25.0
1,2-Dibromoethane 0.200 20.0 ±20.0 ±25.0
Chlorobenzene 0.400 20.0 ±20.0 ±25.0
Ethylbenzene 0.400 20.0 ±20.0 ±25.0
m,p-Xylene 0.200 20.0 ±20.0 ±25.0
o-Xylene 0.200 20.0 ±20.0 ±25.0
Styrene 0.200 20.0 ±20.0 ±25.0
Bromoform 0.100 20.0 ±25.0 ±50.0
Isopropylbenzene 0.400 20.0 ±25.0 ±25.0
1,1,2,2-Tetrachloroethane 0.200 20.0 ±25.0 ±25.0
1,3-Dichlorobenzene 0.500 20.0 ±20.0 ±25.0
1,4-Dichlorobenzene 0.600 20.0 ±20.0 ±25.0
1,2-Dichlorobenzene 0.600 20.0 ±20.0 ±25.0
1,2-Dibromo-3-chloropropane 0.010 25.0 ±30.0 ±50.0
1,2,4-Trichlorobenzene 0.400 20.0 ±30.0 ±50.0
1,2,3-Trichlorobenzene 0.400 25.0 ±30.0 ±50.0
Deuterated Monitoring Compounds
Vinyl chloride-d3 0.010 20.0 ±30.0 ±50.0
Chloroethane-d5 0.010 40.0 ±30.0 ±50.0
1,1-Dichloroethene-d2 0.050 20.0 ±25.0 ±25.0
2-Butanone-d5 0.010 40.0 ±40.0 ±50.0
Chloroform-d 0.300 20.0 ±20.0 ±25.0
1,2-Dichloroethane-d4 0.060 20.0 ±25.0 ±25.0
Benzene-d6 0.300 20.0 ±20.0 ±25.0
1,2-Dichloropropane-d6 0.200 20.0 ±20.0 ±25.0

Organic Data Review Low/Medium VOA
January 2017 75
Analyte Minimum RRF
Maximum %RSD
ICV/Opening CCV
Maximum %D1
Closing CCV
Maximum %D
Toluene-d8 0.300 20.0 ±20.0 ±25.0
trans-1,3-Dichloropropene-d4 0.200 20.0 ±20.0 ±25.0
2-Hexanone-d5 0.010 40.0 ±40.0 ±50.0
1,1,2,2-Tetrachloroethane-d2 0.200 20.0 ±25.0 ±25.0
1,2-Dichlorobenzene-d4 0.400 20.0 ±20.0 ±25.0 1 If a closing CCV is acting as an opening CCV, all target analytes and DMCs must meet the requirements
for an opening CCV.
Table 19. Initial Calibration Actions for Low/Medium Volatile Analysis
Criteria Action
Detect Non-detect
Initial Calibration not performed at the specified frequency and sequence
Use professional judgment
R
Use professional judgment
R
Initial Calibration not performed at the specified concentrations J UJ
RRF < Minimum RRF in Table 18 for target analyte
Use professional judgment J+ or R
R
RRF ≥ Minimum RRF in Table 18 for target analyte No qualification No qualification
%RSD > Maximum %RSD in Table 18 for target analyte J Use professional
judgment
%RSD ≤ Maximum %RSD in Table 18 for target analyte No qualification No qualification

Organic Data Review Low/Medium VOA
January 2017 76
IV. Initial Calibration Verification
A. Review Items
Form 7A-OR, quantitation reports, and chromatograms. (SOW SOM02.4 – Exhibit B, Section 3.4 and Exhibit D/Low/Med VOA, Sections 7.2.2.2 and 9.4)
B. Objective
The objective is to ensure that the instrument is calibrated accurately to produce acceptable qualitative and quantitative data throughout each analytical sequence by the use of a second-source check standard.
C. Criteria
1. The accuracy of the calibration for each GC/MS system used for analysis must be verified at thefrequency of one ICV standard analysis per initial calibration analytical sequence. The ICV isanalyzed after the last ICAL standard analysis and prior to a blank, sample, or an applicable CCVanalysis.
2. The ICV standard must contain all required target analytes, from an alternate source or a differentlot than that used for the ICAL standards and DMCs, at or near the mid-point concentration (CS3)of the ICAL.
3. For an ICV, the RRF for each target analyte and DMC must be ≥ the Minimum RRF values in Table18.
4. The Percent Difference (%D) between the ICAL RRF������ and the ICV RRF must be within theICV/Opening CCV Maximum %D limits in Table 18 for each target analyte and DMC.
D. Evaluation
1. Verify that the ICV standard is analyzed at the specified frequency and sequence, and that it isassociated with the correct ICAL. Also verify that the correct ICAL is represented in the datapackage and meets SOW criteria, as described in Section III.
2. Verify that the concentrations of the target analytes and the DMCs in the ICV are at or near themid-point standard CS3 from the ICAL.
3. Verify that the RRF and %D for each target analyte and DMC are reported on Form 7A-OR.Recalculate the RRF and %D for at least one target analyte and DMC associated with each internalstandard, and verify that the recalculated values agree with the laboratory reported values on Form7A-OR.
4. Verify that the RRFs for each target analyte and DMC in the ICV are ≥ Minimum RRF values inTable 18.
5. Verify that the %Ds are within the ICV/Opening CCV Maximum %D limits in Table 18 for eachtarget analyte and DMC.
NOTE: For data obtained from the CLP, information regarding the noncompliant ICV can be obtained from the NFG reports and may be used as part of the evaluation process.
E. Action
1. If the ICV is not performed at the specified frequency, use professional judgment to qualify detectsand non-detects. Contact the EPA Regional CLP COR to request that the laboratory repeat theanalysis, if holding times have not expired and there are remaining sample vials. If reanalysis is notpossible, carefully evaluate all other available information, including the quality of analyte peakshapes and mass spectral matches, the stability of internal standard Retention Times (RTs) andareas in each affected sample, and compare to the most recent calibration performed on the sameinstrument under the same conditions. Using this information and professional judgment, thereviewer may be able to justify unqualified acceptance of qualitative results.
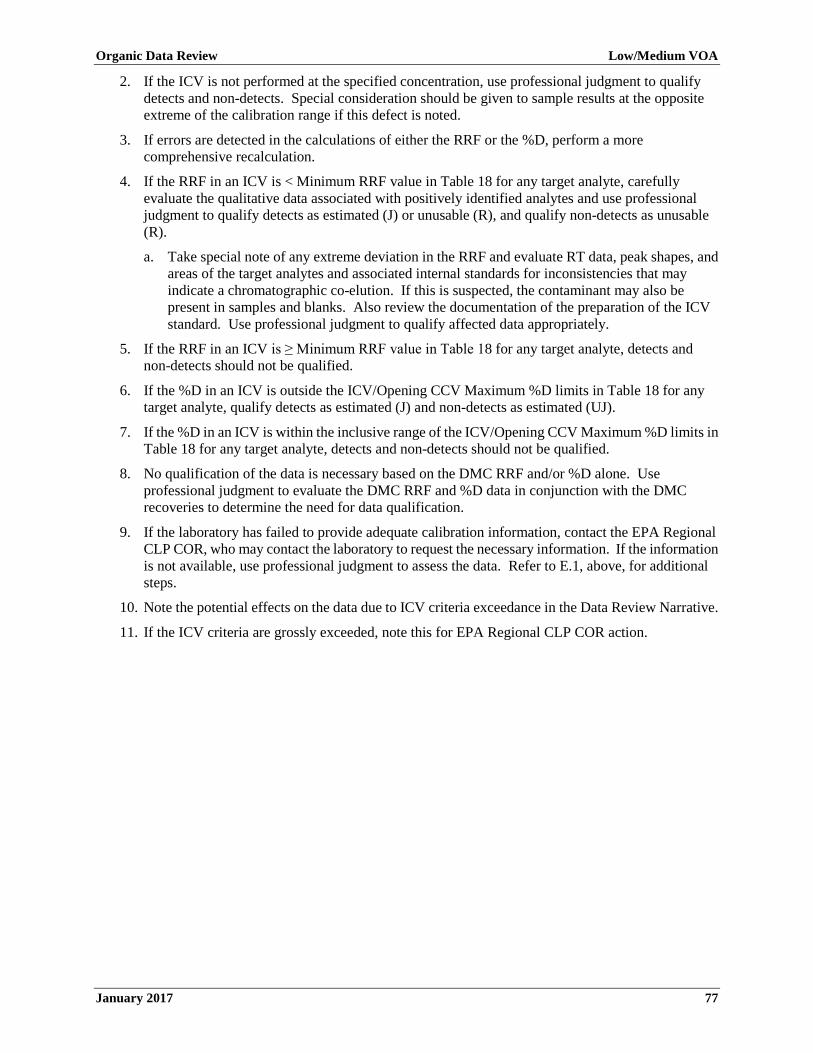
Organic Data Review Low/Medium VOA
January 2017 77
2. If the ICV is not performed at the specified concentration, use professional judgment to qualify detects and non-detects. Special consideration should be given to sample results at the opposite extreme of the calibration range if this defect is noted.
3. If errors are detected in the calculations of either the RRF or the %D, perform a more comprehensive recalculation.
4. If the RRF in an ICV is < Minimum RRF value in Table 18 for any target analyte, carefully evaluate the qualitative data associated with positively identified analytes and use professional judgment to qualify detects as estimated (J) or unusable (R), and qualify non-detects as unusable (R).
a. Take special note of any extreme deviation in the RRF and evaluate RT data, peak shapes, and areas of the target analytes and associated internal standards for inconsistencies that may indicate a chromatographic co-elution. If this is suspected, the contaminant may also be present in samples and blanks. Also review the documentation of the preparation of the ICV standard. Use professional judgment to qualify affected data appropriately.
5. If the RRF in an ICV is ≥ Minimum RRF value in Table 18 for any target analyte, detects and non-detects should not be qualified.
6. If the %D in an ICV is outside the ICV/Opening CCV Maximum %D limits in Table 18 for any target analyte, qualify detects as estimated (J) and non-detects as estimated (UJ).
7. If the %D in an ICV is within the inclusive range of the ICV/Opening CCV Maximum %D limits in Table 18 for any target analyte, detects and non-detects should not be qualified.
8. No qualification of the data is necessary based on the DMC RRF and/or %D alone. Use professional judgment to evaluate the DMC RRF and %D data in conjunction with the DMC recoveries to determine the need for data qualification.
9. If the laboratory has failed to provide adequate calibration information, contact the EPA Regional CLP COR, who may contact the laboratory to request the necessary information. If the information is not available, use professional judgment to assess the data. Refer to E.1, above, for additional steps.
10. Note the potential effects on the data due to ICV criteria exceedance in the Data Review Narrative.
11. If the ICV criteria are grossly exceeded, note this for EPA Regional CLP COR action.

Organic Data Review Low/Medium VOA
January 2017 78
Table 20. ICV Actions for Low/Medium Volatile Analysis
Criteria for ICV Action
Detect Non-detect
ICV not performed at the specified frequency and sequence
Use professional judgment
Use professional judgment
ICV not performed at the specified concentration
Use professional judgment
Use professional judgment
RRF < Minimum RRF in Table 18 for target analyte
Use professional judgment
J or R R
RRF ≥ Minimum RRF in Table 18 for target analyte No qualification No qualification
%D outside the ICV/Opening CCV Maximum %D limits in Table 18 for target analyte
J UJ
%D within the inclusive ICV/Opening CV Maximum %D limits in Table 18 for target analyte
No qualification No qualification
Organic Data Review Low/Medium VOA
January 2017 79
V. Continuing Calibration Verification
A. Review Items
Form 7A-OR, quantitation reports, and chromatograms. (SOW SOM02.4 – Exhibit B, Section 3.4 and Exhibit D/Low/Med VOA, Sections 7.2.2.1 and 9.5)
B. Objective
The objective is to ensure that the instrument continues to meet the sensitivity and linearity criteria to produce acceptable qualitative and quantitative data throughout each analytical sequence.
C. Criteria
1. The calibration for each GC/MS system used for analysis must be verified at the beginning and end of every 12-hour period of operation. The 12-hour period begins with the injection of BFB, followed by the injection of the opening CCV solution. After the injection of all samples and required blanks, and before the end of the 12-hour period, injection of the closing CCV is required. The closing CCV used to bracket the end of a 12-hour analytical sequence may be used as the opening CCV for a new 12-hour analytical sequence, provided that all technical acceptance criteria of an opening CCV are met.
2. The CCV standards must contain all required target analytes and DMCs at or near the mid-point concentration (CS3) of the ICAL.
3. For an opening or a closing CCV, the RRF for each target analyte and DMC must be ≥ the Minimum RRF values in Table 18.
4. The %D between the ICAL RRF������ and the opening CCV RRF must be within the ICV/Opening CCV Maximum %D limits in Table 18 for each target analyte and DMC.
5. For a closing CCV, the %D between the ICAL RRF������ and the CCV RRF must be within the Closing CCV Maximum %D limits in Table 18 for each target analyte and DMC.
D. Evaluation
1. Verify that the CCV is analyzed at the specified frequency and sequence, and that it is associated with the correct ICAL. Also verify that the correct ICAL is represented in the data package and meets SOW criteria, as described in Section III.
2. Verify that the mid-point standard CS3 from the ICAL is used as an opening or a closing CCV.
3. Verify that the RRF and %D for each target analyte and DMC are reported on Form 7A-OR. Recalculate the RRF and %D for at least one target analyte and DMC associated with each internal standard, and verify that the recalculated values agree with the laboratory reported values on Form 7A-OR.
4. For an opening or a closing CCV, verify that the RRFs for each target analyte and DMC are ≥ Minimum RRF values in Table 18.
5. For an opening CCV, verify that the %Ds are within the ICV/Opening CCV Maximum %D limits in Table 18 for each target analyte and DMC.
6. For a closing CCV, verify that the %Ds are within the Closing CCV Maximum %D limits in Table 18 for each target analyte and DMC.
NOTE: For data obtained from the CLP, information regarding the noncompliant CCV can be obtained from the NFG reports and may be used as part of the evaluation process.
Organic Data Review Low/Medium VOA
January 2017 80
E. Action
1. If the CCV is not performed at the specified frequency, qualify detects and non-detects as unusable (R). Contact the EPA Regional CLP COR to request that the laboratory repeat the analysis, if holding times have not expired and there are remaining sample vials. If reanalysis is not possible, carefully evaluate all other available information, including the quality of analyte peak shapes and mass spectral matches, the stability of internal standard RTs and areas in each affected sample, and compare to the most recent calibration performed on the same instrument under the same conditions. Using this information and professional judgment, the reviewer may be able to justify unqualified acceptance of qualitative results and qualification of all quantitative results as estimated (J). Otherwise, qualify all detects and non-detects as unusable (R).
2. If the CCV is not performed at the specified concentration, use professional judgment to qualify detects and non-detects. Special consideration should be given to sample results at the opposite extreme of the calibration range if this defect is noted.
3. If errors are detected in the calculations of either the RRF or the %D, perform a more comprehensive recalculation.
4. For an opening or a closing CCV, if the RRF is < Minimum RRF value in Table 18 for any target analyte, carefully evaluate the qualitative data associated with positively identified analytes and use professional judgment to qualify detects as estimated (J) or unusable (R), and qualify non-detects as unusable (R).
a. Take special note of any extreme deviation in the RRF and evaluate RT data, peak shapes, and areas of the target analytes and associated internal standards for inconsistencies that may indicate a chromatographic co-elution. If this is suspected, the contaminant may also be present in samples and blanks. Also review the documentation of the preparation of the CCV standard. Use professional judgment to qualify affected data appropriately.
5. For an opening or a closing CCV, if the RRF is ≥ Minimum RRF value in Table 18 for any target analyte, detects and non-detects should not be qualified.
6. For an opening CCV, if the %D is outside the ICV/Opening CCV Maximum %D limits in Table 18 for any target analyte, qualify detects as estimated (J) and non-detects as estimated (UJ).
7. For a closing CCV, if the %D is outside the Closing CCV Maximum %D limits in Table 18 for any target analyte, qualify detects as estimated (J) and non-detects as estimated (UJ).
8. For an opening CCV, if the %D is within the inclusive range of the ICV/Opening CCV Maximum %D limits in Table 18 for any target analyte, detects and non-detects should not be qualified.
9. For closing CCV, if the %D is within the inclusive range of the Closing CCV Maximum %D limits in Table 18 for any target analyte, detects and non-detects should not be qualified.
10. No qualification of the data is necessary based on the DMC RRF and/or %D alone. Use professional judgment to evaluate the DMC RRF and %D data in conjunction with the DMC recoveries to determine the need for data qualification.
11. If the laboratory has failed to provide adequate calibration information, contact the EPA Regional CLP COR, who may contact the laboratory to request the necessary information. If the information is not available, use professional judgment to assess the data. Refer to E.1, above, for additional steps.
12. Note the potential effects on the data due to CCV criteria exceedance in the Data Review Narrative.
13. If the CCV criteria are grossly exceeded, note this for EPA Regional CLP COR action.
Organic Data Review Low/Medium VOA
January 2017 81
Table 21. CCV Actions for Low/Medium Volatile Analysis
Criteria for Opening CCV Criteria for Closing CCV Action
Detect Non-detect
CCV not performed at the specified frequency and sequence
CCV not performed at the specified frequency
Use professional
judgment J or R
Use professional
judgment UJ or R
CCV not performed at the specified concentration
CCV not performed at the specified concentration
Use professional
judgment
Use professional
judgment
RRF < Minimum RRF in Table 18 for target analyte
RRF < Minimum RRF in Table 18 for target analyte
Use professional
judgment J or R
R
RRF ≥ Minimum RRF in Table 18 for target analyte
RRF ≥ Minimum RRF in Table 18 for target analyte
No qualification
No qualification
%D outside the ICV/Opening CCV Maximum %D limits in Table 18 for target analyte
%D outside the Closing CCV Maximum %D limits in Table 18 for target analyte
J UJ
%D within the inclusive ICV/Opening CCV Maximum %D limits in Table 18 for target analyte
%D within the inclusive Closing CCV Maximum %D limits in Table 18 for target analyte
No qualification
No qualification

Organic Data Review Low/Medium VOA
January 2017 82
VI. Blanks
A. Review Items
Form 1A-OR, Form 1B-OR, Form 4-OR, chromatograms, and quantitation reports. (SOW SOM02.4 – Exhibit B, Section 3.4 and Exhibit D/Low/Med VOA, Section 12.1)
B. Objective
The objective of a blank analysis results assessment is to determine the existence and magnitude of contamination resulting from laboratory (or field) activities.
C. Criteria
The criteria for evaluation of blanks should apply to any blank associated with the samples (e.g., method blanks, storage blanks, field blanks, etc.). If problems with any blank exist, all associated data must be carefully evaluated to determine whether or not there is an inherent variability in the data or if the problem is an isolated occurrence not affecting other data.
1. Method blank analyses must be performed at the specified frequency and sequence. A method blank must be analyzed once every 12-hour period and prior to any sample analysis and after all ICAL standards, the ICV, or the opening CCV. The method blank must be analyzed on each GC/MS system used for sample analysis within an entire analytical sequence.
2. The method blank, like any other sample in the SDG, must meet the technical acceptance criteria for sample analysis.
3. The TCLP/SPLP ZHE Leachate Extraction Blank (LEB) must be prepared and analyzed at the specified frequency and sequence.
4. A storage blank analysis must be performed at the specified frequency and sequence. A storage blank must be prepared upon receipt of the first samples from an SDG, and stored with the samples until analysis. The storage blank must be analyzed once per SDG after all sample analyses within an SDG are complete.
5. An instrument blank must be analyzed immediately after any sample that has target analytes exceeding the calibration range or non-target compounds exceeding 200 µg/L.
6. The concentration of a target analyte in any blank must not exceed its Contract Required Quantitation Limit (CRQL) (2x CRQLs for Methylene chloride, Acetone, and 2-Butanone). TIC concentration in any blank must be ≤ 5.0 µg/L for water (0.0050 mg/L for TCLP leachate) and ≤ 5.0 µg/kg for soil/sediment matrices.
D. Evaluation
1. Verify that method blanks are analyzed at the specified frequency and sequence. The Method Blank Summary (Form 4-OR) may be used to identify the samples associated with each method blank.
2. Verify that applicable TCLP/SPLP LEBs are analyzed at the specified frequency and sequence. The Method Blank Summary (Form 4-OR) may be used to identify the samples associated with each TCLP/SPLP LEB.
3. Verify that a storage blank has been analyzed at the specified frequency and sequence.
4. Verify that the instrument blank analysis has been performed following any sample analysis where a target analyte(s) is/are reported at high concentration(s).
5. Review the results of all associated blanks on the forms and raw data (chromatograms and quantitation reports) to evaluate the presence of target analytes and non-target compounds in the blanks.
Organic Data Review Low/Medium VOA
January 2017 83
6. Data concerning the field blanks are not evaluated as part of the Contract Compliance Screening(CCS) process. Evaluate field or trip blanks in the manner similar to that used for the methodblanks.
NOTE: For data obtained from the CLP, the preceding criteria are evaluated as part of the CCS process. Information regarding the noncompliant blank can be obtained from the NFG reports and may be used as part of the evaluation process.
E. Action
1. If the appropriate blanks are not analyzed at the correct frequency, use professional judgment todetermine if the associated sample data should be qualified. Obtain additional information from thelaboratory, if necessary. Record the situation in the Data Review Narrative and note it for EPARegional CLP COR action.
2. Action regarding unsuitable blank results depends on the circumstances and origin of the blank.Verify that data qualification decisions based on field quality control (QC) are supported by theproject Quality Assurance Project Plan (QAPP) or EPA Regional Standard Operating Procedure(SOP). At a minimum, contamination found in field blanks should be documented in the DataReview Narrative. In instances where more than one of blank is associated with a given sample,qualification should be based upon a comparison with the associated blank having the highestconcentration of a contaminant. Do not correct the results by subtracting any blank value.
3. For any blank (including method blank), if a target analyte is detected, but it is not detected in thesample, non-detects should not be qualified.
4. For any method blank reported with results < CRQLs, report sample results that are < CRQLs at theCRQLs and qualify as non-detect (U). For any method blank reported with results that are< CRQLs, use professional judgment to qualify sample results that are ≥ CRQLs (≥ 2x result inmethod blank for Methylene chloride, Acetone, and 2-Butanone). Positive results in samples,especially those near but above the CRQL, may be biased high by low level contamination in themethod blank, and should be considered as estimated (J+).
5. For any method blank reported with results ≥ CRQLs, report sample results that are < CRQLs at theCRQLs and qualify as non-detect (U).
6. For any method blank reported with results ≥ CRQLs, report sample results that are ≥ CRQLs but< Blank Results at sample results and qualify as non-detect (U) or as unusable (R). Useprofessional judgment to qualify sample results that are ≥ CRQLs and ≥ Blank Results or ≥ 2xresults in method blank for Methylene chloride, Acetone, and 2-Butanone.
7. If an instrument blank is not analyzed following a sample analysis which contains analyte(s) at highconcentration(s) exceeding the calibration range, evaluate the analyte(s) concentration(s) in thesamples analyzed immediately after the sample with high analyte(s) concentration(s) for carryover.Use professional judgment to determine if instrument cross-contamination has affected anypositive target analyte identification(s). If instrument cross-contamination is suggested andsuspected of having an effect on the sample results or calibration performance, note it for EPARegional CLP COR action.
8. If any analytes are detected in the storage, field, or trip blanks, the following is recommended:
a. Review the associated method blank data to determine if the same analytes are also detected inthe method blank.
i. If the analytes are detected at comparable levels in the method blank, the source of thecontamination may be in the analytical system. Apply the recommended actions for themethod blank.

Organic Data Review Low/Medium VOA
January 2017 84
ii. If the analytes are not detected in the method blank, the source of contamination may be in the storage area or in the field, or contamination may have occurred during sample transport. Consider all associated samples for possible cross-contamination.
iii. For TCLP/SPLP LEBs and storage, field, or trip blanks, the sample result qualifications listed in Table 22 should apply if supported by the project QAPP.
9. If gross contamination exists with blank results that are > ICAL CS5 concentrations, qualify detects as unusable (R). If the contamination is suspected of having an effect on the sample results, note it for EPA Regional CLP COR action.
10. For any blank (including method blank) reported with TICs (non-target compounds) concentrations that are > 5.0 µg/L for water (0.0050 mg/L for TCLP leachate) or > 5.0 µg/kg for soil/sediment matrices, use professional judgment to qualify sample results.
11. There may be instances where little or no contamination is present in the associated blanks, but qualification of the sample is deemed necessary. If it is determined that the contamination is from a source other than the sample, the data should be qualified or, in the case of field QC, should at least be documented in the Data Review Narrative. Contamination introduced through dilution water is one example. Although it is not always possible to determine, instances of this occurring can be detected when contaminants are found in the diluted sample result, but are absent in the undiluted sample.
Table 22. Blank and TCLP/SPLP LEB Actions for Low/Medium Volatile Analysis
Blank Type Blank Result Sample Result Action
Method, TCLP/SPLP LEB, Storage, Field, Trip, Instrument*
Detect Non-detect No qualification
< CRQL
< CRQL Report at CRQL and qualify as non-detect (U)
≥ CRQL or ≥ 2x Blank Result for Methylene chloride, Acetone, and 2-Butanone
Use professional judgment
≥ CRQL
< CRQL Report at CRQL and qualify as non-detect (U)
≥ CRQL but < Blank Result Report at sample result and qualify as non-detect (U) or unusable (R)
≥ CRQL and ≥ Blank Result or ≥ 2x Blank Result for Methylene chloride, Acetone, and 2-Butanone
Use professional judgment
Gross contamination Detect Report at sample result and
qualify as unusable (R)
TIC > 5.0 μg/L (water) or 0.0050 mg/L (TCLP leachate) or TIC > 5.0 µg/kg (soil/sediment)
Detect Use professional judgment
* Qualifications based on instrument blank results affect only the sample analyzed immediately after the sample that has target analyte concentration exceeding the calibration range (ICAL CS5 concentration) or TIC exceeding 200 µg/L.

Organic Data Review Low/Medium VOA
January 2017 85
VII. Deuterated Monitoring Compound
A. Review Items
Form 2A-OR, Form 2B-OR quantitation reports, and chromatograms. (SOW SOM02.4 – Exhibit B, Section 3.4 and Exhibit D/Low/Med VOA, Sections 7.2.2.4 and 11.2.5)
B. Objective
The objective is to evaluate the DMC Percent Recovery (%R) to ensure that the analytical method is efficient.
C. Criteria
1. All samples and blanks are spiked with the DMCs listed in Table 23, just prior to sample purging, to measure the DMC %R.
2. The %R for each DMC should be calculated correctly according to the method.
3. The %R for each DMC in samples and blanks must be within the limits in Table 23.
Table 23. Low/Medium Volatile DMC Recovery Limits
DMC %R for Water Sample
%R for Soil/Sediment
Sample
Vinyl chloride-d3 60 - 135 30 - 150
Chloroethane-d5 70 - 130 30 - 150
1,1-Dichloroethene-d2 60 - 125 45 - 110
2-Butanone-d5 40 - 130 20 - 135
Chloroform-d 70 - 125 40 - 150
1,2-Dichloroethane-d4 70 - 125 70 - 130
Benzene-d6 70 - 125 20 - 135
1,2-Dichloropropane-d6 70 - 120 70 - 120
Toluene-d8 80 - 120 30 - 130
trans-1,3-Dichloropropene-d4 60 - 125 30 - 135
2-Hexanone-d5 45 - 130 20 - 135
1,1,2,2-Tetrachloroethane-d2 65 - 120 45 - 120
1,2-Dichlorobenzene-d4 80 - 120 75 - 120
NOTE: The recovery limits for any of the compounds listed in Table 23 may be expanded at any time during the period of performance if the EPA determines that the limits are too restrictive.
D. Evaluation
1. Check the raw data (e.g., chromatograms and quantitation reports) to verify the recoveries on the Deuterated Monitoring Compound Recovery Form 2A-OR and Form 2B-OR.
2. Check for any calculation or transcription errors. Verify that the DMC recoveries were calculated correctly using the equation in the method and that the recalculated values agree with the laboratory reported values on Form 2A-OR and Form 2B-OR.
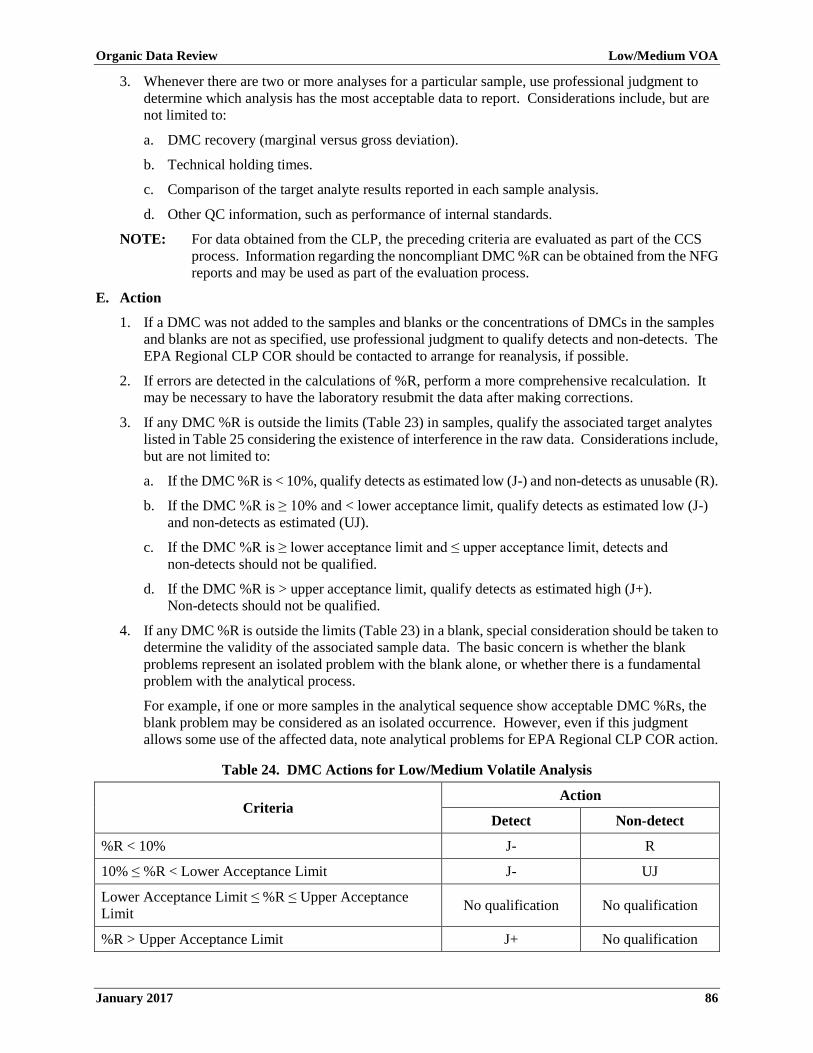
Organic Data Review Low/Medium VOA
January 2017 86
3. Whenever there are two or more analyses for a particular sample, use professional judgment to determine which analysis has the most acceptable data to report. Considerations include, but are not limited to:
a. DMC recovery (marginal versus gross deviation).
b. Technical holding times.
c. Comparison of the target analyte results reported in each sample analysis.
d. Other QC information, such as performance of internal standards.
NOTE: For data obtained from the CLP, the preceding criteria are evaluated as part of the CCS process. Information regarding the noncompliant DMC %R can be obtained from the NFG reports and may be used as part of the evaluation process.
E. Action
1. If a DMC was not added to the samples and blanks or the concentrations of DMCs in the samples and blanks are not as specified, use professional judgment to qualify detects and non-detects. The EPA Regional CLP COR should be contacted to arrange for reanalysis, if possible.
2. If errors are detected in the calculations of %R, perform a more comprehensive recalculation. It may be necessary to have the laboratory resubmit the data after making corrections.
3. If any DMC %R is outside the limits (Table 23) in samples, qualify the associated target analytes listed in Table 25 considering the existence of interference in the raw data. Considerations include, but are not limited to:
a. If the DMC %R is < 10%, qualify detects as estimated low (J-) and non-detects as unusable (R).
b. If the DMC %R is ≥ 10% and < lower acceptance limit, qualify detects as estimated low (J-) and non-detects as estimated (UJ).
c. If the DMC %R is ≥ lower acceptance limit and ≤ upper acceptance limit, detects and non-detects should not be qualified.
d. If the DMC %R is > upper acceptance limit, qualify detects as estimated high (J+). Non-detects should not be qualified.
4. If any DMC %R is outside the limits (Table 23) in a blank, special consideration should be taken to determine the validity of the associated sample data. The basic concern is whether the blank problems represent an isolated problem with the blank alone, or whether there is a fundamental problem with the analytical process.
For example, if one or more samples in the analytical sequence show acceptable DMC %Rs, the blank problem may be considered as an isolated occurrence. However, even if this judgment allows some use of the affected data, note analytical problems for EPA Regional CLP COR action.
Table 24. DMC Actions for Low/Medium Volatile Analysis
Criteria Action
Detect Non-detect
%R < 10% J- R
10% ≤ %R < Lower Acceptance Limit J- UJ
Lower Acceptance Limit ≤ %R ≤ Upper Acceptance Limit No qualification No qualification
%R > Upper Acceptance Limit J+ No qualification
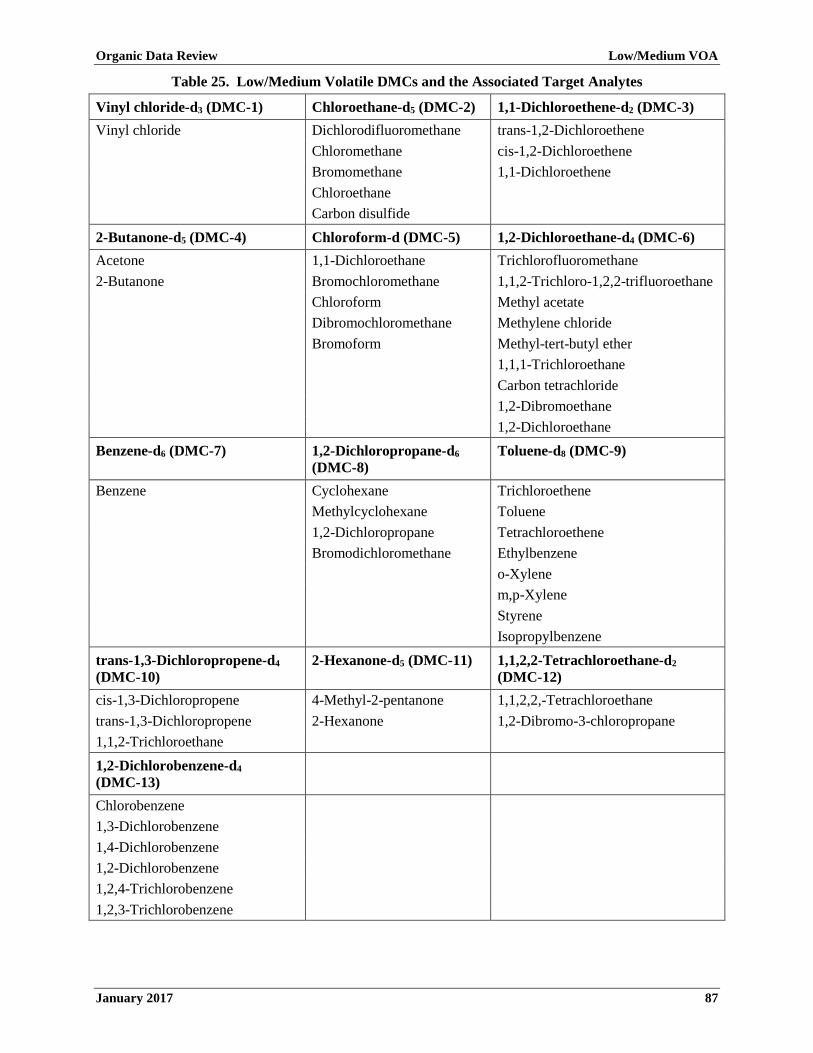
Organic Data Review Low/Medium VOA
January 2017 87
Table 25. Low/Medium Volatile DMCs and the Associated Target Analytes
Vinyl chloride-d3 (DMC-1) Chloroethane-d5 (DMC-2) 1,1-Dichloroethene-d2 (DMC-3) Vinyl chloride Dichlorodifluoromethane trans-1,2-Dichloroethene Chloromethane cis-1,2-Dichloroethene Bromomethane 1,1-Dichloroethene Chloroethane Carbon disulfide 2-Butanone-d5 (DMC-4) Chloroform-d (DMC-5) 1,2-Dichloroethane-d4 (DMC-6) Acetone 1,1-Dichloroethane Trichlorofluoromethane 2-Butanone Bromochloromethane 1,1,2-Trichloro-1,2,2-trifluoroethane Chloroform Methyl acetate Dibromochloromethane Methylene chloride Bromoform Methyl-tert-butyl ether 1,1,1-Trichloroethane Carbon tetrachloride 1,2-Dibromoethane 1,2-Dichloroethane Benzene-d6 (DMC-7) 1,2-Dichloropropane-d6
(DMC-8) Toluene-d8 (DMC-9)
Benzene Cyclohexane Trichloroethene Methylcyclohexane Toluene 1,2-Dichloropropane Tetrachloroethene Bromodichloromethane Ethylbenzene o-Xylene m,p-Xylene Styrene Isopropylbenzene trans-1,3-Dichloropropene-d4 (DMC-10)
2-Hexanone-d5 (DMC-11) 1,1,2,2-Tetrachloroethane-d2 (DMC-12)
cis-1,3-Dichloropropene 4-Methyl-2-pentanone 1,1,2,2,-Tetrachloroethane trans-1,3-Dichloropropene 2-Hexanone 1,2-Dibromo-3-chloropropane 1,1,2-Trichloroethane 1,2-Dichlorobenzene-d4 (DMC-13)
Chlorobenzene 1,3-Dichlorobenzene 1,4-Dichlorobenzene 1,2-Dichlorobenzene 1,2,4-Trichlorobenzene 1,2,3-Trichlorobenzene

Organic Data Review Low/Medium VOA
January 2017 88
VIII. Matrix Spike/Matrix Spike Duplicate
A. Review Items
SDG Cover Page, Form 3A-OR, chromatograms, and quantitation reports. (SOW SOM02.4 – Exhibit B, Section 3.4 and Exhibit D/Low/Med VOA, Sections 7.2.2.5 and 12.2)
B. Objective
The objective of the Matrix Spike (MS)/Matrix Spike Duplicate (MSD) analysis is to evaluate the effect of each sample matrix on the sample preparation procedures and the measurement methodology.
C. Criteria
1. If requested, MS/MSD samples shall be prepared and analyzed at the specified frequency. One pair of MS/MSD samples should be analyzed per matrix or per SDG.
NOTE: Data for MS and MSDs will not be present unless requested by the EPA Region.
2. Samples identified as field blanks or Performance Evaluation (PE) samples cannot be used for spiked sample analysis.
3. The MS/MSD %R and the Relative Percent Difference (RPD) between MS and MSD results should be calculated according to the method.
4. The MS/MSD %R and RPD should be within the acceptance limits in Table 26.
D. Evaluation
1. Verify that requested MS/MSD samples were analyzed at the required frequency.
2. Verify that a field blank or PE sample was not used for MS/MSD analysis.
3. Verify that the recalculated MS/MSD %R and RPD values agree with the laboratory reported values on Form 3A-OR.
4. Inspect the MS/MSD %R and RPD on Form 3A-OR and verify that they are within the limits listed in Table 26.
NOTE: For data obtained from the CLP, the preceding criteria, including the requested MS/MSD spiking analytes and spiking levels specified in Exhibit D – Low/Medium Concentrations of Volatile Organic Compounds Analysis, Section 7.2.2.5, of the SOW, are evaluated as part of the CCS process. Information regarding the noncompliant MS/MSD %R or RPD can be obtained from the NFG reports and may be used as part of the evaluation process.
E. Action
1. If requested MS/MSD samples were not analyzed at the specified frequency, use professional judgment to determine the impact on sample data, if any. Obtain additional information from the laboratory, if necessary. Record the situation in the Data Review Narrative and note it for EPA Regional CLP COR action. It is not likely that data qualification will be warranted if the frequency requirements are not met. Carefully consider all factors, known and unknown, about method performance on the matrix at hand, in lieu of MS/MSD data.
2. If a field blank or PE sample was used for the MS/MSD analysis, note this for EPA Regional CLP COR action. All of the other QC data must then be carefully checked. Use professional judgment when evaluating the data.
3. If errors are detected in the calculations of the MS/MSD %R or RPD, perform a more comprehensive recalculation.
4. If the MS/MSD %R or RPD is outside the acceptance limits in Table 26, qualify the detects and non-detects in the original sample to include the consideration of the existence of interference in the raw data. Considerations include, but are not limited to:
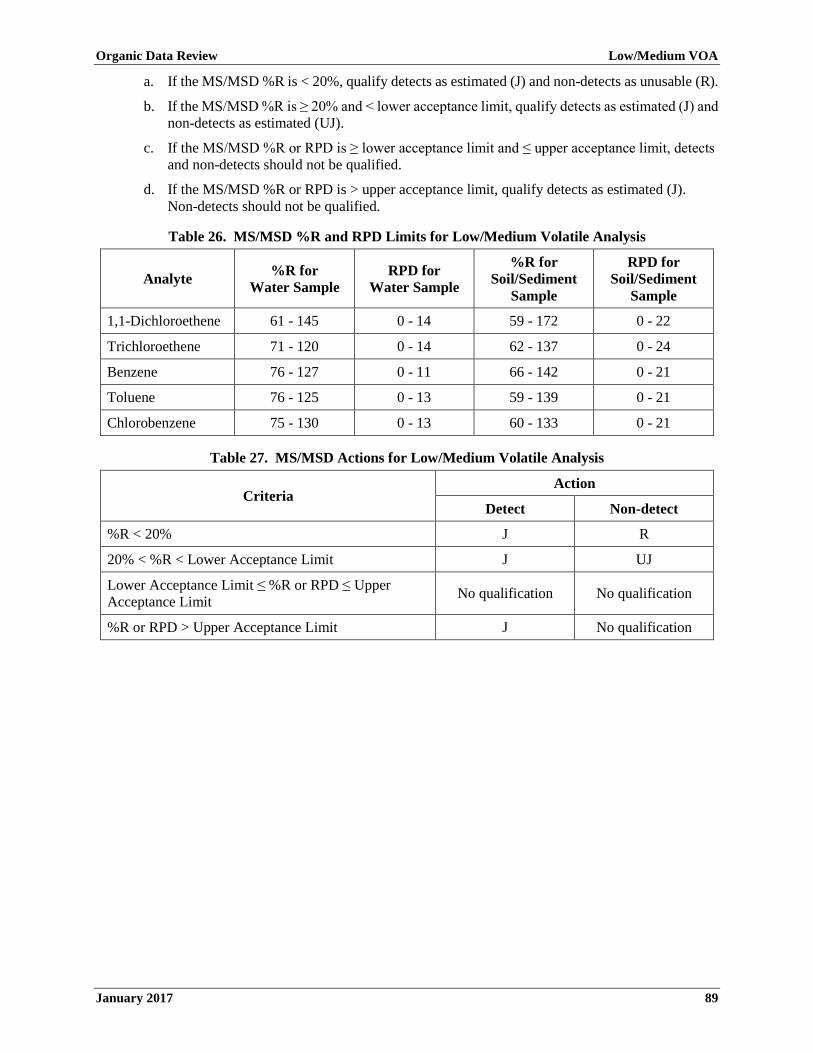
Organic Data Review Low/Medium VOA
January 2017 89
a. If the MS/MSD %R is < 20%, qualify detects as estimated (J) and non-detects as unusable (R).
b. If the MS/MSD %R is ≥ 20% and < lower acceptance limit, qualify detects as estimated (J) and non-detects as estimated (UJ).
c. If the MS/MSD %R or RPD is ≥ lower acceptance limit and ≤ upper acceptance limit, detects and non-detects should not be qualified.
d. If the MS/MSD %R or RPD is > upper acceptance limit, qualify detects as estimated (J). Non-detects should not be qualified.
Table 26. MS/MSD %R and RPD Limits for Low/Medium Volatile Analysis
Analyte %R for Water Sample
RPD for Water Sample
%R for Soil/Sediment
Sample
RPD for Soil/Sediment
Sample
1,1-Dichloroethene 61 - 145 0 - 14 59 - 172 0 - 22
Trichloroethene 71 - 120 0 - 14 62 - 137 0 - 24
Benzene 76 - 127 0 - 11 66 - 142 0 - 21
Toluene 76 - 125 0 - 13 59 - 139 0 - 21
Chlorobenzene 75 - 130 0 - 13 60 - 133 0 - 21
Table 27. MS/MSD Actions for Low/Medium Volatile Analysis
Criteria Action
Detect Non-detect
%R < 20% J R
20% < %R < Lower Acceptance Limit J UJ
Lower Acceptance Limit ≤ %R or RPD ≤ Upper Acceptance Limit No qualification No qualification
%R or RPD > Upper Acceptance Limit J No qualification
Organic Data Review Low/Medium VOA
January 2017 90
IX. Internal Standard
A. Review Items
Form 8A-OR, quantitation reports, and chromatograms. (SOW SOM02.4 – Exhibit B, Section 3.4 and Exhibit D/Low/Med VOA, Sections 7.2.2.6, 11.3.5, and 11.3.6)
B. Objective
The objective is to evaluate the internal standard performance to ensure that GC/MS sensitivity and response are stable during each analysis.
C. Criteria
1. The internal standard solution must be added to all samples and blanks at the specified concentration. The internal standard solution must contain all internal standard compounds specified in the method.
2. The area response of each internal standard compound in all samples and blanks must be within the inclusive ranges of 50-200% of the area response of the same internal standard compound from the associated opening CCV or the mid-point standard CS3 from the associated ICAL.
3. The RT of the internal standard compound in the sample or blank must not vary more than ±10.0 seconds from the RT of the same internal standard compound in the associated opening CCV or mid-point standard CS3 from the associated ICAL.
D. Evaluation
1. Verify that all required internal standard compounds were added to sample and blank analyses at the specified concentrations.
2. Check the raw data (e.g., chromatograms and quantitation reports) to verify that the RT and area response of each internal standard compound in a sample or blank are reported on Form 8A-OR.
3. Verify that the RTs and area responses for all internal standard compounds are within the specified criteria. If internal standard RTs are significantly different from the associated CCV or ICAL midpoint (i.e., more than 10 seconds), the internal standard peak may have been misidentified, but most likely a change in the chromatographic system should be suspected. This could be an improper desorb/injection cycle, a leak in the purge/trap/GC system, or the effect of a highly contaminated matrix. Normally, the area counts will also suffer in this situation, but even if they appear unaffected, both quantitative and qualitative results should be considered highly suspect.
4. If there is a reanalysis for a particular sample, determine which analysis is the best data to report. Considerations include, but are not limited to:
a. Magnitude and direction of the internal standard area response shift.
b. Magnitude and direction of the internal standard RT shift.
c. Technical holding times.
d. Comparison of the values of the target analytes reported in each method.
e. Other QC information.
NOTE: For data obtained from the CLP, the preceding criteria are evaluated as part of the CCS process. Information regarding the noncompliant internal standard area response or RT can be obtained from the NFG reports and may be used as part of the evaluation process.

Organic Data Review Low/Medium VOA
January 2017 91
E. Action
NOTE: Apply the action to the target analytes in samples or blanks that are associated to the noncompliant internal standard compound in Table 28. The internal standard and the associated target analytes are in Exhibit D – Low/Medium Concentrations of Volatile Organic Compounds Analysis, Table 9, of the SOW.
1. If the required internal standard compounds were not added to a sample or blank, qualify detects and non-detects as unusable (R).
2. If the required internal standard compound was not analyzed at the specified concentration in a sample or blank, use professional judgment to qualify detects and non-detects.
3. If the area response of an internal standard compound in a sample or blank is < 20% of the area response of the same internal standard compound in the associated opening CCV or mid-point standard CS3 from the associated ICAL, qualify detects as estimated high (J+) and non-detects as unusable (R).
4. If the area response of an internal standard compound in a sample or blank is ≥ 20% and < 50% of the area response of the same internal standard compound in the associated opening CCV or mid-point standard CS3 from the associated ICAL, qualify detects as estimated high (J+) and non-detects as unusable (UJ).
5. If the area response of an internal standard compound in a sample or blank is within the inclusive range of 50-200% of the area response of the same internal standard compound in the associated opening CCV or mid-point standard CS3 from the associated ICAL, detects and non-detects should not be qualified.
6. If the area response of an internal standard compound in a sample or blank is > 200% of the area response of the same internal standard compound in the associated opening CCV or mid-point standard CS3 from the associated ICAL, qualify detects as estimated low (J-). Non-detects should not be qualified.
7. If the RT shift between sample/blank and the associated opening CCV or mid-point standard CS3 from the associated ICAL of an internal standard compound is > 10.0 seconds, qualify detects and non-detects as unusable (R). The EPA Regional CLP COR should be contacted to arrange for reanalysis.
8. If the RT shift between sample/blank and the associated opening CCV or mid-point standard CS3 from the associated ICAL of an internal standard compound is < 10.0 seconds, detects and non-detects should not be qualified.
9. If the internal standard performance criteria are grossly exceeded, annotate the potential effects on the data in the Data Review Narrative and note it for EPA Regional CLP COR action.
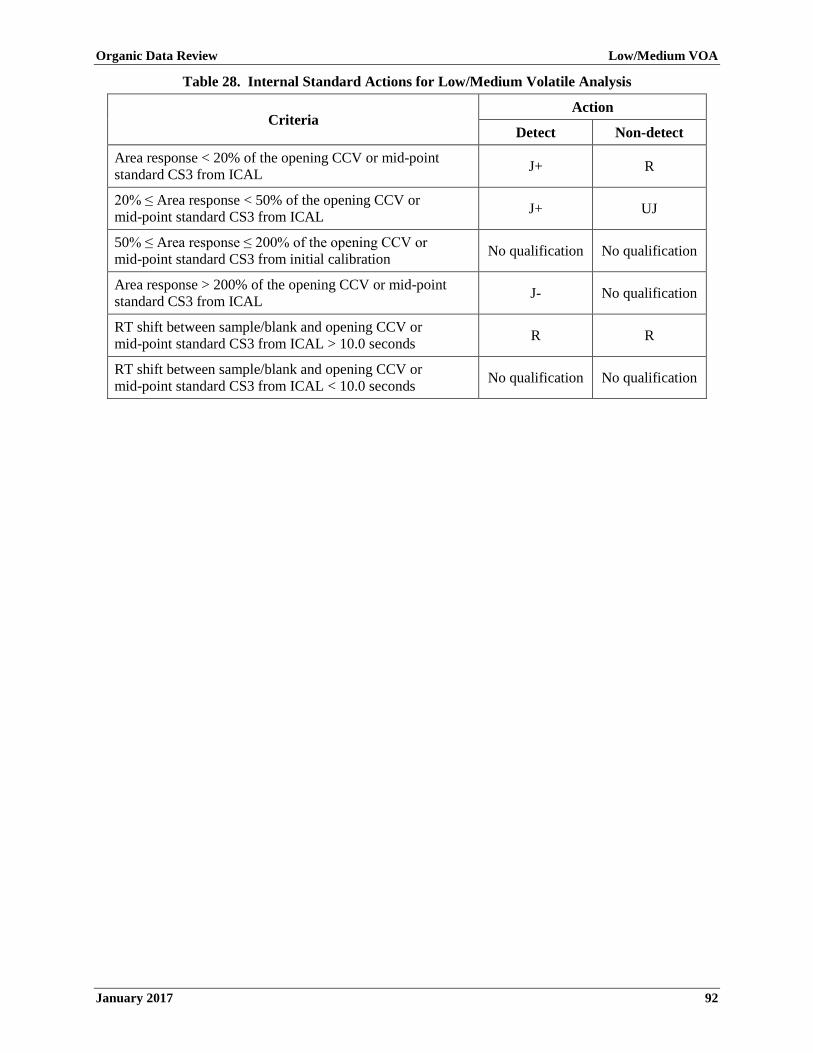
Organic Data Review Low/Medium VOA
January 2017 92
Table 28. Internal Standard Actions for Low/Medium Volatile Analysis
Criteria Action
Detect Non-detect
Area response < 20% of the opening CCV or mid-point standard CS3 from ICAL J+ R
20% ≤ Area response < 50% of the opening CCV or mid-point standard CS3 from ICAL J+ UJ
50% ≤ Area response ≤ 200% of the opening CCV or mid-point standard CS3 from initial calibration No qualification No qualification
Area response > 200% of the opening CCV or mid-point standard CS3 from ICAL J- No qualification
RT shift between sample/blank and opening CCV or mid-point standard CS3 from ICAL > 10.0 seconds R R
RT shift between sample/blank and opening CCV or mid-point standard CS3 from ICAL < 10.0 seconds No qualification No qualification
Organic Data Review Low/Medium VOA
January 2017 93
X. Target Analyte Identification
A. Review Items
Form 1A-OR, quantitation reports, mass spectra, and chromatograms. (SOW SOM02.4 – Exhibit B, Section 3.4 and Exhibit D/Low/Med VOA, Section 11.1.1)
B. Objective
The objective is to provide acceptable GC/MS qualitative analysis to minimize the number of erroneous analyte identifications.
C. Criteria
1. The mass spectrum of the analyte from the sample analysis must match that of the same analyte in the associated opening CCV or mid-point standard CS3 from the associated ICAL according to the following criteria:
a. All ions present in the calibration standard mass spectrum must be present in the sample spectrum at relative intensity > 10%.
b. The relative intensities of these ions must agree within ±20% between the standard and sample spectra (e.g., for an ion with an abundance of 50% in the standard spectrum, the corresponding sample ion abundance must be between 30-70%).
c. Ions present at > 10% in the sample mass spectrum, but not present in the standard spectrum, must be evaluated by a reviewer experienced in mass spectral interpretation.
2. The Relative Retention Time (RRT) for a positively identified target analyte must be within ±0.06 RRT units of the RRT for the same analyte in the associated opening CCV or mid-point standard CS3 from the associated ICAL.
D. Evaluation
1. Verify that the positively identified target analyte mass spectrum meets the specified criteria. If not, examine the sample target analyte spectra for the presence of interference at one or more mass fragment peaks. Although the presence of a co-eluting interferent may preclude positive identification of the analyte, the presumptive evidence of its presence may be useful information to include in the Data Review Narrative.
2. Verify that the RRT of the positively identified target analyte is within ±0.06 RRT units of the RRT for the same analyte in the associated opening CCV or mid-point standard CS3 from the associated ICAL.
3. Be aware of situations when sample carryover is a possibility and use professional judgment to determine if instrument cross-contamination has affected any positive analyte identification. An instrument blank must be analyzed after a sample containing target analytes with concentrations exceeding the ICAL range (200 μg/L for non-ketones, 400 μg/L for ketones), non-target compounds at concentrations > 200 μg/L, or saturated ions from an analyte (excluding the analyte peaks in the solvent front).
4. Verify that peaks are correctly identified as target analytes, TICs, DMCs, or internal standards on the chromatogram for samples and blanks.
5. Verify that there is no erroneous analyte identification, either false positive or false negative, for each target analyte. The positively identified target analytes can be more easily detected for false positives than false negatives. More information is available for false positives due to the requirement for submittal of data supporting positive identifications. Non-detected target analytes, on the other hand, are more difficult to assess. One example of the detection of false negatives is reporting a target analyte as a TIC.

Organic Data Review Low/Medium VOA
January 2017 94
NOTE: For data obtained from the CLP, the preceding criteria are evaluated as part of the CCS process. Information regarding the noncompliant TICs can be obtained from the CCS report and may be used as part of the evaluation process.
NOTE: A target analyte reported as a false negative may not have the best match in a TIC search of a contaminated sample, but its mass spectrum may be present under that of a reported TIC.
E. Action
1. If the positively identified target analyte mass spectrum does not meet the specified criteria, qualify detect as unusable (R), or report the result at the CRQL and qualify as non-detect (U).
2. If the RRT for a positively identified target analyte is outside the specified RRT windows, qualify detects as unusable (R), or report the result at the CRQL and qualify as non-detect (U).
3. If it is determined that cross-contamination has occurred, use professional judgment to qualify detects. Annotate any changes made to the reported analytes due to either false positive or negative identifications, or concerns regarding target analyte identifications, in the Data Review Narrative. Note the necessity for numerous or significant changes for EPA Regional CLP COR action.

Organic Data Review Low/Medium VOA
January 2017 95
XI. Target Analyte Quantitation and Reported Contract Required Quantitation Limit
A. Review Items
Form 1A-OR, sample preparation sheets, SDG Narrative, quantitation reports, and chromatograms. (SOW SOM02.4 – Exhibit B, Section 3.4 and Exhibit D/Low/Med VOA, Sections 11.2.1, 11.2,2, and 11.2.4)
B. Objective
The objective is to ensure that the reported results and CRQLs for target analytes are accurate.
C. Criteria
1. Target analyte results and sample-specific CRQLs must be calculated according to the correct equations.
2. Target analyte RRF must be calculated using the correct associated internal standard, as listed in the method. Quantitation must be based on the quantitation ion (m/z) specified in the method for both the internal standards and target analytes. Target analyte result must be calculated using the RRF������ from the associated ICAL.
D. Evaluation
1. Verify that the results for all positively identified analytes are calculated and reported by the laboratory.
2. Verify that the CRQLs are calculated for the non-detects and reported accordingly.
3. Verify that the correct internal standard, quantitation ion, and RRF������ are used to calculate the reported results.
4. Verify that the same internal standard, quantitation ion, and RRF������ are used consistently.
5. Verify that the sample-specific CRQLs have been calculated and adjusted to reflect Percent Solids (%Solids), original sample mass/volume, and any applicable dilutions.
NOTE: For data obtained from the CLP, the preceding criteria are evaluated as part of the CCS process. Information regarding the noncompliant results or CRQLs can be obtained from the CCS report and may be used as part of the evaluation process.
E. Action
1. If any discrepancies are found, contact the EPA Regional CLP COR, who may contact the laboratory to obtain additional information that could resolve any differences. If a discrepancy remains unresolved, use professional judgment to decide which value is the most accurate and to determine whether qualification of data is warranted. Annotate the reasons for any data qualification in the Data Review Narrative.
2. If errors are detected in results and CRQL calculations, perform a more comprehensive recalculation.
3. If the %Solids for a soil/sediment sample is < 10.0%, use professional judgment to qualify detects and non-detects.
4. If the %Solids for a soil/sediment sample is ≥ 10.0% and < 30.0%, use professional judgment to qualify detects and non-detects.
5. If the %Solids for a soil/sediment sample is ≥ 30.0%, detects and non-detects should not be qualified.
6. If sample results are < CRQLs and ≥ MDLs, qualify as estimated (J).
7. Note numerous or significant failures to accurately quantify the target analytes, or to properly evaluate and adjust CRQLs, for EPA Regional CLP COR action.

Organic Data Review Low/Medium VOA
January 2017 96
Table 29. Percent Solids Actions for Low/Medium Volatile Analysis for Non-Aqueous Samples
Criteria Action
Detects Non-detects
%Solids < 10.0% Use professional judgment Use professional judgment
10.0% ≤ %Solids < 30.0% Use professional judgment Use professional judgment
%Solids ≥ 30.0% No qualification No qualification
Organic Data Review Low/Medium VOA
January 2017 97
XII. Tentatively Identified Compounds
A. Review Items
Form 1B-OR, chromatograms, library search printouts, and spectra for the TIC candidates. (SOW SOM02.4 – Exhibit B, Section 3.4 and Exhibit D/Low/Med VOA, Sections 11.1.2 and 11.2.3)
B. Objective
The objective is to provide tentative identifications to chromatographic peaks that are not identified as target analytes, DMCs, or internal standards.
C. Criteria
For each sample, the laboratory must conduct a mass spectral search of the National Institute of Standards and Technology (NIST) (2011 release or later), Wiley (2011 release or later), or equivalent mass spectral library, and report the possible identity for up to 30 of the largest peaks that are not DMCs, internal standards, or target analytes. The peak for a TIC should have an area or height > 10% of the area or height of the nearest internal standard. The estimated concentration for a TIC is calculated similarly to that for a target analyte, using total ion areas for the TIC and the internal standard, and assuming an RRF of 1.0.
1. Guidelines for tentative identification are as follows:
a. Major ions (> 10% Relative Intensity) in the reference spectrum should be present in the sample spectrum.
b. The relative intensities of the major ions should agree within ±20% between the sample and the reference spectra.
c. Molecular ions present in the reference spectrum should be present in the sample spectrum.
d. Non-target compounds receiving a library search match of 85% or higher are considered a “probable match”. The compound should be reported unless the mass spectral interpretation specialist feels there is evidence not to report the compound as identified by the library search program. The laboratory should include the justification for not reporting a compound as listed by the search program in the SDG Narrative.
e. If the library search produces more than one compound ≥ 85%, the compound with the highest percent match (report first compound if percent match is the same for two or more compounds) should be reported, unless the mass spectral interpretation specialist feels that the highest match compound should not be reported or another compound with a lower match should be reported. The laboratory should include the justification for not reporting the compound with the highest spectral match within the SDG Narrative. DMCs, internal standards, and target analytes should not be reported as TICs.
f. If the library search produces a series of obvious isomer compounds with library search matches ≥ 85%, the compound with the highest library search percent match (or the first compound if the library search matches are the same) should be reported. The laboratory should note in the SDG Narrative that the exact isomer configuration, as reported, may not be accurate.
g. If the library search produces no matches ≥ 85%, and in the technical judgment of the mass spectral interpretation specialist no valid tentative identification can be made, the compound should be reported as “unknown”. The mass spectral specialist should give additional classification of the unknown compound, if possible (e.g., “unknown aromatic”, “unknown hydrocarbon”, “unknown acid type”, “unknown chlorinated compound”). If probable molecular weights can be distinguished, they should be included.
Organic Data Review Low/Medium VOA
January 2017 98
h. The Chemical Abstracts Service (CAS) registry number is the unique identifier for eachchemical compound. As the rules of chemical nomenclature have changed over time, eachchemical substance is liable to have several names or synonyms [i.e., trade or brand name(s);generic or common name(s); trivial or systematic; or International Union of Pure and AppliedChemistry (IUPAC) name(s)]. Whether synonyms or other names are created for thiscompound, the CAS registry number will remain unchanged. The CAS registry number issimply an identifier which has no structural significance. Regardless of RTs, if the librarysearch produces two or more compounds at or above 85% with the same CAS number, thecompound with the highest percent match (report first compound if the percent match is thesame for two or more compounds) should be reported unless the mass spectral interpretationspecialist feels there is just evidence not to report the compound with the highest match.
i. If the library search produces only one and the same compound (i.e., the same CAS registrynumber) with the match at or above 85% at two different RTs, the compound having thehighest percent match should be reported as TIC and the other one could be reported asunknown. If both TICs have the same percent match for the same compound, one of the TICscould be reported as unknown. Such justifications should be included in the SDG Narrative.
j. Alkanes are not to be reported as TICs on Form 1B-OR. An alkane is defined as anyhydrocarbon with the generic formula CnH2n+2 (straight-chain or branched) or CnH2n (cyclic)that contains only C-H and C-C single bonds. When the preceding alkanes are tentativelyidentified, the concentration(s) should be estimated and the analytes reported as alkanes byclass (i.e., straight-chain, branched, cyclic, as a series, or as applicable) in the SDG Narrative.Total alkanes concentration should be reported on Form 1B-OR.
D. Evaluation
1. Verify that the laboratory has generated a library search for all required peaks in thechromatograms for samples and blanks.
2. Verify that TIC peaks present in samples are not found in blanks. When a low-level, non-targetcompound that is a common artifact or laboratory contaminant is detected in a sample, a thoroughcheck of blank chromatograms may require looking for peaks which are < 10% of the internalstandard height, but present in the blank chromatogram at a similar RRT.
3. Verify that mass spectra for all reported TICs are present for every sample and blank.
4. Review ions present in the sample spectrum, but not in the reference spectrum, for possiblebackground contamination, interference, or presence of coeluting compounds.
5. Review ions present in the reference spectrum, but not in the sample spectrum, for possiblesubtraction from the sample spectrum because of background contamination or coelutingcompounds. Data system library reduction programs can sometimes create these discrepancies.
6. Consider all reasonable choices since TIC library searches often yield several candidatecompounds having a close matching score.
7. Be aware of common laboratory artifacts/contaminants and their sources (e.g., Aldol condensationproducts, solvent preservatives, and reagent contaminants). These may be present in blanks and notreported as sample TICs, such as:
a. Common laboratory contaminants include CO2 (m/z 44), siloxanes (m/z 73), diethyl ether,hexane, certain freons, and phthalates at levels < 100 µg/L.
b. Solvent preservatives include cyclohexene (a methylene chloride preservative). Relatedby-products include cyclohexanone, cyclohexenone, cyclohexanol, cyclohexenol,chlorocyclohexene, and chlorocyclohexanol.
c. Aldol condensation reaction products of acetone include 4-hydroxy-4-methyl-2-pentanone,4-methyl-2-penten-2-one, and 5,5-dimethyl-2(5H)-furanone.

Organic Data Review Low/Medium VOA
January 2017 99
8. A target analyte may be identified by non-target library search procedures, even though it is not identified as a target analyte (false negative). If the total area quantitation method is used, request that the laboratory recalculate the result using the proper quantitation ion and RRF.
a. A non-target compound may be incorrectly identified by the instrument’s target analyte data processor as a target analyte (false positive). When this happens, the non-target library search procedure will not detect the false positive as a TIC. In this case, request that the laboratory properly identify the analyte as a TIC and recalculate the result using the total area quantitation method and an RRF of 1.0.
b. Evaluate other sample chromatograms and check for both false negatives and false positives to determine if the occurrence is isolated or systematic.
9. Verify that the TIC concentration is calculated using an RRF of 1.0.
E. Action
1. If the library search match for a TIC is ≥ 85%, qualify the TIC as tentatively identified with estimated concentration (NJ).
2. If the library search match for a TIC is < 85%, qualify the TIC as unknown with estimated concentration (J).
3. General actions related to the review of TIC results are as follows:
a. If it is determined that a tentative identification of a non-target compound is unacceptable, change the tentative identification to “unknown” or another appropriate identification, and qualify the result as estimated (J).
b. If a library search or proper calculation is not performed for all contractually-required peaks, the EPA Regional CLP COR may request the data from the laboratory.
c. Use professional judgment to determine whether a library search result for a TIC represents a reasonable identification. If there is more than one possible match, report the result as “either compound X or compound Y”. If there is a lack of isomer specificity, change the TIC result to a non-specific isomer result (e.g., 1,3,5-trimethyl benzene to trimethyl benzene isomer) or to a compound class (e.g., 2-methyl, 3-ethyl benzene to a substituted aromatic compound).
d. Other Case factors may influence TIC judgments. If a sample TIC match is poor, but other samples have a TIC with a valid library match, similar RRT, and the same ions, infer identification information from the other sample TIC results.
4. Note any changes made to the reported data or any concerns regarding TIC identifications in the Data Review Narrative.
5. Note any failure to properly evaluate and report TICs for EPA Regional CLP COR action.

Organic Data Review Low/Medium VOA
January 2017 100
XIII. System Performance
A. Review Items
Form 8A-OR and chromatograms. (SOW SOM02.4 – Exhibit B, Section 3.4 and Exhibit D/Low/Med VOA, Section 11.1)
B. Objective
The objective is to ensure that the system is stable during the analytical sequence to produce quality data.
C. Criteria
There are no specific criteria for system performance.
D. Evaluation
1. Abrupt discrete shifts in the Reconstructed Ion Chromatogram (RIC) baseline may indicate a change in the instrument’s sensitivity or the zero setting. A baseline “shift” could indicate a decrease in sensitivity in the instrument or an increase in the instrument zero, possibly causing target compounds at or near the detection limit to miss detection. A baseline “rise” could indicate problems such as a change in the instrument zero, a leak, or degradation of the column.
2. Poor chromatographic performance affects both qualitative and quantitative results. Indications of substandard performance include:
a. High RIC background levels or shifts in absolute RTs of internal standards.
b. Excessive baseline rise at elevated temperature.
c. Extraneous peaks.
d. Loss of resolution.
e. Peak tailing or peak splitting that may result in inaccurate quantitation.
3. A drift in instrument sensitivity may occur during the 12-hour period and may be an indication of possible internal standard spiking problems. This could be discerned by examination of the internal standard area on Form 8A-OR for trends such as a continuous or near-continuous increase or decrease in the internal standard area over time.
E. Action
1. Use professional judgment to qualify the data if it is determined that system performance has degraded during sample analyses.
2. Note any degradation of system performance which significantly affected the data for EPA Regional CLP COR action.

Organic Data Review Low/Medium VOA
January 2017 101
XIV. Performance Evaluation Sample
A. Review Items
Form 1A-OR, TR/COC Record documentation, preparation logs, instrument printouts, and raw data. (SOW SOM02.4 – Exhibit B, Section 3.4 and Exhibit F, Section 4.1)
B. Objective
The objective is to determine the validity of the analytical results based on the recovery of the PE sample(s).
C. Criteria
1. Matrix-specific PE samples shall be analyzed utilizing the same analytical methods and Quality Assurance/Quality Control (QA/QC) procedures as employed for the samples, at a frequency to be determined by each EPA Region for each site. PE samples must be analyzed in an SDG containing field samples for the Case, using the same procedures, reagents, and instrumentation.
D. Evaluation
1. Verify, using Form 1A-OR, preparation logs, and raw data, that the PE samples were analyzed with the field samples and field blanks in the SDG.
2. Verify, using Form 1A-OR, that the PE sample results are within the warning limits (95% confidence interval) and action limits (99% confidence interval).
3. If a significant number (i.e., half or more) of the analytes in the PE samples fall outside of the 95% warning or 99% action criteria, or a number of false positive results are reported, evaluate the overall impact on the data.
E. Action
NOTE: If the PE sample criteria are not met, the laboratory performance and method accuracy are in question. Use professional judgment to determine if the data should be qualified or rejected. The following guidance is suggested for qualifying sample data associated with a PE sample that does not meet the required criteria.
For a PE sample that does not meet the technical criteria, apply the action to all samples in the same preparation batch. If the concentration of any analyte in a PE sample is not comparable to the analyte’s concentration in the field samples or field blanks (i.e., it is much higher or much lower than the concentration in these samples), the action may be applied to only those samples in which the analyte’s concentration is comparable to the PE sample concentration.
1. If the PE sample was not analyzed with the field samples and field blanks, use professional judgment to determine if the associated sample results should be qualified. Obtain additional information from the laboratory, if necessary. If a laboratory fails to analyze the PE sample(s) provided with field samples and field blanks, or if a laboratory consistently fails to generate acceptable PE sample results, record the situation in the Data Review Narrative, and note it for EPA Regional CLP COR action.
2. If the PE sample results are outside the lower warning limits but inside the lower action limits, qualify detects as estimated low (J-) and non-detects as estimated (UJ).
3. If the PE sample results are outside the lower action limits, qualify detects as estimated low (J-) and non-detects as unusable (R).
4. If the PE sample results are within the limits, detects and non-detects should not be qualified.
5. If the PE sample results are outside the upper warning limits but inside the upper action limits, qualify detects as estimated high (J+). Non-detects should not be qualified.

Organic Data Review Low/Medium VOA
January 2017 102
6. If the PE sample results are outside the upper action limits, qualify detects as estimated high (J+). Non-detects should not be qualified.
7. Annotate the potential effects on the data due to out-of-control PE sample results in the Data Review Narrative.
Table 30. PE Sample Actions for Low/Medium Volatile Analysis
Criteria Action
Detect Non-detect PE sample results outside lower warning limits but inside lower action limits J- UJ
PE sample results outside lower action limits J- R PE sample results within limits No qualification No qualification PE sample results outside upper warning limits but inside upper action limits J+ No qualification
PE sample results outside upper action limits J+ No qualification

Organic Data Review Low/Medium VOA
January 2017 103
XV. Regional Quality Assurance and Quality Control
A. Review Items
Form 1A-OR, chromatograms, TR/COC Record documentation, quantitation reports, and other raw data from QA/QC samples. (SOW SOM02.4 – Exhibit B, Sections 2.4 and 3.4)
B. Objective
The objective is to use results from the analysis of EPA Regional QA/QC samples such as field duplicates, blind spikes, and blind blanks to determine the validity of the analytical results.
C. Criteria
Criteria are determined by each EPA Region.
1. The frequency of EPA Regional QA/QC samples should be defined in the project QAPP.
2. Performance criteria for EPA Regional QA/QC samples should also be defined in the project QAPP.
3. The EPA Region may provide the laboratory with PE samples to be analyzed with each SDG. These samples may include blind spikes and/or blind blanks. The laboratory must analyze a PE sample when provided by the EPA Region. Refer to Section VI, above, for blanks criteria. Refer to Section XIV, above, for PE samples criteria.
4. The RPD between field duplicates shall fall with the specific limits in the EPA Region’s SOP or project QAPP.
D. Evaluation
1. Evaluation procedures must follow the EPA Region’s SOP for data review.
2. Determine whether the results of EPA Regional QA/QC samples impact all samples in the project or only those directly associated (i.e., in the same SDG, collected on the same day, prepared together, or contained in the same analytical sequence).
3. Calculate the RPD between field duplicates and provide this information in the Data Review Narrative. Also verify that the value falls within the specific limits in the EPA Region’s SOP or project QAPP.
4. Determine whether poor precision is the fault of the laboratory, or a result of sample non-homogeneity in the field. Laboratory observations of sample appearance may become important in these situations.
E. Action
1. Any action must be in accordance with EPA Regional specifications and the criteria for acceptable field duplicate sample results.
2. Note unacceptable results for field duplicate samples for EPA Regional CLP COR action.
3. In general, for EPA Regional QA/QC performance not within QAPP specification, qualify detects as estimated (J) and non-detects as estimated (UJ). The impact on overall data quality should be assessed after consultation with the data user and/or field personnel. Contact the EPA Regional CLP COR if reanalysis of samples is required.

Organic Data Review Low/Medium VOA
January 2017 104
XVI. Overall Assessment of Data
A. Review Items
Entire data package, data review results, and (if available) the QAPP and Sampling and Analysis Plan (SAP).
B. Objective
The objective is to provide the overall assessment on data quality and usability.
C. Criteria
1. Review all available materials to assess the overall quality of the data, keeping in mind the additive nature of analytical problems.
2. Reported analyte concentrations must be quantitated according to the appropriate equations, as listed in the method. All sample results must be within the linear calibration ranges per the methods.
D. Evaluation
Examine the raw data to verify that the correct calculation of the sample results was reported by the laboratory. Analysis logs, instrument printouts, etc., should be compared to the reported sample results recorded on the appropriate Organic Data Reporting Forms (Form 1A-OR through Form 8A-OR).
1. Evaluate any technical problems which have not been previously addressed.
2. Examine the raw data for any anomalies (e.g., baseline shift).
3. Verify that the appropriate method is used in sample analysis.
4. Verify that there are no transcription or reduction errors.
5. Verify that target analyte results fall within the calibrated ranges.
6. If appropriate information is available, use professional judgment to assess the usability of the data in order to assist the data user in avoiding inappropriate use of the data. Review all available information, including the QAPP (specifically the acceptance and performance criteria), SAP, and communication with the data user that concerns the intended use and desired quality of these data.
E. Action
1. Use professional judgment to determine if there is any need to qualify data which were not qualified based on the QC criteria previously discussed.
2. Use professional judgment to qualify sample results and non-detects if the MDL exceeds the CRQL.
3. If a sample is not diluted properly when sample results exceed the upper limit of the calibration range, qualify sample results as estimated (J).
4. Write a brief Data Review Narrative to give the user an indication of the limitations of the analytical data.
5. Note any inconsistency of the data with the SDG Narrative for EPA Regional CLP COR action. If sufficient information on the intended use and required quality of the data is available, include an assessment of the usability of the data within the given context. This may be used as part of a formal Data Quality Assessment (DQA).

Organic Data Review Semivolatiles
January 2017 105
SEMIVOLATILE DATA REVIEW
The Semivolatile (SVOA) organic data requirements to be reviewed during validation are listed below:
I. Preservation and Holding Times ................................................................................................... 107
II. Gas Chromatograph/Mass Spectrometer Instrument Performance Check .................................... 111
III. Initial Calibration ........................................................................................................................... 119
IV. Initial Calibration Verification ...................................................................................................... 126
V. Continuing Calibration Verification .............................................................................................. 129
VI. Blanks ............................................................................................................................................ 132
VII. Deuterated Monitoring Compound ................................................................................................ 135
VIII. Matrix Spike/Matrix Spike Duplicate ............................................................................................ 139
IX. Gel Permeation Chromatography Performance Check .................................................................. 141
X. Internal Standard ........................................................................................................................... 143
XI. Target Analyte Identification......................................................................................................... 146
XII. Target Analyte Quantitation and Reported Contract Required Quantitation Limit ....................... 148
XIII. Tentatively Identified Compounds ................................................................................................ 150
XIV. System Performance ...................................................................................................................... 153
XV. Performance Evaluation Sample ................................................................................................... 154
XVI. Regional Quality Assurance and Quality Control ......................................................................... 156
XVII. Overall Assessment of Data .......................................................................................................... 157
Organic Data Review Semivolatiles
January 2017 106
This page is intentionally left blank.

Organic Data Review Semivolatiles
January 2017 107
I. Preservation and Holding Times
A. Review Items
Form 1A-OR, Form 1B-OR, Traffic Report/Chain of Custody (TR/COC) Record documentation, Form DC-1, raw data, sample extraction sheets, and the Sample Delivery Group (SDG) Narrative checking for: pH, shipping container temperature, holding time, and other sample conditions. (SOW SOM02.4 – Exhibit B, Section 3.4; Exhibit D/Introduction, Section 5.0; Exhibit D/General, Sections 8.0, 10.1.2.1, and 10.2.2.4.4; and Exhibit D/SVOA, Section 8.0)
B. Objective
The objective is to determine the validity of the analytical results based on the sample conditions and the holding time of the sample.
C. Criteria
1. The extraction technical holding time is determined from the date of sample collection to the date of sample extraction for aqueous and non-aqueous (soil and sediment) samples that are not designated for Toxicity Characteristic Leaching Procedure (TCLP)/Synthetic Precipitation Leachate Procedure (SPLP) procedures. The extraction technical holding time for samples designated for TCLP/SPLP is determined from the date of sample collection to the date of TCLP/SPLP extraction.
2. For TCLP/SPLP leachate samples, extraction technical holding time is determined from the date of TCLP/SPLP procedure completion to the date of the leachate sample extraction by the specified preparation methods for aqueous samples. The analysis technical holding time is determined from the date of sample extraction completion to the date of sample analysis.
3. Samples should be in proper condition with shipping container temperatures at ≤ 6ºC upon receipt at the laboratory. All aqueous and non-aqueous samples shall be protected from light and refrigerated at ≤ 6ºC (but not frozen) from the time of receipt at the laboratory. Sample extracts shall be stored at ≤ 6ºC (but not frozen) from the time of the extraction completion until analysis.
4. The extraction technical holding time criteria for aqueous samples, TCLP/SPLP aqueous filtrate samples, and TCLP/SPLP leachate samples that are properly preserved is 7 days.
5. The extraction technical holding time criteria for soil/sediment samples designated for TCLP/SPLP is 14 days.
6. The extraction technical holding time criteria for non-aqueous samples that are properly preserved is 14 days.
7. The analysis technical holding time criteria for extracts, including TCLP/SPLP leachate and aqueous filtrate sample extracts, is 40 days.
D. Evaluation
1. Review the SDG Narrative and the TR/COC Record documentation to determine if the samples are received intact and iced. If there is an indication of problems with the samples, the sample integrity may be compromised.
2. Verify that the extraction dates and the analysis dates for samples on Form 1A-OR, Form 1B-OR, and the raw data are identical.
3. Establish extraction technical holding times for samples, excluding TCLP/SPLP leachate samples, by comparing the sample collection dates on the TR/COC Record documentation with the dates of extraction on Form 1A-OR, Form 1B-OR, and the sample extraction sheets.
4. Establish extraction technical holding times for TCLP/SPLP leachate samples by comparing the sample collection dates on the TR/COC Record documentation with the dates of extraction on sample extraction sheets.
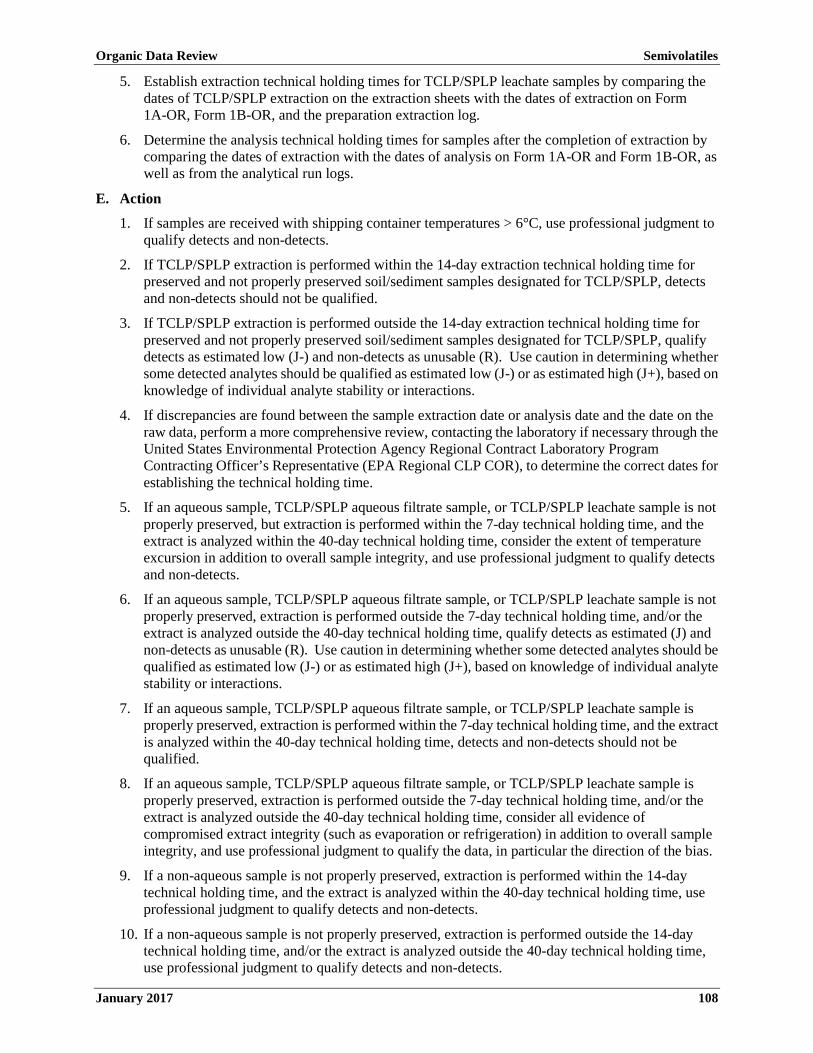
Organic Data Review Semivolatiles
January 2017 108
5. Establish extraction technical holding times for TCLP/SPLP leachate samples by comparing thedates of TCLP/SPLP extraction on the extraction sheets with the dates of extraction on Form1A-OR, Form 1B-OR, and the preparation extraction log.
6. Determine the analysis technical holding times for samples after the completion of extraction bycomparing the dates of extraction with the dates of analysis on Form 1A-OR and Form 1B-OR, aswell as from the analytical run logs.
E. Action
1. If samples are received with shipping container temperatures > 6°C, use professional judgment toqualify detects and non-detects.
2. If TCLP/SPLP extraction is performed within the 14-day extraction technical holding time forpreserved and not properly preserved soil/sediment samples designated for TCLP/SPLP, detectsand non-detects should not be qualified.
3. If TCLP/SPLP extraction is performed outside the 14-day extraction technical holding time forpreserved and not properly preserved soil/sediment samples designated for TCLP/SPLP, qualifydetects as estimated low (J-) and non-detects as unusable (R). Use caution in determining whethersome detected analytes should be qualified as estimated low (J-) or as estimated high (J+), based onknowledge of individual analyte stability or interactions.
4. If discrepancies are found between the sample extraction date or analysis date and the date on theraw data, perform a more comprehensive review, contacting the laboratory if necessary through theUnited States Environmental Protection Agency Regional Contract Laboratory ProgramContracting Officer’s Representative (EPA Regional CLP COR), to determine the correct dates forestablishing the technical holding time.
5. If an aqueous sample, TCLP/SPLP aqueous filtrate sample, or TCLP/SPLP leachate sample is notproperly preserved, but extraction is performed within the 7-day technical holding time, and theextract is analyzed within the 40-day technical holding time, consider the extent of temperatureexcursion in addition to overall sample integrity, and use professional judgment to qualify detectsand non-detects.
6. If an aqueous sample, TCLP/SPLP aqueous filtrate sample, or TCLP/SPLP leachate sample is not properly preserved, extraction is performed outside the 7-day technical holding time, and/or the extract is analyzed outside the 40-day technical holding time, qualify detects as estimated (J) and non-detects as unusable (R). Use caution in determining whether some detected analytes should be qualified as estimated low (J-) or as estimated high (J+), based on knowledge of individual analyte stability or interactions.
7. If an aqueous sample, TCLP/SPLP aqueous filtrate sample, or TCLP/SPLP leachate sample isproperly preserved, extraction is performed within the 7-day technical holding time, and the extractis analyzed within the 40-day technical holding time, detects and non-detects should not bequalified.
8. If an aqueous sample, TCLP/SPLP aqueous filtrate sample, or TCLP/SPLP leachate sample is properly preserved, extraction is performed outside the 7-day technical holding time, and/or the extract is analyzed outside the 40-day technical holding time, consider all evidence of compromised extract integrity (such as evaporation or refrigeration) in addition to overall sample integrity, and use professional judgment to qualify the data, in particular the direction of the bias.
9. If a non-aqueous sample is not properly preserved, extraction is performed within the 14-daytechnical holding time, and the extract is analyzed within the 40-day technical holding time, useprofessional judgment to qualify detects and non-detects.
10. If a non-aqueous sample is not properly preserved, extraction is performed outside the 14-day technical holding time, and/or the extract is analyzed outside the 40-day technical holding time, use professional judgment to qualify detects and non-detects.

Organic Data Review Semivolatiles
January 2017 109
11. If a non-aqueous sample is properly preserved, extraction is performed within the 14-day technicalholding time, and the extract is analyzed within the 40-day technical holding time, detects andnon-detects should not be qualified.
12. If a non-aqueous sample is properly preserved, extraction is performed outside the 14-day technical holding time, and/or the extract is analyzed outside the 40-day technical holding time, qualify detects as estimated low (J-) and non-detects as unusable (R). Use caution in determining whether some detected analytes should be qualified as estimated low (J-) or as estimated high (J+), based on knowledge of individual analyte stability or interactions.
13. Note the effect of exceeding the holding time on the resulting data in the Data Review Narrative,whenever possible.
14. If technical holding times are grossly exceeded, qualify detects as estimated low (J-) and useprofessional judgment to qualify non-detects as unusable (R). Note this for EPA Regional CLPCOR action. Annotate the effect of the holding time exceedance on the resulting data in the DataReview Narrative, whenever possible.
Table 31. Preservation and Holding Time Actions for Semivolatile Analysis
Matrix Preserved Criteria Action
Detect Non-detect
Aqueous
No
≤ 7 days (for extraction) and ≤ 40 days (for analysis)
Use professional judgment
Use professional judgment
TCLP/SPLP aqueous filtrate sample and TCLP/SPLP leachate sample extracted within the 7-day technical holding time
No
> 7 days (for extraction) > 40 days (for analysis)
and/or
J R TCLP/SPLP aqueous filtrate sample and TCLP/SPLP leachate sample not extracted within the 7-day technical holding time
Yes
≤ 7 days (for extraction) and ≤ 40 days (for analysis)
No qualification No qualification TCLP/SPLP aqueous filtrate sample and TCLP/SPLP leachate sample extracted within the 7-day technical holding time
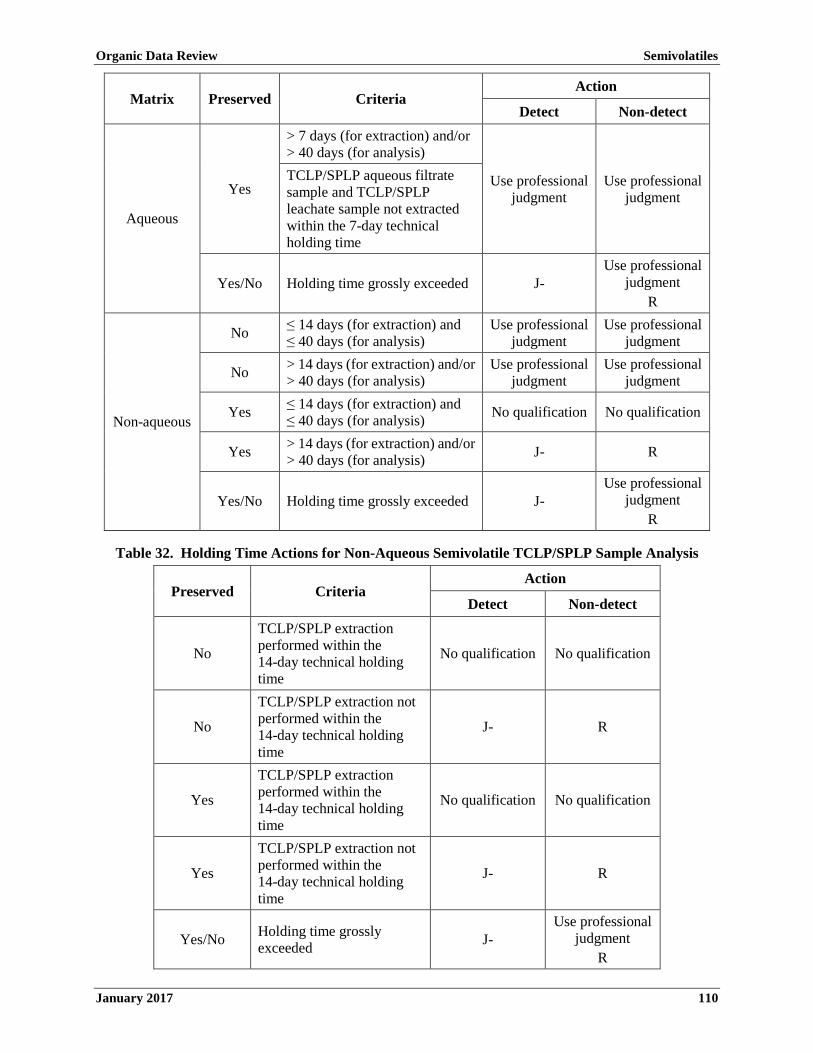
Organic Data Review Semivolatiles
January 2017 110
Matrix Preserved Criteria Action
Detect Non-detect
Aqueous
Yes
> 7 days (for extraction) > 40 days (for analysis)
and/or
Use professional judgment
Use professional judgment
TCLP/SPLP aqueous filtrate sample and TCLP/SPLP leachate sample not extracted within the 7-day technical holding time
Yes/No Holding time grossly exceeded J- Use professional
judgment R
Non-aqueous
No ≤ ≤
14 days (for extraction) and 40 days (for analysis)
Use professional judgment
Use professional judgment
No > 14 days (for extraction) > 40 days (for analysis)
and/or Use professional judgment
Use professional judgment
Yes ≤ ≤
14 days (for extraction) and 40 days (for analysis) No qualification No qualification
Yes > 14 days (for extraction) > 40 days (for analysis)
and/or J- R
Yes/No Holding time grossly exceeded J- Use professional
judgment R
Table 32. Holding Time Actions for Non-Aqueous Semivolatile TCLP/SPLP Sample Analysis
Action Preserved Criteria
Detect Non-detect
No
TCLP/SPLP extraction performed within the 14-day technical holding time
No qualification No qualification
No
TCLP/SPLP extraction not performed within the 14-day technical holding time
J- R
Yes
TCLP/SPLP extraction performed within the 14-day technical holding time
No qualification No qualification
Yes
TCLP/SPLP extraction not performed within the 14-day technical holding time
J- R
Yes/No Holding time grossly exceeded J-
Use professional judgment
R

Organic Data Review Semivolatiles
January 2017 111
II. Gas Chromatograph/Mass Spectrometer Instrument Performance Check
A. Review Items
Form 5-OR, decafluorotriphenylphosphine (DFTPP) mass spectra, and mass listing. (SOW SOM02.4 – Exhibit B, Section 3.4 and Exhibit D/SVOA, Section 9.2)
B. Objective
The objective of performing Gas Chromatograph/Mass Spectrometer (GC/MS) instrument performance checks is to ensure adequate mass resolution, identification, and to some degree, sensitivity, and to document this level of performance prior to analyzing any sequence of standards or samples.
C. Criteria
NOTE: This requirement does not apply when samples are analyzed by the Selected Ion Monitoring (SIM) technique.
1. A sufficient amount of the instrument performance check solution (50 ng DFTPP on-column) must be analyzed at the specified frequency and sequence. It must be injected once at the beginning of each 12-hour period, during which samples, blanks, or standards are to be analyzed. The 12-hour period begins with the injection of DFTPP; however, in cases where a closing Continuing Calibration Verification (CCV) can be used as an opening CCV, the 12-hour period begins with the injection of the opening CCV.
Listed below are examples of acceptable analytical sequences incorporating the use of the opening and/or closing CCV. Use these examples as a guide for the possible analytical sequences that can be expected.
Conditions for When Example Sequence is
Appropriate:
Acceptable Criteria That Must Be Met: Notes:
Use Example 1 if time remains on the 12-hour clock after the initial calibration sequence.
• DFTPP tunes meet instrument performance criteria.
• The five Initial Calibration standards meet initial calibration criteria.
• Initial Calibration Verification (ICV) meets ICV criteria.
• CCV A meets both opening and closing CCV criteria.
• CCV B meets closing CCV criteria.
The requirement of starting the new 12-hour clock for Analytical Sequence 2 with a new DFTPP tune is waived if CCV A meets opening CCV criteria. If CCV B meets opening CCV criteria, a method blank and subsequent samples may be analyzed immediately after CCV B.
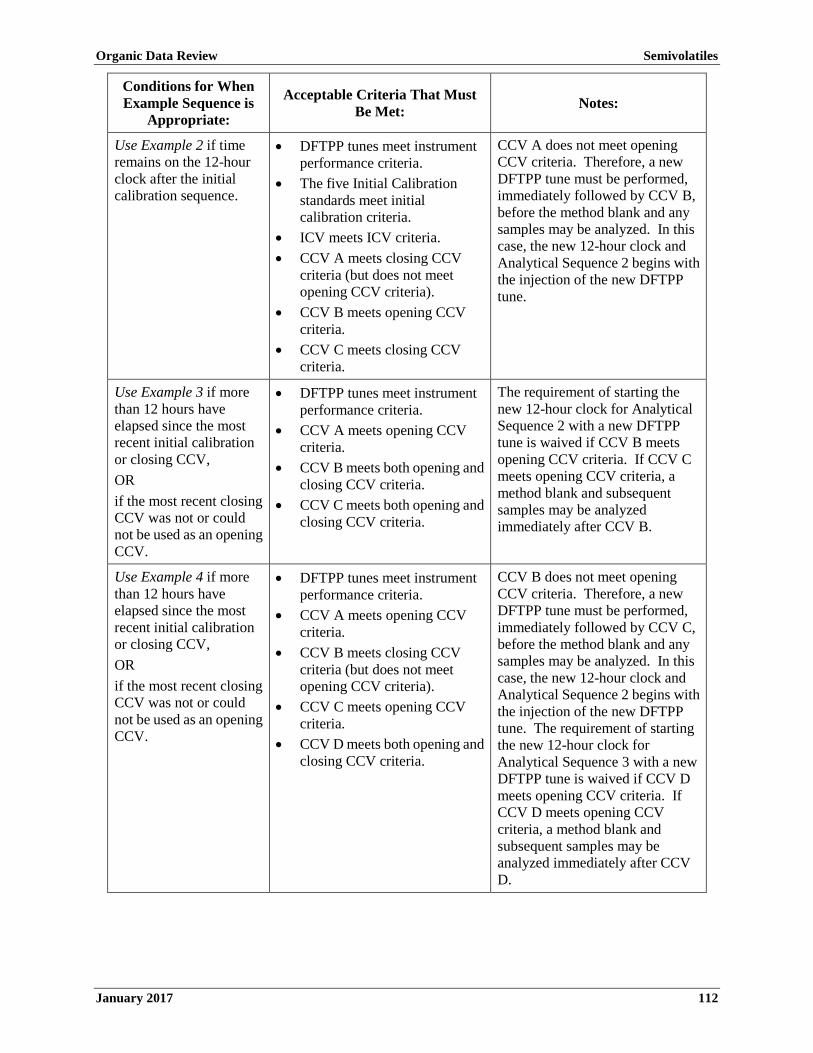
Organic Data Review Semivolatiles
January 2017 112
Conditions for When Example Sequence is
Appropriate:
Acceptable Criteria That Must Be Met: Notes:
Use Example 2 if time remains on the 12-hour clock after the initial calibration sequence.
• DFTPP tunes meet instrument performance criteria.
• The five Initial Calibration standards meet initial calibration criteria.
• ICV meets ICV criteria. • CCV A meets closing CCV
criteria (but does not meet opening CCV criteria).
• CCV B meets opening CCV criteria.
• CCV C meets closing CCV criteria.
CCV A does not meet opening CCV criteria. Therefore, a new DFTPP tune must be performed, immediately followed by CCV B, before the method blank and any samples may be analyzed. In this case, the new 12-hour clock and Analytical Sequence 2 begins with the injection of the new DFTPP tune.
Use Example 3 if more than 12 hours have elapsed since the most recent initial calibration or closing CCV, OR if the most recent closing CCV was not or could not be used as an opening CCV.
• DFTPP tunes meet instrument performance criteria.
• CCV A meets opening CCV criteria.
• CCV B meets both opening and closing CCV criteria.
• CCV C meets both opening and closing CCV criteria.
The requirement of starting the new 12-hour clock for Analytical Sequence 2 with a new DFTPP tune is waived if CCV B meets opening CCV criteria. If CCV C meets opening CCV criteria, a method blank and subsequent samples may be analyzed immediately after CCV B.
Use Example 4 if more than 12 hours have elapsed since the most recent initial calibration or closing CCV, OR if the most recent closing CCV was not or could not be used as an opening CCV.
• DFTPP tunes meet instrument performance criteria.
• CCV A meets opening CCV criteria.
• CCV B meets closing CCV criteria (but does not meet opening CCV criteria).
• CCV C meets opening CCV criteria.
• CCV D meets both opening and closing CCV criteria.
CCV B does not meet opening CCV criteria. Therefore, a new DFTPP tune must be performed, immediately followed by CCV C, before the method blank and any samples may be analyzed. In this case, the new 12-hour clock and Analytical Sequence 2 begins with the injection of the new DFTPP tune. The requirement of starting the new 12-hour clock for Analytical Sequence 3 with a new DFTPP tune is waived if CCV D meets opening CCV criteria. If CCV D meets opening CCV criteria, a method blank and subsequent samples may be analyzed immediately after CCV D.
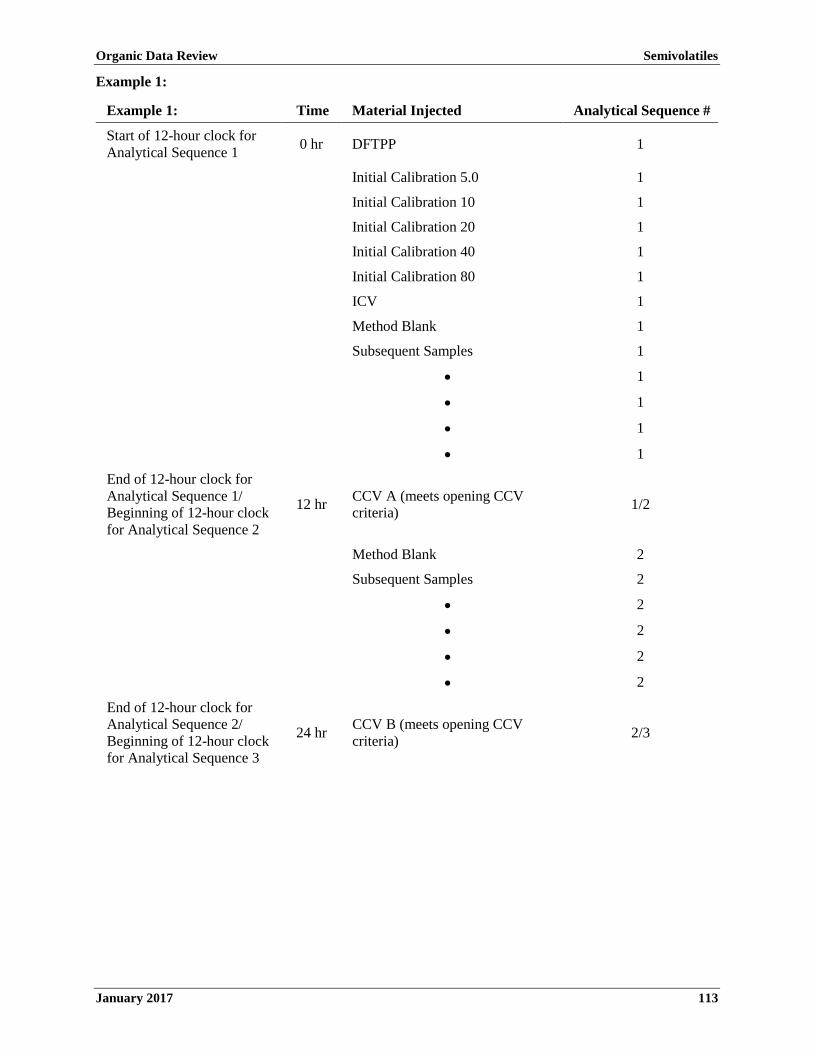
Organic Data Review Semivolatiles
January 2017 113
Example 1:
Example 1: Time Material Injected Analytical Sequence #
Start of 12-hour clock for Analytical Sequence 1 0 hr DFTPP 1
Initial Calibration 5.0 1
Initial Calibration 10 1
Initial Calibration 20 1
Initial Calibration 40 1
Initial Calibration 80 1
ICV 1
Method Blank 1
Subsequent Samples 1
• 1
• 1
• 1
• 1
End of 12-hour clock for Analytical Sequence 1/ Beginning of 12-hour clock for Analytical Sequence 2
12 hr CCV A (meets opening CCVcriteria) 1/2
Method Blank 2
Subsequent Samples 2
• 2
• 2
• 2
• 2
End of 12-hour clock for Analytical Sequence 2/ Beginning of 12-hour clock for Analytical Sequence 3
24 hr CCV B (meets opening CCVcriteria) 2/3

Organic Data Review Semivolatiles
January 2017 114
Example 2:
Example 2: Time Material Injected Analytical Sequence #
Start of 12-hour clock for Analytical Sequence 1 0 hr DFTPP 1
Initial Calibration 5.0 1
Initial Calibration 10 1
Initial Calibration 20 1
Initial Calibration 40 1
Initial Calibration 80 1
ICV 1
Method Blank 1
Subsequent Samples 1
• 1
• 1
• 1
• 1
End of 12-hour clock for Analytical Sequence 1 12 hr
CCV A (meets closing CCV criteria, fails opening CCV criteria)
1
Beginning of 12-hour clock for Analytical Sequence 2 13 hr DFTPP 2
CCV B (meets opening CCV criteria) 2
Method Blank 2
Subsequent Samples 2
• 2
• 2
• 2
• 2
End of 12-hour clock for Analytical Sequence 2 25 hr CCV C (meets closing CCV
criteria) 2
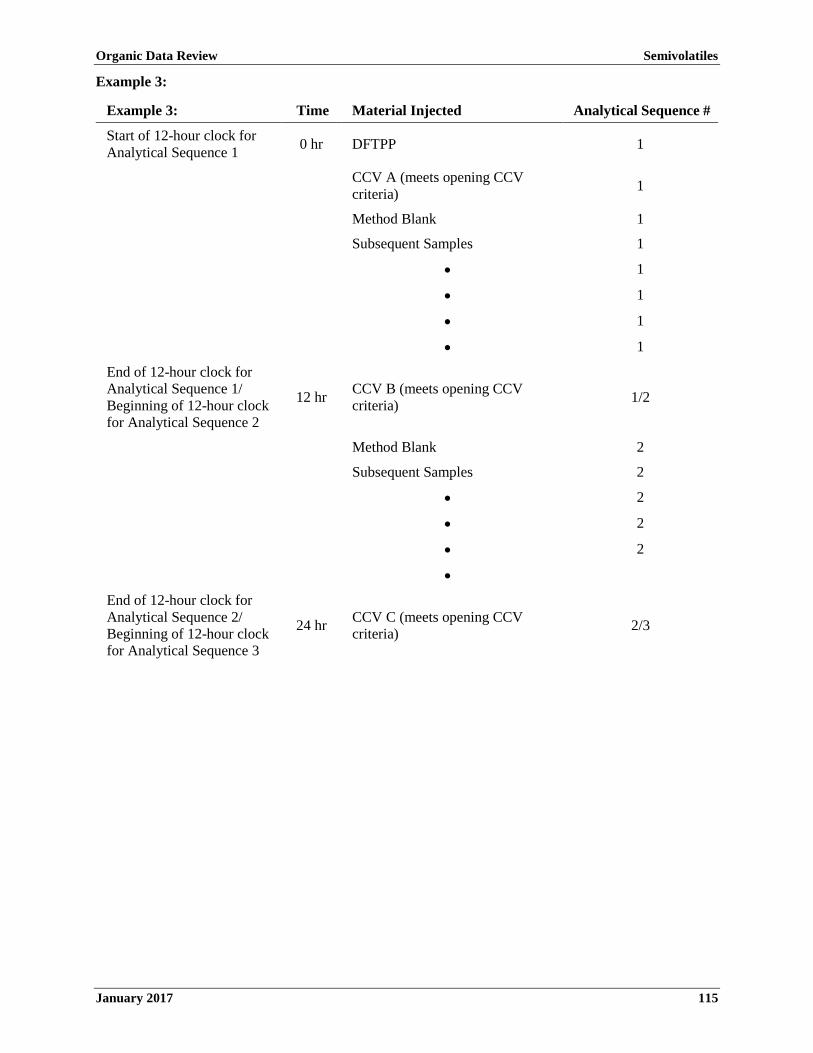
Organic Data Review Semivolatiles
January 2017 115
Example 3:
Example 3: Time Material Injected Analytical Sequence #
Start of 12-hour clock for Analytical Sequence 1 0 hr DFTPP 1
CCV A (meets opening CCV criteria) 1
Method Blank 1
Subsequent Samples 1
• 1
• 1
• 1
• 1
End of 12-hour clock for Analytical Sequence 1/ Beginning of 12-hour clock for Analytical Sequence 2
12 hr CCV B (meets opening CCV criteria) 1/2
Method Blank 2
Subsequent Samples 2
• 2
• 2
• 2
•
End of 12-hour clock for Analytical Sequence 2/ Beginning of 12-hour clock for Analytical Sequence 3
24 hr CCV C (meets opening CCV criteria) 2/3
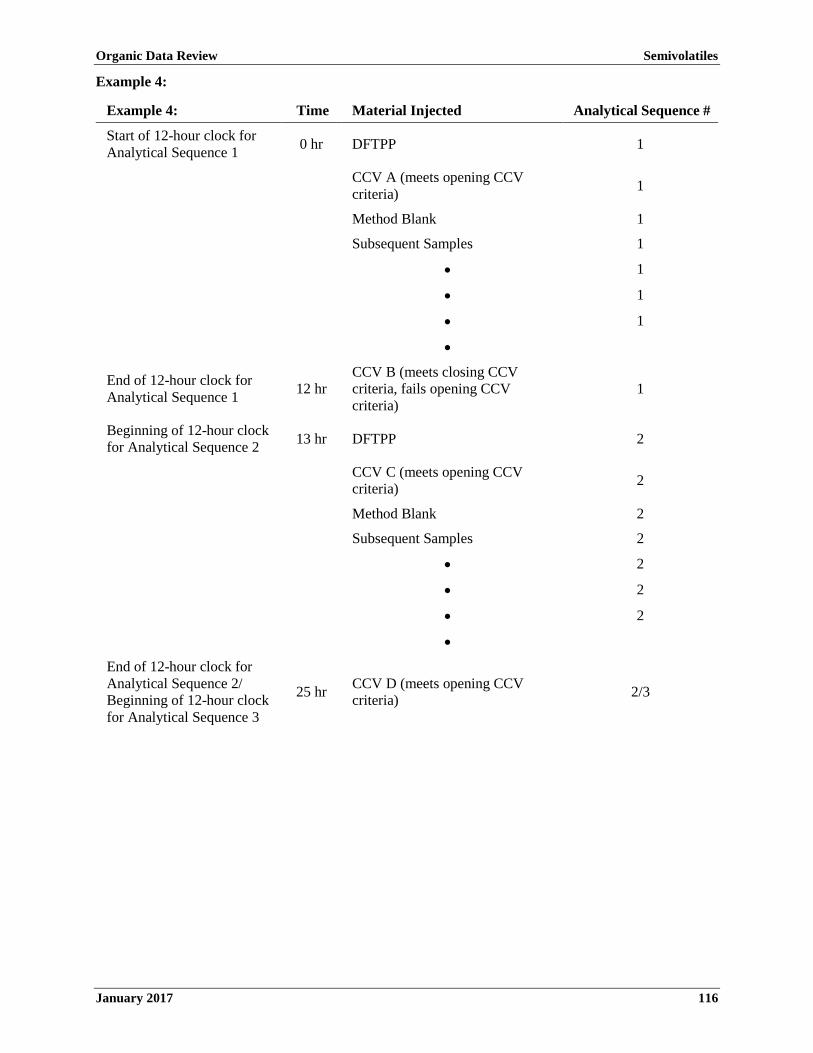
Organic Data Review Semivolatiles
January 2017 116
Example 4:
Example 4: Time Material Injected Analytical Sequence #
Start of 12-hour clock for Analytical Sequence 1 0 hr DFTPP 1
CCV A (meets opening CCV criteria) 1
Method Blank 1
Subsequent Samples 1
• 1
• 1
• 1
•
End of 12-hour clock for Analytical Sequence 1 12 hr
CCV B (meets closing CCV criteria, fails opening CCV criteria)
1
Beginning of 12-hour clock for Analytical Sequence 2 13 hr DFTPP 2
CCV C (meets opening CCV criteria) 2
Method Blank 2
Subsequent Samples 2
• 2
• 2
• 2
•
End of 12-hour clock for Analytical Sequence 2/ Beginning of 12-hour clock for Analytical Sequence 3
25 hr CCV D (meets opening CCVcriteria) 2/3

Organic Data Review Semivolatiles
January 2017 117
2. The DFTPP instrument performance check must meet the ion abundance criteria listed in Table 33.
Table 33. Ion Abundance Criteria for DFTPP
Mass Ion Abundance Criteria
51 10.0 - 80.0% of mass 198
68 Less than 2.0% of mass 69
69 Present
70 Less than 2.0% of mass 69
127 10.0 - 80.0% of mass 198
197 Less than 2.0% of mass 198
198 Base peak, 100% relative abundance*
199 5.0 - 9.0% of mass 198
275 10.0 - 60.0% of mass 198
365 Greater than 1.0% of mass 198
441 Present, but less than mass 443
442 Greater than 50.0% of mass 198
443 15.0 - 24.0% of mass 442
* All ion abundances must be normalized to m/z 198, the nominal base peak, even though the ionabundance of m/z 442 may exceed that of m/z 198.
D. Evaluation
1. Verify that the DFTPP Instrument Performance Check is analyzed at the specified frequency andsequence.
2. Compare the data presented on Form 5-OR for each Instrument Performance Check with each masslisting submitted to ensure the following:
a. Form 5-OR is present and completed for each required DFTPP at the specified frequency.
b. The laboratory has not made transcription errors between the data and the form. If there aremajor differences between the mass listing and Forms 5-OR, a more in-depth review of the datais required. This may include obtaining and reviewing additional information from thelaboratory.
c. The appropriate number of significant figures has been reported (number of significant figuresgiven for each ion in the Ion Abundance Criteria column) and that rounding is correct.
d. The laboratory has not made any calculation errors.
3. Verify from the raw data (mass listing) that the mass assignment is correct and that the mass listingis normalized to m/z 198.
4. Verify that the ion abundance criteria are met. The ion abundance for m/z 68, 70, 441, and 443 arecalculated by normalizing to the specified m/z. The critical ion abundance criteria for DFTPP arethe relative abundance ratios of m/z 198/199 and 442/443. For the ions at m/z 51, 127, and 275, theactual relative abundance is not as critical. The relative abundance of m/z 365 is present and> 1.0%.

Organic Data Review Semivolatiles
January 2017 118
5. If possible, verify that spectra are generated using appropriate background subtraction techniques.Since the DFTPP spectrum is obtained from chromatographic peaks that should be free fromco-elution problems, background subtraction should be performed in accordance with thefollowing procedure:
a. Three scans (the peak apex scan and the scans immediately preceding and following the apex)are acquired and averaged.
b. Background subtraction must be accomplished using a single scan acquired within 20 scans ofthe elution of DFTPP, but the DFTPP peak must not be subtracted as part of the background.
NOTE: All mass spectrometer instrument conditions must be identical to those used for sample analysis. Background subtraction actions resulting in spectral distortions for the sole purpose of meeting the method specifications are contrary to the Quality Assurance (QA) objectives, and are therefore unacceptable.
NOTE: For data obtained from the CLP, information regarding noncompliant DFTPP instrument performance check can be obtained from the National Functional Guidelines (NFG) reports and may be used as part of the evaluation process.
E. Action
1. If the instrument performance check is not analyzed at the specified frequency and sequence,qualify detects and non-detects in the associated samples as unusable (R). The EPA Regional CLPCOR should be contacted to arrange for reanalysis of all affected samples.
a. In the event that samples cannot be reanalyzed, examine all calibrations associated with thesequence to evaluate whether proper qualitative criteria were achievable. If so, it may bepossible to salvage usable data from the sequence. Otherwise, qualify the data as unusable (R).
2. If minor transcription errors are found to be insignificant to data quality and can be corrected on acopy of the form, no further action is required.
3. If the laboratory failed to provide the correct forms, or if significant transcription or calculationerrors are found, notify the EPA Regional CLP COR, who may contact the laboratory to request thenecessary information. If the information is not available, use professional judgment to assess thedata, and notify the EPA Regional CLP COR.
4. If the mass assignment is in error (e.g., m/z 197 is indicated as the base peak rather than m/z 198),qualify detects and non-detects in the associated samples as unusable (R).
5. If the ion abundance criteria in Table 33 are not met, use professional judgment to qualify detectsand non-detects in the associated samples.
6. If the ion abundance criteria is not met for ions at m/z 51, 127, and 275, detects and non-detectsshould not be qualified.
7. If the ion abundance at m/z 365 is zero, minimum detection limits may be affected. On the otherhand, if m/z 365 is present, but ion abundance is < 1.0%, detects and non-detects should not bequalified.
8. Annotate decisions to use analytical data associated with noncompliant DFTPP instrumentperformance checks in the Data Review Narrative.
9. If instrument performance check criteria are achieved using alternate techniques other thandescribed in Section II.D.5, obtain additional information to evaluate the performance andprocedures. Note any concerns or questions for EPA Regional CLP COR action.
For example, the issue shall be noted for the EPA Regional CLP COR when an inappropriatetechnique such as background subtracting from the solvent front or from another region of thechromatogram rather than from the DFTPP peak is used to obtain background subtraction.

Organic Data Review Semivolatiles
January 2017 119
III. Initial Calibration
A. Review Items
Form 6A-OR, quantitation reports, and chromatograms. (SOW SOM02.4 – Exhibit B, Section 3.4 and Exhibit D/SVOA, Sections 7.2.2.1 and 9.3)
B. Objective
The objective of initial calibration (ICAL) is to ensure that the instrument is capable of producing acceptable qualitative and quantitative data.
C. Criteria
1. ICAL shall be performed at the specified frequency and sequence. Each GC/MS system must be calibrated with a minimum of five concentrations to determine instrument sensitivity and the linearity of GC/MS response for the purgeable target analytes and Deuterated Monitoring Compounds (DMCs).
a. ICAL standards must be analyzed prior to any analysis of the ICV, samples, and required blanks, and within 12 hours of the associated instrument performance check at the beginning of each analytical sequence, or as necessary if the CCV acceptance criteria are not met.
b. ICAL standards must contain all required target analytes and DMCs at specified concentrations. The calibration standards are to be prepared at 5.0, 10, 20, 40, and 80 ng/µL for each target analyte and associated DMCs, except 1,4-Dioxane, twenty-one target analytes and six DMCs listed in Section C.1.c, and DMC 1,4-Dioxane-d8. For 1,4-Dioxane and 1,4-Dioxane-d8, the calibration standard concentrations are at 2.0, 4.0, 8.0, 16, and 32 ng/ µL.
c. The ICAL standard concentrations are at 10, 20, 40, 80, and 160 ng/µL for twenty-one target analytes and six DMCs: Benzaldehyde, Phenol, Bis(2-chloroethyl) ether, 2-Methylphenol, 2,2'-Oxybis(1-chloropropane), Acetophenone, 4-Chloroaniline, Caprolactam, Hexachlorocyclopentadiene, Atrazine, Carbazole, Fluoranthene, 3,3'-Dichlorobenzidine, Di-n-octylphthalate, 2,4-Dinitrophenol, PCP, 4-Methylphenol, 4,6-Dinitro-2-methylphenol, 3-Nitroaniline, 4-Nitroaniline, 4-Nitrophenol, Phenol-d5, Bis(2-chloroethyl) ether-d8, 4-Methylphenol-d8, 4-Chloroaniline-d4, 4-Nitrophenol-d4, and 4,6-Dinitro-2-methylphenol-d2. For the optional analysis of Polycyclic Aromatic Hydrocarbons (PAHs) and PCP using the SIM technique, the calibration standard concentrations are at 0.10, 0.20, 0.40, 0.80, and 1.6 ng/µL for each target analyte of interest and the associated DMCs. PCP concentrations are at 0.20, 0.40, 0.80, 1.6, and 3.2 ng/µL.
2. The Relative Response Factor (RRF), Mean RRF (RRF������), and Percent Relative Standard Deviation (%RSD) must be calculated for each target analyte and DMC accordingly.
3. The RRF for each target analyte and DMC in each ICAL standard must be ≥ Minimum RRF value in Table 34.
4. The %RSD of the ICAL RRF for each target analyte and DMC must be ≤ Maximum %RSD value in Table 34.
NOTE: The technical acceptance criteria specified in a “Request for Quote (RFQ) for Solicitation” of a Modified Analysis may impact some of the preceding evaluation criteria. A copy of this document should be present in the Complete SDG File (CSF), when applicable.
D. Evaluation
1. Verify that the ICAL is performed at the specified frequency and sequence.
2. Verify that the correct concentrations of the target analytes and DMCs are used in each ICAL standard.
Organic Data Review Semivolatiles
January 2017 120
3. Verify that the RRF, RRF������, and %RSD for each target analyte and DMC are reported on Form 6A-OR. Recalculate the RRFs, RRF������s, and %RSDs for at least one target analyte and DMC associated with each internal standard, and verify that the recalculated values agree with the laboratory reported values on Form 6A-OR.
4. Verify that the RRF is ≥ Minimum RRF value in Table 34 for each target analyte and DMC.
5. Verify that the %RSD is ≤ Maximum %RSD value in Table 34 for each target analyte and DMC.
NOTE: For data obtained from the CLP, information regarding noncompliant ICAL can be obtained from the NFG reports and may be used as part of the evaluation process.
E. Action
1. If the ICAL is not performed at the specified frequency and sequence, use professional judgment to qualify detects and non-detects in the associated samples as unusable (R).
2. If the ICAL is not performed at the specified concentrations, qualify detects in the associated samples as estimated (J) and non-detects in the associated samples as estimated (UJ).
3. If errors are detected in the calculations of the RRFs, RRF������s, or %RSDs, perform a more comprehensive recalculation.
4. If the RRF is < Minimum RRF value in Table 34 for any target analyte, use professional judgment to qualify detects in the associated samples as estimated high (J+) or unusable (R), and non-detects in the associated samples as unusable (R).
5. If the RRF is ≥ Minimum RRF value in Table 34 for any target analyte, detects and non-detects in the associated samples should not be qualified.
6. If the %RSD is > Maximum %RSD value in Table 34 for any target analyte, qualify detects in the associated samples as estimated (J). Use professional judgment to qualify non-detects in the associated samples.
7. If the %RSD is ≤ Maximum %RSD value in Table 34 for any target analyte, detects and non-detects in the associated samples should not be qualified.
8. No qualification of the data is necessary based on the DMC RRF, RRF������, and %RSD data alone. Use professional judgment to evaluate the DMC RRF, RRF������, and %RSD data in conjunction with the DMC recoveries to determine the need for data qualification.
9. Based on the project-specific Data Quality Objectives (DQOs), a more in-depth review may be necessary. The following guidelines are recommended:
a. If the %RSD criteria of any target analytes are not met and the %RSD criteria are still not satisfied after eliminating either the high or the low-point of the ICAL:
i. Qualify detects in the associated samples as estimated (J).
ii. Use professional judgment to qualify non-detects in the associated samples.
b. If the high-point of the ICAL curve is outside of the %RSD criteria (e.g., due to saturation):
i. Qualify detects in the associated samples with analyte concentrations greater than the high-point concentration as estimated (J).
ii. Detects in the associated samples with analyte concentrations within the calibration range should not be qualified.
iii. Non-detects in the associated samples should not be qualified.

Organic Data Review Semivolatiles
January 2017 121
c. If the low-point of the ICAL curve is outside of the %RSD criteria:
i. Qualify detects in the associated samples with analyte concentrations in the non-linearrange as estimated (J).
ii. Detects in the associated samples with analyte concentrations within the calibration rangeshould not be qualified.
iii. For non-detects in the associated samples, use the lowest point of the linear portion of theICAL curve to determine the new quantitation limit.
10. If the laboratory failed to provide adequate calibration information, notify the EPA Regional CLPCOR, who may contact the laboratory to request the necessary information. If the information isnot available, use professional judgment to assess the data.
11. Annotate the potential effects on the reported data due to exceeding the ICAL criteria in the DataReview Narrative.
12. If the ICAL criteria are grossly exceeded, note this for EPA Regional CLP COR action.
Table 34. RRF, %RSD, and %D Acceptance Criteria in Initial Calibration, ICV, and CCV for Semivolatile Analysis
Analyte Minimum RRF
Maximum %RSD
ICV/Opening CCV
Maximum %D1
Closing CCV
Maximum %D
1,4-Dioxane 0.010 40.0 ±40.0 ±50.0
Benzaldehyde 0.100 40.0 ±40.0 ±50.0
Phenol 0.080 20.0 ±20.0 ±25.0
Bis(2-chloroethyl) ether 0.100 20.0 ±20.0 ±25.0
2-Chlorophenol 0.200 20.0 ±20.0 ±25.0 2-Methylphenol 0.010 20.0 ±20.0 ±25.0
3-Methylphenol 0.010 20.0 ±20.0 ±25.0
2,2'-Oxybis-(1-chloropropane) 0.010 20.0 ±25.0 ±50.0
Acetophenone 0.060 20.0 ±20.0 ±25.0
4-Methylphenol 0.010 20.0 ±20.0 ±25.0
N-Nitroso-di-n-propylamine 0.080 20.0 ±25.0 ±25.0
Hexachloroethane 0.100 20.0 ±20.0 ±25.0
Nitrobenzene 0.090 20.0 ±20.0 ±25.0 Isophorone 0.100 20.0 ±20.0 ±25.0
2-Nitrophenol 0.060 20.0 ±20.0 ±25.0
2,4-Dimethylphenol 0.050 20.0 ±25.0 ±50.0
Bis(2-chloroethoxy) methane 0.080 20.0 ±20.0 ±25.0
2,4-Dichlorophenol 0.060 20.0 ±20.0 ±25.0
Naphthalene 0.200 20.0 ±20.0 ±25.0
4-Chloroaniline 0.010 40.0 ±40.0 ±50.0

Organic Data Review Semivolatiles
January 2017 122
Analyte Minimum RRF
Maximum %RSD
ICV/Opening CCV
Maximum %D1
Closing CCV
Maximum %D
Hexachlorobutadiene 0.040 20.0 ±20.0 ±25.0
Caprolactam 0.010 40.0 ±30.0 ±50.0
4-Chloro-3-methylphenol 0.040 20.0 ±20.0 ±25.0
2-Methylnaphthalene 0.100 20.0 ±20.0 ±25.0
Hexachlorocyclopentadiene 0.010 40.0 ±40.0 ±50.0
2,4,6-Trichlorophenol 0.090 20.0 ±20.0 ±25.0
2,4,5-Trichlorophenol 0.100 20.0 ±20.0 ±25.0
1,1'-Biphenyl 0.200 20.0 ±20.0 ±25.0
2-Chloronaphthalene 0.300 20.0 ±20.0 ±25.0
2-Nitroaniline 0.060 20.0 ±25.0 ±25.0
Dimethylphthalate 0.300 20.0 ±20.0 ±25.0
2,6-Dinitrotoluene 0.080 20.0 ±20.0 ±25.0
Acenaphthylene 0.400 20.0 ±20.0 ±25.0
3-Nitroaniline 0.010 20.0 ±25.0 ±50.0
Acenaphthene 0.200 20.0 ±20.0 ±25.0
2,4-Dinitrophenol 0.010 40.0 ±50.0 ±50.0
4-Nitrophenol 0.010 40.0 ±40.0 ±50.0
Dibenzofuran 0.300 20.0 ±20.0 ±25.0
2,4-Dinitrotoluene 0.070 20.0 ±20.0 ±25.0
Diethylphthalate 0.300 20.0 ±20.0 ±25.0
1,2,4,5-Tetrachlorobenzene 0.100 20.0 ±20.0 ±25.0
4-Chlorophenyl-phenylether 0.100 20.0 ±20.0 ±25.0
Fluorene 0.200 20.0 ±20.0 ±25.0
4-Nitroaniline 0.010 40.0 ±40.0 ±50.0
4,6-Dinitro-2-methylphenol 0.010 40.0 ±30.0 ±50.0
4-Bromophenyl-phenyl ether 0.070 20.0 ±20.0 ±25.0
N-Nitrosodiphenylamine 0.100 20.0 ±20.0 ±25.0
Hexachlorobenzene 0.050 20.0 ±20.0 ±25.0
Atrazine 0.010 40.0 ±25.0 ±50.0
Pentachlorophenol 0.010 40.0 ±40.0 ±50.0
Phenanthrene 0.200 20.0 ±20.0 ±25.0
Anthracene 0.200 20.0 ±20.0 ±25.0

Organic Data Review Semivolatiles
January 2017 123
Analyte Minimum RRF
Maximum %RSD
ICV/Opening CCV
Maximum %D1
Closing CCV
Maximum %D
Carbazole 0.050 20.0 ±20.0 ±25.0
Di-n-butylphthalate 0.500 20.0 ±20.0 ±25.0
Fluoranthene 0.100 20.0 ±20.0 ±25.0
Pyrene 0.400 20.0 ±25.0 ±50.0
Butylbenzylphthalate 0.100 20.0 ±25.0 ±50.0
3,3'-Dichlorobenzidine 0.010 40.0 ±40.0 ±50.0
Benzo(a)anthracene 0.300 20.0 ±20.0 ±25.0
Chrysene 0.200 20.0 ±20.0 ±50.0
Bis(2-ethylhexyl) phthalate 0.200 20.0 ±25.0 ±50.0
Di-n-octylphthalate 0.010 40.0 ±40.0 ±50.0
Benzo(b)fluoranthene 0.010 20.0 ±25.0 ±50.0
Benzo(k)fluoranthene 0.010 20.0 ±25.0 ±50.0
Benzo(a)pyrene 0.010 20.0 ±20.0 ±50.0
Indeno(1,2,3-cd)pyrene 0.010 20.0 ±25.0 ±50.0
Dibenzo(a,h)anthracene 0.010 20.0 ±25.0 ±50.0
Benzo(g,h,i)perylene 0.010 20.0 ±30.0 ±50.0
2,3,4,6-Tetrachlorophenol 0.040 20.0 ±20.0 ±50.0
Selective Ion Monitoring
Naphthalene 0.600 20.0 ±25.0 ±25.0
2-Methylnaphthalene 0.300 20.0 ±20.0 ±25.0
Acenaphthylene 0.900 20.0 ±20.0 ±25.0
Acenaphthene 0.500 20.0 ±20.0 ±25.0
Fluorene 0.700 20.0 ±25.0 ±50.0
Phenanthrene 0.300 20.0 ±25.0 ±50.0
Anthracene 0.400 20.0 ±25.0 ±50.0
Fluoranthene 0.400 20.0 ±25.0 ±50.0
Pyrene 0.500 20.0 ±30.0 ±50.0
Benzo(a)anthracene 0.400 20.0 ±25.0 ±50.0
Chrysene 0.400 20.0 ±25.0 ±50.0
Benzo(b)fluoranthene 0.100 20.0 ±30.0 ±50.0
Benzo(k)fluoranthene 0.100 20.0 ±30.0 ±50.0
Benzo(a)pyrene 0.100 20.0 ±25.0 ±50.0

Organic Data Review Semivolatiles
January 2017 124
Analyte Minimum RRF
Maximum %RSD
ICV/Opening CCV
Maximum %D1
Closing CCV
Maximum %D
Indeno(1,2,3-cd)pyrene 0.100 20.0 ±40.0 ±50.0
Dibenzo(a,h)anthracene 0.010 25.0 ±40.0 ±50.0
Benzo(g,h,i)perylene 0.020 25.0 ±40.0 ±50.0
Pentachlorophenol 0.010 40.0 ±50.0 ±50.0
Deuterated Monitoring Compounds
1,4-Dioxane-d8 0.010 20.0 ±25.0 ±50.0 Phenol-d5 0.010 20.0 ±25.0 ±25.0
Bis-(2-chloroethyl) ether-d8 0.100 20.0 ±20.0 ±25.0
2-Chlorophenol-d4 0.200 20.0 ±20.0 ±25.0
4-Methylphenol-d8 0.010 20.0 ±20.0 ±25.0
4-Chloroaniline-d4 0.010 40.0 ±40.0 ±50.0
Nitrobenzene-d5 0.050 20.0 ±20.0 ±25.0
2-Nitrophenol-d4 0.050 20.0 ±20.0 ±25.0
2,4-Dichlorophenol-d3 0.060 20.0 ±20.0 ±25.0
Dimethylphthalate-d6 0.300 20.0 ±20.0 ±25.0
Acenaphthylene-d8 0.400 20.0 ±20.0 ±25.0
4-Nitrophenol-d4 0.010 40.0 ±40.0 ±50.0 Fluorene-d10 0.100 20.0 ±20.0 ±25.0 4,6-Dinitro-2-methylphenol-d2 0.010 40.0 ±30.0 ±50.0 Anthracene-d10 0.300 20.0 ±20.0 ±25.0 Pyrene-d10 0.300 20.0 ±25.0 ±50.0
Benzo(a)pyrene-d12 0.010 20.0 ±20.0 ±50.0
Fluoranthene-d10 (SIM) 0.400 20.0 ±25.0 ±50.0
2-Methylnaphthalene-d10 (SIM) 0.300 20.0 ±20.0 ±25.0 1 If a closing CCV is acting as an opening CCV, all target analytes must meet the requirements for an
opening CCV.

Organic Data Review Semivolatiles
January 2017 125
Table 35. Initial Calibration Actions for Semivolatile Analysis
Criteria Action
Detect Non-detect
Initial Calibration not performed at the specified frequency and sequence
Use professional judgment
R
Use professional judgment
R
Initial Calibration not performed at the specified concentrations J UJ
RRF < Minimum RRF in Table 34 for target analyte
Use professional judgment J+ or R
R
RRF ≥ Minimum RRF in Table 34 for target analyte No qualification No qualification
%RSD > Maximum %RSD in Table 34 for target analyte J Use professional
judgment
%RSD ≤ Maximum %RSD in Table 34 for target analyte No qualification No qualification

Organic Data Review Semivolatiles
January 2017 126
IV. Initial Calibration Verification
A. Review Items
Form 7A-OR, quantitation reports, and chromatograms. (SOW SOM02.4 – Exhibit B, Section 3.4 and Exhibit D/SVOA, Sections 7.2.2.2 and 9.4)
B. Objective
The objective is to ensure that the instrument is calibrated accurately to produce acceptable qualitative and quantitative data throughout each analytical sequence by the use of a second-source check standard.
C. Criteria
1. The accuracy of the calibration for each GC/MS system used for analysis must be verified at thefrequency of one ICV standard analysis per initial calibration analytical sequence. The ICV isanalyzed after the last ICAL standard analysis and prior to a blank, sample, or an applicable CCVanalysis.
2. The ICV standard must contain all required target analytes, from an alternate source or a differentlot than that used for the ICAL standards and DMCs, at or near the mid-point concentration (CS3)of the ICAL.
3. For an ICV, the RRFs for each target analyte and DMC must be ≥ the Minimum RRF values inTable 34.
4. The Percent Difference (%D) between the ICAL RRF������ and the ICV RRF must be within theICV/Opening CCV Maximum %D limits in Table 34 for each target analyte and DMC.
D. Evaluation
1. Verify that the ICV standard is analyzed at the specified frequency and sequence, and that it isassociated with the correct ICAL. Also verify that the correct ICAL is represented in the datapackage and meets SOW criteria, as described in Section III.
2. Verify that the concentrations of the target analytes and the DMCs in the ICV are at or near themid-point standard CS3 from the ICAL.
3. Verify that the RRF and %D for each target analyte and DMC are reported on Form 7A-OR.Recalculate the RRF and %D for at least one target analyte and DMC associated with each internalstandard, and verify that the recalculated values agree with the laboratory reported values on Form7A-OR.
4. Verify that the RRFs for each target analyte and DMC in the ICV are ≥ Minimum RRF values inTable 34.
5. Verify that the %Ds are within the ICV/Opening CCV Maximum %D limits in Table 34 for eachtarget analyte and DMC.
NOTE: For data obtained from the CLP, information regarding the noncompliant ICV can be obtained from the NFG reports and may be used as part of the evaluation process.
E. Action
1. If the ICV is not performed at the specified frequency, use professional judgment to qualify detectsand non-detects. Contact the EPA Regional CLP COR to request that the laboratory repeat theanalysis, if holding times have not expired and there are remaining sample vials. If reanalysis is notpossible, carefully evaluate all other available information, including the quality of analyte peakshapes and mass spectral matches, the stability of internal standard Retention Times (RTs) andareas in each affected sample, and compare to the most recent calibration performed on the sameinstrument under the same conditions. Using this information and professional judgment, thereviewer may be able to justify unqualified acceptance of qualitative results.
Organic Data Review Semivolatiles
January 2017 127
2. If the ICV is not performed at the specified concentration, use professional judgment to qualifydetects and non-detects. Special consideration should be given to sample results at the oppositeextreme of the calibration range if this defect is noted.
3. If errors are detected in the calculations of either the RRF or the %D, perform a morecomprehensive recalculation.
4. If the RRF in an ICV is < Minimum RRF value in Table 34 for any target analyte, carefullyevaluate the qualitative data associated with positively identified analytes and use professionaljudgment to qualify detects as estimated (J) or unusable (R), and qualify non-detects as unusable(R).
a. Take special note of any extreme deviation in the RRF and evaluate RT data, peak shapes, andareas of the target analytes and associated internal standards for inconsistencies that mayindicate a chromatographic co-elution. If this is suspected, the contaminant may also bepresent in samples and blanks. Also review the documentation of the preparation of the ICVstandard. Use professional judgment to qualify affected data appropriately.
5. If the RRF in an ICV is ≥ Minimum RRF value in Table 34 for any target analyte, detects andnon-detects should not be qualified.
6. If the %D in an ICV is outside the ICV/Opening CCV Maximum %D limits in Table 34 for anytarget analyte, qualify detects as estimated (J) and non-detects as estimated (UJ).
7. If the %D in an ICV is within the inclusive range of the ICV/Opening CCV Maximum %D limits inTable 34 for any target analyte, detects and non-detects should not be qualified.
8. No qualification of the data is necessary based on the DMC RRF and/or %D alone. Useprofessional judgment to evaluate the DMC RRF and %D data in conjunction with the DMCrecoveries to determine the need for data qualification.
9. If the laboratory has failed to provide adequate calibration information, contact the EPA RegionalCLP COR, who may contact the laboratory to request the necessary information. If the informationis not available, use professional judgment to assess the data. Refer to E.1, above, for additionalsteps.
10. Note the potential effects on the data due to ICV criteria exceedance in the Data Review Narrative.
11. If the ICV criteria are grossly exceeded, note this for EPA Regional CLP COR action.

Organic Data Review Semivolatiles
January 2017 128
Table 36. ICV Actions for Semivolatile Analysis
Criteria for ICV Action
Detect Non-detect
ICV not performed at the specified frequency and sequence
Use professional judgment
Use professional judgment
ICV not performed at the specified concentration
Use professional judgment
Use professional judgment
RRF < Minimum RRF in Table 34 for target analyte
Use professional judgment
J or R R
RRF ≥ Minimum RRF in Table 34 for target analyte No qualification No qualification
%D outside the ICV/Opening CCV Maximum %D limits in Table 34 for target analyte
J UJ
%D within the inclusive ICV/Opening CCV Maximum %D limits in Table 34 for target analyte
No qualification No qualification

Organic Data Review Semivolatiles
January 2017 129
V. Continuing Calibration Verification
A. Review Items
Form 7A-OR, quantitation reports, and chromatograms. (SOW SOM02.4 – Exhibit B, Section 3.4 and Exhibit D/SVOA, Sections 7.2.2.1 and 9.5)
B. Objective
The objective is to ensure that the instrument continues to meet the sensitivity and linearity criteria to produce acceptable qualitative and quantitative data throughout each analytical sequence.
C. Criteria
1. The calibration for each GC/MS system used for analysis must be verified at the beginning and end of every 12-hour period of operation. The 12-hour period begins with the injection of DFTPP, followed by the injection of the opening CCV solution. After the injection of all samples and required blanks, and before the end of the 12-hour period, injection of the closing CCV is required. The closing CCV used to bracket the end of a 12-hour analytical sequence may be used as the opening CCV for a new 12-hour analytical sequence, provided that all technical acceptance criteria are met for an opening CCV.
2. The CCV standards must contain all required target analytes and DMCs at or near the mid-point concentration (CS3) of the ICAL.
3. For an opening or a closing CCV, the RRFs for the target analytes and DMCs must be ≥ the Minimum RRF values in Table 34.
4. The %D between the ICAL RRF������ and the opening CCV RRF must be within the ICV/Opening CCV Maximum %D limits in Table 34 for each target analyte and DMC.
5. For a closing CCV, the %D between the ICAL RRF������ and the CCV RRF must be within the Closing CCV Maximum %D limits in Table 34 for each target analyte and DMC.
D. Evaluation
1. Verify that the CCV is analyzed at the specified frequency (an opening and closing CCV must be analyzed within a 12-hour period) and sequence, and that it is associated with the correct ICAL. Also verify that the correct ICAL is represented in the data package and meets SOW criteria, as described in Section III.
2. Verify that the mid-point standard CS3 from the ICAL is used as an opening or a closing CCV.
3. Verify that the RRF and %D for each target analyte and DMC are reported on Form 7A-OR. Recalculate the RRF and %D for at least one target analyte and DMC associated with each internal standard, and verify that the recalculated values agree with the laboratory reported values on Form 7A-OR.
4. For an opening or a closing CCV, verify that the RRFs for each target analyte and DMC are ≥ Minimum RRF values in Table 34.
5. For an opening CCV, verify that the %Ds are within the ICV/Opening CCV Maximum %D limits in Table 34 for each target analyte and DMC.
6. For a closing CCV, verify that the %Ds are within the Closing CCV Maximum %D limits in Table 34 for each target analyte and DMC.
NOTE: For data obtained from the CLP, information regarding the noncompliant CCV can be obtained from the NFG reports and may be used as part of the evaluation process.

Organic Data Review Semivolatiles
January 2017 130
E. Action
1. If the CCV is not performed at the specified frequency, qualify detects and non-detects as unusable (R). Contact the EPA Regional CLP COR to request that the laboratory repeat the analysis, if holding times have not expired and there are remaining sample vials. If reanalysis is not possible, carefully evaluate all other available information, including the quality of analyte peak shapes and mass spectral matches, the stability of internal standard RTs and areas in each affected sample, and compare to the most recent calibration performed on the same instrument under the same conditions. Using this information and professional judgment, the reviewer may be able to justify unqualified acceptance of qualitative results and qualification of all quantitative results as estimated (J). Otherwise, qualify all detects and non-detects as unusable (R).
2. If the CCV is not performed at the specified concentration, use professional judgment to qualify detects and non-detects. Special consideration should be given to sample results at the opposite extreme of the calibration range if this defect is noted.
3. If errors are detected in the calculations of either the RRF or the %D, perform a more comprehensive recalculation.
4. For an opening or a closing CCV, if the RRF is < Minimum RRF value in Table 34 for any target analyte, carefully evaluate the qualitative data associated with positively identified analytes and use professional judgment to qualify detects as estimated (J) or unusable (R), and qualify non-detects as unusable (R).
a. Take special note of any extreme deviation in the RRF and evaluate RT data, peak shapes, and areas of the target analytes and associated internal standards for inconsistencies that may indicate a chromatographic co-elution. If this is suspected, the contaminant may also be present in samples and blanks. Also review the documentation of the preparation of the CCV standard. Use professional judgment to qualify affected data appropriately.
5. For opening or a closing CCV, if the RRF is ≥ Minimum RRF value in Table 34 for any target analyte, detects and non-detects should not be qualified.
6. For an opening CCV, if the %D is outside the ICV/Opening CCV Maximum %D limits in Table 34 for any target analyte, qualify detects as estimated (J) and non-detects as estimated (UJ).
7. For a closing CCV, if the %D is outside the Closing CCV Maximum %D limits in Table 34 for any target analyte, qualify detects as estimated (J) and non-detects as estimated (UJ).
8. For an opening CCV, if the %D is within the inclusive range of the ICV/Opening CCV Maximum %D limits in Table 34 for any target analyte, detects and non-detects should not be qualified.
9. For closing CCV, if the %D is within the inclusive range of the Closing CCV Maximum %D limits in Table 34 for any target analyte, detects and non-detects should not be qualified.
10. No qualification of the data is necessary based on the DMC RRF and/or %D alone. Use professional judgment to evaluate the DMC RRF and %D data in conjunction with the DMC recoveries to determine the need for data qualification.
11. If the laboratory has failed to provide adequate calibration information, contact the EPA Regional CLP COR, who may contact the laboratory to request the necessary information. If the information is not available, use professional judgment to assess the data. Refer to E.1, above, for additional steps.
12. Note the potential effects on the data due to CCV criteria exceedance in the Data Review Narrative.
13. If the CCV criteria are grossly exceeded, note this for EPA Regional CLP COR action.

Organic Data Review Semivolatiles
January 2017 131
Table 37. CCV Actions for Semivolatile Analysis
Criteria for Opening CCV Criteria for Closing CCV Action
Detect Non-detect
CCV not performed at the specified frequency and sequence
CCV not performed at the specified frequency
Use professional
judgment J or R
Use professional
judgment UJ or R
CCV not performed at the specified concentration
CCV not performed at the specified concentration
Use professional
judgment
Use professional
judgment
RRF < Minimum RRF in Table 34 for target analyte
RRF < Minimum RRF in Table 34 for target analyte
Use professional
judgment J or R
R
RRF ≥ Minimum RRF in Table 34 for target analyte
RRF ≥ Minimum RRF in Table 34 for target analyte
No qualification
No qualification
%D outside the ICV/Opening CCV Maximum %D limits in Table 34 for target analyte
%D outside the Closing CCV Maximum %D limits in Table 34 for target analyte
J UJ
%D within the inclusive ICV/Opening CCV Maximum %D limits in Table 34 for target analyte
%D within the inclusive Closing CCV Maximum %D limits in Table 34 for target analyte
No qualification
No qualification
Organic Data Review Semivolatiles
January 2017 132
VI. Blanks
A. Review Items
Form 1A-OR, Form 1B-OR, Form 4-OR, chromatograms, and quantitation reports. (SOW SOM02.4 – Exhibit B, Section 3.4 and Exhibit D/SVOA, Section 12.1)
B. Objective
The objective of a blank analysis results assessment is to determine the existence and magnitude of contamination resulting from laboratory (or field) activities.
C. Criteria
The criteria for evaluation of blanks should apply to any blank associated with the samples (e.g., method blanks, field blanks, etc.). If problems with any blank exist, all associated data must be carefully evaluated to determine whether or not there is an inherent variability in the data or if the problem is an isolated occurrence not affecting other data. Whereas previous guidelines recommended special criteria to discount possible false positives of common semivolatile laboratory contaminants (phthalate esters), recent CLP data have shown less than a 1% probability that levels of these contaminants from a contaminating source will exceed the Contract Required Quantitation Limit (CRQL).
1. Method blank analyses must be performed at the specified frequency and sequence. A methodblank must be extracted per matrix each time samples are extracted. The number of samplesextracted with each method blank shall not exceed 20 field samples. The method blank must beextracted by the same procedure used to extract samples and analyzed on each GC/MS systemunder the same conditions used to analyze associated samples.
2. The method blank, like any other sample in the SDG, must meet the technical acceptance criteriafor sample analysis.
3. The TCLP/SPLP Leachate Extraction Blank (LEB) must be prepared and analyzed at the specifiedfrequency and sequence.
4. The concentration of a target analyte in any blank must not exceed its CRQL. TentativelyIdentified Compound (TIC) concentration in any blanks must be < 5.0 ug/L for water (0.0050 mg/Lfor TCLP leachate) or 170 ug/kg for soil/sediment matrices.
D. Evaluation
1. Verify that method blanks are extracted at the specified frequency and analyzed at the requiredsequence. The Method Blank Summary (Form 4-OR) may be used to identify the samplesassociated with each method blank.
2. Verify that applicable TCLP/SPLP LEBs are analyzed at the specified frequency and sequence.The Method Blank Summary (Form 4-OR) may be used to identify the samples associated witheach TCLP/SPLP LEB.
3. Data concerning the field blanks are not evaluated as part of the Contract Compliance Screening(CCS) process. Evaluations on field or trip blanks should be similar to the method blanks.
4. Review the results of all associated blanks on the forms and raw data (chromatograms andquantitation reports) to evaluate the presence of target analytes and non-target compounds in theblanks.
NOTE: For data obtained from the CLP, the preceding criteria are evaluated as part of the CCS process. Information regarding the noncompliant blank can be obtained from the NFG reports and may be used as part of the evaluation process.

Organic Data Review Semivolatiles
January 2017 133
E. Action
1. If the appropriate blanks are not extracted at the correct frequency and/or analyzed at the correct sequence, use professional judgment to determine if the associated sample data should be qualified. Obtain additional information from the laboratory, if necessary. Record the situation in the Data Review Narrative and note it for EPA Regional CLP COR action.
2. Action regarding unsuitable blank results depends on the circumstances and origin of the blank. Verify that the data qualification decisions based on field quality control (QC) are supported by the project Quality Assurance Project Plan (QAPP) or EPA Regional Standard Operating Procedure (SOP). At a minimum, contamination found in field blanks should be documented in the Data Review Narrative. In instances where more than one blank is associated with a given sample, qualification should be based upon a comparison with the associated blank having the highest concentration of a contaminant. Do not correct the results by subtracting any blank value.
3. For any blank (including method blank), if a target analyte is detected, but it is not detected in the sample, non-detects should not be qualified.
4. For any method blank reported with results < CRQLs, report sample results that are < CRQLs at the CRQLs and qualify as non-detect (U). For any method blank reported with results that are < CRQLs, use professional judgment to qualify sample results that are ≥ CRQLs. Positive results in samples, especially those near but above the CRQL, may be biased high by low level contamination in the method blanks, and should be considered as estimated (J+).
5. For any method blank reported with results ≥ CRQLs, report sample results that are < CRQLs at the CRQLs and qualify as non-detect (U). For any method blank reported with results ≥ CRQLs, report at sample results that are ≥ CRQLs but < Blank Results at sample results and qualify as non-detect (U) or unusable (R). Use professional judgment to qualify sample results that are ≥ CRQLs and ≥ Blank Results.
6. For TCLP/SPLP LEBs and field blanks, sample result qualifications listed in Table 38 should apply if supported by the project QAPP.
7. If gross contamination exists with blank results that are > ICAL CS5 concentrations, qualify detects as unusable (R). If the contamination is suspected of having an effect on the sample results, note it for EPA Regional CLP COR action.
8. For any blank (including method blank) reported with TICs (non-target compounds) concentrations that are > 5.0 ug/L for water (0.0050 mg/L for TCLP leachate) and 170 ug/kg for soil/sediment matrices, use professional judgment to qualify sample results.
9. There may be instances where little or no contamination is present in the associated blanks, but qualification of the sample is deemed necessary. If it is determined that the contamination is from a source other than the sample, the data should be qualified, or in the case of field QC, should at least be documented in the Data Review Narrative. Contamination introduced through dilution water is one example. Although it is not always possible to determine, instances of this occurring can be detected when contaminants are found in the diluted sample result, but are absent in the undiluted sample.
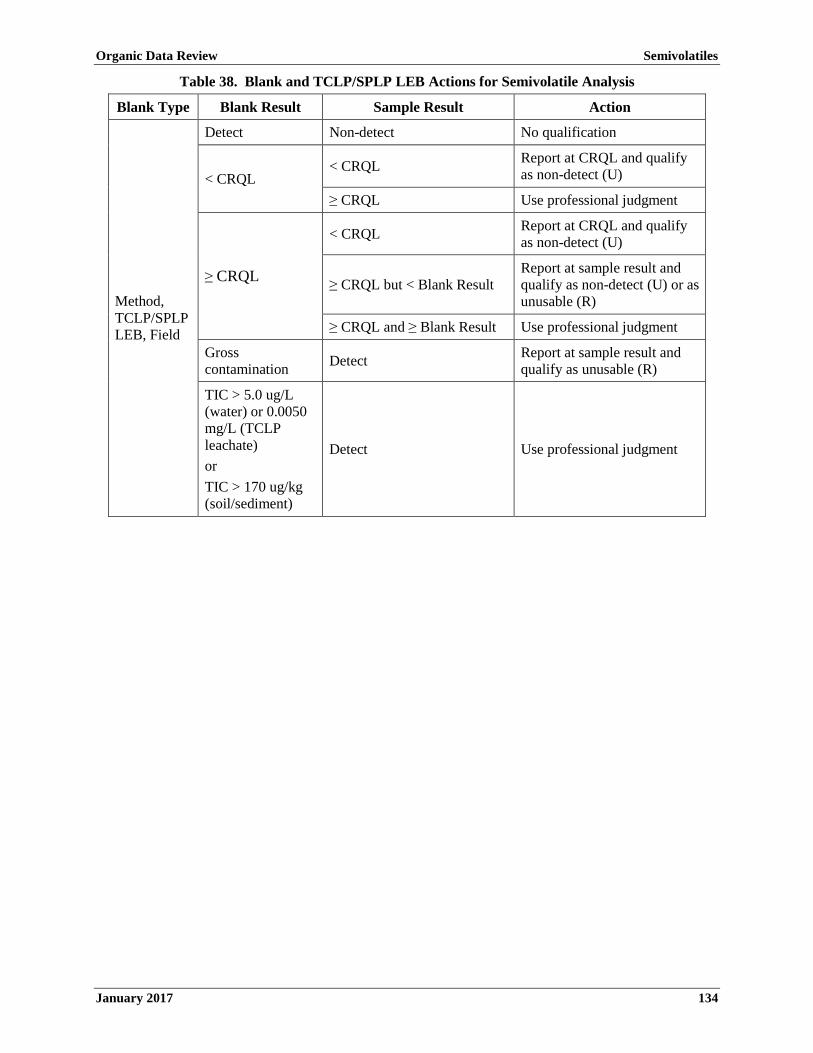
Organic Data Review Semivolatiles
January 2017 134
Table 38. Blank and TCLP/SPLP LEB Actions for Semivolatile Analysis
Blank Type Blank Result Sample Result Action
Method, TCLP/SPLP LEB, Field
Detect Non-detect No qualification
< CRQL < CRQL Report at CRQL and qualify
as non-detect (U)
≥ CRQL Use professional judgment
≥ CRQL
< CRQL Report at CRQL and qualify as non-detect (U)
≥ CRQL but < Blank Result Report at sample result and qualify as non-detect (U) or as unusable (R)
≥ CRQL and ≥ Blank Result Use professional judgment
Gross contamination Detect Report at sample result and
qualify as unusable (R)
TIC > 5.0 ug/L (water) or 0.0050 mg/L (TCLP leachate) or TIC > 170 ug/kg (soil/sediment)
Detect Use professional judgment

Organic Data Review Semivolatiles
January 2017 135
VII. Deuterated Monitoring Compound
A. Review Items
Form 2A-OR, Form 2B-OR quantitation reports, and chromatograms. (SOW SOM02.4 – Exhibit B, Section 3.4 and Exhibit D/SVOA, Sections 7.2.2.5 and 11.2.4)
B. Objective
The objective is to evaluate DMC percent recovery (%R) to ensure that the analytical method is efficient.
C. Criteria
1. All samples and blanks are spiked with DMCs listed in Table 39, prior to the sample extraction procedure, to measure DMC %R.
2. The %R for each DMC shall be calculated correctly according to the method.
3. The %R for each DMC in samples and blanks must be within the limits in Table 39.
Table 39. Semivolatile DMC Recovery Limits
DMC %R For Water Sample
%R For Soil/Sediment Sample
1,4-Dioxane-d8 40 - 110 40 - 110
Phenol-d5 10 - 130 10 - 130
Bis(2-chloroethyl) ether-d8 25 - 120 10 - 150
2-Chlorophenol-d4 20 - 130 15 - 120
4-Methylphenol-d8 25 - 125 10 - 140
4-Chloroaniline-d4 1 - 146* 1 - 145*
Nitrobenzene-d5 20 - 125 10 - 135
2-Nitrophenol-d4 20 - 130 10 - 120
2,4-Dichlorophenol-d3 20 - 120 10 - 140
Dimethylphthalate-d6 25 - 130 10 - 145
Acenaphthylene-d8 10 - 130 15 - 120
4-Nitrophenol-d4 10 - 150 10 - 150
Fluorene-d10 25 - 125 20 - 140
4,6-Dinitro-2-methylphenol-d2 10 - 130 10 - 130
Anthracene-d10 25 - 130 10 - 150
Pyrene-d10 15 - 130 10 - 130
Benzo(a)pyrene-d12 20 - 130 10 - 140
Fluoranthene-d10 (SIM) 30 - 130 30 - 130
2-Methylnaphthalene-d10 (SIM) 30 - 130 20 - 140
* Limits are advisory.

Organic Data Review Semivolatiles
January 2017 136
D. Evaluation
1. Check the raw data (e.g., chromatograms and quantitation reports) to verify the recoveries on the Deuterated Monitoring Compound Recovery Form 2A-OR and Form 2B-OR.
2. Check for any calculation or transcription errors. Verify that the DMC recoveries were calculated correctly using the equation in the method and that the recalculated values agree with the laboratory reported values on Form 2A-OR and Form 2B-OR.
3. Whenever there are two or more analyses for a particular sample, use professional judgment to determine which analysis has the most acceptable data to report. Considerations include, but are not limited to:
a. DMC recovery (marginal versus gross deviation).
b. Technical holding times.
c. Comparison of the target analyte results reported in each sample analysis.
d. Other QC information, such as performance of internal standards.
NOTE: For data obtained from the CLP, the preceding criteria are evaluated as part of the CCS process. Information regarding the noncompliant DMC %R can be obtained from the NFG reports and may be used as part of the evaluation process.
E. Action
1. If a DMC was not added to the samples and blanks or the concentrations of DMCs in the samples and blanks are not as specified, use professional judgment to qualify detects and non-detects. The EPA Regional CLP COR should be contacted to arrange for reanalysis, if possible.
2. If errors are detected in the calculations of %R, perform a more comprehensive recalculation. It may be necessary to have the laboratory resubmit the data after making corrections.
3. If any DMC %R is outside the limits (Table 39) in samples, qualify the associated target analytes listed in Table 41 and SIM target analytes in Table 42 considering the existence of interference in the raw data. Considerations include, but are not limited to:
a. If the DMC %R in the undiluted sample analysis is < 10% (excluding DMCs with 10% as a lower acceptance limits), qualify detects as estimated low (J-) and non-detects as unusable (R).
b. If the DMC %R in the undiluted sample analysis is ≥ 10% (excluding DMCs with 10% as a lower acceptance limits) and < lower acceptance limit, qualify detects as estimated low (J-) and non-detects as estimated (UJ).
c. If the DMC %R in the diluted sample analysis is < lower acceptance limit, use professional judgment to qualify detects and non-detects.
d. If the DMC %R is ≥ lower acceptance limit and ≤ upper acceptance limit, detects and non-detects should not be qualified.
e. If the DMC %R is > upper acceptance limit, qualify detects as estimated high (J+). Non-detects should not be qualified.
4. If any DMC %R is outside the limits (Table 39) in a blank, special consideration should be taken to determine the validity of the associated sample data. The basic concern is whether the blank problems represent an isolated problem with the blank alone, or whether there is a fundamental problem with the analytical process.
For example, if one or more samples in the analytical sequence show acceptable DMC %Rs, the blank problem may be considered as an isolated occurrence. However, even if this judgment allows some use of the affected data, note analytical problems for EPA Regional CLP COR action.

Organic Data Review Semivolatiles
January 2017 137
Table 40. DMC Actions for Semivolatile Analysis
Criteria Action
Detect Non-detect
%R < 10% (excluding DMCs with 10% as a lower acceptance limit, undiluted sample analysis) J- R
10% ≤ %R (excluding DMCs with 10% as a lower acceptance limit, undiluted sample analysis) < Lower Acceptance Limit
J- UJ
%R < Lower Acceptance Limit (diluted sample analysis) Use professional judgment
Use professional judgment
Lower Acceptance limit ≤ %R ≤ Upper Acceptance Limit No qualification No qualification
%R > Upper Acceptance Limit J+ No qualification
Table 41. Semivolatile DMCs and the Associated Target Analytes
1,4-Dioxane-d8 (DMC-1) Phenol-d5 (DMC-2) Bis(2-Chloroethyl) ether-d8
(DMC-3) 1,4-Dioxane Benzaldehyde Bis(2-chloroethyl) ether Phenol 2,2'-Oxybis(1-chloropropane) Bis(2-chloroethoxy) methane 2-Chlorophenol-d4 (DMC-4) 4-Methylphenol-d8 (DMC-5) 4-Chloroaniline-d4 (DMC-6) 2-Chlorophenol 2-Methylphenol 4-Chloroaniline 3-Methylphenol 4-Methylphenol 2,4-Dimethylphenol Nitrobenzene-d5 (DMC-7) 2-Nitrophenol-d4 (DMC-8) 2,4-Dichlorophenol-d3 (DMC-9) Acetophenone Isophorone 2,4-Dichlorophenol N-Nitroso-di-n-propylamine 2-Nitrophenol Hexachlorobutadiene Hexachloroethane 4-Chloro-3-methylphenol Hexachlorocyclopentadiene 2,4,6-Trichlorophenol Nitrobenzene 2,4,5-Trichlorophenol 2,6-Dinitrotoluene 1,2,4,5-Tetrachlorobenzene 2,4-Dinitrotoluene *Pentachlorophenol N-Nitrosodiphenylamine 2,3,4,6-Tetrachlorophenol 3,3'-Dichlorobenzidine
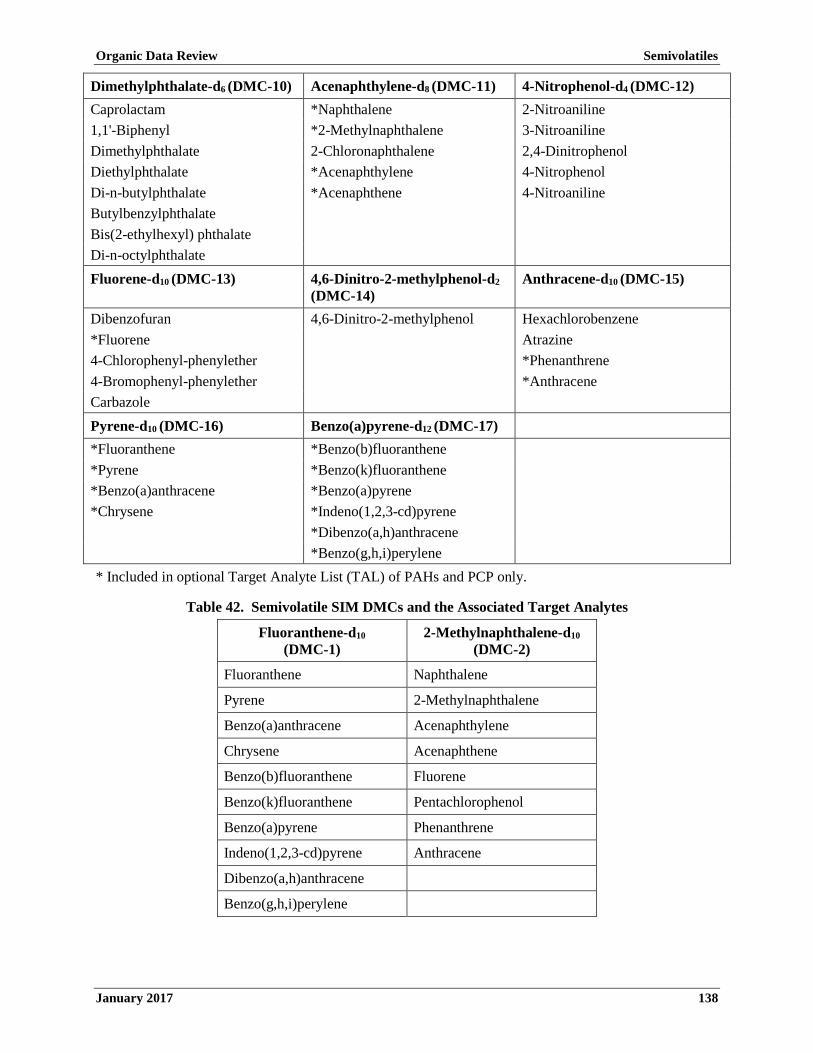
Organic Data Review Semivolatiles
January 2017 138
Dimethylphthalate-d6 (DMC-10) Acenaphthylene-d8 (DMC-11) 4-Nitrophenol-d4 (DMC-12) Caprolactam *Naphthalene 2-Nitroaniline 1,1'-Biphenyl *2-Methylnaphthalene 3-Nitroaniline Dimethylphthalate 2-Chloronaphthalene 2,4-Dinitrophenol Diethylphthalate *Acenaphthylene 4-Nitrophenol Di-n-butylphthalate *Acenaphthene 4-Nitroaniline Butylbenzylphthalate Bis(2-ethylhexyl) phthalate Di-n-octylphthalate Fluorene-d10 (DMC-13) 4,6-Dinitro-2-methylphenol-d2
(DMC-14) Anthracene-d10 (DMC-15)
Dibenzofuran 4,6-Dinitro-2-methylphenol Hexachlorobenzene *Fluorene Atrazine 4-Chlorophenyl-phenylether *Phenanthrene 4-Bromophenyl-phenylether *Anthracene Carbazole Pyrene-d10 (DMC-16) Benzo(a)pyrene-d12 (DMC-17) *Fluoranthene *Benzo(b)fluoranthene *Pyrene *Benzo(k)fluoranthene *Benzo(a)anthracene *Benzo(a)pyrene *Chrysene *Indeno(1,2,3-cd)pyrene *Dibenzo(a,h)anthracene *Benzo(g,h,i)perylene * Included in optional Target Analyte List (TAL) of PAHs and PCP only.
Table 42. Semivolatile SIM DMCs and the Associated Target Analytes
Fluoranthene-d10
(DMC-1) 2-Methylnaphthalene-d10
(DMC-2)
Fluoranthene Naphthalene
Pyrene 2-Methylnaphthalene
Benzo(a)anthracene Acenaphthylene
Chrysene Acenaphthene
Benzo(b)fluoranthene Fluorene
Benzo(k)fluoranthene Pentachlorophenol
Benzo(a)pyrene Phenanthrene
Indeno(1,2,3-cd)pyrene Anthracene
Dibenzo(a,h)anthracene
Benzo(g,h,i)perylene
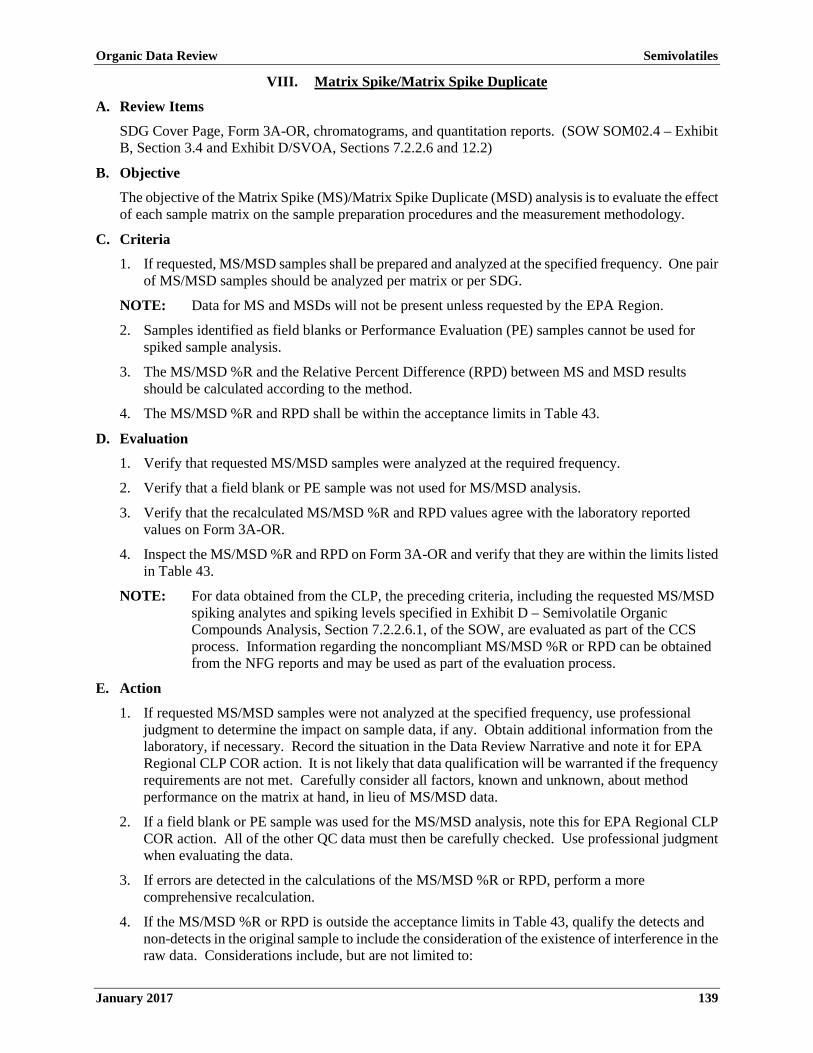
Organic Data Review Semivolatiles
January 2017 139
VIII. Matrix Spike/Matrix Spike Duplicate
A. Review Items
SDG Cover Page, Form 3A-OR, chromatograms, and quantitation reports. (SOW SOM02.4 – Exhibit B, Section 3.4 and Exhibit D/SVOA, Sections 7.2.2.6 and 12.2)
B. Objective
The objective of the Matrix Spike (MS)/Matrix Spike Duplicate (MSD) analysis is to evaluate the effect of each sample matrix on the sample preparation procedures and the measurement methodology.
C. Criteria
1. If requested, MS/MSD samples shall be prepared and analyzed at the specified frequency. One pair of MS/MSD samples should be analyzed per matrix or per SDG.
NOTE: Data for MS and MSDs will not be present unless requested by the EPA Region.
2. Samples identified as field blanks or Performance Evaluation (PE) samples cannot be used for spiked sample analysis.
3. The MS/MSD %R and the Relative Percent Difference (RPD) between MS and MSD results should be calculated according to the method.
4. The MS/MSD %R and RPD shall be within the acceptance limits in Table 43.
D. Evaluation
1. Verify that requested MS/MSD samples were analyzed at the required frequency.
2. Verify that a field blank or PE sample was not used for MS/MSD analysis.
3. Verify that the recalculated MS/MSD %R and RPD values agree with the laboratory reported values on Form 3A-OR.
4. Inspect the MS/MSD %R and RPD on Form 3A-OR and verify that they are within the limits listed in Table 43.
NOTE: For data obtained from the CLP, the preceding criteria, including the requested MS/MSD spiking analytes and spiking levels specified in Exhibit D – Semivolatile Organic Compounds Analysis, Section 7.2.2.6.1, of the SOW, are evaluated as part of the CCS process. Information regarding the noncompliant MS/MSD %R or RPD can be obtained from the NFG reports and may be used as part of the evaluation process.
E. Action
1. If requested MS/MSD samples were not analyzed at the specified frequency, use professional judgment to determine the impact on sample data, if any. Obtain additional information from the laboratory, if necessary. Record the situation in the Data Review Narrative and note it for EPA Regional CLP COR action. It is not likely that data qualification will be warranted if the frequency requirements are not met. Carefully consider all factors, known and unknown, about method performance on the matrix at hand, in lieu of MS/MSD data.
2. If a field blank or PE sample was used for the MS/MSD analysis, note this for EPA Regional CLP COR action. All of the other QC data must then be carefully checked. Use professional judgment when evaluating the data.
3. If errors are detected in the calculations of the MS/MSD %R or RPD, perform a more comprehensive recalculation.
4. If the MS/MSD %R or RPD is outside the acceptance limits in Table 43, qualify the detects and non-detects in the original sample to include the consideration of the existence of interference in the raw data. Considerations include, but are not limited to:

Organic Data Review Semivolatiles
January 2017 140
a. If the MS/MSD %R is < 10% (excluding spiked analyte with %R lower limit of 10% or less), qualify detects as estimated (J) and non-detects as unusable (R).
b. If the MS/MSD %R is ≥ 10% (excluding spiked analyte with %R lower limit of 10% or less) and < the lower acceptance limit, qualify detects as estimated (J) and non-detects as estimated (UJ).
c. If the MS/MSD %R or RPD is ≥ lower acceptance limit and ≤ upper acceptance limit, detects and non-detects should not be qualified.
d. If the MS/MSD %R or RPD is > upper acceptance limit, qualify detects as estimated (J). Non-detects should not be qualified.
Table 43. MS/MSD %R and RPD Limits for Semivolatile Analysis
Compound %R for Water Sample
RPD for Water Sample
%R for Soil/Sediment
Sample
RPD for Soil/Sediment
Sample
Phenol 12 - 110 0 - 42 26 - 90 0 - 35
2-Chlorophenol 27 - 123 0 - 40 25 - 102 0 - 50
N-Nitroso-di-n-propylamine 41 - 116 0 - 38 41 - 126 0 - 38
4-Chloro-3-methylphenol 23 - 97 0 - 42 26 - 103 0 - 33
Acenaphthene 46 - 118 0 - 31 31 - 137 0 - 19
4-Nitrophenol 10 - 80 0 - 50 11 - 114 0 - 50
2,4-Dinitrotoluene 24 - 96 0 - 38 28 - 89 0 - 47
Pentachlorophenol 9 - 103 0 - 50 17 - 109 0 - 47
Pyrene 26 - 127 0 - 31 35 - 142 0 - 36
Table 44. MS/MSD Actions for Semivolatile Analysis
Criteria Action
Detect Non-detect
%R < 10% (excluding spiked analyte with %R lower limit of 10% or less) J R
10% ≤ %R (excluding spiked analyte with %R lower limit of 10% or less) < Lower Acceptance Limit J UJ
Lower Acceptance Limit ≤ %R or RPD ≤ Upper Acceptance Limit No qualification No qualification
%R or RPD > Upper Acceptance Limit J No qualification

Organic Data Review Semivolatiles
January 2017 141
IX. Gel Permeation Chromatography Performance Check
A. Review Items
Form 9B-OR, two ultraviolet (UV) traces, Gel Permeation Chromatography (GPC) cleanup blank quantitation reports, and chromatograms. (SOW SOM02.4 – Exhibit B, Section 3.4 and Exhibit D/SVOA, Section 10.3)
B. Objective
The objective is to evaluate GPC cleanup efficiency.
C. Criteria
1. GPC is used for the cleanup of all non-aqueous sample extracts and for aqueous sample extracts that contain high molecular weight components that interfere with the analysis of the target analytes.
2. Each GPC system must be calibrated prior to processing samples for GPC cleanup, when the GPC calibration verification solution fails to meet criteria, when the column is changed or channeling occurs, and once every 7 days when in use.
3. The GPC calibration is acceptable if the two UV traces meet the following requirements:
a. Peaks must be observed and symmetrical for all compounds in the calibration solution.
b. Corn oil and the phthalate peaks exhibit > 85% resolution.
c. Phthalate and methoxychlor peaks exhibit > 85% resolution.
d. Methoxychlor and perylene peaks exhibit > 85% resolution.
e. Perylene and sulfur peaks must not be saturated and should exhibit > 90% baseline resolution.
f. The RT shift is < 5% between UV traces for bis(2-ethylhexyl) phthalate and perylene.
4. A GPC blank must be analyzed after each GPC calibration. The concentration for any target analyte in the GPC blank must not exceed the CRQL.
5. The calibration verification must be performed at least once every 7 days according to the specifications.
D. Evaluation
1. Verify that the GPC calibration is performed at the specified frequency.
2. Verify that there are two UV traces present and that the RT shift for bis(2-ethylhexyl) phthalate and perylene is < 5%.
3. Verify that the analytes in the GPC calibration standard are present and the peaks are symmetrical in both UV traces meeting the minimum resolution requirements.
4. Verify that no target analyte in the GPC blank exceeds the CRQL.
5. Verify that the GPC calibration verification is performed at the specified frequency.
E. Action
1. If GPC calibration and calibration verification criteria are not met, examine the raw data for the presence of high molecular weight contaminants; and examine subsequent sample data for unusual peaks. Use professional judgment to qualify the data. If the laboratory chooses to analyze samples under unacceptable GPC criteria, notify the EPA Regional CLP COR.

Organic Data Review Semivolatiles
January 2017 142
a. If the RT shift of bis(2-ethylhexyl) phthalate and perylene is > 5%, the GPC unit may be in an unstable temperature environment and subject to erratic performance. The expected result may be an unknown bias in the data. Contact the EPA Regional CLP COR to arrange for sample reanalysis.
2. Annotate the potential effects on the sample data resulting from the GPC cleanup analyses not yielding acceptable results in the Data Review Narrative.

Organic Data Review Semivolatiles
January 2017 143
X. Internal Standard
A. Review Items
Form 8A-OR, quantitation reports, and chromatograms. (SOW SOM02.4 – Exhibit B, Section 3.4 and Exhibit D/SVOA, Sections 7.2.2.7, 11.3.5, and 11.3.6 )
B. Objective
The objective is to evaluate the internal standard performance to ensure that GC/MS sensitivity and response are stable during each analysis.
C. Criteria
1. The internal standard solution must be added to all samples and blanks at the specified concentration. The internal standard solution must contain all internal standard compounds specified in the method.
2. The area response of each internal standard compound in all samples and blanks must be within the inclusive ranges of 50-200% of the area response of the same internal standard compound from the associated opening CCV or the mid-point standard CS3 from the associated ICAL.
3. The RT of the internal standard compound in the sample or blank must not vary more than ±30.0 seconds from the RT of the same internal standard compound in the associated opening CCV or mid-point standard CS3 from the associated ICAL.
D. Evaluation
1. Verify that all required internal standard compounds were added to sample and blank analyses at the specified concentrations.
2. Check the raw data (e.g., chromatograms and quantitation reports) to verify that the RT and area response of each internal standard compound in a sample or blank are reported on Form 8A-OR.
3. Verify that the RTs and area responses for all internal standard compounds are within the specified criteria. If internal standard RTs are significantly different from the associated CCV or ICAL midpoint (i.e., more than 30 seconds), the internal standard peak may have been misidentified, but most likely a change in the chromatographic system should be suspected. This could be an improper injection, a leak in the GC system, or the effect of a highly contaminated matrix. Normally, the area counts will also suffer in this situation, but even if they appear unaffected, both quantitative and qualitative results should be considered highly suspect.
4. If there is a reanalysis for a particular sample, determine which analysis is the best data to report. Considerations include, but are not limited to:
a. Magnitude and direction of the internal standard area response shift.
b. Magnitude and direction of the internal standard RT shift.
c. Technical holding times.
d. Comparison of the values of the target analytes reported in each method.
e. Other QC information.
NOTE: For data obtained from the CLP, the preceding criteria are evaluated as part of the CCS process. Information regarding the noncompliant internal standard area response or RT can be obtained from the NFG reports and may be used as part of the evaluation process.

Organic Data Review Semivolatiles
January 2017 144
E. Action
NOTE: Apply the action to the target analytes in samples or blanks that are associated to the noncompliant internal standard compound in Table 45. The internal standard and the associated target analytes are in Exhibit D – Semivolatile Organic Compounds Analysis, Tables 9 and 10, of the SOW.
1. If the required internal standard compounds were not added to a sample or blank, qualify detects and non-detects as unusable (R).
2. If the required internal standard compound was not analyzed at the specified concentration in a sample or blank, use professional judgment to qualify detects and non-detects.
3. If the area response of an internal standard compound in a sample or blank is < 20% of the area response of the same internal standard compound in the associated opening CCV or mid-point standard CS3 from the associated ICAL, qualify detects as estimated high (J+) and non-detects as unusable (R).
4. If the area response of an internal standard compound in a sample or blank is ≥ 20 % and < 50% of the area response of the same internal standard compound in the associated opening CCV or mid-point standard CS3 from the associated ICAL, qualify detects as estimated high (J+) and non-detects as estimated (UJ).
5. If the area response of an internal standard compound in a sample or blank is within the inclusive range of 50-200% of the area response of the same internal standard compound in the associated opening CCV or mid-point standard CS3 from the associated ICAL, detects and non-detects should not be qualified.
6. If the area response of an internal standard compound in a sample or blank is > 200% of the area response of the same internal standard compound in the associated opening CCV or mid-point standard CS3 from the associated ICAL, qualify detects as estimated low (J-). Non-detects should not be qualified.
7. If the RT shift between sample/blank and the associated opening CCV or mid-point standard CS3 from the associated ICAL of an internal standard compound is > 30.0 seconds, qualify detects and non-detects as unusable (R). The EPA Regional CLP COR should be contacted to arrange for reanalysis.
8. If the RT shift between sample/blank and the associated opening CCV or mid-point standard CS3 from the associated ICAL of an internal standard compound is < 30.0 seconds, detects and non-detects should not be qualified.
9. If the internal standard performance criteria are grossly exceeded, annotate the potential effects on the data in the Data Review Narrative and note it for EPA Regional CLP COR action.

Organic Data Review Semivolatiles
January 2017 145
Table 45. Internal Standard Actions for Semivolatile Analysis
Criteria Action
Detect Non-detect
Area response < 20% of the opening CCV or mid-point standard CS3 from ICAL J+ R
20% ≤ Area response < 50% of the opening CCV or mid-point standard CS3 from ICAL J+ UJ
50% ≤ Area response ≤ 200% of the opening CCV or mid-point standard CS3 from ICAL No qualification No qualification
Area response > 200% of the opening CCV or mid-point standard CS3 from ICAL J- No qualification
RT shift between sample/blank and opening CCV or mid-point standard CS3 from ICAL > 30.0 seconds R R
RT shift between sample/blank and opening CCV or mid-point standard CS3 from ICAL < 30.0 seconds No qualification No qualification
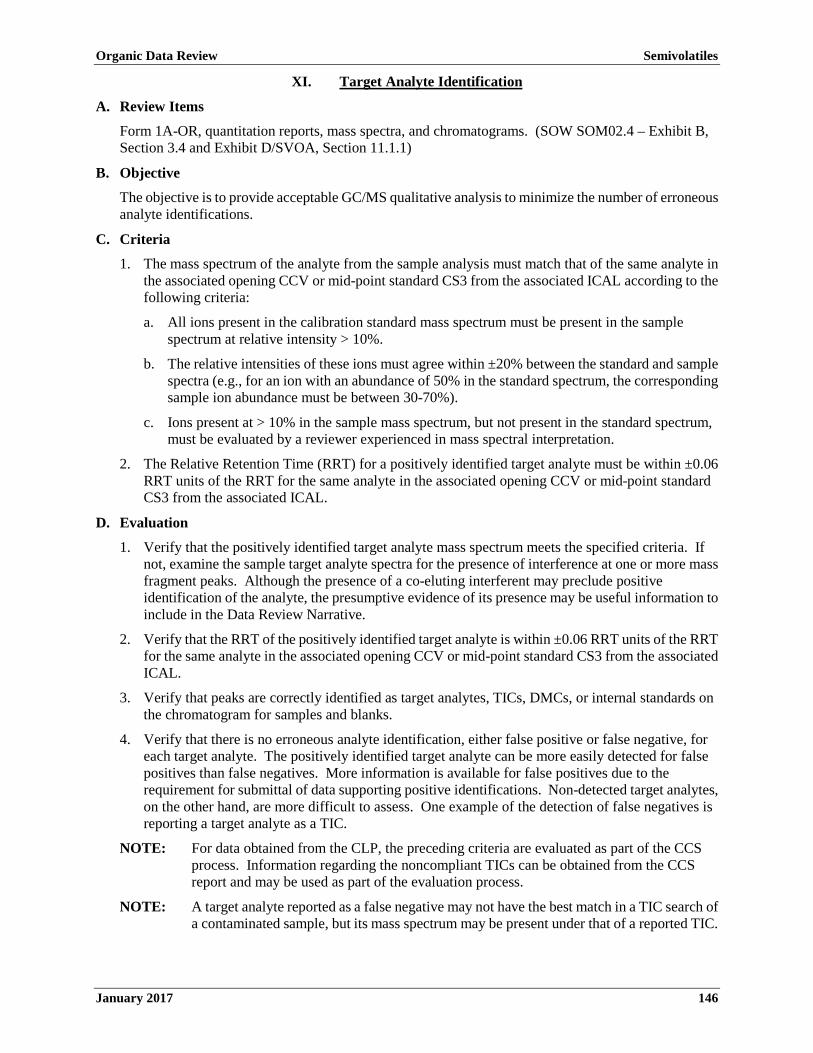
Organic Data Review Semivolatiles
January 2017 146
XI. Target Analyte Identification
A. Review Items
Form 1A-OR, quantitation reports, mass spectra, and chromatograms. (SOW SOM02.4 – Exhibit B, Section 3.4 and Exhibit D/SVOA, Section 11.1.1)
B. Objective
The objective is to provide acceptable GC/MS qualitative analysis to minimize the number of erroneous analyte identifications.
C. Criteria
1. The mass spectrum of the analyte from the sample analysis must match that of the same analyte in the associated opening CCV or mid-point standard CS3 from the associated ICAL according to the following criteria:
a. All ions present in the calibration standard mass spectrum must be present in the sample spectrum at relative intensity > 10%.
b. The relative intensities of these ions must agree within ±20% between the standard and sample spectra (e.g., for an ion with an abundance of 50% in the standard spectrum, the corresponding sample ion abundance must be between 30-70%).
c. Ions present at > 10% in the sample mass spectrum, but not present in the standard spectrum, must be evaluated by a reviewer experienced in mass spectral interpretation.
2. The Relative Retention Time (RRT) for a positively identified target analyte must be within ±0.06 RRT units of the RRT for the same analyte in the associated opening CCV or mid-point standard CS3 from the associated ICAL.
D. Evaluation
1. Verify that the positively identified target analyte mass spectrum meets the specified criteria. If not, examine the sample target analyte spectra for the presence of interference at one or more mass fragment peaks. Although the presence of a co-eluting interferent may preclude positive identification of the analyte, the presumptive evidence of its presence may be useful information to include in the Data Review Narrative.
2. Verify that the RRT of the positively identified target analyte is within ±0.06 RRT units of the RRT for the same analyte in the associated opening CCV or mid-point standard CS3 from the associated ICAL.
3. Verify that peaks are correctly identified as target analytes, TICs, DMCs, or internal standards on the chromatogram for samples and blanks.
4. Verify that there is no erroneous analyte identification, either false positive or false negative, for each target analyte. The positively identified target analyte can be more easily detected for false positives than false negatives. More information is available for false positives due to the requirement for submittal of data supporting positive identifications. Non-detected target analytes, on the other hand, are more difficult to assess. One example of the detection of false negatives is reporting a target analyte as a TIC.
NOTE: For data obtained from the CLP, the preceding criteria are evaluated as part of the CCS process. Information regarding the noncompliant TICs can be obtained from the CCS report and may be used as part of the evaluation process.
NOTE: A target analyte reported as a false negative may not have the best match in a TIC search of a contaminated sample, but its mass spectrum may be present under that of a reported TIC.

Organic Data Review Semivolatiles
January 2017 147
E. Action
1. If the positively identified target analyte mass spectrum does not meet the specified criteria, qualifydetect as unusable (R), or report the result at the CRQL and qualify as non-detect (U).
2. If the RRT for a positively identified target analyte is outside the specified RRT windows, qualifydetects as unusable (R), or report the result at the CRQL and qualify as non-detect (U).
3. If it is determined that cross-contamination has occurred, use professional judgment to qualifydetects. Annotate any changes made to the reported analytes due to either false positive or negativeidentifications, or concerns regarding target analyte identifications in the Data Review Narrative.Note the necessity for numerous or significant changes for EPA Regional CLP COR action.

Organic Data Review Semivolatiles
January 2017 148
XII. Target Analyte Quantitation and Reported Contract Required Quantitation Limit
A. Review Items
Form 1A-OR, sample preparation sheets, SDG Narrative, quantitation reports, and chromatograms. (SOW SOM02.4 – Exhibit B, Section 3.4 and Exhibit D/SVOA, Sections 11.2.1, 11.2.1.6, and 11.2 3)
B. Objective
The objective is to ensure that the reported results and CRQLs for target analytes are accurate.
C. Criteria
1. Target analyte results and the sample-specific CRQLs must be calculated according to the correct equations.
2. Target analyte RRF must be calculated using the correct associated internal standard, as listed in the method. Quantitation must be based on the quantitation ion (m/z) specified in the method for both the internal standards and target analytes. Target analyte result must be calculated using the RRF������ from the associated ICAL.
D. Evaluation
1. Verify that the results for all positively identified analytes are calculated and reported by the laboratory.
2. Verify that the CRQLs are calculated for the non-detects and reported accordingly.
3. Verify that the correct internal standard, quantitation ion, and RRF������ are used to calculate the reported results.
4. Verify that the same internal standard, quantitation ion, and RRF������ are used consistently.
5. Verify that the sample-specific CRQLs have been calculated and adjusted to reflect Percent Solids (%Solids), original sample mass/volume, and any applicable dilutions.
a. For soil/sediment samples that are high in moisture (i.e., < 30% solids), evaluation of the presence of each analyte depends on the anticipated interaction between the analyte and the total matrix, as well as how the sample was processed.
b. If the phases of a sample were separated and processed separately, no particular qualification on the grounds of matrix distribution is warranted.
c. If a soil/sediment sample was processed by eliminating most of the water, analytes that are highly water soluble under ambient conditions may be severely impacted such that their presence cannot be completely evaluated.
NOTE: For data obtained from the CLP, the preceding criteria are evaluated as part of the CCS process. Information regarding the noncompliant results or CRQLs can be obtained from the CCS report and may be used as part of the evaluation process.
E. Action
1. If any discrepancies are found, contact the EPA Regional CLP COR, who may contact the laboratory to obtain additional information that could resolve any differences. If a discrepancy remains unresolved, use professional judgment to decide which value is the most accurate and to determine whether qualification of data is warranted. Annotate the reasons for any data qualification in the Data Review Narrative.
2. If errors are detected in results and CRQL calculations, perform a more comprehensive recalculation.
3. If the %Solids for a soil/sediment sample is < 10.0%, use professional judgment to qualify detects and non-detects.

Organic Data Review Semivolatiles
January 2017 149
4. If the %Solids for a soil/sediment sample is ≥ 10.0% and < 30%, use professional judgment to qualify detects and non-detects.
5. If the %Solids for a soil/sediment sample is ≥ 30.0%, detects and non-detects should not be qualified.
6. If sample results are < CRQLs and ≥ MDLs, qualify as estimated (J).
7. Note numerous or significant failures to accurately quantify the target analytes, or to properly evaluate and adjust CRQLs, for EPA Regional CLP COR action.
Table 46. Percent Solids Actions for Semivolatile Analysis for Non-Aqueous Samples
Criteria Action
Detects Non-detects
%Solids < 10.0% Use professional judgment Use professional judgment
10.0% ≤ %Solids < 30.0% Use professional judgment Use professional judgment
%Solids ≥ 30.0% No qualification No qualification

Organic Data Review Semivolatiles
January 2017 150
XIII. Tentatively Identified Compounds
A. Review Items
Form 1B-OR, chromatograms, library search printouts, and spectra for the TIC candidates. (SOW SOM02.4 – Exhibit B, Section 3.4 and Exhibit D/SVOA, Sections 11.1.2 and 11.2.2)
B. Objective
The objective is to provide tentative identifications to chromatographic peaks that are not identified as target analytes, DMCs, or internal standards.
C. Criteria
For each sample, the laboratory must conduct a mass spectral search of the National Institute of Standards and Technology (NIST) (2011 release or later), Wiley (2011 release or later), or equivalent mass spectral library, and report the possible identity for up to 30 of the largest peaks which are not DMCs, internal standards, or target analytes. The peak for a TIC should have an area or height > 10% of the area or height of the nearest internal standard. The estimated concentration for a TIC is calculated similarly to that for a target analyte, using total ion areas for the TIC and the internal standard, and assuming an RRF of 1.0.
1. Guidelines for tentative identification are as follows:
a. Major ions (> 10% Relative Intensity) in the reference spectrum should be present in the sample spectrum.
b. The relative intensities of the major ions should agree within ±20% between the sample and the reference spectra.
c. Molecular ions present in the reference spectrum should be present in the sample spectrum.
d. Non-target compounds receiving a library search match of 85% or higher are considered a “probable match”. The compound should be reported unless the mass spectral interpretation specialist feels there is evidence not to report the compound as identified by the library search program. The laboratory should include the justification for not reporting a compound as listed by the search program in the SDG Narrative.
e. If the library search produces more than one compound ≥ 85%, the compound with the highest percent match (report first compound if percent match is the same for two or more compounds) should be reported, unless the mass spectral interpretation specialist feels that the highest match compound should not be reported or another compound with a lower match should be reported. The laboratory should include the justification for not reporting the compound with the highest spectral match within the SDG Narrative. DMCs, internal standards, and target analytes should not be reported as TICs.
f. If the library search produces a series of obvious isomer compounds with library search matches ≥ 85%, the compound with the highest library search percent match (or the first compound if the library search matches are the same) should be reported. The laboratory should note in the SDG Narrative that the exact isomer configuration, as reported, may not be accurate.
g. If the library search produces no matches ≥ 85%, and in the technical judgment of the mass spectral interpretation specialist no valid tentative identification can be made, the compound should be reported as “unknown”. The mass spectral specialist should give additional classification of the unknown compound, if possible (e.g., “unknown aromatic”, “unknown hydrocarbon”, “unknown acid type”, “unknown chlorinated compound”). If probable molecular weights can be distinguished, they should be included.

Organic Data Review Semivolatiles
January 2017 151
h. The Chemical Abstracts Service (CAS) registry number is the unique identifier for each chemical compound. As the rules of chemical nomenclature have changed over time, each chemical substance is liable to have several names or synonyms [i.e., trade or brand name(s); generic or common name(s); trivial or systematic; or International Union of Pure and Applied Chemistry (IUPAC) name(s)]. Whether synonyms or other names are created for this compound, the CAS registry number will remain unchanged. The CAS registry number is simply an identifier which has no structural significance. Regardless of RTs, if the library search produces two or more compounds at or above 85% with the same CAS number, the compound with the highest percent match (report first compound if the percent match is the same for two or more compounds) should be reported unless the mass spectral interpretation specialist feels there is just evidence not to report the compound with the highest match.
i. If the library search produces only one and the same compound (i.e., the same CAS registry number) with the match at or above 85% at two different RTs, the compound having the highest percent match should be reported as TIC and the other one could be reported as unknown. If both TICs have the same percent match for the same compound, one of the TICs could be reported as unknown. Such justifications should be included in the SDG Narrative.
j. Alkanes are not to be reported as TICs on Form 1B-OR. An alkane is defined as any hydrocarbon with the generic formula CnH2n+2 (straight-chain or branched) or CnH2n (cyclic) that contains only C-H and C-C single bonds. When the preceding alkanes are tentatively identified, the concentration(s) should be estimated and the analytes reported as alkanes by class (i.e., straight-chain, branched, cyclic, as a series, or as applicable) in the SDG Narrative. Total alkanes concentration should be reported on Form 1B-OR.
D. Evaluation
1. Verify that the laboratory has generated a library search for all required peaks in the chromatograms for samples and blanks.
2. Verify that TIC peaks present in samples are not found in blanks. When a low-level, non-target compound that is a common artifact or laboratory contaminant is detected in a sample, a thorough check of blank chromatograms may require looking for peaks which are < 10% of the internal standard height, but present in the blank chromatogram at a similar RRT.
3. Verify that mass spectra for all reported TICs are present for every sample and blank.
4. Review ions present in the sample spectrum, but not in the reference spectrum, for possible background contamination, interference, or presence of coeluting compounds.
5. Review ions present in the reference spectrum, but not in the sample spectrum, for possible subtraction from the sample spectrum because of background contamination or coeluting compounds. Data system library reduction programs can sometimes create these discrepancies.
6. Consider all reasonable choices since TIC library searches often yield several candidate compounds having a close matching score.
7. Be aware of common laboratory artifacts/contaminants and their sources (e.g., Aldol condensation products, solvent preservatives, and reagent contaminants). These may be present in blanks and not reported as sample TICs, such as:
a. Common laboratory contaminants include CO2 (m/z 44), siloxanes (m/z 73), diethyl ether, hexane, certain freons, and phthalates at levels < 100 µg/L.
b. Solvent preservatives include cyclohexene (a methylene chloride preservative). Related by-products include cyclohexanone, cyclohexenone, cyclohexanol, cyclohexenol, chlorocyclohexene, and chlorocyclohexanol.
c. Aldol condensation reaction products of acetone include 4-hydroxy-4-methyl-2-pentanone, 4-methyl-2-penten-2-one, and 5,5-dimethyl-2(5H)-furanone.

Organic Data Review Semivolatiles
January 2017 152
8. A target analyte may be identified by non-target library search procedures, even though it is not identified as a target analyte (false negative). If the total area quantitation method is used, request that the laboratory recalculate the result using the proper quantitation ion and RRF.
a. A non-target compound may be incorrectly identified by the instrument’s target analyte data processor as a target analyte (false positive). When this happens, the non-target library search procedure will not detect the false positive as a TIC. In this case, request that the laboratory properly identify the analyte as a TIC and recalculate the result using the total area quantitation method and an RRF of 1.0.
b. Evaluate other sample chromatograms and check for both false negatives and false positives to determine if the occurrence is isolated or systematic.
9. Verify that the TIC concentration is calculated using an RRF of 1.0.
E. Action
1. If the library search match for a TIC is ≥ 85%, qualify the TIC as tentatively identified with estimated concentration (NJ).
2. If the library search match for a TIC is < 85%, qualify the TIC as unknown with estimated concentration (J).
3. General actions related to the review of TIC results are as follows:
a. If it is determined that a tentative identification of a non-target compound is unacceptable, change the tentative identification to “unknown” or another appropriate identification, and qualify the result as estimated (J).
b. If a library search or proper calculation is not performed for all contractually-required peaks, the EPA Regional CLP COR may request the data from the laboratory.
c. Use professional judgment to determine whether a library search result for a TIC represents a reasonable identification. If there is more than one possible match, report the result as “either compound X or compound Y”. If there is a lack of isomer specificity, change the TIC result to a non-specific isomer result (e.g., 1,3,5-trimethyl benzene to trimethyl benzene isomer) or to a compound class (e.g., 2-methyl, 3-ethyl benzene to a substituted aromatic compound).
d. Other Case factors may influence TIC judgments. If a sample TIC match is poor, but other samples have a TIC with a valid library match, similar RRT, and the same ions, infer identification information from the other sample TIC results.
4. Note any changes made to the reported data or any concerns regarding TIC identifications in the Data Review Narrative.
5. Note any failure to properly evaluate and report TICs for EPA Regional CLP COR action.

Organic Data Review Semivolatiles
January 2017 153
XIV. System Performance
A. Review Items
Form 8A-OR and chromatograms. (SOW SOM02.4 – Exhibit B, Section 3.4 and Exhibit D/SVOA, Section 11.1)
B. Objective
The objective is to ensure that the system is stable during the analytical sequence to produce quality data.
C. Criteria
There are no specific criteria for system performance.
D. Evaluation
1. Abrupt discrete shifts in the Reconstructed Ion Chromatogram (RIC) baseline may indicate a change in the instrument’s sensitivity or the zero setting. A baseline “shift” could indicate a decrease in sensitivity in the instrument or an increase in the instrument zero, possibly causing target compounds at or near the detection limit to miss detection. A baseline “rise” could indicate problems such as a change in the instrument zero, a leak, or degradation of the column.
2. Poor chromatographic performance affects both qualitative and quantitative results. Indications of substandard performance include:
a. High RIC background levels or shifts in absolute RTs of internal standards.
b. Excessive baseline rise at elevated temperature.
c. Extraneous peaks.
d. Loss of resolution.
e. Peak tailing or peak splitting that may result in inaccurate quantitation.
3. A drift in instrument sensitivity may occur during the 12-hour period and may be an indication of possible internal standard spiking problems. This could be discerned by examination of the internal standard area on Form 8A-OR for trends such as a continuous or near-continuous increase or decrease in the internal standard area over time.
E. Action
1. Use professional judgment to qualify the data if it is determined that system performance has degraded during sample analyses.
2. Note any degradation of system performance which significantly affected the data for EPA Regional CLP COR action.

Organic Data Review Semivolatiles
January 2017 154
XV. Performance Evaluation Sample
A. Review Items
Form 1A-OR, TR/COC Record documentation, preparation logs, instrument printouts, and raw data. (SOW SOM02.4 – Exhibit B, Section 3.4 and Exhibit F, Section 4.1)
B. Objective
The objective is to determine the validity of the analytical results based on the recovery of the PE sample(s).
C. Criteria
1. Matrix-specific PE samples shall be analyzed utilizing the same analytical methods and Quality Assurance/Quality Control (QA/QC) procedures as employed for the samples, at a frequency to be determined by each EPA Region for each site. PE samples must be analyzed in an SDG containing field samples for the Case, using the same procedures, reagents, and instrumentation.
D. Evaluation
1. Verify, using Form 1A-OR, preparation logs, and raw data, that the PE samples were analyzed with the field samples and field blanks in the SDG.
2. Verify, using Form 1A-OR, that the PE sample results are within the warning limits (95% confidence interval) and action limits (99% confidence interval).
3. If a significant number (i.e., half or more) of the analytes in the PE samples fall outside of the 95% warning or 99% action criteria, or a number of false positive results are reported, evaluate the overall impact on the data.
E. Action
NOTE: If the PE sample criteria are not met, the laboratory performance and method accuracy are in question. Use professional judgment to determine if the data should be qualified or rejected. The following guidance is suggested for qualifying sample data associated with a PE sample that does not meet the required criteria.
For a PE sample that does not meet the technical criteria, apply the action to all samples in the same preparation batch. If the concentration of any analyte in a PE sample is not comparable to the analyte’s concentration in the field samples or field blanks (i.e., it is much higher or much lower than the concentration in these samples), the action may be applied to only those samples in which the analyte’s concentration is comparable to the PE sample concentration.
1. If the PE sample was not analyzed with the field samples and field blanks, use professional judgment to determine if the associated sample results should be qualified. Obtain additional information from the laboratory, if necessary. If a laboratory fails to analyze the PE sample(s) provided with field samples and field blanks, or if a laboratory consistently fails to generate acceptable PE sample results, record the situation in the Data Review Narrative, and note it for EPA Regional CLP COR action.
2. If the PE sample results are outside the lower warning limits but inside the lower action limits, qualify detects as estimated low (J-) and non-detects as estimated (UJ).
3. If the PE sample results are outside the lower action limits, qualify detects as estimated low (J-) and non-detects as unusable (R).
4. If the PE sample results are within the limits, detects and non-detects should not be qualified.
5. If the PE sample results are outside the upper warning limits but inside the upper action limits, qualify detects as estimated high (J+). Non-detects should not be qualified.

Organic Data Review Semivolatiles
January 2017 155
6. If the PE sample results are outside the upper action limits, qualify detects as estimated high (J+). Non-detects should not be qualified.
7. Annotate the potential effects on the data due to out-of-control PE sample results in the Data Review Narrative.
Table 47. PE Sample Actions for Semivolatile Analysis
Criteria Action
Detect Non-detect PE sample results outside lower warning limits but inside lower action limits J- UJ
PE sample results outside lower action limits J- R PE sample results within limits No qualification No qualification PE sample results outside upper warning limits but inside upper action limits J+ No qualification
PE sample results outside upper action limits J+ No qualification
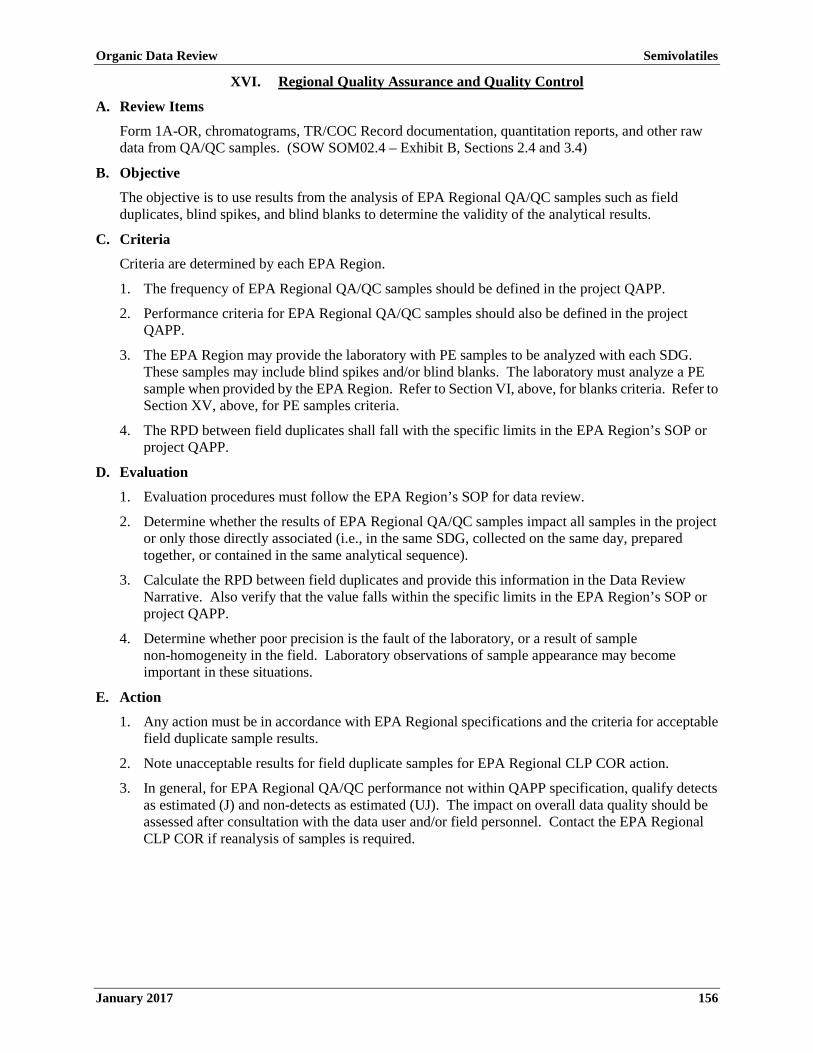
Organic Data Review Semivolatiles
January 2017 156
XVI. Regional Quality Assurance and Quality Control
A. Review Items
Form 1A-OR, chromatograms, TR/COC Record documentation, quantitation reports, and other raw data from QA/QC samples. (SOW SOM02.4 – Exhibit B, Sections 2.4 and 3.4)
B. Objective
The objective is to use results from the analysis of EPA Regional QA/QC samples such as field duplicates, blind spikes, and blind blanks to determine the validity of the analytical results.
C. Criteria
Criteria are determined by each EPA Region.
1. The frequency of EPA Regional QA/QC samples should be defined in the project QAPP.
2. Performance criteria for EPA Regional QA/QC samples should also be defined in the project QAPP.
3. The EPA Region may provide the laboratory with PE samples to be analyzed with each SDG. These samples may include blind spikes and/or blind blanks. The laboratory must analyze a PE sample when provided by the EPA Region. Refer to Section VI, above, for blanks criteria. Refer to Section XV, above, for PE samples criteria.
4. The RPD between field duplicates shall fall with the specific limits in the EPA Region’s SOP or project QAPP.
D. Evaluation
1. Evaluation procedures must follow the EPA Region’s SOP for data review.
2. Determine whether the results of EPA Regional QA/QC samples impact all samples in the project or only those directly associated (i.e., in the same SDG, collected on the same day, prepared together, or contained in the same analytical sequence).
3. Calculate the RPD between field duplicates and provide this information in the Data Review Narrative. Also verify that the value falls within the specific limits in the EPA Region’s SOP or project QAPP.
4. Determine whether poor precision is the fault of the laboratory, or a result of sample non-homogeneity in the field. Laboratory observations of sample appearance may become important in these situations.
E. Action
1. Any action must be in accordance with EPA Regional specifications and the criteria for acceptable field duplicate sample results.
2. Note unacceptable results for field duplicate samples for EPA Regional CLP COR action.
3. In general, for EPA Regional QA/QC performance not within QAPP specification, qualify detects as estimated (J) and non-detects as estimated (UJ). The impact on overall data quality should be assessed after consultation with the data user and/or field personnel. Contact the EPA Regional CLP COR if reanalysis of samples is required.

Organic Data Review Semivolatiles
January 2017 157
XVII. Overall Assessment of Data
A. Review Items
Entire data package, data review results, and (if available) the QAPP and Sampling and Analysis Plan (SAP).
B. Objective
The objective is to provide the overall assessment on data quality and usability.
C. Criteria
1. Review all available materials to assess the overall quality of the data, keeping in mind the additive nature of analytical problems.
2. Reported analyte concentrations must be quantitated according to the appropriate equations, as listed in the method. All sample results must be within the linear calibration ranges per the methods.
D. Evaluation
Examine the raw data to verify that the correct calculation of the sample results was reported by the laboratory. Analysis logs, instrument printouts, etc., should be compared to the reported sample results recorded on the appropriate Organic Data Reporting Forms (Form 1A-OR through Form 9B-OR).
1. Evaluate any technical problems which have not been previously addressed.
2. Examine the raw data for any anomalies (e.g., baseline shift).
3. Verify that the appropriate method is used in sample analysis.
4. Verify that there are no transcription or reduction errors.
5. Verify that target analyte results fall within the calibrated ranges.
6. If appropriate information is available, use professional judgment to assess the usability of the data in order to assist the data user in avoiding inappropriate use of the data. Review all available information, including the QAPP (specifically the acceptance and performance criteria), SAP, and communication with the data user that concerns the intended use and desired quality of these data.
E. Action
1. Use professional judgment to determine if there is any need to qualify data which were not qualified based on the QC criteria previously discussed.
2. Use professional judgment to qualify sample results and non-detects if the MDL exceeds the CRQL.
3. If a sample is not diluted properly when sample results exceed the upper limit of the calibration range, qualify sample results as estimated (J).
4. Write a brief Data Review Narrative to give the user an indication of the limitations of the analytical data.
5. Note any inconsistency of the data with the SDG Narrative for EPA Regional CLP COR action. If sufficient information on the intended use and required quality of the data is available, include an assessment of the usability of the data within the given context. This may be used as part of a formal Data Quality Assessment (DQA).

Organic Data Review Semivolatiles
January 2017 158
This page is intentionally left blank.
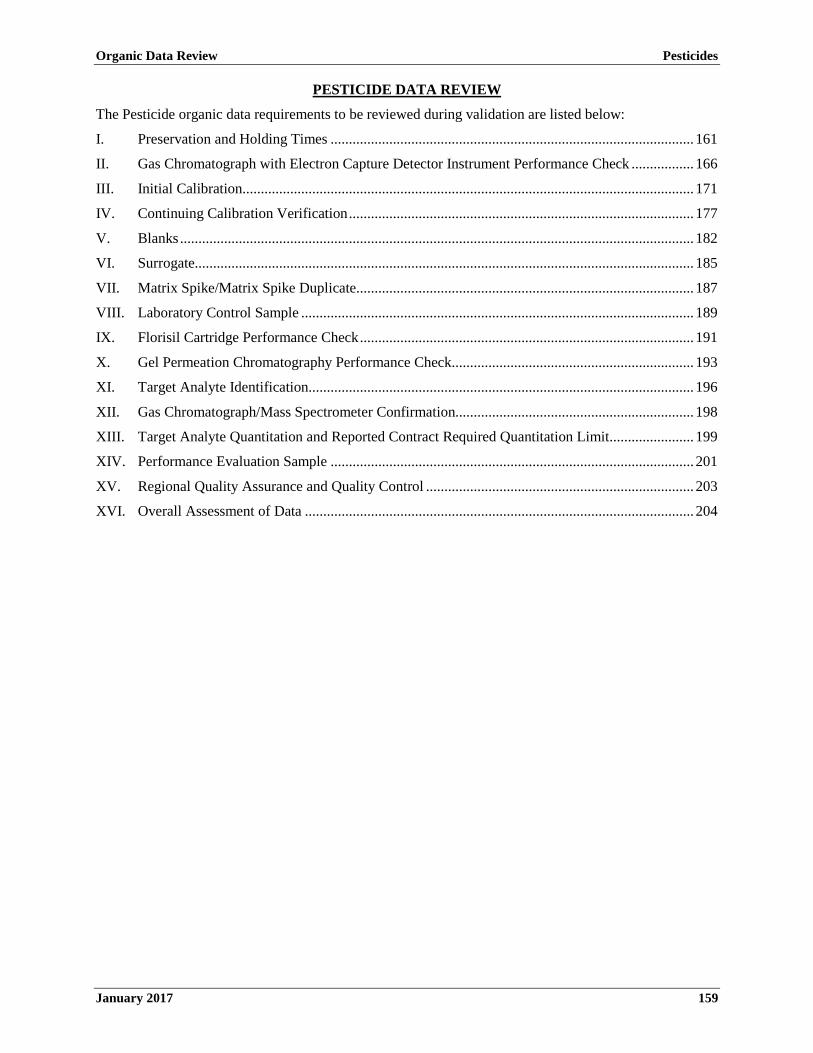
Organic Data Review Pesticides
January 2017 159
PESTICIDE DATA REVIEW
The Pesticide organic data requirements to be reviewed during validation are listed below:
I. Preservation and Holding Times ................................................................................................... 161
II. Gas Chromatograph with Electron Capture Detector Instrument Performance Check ................. 166
III. Initial Calibration ........................................................................................................................... 171
IV. Continuing Calibration Verification .............................................................................................. 177
V. Blanks ............................................................................................................................................ 182
VI. Surrogate........................................................................................................................................ 185
VII. Matrix Spike/Matrix Spike Duplicate ............................................................................................ 187
VIII. Laboratory Control Sample ........................................................................................................... 189
IX. Florisil Cartridge Performance Check ........................................................................................... 191
X. Gel Permeation Chromatography Performance Check .................................................................. 193
XI. Target Analyte Identification......................................................................................................... 196
XII. Gas Chromatograph/Mass Spectrometer Confirmation................................................................. 198
XIII. Target Analyte Quantitation and Reported Contract Required Quantitation Limit ....................... 199
XIV. Performance Evaluation Sample ................................................................................................... 201
XV. Regional Quality Assurance and Quality Control ......................................................................... 203
XVI. Overall Assessment of Data .......................................................................................................... 204
Organic Data Review Pesticides
January 2017 160
This page is intentionally left blank.

Organic Data Review Pesticides
January 2017 161
I. Preservation and Holding Times
A. Review Items
Form 1A-OR, Traffic Report/Chain of Custody (TR/COC) documentation, Form DC-1, raw data, sample extraction sheets, and the Sample Delivery Group (SDG) Narrative checking for: pH, shipping container temperature, holding time, and other sample conditions. (SOW SOM02.4 – Exhibit B, Section 3.4; Exhibit D/Introduction, Section 5.0; Exhibit D/General, Sections 8.0, 10.1.2.1, and 10.2.2.4.4; and Exhibit D/PEST, Section 8.0)
B. Objective
The objective is to determine the validity of the analytical results based on the sample conditions and the holding time of the sample.
C. Criteria
1. The extraction technical holding time is determined from the date of sample collection to the dateof sample extraction for aqueous and non-aqueous (soil and sediment) samples that are notdesignated for Toxicity Characteristic Leachate Procedure (TCLP)/Synthetic PrecipitationLeachate Procedure (SPLP) procedures. The extraction technical holding time for samplesdesignated for TCLP/SPLP is determined from the date of sample collection to the date ofTCLP/SPLP extraction.
2. For TCLP/SPLP leachate samples, extraction technical holding time is determined from the date ofTCLP/SPLP procedure completion to the date of the leachate sample extraction by the specifiedpreparation methods for aqueous samples. The analysis technical holding time is determined fromthe date of sample extraction completion to the date of sample analysis.
3. Samples should be in proper condition with shipping container temperatures at ≤ 6ºC upon receiptat the laboratory. All aqueous and non-aqueous samples shall be protected from light andrefrigerated at ≤ 6ºC (but not frozen) from the time of receipt at the laboratory. Sample extractsshall be stored at ≤ 6ºC (but not frozen) from the time of the extraction completion until analysis.
4. The extraction technical holding time criteria for aqueous samples, TCLP/SPLP aqueous filtratesamples, and TCLP/SPLP leachate samples that are properly preserved is 7 days.
5. The extraction technical holding time criteria for soil/sediment samples designated for TCLP/SPLPis 14 days.
6. The extraction technical holding time criteria for non-aqueous samples that are properly preservedis 14 days.
7. The analysis technical holding time criteria for extracts, including TCLP/SPLP leachate andaqueous filtrate sample extracts, is 40 days.
D. Evaluation
1. Review the SDG Narrative and the TR/COC Record documentation to determine if the samples arereceived intact and iced. If there is an indication of problems with the samples, the sample integritymay be compromised.
2. Verify that the extraction dates and the analysis dates for samples on Form 1A-OR and the raw dataare identical.
3. Establish extraction technical holding times for samples excluding TCLP/SPLP leachate samplesby comparing the sample collection dates on the TR/COC Record documentation with the dates ofextraction on Form 1A-OR and the sample extraction sheets.
4. Establish extraction technical holding times for TCLP/SPLP leachate samples by comparing thesample collection dates on the TR/COC Record documentation with the dates of extraction onsample extraction sheets.
Organic Data Review Pesticides
January 2017 162
5. Establish extraction technical holding times for TCLP/SPLP leachate samples by comparing thedates of TCLP/SPLP extraction on the extraction sheets with the dates of extraction on Form1A-OR and the preparation extraction log.
6. Determine the analysis technical holding times for samples after the completion of extraction bycomparing the dates of extraction with the dates of analysis on Form 1A-OR, as well as from theanalytical run logs.
E. Action
1. If samples are received with shipping container temperatures > 6°C, use professional judgment toqualify detects and non-detects.
2. If TCLP/SPLP extraction is performed within the 14-day extraction technical holding time forpreserved and not properly preserved soil/sediment samples designated for TCLP/SPLP, detectsand non-detects should not be qualified.
3. If TCLP/SPLP extraction is performed outside the 14-day extraction technical holding time forpreserved and not properly preserved soil/sediment samples designated for TCLP/SPLP, qualifydetects as estimated low (J-) and non-detects as unusable (R). Use caution in determining whethersome detected analytes should be qualified as estimated low (J-) or as estimated (J+), based onknowledge of individual analyte stability or interactions.
4. If discrepancies are found between the sample extraction date or analysis date and the date on theraw data, perform a more comprehensive review, contacting the laboratory if necessary through theUnited States Environmental Protection Agency Regional Contract Laboratory ProgramContracting Officer’s Representative (EPA Regional CLP COR), to determine the correct dates forestablishing the technical holding time.
5. If an aqueous sample, TCLP/SPLP aqueous filtrate sample, or TCLP/SPLP leachate sample is notproperly preserved, but extraction is performed within the 7-day technical holding time, and theextract is analyzed within the 40-day technical holding time, consider the extent of temperatureexcursion in addition to overall sample integrity, and use professional judgment to qualify detectsand non-detects.
6. If an aqueous sample, TCLP/SPLP aqueous filtrate sample, or TCLP/SPLP leachate sample is not properly preserved, extraction is performed outside the 7-day technical holding time, and/or the extract is analyzed outside the 40-day technical holding time, qualify detects as estimated (J) and non-detects as unusable (R). Use caution in determining whether some detected analytes should be qualified as estimated low (J-) or estimated high (J+), based on knowledge of individual analyte stability or interactions.
7. If an aqueous sample, TCLP/SPLP aqueous filtrate sample, or TCLP/SPLP leachate sample isproperly preserved, extraction is performed within the 7-day technical holding time, and the extractis analyzed within the 40-day technical holding time, detects and non-detects should not bequalified.
8. If an aqueous sample, TCLP/SPLP aqueous filtrate sample, or TCLP/SPLP leachate sample is properly preserved, extraction is performed outside the 7-day technical holding time, and/or the extract is analyzed outside the 40-day technical holding time, consider all evidence of compromised extract integrity (such as evaporation or refrigeration) in addition to overall sample integrity, and use professional judgment to qualify the data, in particular the direction of the bias.
9. If a non-aqueous sample is not properly preserved, but extraction is performed within the 14-daytechnical holding time, and the extract is analyzed within the 40-day technical holding time, useprofessional judgment to qualify detects and non-detects.
10. If a non-aqueous sample is not properly preserved, and extraction is performed outside the 14-day technical holding time, and/or the extract is analyzed outside the 40-day technical holding time, use professional judgment to qualify detects and non-detects.

Organic Data Review Pesticides
January 2017 163
11. If a non-aqueous sample is properly preserved, extraction is performed within the 14-day technical holding time, and the extract is analyzed within the 40-day technical holding time, detects and non-detects should not be qualified.
12. If a non-aqueous sample is properly preserved, extraction is performed outside the 14-day technical holding time, and/or the extract is analyzed outside the 40-day technical holding time, qualify detects as estimated low (J-) and non-detects as unusable (R). Use caution in determining whether some detected analytes should be qualified as estimated low (J-) or estimated high (J+), based on knowledge of individual analyte stability or interactions.
13. Note the effect of exceeding the holding time on the resulting data in the Data Review Narrative,whenever possible.
14. If technical holding times are grossly exceeded, qualify detects as estimated (J) and useprofessional judgment to qualify non-detects as unusable (R). Note this for EPA Regional CLPCOR action. Annotate the effect of the holding time exceedance on the resulting data in the DataReview Narrative, wherever possible.

Organic Data Review Pesticides
January 2017 164
Table 48. Preservation and Holding Time Actions for Pesticide Analysis
Matrix Preserved Criteria Action
Detect Non-detect
Aqueous
No
≤ ≤
7 days (for extraction) and 40 days (for analysis)
Use professional judgment
Use professional judgment
TCLP/SPLP aqueous filtrate sample and TCLP/SPLP leachate sample extracted within the 7-day technical holding time
No
> 7 days (for extraction) and/or > 40 days (for analysis)
J R TCLP/SPLP aqueous filtrate sample and TCLP/SPLP leachate sample not extracted within the 7-day technical holding time
Yes
≤ 7 days (for extraction) and ≤ 40 days (for analysis)
No qualification No qualification TCLP/SPLP aqueous filtrate sample and TCLP/SPLP leachate sample extracted within the 7-day technical holding time
Yes
> 7 days (for extraction) > 40 days (for analysis)
and/or
Use professional judgment
Use professional judgment
TCLP/SPLP aqueous filtrate sample and TCLP/SPLP leachate sample not extracted within the 7-day technical holding time
Yes/No Holding time grossly exceeded J Use professional
judgment R

Organic Data Review Pesticides
January 2017 165
Matrix Preserved Criteria Action
Detect Non-detect
Non-aqueous
No ≤ 14 days (for extraction) and ≤ 40 days (for analysis)
Use professional judgment
Use professional judgment
No > 14 days (for extraction) and/or > 40 days (for analysis)
Use professional judgment
Use professional judgment
Yes ≤ 14 days (for extraction) and ≤ 40 days (for analysis)
No qualification No qualification
Yes > 14 days (for extraction) and/or > 40 days (for analysis)
J- Use professional
judgment R
Yes/No Holding time grossly exceeded J Use professional
judgment R
Table 49. Holding Time Actions for Non-Aqueous Pesticide TCLP/SPLP Sample Analysis
Action Preserved Criteria
Detect Non-detect
No
TCLP/SPLP extraction performed within the 14-day technical holding time
No qualification No qualification
No
TCLP/SPLP extraction not performed within the 14-day technical holding time
J--
Yes
TCLP/SPLP extraction performed within the 14-day technical holding time
No qualification No qualification
Yes
TCLP/SPLP extraction not performed within the 14-day technical holding time
J--
Yes/No Holding time grossly exceeded
J Use professional
judgment
R

Organic Data Review Pesticides
January 2017 166
II. Gas Chromatograph with Electron Capture Detector Instrument Performance Check
A. Review Items
Form 6G-OR, Form 7B-OR, chromatograms, and data system printouts. (SOW SOM02.4 – Exhibit B, Section 3.4 and Exhibit D/PEST, Section 9.0)
B. Objective
The objective of performing Gas Chromatograph/Electron Capture Detector (GC/ECD) instrument performance checks is to ensure adequate resolution and instrument sensitivity.
C. Criteria
1. Resolution Check Mixture
a. The Resolution Check Mixture (RESC) is analyzed at the beginning of every initial calibration (ICAL) sequence on each GC column and instrument used for analysis. The RESC contains the following target analytes and surrogates listed in Table 50:
Table 50. Resolution Check Mixture trans-Chlordane Endrin ketone Endosulfan I Methoxychlor 4,4'-DDE Endosulfan II Dieldrin Heptachlor-epoxide Endosulfan sulfate cis-Chlordane alpha-BHC 4,4'-DDD beta-BHC 4,4'-DDT delta-BHC Endrin gamma-BHC Endrin aldehyde Aldrin Tetrachloro-m-xylene (surrogate) Heptachlor Decachlorobiphenyl (surrogate)
b. The resolution between two adjacent peaks in the RESC must be ≥ 80.0% for all analytes for
the primary column and ≥ 50.0% for the confirmation column in order to use Individual Standard Mixture C (INDC). If Individual Standard Mixture A (INDA) and Individual Standard Mixture B (INDB) are used, the resolution between two adjacent peaks must be ≥ 60.0%.
2. Performance Evaluation Mixture
a. The Performance Evaluation Mixture (PEM) is analyzed at the beginning (following the Resolution Check Standard) and at the end of the ICAL sequence. The PEM analysis must bracket one end of each 12-hour analytical period. The PEM contains the following target analytes and surrogates listed in Table 51:
Table 51. Performance Evaluation Mixture (PEM) gamma-BHC Endrin alpha-BHC Methoxychlor 4,4'-DDT Tetrachloro-m-xylene (surrogate) beta-BHC Decachlorobiphenyl (surrogate)
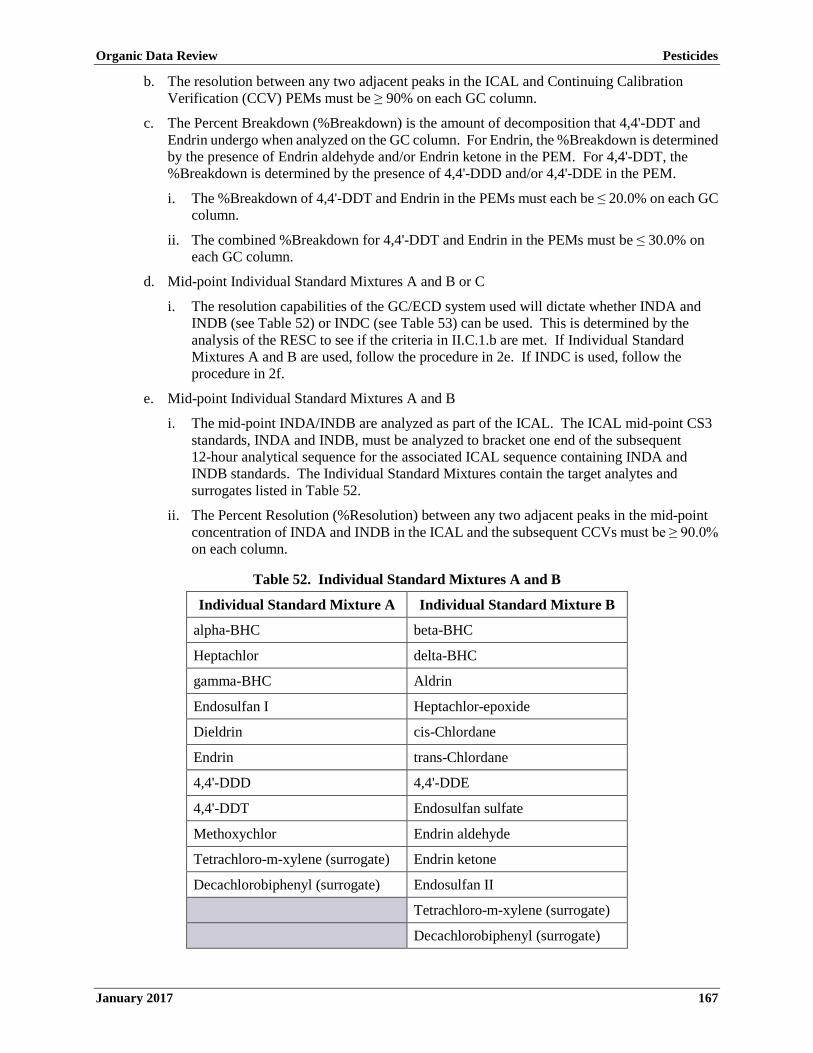
Organic Data Review Pesticides
January 2017 167
b. The resolution between any two adjacent peaks in the ICAL and Continuing Calibration Verification (CCV) PEMs must be ≥ 90% on each GC column.
c. The Percent Breakdown (%Breakdown) is the amount of decomposition that 4,4'-DDT and Endrin undergo when analyzed on the GC column. For Endrin, the %Breakdown is determined by the presence of Endrin aldehyde and/or Endrin ketone in the PEM. For 4,4'-DDT, the %Breakdown is determined by the presence of 4,4'-DDD and/or 4,4'-DDE in the PEM.
i. The %Breakdown of 4,4'-DDT and Endrin in the PEMs must each be ≤ 20.0% on each GC column.
ii. The combined %Breakdown for 4,4'-DDT and Endrin in the PEMs must be ≤ 30.0% on each GC column.
d. Mid-point Individual Standard Mixtures A and B or C
i. The resolution capabilities of the GC/ECD system used will dictate whether INDA and INDB (see Table 52) or INDC (see Table 53) can be used. This is determined by the analysis of the RESC to see if the criteria in II.C.1.b are met. If Individual Standard Mixtures A and B are used, follow the procedure in 2e. If INDC is used, follow the procedure in 2f.
e. Mid-point Individual Standard Mixtures A and B
i. The mid-point INDA/INDB are analyzed as part of the ICAL. The ICAL mid-point CS3 standards, INDA and INDB, must be analyzed to bracket one end of the subsequent 12-hour analytical sequence for the associated ICAL sequence containing INDA and INDB standards. The Individual Standard Mixtures contain the target analytes and surrogates listed in Table 52.
ii. The Percent Resolution (%Resolution) between any two adjacent peaks in the mid-point concentration of INDA and INDB in the ICAL and the subsequent CCVs must be ≥ 90.0% on each column.
Table 52. Individual Standard Mixtures A and B
Individual Standard Mixture A Individual Standard Mixture B
alpha-BHC beta-BHC
Heptachlor delta-BHC
gamma-BHC Aldrin
Endosulfan I Heptachlor-epoxide
Dieldrin cis-Chlordane
Endrin trans-Chlordane
4,4'-DDD 4,4'-DDE
4,4'-DDT Endosulfan sulfate
Methoxychlor Endrin aldehyde
Tetrachloro-m-xylene (surrogate) Endrin ketone
Decachlorobiphenyl (surrogate) Endosulfan II
Tetrachloro-m-xylene (surrogate)
Decachlorobiphenyl (surrogate)

Organic Data Review Pesticides
January 2017 168
f. Mid-point Individual Standard Mixture C
i. The mid-point INDC is analyzed as part of the ICAL. The ICAL mid-point CS3 standard, INDC, must be analyzed to bracket one end of the subsequent 12-hour analytical sequence for the associated ICAL sequence containing INDC standards. The INDC contains target analytes and surrogates listed in Table 53.
ii. The %Resolution between any two adjacent peaks in the mid-point concentration of INDC in the ICAL and CCV must be ≥ 80.0% for the primary column and ≥ 50.0% for the secondary column.
Table 53. Individual Standard Mixture C
alpha-BHC 4,4'-DDD
beta-BHC 4,4'-DDE
delta-BHC 4,4'-DDT
gamma-BHC Dieldrin
Aldrin Endrin
Heptachlor Endosulfan sulfate
Heptachlor-epoxide Endrin ketone
cis-Chlordane Endrin aldehyde
trans-Chlordane Methoxychlor
Endosulfan I Tetrachloro-m-xylene (surrogate)
Endosulfan II Decachlorobiphenyl (surrogate)
D. Evaluation
1. Resolution Check Mixture
a. Verify that the RESC is analyzed at the specified frequency and sequence.
b. Check the RESC data and Form 6G-OR to verify that if INDA and INDB are used in the analytical sequence, and that the %Resolution between two adjacent peaks for the required target analytes and surrogates in RESC is ≥ 60.0% on both GC columns.
c. Verify that if INDC is used in the analytical sequence, the %Resolution between two adjacent peaks for the required analytes and surrogates in RESC is ≥ 80.0% on the primary column and ≥ 50.0% on the secondary column.
2. Performance Evaluation Mixture
a. Verify that the PEM is analyzed at the specified frequency and sequence.
b. Check the ICAL and CCV PEM data and Form 6G-OR to verify that the %Resolution between adjacent peaks is ≥ 90.0% on both GC columns.
c. Check Form 7B-OR to verify that the %Breakdown of 4,4'-DDT is ≤ 20.0%, the %Breakdown of Endrin is ≤ 20.0%, and the combined %Breakdown of 4,4'-DDT and Endrin is ≤ 30.0% in all PEMs on both GC columns.
3. Mid-point Individual Standard Mixtures A and B
a. Check the ICAL and CCV mid-point INDA and INDB data on Form 6G-OR to verify that the %Resolution between adjacent peaks is ≥ 90.0% on both GC columns.

Organic Data Review Pesticides
January 2017 169
4. Mid-point Individual Standard Mixture C
a. Check the ICAL and CCV mid-point INDC data on Form 6G-OR to verify that the %Resolution between adjacent peaks is ≥ 80.0% for the primary column and ≥ 50.0% for the secondary column.
NOTE: For data obtained from the CLP, the preceding criteria are evaluated as part of the Contract Compliant Screening (CCS) process. Information regarding the noncompliant %Resolution and %Breakdown can be obtained from the National Functional Guidelines (NFG) reports and may be used as part of the evaluation process.
E. Action
1. Resolution Check Mixture
a. If the RESC is not performed at the specified sequence or frequency, use professional judgment to qualify detects and non-detects.
b. If the RESC %Resolution criteria are not met, qualify detects as presumptively present with estimated concentration (NJ) and non-detects as unusable (R).
2. Performance Evaluation Mixture
a. If the PEM is not performed at the specified frequency and sequence, qualify detects and non-detects as unusable (R).
b. If the PEM %Resolution criteria are not met, qualify detects as presumptively present with estimated concentration (NJ) and non-detects as unusable (R).
c. If the 4,4'-DDT %Breakdown is > 20.0%, qualify detected 4,4'-DDT, 4,4'-DDD, and 4,4'-DDE as estimated (J). When 4,4'-DDT is not detected, but 4,4'-DDD and 4,4'-DDE are detected, qualify non-detected 4,4'-DDT as unusable (R) and detected 4,4'-DDD and 4,4'-DDE as presumptively present with estimated concentration (NJ).
d. If the Endrin %Breakdown > 20.0%, qualify detected Endrin, Endrin aldehyde, and Endrin ketone as estimated (J). When Endrin is not detected, but Endrin aldehyde and Endrin ketone are detected, qualify non-detected Endrin as unusable (R) and detected Endrin aldehyde and Endrin ketone as presumptively present with estimated concentration (NJ).
e. If the combined %Breakdown for 4,4'-DDT and Endrin is > 30.0%, consider the degree of individual breakdown of 4,4'-DDT and Endrin and qualify as in Sections II.E.2.c and II.E.2.d accordingly.
3. Mid-point Individual Standard Mixtures (A and B) or (C)
a. If the mid-point Individual Standard Mixture CS3 is not performed at the specified frequency, qualify detects and non-detects as unusable (R).
4. If the mid-point Individual Standard Mixture CS3 %Resolution criteria are not met, qualify detects as presumptively present with estimated concentration (NJ) and non-detects as unusable (R).
5. Annotate the potential effects on the sample data resulting from the instrument performance check criteria in the Data Review Narrative.
6. If the laboratory has repeatedly failed to comply with the requirements for linearity, %Resolution, or 4,4'-DDT/Endrin %Breakdown, notify the EPA Regional CLP COR.

Organic Data Review Pesticides
January 2017 170
Table 54. GC/ECD Instrument Performance Check Actions
Criteria Action
Detect Non-detect
RESC not performed at the specified frequency and sequence
Use professional judgment
Use professional judgment
RESC % Resolution < 60.0% (INDA/INDB)
RESC % Resolution < 80.0% (INDC, primary column) % Resolution < 50.0% (INDC, secondary column)
NJ R
PEM not performed at the specified frequency and sequence R R
PEM %Resolution < 90.0% NJ R
PEM: 4,4'-DDT %Breakdown > 20.0% and 4,4'-DDT is detected
J for 4,4'-DDT, 4,4'-DDD, and
4,4'-DDE No qualification
PEM: 4,4'-DDT %Breakdown > 20.0% and 4,4'-DDT is not detected
NJ for 4,4'-DDD and 4,4'-DDE R for 4,4'- DDT
PEM: Endrin %Breakdown > 20.0% and Endrin is detected
J for Endrin, Endrin aldehyde, and Endrin
ketone No qualification
PEM: Endrin %Breakdown > 20.0% and Endrin is not detected
NJ for Endrin aldehyde and Endrin
ketone R for Endrin
PEM: Combined %Breakdown > 30%
Apply qualifiers as described above
considering degree of individual
breakdown.
Apply qualifiers as described above
considering degree of individual
breakdown.
CS3 INDA/INDB or INDC not performed at the specified frequency R R
%Resolution < 90.0% (CS3 INDA and INDB)
%Resolution < 80.0% (CS3 INDC, primary column) %Resolution < 50.0% ( CS3 INDC, secondary column)
NJ R
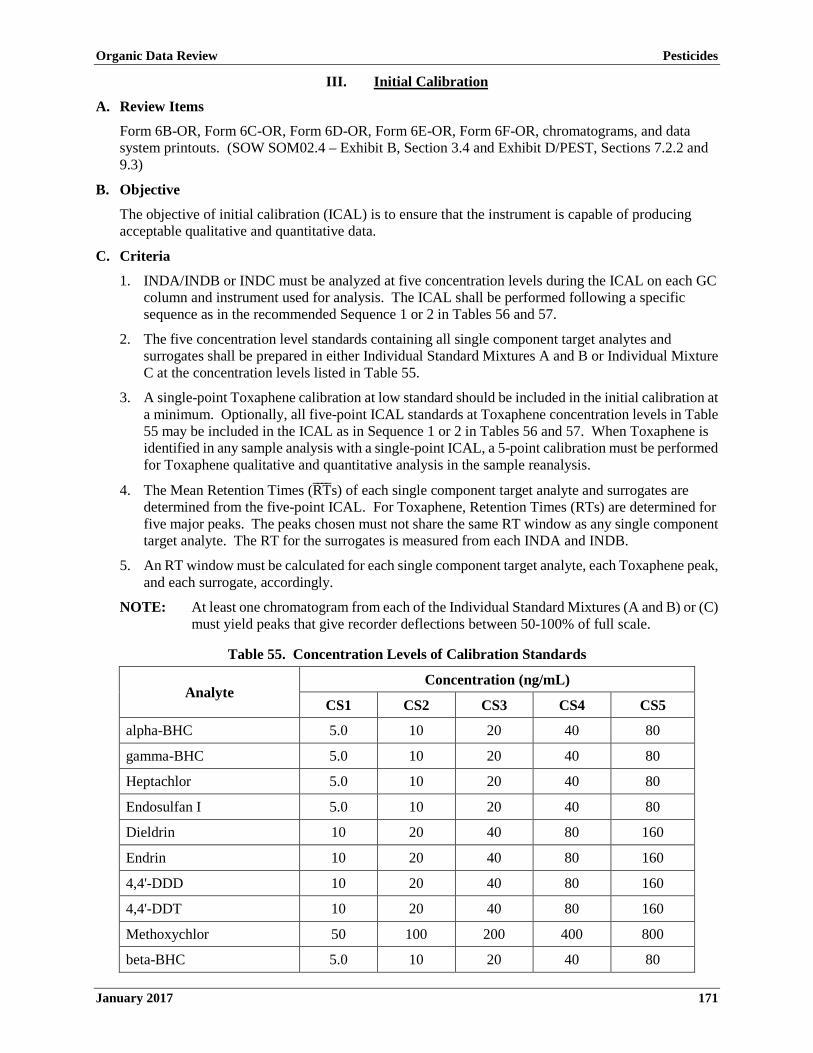
Organic Data Review Pesticides
January 2017 171
III. Initial Calibration
A. Review Items
Form 6B-OR, Form 6C-OR, Form 6D-OR, Form 6E-OR, Form 6F-OR, chromatograms, and data system printouts. (SOW SOM02.4 – Exhibit B, Section 3.4 and Exhibit D/PEST, Sections 7.2.2 and 9.3)
B. Objective
The objective of initial calibration (ICAL) is to ensure that the instrument is capable of producing acceptable qualitative and quantitative data.
C. Criteria
1. INDA/INDB or INDC must be analyzed at five concentration levels during the ICAL on each GC column and instrument used for analysis. The ICAL shall be performed following a specific sequence as in the recommended Sequence 1 or 2 in Tables 56 and 57.
2. The five concentration level standards containing all single component target analytes and surrogates shall be prepared in either Individual Standard Mixtures A and B or Individual Mixture C at the concentration levels listed in Table 55.
3. A single-point Toxaphene calibration at low standard should be included in the initial calibration at a minimum. Optionally, all five-point ICAL standards at Toxaphene concentration levels in Table 55 may be included in the ICAL as in Sequence 1 or 2 in Tables 56 and 57. When Toxaphene is identified in any sample analysis with a single-point ICAL, a 5-point calibration must be performed for Toxaphene qualitative and quantitative analysis in the sample reanalysis.
4. The Mean Retention Times (RT����s) of each single component target analyte and surrogates are determined from the five-point ICAL. For Toxaphene, Retention Times (RTs) are determined for five major peaks. The peaks chosen must not share the same RT window as any single component target analyte. The RT for the surrogates is measured from each INDA and INDB.
5. An RT window must be calculated for each single component target analyte, each Toxaphene peak, and each surrogate, accordingly.
NOTE: At least one chromatogram from each of the Individual Standard Mixtures (A and B) or (C) must yield peaks that give recorder deflections between 50-100% of full scale.
Table 55. Concentration Levels of Calibration Standards
Analyte Concentration (ng/mL)
CS1 CS2 CS3 CS4 CS5
alpha-BHC 5.0 10 20 40 80
gamma-BHC 5.0 10 20 40 80
Heptachlor 5.0 10 20 40 80
Endosulfan I 5.0 10 20 40 80
Dieldrin 10 20 40 80 160
Endrin 10 20 40 80 160
4,4'-DDD 10 20 40 80 160
4,4'-DDT 10 20 40 80 160
Methoxychlor 50 100 200 400 800
beta-BHC 5.0 10 20 40 80

Organic Data Review Pesticides
January 2017 172
Analyte Concentration (ng/mL)
CS1 CS2 CS3 CS4 CS5
delta-BHC 5.0 10 20 40 80
Aldrin 5.0 10 20 40 80
Heptachlor-epoxide 5.0 10 20 40 80
4,4'-DDE 10 20 40 80 160
Endosulfan II 10 20 40 80 160
Endosulfan sulfate 10 20 40 80 160
Endrin ketone 10 20 40 80 160
Endrin aldehyde 10 20 40 80 160
cis-Chlordane 5.0 10 20 40 80
trans-Chlordane 5.0 10 20 40 80
Tetrachloro-m-xylene (surrogate) 5.0 10 20 40 80
Decachlorobiphenyl (surrogate) 10 20 40 80 160
Toxaphene 500 1000 2000 4000 8000
6. Calibration Factors (CFs) must be calculated for each single component target analyte, each of the five major Toxaphene peaks, and each surrogate in the ICAL standard. Mean Calibration Factor (CF����) must be calculated accordingly for the 5-point ICAL.
7. The Percent Relative Standard Deviation (%RSD) of the CFs for each of the single component target analytes must be ≤ 20.0%, except for alpha-BHC and delta-BHC. The %RSD of the CFs for alpha-BHC and delta-BHC must be ≤ 25.0%. The %RSD of the CFs for each of the Toxaphene peaks must be ≤ 30.0% when a 5-point ICAL is performed. The %RSD of the CFs for the two surrogates [tetrachloro-m-xylene (TCX) and decachlorobiphenyl (DCB)] must be ≤ 30.0%.
NOTE: Either peak area or peak height may be used to calculate the CFs that are, in turn, used to calculate the %RSD. However, the type of peak measurement used to calculate each CF for a given compound must be consistent. For example, if peak area is used to calculate the low-point CF for Endrin, the mid-point and high-point CFs for Endrin must also be calculated using peak area.

Organic Data Review Pesticides
January 2017 173
Table 56. Initial Calibration Sequence 1
Initial Calibration Sequence 1
1. Resolution Check
2. PEM
3. Toxaphene CS1
4. Toxaphene CS2
5. Toxaphene CS3
6. Toxaphene CS4
7. Toxaphene CS5
8. CS1 Individual Standard Mixture C
9. CS2 Individual Standard Mixture C
10. CS3 Individual Standard Mixture C
11. CS4 Individual Standard Mixture C
12. CS5 Individual Standard Mixture C
13. Instrument Blank
14. PEM
Table 57. Initial Calibration Sequence 2
Initial Calibration Sequence 2
1. Resolution Check
2. PEM
3. Toxaphene CS1
4. Toxaphene CS2
5. Toxaphene CS3
6. Toxaphene CS4
7. Toxaphene CS5
8. CS1 Individual Standard Mixture A
9. CS1 Individual Standard Mixture B
10. CS2 Individual Standard Mixture A
11. CS2 Individual Standard Mixture B
12. CS3 Individual Standard Mixture A
13. CS3 Individual Standard Mixture B
14. CS4 Individual Standard Mixture A
15. CS4 Individual Standard Mixture B
16. CS5 Individual Standard Mixture A
17. CS5 Individual Standard Mixture B

Organic Data Review Pesticides
January 2017 174
Initial Calibration Sequence 2
18. Instrument Blank
19. PEM
NOTE: For ICAL Sequence 2, Individual Standards for Mixture B may be analyzed before corresponding Individual Standards for Mixture A.
D. Evaluation
1. Verify that the ICAL is performed at the specified frequency and sequence. Verify that the proper ICAL sequence (1 or 2) is used depending on if INDC or INDA/INDB is used. Verify that a single-point Toxaphene calibration at low standard is included in the ICAL or a 5-point Toxaphene calibration is included in either one of the ICAL sequence 1 and 2.
2. Check the raw data for each standard in the ICAL to verify that the concentration for each single component target analyte, Toxaphene, and surrogate is at the specified concentration level.
3. Check the INDA/INDB data or INDC data and Form 6B-OR to review the calculated RT windows for calculation and transcription errors.
4. Check the Toxaphene ICAL standard data and Form 6D-OR to verify that five major peaks are used for identification, and RT windows are calculated as specified. Verify that the peaks chosen do not share the same RT window as any single component target analyte in any Individual Standard Mixture.
5. Check the chromatograms and verify that at least one chromatogram from each of the INDA/INDB, INDC, or Toxaphene standard yields peaks registering recorder deflections between 50-100% of full scale.
6. Check and recalculate the CFs, CF����s, and %RSDs for one or more single component target analytes in INDA/INDB, INDC, or Toxaphene standard. Verify that the recalculated values agree with the reported values on Form 6C-OR and Form 6E-OR. If errors are detected, perform a more comprehensive recalculation and review.
7. Verify that the %RSD for each single component target analyte, each of the five major Toxaphene peaks and each surrogate in the initial standard is within the acceptance limits.
NOTE: For data obtained from the CLP, the preceding criteria are evaluated as part of the CCS process. Information regarding the noncompliant RT windows and %RSDs can be obtained from the NFG reports and may be used as part of the evaluation process.
E. Action
1. If the ICAL is not performed at the specified frequency or sequence, use professional judgment to qualify detects and non-detects. Contact the EPA Regional CLP COR to arrange for reanalysis, if possible, or note in the Data Review Narrative for later EPA Regional CLP COR action.
2. If the ICAL is not performed at the specified concentrations, use professional judgment to qualify detects and non-detects. This is especially critical for the low-level standards and non-detects.
3. If errors are detected in the calculations of RT windows, CFs, CF����s, or %RSD, perform a more comprehensive recalculation.
4. If the chromatogram display criteria are not met, use professional judgment to qualify detects and non-detects. Contact the EPA Regional CLP COR to arrange for a revised report, or note in the Data Review Narrative for later EPA Regional CLP COR action.
5. If the %RSD for any target analyte or surrogate is outside the acceptance limits, qualify detects as estimated (J). Use professional judgment to qualify non-detects.

Organic Data Review Pesticides
January 2017 175
6. If the %RSD for all target analytes are within the acceptance limits, detects and non-detects should not be qualified.
7. Based on the project-specific Data Quality Objectives (DQOs), a more in-depth review may be necessary. The following guidelines are recommended:
a. If the %RSD criteria of any target analytes are not met, and if the %RSD criteria are still not satisfied after eliminating either the high- or the low-point of the ICAL:
i. Qualify detects in the associated samples as estimated (J).
ii. Use professional judgment to qualify non-detects in the associated samples.
b. If the high-point of the ICAL curve is outside of the %RSD criteria (e.g., due to saturation):
i. Qualify detects in the associated samples with analyte concentrations greater than the high-point concentration as estimated (J).
ii. Detects in the associated samples with analyte concentrations within the calibration range should not be qualified.
iii. Non-detects in the associated samples should not be qualified.
c. If the low-point of the ICAL curve is outside of the %RSD criteria:
i. Qualify detects in the associated samples with analyte concentrations in the non-linear range as estimated (J).
ii. Detects in the associated samples with analyte concentrations within the calibration range should not be qualified.
iii. For non-detects in the associated samples, use the lowest point of the linear portion of the ICAL curve to determine the new quantitation limit.
8. If the laboratory failed to provide adequate calibration information, notify the EPA Regional CLP COR, who may contact the laboratory to request the necessary information. If the information is not available, use professional judgment to assess the data.
9. Annotate the potential effects on the reported data due to exceeding the ICAL criteria in the Data Review Narrative.
10. If the ICAL criteria are grossly exceeded, contact the EPA Regional CLP COR to arrange for reanalysis, if possible, or note it in the Data Review Narrative for later EPA Regional CLP COR action.

Organic Data Review Pesticides
January 2017 176
Table 58. Initial Calibration Action for Pesticide Analysis
Criteria Action
Detect Non-detect
Initial calibration not performed or not performed at specified frequency and sequence
Contact the EPA Regional CLP COR for reanalysis or use professional judgment
Contact the EPA Regional CLP COR for reanalysis or use professional judgment
Initial calibration not performed at the specified concentrations
Contact the EPA Regional CLP COR for reanalysis or use professional judgment
Contact the EPA Regional CLP COR for reanalysis or use professional judgment
RT windows incorrect Or Chromatogram criteria not met
Contact the EPA Regional CLP COR for reanalysis or use professional judgment
Contact the EPA Regional CLP COR for reanalysis or use professional judgment
%RSD outside acceptance limits* J Use professional judgment
%RSD within acceptance limits* No qualification No qualification
* %RSD < 20.0% for single component target analytes except alpha-BHC and delta-BHC.
%RSD < 25.0% for alpha-BHC and delta-BHC.
%RSD < 30.0% for Toxaphene peaks.
%RSD < 20.0% for surrogates (TCX and DCB).

Organic Data Review Pesticides
January 2017 177
IV. Continuing Calibration Verification
A. Review Items
Form 7B-OR, Form 7C-OR, Form 7D-OR, chromatograms, and data system printouts. (SOW SOM02.4 – Exhibit B, Section 3.4 and Exhibit D/PEST, Sections 7.2.2 and 9.4)
B. Objective
The objective is to ensure that the instrument continues to meet the sensitivity and linearity criteria to produce acceptable qualitative and quantitative data throughout each analytical sequence.
C. Criteria
1. The calibration for each GC/ECD system used for analysis must be verified at the beginning and end of every 12-hour period of operation. A CCV consisting of the analyses of instrument blanks, the PEM, and the mid-point ICAL standard CS3 for INDA and INDB or INDC is performed. The opening and closing CCVs consist of an injection of an instrument blank followed by either an injection of an PEM or mid-point concentration of INDA and INDB or INDC in an alternating fashion (i.e., if the PEM is part of the opening CCV, the mid-point ICAL standard CS3 for INDA and INDB or INDC must be part of the closing CCV). For Toxaphene analyses under a five-point calibration, the sequence must end with an instrument blank and a CS3 Toxaphene Standard.
2. The CCV PEM standard must contain the specified target analytes and surrogates at the specified concentration.
3. The CCV CS3 standards must contain all required target analytes and surrogates at or near the mid-point standard concentration of the ICAL.
4. The absolute RT for each single component target analyte and surrogate in the CCV PEM and CS3 of INDA and INDB or INDC must be within the RT windows determined from the ICAL. If the CCV CS3 of Toxaphene is required, the absolute RT for each Toxaphene peak must be within the RT windows determined from the ICAL.
5. The Percent Difference (%D) between the calculated amount and the nominal amount (amount added) for each single component target analyte and surrogate in the CCV PEM must be calculated. The %Breakdown of 4,4'-DDT, %Breakdown of Endrin, and combined %Breakdown of 4,4'-DDT and Endrin must be calculated accordingly for the CCV PEM.
6. The %D between the CF and CF���� from the associated ICAL for each target analyte and surrogate in CCV CS3 and the CF %D for each Toxaphene peak in the applicable CCV CS3 must be calculated accordingly.
7. The %D for each single component target analyte and surrogate in the CCV PEM must be in the inclusive range of ±25.0%.
8. The %Breakdown of 4,4'-DDT and %Breakdown of Endrin in the CCV PEM must be ≤ 20.0%, and the combined %Breakdown of 4,4'-DDT and Endrin in the CCV PEM must be ≤ 30.0%.
9. The %D for each target analyte and surrogate in the CCV CS3 must be in the inclusive range of ±25.0%.
10. The %D for each Toxaphene peak in the applicable the CCV CS3 must be in the inclusive range of ±25.0%.
11. Instrument blanks paired with either a PEM or CS3 standard must bracket the 12-hour analytical sequence. The concentration of each target analyte in the instrument blank must not exceed the Contract Required Quantitation Limit (CRQL).
12. No more than 14 hours may elapse from the injection of the instrument blank that begins an analytical sequence (opening CCV) and the injection of either a PEM or CS3 standard that ends an analytical sequence (closing CCV).

Organic Data Review Pesticides
January 2017 178
13. No more than 12 hours may elapse from the injection of the instrument blank that begins an analytical sequence (opening CCV) and the injection of the last sample or blank that is part of the same analytical sequence.
D. Evaluation
1. Verify that the CCV PEM and CS3 standard (including Toxaphene CS3) are analyzed at the specified frequency and sequence, and that each CCV standard is associated to the correct ICAL.
2. Verify that specified target analytes and surrogates at the correct concentrations are included in the CCV PEM.
3. Verify that the mid-point standard CS3 from the ICAL is used for the CCV and the specified target analytes and surrogates are included in each CS3 standard.
4. Verify that the absolute RT for each single component target analyte and surrogate in the CCV PEM and CS3 standard of INDA and INDB or INDC are within the RT windows determined from the ICAL. Verify that the absolute RT for each Toxaphene peak in the applicable CS3 standard is within the RT window determined from the ICAL.
5. Verify that the %D for each single component target analyte and surrogate in the CCV PEM is calculated correctly; that the %Breakdown of 4,4'-DDT, %Breakdown of Endrin, and combined %Breakdown of 4,4'-DDT and Endrin in the CCV PEM are calculated correctly; and that the recalculated values agree with the laboratory reported values on Form 7B-OR. Recalculate the %D for at least one target analyte, surrogate, and all three %Breakdowns in each CCV PEM.
6. Verify that the %D for each target analyte and surrogate in the CCV CS3 and the CF %D for each Toxaphene peak in the applicable CCV CS3 are calculated correctly, and that the recalculated values agree with the laboratory reported values on Form 7C-OR and Form 7D-OR, respectively. Recalculate the %D for at least one target analyte, surrogate, and all five Toxaphene peaks in each CS3 standard.
7. Verify that the %D for each single component target analyte and surrogate in the CCV PEM are in the inclusive range of ±25.0%.
8. Verify that the %Breakdown of 4,4'-DDT and %Breakdown of Endrin in CCV PEM are ≤ 20.0% and that the combined %Breakdown of 4,4'-DDT and Endrin in CCV PEM is ≤ 30.0%.
9. Verify that the %D for each target analyte and surrogate in CCV CS3 are in the inclusive range of ±25.0%.
10. Verify that the %D for each Toxaphene peak in the applicable CCV CS3 is in the inclusive range of ±25.0%.
11. Verify that the instrument blanks paired with either the PEM or CS3 standard are analyzed at the specified frequency and sequence, and that the concentration of each target analyte in the instrument blank is not exceeding the CRQL.
12. Verify that the time elapsed between the injection of an instrument blank as opening CCV and the injection of either a PEM or CS3 as closing CCV is within 14 hours.
13. Verify that the time elapsed between the injection of an instrument blank as opening CCV and the injection of the last sample or blank in the same analytical sequence is within 12 hours.
NOTE: For data obtained from the CLP, information regarding the noncompliant CCV can be obtained from the NFG reports and may be used as part of the evaluation process.
Organic Data Review Pesticides
January 2017 179
E. Action
1. If the CCV PEM or CS3 is not performed at the specified frequency and sequence, contact the EPA Regional CLP COR to request that the laboratory repeat the analysis if holding times have not expired and there is extract remaining. If reanalysis is not possible, carefully evaluate all other available information, including the quality of analyte peak shapes and RT match of surrogates on both columns, and compare to the most recent calibration performed on the same instrument under the same conditions. Using this information and professional judgment, the reviewer may be able to justify unqualified acceptance of qualitative results and qualification of all quantitative results as estimated (J). Otherwise, qualify all detects and non-detects as unusable (R).
2. If the CCV PEM is not performed at the specified concentration, use professional judgment to qualify detects and non-detects.
3. If the CCV CS3 is not performed at the specified concentration, use professional judgment to qualify detects and non-detects.
4. If the RT of any target analyte in the CCV PEM and CS3 standard is outside the RT window, carefully evaluate the associated sample results. All samples injected after the last in-control standard are potentially affected.
a. For non-detected target analytes in the affected samples, check the sample chromatograms that may contain any peaks that are close to the expected RT window of the target analytes of interest.
i. If no peaks are present, non-detects should not be qualified.
ii. If any peaks are present close to the expected RT window of the analytes of interest, use professional judgment to qualify the non-detects as presumptively present with estimated concentration (NJ).
b. For detected target analytes in the affected samples, check the sample chromatograms that may contain any peaks that are close to the expected RT window of the target analytes of interest.
If the peaks are close to the expected RT window of the pesticide of interest, it may require additional effort to determine if sample peaks represent the target analytes of interest.
For example, the data package may be examined for the presence of three or more standards containing the target analytes of interest that were run within the analytical sequence during which the sample was analyzed. If three or more such standards are present, the RT windows can be re-evaluated using the RT����s of the standards. i. If the peaks in the affected sample fall within the revised windows, qualify detects as
presumptively present with estimated concentration (NJ).
ii. If the problem of concern remains unresolved, qualify detects as unusable (R).
5. If errors are detected in the calculations of either the %D or %Breakdown in the CCV PEM, perform a more comprehensive recalculation.
6. If errors are detected in the calculations of the %D in any CS3 standard or %D for any Toxaphene peak in the applicable CCV CS3, perform a more comprehensive recalculation. Contact the EPA Regional CLP COR to arrange for data resubmittal and note it in the Data Review Narrative for later EPA Regional CLP COR action.
7. If the %D for any target analyte in the CCV PEM is outside the limits, qualify detects as estimated (J) and non-detects as estimated (UJ).
8. If the 4,4'-DDT %Breakdown is > 20.0%, qualify detected 4,4'-DDT, 4,4'-DDD, and 4,4'-DDE as estimated (J). When 4,4'-DDT is not detected, but 4,4'-DDD and 4,4'-DDE are detected, qualify non-detected 4,4'-DDT as unusable (R) and detected 4,4'-DDD and 4,4'-DDE as presumptively present with estimated concentration (NJ).
Organic Data Review Pesticides
January 2017 180
9. If the Endrin %Breakdown > 20.0%, qualify detected Endrin, Endrin aldehyde, and Endrin ketone as estimated (J). When Endrin is not detected, but Endrin aldehyde and Endrin ketone are detected, qualify non-detected Endrin as unusable (R) and detected Endrin aldehyde and Endrin ketone as presumptively present with estimated concentration (NJ).
10. If the combined %Breakdown for 4,4'-DDT and Endrin is > 30.0%, consider the degree of individual breakdown of 4,4'-DDT and Endrin and qualify as in Sections IV.E.8 and IV.E.9 accordingly.
11. If the %D for any target analyte in CCV CS3 is outside the limits, qualify detects as estimated (J) and non-detects as estimated (UJ).
12. If the time elapsed between the injection of an instrument blank as opening CCV and the injection of either a PEM or CS3 as closing CCV exceeds 14 hours, carefully evaluate instrument stability during the entire sequence to decide whether degradation has occurred, including column bleed, RTs, peak shapes, and surrogate recovery. If system degradation has been found, qualify positive results as estimated (J). If any possibility exists for either false positives or false negatives, qualify non-detects as unusable (R).
13. If the time elapsed between the injection of an instrument blank as opening CCV and the injection of the last sample or blank in the same analytical sequence exceeds 12 hours, carefully evaluate instrument stability during the entire sequence to decide whether degradation has occurred, including column bleed, RTs, peak shapes, and surrogate recovery. If system degradation has been found, qualify positive results as estimated (J). If any possibility exists for either false positives or false negatives, qualify non-detects as unusable (R).
14. If the RT for each target analyte in PEM and CS3 standards are within the RT windows, and the %D for the specified target analyte and %Breakdown in PEM are within the respective limits, and the %D for each target analyte in CCV CS3 is within the limits, detects and non-detects should not be qualified.
15. No qualification of the data is necessary based on the surrogate %D alone. Use professional judgment to evaluate the surrogate %D data in conjunction with surrogate recoveries to determine the need for data qualification.
16. If an instrument blank as part of the CCV is not performed at the specified frequency and sequence, or instrument blank does not meet the concentration criteria, refer to Section V. Blanks for data qualifications.
17. If the laboratory has failed to provide adequate calibration information, contact the EPA Regional CLP COR, who may contact the laboratory to request the necessary information. If the information is not available, use professional judgment to assess the data.
18. Note the potential effects on the data due to CCV criteria exceedance in the Data Review Narrative.
19. If the CCV criteria are grossly exceeded, note this for EPA Regional CLP COR action.

Organic Data Review Pesticides
January 2017 181
Table 59. CCV Actions for Pesticide Analysis
Criteria Action
Detect Non-detect
CCV PEM and CS3 not performed at the correct frequency and sequence
Contact the EPA Regional CLP COR for reanalysis or use professional judgment
Contact the EPA Regional CLP COR for reanalysis or use professional judgment
CCV PEM not performed at the specified concentration
Contact the EPA Regional CLP COR for reanalysis or use professional judgment
Contact the EPA Regional CLP COR for reanalysis or use professional judgment
CCV CS3 not performed at the specified concentration
Contact the EPA Regional CLP COR for reanalysis or use professional judgment
Contact the EPA Regional CLP COR for reanalysis or use professional judgment
RT outside the RT window Use professional judgment Use professional judgment
PEM %D outside the limits J UJ
PEM: 4,4'-DDT %Breakdown >20.0% and 4,4'-DDT is detected
J for 4,4'-DDT, 4,4'-DDD, and 4,4'-DDE No qualification
PEM: 4,4'-DDT %Breakdown >20.0% and 4,4'-DDT is not detected
NJ for 4,4'-DDD and 4,4'-DDE R for 4,4'-DDT
PEM: Endrin %Breakdown >20.0% and Endrin is detected
J for Endrin, Endrin aldehyde, and Endrin ketone No qualification
PEM: Endrin %Breakdown >20.0% and Endrin is not detected
NJ for Endrin aldehyde and Endrin ketone R for Endrin
PEM: Combined %Breakdown >30%
Apply qualifiers as described above considering
degree of individual breakdown
Apply qualifiers as described above considering
degree of individual breakdown
CS3 %D outside the limits J UJ
Time elapsed between opening CCV Pesticide Instrument Blank and closing CCV PEM or CS3 exceeds 14 hours
Use professional judgment Use professional judgment
Time elapsed between opening CCV Pesticide Instrument Blank and last sample or blank exceeds 12 hours
Use professional judgment Use professional judgment
RT, PEM %D, PEM %Breakdown, CS3 %D, and time elapsed within limits No qualification No qualification

Organic Data Review Pesticides
January 2017 182
V. Blanks
A. Review Items
Form 1A-OR, Form 4-OR, chromatograms, and quantitation reports. (SOW SOM02.4 – Exhibit B, Section 3.4 and Exhibit D/PEST, Section 12.1)
B. Objective
The objective of a blank analysis results assessment is to determine the existence and magnitude of contamination resulting from laboratory (or field) activities.
C. Criteria
The criteria for evaluation of blanks should apply to any blank associated with the samples (e.g., method blanks, instrument blanks, sulfur cleanup blank, field blanks, etc.). If problems with any blank exist, all associated data must be carefully evaluated to determine whether or not there is an inherent variability in the data or if the problem is an isolated occurrence not affecting other data.
1. Method blank analyses must be performed at the specified frequency and sequence. A method blank must be extracted per matrix each time when samples are extracted. The number of samples extracted with each method blank shall not exceed 20 field samples. The method blank must be extracted by the same procedure used to extract samples and analyzed on each GC system under the same conditions used to analyze associated samples.
2. The method blank, like any other sample in the SDG, must meet the technical acceptance criteria for sample analysis.
3. An acceptable instrument blank must be analyzed at the beginning and end of an analytical sequence in which samples are analyzed, immediately prior to the analysis of the PEM or mid-point INDA/INDB or INDC used as the CCV.
4. A sulfur cleanup blank must be analyzed whenever part of a set of the extracted samples requires sulfur cleanup. If the entire set of samples associated with a method blank requires sulfur cleanup, the method blank also serves the purpose of a sulfur cleanup blank and a separate sulfur cleanup blank is not required.
5. The TCLP/SPLP Leachate Extraction Blank (LEB) must be prepared and analyzed at the specified frequency and sequence.
6. The concentration of a target analyte in any blanks must not exceed its CRQL.
D. Evaluation
1. Verify that method blanks are extracted at the specified frequency and analyzed at the required sequence. The Method Blank Summary (Form 4-OR) may be used to identify the samples associated with each method blank.
2. Verify that applicable TCLP/SPLP LEBs are analyzed at the specified frequency and sequence. The Method Blank Summary (Form 4-OR) may be used to identify the samples associated with each TCLP/SPLP LEB.
3. Verify that instrument blanks are analyzed at the specified frequency and sequence.
4. Verify that the sulfur cleanup blank is analyzed when part of a set of samples extracted together requires sulfur cleanup. The Method Blank Summary (Form 4-OR) may be used to identify the samples associated with the sulfur cleanup blank.
5. Data concerning the field blanks are not evaluated as part of the CCS process. Evaluations on field or trip blanks should be similar to the method blanks.
6. Review the results of all associated blanks on the forms and raw data (chromatograms and quantitation reports) to evaluate the presence of target analytes in the blanks.

Organic Data Review Pesticides
January 2017 183
NOTE: For data obtained from the CLP, the preceding criteria are evaluated as part of the CCS process. Information regarding the noncompliant blank can be obtained from the NFG reports and may be used as part of the evaluation process.
E. Action
1. If the appropriate blanks are not extracted at the correct frequency and/or analyzed at the correctsequence, use professional judgment to determine if the associated sample data should be qualified.Obtain additional information from the laboratory, if necessary. Record the situation in the DataReview Narrative and note it for EPA Regional CLP COR action.
2. Action regarding unsuitable blank results depends on the circumstances and origin of the blank.Verify that data qualification decisions based on field quality control (QC) are supported by theproject Quality Assurance Project Plan (QAPP) or EPA Regional Standard Operating Procedure(SOP). At a minimum, contamination found in field blanks should be documented in the DataReview Narrative. In instances where more than one blank is associated with a given sample,qualification should be based upon a comparison with the associated blank having the highestconcentration of a contaminant. Do not correct the results by subtracting any blank value.
3. For any blank (including method blank), if a target analyte is detected, but it is not detected in thesample, non-detects should not be qualified.
4. For any method blank reported with results < CRQLs, report sample results that are < CRQLs at theCRQLs and qualify as non-detect (U). For any method blank reported with results that are< CRQLs, use professional judgment to qualify sample results that are ≥ CRQLs. Positive resultsin samples, especially those near but above the CRQL, may be biased high by low levelcontamination in the method blank, and should be considered as estimated (J+).
5. For any method blank reported with results ≥ CRQLs, report sample results that are < CRQLs at theCRQLs and qualify as non-detect (U). For any method blank reported with results ≥ CRQLs, reportsample results that are ≥ CRQLs but < Blank Results at sample results and qualify as non-detect (U)or as unusable (R). Use professional judgment to qualify sample results that ≥ CRQLs and≥ Blank Results.
6. For TCLP/SPLP LEBs, sulfur cleanup blanks, instrument blanks, and field blanks, sample resultqualifications listed in Table 60 should apply if supported by the project QAPP.
7. If gross contamination exists with blank results that are > ICAL CS5 concentrations, qualify detectsas unusable (R). If the contamination is suspected of having an effect on the sample results, note itfor EPA Regional CLP COR action.
8. There may be instances where little or no contamination is present in the associated blanks, butqualification of the sample is deemed necessary. If it is determined that the contamination is froma source other than the sample, the data should be qualified or, in the case of field QC, should atleast be documented in the Data Review Narrative. Contamination introduced through dilutionwater is one example. Although it is not always possible to determine, instances of this occurringcan be detected when contaminants are found in the diluted sample result, but are absent in theundiluted sample.

Organic Data Review Pesticides
January 2017 184
Table 60. Blank and TCLP/SPLP LEB Actions for Pesticide Analysis
Blank Type Blank Result Sample Result Action
Method, TCLP/SPLP LEB, Sulfur cleanup, Instrument, Field
Detects Non-detect No qualification
< CRQL < CRQL Report at CRQL and qualify as
non-detect (U)
≥ CRQL Use professional judgment
≥ CRQL
< CRQL Report at CRQL and qualify as non-detect (U)
≥ CRQL but < Blank Result Report at sample result and qualify as non-detect (U) or as unusable (R)
≥ CRQL and ≥ Blank Result Use professional judgment
Gross contamination Detect Report at sample result and
qualify as unusable (R)
Organic Data Review Pesticides
January 2017 185
VI. Surrogate
A. Review Items
Form 2C-OR, Form 8B-OR, chromatograms, and data system printouts. (SOW SOM02.4 – Exhibit B, Section 3.4 and Exhibit D/PEST, Sections 7.2.2.7 and 11.2.6)
B. Objective
The objective is to evaluate surrogate percent recovery (%R) to ensure that the analytical method is efficient.
C. Criteria
1. Surrogate spiking solution containing two surrogates, TCX and DCB, is added to all samples, including Matrix Spike (MS)/Matrix Spike Duplicates (MSDs), Laboratory Control Samples (LCSs), and blanks to measure the surrogate recovery. The surrogates are also added to all the standards to monitor RTs.
2. The RTs of the surrogates in each PEM, mid-point Individual Standard Mixtures A and B or Individual Standard Mixture C used for the CCV, all samples (including MS/MSD and LCS), and all blanks must be within the calculated RT windows. TCX must be within ±0.05 minutes, and DCB must be within ±0.10 minutes of the RT����s determined from the ICAL.
3. The %R for the surrogates TCX and DCB in all samples, including MS/MSDs, LCSs, and all blanks, must be calculated accordingly.
4. The %R for each surrogate must be in the inclusive range of 30-150% for all samples, including MS/MSDs, LCSs, and all blanks.
D. Evaluation
1. Check the raw data (e.g., chromatograms and data system printouts) to verify that the surrogates are added at the specified concentrations to all samples and blanks.
2. Check the raw data (e.g., chromatograms and data system printouts) to verify that the surrogate RTs on Form 8B-OR are within the RT windows.
3. Check the raw data (e.g., chromatograms and data system printouts) to verify that the surrogate %R for each sample and blank is on Form 2C-OR.
4. Check for any calculation or transcription errors. Verify that the surrogate recoveries are calculated correctly using the equation in the method.
5. Whenever there are two or more analyses for a particular sample, use professional judgment to determine which analyses is the most accurate data to report. Considerations include, but are not limited to:
a. Surrogate recovery (marginal versus gross deviation).
b. Technical holding times.
c. Comparison of the results of the target compounds reported in each sample analysis.
d. Other QC information, such as surrogate recoveries and/or RTs in blanks and standards.
NOTE: For data obtained from the CLP, the preceding criteria are evaluated as part of the CCS process. Information regarding the noncompliant surrogate recovery can be obtained from the NFG reports and may be used as part of the evaluation process.
E. Action
1. If surrogates are not added to any sample or blank, or surrogate concentration is incorrect in the sample or blank, use professional judgment to qualify detects and non-detects. Contact the EPA Regional CLP COR to arrange for reanalysis, if possible.
Organic Data Review Pesticides
January 2017 186
2. If surrogate RTs in the PEMs, Individual Standard Mixtures, samples, and blanks are outside of the RT windows, use professional judgment to qualify detects and non-detects.
3. If surrogate RTs are within RT windows, detects and non-detects should not be qualified.
4. If errors are detected in the calculations of the %R, perform a more comprehensive recalculation. It may be necessary to have the laboratory resubmit the data after making corrections.
5. If the %R for any surrogate is outside the acceptance limits, consider the existence of coelution and interference in the raw data. Use professional judgment to qualify data, as surrogate recovery problems may not directly apply to target analytes.
6. If the %R for any surrogate in undiluted sample is < 10%, qualify detects as estimated low (J-) and non-detects as unusable (R).
7. If the %R for any surrogate in diluted sample is < 10%, use professional judgment to qualify detects and non-detects.
8. If the %R for any surrogate is ≥ 10% and < 30%, qualify detects as estimated low (J-) and non-detects as estimated (UJ).
9. If the %R for both surrogates are ≥ 30% and ≤ 150%, detects and non-detects should not be qualified.
10. If the %R for any surrogate is > 150% but ≤ 200%, qualify detects as estimated high (J+). Non-detects should not be qualified.
11. If the %R for any surrogate is > 200%, qualify detects as estimated high (J+). Use professional judgment to qualify non-detects.
12. In the special case of a blank analysis with surrogate %R outside the acceptance limits, give special consideration to qualify the associated sample data. The basic concern is whether the blank problems represent an isolated problem with the blank alone, or whether there is a fundamental problem with the analytical process.
For example, if one or more samples in the same extraction batch have surrogate %R within the acceptance limits, use professional judgment to determine if the blank problem is an isolated occurrence. Note analytical problems for EPA Regional CLP COR action even if this judgment allows some use of the affected data.
Table 61. Surrogate Actions for Pesticide Analysis
Criteria Action*
Detect Non-detect
RT out of RT window Use professional judgment Use professional judgment
RT within RT window No qualification No qualification
%R < 10% (undiluted sample) J- R
%R < 10% (diluted sample) Use professional judgment Use professional judgment
10% ≤ %R < 30% J- UJ
30% ≤ %R ≤ 150% No qualification No qualification
150% < %R ≤ 200% J+ No qualification
%R > 200% J+ Use professional judgment
* Use professional judgment in qualifying data, as surrogate recovery problems may not directly apply to target analytes.

Organic Data Review Pesticides
January 2017 187
VII. Matrix Spike/Matrix Spike Duplicate
A. Review Items
SDG Cover Page, Form 3A-OR, chromatograms, and quantitation reports. (SOW SOM02.4 – Exhibit B, Section 3.4 and Exhibit D/PEST, Sections 7.2.2.8 and 12.2)
B. Objective
The objective of MS/MSD analysis is to evaluate the effect of each sample matrix on the sample preparation procedures and the measurement methodology.
C. Criteria
1. MS/MSD samples shall be prepared and analyzed at the specified frequency. One pair of MS/MSD samples should be analyzed per matrix or per SDG.
2. Samples identified as field blanks or Performance Evaluation (PE) samples cannot be used for MS/MSD sample analysis.
3. The MS/MSD %R and the Relative Percent Difference (RPD) between MS and MSD results should be calculated according to the method.
4. The MS/MSD %R and RPD shall be within the acceptance limits in Table 62.
D. Evaluation
1. Verify that requested MS/MSD samples were analyzed at the required frequency.
2. Verify that a field blank or PE sample was not used for MS/MSD analysis.
3. Verify that the recalculated MS/MSD %R and RPD values agree with the laboratory reported values on Form 3A-OR.
4. Inspect the MS/MSD %R and RPD on Form 3A-OR and verify that they are within the limits listed in Table 62.
NOTE: For data obtained from the CLP, the preceding criteria, including the required MS/MSD spiking analytes and spiking levels specified in Exhibit D – Pesticides Analysis, Table 7, of the SOW, are evaluated as part of the CCS process. Information regarding the noncompliant MS/MSD %R or RPD can be obtained from the NFG reports and may be used as part of the evaluation process.
E. Action
1. If MS/MSD samples were not analyzed at the specified frequency, or were spiked with the wrong analytes or at the wrong concentrations, use professional judgment to determine the impact on sample data, if any. Obtain additional information from the laboratory, if necessary. Record the situation in the Data Review Narrative and note it for EPA Regional CLP COR action. It is not likely that data qualification will be warranted if the frequency requirements are not met. Carefully consider all factors, known and unknown, about method performance on the matrix at hand, in lieu of MS/MSD data.
2. If a field blank or PE sample was used for the MS/MSD analysis, note this for EPA Regional CLP COR action. All of the other QC data must then be carefully checked. Use professional judgment when evaluating the data.
3. If errors are detected in the calculations of the MS/MSD %R or RPD, perform a more comprehensive recalculation.
4. If the MS/MSD %R or RPD is outside the acceptance limits in Table 62, qualify the detects and non-detects in the original sample to include the consideration of the existence of interference in the raw data. Considerations include, but are not limited to:

Organic Data Review Pesticides
January 2017 188
a. If the MS/MSD %R is < 20%, qualify detects as estimated (J) and non-detects as unusable (R).
b. If the MS/MSD %R is ≥ 20% and < lower acceptance limit, qualify detects as estimated (J) andnon-detects as estimated (UJ).
c. If the MS/MSD %R or RPD is ≥ lower acceptance limit and ≤ upper acceptance limit, detectsand non-detects should not be qualified.
d. If the MS/MSD %R or RPD is > upper acceptance limit, qualify detects as estimated (J).Non-detects should not be qualified.
Table 62. MS/MSD %R and RPD Limits for Pesticide Analysis
Analyte %R for Water Sample
RPD for Water Sample
%R for Soil Sample
RPD for Soil Sample
gamma-BHC (Lindane) 56 - 123 0 - 15 46 - 127 0 - 50
Heptachlor 40 - 131 0 - 20 35 - 130 0 - 31
Aldrin 40 - 120 0 - 22 34 - 132 0 - 43
Dieldrin 52 - 126 0 - 18 31 - 134 0 - 38
Endrin 56 - 121 0 - 21 42 - 139 0 - 45
4,4'-DDT 38 - 127 0 - 27 23 - 134 0 - 50
Table 63. MS/MSD Actions for Pesticide Analysis
Criteria Action
Detect Non-detect
%R < 20% J R
20% ≤ %R < Lower Acceptance Limit J UJ
Lower Acceptance Limit ≤ %R or RPD ≤ Upper Acceptance Limit No qualification No qualification
%R or RPD > Upper Acceptance Limit J No qualification

Organic Data Review Pesticides
January 2017 189
VIII. Laboratory Control Sample
A. Review Items
Form 3B-OR, chromatograms, and data system printouts. (SOW SOM02.4 – Exhibit B, Section 3.4 and Exhibit D/PEST, Sections 7.2.2.9 and 12.3)
B. Objective
The objective is to evaluate the accuracy of the analytical method and laboratory performance.
C. Criteria
1. An LCS must be prepared and analyzed at the specified frequency. The LCS should be extracted and analyzed per matrix or per SDG. The LCS should be extracted using the same procedures as the samples and method blank.
2. The requirements below apply independently to each GC column and to all instruments used for these analyses. Quantitation must be performed on each GC column.
3. The LCS must contain the target analytes in Table 64 and the surrogates at the specified concentrations in the method (Table 7 in the SOW).
4. The %R for each spiked analyte in the LCS must be calculated according to the method.
5. The %R for each spiked analyte must be within the acceptance limits in Table 64.
Table 64. LCS %R Limits for Pesticide Analysis
Analyte %R Limits
gamma-BHC 50 - 120
Heptachlor epoxide 50 - 150
Dieldrin 30 - 130
4,4'-DDE 50 - 150
Endrin 50 - 120
Endosulfan sulfate 50 - 120
trans-Chlordane 30 - 130
NOTE: The %R limits for any spiked analyte in the LCS may be expanded at any time during the period of performance if the EPA determines that the limits are too restrictive.
6. All samples prepared and analyzed with an LCS that does not meet the technical acceptance criteria in the method will require re-extraction and reanalysis.
D. Evaluation
1. Verify that the LCS is prepared and analyzed at the specified frequency.
2. Check the raw data (e.g., chromatograms and data system printouts) to verify that the LCS is spiked with the specified target analytes at the method specified concentrations (Table 7 in the SOW).
3. Check the raw data (e.g., chromatograms and data system printouts) to verify that the %R of each target analyte in the LCS is calculated correctly and that the recalculated %R values agree with that reported on Form 3B-OR.
4. Verify that the %R of each target analyte in the LCS is within the specified acceptance limits.
NOTE: For data obtained from the CLP, the preceding criteria are evaluated as part of the CCS process. Information regarding the noncompliant LCS %R can be obtained from the NFG reports and may be used as part of the evaluation process.

Organic Data Review Pesticides
January 2017 190
E. Action
1. If the LCS is not performed at the specified frequency, use professional judgment to qualify detectsand non-detects in the associated samples.
NOTE: If an LCS sample is not analyzed at the specified frequency, use professional judgment to determine the impact on sample data. Obtain additional information from the laboratory, if necessary. Record the situation in the Data Review Narrative and note it for EPA Regional CLP COR action. It is not likely that data qualification will be warranted if the frequency requirement is not met. Carefully consider all factors, known and unknown, about method performance, in lieu of LCS data.
2. If the LCS is not performed at the specified concentration, use professional judgment to qualifydetects and non-detects in the associated samples.
3. If errors are detected in the calculations of the LCS %R, perform a more comprehensiverecalculation.
4. If the LCS %R criteria are not met, qualify the specific target analyte in the associated samples.
a. If the LCS %R is < lower acceptance limit, qualify detects as estimated low (J-) andnon-detects as unusable (R).
b. If the LCS %R is ≥ lower acceptance limit and ≤ upper acceptance limit, detects andnon-detects should not be qualified.
c. If the LCS %R is > upper acceptance limit, qualify detects as estimated high (J+). Non-detectsshould not be qualified.
d. Use professional judgment to qualify analytes other than those included in the LCS.
e. Take into account the analyte class, analyte recovery efficiency, analytical problems associatedwith each analyte, and comparability in the performance of the LCS analyte to the non-LCSanalyte.
Table 65. LCS Actions for Pesticide Analysis
Criteria Action
Detect Non-detect
LCS not performed at the specified frequency or concentration
Use professional judgment
Use professional judgment
%R < Lower Acceptance Limit J- R
Lower Acceptance Limit ≤ %R ≤ Upper Acceptance Limit No qualification No qualification
%R > Upper Acceptance Limit J+ No qualification

Organic Data Review Pesticides
January 2017 191
IX. Florisil Cartridge Performance Check
A. Review Items
Form 9A-OR, Florisil raw data, chromatograms, and data system printouts. (SOW SOM02.4 – Exhibit B, Section 3.4 and Exhibit D/PEST, Section 10.3.2)
B. Objective
The objective is to evaluate the performance of the Florisil cartridge used for Florisil cleanup procedure on sample extracts.
C. Criteria
1. The performance of each lot of Florisil cartridges used for sample cleanup must be evaluated at least once or every six months (whichever is most frequent).
2. The Florisil cartridge performance check standard solution must contain 2,4,5-trichlorophenol and the mid-point concentration of INDA or INDC as specified in the method.
3. The %R for each target analyte and surrogate in INDA must be calculated according to the method.
4. The %R limits for the target analytes and surrogates in the INDA are 80-120%, and < 5% for 2,4,5-trichlorophenol. If INDC is used, the %R limits for target analytes and surrogates in INDC shall be evaluated.
D. Evaluation
1. Verify that the Florisil Cartridge Performance Check is performed at the specified frequency.
2. Check the raw data for the Florisil Cartridge Performance Check analysis to verify that the concentrations of analytes are correct.
3. Check the raw data for the Florisil Cartridge Performance Check results and verify that the %R for each analyte and surrogate are calculated correctly and agree with that on Form 9A-OR. Verify that there are no transcription errors.
4. Verify that the %R for the target analytes and surrogates in the Florisil Cartridge Performance Check solution are within 80-120%, and the recovery of 2,4,5-trichlorophenol is < 5%.
NOTE: For data obtained from the CLP, the preceding criteria are evaluated as part of the CCS process. Information regarding the noncompliant %R in the Florisil Cartridge Performance Check can be obtained from the NFG reports and may be used as part of the evaluation process.
E. Action
1. If the Florisil Cartridge Performance Check is not performed at the specified frequency, use professional judgment to qualify detects and non-detects.
2. If the Florisil Cartridge Performance Check is not performed at the specified concentrations, use professional judgment to qualify detects and non-detects.
3. If errors are detected in the calculations of the %R in the Florisil Cartridge Performance Check, perform a more comprehensive recalculation.
4. If the Florisil Cartridge Performance Check criteria are not met, examine the raw data for the presence of polar interferences and use professional judgment in qualifying the data as follows:
a. If the %R is < 10% for any of target analyte in the Florisil Cartridge Performance Check, use professional judgment to qualify detects. Qualify non-detects as unusable (R).
b. If the %R is ≥ 10% and < 80% for any target analyte in the Florisil Cartridge Performance Check, qualify detects as estimated (J) and non-detects as estimated (UJ).
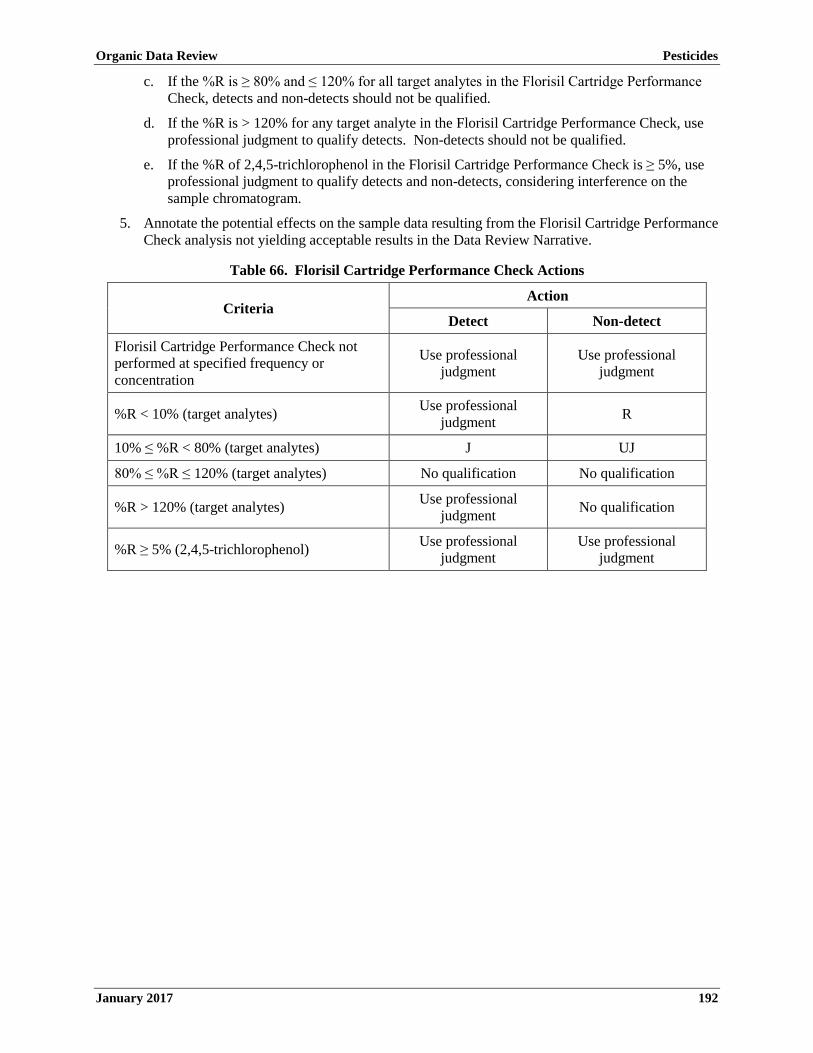
Organic Data Review Pesticides
January 2017 192
c. If the %R is ≥ 80% and ≤ 120% for all target analytes in the Florisil Cartridge PerformanceCheck, detects and non-detects should not be qualified.
d. If the %R is > 120% for any target analyte in the Florisil Cartridge Performance Check, useprofessional judgment to qualify detects. Non-detects should not be qualified.
e. If the %R of 2,4,5-trichlorophenol in the Florisil Cartridge Performance Check is ≥ 5%, useprofessional judgment to qualify detects and non-detects, considering interference on thesample chromatogram.
5. Annotate the potential effects on the sample data resulting from the Florisil Cartridge PerformanceCheck analysis not yielding acceptable results in the Data Review Narrative.
Table 66. Florisil Cartridge Performance Check Actions
Criteria Action
Detect Non-detect
Florisil Cartridge Performance Check not performed at specified frequency or concentration
Use professional judgment
Use professional judgment
%R < 10% (target analytes) Use professional judgment R
10% ≤ %R < 80% (target analytes) J UJ
80% ≤ %R ≤ 120% (target analytes) No qualification No qualification
%R > 120% (target analytes) Use professional judgment No qualification
%R ≥ 5% (2,4,5-trichlorophenol) Use professional judgment
Use professional judgment

Organic Data Review Pesticides
January 2017 193
X. Gel Permeation Chromatography Performance Check
A. Review Items
Form 9B-OR, two ultraviolet (UV) traces, Gel Permeation Chromatography (GPC) raw data, chromatograms, and data system printouts. (SOW SOM02.4 – Exhibit B, Section 3.4 and Exhibit D/PEST, Section 10.3.1)
B. Objective
The objective is to evaluate GPC cleanup efficiency.
C. Criteria
1. GPC is used for the cleanup of all non-aqueous sample extracts and for aqueous sample extracts that contain high molecular weight components that interfere with the analysis of the target analytes.
2. Each GPC system must be calibrated prior to processing samples for GPC cleanup, when the GPC calibration verification solution fails to meet criteria, when the column is changed, when channeling occurs, and once every 7 days when in use.
3. The GPC calibration is acceptable if the two UV traces meet the following requirements:
a. Peaks must be observed and symmetrical for all compounds in the calibration solution.
b. Corn oil and the phthalate peaks exhibit > 85% resolution.
c. Phthalate and methoxychlor peaks exhibit > 85% resolution.
d. Methoxychlor and perylene peaks exhibit > 85% resolution.
e. Perylene and sulfur peaks must not be saturated and should exhibit > 90% baseline resolution.
f. The RT shift is < 5% between UV traces for bis(2-ethylhexyl) phthalate and perylene.
4. A GPC blank must be analyzed after each GPC calibration. The concentration for any target analyte in the GPC blank must not exceed the CRQL.
5. GPC calibration verification must be performed at least once every 7 days (immediately following the GPC calibration) whenever samples (including MS/MSDs, LCSs, and blanks) are cleaned up using the GPC.
6. The GPC calibration verification solution must contain the target analytes gamma-BHC (Lindane), Heptachlor, Aldrin, 4,4'-DDT, Endrin, and Dieldrin in Methylene chloride at the concentrations specified in the method (Table 7 in SOW).
7. The %R for each target analyte in the GPC calibration verification must be calculated according to the method.
8. The %R for each target analyte in the GPC calibration verification must be in the inclusive range of 80-120%.
D. Evaluation
1. Verify that the GPC calibration is performed at the specified frequency.
2. Verify that there are two UV traces present and that the RT shift for bis(2-ethylhexyl) phthalate and perylene is < 5%.
3. Verify that the analytes in the GPC calibration standard are present and the peaks are symmetrical in both UV traces meeting the minimum resolution requirements.
4. Verify that no target analyte in the GPC blank exceeds the CRQL.
5. Verify that the GPC calibration verification is performed at the specified frequency and concentrations.

Organic Data Review Pesticides
January 2017 194
6. Verify that the %R for target analytes are calculated correctly and the %R values agree with that on Form 9B-OR.
7. Verify that the %R for target analytes are within the acceptance limits.
NOTE: For data obtained from the CLP, the preceding criteria are evaluated as part of the CCS process. Information regarding the noncompliant %R in the GPC calibration verification can be obtained from the NFG reports and may be used as part of the evaluation process.
E. Action
1. If GPC calibration frequency, UV traces, and GPC blank criteria are not met, examine the raw data for the presence of high molecular weight contaminants, examine subsequent sample data for unusual peaks, and use professional judgment to qualify the data. If the laboratory chooses to analyze samples under unacceptable GPC criteria, notify the EPA Regional CLP COR.
a. If the RT shift of bis(2-ethylhexyl) phthalate and perylene is > 5%, the GPC unit may be in an unstable temperature environment and subject to erratic performance. The expected result may be an unknown bias in the data. Contact the EPA Regional CLP COR to arrange for sample reanalysis.
2. If GPC calibration verification is not performed at the specified frequency, use professional judgment to qualify detects and non-detects.
3. If GPC calibration verification is not performed at the specified concentrations, use professional judgment to qualify detects and non-detects.
4. If errors are detected in the calculations of the %R in the GPC calibration verification, perform a more comprehensive recalculation.
5. If GPC calibration verification criteria are not met, examine the raw data and qualify data as follows:
a. If the %R is < 10% for any target analytes and surrogates in the GPC calibration verification, use professional judgment to qualify detects. Qualify non-detects as unusable (R).
b. If the %R is ≥ 10% and < 80% for any target analytes and surrogates in the GPC calibration verification, qualify detects as estimated (J) and non-detects as estimated (UJ).
c. If the %R is ≥ 80% and ≤ 120% for all target analytes and surrogates in the GPC calibration verification, detects and non-detects should not be qualified.
d. If the %R is > 120% for any target analytes and surrogates in the GPC calibration verification, use professional judgment to qualify detects. Non-detects should not be qualified.
6. Annotate the potential effects on the sample data resulting from the GPC cleanup analyses not yielding acceptable results in the Data Review Narrative.

Organic Data Review Pesticides
January 2017 195
Table 67. GPC Performance Check Actions for Pesticide Analysis
Criteria Action
Detect Non-detect
GPC Performance Check not performed at the specified frequency or concentration
Use professional judgment Use professional judgment
%R < 10% (target analytes) Use professional judgment R
10% ≤ %R < 80% (target analytes) J UJ
80% ≤ %R ≤ 120% (target analytes) No qualification No qualification
%R > 120% (target analytes) Use professional judgment No qualification

Organic Data Review Pesticides
January 2017 196
XI. Target Analyte Identification
A. Review Items
Form 1A-OR, Form 10A-OR, Form 10B-OR, chromatograms, and data system printouts. (SOW SOM02.4 – Exhibit B, Section 3.4 and Exhibit D/PEST, Section 11.1.1)
B. Objective
The objective is to provide acceptable GC/ECD qualitative analysis to minimize the number of erroneous analyte identifications.
C. Criteria
1. The RTs of both of the surrogates and reported target analytes in each sample must be within the calculated RT windows on both columns. TCX must be within ±0.05 minutes of the RT���� determined from the ICAL, and DCB must be within ±0.10 minutes of the RT���� determined from the ICAL.
2. For detected single component target analytes and Toxaphene, the %D between the concentrations on two GC columns must be calculated according to the method. The %D for any detected target analyte should be < 25.0% to have high confidence in the identification.
3. When no analytes are identified in a sample, the chromatograms from the analyses of the sample extract must use the same scaling factor as was used for the low-point standard of the ICAL associated with those analyses.
4. Chromatograms must display detected single component target analytes in the sample and the largest peak of Toxaphene detected in the sample at less than full scale.
5. If an extract must be diluted, chromatograms must display single component target analyte peaks between 10-100% of full scale, and the chosen five Toxaphene peaks between 25-100% of full scale.
6. For any sample, the baseline of the chromatogram must return to below 50% of full scale before the elution time of alpha-BHC, and also return to below 25% of full scale after the elution time of alpha-BHC and before the elution time of DCB.
7. If a chromatogram is replotted electronically to meet these requirements, the scaling factor used must be displayed on the chromatogram, and both the initial chromatogram and the replotted chromatogram must be submitted in the data package.
D. Evaluation
1. Review Form 1A-OR, the associated raw data (chromatograms and data system printouts), Form 10A-OR, and Form 10B-OR.
a. Verify that the reported target analytes as detects are identified correctly by comparing the sample chromatograms to the tabulated results and verifying peak measurements and RTs.
b. Verify the non-detects by a review of the sample chromatograms.
c. Check the associated blank data for potential interferences (to evaluate sample data for false positives) and check the calibration data for adequate RT windows (to evaluate sample data for false positives and false negatives).
d. For Toxaphene, compare the RTs and relative peak height ratios of the five major peaks in the appropriate standard chromatograms.
e. Compare the Toxaphene peaks identified in the sample to determine that the RTs do not overlap with the RTs of any other target analytes or with chromatographic interferences from the sample matrix.

Organic Data Review Pesticides
January 2017 197
2. Verify that the %D results were calculated correctly and that the recalculated %D agrees with that reported on Forms 10A-OR or 10B-OR, as appropriate.
3. Verify that the %D for any target analyte is < 25.0%. If the %D is > 25.0% for any target analyte, evaluate the impact of the presence of an interfering compound, and whether the interference precludes confirmation of the target analyte. Also, evaluate the possibility of poor precision or non-homogeneity as causes for the difference.
E. Action
1. If the qualitative criteria for both columns are not met, all target analytes that are reported as detects should be qualified as non-detect (U). Use professional judgment to assign an appropriate quantitation limit using the following guidance:
a. If the detected target analyte peak is sufficiently outside the RT window determined from the associated ICAL, the reported values may be a false positive and should be replaced with the sample CRQL value.
b. If the detected target analyte peak poses an interference with the potential detection of another target peak, the reported value should be considered and qualified as unusable (R).
2. If a peak is identified in both GC column analyses that falls within the appropriate RT windows, but the analyte is reported as a non-detect, the analyte may be a false negative. Use professional judgment to decide if the analyte should be included and reported as detect. Annotate all conclusions made regarding target analyte identification in the Data Review Narrative.
3. If the Toxaphene peak RT windows determined from the calibration overlap with single component target analytes or chromatographic interferences, use professional judgment to qualify the data.
4. If Toxaphene exhibits a marginal pattern-matching quality, use professional judgment to determine if the differences are due to environmental “weathering” (i.e., degradation of the earlier eluting peaks relative to the later eluting peaks). If the presence of Toxaphene is strongly suggested, report results as presumptively present with estimated concentration (NJ).
5. If errors are detected in the calculations of the %D for any target analyte, perform a more comprehensive recalculation.
6. If an interfering compound is indicated, consider the potential for co-elution and use professional judgment to determine how best to report. It is recommended to either report the analyte as positive at the lower value, qualified as tentative (N), or as non-detect (U) at the CRQL.

Organic Data Review Pesticides
January 2017 198
XII. Gas Chromatograph/Mass Spectrometer Confirmation
A. Review Items
Form 1A-OR, Form 10A-OR, Form 10B-OR, chromatograms, and data system printouts. (SOW SOM02.4 – Exhibit B, Section 3.4 and Exhibit D/PEST, Section 11.1.2)
B. Objective
The objective is to ensure the accuracy of the positive identification of a target analyte.
C. Criteria
1. Gas Chromatography/Mass Spectrometer (GC/MS) confirmation is required when a positivelyidentified target analyte has on-column concentration meeting the specified criterion on both GCcolumns. For a single component target analyte, GC/MS shall be performed for analyteconcentration ≥ 5.0 ng/µL. For Toxaphene, GC/MS shall be performed for at least one peakconcentration ≥ 125 ng/µL.
2. GC/MS confirmation may be accomplished by one of three general means:
a. Examination of the semivolatile GC/MS library search results [i.e., Tentatively IdentifiedCompound (TIC) data];
b. A second analysis of the semivolatile extract; or
c. Analysis of the pesticide extract, following any solvent exchange and concentration steps thatmay be necessary.
D. Evaluation
1. Review Form 1A-OR, the associated raw data (chromatograms and data system printouts), Form10A-OR, and Form 10B-OR.
2. Check the quantitation report to verify that GC/MS confirmation is required by ensuring that theon-column concentration criteria are met (criteria indicated in Section C.1).
3. Verify that GC/MS confirmation is completed as specified in the method.
NOTE: For data obtained from the CLP, the preceding criteria are evaluated as part of the CCS process. Information regarding noncompliant GC/MS can be obtained from the CCS report and may be used as part of the evaluation process.
E. Action
1. If an analyte was confirmed by GC/MS, qualify as confirmed (C).
2. If a sufficient quantity of an analyte was indicated and GC/MS confirmation was attempted but wasnot confirmed, qualify with an X or as non-detect (U). Explain in the Data Review Narrative thatthe analyte should be considered non-detect because it could not be confirmed.
Table 68. GC/MS Confirmation Actions
Criteria Action for Detects
Analyte confirmed by GC/MS C
Analyte indicated but not confirmed by GC/MS X or U
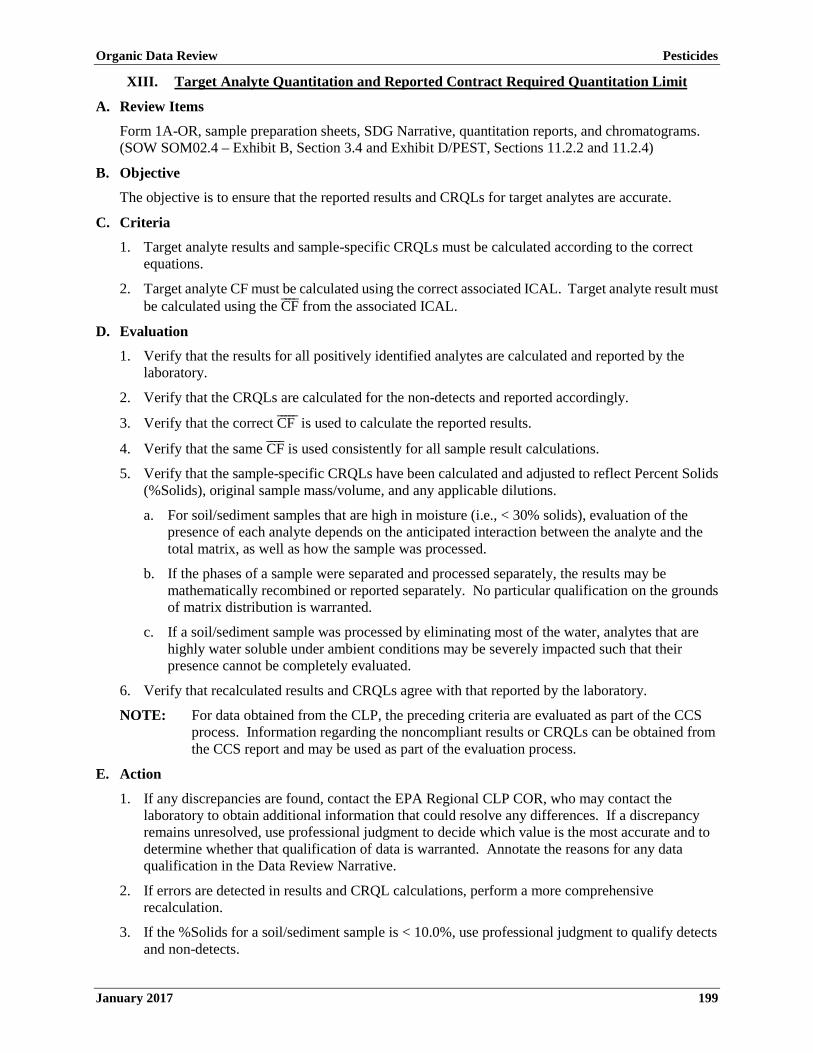
Organic Data Review Pesticides
January 2017 199
XIII. Target Analyte Quantitation and Reported Contract Required Quantitation Limit
A. Review Items
Form 1A-OR, sample preparation sheets, SDG Narrative, quantitation reports, and chromatograms. (SOW SOM02.4 – Exhibit B, Section 3.4 and Exhibit D/PEST, Sections 11.2.2 and 11.2.4)
B. Objective
The objective is to ensure that the reported results and CRQLs for target analytes are accurate.
C. Criteria
1. Target analyte results and sample-specific CRQLs must be calculated according to the correctequations.
2. Target analyte CF must be calculated using the correct associated ICAL. Target analyte result mustbe calculated using the CF���� from the associated ICAL.
D. Evaluation
1. Verify that the results for all positively identified analytes are calculated and reported by thelaboratory.
2. Verify that the CRQLs are calculated for the non-detects and reported accordingly.
3. Verify that the correct CF ����� is used to calculate the reported results.
4. Verify that the same CF���� is used consistently for all sample result calculations.
5. Verify that the sample-specific CRQLs have been calculated and adjusted to reflect Percent Solids(%Solids), original sample mass/volume, and any applicable dilutions.
a. For soil/sediment samples that are high in moisture (i.e., < 30% solids), evaluation of thepresence of each analyte depends on the anticipated interaction between the analyte and thetotal matrix, as well as how the sample was processed.
b. If the phases of a sample were separated and processed separately, the results may bemathematically recombined or reported separately. No particular qualification on the groundsof matrix distribution is warranted.
c. If a soil/sediment sample was processed by eliminating most of the water, analytes that arehighly water soluble under ambient conditions may be severely impacted such that theirpresence cannot be completely evaluated.
6. Verify that recalculated results and CRQLs agree with that reported by the laboratory.
NOTE: For data obtained from the CLP, the preceding criteria are evaluated as part of the CCS process. Information regarding the noncompliant results or CRQLs can be obtained from the CCS report and may be used as part of the evaluation process.
E. Action
1. If any discrepancies are found, contact the EPA Regional CLP COR, who may contact thelaboratory to obtain additional information that could resolve any differences. If a discrepancyremains unresolved, use professional judgment to decide which value is the most accurate and todetermine whether that qualification of data is warranted. Annotate the reasons for any dataqualification in the Data Review Narrative.
2. If errors are detected in results and CRQL calculations, perform a more comprehensiverecalculation.
3. If the %Solids for a soil/sediment sample is < 10.0%, use professional judgment to qualify detectsand non-detects.

Organic Data Review Pesticides
January 2017 200
4. If the %Solids for a soil/sediment sample is ≥ 10.0% and < 30.0%, use professional judgment to qualify detects and non-detects.
5. If the %Solids for a soil/sediment sample is ≥ 30.0%, detects and non-detects should not be qualified.
6. If sample results are < CRQLs and ≥ MDLs, qualify as estimated (J).
7. Note numerous or significant failures to accurately quantify the target analytes, or to properly evaluate and adjust CRQLs, for EPA Regional CLP COR action.
Table 69. Percent Solids Actions for Pesticide Analysis for Non-Aqueous Samples
Criteria Action
Detect Non-detect
%Solids < 10.0% Use professional judgment Use professional judgment
10.0% ≤ %Solids < 30.0% Use professional judgment Use professional judgment
%Solids > 30.0% No qualification No qualification
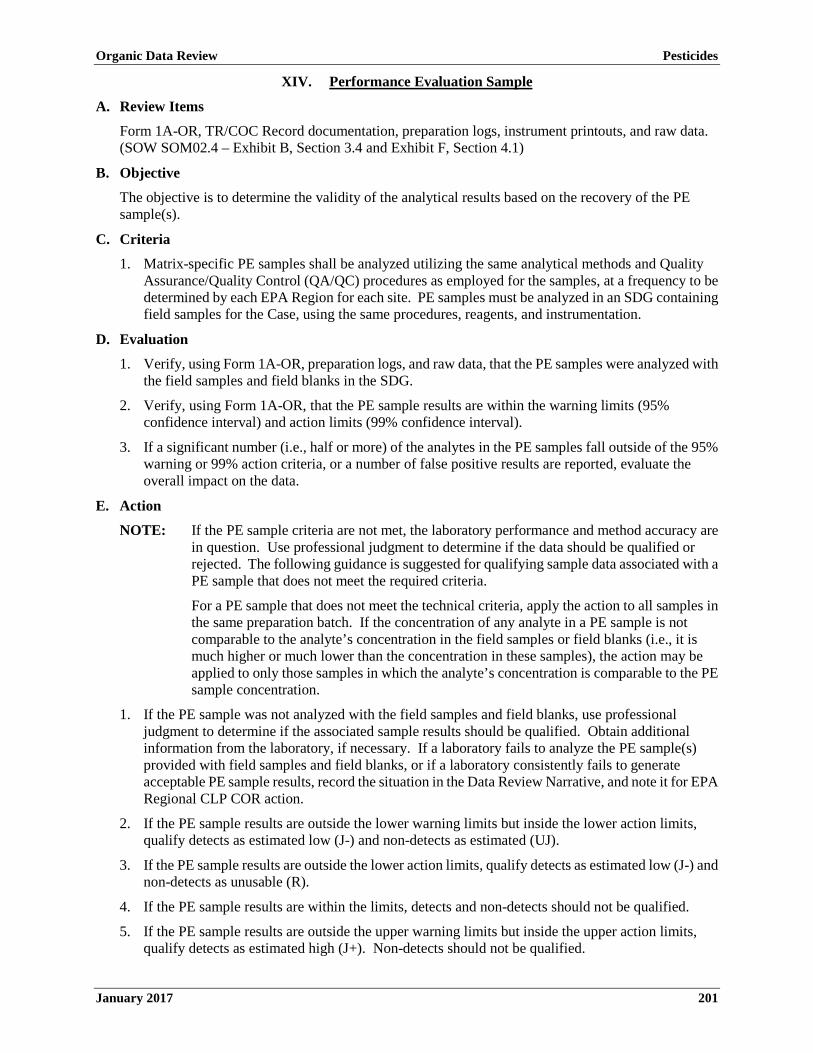
Organic Data Review Pesticides
January 2017 201
XIV. Performance Evaluation Sample
A. Review Items
Form 1A-OR, TR/COC Record documentation, preparation logs, instrument printouts, and raw data. (SOW SOM02.4 – Exhibit B, Section 3.4 and Exhibit F, Section 4.1)
B. Objective
The objective is to determine the validity of the analytical results based on the recovery of the PE sample(s).
C. Criteria
1. Matrix-specific PE samples shall be analyzed utilizing the same analytical methods and Quality Assurance/Quality Control (QA/QC) procedures as employed for the samples, at a frequency to be determined by each EPA Region for each site. PE samples must be analyzed in an SDG containing field samples for the Case, using the same procedures, reagents, and instrumentation.
D. Evaluation
1. Verify, using Form 1A-OR, preparation logs, and raw data, that the PE samples were analyzed with the field samples and field blanks in the SDG.
2. Verify, using Form 1A-OR, that the PE sample results are within the warning limits (95% confidence interval) and action limits (99% confidence interval).
3. If a significant number (i.e., half or more) of the analytes in the PE samples fall outside of the 95% warning or 99% action criteria, or a number of false positive results are reported, evaluate the overall impact on the data.
E. Action
NOTE: If the PE sample criteria are not met, the laboratory performance and method accuracy are in question. Use professional judgment to determine if the data should be qualified or rejected. The following guidance is suggested for qualifying sample data associated with a PE sample that does not meet the required criteria.
For a PE sample that does not meet the technical criteria, apply the action to all samples in the same preparation batch. If the concentration of any analyte in a PE sample is not comparable to the analyte’s concentration in the field samples or field blanks (i.e., it is much higher or much lower than the concentration in these samples), the action may be applied to only those samples in which the analyte’s concentration is comparable to the PE sample concentration.
1. If the PE sample was not analyzed with the field samples and field blanks, use professional judgment to determine if the associated sample results should be qualified. Obtain additional information from the laboratory, if necessary. If a laboratory fails to analyze the PE sample(s) provided with field samples and field blanks, or if a laboratory consistently fails to generate acceptable PE sample results, record the situation in the Data Review Narrative, and note it for EPA Regional CLP COR action.
2. If the PE sample results are outside the lower warning limits but inside the lower action limits, qualify detects as estimated low (J-) and non-detects as estimated (UJ).
3. If the PE sample results are outside the lower action limits, qualify detects as estimated low (J-) and non-detects as unusable (R).
4. If the PE sample results are within the limits, detects and non-detects should not be qualified.
5. If the PE sample results are outside the upper warning limits but inside the upper action limits, qualify detects as estimated high (J+). Non-detects should not be qualified.

Organic Data Review Pesticides
January 2017 202
6. If the PE sample results are outside the upper action limits, qualify detects as estimated high (J+).Non-detects should not be qualified.
7. Annotate the potential effects on the data due to out-of-control PE sample results in the DataReview Narrative.
Table 70. PE Sample Actions for Pesticide Analysis
Criteria Action
Detect Non-detect PE sample results outside lower warning limits but inside lower action limits J- UJ
PE sample results outside lower action limits J- R PE sample results within limits No qualification No qualification PE sample results outside upper warning limits but inside upper action limits J+ No qualification
PE sample results outside upper action limits J+ No qualification

Organic Data Review Pesticides
January 2017 203
XV. Regional Quality Assurance and Quality Control
A. Review Items
Form 1A-OR, chromatograms, TR/COC Record documentation, quantitation reports, and other raw data from QA/QC samples. (SOW SOM02.4 – Exhibit B, Sections 2.4 and 3.4)
B. Objective
The objective is to use results from the analysis of EPA Regional QA/QC samples such as field duplicates, blind spikes, and blind blanks to determine the validity of the analytical results.
C. Criteria
Criteria are determined by each EPA Region.
1. The frequency of EPA Regional QA/QC samples should be defined in the project QAPP.
2. Performance criteria for EPA Regional QA/QC samples should also be defined in the projectQAPP.
3. The EPA Region may provide the laboratory with PE samples to be analyzed with each SDG.These samples may include blind spikes and/or blind blanks. The laboratory must analyze a PEsample when provided by the EPA Region. Refer to Section V, above, for blanks criteria. Referto Section XIV, above, for PE samples criteria.
4. The RPD between field duplicates shall fall with the specific limits in the EPA Region’s SOP orproject QAPP.
D. Evaluation
1. Evaluation procedures must follow the EPA Region’s SOP for data review.
2. Determine whether the results of EPA Regional QA/QC samples impact all samples in the projector only those directly associated (i.e., in the same SDG, collected on the same day, preparedtogether, or contained in the same analytical sequence).
3. Calculate the RPD between field duplicates and provide this information in the Data ReviewNarrative. Also verify that the value falls within the specific limits in the EPA Region’s SOP orproject QAPP.
4. Determine whether poor precision is the fault of the laboratory, or a result of samplenon-homogeneity in the field. Laboratory observations of sample appearance may becomeimportant in these situations.
E. Action
1. Any action must be in accordance with EPA Regional specifications and the criteria for acceptablefield duplicate sample results.
2. Note unacceptable results for field duplicate samples for EPA Regional CLP COR action.
3. In general, for EPA Regional QA/QC performance not within QAPP specification, qualify detectsas estimated (J) and non-detects as estimated (UJ). The impact on overall data quality should beassessed after consultation with the data user and/or field personnel. Contact the EPA RegionalCLP COR if reanalysis of samples is required.

Organic Data Review Pesticides
January 2017 204
XVI. Overall Assessment of Data
A. Review Items
Entire data package, data review results, and (if available) the QAPP and Sampling and Analysis Plan (SAP).
B. Objective
The objective is to provide the overall assessment on data quality and usability.
C. Criteria
1. Review all available materials to assess the overall quality of the data, keeping in mind the additive nature of analytical problems.
2. Reported analyte concentrations must be quantitated according to the appropriate equations, as listed in the method. All sample results must be within the linear calibration ranges per the methods.
D. Evaluation
Examine the raw data to verify that the correct calculation of the sample results was reported by the laboratory. Analysis logs, instrument printouts, etc., should be compared to the reported sample results recorded on the appropriate Organic Data Reporting Forms (Form 1A-OR through Form 10B-OR).
1. Evaluate any technical problems which have not been previously addressed.
2. Examine the raw data for any anomalies (e.g., baseline shift).
3. Verify that the appropriate method is used in sample analysis.
4. Verify that there are no transcription or reduction errors.
5. Verify that target analyte results fall within the calibrated ranges.
6. If appropriate information is available, use professional judgment to assess the usability of the data in order to assist the data user in avoiding inappropriate use of the data. Review all available information, including the QAPP (specifically the acceptance and performance criteria), SAP, and communication with the data user that concerns the intended use and desired quality of these data.
E. Action
1. Use professional judgment to determine if there is any need to qualify data which were not qualified based on the QC criteria previously discussed.
2. Use professional judgment to qualify sample results and non-detects if the MDL exceeds the CRQL.
3. If a sample is not diluted properly when sample results exceed the upper limit of the calibration range, qualify sample results as estimated (J).
4. Write a brief Data Review Narrative to give the user an indication of the limitations of the analytical data.
5. Note any inconsistency of the data with the SDG Narrative for EPA Regional CLP COR action. If sufficient information on the intended use and required quality of the data is available, include an assessment of the usability of the data within the given context. This may be used as part of a formal Data Quality Assessment (DQA).
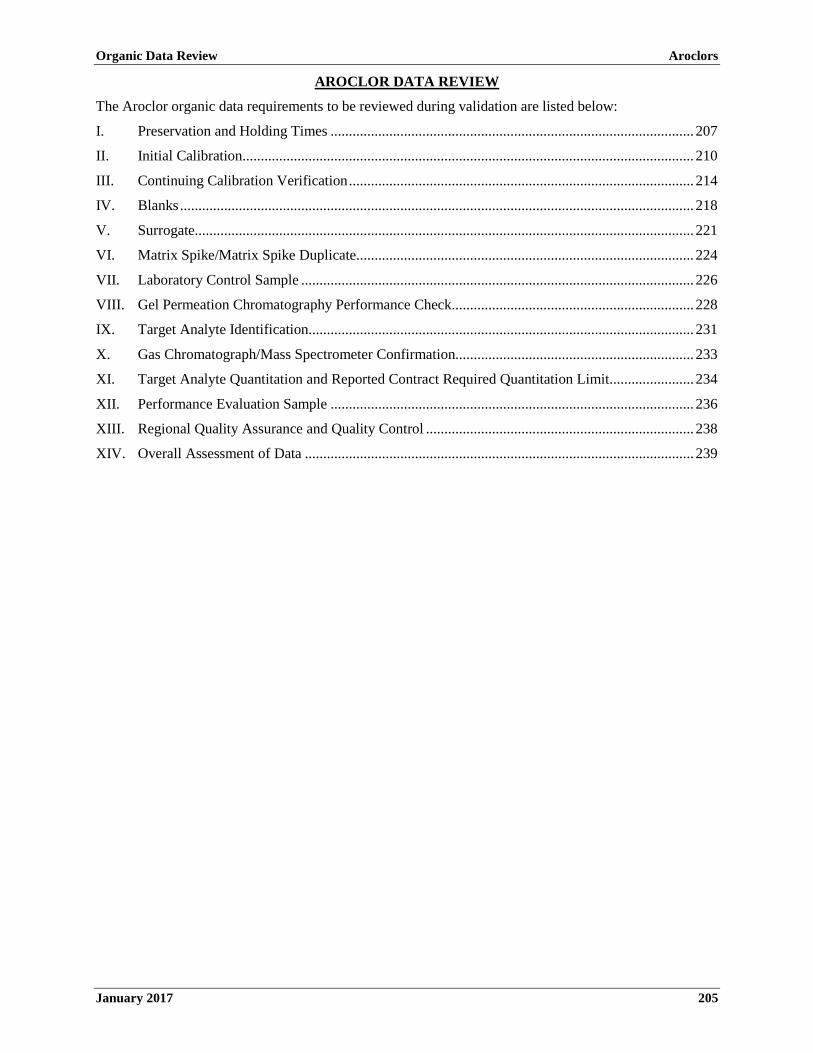
Organic Data Review Aroclors
January 2017 205
AROCLOR DATA REVIEW
The Aroclor organic data requirements to be reviewed during validation are listed below:
I. Preservation and Holding Times ................................................................................................... 207
II. Initial Calibration ........................................................................................................................... 210
III. Continuing Calibration Verification .............................................................................................. 214
IV. Blanks ............................................................................................................................................ 218
V. Surrogate........................................................................................................................................ 221
VI. Matrix Spike/Matrix Spike Duplicate ............................................................................................ 224
VII. Laboratory Control Sample ........................................................................................................... 226
VIII. Gel Permeation Chromatography Performance Check .................................................................. 228
IX. Target Analyte Identification......................................................................................................... 231
X. Gas Chromatograph/Mass Spectrometer Confirmation................................................................. 233
XI. Target Analyte Quantitation and Reported Contract Required Quantitation Limit ....................... 234
XII. Performance Evaluation Sample ................................................................................................... 236
XIII. Regional Quality Assurance and Quality Control ......................................................................... 238
XIV. Overall Assessment of Data .......................................................................................................... 239

Organic Data Review Aroclors
January 2017 206
This page is intentionally left blank.
Organic Data Review Aroclors
January 2017 207
I. Preservation and Holding Times
A. Review Items
Form 1A-OR, Traffic Report/Chain of Custody (TR/COC) Record documentation, Form DC-1, raw data, sample extraction sheets, and the Sample Delivery Group (SDG) Narrative checking for: pH, shipping container temperature, holding time, and other sample conditions. (SOW SOM02.4 – Exhibit B, Section 3.4; Exhibit D/Introduction, Section 5.0; Exhibit D/General, Sections 8.0, 10.1.2.1, and 10.2.2.4.4; and Exhibit D/ARO, Section 8.0)
B. Objective
The objective is to determine the validity of the analytical results based on the sample conditions and the holding time of the sample.
C. Criteria
1. The extraction technical holding time is determined from the date of sample collection to the dateof sample extraction. The analysis technical holding time is determined from the date of sampleextraction completion to the date of sample analysis.
2. Samples shall be in proper condition with shipping container temperatures at ≤ 6ºC upon receipt atthe laboratory. All aqueous and non-aqueous samples shall be protected from light and refrigeratedat ≤ 6ºC (but not frozen) from the time of receipt at the laboratory. Sample extracts shall be storedat ≤ 6ºC (but not frozen) from the time of the extraction completion until analysis.
3. The extraction technical holding time criteria for aqueous samples that are not properly preserved is7 days.
4. The extraction technical holding time criteria for non-aqueous samples that are not properlypreserved is 14 days.
5. The extraction technical holding time criteria for aqueous and soil samples that are properlypreserved is 1 year.
6. The analysis technical holding time criteria for sample extracts that are not properly preserved is 40days.
7. The analysis technical holding time criteria for sample extracts that are properly preserved is 40days.
D. Evaluation
1. Review the SDG Narrative and the TR/COC Record documentation to determine if the samples arereceived intact and iced. If there is an indication of problems with the samples, the sample integritymay be compromised.
2. Verify that the extraction dates and the analysis dates for samples on Form 1A-OR and the raw dataare identical.
3. Determine the analysis technical holding times for samples after the completion of extraction bycomparing the dates of extraction with the dates of analysis on Form 1A-OR.
E. Action
1. If samples are received with shipping container temperatures > 6°C, use professional judgment toqualify detects and non-detects.
2. If discrepancies are found between the sample extraction date or analysis date and the date on theraw data, perform a more comprehensive review, contacting the laboratory if necessary through theUnited States Environmental Protection Agency Regional Contract Laboratory ProgramContracting Officer’s Representative (EPA Regional CLP COR), to determine the correct dates forestablishing the technical holding time.

Organic Data Review Aroclors
January 2017 208
3. If an aqueous sample is not properly preserved, but extraction is performed within the 7-daytechnical holding time and the extract is analyzed within the 40-day technical holding time, useprofessional judgment to qualify detects and non-detects.
4. If an aqueous sample is not properly preserved, but extraction is performed outside the 7-daytechnical holding time, and/or the extract is analyzed outside the 40-day technical holding time,detects should be qualified as estimated (J). Use professional judgment to qualify non-detects.
5. If an aqueous sample is properly preserved, extraction is performed within the 1-year technicalholding time, and the extract is analyzed within the 40-day technical holding time, detects andnon-detects should not be qualified.
6. If an aqueous sample is properly preserved, but extraction is performed outside the 1-year technicalholding time, and/or the extract is analyzed outside the 40-day technical holding time, qualifydetects as estimated (J) and non-detects as estimated (UJ).
7. If a non-aqueous sample is not properly preserved, but extraction is performed within the 14-daytechnical holding time and the extract is analyzed within the 40-day technical holding time, useprofessional judgment to qualify detects and non-detects.
8. If a non-aqueous sample is not properly preserved, but extraction is performed outside the 14-daytechnical holding time and/or the extract is analyzed outside the 40-day technical holding time,detects should be qualified as estimated (J). Use professional judgment to qualify non-detects.
9. If a non-aqueous sample is properly preserved, and extraction is performed within the 1-year technical holding time and the extract is analyzed within the 40-day technical holding time, detects and non-detects should not be qualified.
10. If a non-aqueous sample is properly preserved, but extraction is performed outside the 1-year technical holding time and/or the extract is analyzed outside the 40-day technical holding time, qualify detects as estimated low (J) and non-detects as estimated (UJ).
11. If discrepancies are found between the sample extraction date or analysis date and the date on theraw data, perform a more comprehensive review, contacting the laboratory if necessary through theEPA Regional CLP COR, to determine the correct dates for establishing the technical holding time.
12. Note the effect of exceeding the holding time on the resulting data in the Data Review Narrative,whenever possible.
13. If technical holding times are grossly exceeded, qualify detects as estimated (J). Use professionaljudgment to qualify non-detects as estimated (UJ) or unusable (R). Note it for EPA Regional CLPCOR action. Use caution in determining whether some detected analytes should be qualified asestimated low (J-) or estimated high (J+), based on knowledge of individual analyte stability orinteractions. Exceedance of holding time limits may not indicate a low bias for all Aroclors.
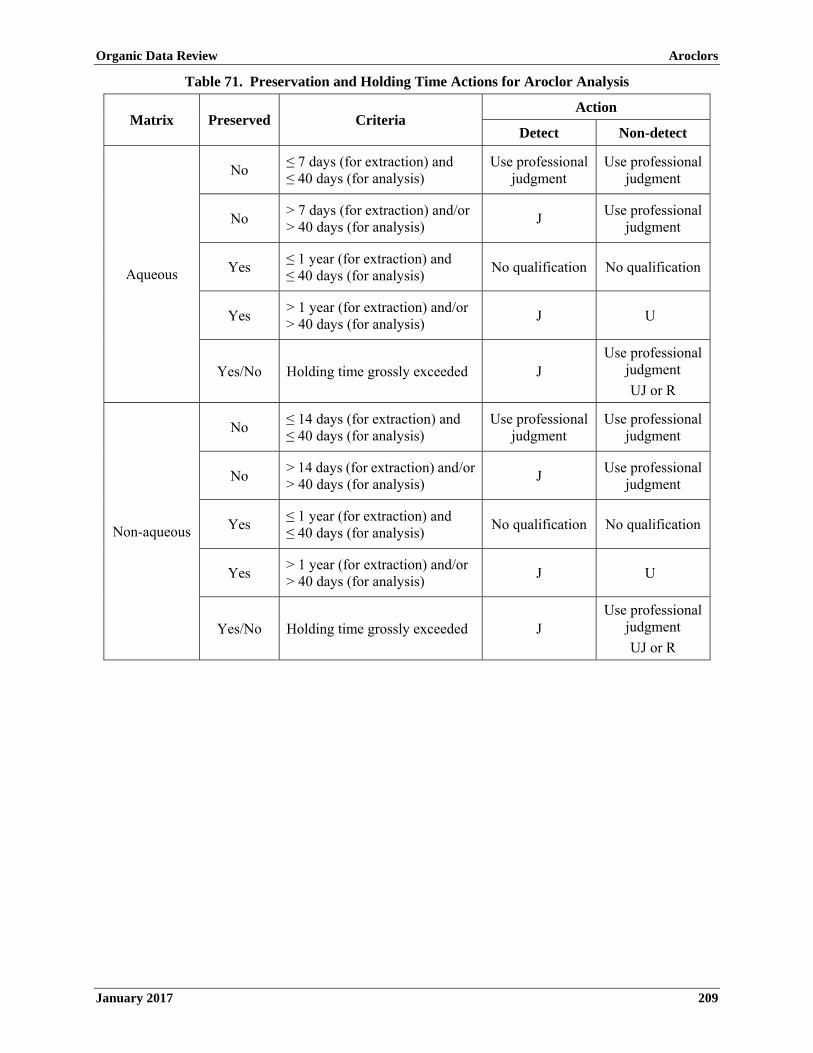
Organic Data Review Aroclors
January 2017 209
Table 71. Preservation and Holding Time Actions for Aroclor Analysis
Matrix Preserved Criteria Action
Detect Non-detect
Aqueous
No ≤ 7 days (for extraction) and ≤ 40 days (for analysis)
Use professional judgment
Use professional judgment
No > 7 days (for extraction) and/or > 40 days (for analysis)
J Use professional
judgment
Yes ≤ 1 year (for extraction) and ≤ 40 days (for analysis)
No qualification No qualification
Yes > 1 year (for extraction) and/or > 40 days (for analysis)
J U
Yes/No Holding time grossly exceeded J Use professional
judgment
UJ or R
Non-aqueous
No ≤ 14 days (for extraction) and ≤ 40 days (for analysis)
Use professional judgment
Use professional judgment
No > 14 days (for extraction) and/or > 40 days (for analysis)
J Use professional
judgment
Yes ≤ 1 year (for extraction) and ≤ 40 days (for analysis)
No qualification No qualification
Yes > 1 year (for extraction) and/or > 40 days (for analysis)
J U
Yes/No Holding time grossly exceeded J Use professional
judgment
UJ or R

Organic Data Review Aroclors
January 2017 210
II. Initial Calibration
A. Review Items
Form 6D-OR, Form 6E-OR, Form 6F-OR, chromatograms, and data system printouts. (SOW SOM02.4 – Exhibit B, Section 3.4 and Exhibit D/ARO, Sections 7.2.2 and 9.3)
B. Objective
The objective of initial calibration (ICAL) is to ensure that the instrument is capable of producing acceptable qualitative and quantitative data.
C. Criteria
1. A five-point ICAL is performed for Aroclor 1016/1260. Either single or five-point calibration shall be performed for the other Aroclor analytes. Aroclors 1221, 1232, 1242, 1248, 1254, 1262, or 1268 are calibrated at the lowest concentration (CS1) for pattern recognition at the Contract Required Quantitation Limit (CRQL). If Aroclors 1221, 1232, 1242, 1248, 1254, 1262, or 1268 are identified in a sample with a single-point ICAL, a valid five-point ICAL is required for confirming the identification and quantitation of the specific detected Aroclor analyte.
2. The ICAL must be performed following a specific sequence listed in Table 72. Single-point Aroclor calibration may be made before or after the analysis of the five-point Aroclor calibration. Each Aroclor Standard shall be analyzed before the analysis of any sample or blank.
3. The concentrations for Aroclors in the five ICAL standards shall be at 100, 200, 400, 800, and 1600 ng/mL. The concentrations for surrogates in the five ICAL standards shall be at 5.0, 10, 20, 40, and 80 ng/mL for tetrachloro-m-xylene (TCX), and 10, 20, 40, 80, and 160 ng/mL for decachlorobiphenyl (DCB). The single-point ICAL standard for all Aroclors other than Aroclor 1016/1260 should be at 100 ng/mL.
4. The Mean Retention Times (RT����s) of each of the five major peaks of Aroclors 1016 and 1260 and the Retention Time (RT) of the surrogates are determined from the five-point ICAL. For Aroclor 1221, the RT of each of the three major peaks and the RT of the surrogates are determined from the single-point standard ICAL standard. For the other six Aroclors (1232, 1242, 1248, 1254, 1262, or 1268), the RT of each of the five major peaks and the RT of the surrogates are determined from the single-point standard ICAL. If Aroclors 1221, 1232, 1242, 1248, 1254, 1262, or 1268 are identified in a sample, the RT����s of each of the five major peaks (three major peaks for Aroclor 1221) and the RT of the surrogates are determined from the five-point ICAL.
5. An RT window must be calculated as ±0.07 for each of the five major Aroclor peaks (three major peaks for Aroclor 1221), and ±0.05 and ±0.10 for the surrogates TCX and DCB, respectively.
6. The chromatograms of the standards for the Aroclors analyzed during the ICAL sequence must display the peaks chosen for identification of each analyte at greater than 25% of full scale, but less than 100% of full scale.
7. The Mean Calibration Factor (CF����) must be calculated for the five major peaks for each Aroclor (three major peaks for Aroclor 1221), as well as for the surrogates, in the 5-point ICAL.
8. The Percent Relative Standard Deviation (%RSD) of the Calibration Factors (CFs) for the five major peaks of each of the Aroclor analytes must be ≤ 20.0%. The %RSD of the CFs for the two surrogates must be ≤ 20.0%.
NOTE: Either peak area or peak height may be used to calculate the CFs that are, in turn, used to calculate the %RSD. However, the type of peak measurement used to calculate each CF for a given compound must be consistent. For example, if peak area is used to calculate the CS1 CF for a given peak of a certain Aroclor, the remaining CFs for the same peak in the remaining standards (CS2-CS5) for that Aroclor must also be calculated using peak area.

Organic Data Review Aroclors
January 2017 211
Table 72. Initial Calibration Sequence
1. Aroclor 1221 CS1
2. Aroclor 1232 CS1
3. Aroclor 1242 CS1
4. Aroclor 1248 CS1
5. Aroclor 1254 CS1
6. Aroclor 1262 CS1
7. Aroclor 1268 CS1
8. Aroclor 1016/1260 (100 ng/mL) CS1
9. Aroclor 1016/1260 (200 ng/mL) CS2
10. Aroclor 1016/1260 (400 ng/mL) CS3
11. Aroclor 1016/1260 (800 ng/mL) CS4
12. Aroclor 1016/1260 (1600 ng/mL) CS5
13. Instrument blank
D. Evaluation
1. Verify that the ICAL is performed at the specified frequency and sequence. Verify that the proper ICAL sequence is used and that either single-point calibration for Aroclors other than Aroclor 1016/1260 is included in the ICAL, or a 5-point calibration for a specific Aroclor is included.
2. Check the raw data (chromatograms and data system printouts) for each standard in the ICAL to verify that each of the standards is analyzed at the specified concentrations for Aroclor analytes and surrogates.
3. Check the Aroclor Standards data and Form 6D-OR, Form 6E-OR, and Form 6F-OR to verify that the RT windows, CFs, CF����s, and %RSDs are calculated correctly. Recalculate the CFs and %RSDs for one or more Aroclors and verify that the recalculated values agree with that reported by the laboratory and there are no transcription errors.
4. Check the chromatograms and verify that at least one chromatogram from each of the Aroclor Standards yields peaks registering recorder deflections between 25-100% of full scale.
5. Verify that the %RSD for the CFs are within the acceptance limits.
NOTE: For data obtained from the CLP, the preceding criteria are evaluated as part of the Contract Compliance Screening (CCS) process. Information regarding the noncompliant RT windows and %RSD can be obtained from the National Functional Guidelines (NFG) reports and may be used as part of the evaluation process.
E. Action
1. If ICAL is not performed at the specified frequency and sequence, use professional judgment to qualify detects and non-detects. Contact the EPA Regional CLP COR to arrange for reanalysis, if possible, or note it in the Data Review Narrative for later EPA Regional CLP COR action.
2. If the ICAL standards are not performed at the specified concentrations, use professional judgment to qualify detects and non-detects. This is especially critical for the low-level standards and non-detects.
3. If errors are detected in the calculations of RT windows, CFs, CF����s, or %RSDs, perform a more comprehensive recalculation.
Organic Data Review Aroclors
January 2017 212
4. If the chromatogram display criteria are not met, use professional judgment to qualify detects and non-detects. Contact the EPA Regional CLP COR to arrange for a revised report, or note in the Data Review Narrative for later EPA Regional CLP COR action.
5. If the %RSD for any target analyte peak used for Aroclor analyte identification is outside the acceptance limits, qualify detects as estimated (J). Use professional judgment to qualify non-detects.
6. If the %RSD for all target analyte peaks used for Aroclor analyte identification are within the acceptance limits, detects and non-detects should not be qualified.
7. Based on the project-specific Data Quality Objectives (DQOs), a more in-depth review may be necessary. The following guidelines are recommended:
a. If the %RSD criteria of any target analytes are not met, and if the %RSD criteria are still not satisfied after eliminating either the high or the low-point of the ICAL:
i. Qualify detects in the associated samples as estimated (J).
ii. Use professional judgment to qualify non-detects in the associated samples.
b. If the high-point of the ICAL curve is outside of the %RSD criteria (e.g., due to saturation):
i. Qualify detects in the associated samples with analyte concentrations greater than the high-point concentration as estimated (J).
ii. Detects in the associated samples with analyte concentrations within the calibration range should not be qualified.
iii. Non-detects in the associated samples should not be qualified.
c. If the low-point of the ICAL curve is outside of the %RSD criteria:
i. Qualify detects in the associated samples with analyte concentrations in the non-linear range as estimated (J).
ii. Detects in the associated samples with analyte concentrations within the calibration range should not be qualified.
iii. For non-detects in the associated samples, use the lowest point of the linear portion of the ICAL curve to determine the new quantitation limit.
8. If the laboratory failed to provide adequate calibration information, notify the EPA Regional CLP COR, who may contact the laboratory to request the necessary information. If the information is not available, use professional judgment to assess the data.
9. Annotate the potential effects on the reported data due to exceeding the ICAL criteria in the Data Review Narrative.
10. If the ICAL criteria are grossly exceeded, contact the EPA Regional CLP COR to arrange for reanalysis, if possible, or note it in the Data Review Narrative for later EPA Regional CLP COR action.
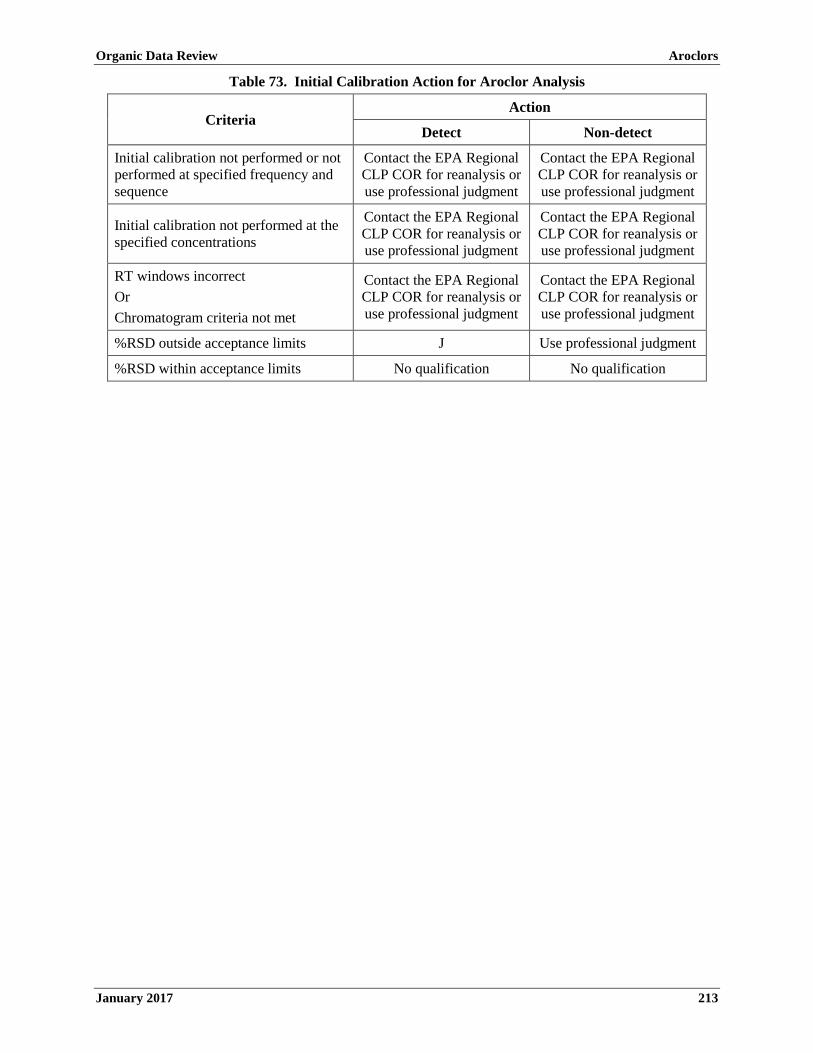
Organic Data Review Aroclors
January 2017 213
Table 73. Initial Calibration Action for Aroclor Analysis
Criteria Action
Detect Non-detect
Initial calibration not performed or not performed at specified frequency and sequence
Contact the EPA Regional CLP COR for reanalysis or use professional judgment
Contact the EPA Regional CLP COR for reanalysis or use professional judgment
Initial calibration not performed at the specified concentrations
Contact the EPA Regional CLP COR for reanalysis or use professional judgment
Contact the EPA Regional CLP COR for reanalysis or use professional judgment
RT windows incorrect Or Chromatogram criteria not met
Contact the EPA Regional CLP COR for reanalysis or use professional judgment
Contact the EPA Regional CLP COR for reanalysis or use professional judgment
%RSD outside acceptance limits J Use professional judgment
%RSD within acceptance limits No qualification No qualification

Organic Data Review Aroclors
January 2017 214
III. Continuing Calibration Verification
A. Review Items
Form 7D-OR, chromatograms, and data system printouts. (SOW SOM02.4 – Exhibit B, Section 3.4 and Exhibit D/ARO, Sections 7.2.2 and 9.4)
B. Objective
The objective is to ensure that the instrument continues to meet the sensitivity and linearity criteria to produce acceptable qualitative and quantitative data throughout each analytical sequence.
C. Criteria
1. A Continuing Calibration Verification (CCV), consisting of the analyses of instrument blanks and the mid-point concentration (CS3) of Aroclor Standards, must be performed at the beginning (opening CCV) and end (closing CCV) of each 12-hour analytical sequence. The opening and closing CCVs consist of an injection of an instrument blank followed by an injection of mid-point ICAL standard CS3 of Aroclor 1016/1260. If an Aroclor analyte other than 1016 or 1260 is detected in any samples, a mid-point ICAL standard CS3 of that specific Aroclor analyte must be analyzed as part of the opening and closing CCV.
2. The CCV CS3 standards must contain all required target analytes and surrogates at or near the mid-point standard concentration of the ICAL.
3. The RT for each Aroclor target analyte and surrogate in the CCV CS3 standard must be within the RT windows determined from the ICAL.
4. The Percent Difference (%D) between the CF and CF���� from the associated ICAL for each of the five major Aroclor target analyte peaks (three major peaks for Aroclor 1221) and surrogate in the CCV CS3 standard must be calculated accordingly.
5. For the opening CCV, or closing CCV that is used as an opening CCV for the next 12-hour period, the %D for each of the five peaks (three major peaks for Aroclor 1221) used to identify an Aroclor and surrogates in the CS3 Aroclor Standard must be in the inclusive range of ±25.0% and ±30.0%, respectively.
6. For a closing CCV, the %D for each of the five peaks (three major peaks for Aroclor 1221) used to identify an Aroclor and surrogates in the CS3 Aroclor Standard must be in the inclusive range of ±50.0%.
7. Instrument blanks paired with the CS3 standard must bracket the 12-hour analytical sequence. The concentration of each target analyte in the instrument blank must not exceed the CRQL.
8. No more than 14 hours may elapse from the injection beginning the opening CCV (instrument blank) and the injection ending the closing CCV (CS3 Aroclor Standard).
9. No more than 12 hours may elapse from the injection of the instrument blank that begins an analytical sequence (opening CCV) and the injection of the last sample or blank that is part of the same analytical sequence.
D. Evaluation
1. Verify that the CCV is performed at the specified frequency and sequence.
2. Verify that the CCV CS3 standard is performed at the specified concentrations.
3. Verify that the RTs for each Aroclor peak and for surrogate in the CS3 standard are within the RT windows.

Organic Data Review Aroclors
January 2017 215
4. Check the data for each of the Aroclors and surrogates in the CS3 standards on Form 7D-OR and verify that the CFs and %Ds are calculated correctly. Recalculate the CFs and %Ds for one or more Aroclor peaks and verify that the recalculated values agree with that reported by the laboratory and that there are no transcription errors.
5. Verify that the %D for each of the five peaks (three major peaks for Aroclor 1221) used to identify an Aroclor analyte and surrogates in the opening CCV CS3 Aroclor Standard, or a closing CCV used as an opening CCV for the next analytical sequence, are within the acceptance limits (± 25.0% and ± 30.0% for target analytes and surrogates, respectively).
6. Verify that the %D for each of the five peaks (three major peaks for Aroclor 1221) used to identify an Aroclor analyte and surrogates in the closing CCV CS3 Aroclor Standard are within the acceptance limits (± 50.0%).
7. Verify that the instrument blanks paired with the CS3 standard are analyzed at the specified frequency and sequence and that the concentration of each target analyte in the instrument blank is not exceeding the CRQL.
8. Verify that the time elapsed between the injection of an instrument blank as opening CCV and the injection of that last CS3 Aroclor Standard as closing CCV is within 14 hours.
9. Verify that the time elapsed between the injection of an instrument blank as opening CCV and the injection of the last sample or blank in the same analytical sequence is within 12 hours.
NOTE: For data obtained from the CLP, information regarding the noncompliant CCV can be obtained from the NFG reports and may be used as part of the evaluation process.
E. Action
1. If the CCV is not performed at the specified frequency and sequence, contact the EPA Regional CLP COR to request that the laboratory repeat the analysis, if holding times have not expired and there is extract remaining. If reanalysis is not possible, carefully evaluate all other available information, including the quality of analyte peak shapes and RT match of surrogates on both columns, and compare to the most recent calibration performed on the same instrument under the same conditions. Using this information and professional judgment, the reviewer may be able to justify unqualified acceptance of qualitative results and qualification of all quantitative results as estimated (J). Otherwise, qualify all detects and non-detects as unusable (R).
2. If the CCV is not performed at the specified concentrations, use professional judgment to qualify detects and non-detects.
3. If the RTs for any Aroclor target analyte peak or surrogate in the CS3 standard are outside the RT windows and match peak pattern, carefully evaluate the associated sample results. All samples injected after the last in-control standard are potentially affected.
a. For non-detected target analytes in the affected samples, check the sample chromatograms that may contain any peaks that are close to the expected RT window of the target analyte peaks of interest.
i. If no peaks used for Aroclor analyte identification are present, non-detects should not be qualified.
ii. If any peaks present are close to the expected RT window of the analytes of interest, use professional judgment to qualify the non-detects as presumptively present with estimated concentration (NJ).
b. For detected target analytes in the affected samples, check the sample chromatograms that may contain any peaks that are close to the expected RT window of the target analytes of interest.

Organic Data Review Aroclors
January 2017 216
If the peaks are close to the expected RT window of the Aroclor of interest, it may require additional effort to determine if sample peaks represent the target analytes of interest. Peak pattern recognition is used as a means of identifying the Aroclor target analytes.
For example, the data package may be examined for the presence of three or more standards containing the target analytes of interest that were run within the analytical sequence during which the sample was analyzed. If three or more such standards are present, the RT windows can be re-evaluated using the RT����s of the standards. i. If the peaks used for Aroclor analyte identification in the affected sample fall within the
revised windows, qualify detects as presumptively present with estimated concentration (NJ).
ii. If the problem of concern remains unresolved, qualify detects as unusable (R).
4. If errors are detected in the calculations of either the CF or %D in any CCV CS3 standard, perform a more comprehensive recalculation. Contact the EPA Regional CLP COR to arrange for data resubmittal and note it in the Data Review Narrative for later EPA Regional CLP COR action.
5. If the %D for any Aroclor target analyte peak in CCV CS3 standard is outside the limits, qualify detects as estimated (J) and non-detects as estimated (UJ).
6. If the time elapsed between the injection of an instrument blank as opening CCV and the injection of the last required CS3 standard as closing CCV exceeds 14 hours, carefully evaluate instrument stability during the entire sequence to decide whether degradation has occurred, including column bleed, RTs, peak shapes, and surrogate recovery. If system degradation has been found, qualify positive results as estimated (J). If any possibility exists for either false positives or false negatives, qualify non-detects as unusable (R).
7. If the time elapsed between the injection of an instrument blank as opening CCV and the injection of the last sample or blank in the same analytical sequence exceeds 12 hours, carefully evaluate instrument stability during the entire sequence to decide whether degradation has occurred, including column bleed, RTs, peak shapes, and surrogate recovery. If system degradation has been found, qualify positive results as estimated (J). If any possibility exists for either false positives or false negatives, qualify non-detects as unusable (R).
8. If the RT for each target analyte peak in CS3 standards are within the RT windows or the %D for each target analyte peak in CCV CS3 is within the limits, detects and non-detects should not be qualified.
9. No qualification of the data is necessary based on the surrogate %D alone. Use professional judgment to evaluate the surrogate %D data in conjunction with surrogate recoveries to determine the need for data qualification.
10. If an instrument blank as part of CCV is not performed at the specified frequency and sequence, or instrument blank does not meet the concentration criteria, refer to Section IV. Blanks for data qualifications.
11. If the laboratory has failed to provide adequate calibration information, contact the EPA Regional CLP COR, who may contact the laboratory to request the necessary information. If the information is not available, use professional judgment to assess the data.
12. Note the potential effects on the data due to CCV criteria exceedance in the Data Review Narrative.
13. If the CCV criteria are grossly exceeded, note this for EPA Regional CLP COR action.

Organic Data Review Aroclors
January 2017 217
Table 74. CCV Actions for Aroclor Analysis
Criteria Action
Detect Non-detect
CCV CS3 not performed at the correct frequency and sequence
Contact the EPA Regional CLP COR for reanalysis or use professional judgment
Contact the EPA Regional CLP COR for reanalysis or use professional judgment
CCV CS3 not performed at the specified concentration
Contact the EPA Regional CLP COR for reanalysis or use professional judgment
Contact the EPA Regional CLP COR for reanalysis or use professional judgment
RT outside the RT window Use professional judgment Use professional judgment
CS3 %D outside the limits J UJ
Time elapsed between opening CCV instrument blank and closing CCV CS3 exceeds 14 hours
Use professional judgment Use professional judgment
Time elapsed between opening CCV instrument blank and last sample or blank exceeds 12 hours
Use professional judgment Use professional judgment
RT, CS3 %D, and time elapsed within limits No qualification No qualification
Organic Data Review Aroclors
January 2017 218
IV. Blanks
A. Review Items
Form 1A-OR, Form 4-OR, chromatograms, and quantitation reports. (SOW SOM02.4 – Exhibit B, Section 3.4 and Exhibit D/ARO, Section 12.1)
B. Objective
The objective of a blank analysis results assessment is to determine the existence and magnitude of contamination resulting from laboratory (or field) activities.
C. Criteria
The criteria for evaluation of blanks should apply to any blank associated with the samples (e.g., method blanks, instrument blanks, sulfur cleanup blank, field blanks, etc.). If problems with any blank exist, all associated data must be carefully evaluated to determine whether or not there is an inherent variability in the data or if the problem is an isolated occurrence not affecting other data.
1. Method blank samples must be performed at the specified frequency and sequence. A method blank must be extracted per matrix each time when samples are extracted. The number of samples extracted with each method blank shall not exceed 20 field samples. The method blank must be extracted by the same procedure used to extract samples and must be analyzed on each Gas Chromatograph (GC) system under the same conditions used to analyze associated samples.
2. The method blank, like any other sample in the SDG, must meet the technical acceptance criteria for sample analysis.
3. An acceptable instrument blank must be analyzed at the beginning and ending of an analytical sequence in which samples are analyzed, immediately prior to the analysis of the Aroclor 1016/1260 CS3 used as the CCV.
4. A sulfur cleanup blank must be analyzed whenever part of a set of the extracted samples requires sulfur cleanup. If the entire set of samples associated with a method blank requires sulfur cleanup, the method blank also serves the purpose of a sulfur cleanup blank and a separate sulfur cleanup blank is not required.
5. The concentration of a target analyte in any blanks must not exceed its CRQL.
D. Evaluation
1. Verify that method blanks are extracted at the specified frequency and analyzed at the required sequence. The Method Blank Summary (Form 4-OR) may be used to identify the samples associated with each method blank.
2. Verify that instrument blanks are analyzed at the specified frequency and sequence.
3. Verify that the sulfur cleanup blank is analyzed when part of a set of samples extracted together requires sulfur cleanup. The Method Blank Summary (Form 4-OR) may be used to identify the samples associated with the sulfur cleanup blank.
4. Data concerning the field blanks are not evaluated as part of the CCS process. Evaluations on field or trip blanks should be similar to the method blanks.
5. Review the results of all associated blanks on the forms and raw data (chromatograms and quantitation reports) to evaluate the presence of target analytes in the blanks.
NOTE: For data obtained from the CLP, the preceding criteria are evaluated as part of the CCS process. Information regarding the noncompliant blank can be obtained from the NFG reports and may be used as part of the evaluation process.
Organic Data Review Aroclors
January 2017 219
E. Action
1. If the appropriate blanks are not extracted at the correct frequency and/or analyzed at the correct sequence, use professional judgment to determine if the associated sample data should be qualified. Obtain additional information from the laboratory, if necessary. Record the situation in the Data Review Narrative and note it for EPA Regional CLP COR action.
2. Action regarding unsuitable blank results depends on the circumstances and origin of the blank. Verify that data qualification decisions based on field quality control (QC) are supported by the project Quality Assurance Project Plan (QAPP) or EPA Regional Standard Operating Procedure (SOP). At a minimum, contamination found in field blanks should be documented in the Data Review Narrative. In instances where more than one blank is associated with a given sample, qualification should be based upon a comparison with the associated blank having the highest concentration of a contaminant. Do not correct the results by subtracting any blank value.
3. For any blank (including method blank), if a target analyte is detected, but it is not detected in the sample, non-detects should not be qualified.
4. For any method blank reported with results < CRQLs, report sample results that are < CRQLs at the CRQLs and qualify as non-detect (U). For any method blank reported with results that are < CRQLs, use professional judgment to qualify sample results that are ≥ CRQLs. Positive results in samples, especially those near but above the CRQL, may be biased high by low level contamination in the method blank, and should be considered as estimated (J+).
5. For any method blank reported with results ≥ CRQLs, report sample results that are < CRQLs at the CRQLs and qualify as non-detect (U). For any method blank reported with results ≥ CRQLs, report sample results that are ≥ CRQLs but < Blank Results at sample results and qualify as non-detect (U) or as unusable (R). Use professional judgment to qualify sample results ≥ CRQLs and ≥ Blank Results.
6. For Sulfur cleanup blanks, instrument blanks, and field blanks, sample result qualifications listed in Table 75 should apply if supported by the project QAPP.
7. If gross contamination exists with blank results that are > ICAL CS5 concentrations, qualify detects as unusable (R). If the contamination is suspected of having an effect on the sample results, note it for EPA Regional CLP COR action.
8. There may be instances where little or no contamination is present in the associated blanks, but qualification of the sample is deemed necessary. If it is determined that the contamination is from a source other than the sample, the data should be qualified or, in the case of field QC, should at least be documented in the Data Review Narrative. Contamination introduced through dilution water is one example. Although it is not always possible to determine, instances of this occurring can be detected when contaminants are found in the diluted sample result, but are absent in the undiluted sample.

Organic Data Review Aroclors
January 2017 220
Table 75. Blank Actions for Aroclor Analysis
Blank Type Blank Result Sample Result Action
Method, Sulfur cleanup, Instrument, Field
Detects Non-detect No qualification
< CRQL < CRQL Report at CRQL and qualify
as non-detect (U)
≥ CRQL Use professional judgment
≥ CRQL
< CRQL Report at CRQL and qualify as non-detect (U)
≥ CRQL but < Blank Result Report at sample result and qualify as non-detect (U) or as unusable (R)
≥ CRQL and ≥ Blank Result Use professional judgment
Gross contamination Detect Report at sample result and
qualify as unusable (R)

Organic Data Review Aroclors
January 2017 221
V. Surrogate
A. Review Items
Form 2C-OR, Form 8B-OR, chromatograms, and data system printouts. (SOW SOM02.4 – Exhibit B, Section 3.4 and Exhibit D/ARO, Sections 7.2.2.4 and 11.2.5)
B. Objective
The objective is to evaluate surrogate percent recovery (%R) to ensure that the analytical method is efficient.
C. Criteria
1. Surrogate spiking solution containing two surrogates, TCX and DCB, is added to all samples, including Matrix Spike (MS)/Matrix Spike Duplicates (MSDs), Laboratory Control Samples (LCSs), and blanks to measure the surrogate recovery. The surrogates are also added to all the standards to monitor RTs.
2. The RTs of the surrogates in each CCV CS3 standard, all samples (including MS/MSD and LCS), and all blanks must be within the calculated RT windows. TCX must be within ±0.05 minutes, and DCB must be within ±0.10 minutes of the RT����s determined from the ICAL.
3. The %R for the surrogates TCX and DCB in all samples, including MS/MSDs, LCSs, and all blanks, must be calculated accordingly.
4. The %R for each surrogate must be in the inclusive range of 30-150% for all samples, including MS/MSDs, LCSs, and all blanks.
D. Evaluation
1. Check the raw data (e.g., chromatograms and data system printouts) to verify that the surrogates are added at the specified concentrations to all samples and blanks.
2. Check the raw data (e.g., chromatograms and data system printouts) to verify that the surrogate RTs on Form 8B-OR are within the RT windows.
3. Check the raw data (e.g., chromatograms and data system printouts) to verify that the surrogate %R for each sample and blank is on Form 2C-OR.
4. Check for any calculation or transcription errors. Verify that the surrogate recoveries are calculated correctly using the equation in the method.
5. Whenever there are two or more analyses for a particular sample, use professional judgment to determine which analyses are the most accurate data to report. Considerations include, but are not limited to:
a. Surrogate recovery (marginal versus gross deviation).
b. Technical holding times.
c. Comparison of the results of the target compounds reported in each sample analysis.
d. Other QC information, such as surrogate recoveries and/or RTs in blanks and standards.
NOTE: For data obtained from the CLP, the preceding criteria are evaluated as part of the CCS process. Information regarding the noncompliant surrogate recovery can be obtained from the NFG reports and may be used as part of the evaluation process.
E. Action
1. If surrogates are not added to any sample or blank, or surrogate concentration is incorrect in the sample or blank, use professional judgment to qualify detects and non-detects. Contact the EPA Regional CLP COR to arrange for reanalysis, if possible.

Organic Data Review Aroclors
January 2017 222
2. If surrogate RTs in CCV CS3 standards, samples, and blanks are outside of the RT windows, use professional judgment to qualify detects and non-detects.
3. If surrogate RTs are within RT windows, detects and non-detects should not be qualified.
4. If errors are detected in the calculations of the %R, perform a more comprehensive recalculation. It may be necessary to have the laboratory resubmit the data after making corrections.
5. If the %R for any surrogate is outside the acceptance limits, consider the existence of coelution and interference in the raw data. Use professional judgment to qualify data, as surrogate recovery problems may not directly apply to target analytes.
6. If Aroclor 1262 or 1268 is detected in a sample, the %R of the DCB surrogate is advisory for both column analyses of the specific sample. However, the %R for TCX must meet the acceptance criteria.
7. If the %R for any surrogate in undiluted sample is < 10%, qualify detects as estimated low (J-) and non-detects as unusable (R).
8. If the %R for any surrogate in diluted sample is < 10%, use professional judgment to qualify detects and non-detects.
9. If the %R for any surrogate is ≥ 10%, and < 30%, qualify detects as estimated low (J-) and non-detects as estimated (UJ).
10. If the %R for both surrogates are ≥ 30% and ≤ 150%, detects and non-detects should not be qualified.
11. If the %R for any surrogate is > 150% but ≤ 200%, qualify detects as estimated high (J+). Non-detects should not be qualified.
12. If the %R for any surrogate is > 200%, qualify detects as estimated high (J+). Use professional judgment to qualify non-detects.
13. In the special case of a blank analysis with surrogate %R outside the acceptance limits, give special consideration to qualify the associated sample data. The basic concern is whether the blank problems represent an isolated problem with the blank alone, or whether there is a fundamental problem with the analytical process.
For example, if one or more samples in the same extraction batch have surrogate %R within the acceptance limits, use professional judgment to determine if the blank problem is an isolated occurrence. Note analytical problems for EPA Regional CLP COR action even if this judgment allows some use of the affected data.

Organic Data Review Aroclors
January 2017 223
Table 76. Surrogate Actions for Aroclor Analysis
Criteria Action*
Detect Non-detect
RT out of RT window Use professional judgment Use professional judgment
RT within RT window No qualification No qualification
%R < 10% (undiluted sample) J- R
%R < 10% (diluted sample) Use professional judgment**
Use professional judgment**
10% ≤ %R < 30% J- UJ
30% ≤ %R ≤ 150% No qualification No qualification
150% < %R ≤ 200% J+ No qualification
%R > 200% J+ Use professional judgment**
* %R of the DCB surrogate is advisory for both column analyses of samples with detected Aroclor1262 or 1268.
** Use professional judgment in qualifying data, as surrogate recovery problems may not directly apply to target analytes.
Organic Data Review Aroclors
January 2017 224
VI. Matrix Spike/Matrix Spike Duplicate
A. Review Items
SDG Cover Page, Form 3A-OR, chromatograms, and quantitation reports. (SOW SOM02.4 – Exhibit B, Section 3.4 and Exhibit D/ARO, Sections 7.2.2.5 and 12.2)
B. Objective
The objective of MS/MSD analysis is to evaluate the effect of each sample matrix on the sample preparation procedures and the measurement methodology.
C. Criteria
1. MS/MSD samples shall be prepared and analyzed at the specified frequency. One pair of MS/MSD samples should be analyzed per matrix or per SDG.
2. Samples identified as field blanks or Performance Evaluation (PE) samples cannot be used for MS/MSD sample analysis.
3. The MS/MSD %R and the Relative Percent Difference (RPD) between MS and MSD results should be calculated according to the method.
4. The MS/MSD %R and RPD should be within the acceptance limits in Table 77.
D. Evaluation
1. Verify that requested MS/MSD samples were analyzed at the required frequency.
2. Verify that a field blank or PE sample was not used for MS/MSD analysis.
3. Verify that the recalculated MS/MSD %R and RPD values agree with the laboratory reported values on Form 3A-OR.
4. Inspect the MS/MSD %R and RPD on Form 3A-OR and verify that they are within the limits listed in Table 77.
NOTE: For data obtained from the CLP, the preceding criteria, including the required MS/MSD spiking analytes and spiking levels in Exhibit D – Aroclors Analysis, Table 5, of the SOW, are evaluated as part of the CCS process. Information regarding the noncompliant MS/MSD %R or RPD can be obtained from the NFG reports and may be used as part of the evaluation process.
E. Action
1. If MS/MSD samples were not analyzed at the specified frequency, or were spiked with the wrong analytes or at the wrong concentrations, use professional judgment to determine the impact on sample data, if any. Obtain additional information from the laboratory, if necessary. Record the situation in the Data Review Narrative and note it for EPA Regional CLP COR action. It is not likely that data qualification will be warranted if the frequency requirements are not met. Carefully consider all factors, known and unknown, about method performance on the matrix at hand, in lieu of MS/MSD data.
2. If a field blank or PE sample was used for the MS/MSD analysis, note this for EPA Regional CLP COR action. All of the other QC data must then be carefully checked. Use professional judgment when evaluating the data.
3. If errors are detected in the calculations of the MS/MSD %R or RPD, perform a more comprehensive recalculation.
4. If the MS/MSD %R or RPD is outside the acceptance limits in Table 77, qualify the detects and non-detects in the original sample to include the consideration of the existence of interference in the raw data. Considerations include, but are not limited to:

Organic Data Review Aroclors
January 2017 225
a. If the MS/MSD %R is < 20%, qualify detects as estimated (J) and non-detects as unusable (R).
b. If the MS/MSD %R is ≥ 20% and < lower acceptance limit, qualify detects as estimated (J) and non-detects as estimated (UJ).
c. If the MS/MSD %R or RPD is ≥ lower acceptance limit and ≤ upper acceptance limit, detects and non-detects should not be qualified.
d. If the MS/MSD %R or RPD is > upper acceptance limit, qualify detects as estimated (J). Non-detects should not be qualified.
Table 77. MS/MSD %R and RPD Limits for Aroclor Analysis
Analyte %R for Water and Soil Sample
RPD for Water and Soil Sample
Aroclor 1016 29 - 135 0 - 15
Aroclor 1260 29 - 135 0 - 20
Table 78. MS/MSD Actions for Aroclor Analysis
Criteria Action
Detect Non-detect
%R < 20% J R
20% ≤ %R < Lower Acceptance Limit J UJ
Lower Acceptance Limit ≤ %R or RPD ≤ Upper Acceptance Limit No qualification No qualification
%R or RPD > Upper Acceptance Limit J No qualification

Organic Data Review Aroclors
January 2017 226
VII. Laboratory Control Sample
A. Review Items
Form 3B-OR, chromatograms, and data system printouts. (SOW SOM02.4 – Exhibit B, Section 3.4 and Exhibit D/ARO, Sections 7.2.2.6 and 12.3)
B. Objective
The objective is to evaluate the accuracy of the analytical method and laboratory performance.
C. Criteria
1. An LCS must be prepared and analyzed at the specified frequency. The LCS should be extractedand analyzed per matrix or per SDG. The LCS should be extracted using the same procedures asthe samples and method blank.
2. The requirements below apply independently to each GC column and to all instruments used forthese analyses. Quantitation must be performed on each GC column.
3. The LCS must contain the target analytes in Table 79 and the surrogates at the specifiedconcentrations in the method (Table 5 in the SOW).
4. The %R for each spiked analyte in the LCS must be calculated according to the method.
5. The %R for each spiked analyte must be within the acceptance limits in Table 79.
Table 79. LCS %R Limits for Aroclor Analysis
Analyte %Recovery for Water and Soil Sample
Aroclor 1016 50 - 150
Aroclor 1260 50 - 150
6. All samples prepared and analyzed with an LCS that does not meet the technical acceptance criteriain the method will require re-extraction and reanalysis.
D. Evaluation
1. Verify that the LCS is prepared and analyzed at the specified frequency.
2. Check the raw data (e.g., chromatograms and data system printouts) to verify that the LCS is spikedwith the specified target analytes at the method specified concentrations (Table 5 in the SOW).
3. Check the raw data (e.g., chromatograms and data system printouts) to verify that the %R of eachtarget analyte in the LCS is calculated correctly and that the recalculated %R values agree with thatreported on Form 3B-OR.
4. Verify that the %R of each target analyte in the LCS is within the specified acceptance limits.
NOTE: For data obtained from the CLP, the preceding criteria are evaluated as part of the CCS process. Information regarding the noncompliant LCS %R can be obtained from the NFG reports and may be used as part of the evaluation process.
E. Action
1. If the LCS is not performed at the specified frequency, use professional judgment to qualify detectsand non-detects in the associated samples.
NOTE: If an LCS sample is not analyzed at the specified frequency, use professional judgment to determine the impact on sample data. Obtain additional information from the laboratory, if necessary. Record the situation in the Data Review Narrative and note it for EPA Regional CLP COR action. It is not likely that data qualification will be warranted if the frequency
Organic Data Review Aroclors
January 2017 227
requirement is not met. Carefully consider all factors, known and unknown, about method performance, in lieu of LCS data.
2. If the LCS is not performed at the specified concentration, use professional judgment to qualifydetects and non-detects in the associated samples.
3. If errors are detected in the calculations of the LCS %R, perform a more comprehensiverecalculation.
4. If the LCS %R criteria are not met, qualify the specific target analyte in the associated samples.
a. If the LCS %R is < lower acceptance limit, qualify detects as estimated low (J-) andnon-detects as unusable (R).
b. If the LCS %R is ≥ lower acceptance limit and ≤ upper acceptance limit, detects andnon-detects should not be qualified.
c. If the LCS %R is > upper acceptance limit, qualify detects as estimated high (J+). Non-detectsshould not be qualified.
d. Use professional judgment to qualify analytes other than those included in the LCS.
e. Take into account the analyte class, analyte recovery efficiency, analytical problems associatedwith each analyte, and comparability in the performance of the LCS analyte to the non-LCSanalyte.
Table 80. LCS Actions for Aroclor Analysis
Criteria Action
Detect Non-detect
LCS not performed at the specified frequency or concentration
Use professional judgment
Use professional judgment
%R < Lower Acceptance Limit J- R
Lower Acceptance Limit ≤ %R ≤ Upper Acceptance Limit No qualification No qualification
%R > Upper Acceptance Limit J+ No qualification
Organic Data Review Aroclors
January 2017 228
VIII. Gel Permeation Chromatography Performance Check
A. Review Items
Form 9B-OR, two ultraviolet (UV) traces, Gel Permeation Chromatography (GPC) cleanup blank quantitation reports, and chromatograms. (SOW SOM02.4 – Exhibit B, Section 3.4 and Exhibit D/ARO, Section 10.3.1)
B. Objective
The objective is to evaluate GPC cleanup efficiency.
C. Criteria
1. GPC is used for the cleanup of all non-aqueous sample extracts and for aqueous sample extracts that contain high molecular weight components that interfere with the analysis of the target analytes.
2. Each GPC system must be calibrated prior to processing samples for GPC cleanup, when the GPC calibration verification solution fails to meet criteria, when the column is changed, when channeling occurs, and once every 7 days when in use.
3. The GPC calibration is acceptable if the two UV traces meet the following requirements:
a. Peaks must be observed and symmetrical for all compounds in the calibration solution.
b. Corn oil and the phthalate peaks exhibit > 85% resolution.
c. Phthalate and methoxychlor peaks exhibit > 85% resolution.
d. Methoxychlor and perylene peaks exhibit > 85% resolution.
e. Perylene and sulfur peaks must not be saturated and should exhibit > 90% baseline resolution.
f. The RT shift is < 5% between UV traces for bis(2-ethylhexyl) phthalate and perylene.
4. A GPC blank must be analyzed after each GPC calibration. The concentration for any target analyte in the GPC blank must not exceed the CRQL.
5. GPC calibration verification must be performed at least once every 7 days (immediately following the GPC calibration) whenever samples (including MS/MSDs, LCSs, and blanks) are cleaned up using the GPC.
6. The GPC calibration verification solution must contain Aroclor 1016 and Aroclor 1260 at the specified concentrations in the method (0.4 µg/mL).
7. The %R for each target analyte in the GPC calibration verification must be calculated according to the method.
8. The %R for each target analyte in the GPC calibration verification must be in the inclusive range of 80-120%.
D. Evaluation
1. Verify that the GPC calibration is performed at the specified frequency.
2. Verify that there are two UV traces present and that the RT shift for bis(2-ethylhexyl) phthalate and perylene is < 5%.
3. Verify that the analytes in the GPC calibration standard are present and the peaks are symmetrical in both UV traces meeting the minimum resolution requirements.
4. Verify that no target analyte in the GPC blank exceeds the CRQL.
5. Verify that the GPC calibration verification is performed at the specified frequency and concentrations.
Organic Data Review Aroclors
January 2017 229
6. Verify that the %R for target analytes are calculated correctly and the %R values agree with that on Form 9B-OR.
7. Verify that the %R for target analytes is within the acceptance limits.
NOTE: For data obtained from the CLP, the preceding criteria are evaluated as part of the CCS process. Information regarding the noncompliant %R in the GPC calibration verification can be obtained from the NFG reports and may be used as part of the evaluation process.
E. Action
1. If GPC calibration frequency, UV traces, and GPC blank criteria are not met, examine the raw data for the presence of high molecular weight contaminants, examine subsequent sample data for unusual peaks, and use professional judgment to qualify the data. If the laboratory chooses to analyze samples under unacceptable GPC criteria, notify the EPA Regional CLP COR.
a. If the RT shift of bis(2-ethylhexyl) phthalate and perylene is > 5%, the GPC unit may be in an unstable temperature environment and subject to erratic performance. The expected result may be an unknown bias in the data. Contact the EPA Regional CLP COR to arrange for sample reanalysis.
2. If GPC calibration verification is not performed at the specified frequency, use professional judgment to qualify detects and non-detects.
3. If GPC calibration verification is not performed at the specified concentrations, use professional judgment to qualify detects and non-detects.
4. If errors are detected in the calculations of the %R in the GPC calibration verification, perform a more comprehensive recalculation.
5. If GPC calibration verification criteria are not met, examine the raw data and qualify data as follows:
a. If the %R is < 10% for any target analytes and surrogates in the GPC calibration verification, use professional judgment to qualify detects. Qualify non-detects as unusable (R).
b. If the %R is ≥ 10% and < 80% for any target analytes and surrogates in the GPC calibration verification, qualify detects as estimated (J) and non-detects as estimated (UJ).
c. If the %R is ≥ 80% and ≤ 120% for all target analytes and surrogates in the GPC calibration verification, detects and non-detects should not be qualified.
d. If the %R is > 120% for any target analytes and surrogates in the GPC calibration verification, use professional judgment to qualify detects. Non-detects should not be qualified.
6. Annotate the potential effects on the sample data resulting from the GPC cleanup analyses not yielding acceptable results in the Data Review Narrative.

Organic Data Review Aroclors
January 2017 230
Table 81. GPC Performance Check Actions for Aroclor Analysis
Criteria Action
Detect Non-detect
GPC Performance Check not performed at the specified frequency or concentration
Use professional judgment Use professional judgment
%R < 10% (target analytes) Use professional judgment R
10% ≤ %R < 80% (target analytes) J UJ
80% ≤ %R ≤ 120% (target analytes) No qualification No qualification
%R > 120% (target analytes) Use professional judgment No qualification

Organic Data Review Aroclors
January 2017 231
IX. Target Analyte Identification
A. Review Items
Form 1A-OR, Form 10B-OR, chromatograms, and data system printouts. (SOW SOM02.4 – Exhibit B, Section 3.4 and Exhibit D/ARO, Section 11.1.1)
B. Objective
The objective is to provide acceptable Gas Chromatograph/Electron Capture Detector (GC/ECD) qualitative analysis to minimize the number of erroneous analyte identifications.
C. Criteria
1. The RTs of both of the surrogates and reported target analytes with five major peaks (three major peaks for Aroclor 1221) in each sample must be within the calculated RT windows on both columns. TCX must be within ±0.05 minutes of the RT���� determined from the ICAL, and DCB must be within ±0.10 minutes of the RT���� determined from the ICAL.
2. For detected target analytes, the %D between the concentrations on two GC columns must be calculated according to the method. The %D for any detected target analyte should be < 25.0% to have high confidence in the identification.
3. When no analytes are identified in a sample, the chromatograms from the analyses of the sample extract must use the same scaling factor as was used for the low-point standard of the ICAL associated with those analyses.
4. Chromatograms must display the largest peak of any Aroclors detected in the sample at less than full scale.
5. If an extract must be diluted, chromatograms must display the five chosen major peaks (three major peaks for Aroclor 1221) for an analyte between 25-100% of full scale.
6. If a chromatogram is replotted electronically to meet these requirements, the scaling factor used must be displayed on the chromatogram, and both the initial chromatogram and the replotted chromatogram must be submitted in the data package.
D. Evaluation
1. Review Form 1A-OR, the associated raw data (chromatograms and data system printouts), and Form 10B-OR.
a. Verify that the reported target analytes as detects are identified correctly with five major peaks (three major peaks for Aroclor 1221) by comparing the sample chromatograms to the tabulated results and verifying peak measurements and RTs.
b. Verify the non-detects by a review of the sample chromatograms.
c. Check the associated blank data for potential interferences (to evaluate sample data for false positives) and check the calibration data for adequate RT windows (to evaluate sample data for false positives and false negatives).
2. Verify that the %D results were calculated correctly and that the recalculated %D agrees with that reported on Form 10B-OR.
3. Verify that the %D for any target analyte is < 25.0%. If the %D is > 25% for any target analyte, evaluate the impact of the presence of an interfering compound and whether the interference precludes confirmation of the target analyte. Also, evaluate the possibility of poor precision or non-homogeneity as causes for the difference.

Organic Data Review Aroclors
January 2017 232
E. Action
1. If the qualitative criteria for both columns are not met, all target analytes that are reported as detects should be qualified as non-detect (U). Use professional judgment to assign an appropriate quantitation limit using the following guidance:
a. If the detected target analyte peak is sufficiently outside the RT window determined from the associated ICAL, the reported value may be a false positive and should be replaced with the sample CRQL value.
b. If the detected target analyte peak poses an interference with the potential detection of another target peak, the reported value should be considered and qualified as unusable (R).
2. If five major peaks (three major peaks for Aroclor 1221) are identified in both GC column analyses that fall within the appropriate RT windows, but the analyte is reported as a non-detect, the analyte may be a false negative. Use professional judgment to decide if the analyte should be included and reported as detect. Annotate all conclusions made regarding target analyte identification in the Data Review Narrative.
3. If the Aroclor peak RT windows determined from the calibration overlap with single component target analytes or chromatographic interferences, use professional judgment to qualify the data.
4. If an Aroclor exhibits a marginal pattern-matching quality, use professional judgment to determine if the differences are due to environmental “weathering” (i.e., degradation of the earlier eluting peaks relative to the later eluting peaks). If the presence of an Aroclor is strongly suggested, report results as presumptively present with estimated concentration (NJ).
5. If errors are detected in the calculations of the %D for any target analyte, perform a more comprehensive recalculation.
6. If an interfering compound is indicated, consider the potential for co-elution and use professional judgment to determine how best to report. It is recommended to either report the analyte as positive at the lower value, qualified as tentative (N), or as non-detect (U) at the CRQL.
Organic Data Review Aroclors
January 2017 233
X. Gas Chromatograph/Mass Spectrometer Confirmation
A. Review Items
Form 1A-OR, Form 10B-OR, chromatograms, and data system printouts. (SOW SOM02.4 – Exhibit B, Section 3.4 and Exhibit D/ARO, Section 11.1.2)
B. Objective
The objective is to ensure the accuracy of the positive identification of a target analyte. In the case of Aroclors, the objective is to obtain sufficient information to confirm the presence of Polychlorinated Biphenyls (PCBs) in a sample, not necessarily to confirm which Aroclor is present. This should be accomplished by pattern matching on each of two GC columns in the GC/ECD analysis.
C. Criteria
1. Gas Chromatography/Mass Spectrometry (GC/MS) confirmation is required when a positively identified target analyte has on-column concentration meeting the specified criterion on both GC columns. GC/MS shall be performed for at least one peak concentration ≥ 10 ng/µL.
2. GC/MS confirmation may be accomplished by one of three general means:
a. Examination of the semivolatile GC/MS library search results [i.e., Tentatively Identified Compound (TIC) data];
b. A second analysis of the semivolatile extract; or
c. Analysis of the Aroclor extract, following any solvent exchange and concentration steps that may be necessary.
D. Evaluation
1. Review Form 1A-OR, the associated raw data (chromatograms and data system printouts), and Form 10B-OR.
2. Check the quantitation report to verify that GC/MS confirmation is required by ensuring that the on-column concentration criteria are met (criteria indicated in Section C.1).
3. Verify that GC/MS confirmation is completed as specified in the method.
NOTE: For data obtained from the CLP, the preceding criteria are evaluated as part of the CCS process. Information regarding noncompliant GC/MS can be obtained from the CCS report and may be used as part of the evaluation process.
E. Action
1. If an analyte was confirmed by GC/MS, qualify as confirmed (C).
2. If a sufficient quantity of an analyte was indicated and GC/MS confirmation was attempted but was not confirmed, qualify with an X or as non-detect (U). Explain in the Data Review Narrative that the analyte should be considered a non-detect because it could not be confirmed.
Table 82. GC/MS Confirmation Actions
Criteria Action for Detects
Analyte confirmed by GC/MS C
Analyte indicated but not confirmed by GC/MS X or U
Organic Data Review Aroclors
January 2017 234
XI. Target Analyte Quantitation and Reported Contract Required Quantitation Limit
A. Review Items
Form 1A-OR, sample preparation sheets, SDG Narrative, quantitation reports, and chromatograms. (SOW SOM02.4 – Exhibit B, Section 3.4 and Exhibit D/ARO, Sections 11.2.2 and 11.2.3)
B. Objective
The objective is to ensure that the reported results and CRQLs for target analytes are accurate.
C. Criteria
1. Target analyte results and sample-specific CRQLs must be calculated according to the correct equations.
2. Target analyte CF must be calculated using the correct associated ICAL. Target analyte result must be calculated using the CF���� from the associated ICAL.
D. Evaluation
1. Verify that the results for all positively identified analytes are calculated and reported by the laboratory.
2. Verify that the CRQLs are calculated for the non-detects and reported accordingly.
3. Verify that the correct CF���� is used to calculate the reported results.
4. Verify that the same CF���� is used consistently for all sample result calculations.
5. Verify that the sample-specific CRQLs have been calculated and adjusted to reflect Percent Solids (%Solids), sample mass/volume, and any applicable dilutions.
a. For soil/sediment samples that are high in moisture (i.e., < 30% solids), evaluation of the presence of each analyte depends on the anticipated interaction between the analyte and the total matrix, as well as how the sample was processed.
b. If the phases of a sample were separated and processed separately, the results may be mathematically recombined or reported separately. No particular qualification on the grounds of matrix distribution is warranted.
c. If a soil/sediment sample was processed by eliminating most of the water, analytes that are highly water soluble under ambient conditions may be severely impacted such that their presence cannot be completely evaluated.
6. Verify that recalculated results and CRQLs agree with that reported by the laboratory.
NOTE: For data obtained from the CLP, the preceding criteria are evaluated as part of the CCS process. Information regarding the noncompliant results or CRQLs can be obtained from the CCS report and may be used as part of the evaluation process.
E. Action
1. If any discrepancies are found, contact the EPA Regional CLP COR, who may contact the laboratory to obtain additional information that could resolve any differences. If a discrepancy remains unresolved, use professional judgment to decide which value is the most accurate and to determine whether that qualification of data is warranted. Annotate the reasons for any data qualification in the Data Review Narrative.
2. If errors are detected in results and CRQL calculations, perform a more comprehensive recalculation.
3. If the %Solids for a soil/sediment sample is < 10.0%, use professional judgment to qualify detects and non-detects.

Organic Data Review Aroclors
January 2017 235
4. If the %Solids for a soil/sediment sample is ≥ 10% and < 30.0%, use professional judgment to qualify detects and non-detects.
5. If the %Solids for a soil/sediment sample is > 30.0%, detects and non-detects should not be qualified.
6. If sample results are < CRQLs and ≥ MDLs, qualify as estimated (J).
7. Note numerous or significant failures to accurately quantify the target analytes, or to properly evaluate and adjust CRQLs, for EPA Regional CLP COR action.
Table 83. Percent Solids Actions for Aroclor Analysis for Non-Aqueous Samples
Criteria Action
Detect Non-detect
%Solids < 10.0% Use professional judgment Use professional judgment
10.0% < %Solids < 30.0% Use professional judgment Use professional judgment
%Solids > 30.0% No qualification No qualification

Organic Data Review Aroclors
January 2017 236
XII. Performance Evaluation Sample
A. Review Items
Form 1A-OR, TR/COC Record documentation, preparation logs, instrument printouts, and raw data. (SOW SOM02.4 – Exhibit B, Section 3.4 and Exhibit F, Section 4.1)
B. Objective
The objective is to determine the validity of the analytical results based on the recovery of the PE sample(s).
C. Criteria
1. Matrix-specific PE samples shall be analyzed utilizing the same analytical methods and Quality Assurance/Quality Control (QA/QC) procedures as employed for the samples, at a frequency to be determined by each EPA Region for each site. PE samples must be analyzed in an SDG containing field samples for the Case, using the same procedures, reagents, and instrumentation.
D. Evaluation
1. Verify, using Form 1A-OR, preparation logs, and raw data, that the PE samples were analyzed with the field samples and field blanks in the SDG.
2. Verify, using Form 1A-OR, that the PE sample results are within the warning limits (95% confidence interval) and action limits (99% confidence interval).
3. If a significant number (i.e., half or more) of the analytes in the PE samples fall outside of the 95% warning or 99% action criteria, or a number of false positive results are reported, evaluate the overall impact on the data.
E. Action
NOTE: If the PE sample criteria are not met, the laboratory performance and method accuracy are in question. Use professional judgment to determine if the data should be qualified or rejected. The following guidance is suggested for qualifying sample data associated with a PE sample that does not meet the required criteria.
For a PE sample that does not meet the technical criteria, apply the action to all samples in the same preparation batch. If the concentration of any analyte in a PE sample is not comparable to the analyte’s concentration in the field samples or field blanks (i.e., it is much higher or much lower than the concentration in these samples), the action may be applied to only those samples in which the analyte’s concentration is comparable to the PE sample concentration.
1. If the PE sample was not analyzed with the field samples and field blanks, use professional judgment to determine if the associated sample results should be qualified. Obtain additional information from the laboratory, if necessary. If a laboratory fails to analyze the PE sample(s) provided with field samples and field blanks, or if a laboratory consistently fails to generate acceptable PE sample results, record the situation in the Data Review Narrative, and note it for EPA Regional CLP COR action.
2. If the PE sample results are outside the lower warning limits but inside the lower action limits, qualify detects as estimated low (J-) and non-detects as estimated (UJ).
3. If the PE sample results are outside the lower action limits, qualify detects as estimated low (J-) and non-detects as unusable (R).
4. If the PE sample results are within the limits, detects and non-detects should not be qualified.
5. If the PE sample results are outside the upper warning limits but inside the upper action limits, qualify detects as estimated high (J+). Non-detects should not be qualified.

Organic Data Review Aroclors
January 2017 237
6. If the PE sample results are outside the upper action limits, qualify detects as estimated high (J+).Non-detects should not be qualified.
7. Annotate the potential effects on the data due to out-of-control PE sample results in the DataReview Narrative.
Table 84. PE Sample Actions for Aroclor Analysis
Criteria Action
Detect Non-detect PE sample results outside lower warning limits but inside lower action limits J- UJ
PE sample results outside lower action limits J- R PE sample results within limits No qualification No qualification PE sample results outside upper warning limits but inside upper action limits J+ No qualification
PE sample results outside upper action limits J+ No qualification

Organic Data Review Aroclors
January 2017 238
XIII. Regional Quality Assurance and Quality Control
A. Review Items
Form 1A-OR, chromatograms, TR/COC Record documentation, quantitation reports, and other raw data from QA/QC samples. (SOW SOM02.4 – Exhibit B, Sections 2.4 and 3.4)
B. Objective
The objective is to use results from the analysis of EPA Regional QA/QC samples such as field duplicates, blind spikes, and blind blanks to determine the validity of the analytical results.
C. Criteria
Criteria are determined by each EPA Region.
1. The frequency of EPA Regional QA/QC samples should be defined in the project QAPP.
2. Performance criteria for EPA Regional QA/QC samples should also be defined in the project QAPP.
3. The EPA Region may provide the laboratory with PE samples to be analyzed with each SDG. These samples may include blind spikes and/or blind blanks. The laboratory must analyze a PE sample when provided by the EPA Region. Refer to Section IV, above, for blanks criteria. Refer to Section XII, above, for PE samples criteria.
4. The RPD between field duplicates shall fall with the specific limits in the EPA Region’s SOP or project QAPP.
D. Evaluation
1. Evaluation procedures must follow the EPA Region’s SOP for data review.
2. Determine whether the results of EPA Regional QA/QC samples impact all samples in the project or only those directly associated (i.e., in the same SDG, collected on the same day, prepared together, or contained in the same analytical sequence).
3. Calculate the RPD between field duplicates and provide this information in the Data Review Narrative. Also verify that the value falls within the specific limits in the EPA Region’s SOP or project QAPP.
4. Determine whether poor precision is the fault of the laboratory, or a result of sample non-homogeneity in the field. Laboratory observations of sample appearance may become important in these situations.
E. Action
1. Any action must be in accordance with EPA Regional specifications and the criteria for acceptable field duplicate sample results.
2. Note unacceptable results for field duplicate samples for EPA Regional CLP COR action.
3. In general, for EPA Regional QA/QC performance not within QAPP specification, qualify detects as estimated (J) and non-detects as estimated (UJ). The impact on overall data quality should be assessed after consultation with the data user and/or field personnel. Contact the EPA Regional CLP COR if reanalysis of samples is required.

Organic Data Review Aroclors
January 2017 239
XIV. Overall Assessment of Data
A. Review Items
Entire data package, data review results, and (if available) the QAPP and Sampling and Analysis Plan (SAP).
B. Objective
The objective is to provide the overall assessment on data quality and usability.
C. Criteria
1. Review all available materials to assess the overall quality of the data, keeping in mind the additive nature of analytical problems.
2. Reported analyte concentrations must be quantitated according to the appropriate equations, as listed in the method. All sample results must be within the linear calibration ranges per the methods.
D. Evaluation
Examine the raw data to verify that the correct calculation of the sample results was reported by the laboratory. Analysis logs, instrument printouts, etc., should be compared to the reported sample results recorded on the appropriate Organic Data Reporting Forms (Form 1A-OR through Form 10B-OR).
1. Evaluate any technical problems which have not been previously addressed.
2. Examine the raw data for any anomalies (e.g., baseline shift).
3. Verify that the appropriate method is used in sample analysis.
4. Verify that there are no transcription or reduction errors.
5. Verify that target analyte results fall within the calibrated ranges.
6. If appropriate information is available, use professional judgment to assess the usability of the data in order to assist the data user in avoiding inappropriate use of the data. Review all available information, including the QAPP (specifically the acceptance and performance criteria), SAP, and communication with the data user that concerns the intended use and desired quality of these data.
E. Action
1. Use professional judgment to determine if there is any need to qualify data which were not qualified based on the QC criteria previously discussed.
2. Use professional judgment to qualify sample results and non-detects if the MDL exceeds the CRQL.
3. If a sample is not diluted properly when sample results exceed the upper limit of the calibration range, qualify sample results as estimated (J).
4. Write a brief Data Review Narrative to give the user an indication of the limitations of the analytical data.
5. Note any inconsistency of the data with the SDG Narrative for EPA Regional CLP COR action. If sufficient information on the intended use and required quality of the data is available, include an assessment of the usability of the data within the given context. This may be used as part of a formal Data Quality Assessment (DQA).

Organic Data Review Aroclors
January 2017 240
This page is intentionally left blank.

Organic Data Review Appendix A: Glossary
January 2017 A-1
APPENDIX A: GLOSSARY
Analysis Date/Time – The date and military time (24-hour clock) of the injection of the sample, standard, or blank into the Gas Chromatograph/Mass Spectrometer (GC/MS) or GC system.
Aroclor – A trademarked name for a mixture of polychlorinated biphenyls (PCBs) used in a variety of applications including additives in lubricants, heat transfer dielectric fluids, adhesives, etc.
Blank – An analytical sample that has negligible or unmeasurable amounts of a substance of interest. The blank is designed to assess specific sources of contamination. Types of blanks may include calibration blanks, instrument blanks, method blanks, and field blanks. See the individual definitions for types of blanks.
Breakdown – A measure of the decomposition of certain analytes (DDT and Endrin) into by-products.
4-Bromofluorobenzene (BFB) – The compound chosen to establish mass spectrometer instrument performance for volatile organic analyses.
Calibration Factor (CF) – A measure of the Gas Chromatographic response of a target analyte to the mass injected.
Case – A finite, usually predetermined number of samples collected over a given time period from a particular site. Case Numbers are assigned by the Sample Management Office (SMO). A Case consists of one or more Sample Delivery Groups (SDGs).
Contamination – A component of a sample or an extract that is not representative of the environmental source of the sample. Contamination may stem from other samples, sampling equipment, while in transit, from laboratory reagents, laboratory environment, or analytical instruments.
Continuing Calibration Verification (CCV) – A single parameter or multi-parameter standard solution prepared by the analyst and used to verify the stability of the instrument calibration with time, and the instrument performance during the analysis of samples. The CCV can be one of the calibration standards.
Contract Compliance Screening (CCS) – A screening of electronic and hardcopy data deliverables for completeness and compliance with the contract. This screening is performed under the U.S. Environmental Protection Agency (EPA) direction by the Sample Management Office (SMO) Contractor.
Contract Laboratory Program (CLP) – Supports the EPA’s Superfund effort by providing a range of state-of-the-art chemical analytical services of known and documented quality. This program is directed by the Analytical Services Branch (ASB) of the Office of Superfund Remediation and Technology Innovation (OSRTI) of the EPA.
Contractual Holding Time – The maximum amount of time that the Contract Laboratory Program (CLP) laboratory may hold the samples from the sample receipt date until analysis and still be in compliance with the terms of the contract, as specified in the United States Environmental Protection Agency (EPA) Contract Laboratory Program (CLP) Statement of Work (SOW) for Organic Superfund Methods (Multi-Media, Multi-Concentration) SOM02.4. These times are the same or less than technical holding times to allow for sample packaging and shipping.
Decafluorotriphenylphosphine (DFTPP) – Compound chosen to establish mass spectrometer instrument performance check for semivolatile analysis.
Deuterated Monitoring Compound (DMC) – Compound added to every volatile and semivolatile calibration standard, blank, and sample used to evaluate the efficiency of the extraction/purge-and-trap procedures, and the performance of the Gas Chromatograph/Mass Spectrometer (GC/MS) systems. DMCs are isotopically labeled (deuterated) analogs of native target analytes. DMCs are not expected to be naturally detected in the environmental media.
Organic Data Review Appendix A: Glossary
January 2017 A-2
EPA Regional CLP Contracting Officer’s Representative (EPA Regional CLP COR) – The EPA official who monitors assigned CLP laboratories (either inside or outside of the Regional CLP COR’s respective Region), responds to and identifies problems in laboratory operations, and participants in on-site laboratory audits.
Field Blank – A blank used to provide information about contaminants that may be introduced during sample collection sample shipment, and in the laboratory. A field blank includes trip blanks, rinsate blanks, bottle blanks, equipment blanks, preservative blanks, decontamination blanks, etc.
Field Sample – A portion of material to be analyzed that is contained in single or multiple containers and identified by a unique EPA sample number.
14-Hour Time Period – For pesticide and Aroclor analyses, the 14-hour time period begins at the injection of the beginning of the sequence for an opening Continuing Calibration Verification (CCV) (instrument blank) and must end with the injection of the closing sequence of the closing CCV [Individual standard A, B, or C, or Performance Evaluation Mixture (PEM)]. The time period ends after 14 hours have elapsed according to the system clock.
Gas Chromatograph (GC) – The instrument used to separate analytes on a stationary phase within a chromatographic column. The analytes are volatized directly from the sample (VOA water and low-soil), volatized from the sample extract (VOA medium soil), or injected as extracts (SVOA, PEST, and ARO). In VOA and SVOA analysis, the analytes are detected by a Mass Spectrometer (MS). In Pesticide and Aroclor analysis, the analytes are detected by an Electron Capture Detector (ECD).
Gas Chromatograph/Electron Capture Detector (GC/ECD) – A Gas Chromatograph (GC) equipped with an Electron Capture Detector (ECD). This is one of the most sensitive gas chromatographic detectors or halon-containing compounds such as organochlorine pesticides and polychlorinated biphenyls.
Initial Calibration – Analysis of analytical standards for a series of different concentrations; used to define the quantitative response, linearity, and dynamic range of the instrument to target analytes.
Initial Calibration Verification (ICV) – Analysis of the calibration standard from an alternate source or a different lot than that used for the initial calibration (ICAL) standards at the mid-point CS3 concentration of the ICAL standards to ensure the instrument is calibrated accurately.
Instrument Blank – A blank designed to determine the level of contamination either associated with the analytical instruments, or resulting from carryover.
Internal Standards – Compounds added to every volatile and semivolatile standard, blank, sample (for volatiles), or sample extract aliquot (for semivolatiles), at a known concentration, prior to analysis. Internal standards are used to monitor instrument performance and quantitation of target compounds.
Laboratory Control Sample (LCS) – A reference matrix spiked with target analytes at known concentrations. LCSs are analyzed using the same sample preparation, reagents, and analytical methods employed for the EPA samples received.
m/z – Mass-to-charge ratio; synonymous with “m/e”.
Matrix – The predominant material of which the sample to be analyzed is composed. For the purpose of this document, the sample matrix is either aqueous or non-aqueous.
Matrix Effect – In general, the effect of a particular matrix on the constituents under study. Matrix effects may affect purging/extraction efficiencies, and consequently affect Deuterated Monitoring Compound (DMC)/surrogate recoveries and cause interference for the qualitative and quantitative analyses of the target analytes.
Matrix Spike (MS) – Aliquot of the sample (aqueous/water or soil/sediment) fortified (spiked) with known quantities of specific compounds and subjected to the entire analytical procedure to indicate the appropriateness of the method for the matrix by measuring recovery.

Organic Data Review Appendix A: Glossary
January 2017 A-3
Matrix Spike Duplicate (MSD) – A second aliquot of the same sample as the Matrix Spike (MS) (above) that is spiked in order to determine the precision of the method.
Method Blank – A clean reference matrix sample (i.e., reagent water or purified sodium sulfate) spiked with internal standards, and surrogate standards [or Deuterated Monitoring Compounds (DMCs) for volatile and semivolatile], that is carried throughout the entire analytical procedure. The method blank is used to define the level of contamination associated with the processing and analysis of samples.
Percent Difference (%D) – The difference between two values calculated as a percentage of one of the values.
Percent Relative Standard Deviation (%RSD) – The Percent Relative Standard Deviation is calculated from the standard deviation and mean measurement of either Relative Response Factors (RRFs) or Calibration Factors (CFs) from initial calibration standards. Percent Relative Standard Deviation indicates the precision of a set of measurements.
Performance Evaluation Mixture (PEM) – A calibration solution of specific analytes used to evaluate both recovery and Percent Breakdown as a measure of performance.
Polychlorinated Biphenyls (PCBs) – A group of toxic, persistent chemicals used in electrical transformers and capacitors for insulating purposes, and in gas pipeline systems as a lubricant. The sale and new use of PCBs were banned by law in 1979.
Purge-and-Trap (Device) – Analytical technique (device) used to isolate volatile (purgeable) organics by stripping the compounds from water or soil by a stream of inert gas, trapping the compounds on an adsorbent such as a porous polymer trap, and thermally desorbing the trapped compounds onto the gas chromatographic column.
Reconstructed Ion Chromatogram (RIC) – A mass spectral graphical representation of the separation achieved by a Gas Chromatograph (GC); a plot of total ion current versus Retention Time (RT).
Relative Percent Difference (RPD) – The relative percent difference is based on the mean of the two values, and is reported as an absolute value (i.e., always expressed as a positive number or zero).
Relative Response Factor (RRF) – A measure of the mass spectral response of an analyte relative to its associated internal standard. RRFs are determined by analysis of standards and are used in the calculation of concentrations of analytes in samples.
Relative Retention Time (RRT) – The ratio of the Retention Time (RT) of a compound to that of a standard (such as an internal standard).
Resolution – Also termed Separation or Percent Resolution, the separation between peaks on a chromatogram, calculated by dividing the depth of the valley between the peaks by the peak height of the smaller peak being resolved, multiplied by 100.
Resolution Check Mixture – A solution of specific analytes used to determine resolution of adjacent peaks; used to assess instrumental performance.
Retention Time (RT) – The time a target analyte is retained on a Gas Chromatograph (GC) column before elution. The identification of a target analyte is dependent on a target analyte’s RT falling within the specified RT window established for that analyte. The RT is dependent on the nature of the column’s stationary phase, column diameter, temperature, flow rate, and other parameters.
Sample Delivery Group (SDG) – A unit within a sample Case that is used to identify a group of samples for delivery. An SDG is defined by the following, whichever is most frequent:
• Each 20 field samples [excluding Performance Evaluation (PE) samples] within a Case; or
• Each 7 calendar day period (3 calendar day period for 7-day turnaround) during which fieldsamples in a Case are received (said period beginning with the receipt of the first sample in theSDG).

Organic Data Review Appendix A: Glossary
January 2017 A-4
• All samples scheduled with the same level of deliverables.
• In addition, all samples and/or sample fractions assigned to an SDG must be scheduled under thesame contractual turnaround time. Preliminary Results have no impact on defining the SDG.
Samples may be assigned to SDGs by matrix (i.e., all soil/sediment samples in one SDG, all aqueous/water samples in another) at the discretion of the laboratory. Laboratories shall take all precautions to meet the 20 sample per SDG criteria.
Sample Management Office (SMO) – A Contractor-operated facility operated under the SMO contract, awarded and administered by the EPA.
Sample Number (EPA Sample Number) – A unique identification number designated by the EPA to each sample. An EPA Sample Number appears on the Traffic Report/Chain of Custody (TR/COC) Record which documents information on that sample.
SDG Narrative – Portion of the data package which includes laboratory, contract, Case, and sample number identification, and descriptive documentation of any problems encountered in processing the samples, along with corrective action taken and problem resolution.
Semivolatile Compounds – Compounds amenable to analysis by extraction of the sample with an organic solvent. Used synonymously with Base/Neutral/Acid (BNA) compounds.
Statement of Work (SOW) – A document which specifies how laboratories analyze samples under a particular Contract Laboratory Program (CLP) analytical program.
Storage Blank – Reagent water (two 40.0 mL aliquots) or clean sand stored with volatile samples in a Sample Delivery Group (SDG). It is analyzed after all samples in an SDG have been analyzed. It is used to determine the level of contamination acquired during storage.
Sulfur Blank – A modified method blank that is prepared only when some of the samples in a batch are subjected to sulfur cleanup. It is used to determine the level of contamination associated with the sulfur cleanup procedure. When all of the samples are subjected to sulfur cleanup, the method blank serves this purpose. When none of the samples are subjected to sulfur cleanup, no sulfur cleanup blank is required.
Surrogates (Surrogate Standard) – For pesticides and Aroclors, compounds added to every blank, sample [including Laboratory Control Sample (LCS)], Matrix Spike/Matrix Spike Duplicate (MS/MSD), and standard. Surrogates are used to evaluate analytical efficiency by measuring recovery. Surrogates are not expected to be detected in environmental media.
Target Analyte List (TAL) – A list of analytes designated by the Statement of Work (SOW) for analysis.
Technical Holding Time – The maximum length of time that a sample may be held from the collection date until extraction and/or analysis.
Tentatively Identified Compound (TIC) – Compounds detected in samples that are not target compounds, internal standards, Deuterated Monitoring Compounds (DMCs), or surrogates. Up to 30 peaks, not including those identified as alkanes (those greater than 10% of the peak area or height of the nearest internal standard), are subjected to mass spectral library searches for tentative identification.
Traffic Report/Chain of Custody Record (TR/COC) – An EPA sample identification form completed by the sampler, which accompanies the sample during shipment to the laboratory and is used to document sample identity, sample chain of custody, sample condition, and sample receipt by the laboratory.
Trip Blank – A blank used to provide information about contaminants that may be introduced during sample transport.

Organic Data Review Appendix A: Glossary
January 2017 A-5
Twelve-hour Time Period – The 12-hour time period for Gas Chromatograph/Mass Spectrometer (GC/MS) system instrument performance check, standards calibration (initial, initial calibration verification, or continuing calibration), and method blank analysis begins at the moment of injection of the Decafluorotriphenylphosphine (DFTPP) or 4-Bromofluorobenzene (BFB) analysis that the laboratory submits as documentation of instrument performance. The time period ends after 12 hours have elapsed according to the system clock. For pesticide and Aroclor analyses performed by Gas Chromatography/Electron Capture Detection (GC/ECD), the 12-hour time period in the analytical sequence begins at the moment of injection of the instrument blank that precedes sample analyses, and ends after 12 hours have elapsed according to the system clock.
Volatile Compounds – Compounds amenable to analysis by the purge-and-trap technique. Used synonymously with purgeable compounds.
Organic Data Review Appendix A: Glossary
January 2017 A-6
This page is intentionally left blank.

Organic Data Review Appendix B
January 2017 B-1
APPENDIX B: ORGANIC DATA REVIEW SUMMARY
CASE NO. SITE
LABORATORY NO. OF SAMPLES/MATRIX
MA NO. SDG No. SOW NO. REGION
REVIEWER NAME COMPLETION DATE
EPA REGIONAL CLP COR ACTION FYI
Review Criteria Method
TRACE VOA
LOW/MED VOA SVOA PEST AROCLOR
Preservation and Holding Times
GC/MS or GC/ECD Instrument Performance Check
Initial Calibration
Initial Calibration Verification

Organic Data Review Appendix B
January 2017 B-2
Review Criteria Method
TRACE VOA
LOW/MED VOA SVOA PEST AROCLOR
Continuing Calibration Verification
Blanks
Deuterated Monitoring Compound or Surrogate Spikes
Matrix Spike/Matrix Spike Duplicate
Laboratory Control Sample
Regional QA/QC

Organic Data Review Appendix B
January 2017 B-3
Review Criteria Method
TRACE VOA
LOW/MED VOA SVOA PEST AROCLOR
Internal Standards
GPC Performance Check
Florisil Cartridge Performance Check
Target Analyte Identification
GC/MS Confirmation
Target Analyte Quantitation and Reported CRQLs
Tentatively Identified Compounds

Organic Data Review Appendix B
January 2017 B-4
Review Criteria Method
TRACE VOA
LOW/MED VOA SVOA PEST AROCLOR
System Performance
Overall Assessment of Data