national estuarine eutrophication assessment: effects of ... by appeal... · national estuarine...
TRANSCRIPT

EXHIBIT 21 (AR L.30)

The National Ocean Service: Working for America’s Coasts
More information or access to data, products, and services can be obtained from our Web sites:
Special Projects Officehttp://spo.nos.noaa.gov
National Centers for Coastal Ocean Sciencehttp://www.nccos.noaa.gov
The National Ocean Service (NOS) approaches the 21st century with a clear vision–that our coasts and oceansenjoy robust health, provide a rich bounty of resources, and are wisely managed to endure competing uses. Asthe nation's principal advocate for coastal and ocean stewardship, the National Ocean Service develops thenational foundation for coastal and ocean science, management, response, restoration, and navigation. Thisreport, developed by the NOS Special Projects Office and the National Centers for Coastal Ocean Science, strength-ens this foundation, helping to bridge the gap between science, management, and public policy.
The Special Projects Office works to increase the effectiveness of coastal management in the United States, therebyensuring continued economic prosperity and environmental well-being throughout the nation's coastal regions.A main objective of the Special Projects Office is to provide expertise, products, and services that assist the NOSin designing and implementing an effective program of coastal stewardship throughout the agency. This effortincludes exploring ways to leverage the agency's considerable expertise into a force that more directly supportsand influences the sound management and protection of coastal areas. Special Projects is in a unique position tobridge the gap between NOS scientific efforts and coastal management policy issues.
The National Centers for Coastal Ocean Science (NCCOS) works to understand the ocean and coastal environ-ment, and the influences of human activities, by conducting research, monitoring, and assessments of thesedelicate and important areas. NCCOS activities include understanding and predicting impacts of pollution andcoastal development on sensitive habitats and resources; helping to protect coastal property and residents fromstorms and other natural hazards; understanding the causes and consequences of harmful algal blooms, such asred tides and toxic Pfiesteria piscicida; understanding how climate change may affect our lives; and determiningthe complex factors that affect fish populations.
To receive copies of this report, contact:
Pam RubinNOS Special Projects [email protected], ext. 121
1305 East-West Highway, 9th FloorSilver Spring, MD 20910-3281
This report should be cited as: Bricker, S.B., C.G. Clement, D.E. Pirhalla, S.P. Orlando, and D.R.G. Farrow. 1999.National Estuarine Eutrophication Assessment: Effects of Nutrient Enrichment in the Nation’s Estuaries. NOAA,National Ocean Service, Special Projects Office and the National Centers for Coastal Ocean Science. Silver Spring,MD: 71 pp.
EXHIBIT 21 (AR L.30)

National Estuarine Eutrophication Assessment
Effects of Nutrient Enrichment in the Nation’s Estuaries
Special Projects Officeand the
National Centers for Coastal Ocean Science
National Ocean ServiceNational Oceanic and Atmospheric Administration
1305 East-West HighwaySilver Spring, MD 20910
September 1999
Suzanne B. Bricker, Christopher G. Clement, Douglas E. Pirhalla, S. Paul Orlando, Daniel R.G. Farrow
N�A
�T�I�O
�N�A
�L� �O
�C�E�A
�N�I�C� �A�N�D� �A�T�M�O�S�P�H�E�R�I�C� �A�D�M
�I�N�I�S
�T�R�A
�T�I�O
�N�
U�.�S�.� �D�E�P�A�R�T�M�E�N�T� �O�F� �C�O�M�M
�E�R�C
�E�
EXHIBIT 21 (AR L.30)

Richard Alexander U.S. Geological SurveyWalter Boynton University of MarylandDavid Brock Texas Water Development BoardDarell Brown U.S. Environmental Protection AgencyDavid Chestnut South Carolina Department of Health and Environmental ControlDavid Flemer U.S. Environmental Protection AgencyHolly Greening Tampa Bay National Estuary ProgramThomas Malone University of MarylandGregory McMurray Oregon Department of Environmental QualityJan Newton Washington Department of EcologyJonathan Pennock University of Alabama/Dauphin Island Sea LabAndrew Robertson National Oceanic and Atmospheric AdministrationDonald Stanley East Carolina UniversityJ. Kevin Summers U.S. Environmental Protection AgencyTerry Whitledge University of Alaska
National Assessment Core Group
National Assessment Workshop ParticipantsMerryl Alber University of GeorgiaDonald Boesch University of MarylandThomas Brosnan National Oceanic and Atmospheric AdministrationBrian Cole U.S. Geological SurveyElizabeth Cosper Cosper Environmental Services, Inc.Christopher D’Elia State University of New York at AlbanyErnest Estevez Mote Marine LaboratoryPeggy Fong University of CaliforniaFred Holland South Carolina Department of Wildlife and Marine ResourcesRenee Karrh Maryland Department of Natural ResourcesJack Kelly U.S. Environmental Protection AgencyPeter Larsen Bigelow Laboratory for Ocean ScienceTheodore Loder University of New HampshireRobert Magnien Maryland Department of Natural ResourcesMichael Mallin University of North CarolinaHank McKellar University of South CarolinaGary Powell Texas Water Development BoardRandy Shuman Metropolitan King County, WashingtonRichard Smith U.S. Geological SurveyRonald Thom Battelle Marine Science LaboratoryDavid Tomasko Southwest Florida Water Management DistrictRichard Valigura National Oceanic and Atmospheric AdministrationPeter Verity Skidaway Institute of OceanographyRichard Wetzel Virginia Institute of Marine Science
We would like to thank all of the estuarine research scientists and coastal resource managers whose contribu-tions of data, information, and expertise were the key to making this report possible (Appendix C). The CoreGroup was instrumental in developing methods for aggregating the data and, along with the other participantsin the National Assessment Workshop, reviewed and analyzed the results and made recommendations for anational-level response to eutrophication problems in the nation’s estuaries.
This report is the result of the dedication and cooperation of many individuals who remained committed dur-ing the long duration of the project. Special thanks go to Daniel J. Basta, Director of NOS Special Projects, for hisvision and unflagging support, and to Richard Alexander and Richard Smith of the U.S. Geological Survey foruse of their SPARROW model results prior to publication. We also thank our NOS colleagues Charles Alexanderand C. John Klein for technical advice; Alison Hammer, John Hayes, Percy Pacheco, and Scot Frew for invalu-able support provided for the National Assessment Workshop; Denise Yver for designing the report cover; andPam Rubin for reviewing and editing the manuscript.
ii
Acknowledgments
EXHIBIT 21 (AR L.30)

Foreword.......................................................................................................................... ivExecutive Summary ........................................................................................................ vEutrophication Diagram ............................................................................................... ix
Introduction ..................................................................................................................... 1Estuarine Eutrophication: Background to the Problem ....................................................... 1The Nation’s First Comprehensive Estuarine Eutrophication Assessment ...................... 3The National Report: A Challenge to Interpret the Data ..................................................... 3Extending the Assessment: Toward a National Strategy ..................................................... 6Organizing the Results: Seven Key Questions ...................................................................... 8Using this Report and the Data ............................................................................................... 8
National Overview ......................................................................................................... 9Eutrophic Conditions ................................................................................................................ 9Completing the Picture ........................................................................................................... 13
Regional Summaries .................................................................................................... 19North Atlantic .......................................................................................................................... 20Middle Atlantic ........................................................................................................................ 24South Atlantic ........................................................................................................................... 28Gulf of Mexico.......................................................................................................................... 32Pacific ........................................................................................................................................ 36
Conclusions.................................................................................................................... 41
Toward A National Strategy ....................................................................................... 45
Data Sources .................................................................................................................. 47
AppendicesA. Methods ................................................................................................................... 49B. Table of Results ......................................................................................................... 63C. Participants ............................................................................................................... 67
iii
Table of Contents
EXHIBIT 21 (AR L.30)

Nancy Foster, Ph.D.Assistant Administrator for Ocean Services
and Coastal Zone ManagementNational Ocean Service, NOAA
This report is the culmination of almost seven years of effort to assess compre-hensively the scale, scope, and characteristics of nutrient enrichment andeutrophic conditions in the nation’s estuaries. It provides the most compre-hensive assessment of this issue ever assembled for our nation’s estuaries,and the results represent a significant contribution to the development of anational strategy to control nutrient enrichment problems affecting U.S. coastalwaters. With this information, we have the opportunity to make a real differ-ence in the actions this nation takes to address this important issue.
These results provide a valuable context for a host of ongoing and plannedactivities addressing estuarine eutrophication, including reauthorization ofthe Coastal Zone Management Act, particularly section 6217; reauthorizationof the Clean Water Act; the states’ development of Unified Watershed Assess-ments and Watershed Restoration Priorities as part of the Clean Water ActionPlan; the Report on the Status of the Nation’s Ecosystems; the Committee onEnvironment and Natural Resources Gulf of Mexico Hypoxia Study; andNOAA’s National Dialogues on Coastal Stewardship.
As important as the results themselves is the process used to acquire this in-formation. The approach explicitly recognized that much of what is knownabout these problems resides within the knowledge and experience of expertsaround the nation. Hence, a process was developed to systematically obtaininformation from more than 300 experts on estuarine eutrophication. Thoseinterested in this innovative approach to information synthesis can review theAppendices to learn more about these methods and how to apply them.
During the past year, the National Ocean Service (NOS) has undergone a reor-ganization, and is emerging with a new focus on coastal stewardship. One ofthe new roles for NOS is as a catalyst to ensure that scientific results are tar-geted to providing solutions to environmental problems and to preservingthe nation’s coastal and ocean resources. This report is also an example of thetype of activity that is needed to better bridge the gap between scientists andresource managers. I encourage you to use this work to stimulate further ef-forts to protect our natural resources.
iv
Foreword
EXHIBIT 21 (AR L.30)

Eutrophication is the accelerated productionof organic matter, particularly algae, in a wa-ter body. It is usually caused by an increasein the amount of nutrients being dischargedto the water body. As a result of acceleratedalgal production, a variety of impacts mayoccur, including nuisance and toxic algalblooms, depleted dissolved oxygen, and lossof submerged aquatic vegetation. These im-pacts are interrelated and usually viewed ashaving a negative effect on water quality andecosystem health. Eutrophication has beenrecognized as a problem in freshwater sys-tems for many years, but only in the pastthree decades has concern grown about thewidespread occurrence of eutrophic condi-tions in estuarine systems. Due to the com-plexity of the phenomena and the lack ofconsistent national data sets, the severity andextent of the problem had never been ad-equately characterized at the national scale.
What are the severity and extent ofeutrophic conditions exhibited withinthe estuaries of the United States?
To what extent are eutrophic conditionsin the nation’s estuaries caused by hu-man activities?
To what extent do eutrophic conditionsimpair the use of estuarine resources,and what are the important impaireduses?
Where should management efforts betargeted to achieve the greatest benefittoward remediation and protection fromdegradation?
v
The National AssessmentThis report presents the results of a NationalAssessment Workshop held in August 1998to address the problem of estuarineeutrophication. The assessment was basedprimarily on the results of the National Es-tuarine Eutrophication Survey, conductedby NOAA from 1992 to 1997, but wassupplemented by information on nutrientinputs, population projections, and land usedrawn from a variety of sources. It covers138 estuaries, representing over 90 percentof the estuarine surface area of the cotermi-nous United States, plus the MississippiRiver Plume. The final assessment pre-sented here was undertaken at the NationalAssessment Workshop by a select group ofexperts, all of whom participated in theeutrophication survey. The Workshop wasstructured around answering seven keyquestions regarding the severity and extentof eutrophication in the nation’s estuaries.All results presented in this report were re-viewed by the Workshop participants.
About Estuarine Eutrophication
To what extent can the severity and ex-tent of eutrophic conditions be expectedto increase by the year 2020, given thenatural susceptibility of estuaries and thepotential for increasing nutrient inputs?
Which data gaps and research and moni-toring needs are most critical in terms ofimproving the ability to assess and re-spond to eutrophication symptoms?
How can the results of this assessmentbe translated into a national strategy?
1.
2.
3.
4.
5.
6.
7.
Key Questions
Executive Summary
EXHIBIT 21 (AR L.30)

vi
Executive Summary
Eutrophication Severity and Extent
Human Influence on Eutrophication
High expressions of eutrophic conditions are ex-hibited in 44 estuaries, representing 40% of thetotal estuarine surface area studied. An additional40 estuaries exhibit moderate conditions. Whenconsidered together, the estuaries with moderateto high conditions represent 65% of estuarine sur-face area in the study.
High conditions occur in estuaries along all coasts,but are most prevalent in estuaries along the Gulfof Mexico and Middle Atlantic coasts.
82 estuaries, representing 67% of estuarine sur-face area, exhibit moderate to high expressions ofat least one of the following symptoms: depleteddissolved oxygen, loss of submerged vegetation,and nuisance/toxic algal blooms.
A high level of human influence is associated witha majority (36) of the 44 estuaries with higheutrophic conditions.
Only six (14%) of the 44 estuaries with high-leveleutrophic conditions have corresponding high-level nitrogen inputs. An additional 22 of the 44estuaries have moderate-level nitrogen inputs.
Of the 44 estuaries with high-level eutrophic con-ditions, more than half (25) exhibit a high suscep-tibility to retaining nutrients.
Human influence on the expression of eutrophic conditions is substantial.
Symptoms of eutrophication are prevalent in the nation’s estuaries.
Assessment Data: National Estuarine Eutrophication Survey
Description: rigorous multi-year effort to synthesize the bestavailable information about eutrophic conditions
Characteristics:consistent and comparable national data set was producedthrough survey of over 300 estuarine scientists and managers
includes spatial and temporal information about eutrophi-cation symptoms, including chlorophyll a, macroalgae, epi-phytes, dissolved oxygen, submerged aquatic vegetation,and nuisance/toxic algae
survey data aggregated by estuary and final results re-viewed by experts at the Assessment Workshop
collection, evaluation, and review of the survey data was mostrigorous of all evaluations in the National Assessment
•
•
•
•
Watershed monitoring data from the U.S. Geological Sur-vey provided first-order estimates of nitrogen inputs.
U.S. Census Bureau population estimates and Depart-ment of Agriculture Agricultural Census data were usedas potential nutrient pressure indicators.
Estuarine susceptibility was determined using NOAAdata on freshwater inflow, tide, and estuarine geometry.
Characteristics: assessment based on data less rigorouslyevaluated and reviewed than for eutrophic conditions
Description: provides estimates of human-related nutri-ent inputs, estuarine susceptibility, and human influence
Assessment Data:•
•
•
1
2
Assessment Data: expert evaluations at Workshop
Description: Experts identified impaired uses they judgedto be related to estuarine eutrophic conditions.
Characteristics: Although the information is not supportedby a comprehensive national data set, it does provide arough insight into the extent of problems stemming fromeutrophic conditions.
69 estuaries were identified by workshop partici-pants as having human-use impairments relatedto eutrophication.
Compared to other impaired uses, commercial/recreational fishing and shellfisheries were iden-tified as impaired for human use in the greatestnumber of estuaries, 43 and 46, respectively.
Impaired Uses of Estuaries3
Impairments to estuarine resources, and fisheries in particular, are of great concern.
Key Findings
EXHIBIT 21 (AR L.30)

vii
Executive Summary
Eutrophic conditions will most likely worsen in86 estuaries by the year 2020.
Of the 86 estuaries expected to worsen, 43 exhibitonly low to moderate eutrophic conditions.
The 10 estuaries that exhibit low eutrophic con-ditions and have high susceptibility are most atrisk of future degradation if human-related nu-trient inputs increase.
The 23 estuaries with high expressions of eutrophicconditions and high susceptibility are likely to requiregreater management effort and longer response timefor results than those estuaries with low susceptibil-ity. These estuaries represent approximately 10% ofthe national estuarine surface area.
There are 10 estuaries that have low eutrophic condi-tions and high susceptibility; accordingly, they shouldbe priorities for preventive management. These estu-aries represent approximately 3% of the national es-tuarine surface area.
All of the typical point and nonpoint pollution sourceswere identified at the Workshop as important to tar-get in order to manage nutrient problems. However,there are some important regional differences in nu-trient sources, such as combined sewer overflows inthe North Atlantic.
Potential Management Concerns
Management requirements are dependent on eutrophic conditions and susceptibility.
4
Assessment Data: NOAA susceptibility and Eutrophica-tion Survey data plus expert evaluations at Workshop
Description: In addition to evaluating eutrophic condi-tions and susceptibility (see numbers 1 and 2), expertsidentified pollution sources important for managingnutrient inputs in each watershed.
Characteristics: Although the pollutant source informa-tion is not based on a comprehensive national data set,the expert evaluation of important point and nonpointsources is useful for gaining a first-order understandingat the national level of the types of actions, and the levelof effort, that will be required to address the problem.
Future Eutrophic Conditions5
Without preventive efforts, eutrophic conditions can be expected to continually worsen.
Assessment Data: projected population growth estimatesadapted from the U.S. Census Bureau and NOAA sus-ceptibility data
Description: Experts at the National Workshop usedpopulation growth and estuarine susceptibility esti-mates, along with their knowledge of the estuarine wa-tersheds, to project the direction and magnitude ofchange in current eutrophic conditions.
Characteristics: The reliability of this information is in-herently vulnerable to unforeseen changes in input lev-els from nutrient pollution sources.
Data Gaps and Research Needs6
Much remains to be done to better characterize and understand estuarine eutrophication.
Assessment Data: expert experience and knowledge, incombination with data completeness and reliabilityanalysis of the Eutrophication Survey results
Description: Experts at the National Assessment Work-shop identified data gaps and research needed to im-prove the assessment of the severity, human influence,impacts, and appropriate responses to eutrophicationproblems in estuaries.
Given all of the monitoring and research done todate, information and knowledge is still inad-equate in 48 estuaries (low confidence or inad-equate data for assessment). These estuaries rep-resent approximately 25% of the nation’s estua-rine surface area.
All participants in the National Assessment pro-cess agreed that research is needed to clarify thelinkages between eutrophication and impacts onestuarine resources, including fisheries, recreationand tourism, and risks to human health.
EXHIBIT 21 (AR L.30)

viii
Executive Summary
A national strategy, which incorporates the resultsof this assessment, should be developed to helpset priorities and support decision-making at thenational level.
The strategy should focus on management, moni-toring, and research, and should effectively inte-grate with regional, state, and local programs.
For estuaries in serious condition, prioritiesshould focus on management action; for those inless serious condition but at risk, the focus shouldbe on monitoring and prevention.
Estuaries for which there is insufficient informa-tion for evaluation should undergo basic moni-toring and assessment activities.
Data Gaps and Research Needs, continued6
Toward A National Strategy7
Assessment results will be valuable in setting national priorities.
Assessment Data: expert experience and knowledge base
Description: These recommendations were developedat the National Assessment Workshop from facilitateddiscussions with the participating estuarine eutrophi-cation experts.
The National Assessment process confirms thatmuch remains to be done to adequately charac-terize nutrient pressure on estuaries. Better quan-tification is needed of total nutrient inputs, inputsby source, and estimators of nutrient pressure(e.g., population, land use). Atmospheric andgroundwater inputs are least well quantified.
Better characterization of physical factors isneeded, including basic circulation patterns, ef-fects of weather patterns, climate change, chang-ing land use, and resultant effects on nutrient de-livery, circulation, and eutrophic conditions.
Other research needs include defining the relation-ship between nutrient inputs and toxic blooms, bet-ter characterization of assimilative capacity, andcharacterization of the effects of seasonal popula-tion changes.
Key Findings, continued
EXHIBIT 21 (AR L.30)

Estuarine Eutrophication: Nutrient Sources and Effects in EstuariesEutrophication is a process in which the addition of nutrients to water bodies stimulates algal growth. Under natural conditions, this is usually a slowprocess that results in healthy and productive ecosystems. In recent decades, however, a variety of human activities has greatly acceleratednutrient inputs to estuarine systems, causing excessive growth of algae and leading to degraded environmental conditions.
Eutrophication Diagram
ix
Atm
osph
eric
nitr
ogen
from
au
tom
obile
and
pow
er
plan
t em
issi
ons.
������
Nitr
ogen
and
pho
spho
rus
is
���tr
ansp
orte
d to
�the
estu
ary,
w
here
it s
purs
ove
rgro
wth
of a
lgae
, ca
usin
g nu
mer
ous
prob
lem
s.
Nitr
ogen
and
ph
osph
orus
from
fe
rtili
zers
app
lied
to
crop
s an
d fr
om
farm
ani
mal
s.
Nitr
ogen
and
ph
osph
orus
fr
om u
rban
ru
noff.
Nitr
ogen
and
ph
osph
orus
fr
om w
aste
w
ater
trea
tmen
t pl
ants
.
Epi
phyt
es (
a ty
pe o
f al
gae)
enc
rust
leaf
bla
de,
dram
atic
ally
red
ucin
g lig
ht
avai
labl
e to
the
plan
t.
Thi
ck b
loom
s of
alg
ae o
r ov
erab
unda
nce
of m
acro
alga
e pr
even
t sun
light
from
pe
netr
atin
g th
e w
ater
col
umn.
Dee
per
SA
V
gene
rally
die
s of
f firs
t as
light
is
dim
inis
hed.
Bac
teria
use
oxy
gen
to
deco
mpo
se a
lgal
mat
eria
l.
Alg
ae d
ie o
ff an
d se
ttle
to th
e bo
ttom
.
Ligh
ter
fres
hwat
er
Den
ser
seaw
ater
in
hibi
ts m
ixin
g w
ith
uppe
r ox
ygen
-ric
h la
yer.
Oxy
gen
from
wav
e ac
tion
and
phot
osyn
thes
is m
ixes
with
up
per
fres
her
wat
er la
yer.
Incr
ease
s oc
cur
in th
e du
ratio
n, fr
eque
ncy,
an
d sp
atia
l ext
ent o
f nui
sanc
e/to
xic
bloo
ms.
She
llfis
h be
com
e co
ntam
inat
ed
with
alg
al
toxi
ns.
Imm
obile
sh
ellfi
sh d
ie o
ff.
Som
etim
es fi
sh k
ills
occu
r, b
ut m
ore
likel
y,
fish
avoi
d ar
ea.
Su
bm
erg
ed A
qu
atic
Veg
etat
ion
(S
AV
) D
eclin
eD
eple
ted
Dis
solv
ed O
xyg
enN
uis
ance
/To
xic
Alg
al B
loo
ms
Thi
ck b
loom
s of
alg
ae o
r ov
erab
unda
nce
of
mac
roal
gae
gene
rate
too
muc
h or
gani
c m
atte
r.
Co
nse
qu
ence
s
• Le
ss h
abita
t is
avai
labl
e fo
r fis
h an
d sh
ellfi
sh.
• Im
pact
s on
com
mer
cial
and
rec
reat
iona
l fis
herie
s.•
Impa
cts
to to
uris
m.
Co
nse
qu
ence
s
• Le
ss h
abita
t is
avai
labl
e fo
r fis
h an
d sh
ellfi
sh.
• Lo
wer
com
mer
cial
and
rec
reat
iona
l fis
h yi
elds
.•
Impa
cts
to to
uris
m.
• H
uman
hea
lth e
ndan
gere
d by
exp
osur
e to
toxi
ns.
• C
losu
re o
f she
llfis
h be
ds to
har
vest
.•
Impa
cts
on c
omm
erci
al a
nd r
ecre
atio
nal f
ishe
ries.
• Im
pact
s to
tour
ism
.
Co
nse
qu
ence
s
Typ
es
of
sou
rces
ar
e d
iver
se
and
le
vels
o
f n
utr
ien
ts g
ener
ated
var
y g
reat
ly d
epen
din
g o
n a
n
um
ber
of
fact
ors
. H
ow
ever
, p
op
ula
tio
n i
s th
e co
mm
on
fa
cto
r th
at
crea
tes
dem
and
fo
r th
e p
rod
uct
s an
d s
ervi
ces
that
aff
ect
the
leve
l o
f n
utr
ien
t p
ollu
tio
n e
man
atin
g f
rom
th
ese
sou
rces
.
Som
e to
xic
bloo
ms
caus
e fis
h ki
lls.
Win
d bl
ows
toxi
ns s
hore
war
d,
whe
re th
ey m
ay c
ause
hum
an
resp
irato
ry p
robl
ems.
EXHIBIT 21 (AR L.30)

x
EXHIBIT 21 (AR L.30)

1
Estuarine Eutrophication: Background tothe ProblemEutrophication refers to a process in which the ad-dition of nutrients to water bodies, primarily nitro-gen and phosphorus, stimulates algal growth. Thisis a natural process, but it has been greatly acceler-ated by human activities. Estuaries have always re-ceived nutrients from natural sources in the water-shed and from the ocean. In recent decades, how-ever, population growth and related activities, suchas various agricultural practices, wastewater treat-ment plants, urban runoff, and the burning of fossilfuels, have increased nutrient inputs by many timesthe levels that occur naturally.
Increased nutrient inputs promote a complex arrayof symptoms, beginning with the excessive growthof algae, which, in turn, may lead to other, more se-rious symptoms. In addition to the rate of algalgrowth, nutrient inputs may also affect which algalspecies are favored. This process is poorly under-stood, but some unfavorable species (e.g., Pfiesteria)appear to be linked to nutrient inputs.
This report presents the results of a comprehensive National Assessment to address the problem of estuarine eutrophication.The assessment includes evaluations of eutrophic conditions, human influence, impaired estuarine uses, future conditions,data gaps and research needs, and recommendations for a national strategy to respond to the problem.
Eutrophication refers to a process inwhich the addition of nutrients towater bodies stimulates algal growth.In recent decades, human activitieshave greatly accelerated nutrient in-puts, causing the excessive growth ofalgae and leading to degraded waterquality and associated impairments ofestuarine resources for human use.
Introduction
In recent decades, eutrophication problems havebeen reported globally, from the Baltic, Adriatic, andBlack Seas, to the estuaries and coastal waters of Ja-pan, China, and Australia. Eutrophic symptomshave also been observed in the United States, includ-ing the Chesapeake Bay, Long Island Sound, and thenorthern Gulf of Mexico. More recently, it has be-come clear that nearly all U.S. estuaries exhibit somelevel of eutrophic symptoms, although the scale, in-tensity and impacts vary widely, as do the levels ofnutrient inputs that produce these symptoms.
Whether nutrient additions result in degraded wa-ter quality depends on the extent of additional in-put and on natural characteristics that affect estua-rine susceptibility to nutrients. In some estuaries, nu-trients cause dense algal blooms to occur for monthsat a time, blocking sunlight to submerged aquaticvegetation. Decaying algae from the blooms usesoxygen that was once available to fish and shellfish.In other estuaries, these or other symptoms may oc-cur, but less frequently, for shorter periods of time,or over smaller spatial areas. In still other estuaries,the assimilative capacity, or ability to absorb nutri-ents, may be greatly reduced, though no other symp-toms are apparent. These eutrophic symptoms areindicative of degraded water quality conditions thatcan adversely affect the use of estuarine resources,including commercial and recreational fishing, boat-ing, swimming, and tourism. Eutrophic symptomsmay also cause risks to human health, including se-rious illness and death, that result from the consump-tion of shellfish contaminated with algal toxins, orfrom direct exposure to waterborne or airborne tox-ins.
It should be noted that although nutrients causeeutrophic symptoms, other human and natural in-fluences may cause or affect the expression of such
A red tide causes a fish kill.Photo courtesy of Woods Hole Oceanographic Institution
EXHIBIT 21 (AR L.30)

2
Introduction
symptoms. These influences include engineeredwater flow, which decreases estuarine flushing rates;and development, dredging, and disease, whichchange nutrient assimilative capacity through lossesof wetlands, sea grasses, oysters, and other filterfeeders. In addition to nitrogen and phosphorus,there are other nutrients (e.g., silica) and trace ele-ments that may be important under certain condi-tions, but their role is less understood.
Climate changes may also be significant for futureconditions. Global warming may result in increasedwater temperatures, causing lower dissolved oxy-gen with no changes in nutrient inputs. At the sametime, flushing times and exchange rates might in-crease with rising sea levels, which could possiblyoffset these effects.
For more than 40 years, scientists and natural re-source managers have worked to understand, docu-ment, and resolve the complex issues associated witheutrophication in the nation’s estuaries. Nonetheless,information concerning algal blooms, low dissolvedoxygen, and other eutrophic symptoms was slow tocapture the attention of the public, administrators,and legislators. Recently, the consequences of thesesymptoms have become more apparent, helping toraise awareness of nutrient-related environmentalproblems. For instance, extensive losses of sub-merged aquatic vegetation and the associated lossof fish habitat have occurred, many coastal waterbodies have suffered worsening episodes of low dis-
solved oxygen, and blooms of nuisance and toxicalgae have been occurring in new areas. For example,Pfiesteria was first identified as a major fish-killingagent in the Neuse and Pamlico River estuaries ofNorth Carolina in 1992; in 1997, outbreaks occurredin tributaries of the Chesapeake Bay, where they hadpreviously not been observed.
Given the rising concern of the scientific commu-nity and the public at large, NOAA began to inves-tigate and evaluate the need for a more deliberatenational response to the problem of estuarineeutrophication. In order to determine the nationalextent of this problem and to provide a basis for anappropriate and effective national response, it wasnecessary to survey the overall symptoms ofeutrophication within the nation’s estuaries. Histori-cal information and ongoing field programs offeredthe raw materials, but the task remained to constructa comprehensive and consistent characterization ofthe symptoms of eutrophication. In addition, it wasessential to present the results of the survey withinthe context of everyday use impairments (e.g., swim-ming, fish consumption) that are important to theAmerican public. In fact, the population of U.S.coastal and upstream areas is projected to increaseby more than 13 percent by 2010, suggesting thatnutrient-related problems are likely to get worse.This underscores the need to stimulate additionalpublic involvement by presenting and publicizingthe best available information to concerned citizens,resource managers, and policy makers alike.
Figure 1. Data characteristics of NOAA’s Estuarine Eutrophication Survey
*See Appendix A for detailed descriptions of the symptoms.
DATA SHEETS COMPILED FOR 138 ESTUARIES REGIONAL DATA SUMMARIES COMPILED
Between 120 - 1,200 Data Values per Estuary
Chlorophyll a
Turbidity
Suspended Solids Problems
Nuisance Algae Problems
Toxic Algae Problems
Macroalgae Problems
Epiphyte Problems
Total Dissolved Nitrogen
Total Dissolved Phosphorus
Anoxia
Hypoxia
Biological Stress
Primary Productivity Dominance
Pelagic Community Dominance
Benthic Community Dominance
Submerged Aquatic Vegetation (SAV)
Eutrophication Symptoms*
Existing Conditions
Concentrations
Presence/Absence of Conditions
Spatial Coverage
Months of Occurrence
Frequency of Occurrence
Duration of event
Trends in Conditions (1970 - 1995)
Direction and Magnitude of Change
Frequency
Duration
Spatial coverage
Dominance Shifts
Contributing Factors to Change
Reliability of Information
Symptom Information Collected for Each Salinity Zone
North Atlantic
Middle Atlantic
South Atlantic
Gulf of Mexico
Pacific
Eutrophication
Survey Data
Summary
EXHIBIT 21 (AR L.30)

3
Introduction
The Nation’s First ComprehensiveEstuarine Eutrophication AssessmentSince its inception in 1992, NOAA’s National Estua-rine Eutrophication Survey has synthesized the bestavailable information on eutrophication-relatedsymptoms from more than 300 scientists and envi-ronmental managers. Recently published in five re-gional reports, the data characterize the spatial do-main, severity, duration, frequency and past trendsof 16 eutrophication related conditions in estuariesof the coterminous United States (NOAA 1996,1997a, 1997b, 1997c, 1998).
The 138 estuaries characterized in this study repre-sent more than 90 percent of both the total estuarinewater surface area and the total number of majorU.S. estuaries. Although not an estuary, the Missis-sippi River Plume is also included because of its im-
portance to the Gulf of Mexico and associated estu-aries to the west. Alaska, Hawaii and U.S. territo-ries were not included in this assessment due to lim-ited resources.
A common spatial framework (salinity zones repre-senting tidal fresh, mixing, and saltwater environ-ments) and predefined data categories were used toconsistently characterize the information on condi-
tions and trends for each estuary. In all, this surveyproduced an array of data containing more than40,000 data values (120 to 1,200 per estuary; Figure1). While providing the best possible information onthe problem, this array of data was also challengingto interpret.
The National Report: A Challenge toInterpret the DataNOAA worked with a “Core Group” of 15 scientistsand resource managers (see Acknowledgments) todevelop and apply methods that would best inte-grate the survey data for each estuary. It seemed rea-sonable that eutrophication symptoms and theirtime/space characteristics could be combined in away that provided a single value to represent thestatus of eutrophication symptoms in each estuary.Moreover, this index would allow comparisons,
ranking, and priority-setting amongestuaries, as well as facilitate sum-maries of national and regional re-sults. To accomplish this, two ob-stacles—data quality and a lack ofmethodology for combining numer-ous parameters into a single value—would have to be overcome.
Data Quality. An analysis of datacompleteness and the reliability ofsymptom data was performed forall estuaries so that confidence lev-els could be estimated for the data.For 17 estuaries, symptom datawere so limited that an assessmentof overall eutrophic conditionscould not be made. Most of thesewere on the Pacific Coast. For 31other systems, some of the symp-tom data provided by the expertswas rated as “speculative” becauseit was based on spatially or tempo-rally limited field observations. Theoverall confidence levels for theseestuaries was therefore assessed aslow. The evaluations for each symp-tom were carried through the as-sessment process to provide a basis
for assigning a confidence rating to the overall as-sessment of eutrophic conditions. This confidenceevaluation is important, because incomplete or un-certain data were sometimes included in the overallassessment because it was the best information avail-able.
Developing a Methodology to Aggregate Symptom Data.There was no method available for combining symp-
Experts interpret survey results at the National Assessment Workshop.
EXHIBIT 21 (AR L.30)

4
Introduction
tom data into a single assessment for each estuary;therefore, the Core Group had to address severalquestions while determining the best way to inte-grate the existing data:
Are all eutrophic symptoms and their character-istics equally important? Should all 16 symptomsbe considered in the national assessment? Do cer-tain symptoms logically group or occur in a linearsequence?
Do all eutrophic symptoms have the potential toexist in all estuaries?
Is the threshold for symptoms the same in all es-tuaries? For example, does a given concentrationof chlorophyll a represent “high” eutrophic symp-toms in all estuaries?
The Eutrophication Model. To help overcome theseobstacles and properly interpret the information, theCore Group participated in two work sessions to de-velop and test several analytical and numericalmethods. Ultimately, a single model was developedthat made maximum use of the survey data. Whilethis model does not account entirely for the com-plexity of this issue, it uses available information tobest describe the sequence and severity of eutrophicconditions (Figure 2). The model used six symptomsthat were most directly related to nutrient inputs.Three primary symptoms, algal abundance (usingchlorophyll a as an indicator), epiphyte abundance,and macroalgae, represent the first possible stage ofwater-quality degradation associated with eutrophi-cation. Although nitrogen and phosphorus concen-trations in the water column are related to nutrientinputs, they are also influenced by other biologicaland chemical processes. As a result, elevated con-centrations do not necessarily indicate that eutrophic
symptoms are present, nor dolow concentrations necessarilyindicate that eutrophication isnot present. As an example,chlorophyll a concentrationsmay be very high while dis-solved nutrient concentrationsare low. This scenario is com-mon during peak phytoplank-ton production because theseorganisms assimilate the nutri-ents very efficiently. Thus, nu-trient concentrations in the wa-ter column were not included asprimary symptoms in themodel.
In many estuaries, the primarysymptoms lead to secondarysymptoms, such as submergedaquatic vegetation loss, nui-sance and toxic algal blooms (al-though for toxic forms the link-age is not well established), andlow dissolved oxygen. In somecases, secondary symptoms canexist in the estuary withoutoriginating from the primarysymptoms. This occurs, for in-stance, in many North Atlanticestuaries where toxic algalblooms are transported from thecoastal ocean. In other places,disease or suspended sedimentshave contributed to declines insubmerged aquatic vegetation.
Nitrogen and Phosphorus
Extreme Chl-a Concentrations
Problematic Epiphytic Growth
SAV Spatial Coverage
Diatoms to Flagellates
Benthic Dominance to Pelagic Dominance
AnoxiaHypoxiaBiological Stress
Nuisance Bloom Problems
Toxic Bloom Problems
Primary Symptoms
Secondary Symptoms
Extreme Chl-a Concentrations
Problematic MacroalgalGrowth
Problematic MacroalgalGrowth
Loss of Submerged Aquatic Vegetation
SAV Spatial Coverage Trends
Decreased Light Availability
Algal Dominance Changes Harmful Algae
Increased Organic MatterDecomposition
Low Dissolved Oxygen
External Nutrient Inputs
Figure 2. The simplified eutrophication model used for the National Assessment
•
•
•
EXHIBIT 21 (AR L.30)

5
Introduction
Determining Overall Eutrophic Conditions. A nu-merical scoring system was developed to integrateinformation from all six primary and secondarysymptoms to determine the overall status ofeutrophic symptoms in each estuary. This scoringsystem was implemented in three phases accordingto the methods described in Figure 3 (see AppendixA for a detailed description).
First, a single index value was computed from allprimary symptoms. The scoring system gave equalweight to all three symptoms and considered thespatial and temporal characteristics of each. Thescores for the three symptoms were then averaged,resulting in the highest values being assigned to es-tuaries having multiple primary symptoms that oc-cur with great frequency, over large spatial areas of
the estuary, and for extended periods of time. Like-wise, the lowest scores indicate estuaries that exhibitfew, if any, characteristics of the primary symptoms.
Next, a single index value was computed from allsecondary symptoms. The scoring system again gaveequal weight to all symptoms and their spatial andtemporal characteristics. The highest score of any ofthe three symptoms was then chosen as the overallsecondary value for the estuary. This weights the sec-ondary symptoms higher than the primary symp-toms, because the secondary symptoms take longerto develop, thereby indicating a more chronic prob-lem, and being more indicative of actual impacts tothe estuary.
Finally, the range of numeric scores assigned to pri-mary and secondary symptoms was dividedinto categories of high, moderate, and low. Pri-mary and secondary scores were then com-pared in a matrix so that overall categoriescould be assigned to the estuaries (Figure 3).Estuaries having high scores for both primaryand secondary conditions were considered tohave an overall “high” level of eutrophication.Likewise, estuaries with low primary and sec-ondary values were assigned an overall “low”level of eutrophication. The Core Group mem-bers, using the matrix as a guide, then assignedscores to the remaining estuaries based on theirinterpretations of each estuary’s combinedvalues.
Interpreting the Model Results. While themodel offered a potentially wide scale overwhich to define the severity of the problem,few of the 138 estuaries or the Mississippi RiverPlume actually fell at either extreme of this con-tinuum, where the numerical scoring systemsare more easily interpreted. Logically, estuar-ies with few primary symptoms and low nu-meric scores were considered to be relativelyunaffected by nutrient-related conditions whencompared to estuaries with both primary andsecondary symptoms and higher numericscores.
Most estuaries showed varying degrees of bothprimary and secondary symptoms, so that themeaning of these scores was more difficult todetermine. This was particularly true for twoconditions, for which these general guidelinesfor interpretation were offered:
High or moderate primary symptoms and low sec-ondary symptoms. These estuaries have rela-
Primary and Secondary Symptom Index values are ranked and split into categories as follows:
Category AssignedScore Range
2
1 Individual scores are determined for the primary symptoms and combined into a single primary symptom index. Individual scores are determined for the secondary symptoms and combined into a single secondary symptom index.
3Primary and Secondary Symptom Categories are cross compared in a matrix to determine the overall level of expression of eutrophic conditions.
OVERALL LEVEL OF EXPRESSION OF EUTROPHIC CONDITIONS
LOW
MODERATE
MODERATE LOW MODERATE HIGH
Moderate secondary symptoms indicate substantial eutrophic conditions, but low primary symptoms indicate other factors may be involved in causing the conditions.
Level of expression of eutrophic conditions is minimal.
High secondary symptoms indicate serious problems, but low primary symptoms indicate other factors may also be involved in causing the conditions.
Primary symptoms beginning to indicate possible problems but still very few secondary symptoms expressed.
Primary symptoms high but problems with more serious secondary symptoms still not being expressed.
Level of expression of eutrophic condtions is substantial.
Substantial levels of eutrophic conditions occurring with secondary symptoms indicating serious problems.
Primary symptoms high and substantial secondary symptoms becoming more expressed, indicating potentially serious problems.
High primary and secondary symptom levels indicate serious eutrophication problems.
MODERATE LOW HIGH
MODERATE MODERATE HIGH HIGH
Secondary Symptoms
Pri
mar
y S
ymp
tom
s
Low Moderate High0 0.3 0.6 1
Low
Mod
erat
eH
igh
0.3
0.6
1
In This Report:LOW and MODERATE LOW are grouped together as LOW.HIGH and MODERATE HIGH are grouped together as HIGH.
Low> <0 0.3
0.3 0.6> < Moderate
10.6 <> High
Figure 3. Steps followed in determining the overall level of expression ofeutrophic conditions in estuaries
EXHIBIT 21 (AR L.30)

6
Introduction
tively well developed conditions associated with al-gal blooms, epiphytes, and/or macroalgae, whichsuggests that they are in the early stages of eutrophi-cation and may be on the edge of developing moreserious conditions. These systems may be suscep-tible to additional nutrient inputs and could beginto develop secondary symptoms of eutrophication.
High or moderate secondary symptoms and low primarysymptoms. For these estuaries, advanced secondarysymptoms exist, even though the “prerequisite” pri-mary symptoms (as suggested by the model) maynot be well developed. Three possible interpretationsare offered to describe these conditions. For someestuaries, the secondary conditions were transportedfrom offshore coastal areas, rather than originatingwithin the estuary. This occurs, for example, withtoxic bloom conditions in North Atlantic estuaries.Alternatively, it is possible that nutrient-related wa-ter quality conditions have recently improved, butthe response time to reduce secondary symptoms islonger than it is for primary symptoms. The second-ary symptoms that remain may be residual condi-tions that also may improve as nutrient concentra-tions continue to decrease. Finally, it is possible thatsecondary conditions in an estuary are related onlypartially, or not at all, to nutrient enrichment. Forexample, submerged aquatic vegetation losses in LongIsland Sound have been attributed to both disease andnutrient enrichment.
Through the use of a simple model, a frameworkwas established to help understand the sequence,processes, and symptoms associated with nutrientenrichment. Despite its limitations (e.g., the modeldoes not account for changes in assimilative capac-ity from losses of wetlands), the model representsthe first attempt to synthesize large volumes of dataand to derive a single value for eutrophication ineach estuary. With this foundation, the next stepsare to (1) expand understanding of the relationshipbetween eutrophication and nutrient sources, and(2) evaluate appropriate responses to the problem.
Extending the Assessment: Toward aNational StrategyThis National Assessment focuses on the data inNOAA’s Estuarine Eutrophication Survey, the fun-damental goal of which was to describe the scale,scope, and severity of nutrient enrichment condi-tions nationwide, and to compare the various ex-pressions of eutrophic symptoms in individual es-tuaries. In a sense, the model represents a form ofenvironmental triage—separating estuaries that arein serious condition, but could potentially improve,from those that presently do not experience many
symptoms, but are seemingly at risk. In turn, thisrepresents a starting point for understanding whythese conditions exist, how and why conditions dif-fer across estuaries, whether certain problematic con-ditions may respond to remedial actions, and whichof these actions would best protect estuaries fromfurther degradation.
To do so means to go beyond the survey data. At thevery least, more information is needed about themagnitude and sources of nutrient inputs, the natu-ral ability of estuaries to flush or assimilate incom-ing nutrients, and the relative influence of both ofthese factors on the expression of eutrophication.Moreover, these results need to be associated withuse impairment and public health issues that bringthe message to the public and help to set prioritiesfor management and research activities. With theguidance of the Core Group, the National Assess-ment was expanded to include additional data setsthat begin to examine these linkages.
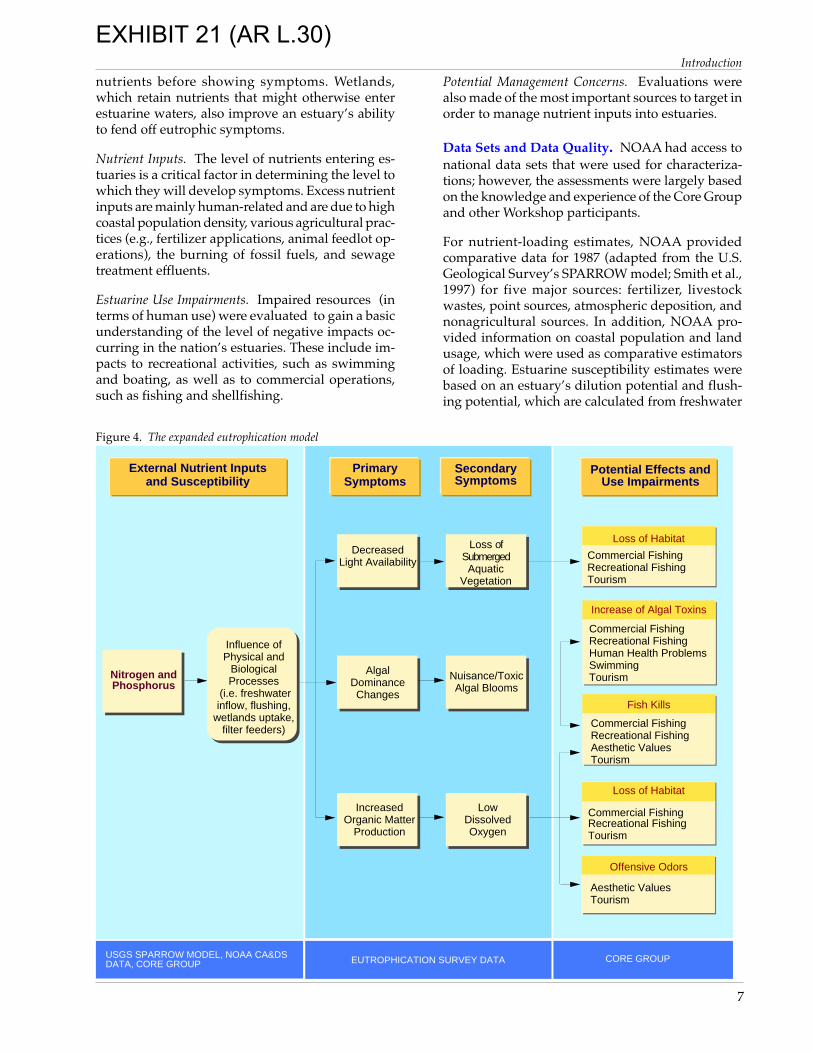
Expanding the Model. To accommodate the addi-tional analyses, the original eutrophication modelwas expanded (Figure 4) so that eutrophic symp-toms could be compared with other national datasets, specifically estuarine transport (i.e., flushing,also referred to as susceptibility), nutrient inputs andsources, and eutrophication-related estuarine useimpairments. The data for these assessments werederived from a variety of sources, described below.These assessments were intended to allow generalobservations about the linkages between symptoms,nutrient loading and susceptibility, and betweeneutrophic conditions and use impairments. Recom-mendations for potential responses to the problemwere developed from conclusions based on theseobservations.
Susceptibility. Estimates were made of the naturaltendency of an estuary to retain or export nutrients.The rate at which water moves through the estuarywas determined by examining tidal action and thevolume of freshwater flowing in from rivers. In gen-eral, if the water (and nutrients) are flushed quickly,there is not sufficient time for problems to developand the estuary is not particularly susceptible. If theestuary acts more like a bathtub, with nutrient-richwater sitting in the system for a long time, then thereis time for nutrients to be taken up by algae. Theseestuaries are more susceptible to developingeutrophic symptoms.
Although only dilution and flushing were includedin this susceptibility estimate, biological processesmay also affect susceptibility. For instance, filter feed-ers raise an estuary’s capacity to assimilate more
EXHIBIT 21 (AR L.30)
7
Introduction
nutrients before showing symptoms. Wetlands,which retain nutrients that might otherwise enterestuarine waters, also improve an estuary’s abilityto fend off eutrophic symptoms.
Nutrient Inputs. The level of nutrients entering es-tuaries is a critical factor in determining the level towhich they will develop symptoms. Excess nutrientinputs are mainly human-related and are due to highcoastal population density, various agricultural prac-tices (e.g., fertilizer applications, animal feedlot op-erations), the burning of fossil fuels, and sewagetreatment effluents.
Estuarine Use Impairments. Impaired resources (interms of human use) were evaluated to gain a basicunderstanding of the level of negative impacts oc-curring in the nation’s estuaries. These include im-pacts to recreational activities, such as swimmingand boating, as well as to commercial operations,such as fishing and shellfishing.
Potential Management Concerns. Evaluations werealso made of the most important sources to target inorder to manage nutrient inputs into estuaries.
Data Sets and Data Quality. NOAA had access tonational data sets that were used for characteriza-tions; however, the assessments were largely basedon the knowledge and experience of the Core Groupand other Workshop participants.
For nutrient-loading estimates, NOAA providedcomparative data for 1987 (adapted from the U.S.Geological Survey’s SPARROW model; Smith et al.,1997) for five major sources: fertilizer, livestockwastes, point sources, atmospheric deposition, andnonagricultural sources. In addition, NOAA pro-vided information on coastal population and landusage, which were used as comparative estimatorsof loading. Estuarine susceptibility estimates werebased on an estuary’s dilution potential and flush-ing potential, which are calculated from freshwater
Nitrogen and Phosphorus
USGS SPARROW MODEL, NOAA CA&DS DATA, CORE GROUP EUTROPHICATION SURVEY DATA CORE GROUP
Potential Effects and Use Impairments
Decreased Light Availability
Loss of Submerged Aquatic
Vegetation
Algal Dominance Changes
Nuisance/Toxic Algal Blooms
Increased Organic Matter
Production
Low Dissolved Oxygen
Secondary Symptoms
Primary Symptoms
External Nutrient Inputs and Susceptibility
Loss of Habitat
Commercial Fishing Recreational FishingTourism
Offensive Odors
Aesthetic ValuesTourism
Fish Kills
Commercial Fishing Recreational FishingAesthetic ValuesTourism
Commercial Fishing Recreational FishingHuman Health ProblemsSwimmingTourism
Increase of Algal Toxins
Loss of Habitat
Commercial Fishing Recreational FishingTourism
Influence of Physical and
Biological Processes
(i.e. freshwater inflow, flushing,
wetlands uptake, filter feeders)
Figure 4. The expanded eutrophication model
EXHIBIT 21 (AR L.30)

8
Introduction
inflow, tidal prism, and estuary geometry (NOAA’sCoastal Assessment & Data Synthesis System, 1998).These data sets were synthesized and interpreted lessrigorously than the symptom data, and thus, weremore speculative than the data for eutrophic symp-toms.
The assessment of estuarine-use impairments andmanagement targets was not based on hard data;rather, it was derived from the expert knowledge ofparticipants at the National Assessment Workshop.Despite the speculative nature of these assessments,the information was still very useful, providing in-sight into the consequences of eutrophic symptomsin estuaries, and into the most effective managementactions for reducing them.
See Appendix A for details on the methods and in-formation sources used in the assessment.
Organizing the Results: Seven KeyQuestionsSeven questions, which follow the logic sequence ofthe expanded eutrophication model, were developedto help organize results for the National Assessment.Question 1 examines the results of the model. Ques-tions 2 through 4 examine linkages between thesesymptoms, pollution sources, and coastal use im-pairments. Questions 5 through 7 identify prioritymanagement, monitoring, and research needs.
1. What are the severity and extent of eutrophic con-ditions exhibited within the estuaries of the UnitedStates?This analysis is based on the eutrophication data setand its interpretation using the eutrophicationmodel.
2. To what extent are eutrophic conditions in U.S.estuaries caused by human activities?The U.S. Geological Survey SPARROW model pro-vided first-order estimates of nutrient loads for 1987from five major sources. Population estimates andAgricultural Census data also were used to repre-sent the potential for nutrient sources. In addition,an indicator of estuarine flushing potential was de-veloped based on freshwater inflow, tide, and es-tuarine geometry.
3. To what extent do eutrophic conditions impairthe use of estuarine resources, and what are the im-portant impaired uses?Core Group members selected from a list of sevenuse impairments for each estuary. This list includedrecreational and commercial fishing, fish consump-tion, shellfishing, swimming, boating, aesthetics, andtourism.
4. Where should management efforts be targeted toachieve the greatest benefit toward remediation andprotection from future degradation, and what arethe most important sources to target?Core Group members selected from a list of 10 pointand nonpoint nutrient source targets.
5. To what extent can the severity and extent ofeutrophic conditions be expected to increase by theyear 2020, given the natural susceptibility of estu-aries and the potential for increasing nutrient in-puts?Projected population growth estimates were usedto represent the potential for future nutrient inputsand thus, changes in eutrophic conditions. Suscep-tibility was used to determine the expected severityof change.
6. Which data gaps and research and monitoringneeds are most critical in terms of improving theability to assess and respond to eutrophic condi-tions?Core Group members listed these, based on their ex-perience and the findings of Questions 1 through 5above.
7. How can the results of this assessment be trans-lated into a national strategy?Recommendations were developed from discussionsbetween members of the Core Group.
Using this Report and the DataThis report contains five sections that are organizedaccording to the seven questions listed above. Thereport emphasizes the results from the eutrophicsymptoms model (i.e., Question 1) as they representthe culmination of the multi-year survey work andprovide an unprecedented classification for thenation’s estuaries. The results of the expanded as-sessment model (i.e., Questions 2 through 7) are alsoprovided, but at a more general level consistent withthe less rigorous methods of data collection. Themost direct responses to the seven questions are pro-vided in the Executive Summary, while the NationalOverview and Regional Summaries sections aresupplemented by mapped and tabular displays ofthe synthesized results. The Conclusions and Rec-ommendations sections propose next steps, as sug-gested by the Core Group and other Workshop par-ticipants. The data and methods used in this Na-tional Assessment are described in the Appendices.The digital data can be accessed on-line at:http://cads.nos.noaa.gov
EXHIBIT 21 (AR L.30)

9
National Overview
The expression of overall eutrophic con-ditions is high in 44 U.S. estuaries. Theseestuaries are located mainly in the Gulfof Mexico and Middle Atlantic regions;however, certain estuaries along allcoastlines exhibit high levels ofeutrophic conditions.
This assessment characterizes the overall eutrophic conditions and the water-quality problems associated with nutrientenrichment for 138 U.S. estuaries. A Core Group of eutrophication experts collaborated with NOAA and was instrumentalin developing methods to assess the results of the National Eutrophication Survey. At a National Assessment Workshop,the Core Group and additional experts reviewed and interpreted the Survey results, and analyzed the factors that influencethe development of problematic conditions. They also reported on impairments in estuarine uses, potential managementconcerns, and the future outlook to the year 2020. Note that the Mississippi River Plume was also characterized, and iscounted as an additional “estuary” in the figures, but is not included in surface area statistics.
Eutrophic ConditionsThe assessment of overall eutrophic conditions isbased on the combined level of expression of sixsymptoms: chlorophyll a, epiphyte abundance,macroalgal abundance, depleted dissolved oxygen,submerged aquatic vegetation loss, and nuisance/toxic algal blooms. The level of expression of each isdetermined by the concentration, spatial coverage,frequency of occurrence, and/or other factors (referto Figure 3, page 5).
For each symptom assessment, an evaluation of thelevel of confidence was made based on the tempo-ral and spatial representativeness of the data. Theconfidence evaluation is important, because in somecases the data were incomplete or uncertain, but stillprovided the best information available and the onlymeans of presenting a national picture. These symp-tom confidence ratings provided the basis for evalu-ating the confidence of overall eutrophic conditions.
The data for 17 estuaries were too sparse to providean overall view of eutrophic conditions althoughlimited data existed for certain symptoms in someof these estuaries (see page 18 for list). For an addi-tional 38 estuaries, the overall assessment confidencewas rated as low (see Appendix B).
Figure 5. Level of expression of eutrophic conditions Figure 6 . Eutrophic conditions by region
Overall Conditions. National Assessment Work-shop participants concluded that the expression ofoverall eutrophic conditions was high in 44 estuar-ies, representing 40% of the total estuarine surfacearea studied (Figure 5). These estuaries were locatedmainly in the Gulf of Mexico and Middle Atlanticregions; however, some estuaries along all coastlinesexhibited high levels of eutrophic conditions (Fig-ures 6 and 7). This means that in these estuaries, oneor more symptoms occurred at problem levels ev-ery year, or persistently, across a major part of eachestuary. An additional 40 estuaries exhibited mod-erate eutrophic conditions. When considered to-gether, the estuaries with moderate to high condi-tions represent 65% of the estuarine surface areastudied. The remaining 38 estuaries exhibited low
Moderate Moderate Low
5
10
15
20
25
30
35
High Moderate High Low
5
10
15
20
25
30
35
North Atlantic
Middle Atlantic
South Atlantic
Gulf of Mexico
Pacific
Num
ber
of E
stua
ries
Num
ber
of E
stua
ries
Eutrophic Condition
HighModerate High
Moderate
Moderate LowLow
Grouped as High in this Report Grouped as Low in this Report
0 High
0 Low
Low Confidence
Moderate to High Confidence
Moderate High to High Expression Moderate Expression Moderate Low to
Low Expression
Low Confidence
Moderate to High Confidence
Low Confidence
Moderate to High Confidence
Eutrophic Condition and Assessment Confidence
Grouped as High in this Report
Grouped as Low in this Report
National Overview
EXHIBIT 21 (AR L.30)

10
National Overview
Bos
ton
Har
bor
Che
sape
ake
Bay
Mai
nste
m
Bar
nega
t Bay
Del
awar
e In
land
Bay
s
Pat
uxen
t Riv
er
Pot
omac
Riv
er
Neu
se R
iver
Lake
P
ontc
hart
rain
Flo
rida
Bay
Upp
er L
agun
a M
adre
Baf
fin B
ayLo
wer
Lag
una
Mad
re
Mis
siss
ippi
R
iver
Plu
me
Cor
pus
Chr
isti
Bay
San
Fra
ncis
co B
ay
Tiju
ana
Est
uary
New
port
Bay
Yor
k R
iver
Tan
gier
/Poc
omok
e S
ound
s
Long
Isla
nd S
ound
Gar
dine
rs B
ay
Gre
at S
outh
Bay
St.
Cro
ix R
iver
/Cob
scoo
k B
ay
Eng
lishm
an B
ay
Nar
ragu
agus
Bay
She
epsc
ot B
ay
Cas
co B
ay
Tom
ales
Bay
Elk
horn
Slo
ugh
Pam
lico/
Pun
go R
iver
s
St.
John
s R
iver
Cal
casi
euLa
ke
Tam
pa B
ay
Sar
asot
a B
ay
Cha
rlotte
Har
bor
Cal
oosa
hatc
hee
R.
Gal
vest
on B
ay
Cho
ctaw
hatc
hee
Bay
San
Ant
onio
Bay
New
Riv
er
Sou
th T
en T
hous
and
Isla
nds
Hoo
d C
anal
Sou
th P
uget
S
ound
Hig
h L
evel
s o
f E
xpre
ssio
n o
f E
utr
op
hic
Co
nd
itio
ns
Per
dido
Bay
Fort
y-fo
ur e
stua
ries
alo
ng a
ll of
the
nat
ion’
s co
asts
wer
e as
sess
ed b
y w
orks
hop
part
icip
ants
as
show
ing
high
exp
ress
ions
of e
utro
phic
con
diti
ons.
The
Mid
dle
Atl
anti
c an
d G
ulf o
f Mex
ico
have
the
high
est p
erce
ntag
es o
f est
uari
es w
ith
high
eut
roph
ic c
ondi
tion
s. T
he P
acifi
c an
d So
uth
Atl
anti
c re
gion
sco
ntai
n th
e hig
hest
per
cent
age o
f est
uari
es th
at la
ck su
ffici
ent i
nfor
mat
ion
to c
onfid
entl
y as
sess
eutr
ophi
c co
ndit
ions
. A
n ad
diti
onal
fort
y es
tuar
ies (
not
show
n) h
ave
mod
erat
e le
vels
of e
utro
phic
con
diti
ons.
Note: Conditions are not necessarily related in whole to human-related eutrophication; to various degrees natural causes and other human disturbancesmay also play a role. For instance, some estuaries in Maine are typified by natural occurrences of toxic algae, which drift in from the open ocean. Once in theestuary, however, these blooms may be sustained by human nutrient inputs.
Figure 7. Estuaries with high levels of expression of eutrophic conditions
Est
uarie
s in
thi
s ca
tego
ry e
xhib
it va
ryin
g co
mbi
natio
ns o
f eu
trop
hic
sym
p-to
ms,
incl
udin
g hi
gh e
xpre
ssio
ns o
f ch
loro
phyl
l a,
mac
roal
gal a
bund
ance
prob
lem
s, e
piph
yte
abun
danc
e pr
oble
ms,
low
dis
solv
ed o
xyge
n, n
uisa
nce
and
toxi
c al
gal
bloo
ms,
and
los
s of
sub
mer
ged
aqua
tic v
eget
atio
n. T
ypi-
cally
, thi
s m
eans
that
one
or
mor
e of
thes
e sy
mpt
oms
occu
r ov
er la
rge
ar-
eas
of th
e es
tuar
y, a
nnua
lly o
r pe
rsis
tent
ly, a
nd/o
r fo
r lo
ng d
urat
ions
.
EXHIBIT 21 (AR L.30)

11
National Overview
Chlorophyll a is a measure used to indicate the amount ofmicroscopic algae, called phytoplankton, growing in a wa-ter body. High concentrations are indicative of problemsrelated to the overproduction of algae.
Epiphytes are algae that grow on the surfaces of plants orother objects. They can cause losses of submerged aquaticvegetation by encrusting leaf surfaces and thereby reduc-ing the light available to the plant leaves.
Macroalgae are large algae, commonly referred to as “sea-weed.” Blooms can cause losses of submerged aquatic veg-etation by blocking sunlight. Additionally, blooms may alsosmother immobile shellfish, corals, or other habitat. Theunsightly nature of some blooms may impact tourism dueto the declining value of swimming, fishing, and boatingopportunities.
Low dissolved oxygen occurs as a result of large algalblooms that sink to the bottom and use oxygen during theprocess of decay. Low dissolved oxygen can cause fish kills,habitat loss, and degraded aesthetic values, resulting in theloss of tourism and recreational water use.
Losses of submerged aquatic vegetation (SAV) occur whenlight is decreased due to turbid water associated with over-growth of algae or as a result of epiphyte growth on leaves.The loss of SAV can have negative effects on the ecologicalfunctioning of an estuary and may impact some fisheriesbecause the SAV beds serve as important habitat.
Nuisance and toxic algal blooms are thought to be causedby a change in the natural mixture of nutrients that occurswhen nutrient inputs increase over a long period of time.These blooms may release toxins that kill fish and shellfish.Human-health problems may also occur due to the consump-tion of seafood that has accumulated algal toxins or from theinhalation of airborne toxins. Many toxic algal blooms occurnaturally; however, the role of nutrient enrichment is unclear.
Common Symptoms of Eutrophication
Figure 8. Level of expression of symptoms within each overall category of eutrophic condition
levels of eutrophic conditions, meaning that symp-toms were not observed at problem levels or thatproblem conditions occurred infrequently or onlyunder specific and unusual circumstances. Abouthalf of these estuaries were located in the South At-lantic and Pacific regions.
In more than 80 percent of estuaries with high andmoderate levels of eutrophic conditions, the assess-ment confidence was high; conversely, confidencewas high in fewer than half of the systems assessedas having low eutrophic conditions. Most of the es-tuaries with low confidence are located in the Pa-cific and South Atlantic regions.
Symptoms: Common Signs of Eutrophication. Theimmediate response to nutrient inputs is the over-growth of algae. The primary symptoms of increasednutrient concentrations in the water column are highlevels of chlorophyll a, epiphytes, and/ormacroalgae (see sidebar, right). It is thought that onceprimary symptoms are observed at high levels, anestuary is in the first stages of displaying undesir-able eutrophic conditions.
High expressions of chlorophyll a occurred in 39 es-tuaries, high expressions of macroalgal abundanceoccurred in 24 estuaries, and high expressions of epi-phyte abundance occurred in 11 estuaries (see Fig-ure 8 for an accounting of symptom expression bro-ken down by eutrophic condition category). Over-all, at least one of these primary symptoms was ex-pressed at high levels in 58 estuaries. In some cases,high levels may be natural, but this observation in-dicates that 40 percent of the nation’s estuaries maybe in the first stages of developing problems associ-ated with eutrophication. On a regional basis, epi-
10 20 30 40
Chlorophyll a
Epiphyte Abundance
Macroalgal Abundance
Low Dissolved Oxygen
Submerged Aquatic
Vegetation Loss
Nuisance/Toxic Algae
10 20 30 40 10 20 30 40
Prim
ary
Sym
ptom
sS
econ
dary
Sym
ptom
s
High Moderate Low
High Eutrophic Conditions(44 Estuaries)
Moderate Eutrophic Conditions(40 Estuaries)
Low Eutrophic Conditions(38 Estuaries)
50Number of Estuaries Number of Estuaries Number of Estuaries
Symptom Expression
EXHIBIT 21 (AR L.30)

12
National Overview
phyte problems occurred mainly in Gulf of Mexicoestuaries, while higher levels of chlorophyll a andmacroalgae were observed in estuaries of all regions(Figure 9).
While high levels of primary symptoms are strongindicators of the onset of eutrophication, the second-
Figure 9. Expression of eutrophic symptomsThese maps depict estuaries with moderate to high levels of expression of eutrophic symptoms, indicating areas of possibleconcern. Note that these symptoms are not necessarily related in whole to human-related nutrient inputs; natural causes andother human disturbances may also play a role, to various degrees, in the expression of symptoms.
ary symptoms, which include low dissolved oxygen,the loss of submerged aquatic vegetation, and theoccurrence of nuisance and toxic blooms, indicatemore serious problems, even at moderate levels.Note that while there is a direct causative link be-tween nutrients and primary symptoms, there aremany other factors, both natural and human related,
A
A A
A A
A
Primary Symptoms Secondary Symptoms
Chlorophyll a Low Dissolved Oxygen
MacroalgalAbundanceProblems
EpiphyteAbundanceProblems
Nuisance and/orToxic Algal Bloom
Problems
Submerged AquaticVegetation Loss
EXHIBIT 21 (AR L.30)

13
National Overview
More than half of U.S. estuaries havemoderate to high expressions of at leastone of the secondary symptoms. Thisfinding is important because these symp-toms can have serious consequences, in-cluding negative impacts on commercialfish yields, degraded recreational oppor-tunities, increased risks to human health,and adverse affects on tourism.
that may contribute to the occurrence of secondarysymptoms.
Depleted dissolved oxygen was expressed at mod-erate or high levels in 42 estuaries. Twenty-seven es-tuaries had moderate or high levels of submergedaquatic vegetation loss, and 51 estuaries exhibitedmoderate or high nuisance/toxic algal blooms (Fig-ures 8 and 9). Overall, moderate or high levels of atleast one secondary symptom was observed in 82estuaries, representing 67% of the nation’s estuarinesurface area—an indication that eutrophication iswell developed and is potentially causing seriousproblems in more than half of U.S. estuaries. Thesecondary symptoms were restricted regionally, withthe exception of nuisance and toxic blooms, whichwere observed in systems along all coasts. Losses ofsubmerged aquatic vegetation were mostly limitedto the Gulf of Mexico and Middle Atlantic regions,
This crab could not survive in the anoxic zone near the mouthof the Mississippi River. Photo courtesy of Nancy Rabalais,courtesy of the National Undersea Research Program.
and low dissolved oxygen was observed mainly inthe Gulf of Mexico, Middle Atlantic, and South At-lantic regions. These geographical differences maybe useful for developing regionally specific indica-tors that are more sensitive than the nationally ap-plied model used here.
Completing the PictureThese results provide a picture of the overalleutrophic conditions in the nation’s estuaries andthe specific symptoms that occur. Nevertheless,questions remain, such as: What factors influencethe development of these symptoms? What types ofuse impairments do these symptoms cause? Whatare the management implications? At the NationalAssessment Workshop, the Core Group used dataand information about estuarine susceptibility andhuman-related nutrient inputs, which, together, pro-vided the basis for evaluating the overall human in-fluence on these conditions. Participants reliedheavily on their experience and prior knowledge toevaluate estuarine-use impairments and potentialmanagement targets. The data for these ancillary as-sessments were not as robust, and were less rigor-ously reviewed, than the Eutrophication Surveydata, and some findings were inconclusive. This in-formation was included, however, because it helpedto complete the national picture.
Influencing Factors. In an effort to determine thelevel of human influence on the development ofeutrophication, workshop participants consideredthe overall eutrophic condition with respect to nu-trient inputs and estuarine susceptibility to retainnutrients. Figure 10 (next page) shows the input dataseparately from the susceptibility data, as well asthe aggregated results, which represent the overalllevel of human influence. Although both phospho-rus and nitrogen cause nutrient enrichment prob-lems in estuaries, at the time of the AssessmentWorkshop, national-level information was availableonly for nitrogen inputs. For this reason, nitrogenvalues were used as the primary estimates of nutri-ent inputs, and information on population densityand land use was used as a general indicator of nu-trient pressure to help account for phosphorus andcorroborate nitrogen estimates. The nitrogen inputestimates were based on watershed monitoring datafrom the U.S. Geological Survey, as produced by theSPARROW model (Smith et al., 1997).
While these data were variable and did not showdistinct groupings, some generalizations could bemade. Many estuaries assessed as having high lev-els of overall eutrophic conditions also had high sus-ceptibility and moderate to high levels of nutrient
EXHIBIT 21 (AR L.30)

14
National Overview
inputs. These estuaries are very sensitive to nutri-ent inputs, and as a result, many were assessed ashaving a high level of human-related influence onthe development of eutrophic conditions. The con-verse also seems to hold true; that is, most estuarieswith low susceptibility and low inputs of nutrientshad a low overall level of eutrophic conditions. Theseestuaries are less sensitive to development ofeutrophic conditions even with human related nu-trient inputs.
The assessment results highlight these generaliza-tions; of the 44 estuaries with high levels of eutrophicconditions, workshop participants assessed 36 ashaving a high level of human influence on the de-velopment of conditions. It is important to note thata common feature of these estuaries was high or
moderate susceptibility. It is also noteworthy thatmost of the 44 estuaries have moderate, not high (asin only six of the estuaries), levels of nutrient inputs.In estuaries with high or moderate susceptibility,even a moderate level of nutrient input may be suf-ficient to cause serious eutrophic symptoms. In thesesystems, natural estuarine characteristics, such aslow tidal exchange, enhance the expression of symp-toms. Most of these estuaries were located in theGulf, Middle Atlantic, and Pacific regions.
In contrast, 38 estuaries exhibited low overalleutrophic conditions. The common traits of theseestuaries were lower susceptibility and lower nitro-gen inputs; 31 of these estuaries had moderate orlow nitrogen inputs, and 28 had moderate or lowsusceptibility. In these systems, natural characteris-
Figure 10. Influencing factors on the expression of eutrophic conditions
Estuarine Susceptibility
The estuarine susceptibility estimates are based on estuarineflushing and dilution capacity - freshwater inflow, tidal flush-ing, and degree of stratification. These characteristics influ-ence the transport and fate of nutrients in coastal water bod-ies, and help to determine the susceptibility of an estuary toretain nutrients. These data were derived from national datasets contained in NOAA’s Coastal Assessment and Data Syn-thesis system.
Overall Human Influence
An estimation of the overall level of human influence on theexpression of eutrophic conditions was determined for eachestuary by combining estuarine susceptibility estimates withindicators of nutrient pressure. Although nitrogen input wasused as the primary indicator of nutrient pressure, workshopparticipants made appropriate modifications to the overallnutrient pressure assessment, based on analysis of popula-tion density and land use data as general nutrient pressureindicators.
Nitrogen Inputs
Nitrogen yield estimates, adapted from USGS’s SPARROWmodel, characterize the level of nitrogen inputs to estuariesfor five major nutrient source types: point sources, fertilizer,livestock, atmospheric deposition, and nonpoint/nonagricul-tural. These data provide a rough snapshot estimation of ni-trogen input conditions for 1987.
At the National Assessment Workshop, an attempt was made to characterize the natural conditions and human activities that influence theexpression of eutrophic conditions in the nation’s estuaries. The purpose was to develop an understanding of why eutrophic conditions differamong estuaries and to provide a basis for guiding management responses to problems. These figures indicate that the response to a givenlevel of nutrient is highly variable and is primarily due to differences among estuarine susceptibility to nutrients. Some estuaries are sosusceptible that only small amounts of additional nutrients will cause problems, while others can seemingly take in large quantities and stilldisplay few eutrophic symptoms (but may pass the nutrients on to other receiving bodies downstream).
9 85
19 19
13
1013
25
Suscep
tibili
ty
Eutrophic Condition
Low Moderate High
High
Moderate
Low
Num
ber
of E
stua
ries
16
1213
15
22 22
4 36
Eutrophic Condition
Nitrogen
Input
Low Moderate High
High
Moderate
LowNum
ber
of E
stua
ries
21(14)
10(2)
6(0)
7(4)
19(10)
2 (1)8(4)
11(2)
36(5)
Low Moderate High
Eutrophic ConditionOvera
ll Human In
fluence
High
Moderate
Low
Num
ber
of E
stua
ries
(parentheses i
ndicate fra
ction
of total w
ith lo
w confid
ence)
EXHIBIT 21 (AR L.30)

15
National Overview
Most estuaries with high eutrophicconditions also have high levels of hu-man influence due to a combination ofmoderate to high nutrient inputs andnatural susceptibility.
tics appeared to suppress the expression of symp-toms. It should be noted, however, that 10 of the es-tuaries with low eutrophic conditions exhibited highsusceptibility.
It is important to note that although these generali-zations can be made, the relationships between nu-trient inputs and the expression of symptoms, orbetween susceptibility and the expression of symp-toms (Figure 10), are not entirely predictable. For in-stance, not all of the 44 estuaries with high eutrophicconditions had high nutrient inputs and high sus-ceptibility, though most did follow this general rule.There were exceptions, including six estuaries as-sessed with high levels of eutrophic conditions andlow human influence. Five of these are located inthe North Atlantic region, where susceptibility is lowdue to tidal ranges greater than six feet, and nitro-gen inputs are generally low due to low populationdensities and densely forested watersheds. The over-all eutrophic conditions in some of these estuarieswere assessed as high because toxic blooms occurredeach year; these events were natural, however, origi-nating offshore and then drifting into the estuaries.Once a bloom has reached an estuary, it is possiblethat land-based nutrients maintain it.
Impaired Uses Relative to Symptoms. The findingthat more than half of the nation’s estuaries havemoderate to high expressions of at least one second-ary symptom of eutrophication is of considerableimportance, because these symptoms may nega-tively impact estuarine resources in a variety of ways
(Figure 11). For instance, losses in the nation’s fish-ery resources may be directly caused by fish killsassociated with low dissolved oxygen and toxicblooms. Declines in tourism occur when low dis-solved oxygen causes noxious smells and floatingmats of algae create unfavorable aesthetic conditions.Risks to human health increase when the toxins fromalgal blooms accumulate in edible fish and shellfish,and when toxins become airborne, causing respira-tory problems due to inhalation. This report doesnot directly address economic losses, however, sea-
sonal economies may suffer wheneutrophic symptoms occur duringthe height of the tourist and/orfishing seasons. The cost of imple-menting strategies to reduce nitro-gen inputs may also be consider-able. For example, the U.S. Environ-mental Protection Agency’s LongIsland Sound Study reported in1998 that the potential cost of re-ducing nitrogen levels from pointsources alone (70 treatment plants)in the Long Island Sound water-shed would be about $2.5 billion.
The magnitude of estuarine im-pacts cannot currently be quanti-
Shellfishing is a typical impaired estuarine use. Photo courtesyof Zoe Rasmussen, Puget Sound Water Quality Action Team.
Figure 11. Number of estuaries with resources impaired for human use
Pacific 12 0 11 4 0 5 0
Gulf of Mexico 11 5 12 4 1 4 10
South Atlantic 8 3 3 1 1 0 2
Middle Atlantic 12 0 9 6 2 8 2
North Atlantic 0 0 11 0 1 0 0
National 43 8 46 15 5 17 14
Region
Com
mer
cial
/Rec
reat
iona
l F
ishi
ng
Fis
h Consumption
She
llfis
h
Sw
imm
ing
Boa
ting
Aes
thet
ics
Tou
rism
Num
ber
of
Est
uarie
s W
ith
Impa
ired
Use
s
12
16
9
19
13
69
EXHIBIT 21 (AR L.30)

16
National Overview
Experts at the National AssessmentWorkshop predicted that more thanhalf of the nation’s estuaries are likelyto develop worsening eutrophic condi-tions during the next 20 years.
fied; however, eutrophication experts at the NationalAssessment Workshop identified estuarine uses thatthey knew or suspected to be impaired because ofeutrophic symptoms (Figure 11). Although this in-formation is qualitative, it is still useful in under-standing the nature of impaired uses on a nationalbasis. In all, some type of use impairment was iden-tified in 69 estuaries. The most frequently reportedimpairments were to commercial fishing and shell-fish harvesting. Considered regionally, fishing and/or shellfishing impairments were reported for allcoasts. Other frequently reported impairments wereaesthetics in the Middle Atlantic, and tourism in theGulf of Mexico region. The loss of assimilativecapacity—the ability of an estuary to receive nutri-ents without exhibiting symptoms—also appears tobe important, particularly in the South Atlantic.
Recommended Management Actions. The generalworkshop recommendation is for authorities to man-age from a watershed perspective, focusing on con-trollable sources of nutrients and on strategies tai-lored to individual watershed characteristics in or-der to maximize potential improvements. This is es-pecially important, given that nutrient-control strat-egies may not be universally applicable across geo-graphic regions. The individually tailored manage-ment plans should also take into account overalleutrophic conditions and the factors influencing thelevel of expression in each estuary, so that effortscan focus on estuaries that will benefit the most fromnutrient controls. For instance, the 23 estuaries withhigh expression of eutrophic conditions and highsusceptibility (which represent about 10% of the na-tional estuarine surface area studied) will likely re-quire greater management efforts and a longer re-sponse time for results, than those estuaries with low
susceptibility. In contrast, the 10 estuaries with loweutrophic conditions and high susceptibility (about3% of national estuarine area) should be prioritiesfor preventive management.
On a national basis, the most frequently recom-mended management targets were agriculture,wastewater treatment, urban runoff, and atmo-spheric deposition (Figure 12). Although previousmanagement efforts have targeted point sources,they were still one of the top three targets recom-mended. In all regions except the North Atlantic,however, nonpoint sources are the primary focus,representing 60 percent of the recommended targets.Agriculture was the most frequently recommendedtarget for the Pacific, Gulf of Mexico, and South At-lantic regions; wastewater treatment plants were im-portant in the North Atlantic; and agriculture andatmospheric sources were most frequently recom-mended in the Middle Atlantic. Notable among thepoint sources were combined sewer overflows, spe-cifically in the North Atlantic, and wastewater treat-ment plants in all regions. Of the nonpoint sources,atmospheric deposition was among the most fre-quently recommended targets, but was noted almostexclusively for the Gulf of Mexico and Middle At-lantic regions. Another important nonpoint sourceidentified as needing management action in theSouth Atlantic and Gulf of Mexico were large ani-
mal production facilities.
Future Outlook to 2020. At the NationalAssessment Workshop, projections weremade to predict what might happen toU.S. estuaries in the future. The futureoutlook was based on predictions ofpopulation growth and expert knowl-edge of specific management and de-velopment activities that are plannedfor the watersheds. Past trends werealso considered, to varying degrees,for this determination (for the mostpart, this information was not explic-itly dealt with at the Workshop; seesidebar, page 18). The future outlookassessment (Figure 13) indicates thatoverall eutrophic conditions willworsen in 86 estuaries, stay the samein 44, and improve in only eight estu-
Figure 12. Sources that experts at the National Assessment Workshop identified asmost important targets to manage nutrient inputs
Region
Was
te W
ater
T
reat
men
t Pla
nts
Com
bine
dS
ewer
Ove
rflo
w
Ons
ite D
ispo
sal
Indu
stry
Ani
mal
O
pera
tions
Urb
an
Agr
icul
ture
For
estr
y
Ran
ge
Atm
osph
eric
Pacific 11 0 5 1 0 7 14 3 0 0
Gulf of Mexico 11 0 2 9 5 11 15 1 5 11
South Atlantic 8 0 2 3 4 12 13 5 0 0
Middle Atlantic 8 1 3 0 1 5 12 0 0 12
North Atlantic 11 7 0 0 0 2 1 0 0 1
National 49 8 12 13 10 37 55 9 5 24
EXHIBIT 21 (AR L.30)

17
National Overview
Bos
ton
Har
bor
Che
sape
ake
Bay
Mai
nste
m
Bar
nega
t Bay
Pat
uxen
t Riv
er
Pot
omac
Riv
erLa
ke
Pon
tcha
rtra
in
Flo
rida
Bay
Upp
er L
agun
a M
adre
Baf
fin B
ay
Low
er L
agun
a M
adre
Mis
siss
ippi
R.
Plu
me
Cor
pus
Chr
isti
Bay
San
Fra
ncis
co B
ay Tiju
ana
Est
uary
San
Die
go B
ayM
issi
on B
ay
New
port
Bay
San
Ped
ro B
ayA
nahe
im B
ay
Yor
k R
iver
Tan
gier
/Poc
omok
e S
ound
s
New
Jer
sey
Inla
nd B
ays
St.
Cro
ix R
iver
/
Cob
scoo
k B
ay
Blu
ehill
Bay
Dam
aris
cotta
Riv
er
Dra
kes
Est
ero
Tom
ales
Bay
Pug
et S
ound
Hoo
d C
anal
Whi
dbey
Bas
in/S
kagi
t Bay
S. P
uget
Sou
nd P
ort O
rcha
rd S
yste
m
Mon
tere
y B
ay
Alb
emar
le S
ound
St.
John
s R
iver
Cal
casi
euLa
ke
Suw
anne
e R
iver
Sar
asot
a B
ay
Cha
rlotte
Har
bor
Cal
oosa
hatc
hee
R.
Apa
lach
icol
a B
ay
Gal
vest
on B
ay
Cho
ctaw
hatc
hee
Bay
Pen
saco
la B
ayP
erdi
do B
ay
San
Ant
onio
Bay
Cha
rlest
on H
arbo
r
Nor
th T
en T
hous
and
Isla
nds
Sou
th T
en T
hous
and
Isla
nds
Gre
at B
ayH
ampt
on H
arbo
r
Plu
m Is
land
Sou
nd
Mas
sach
uset
ts B
ay
Cas
co B
ay
Rap
paha
nnoc
k R
iver
Jam
es R
iver
Che
ster
Riv
er
Cho
ptan
k R
iver
Mar
ylan
d In
land
Bay
s
Chi
ncot
eagu
e B
ay
Sav
anna
h R
iver
Oss
abaw
Sou
nd
St.
Cat
herin
es/S
apel
o S
ound
s
St.
And
rew
/St.
Sim
ons
Sou
nds
Bis
cayn
e B
ay
Alta
mah
a R
iver
St.
Mar
ys R
iver
/Cum
berla
nd S
ound
Indi
an R
iver
Bro
ad R
iver
Bog
ue S
ound
New
Riv
er
St.
Hel
ena
Sou
ndA
pala
chee
B
ay
St.
And
rew
B
ay
Bre
ton/
Cha
ndel
eur
Sou
nds
Mer
men
tau
Est
uary
Ter
rebo
nne/
Tim
balie
r B
ays
Mat
agor
da B
ay
Eel
Riv
er
Gra
ys H
arbo
rW
illap
a B
ay
Coq
uille
Riv
erR
ogue
Riv
er
Siu
slaw
Riv
erU
mpq
ua R
iver
Coo
s B
ay
Sile
tz B
ayY
aqui
na B
ayA
lsea
Riv
er
Neh
alem
Riv
erT
illam
ook
Bay
Net
arts
Bay
Bel
lingh
am/P
adill
a/S
amis
h B
ays
Seq
uim
/Dis
cove
ry
Bay
s
Wor
sen
Impr
ove
Con
ditio
ns E
xpec
ted
To:
Fu
ture
Eu
tro
ph
icat
ion
Tre
nd
s (2
020)
Figure 13. Expected trends in eutrophication through 2020
Exp
erts
at t
he N
atio
nal A
sses
smen
t Wor
ksho
p de
term
ined
that
con
diti
ons
are
expe
cted
to w
orse
n in
mor
e th
an h
alf o
f the
nat
ion’
s es
tuar
ies,
and
alo
ng a
llof
the
coas
ts, b
y 20
20. H
owev
er, t
he e
xper
ts c
auti
oned
that
unc
erta
inty
is in
here
nt in
thes
e pr
edic
tion
s an
d th
at th
ey m
ay b
e un
duly
pes
sim
isti
c. A
num
ber
of fa
ctor
s th
at a
ffect
eut
roph
ic c
ondi
tion
s m
ay c
hang
e ov
er t
ime,
mak
ing
it d
iffic
ult
to p
redi
ct w
ith
subs
tant
ial c
erta
inty
the
ult
imat
e ef
fect
of p
opul
atio
ngr
owth
on
nutr
ient
load
ings
and
the
subs
eque
nt e
xpre
ssio
n of
eut
roph
ic c
ondi
tion
s in
est
uari
es.
Eac
h sy
mbo
l rep
rese
nts
expe
cted
cha
nges
in th
e ex
-pr
essi
on o
f eu
trop
hica
tion
cond
ition
s by
202
0. A
b-se
nce
of a
sym
bol i
ndic
ates
no
expe
cted
cha
nge
from
curr
ent
cond
ition
s. P
redi
ctio
ns a
re b
ased
prim
arily
on p
roje
cted
pop
ulat
ion
grow
th, c
oupl
ed w
ith s
usce
p-tib
ility
to n
utrie
nt in
puts
.
EXHIBIT 21 (AR L.30)

18
National Overview
The assessment of symptom trends (ca. 1970to 1995) was based on data from NOAA’s Es-tuarine Eutrophication Survey. These data areless certain, and the assessments were less rig-orously reviewed at the National AssessmentWorkshop. For 51 estuaries, data was insuffi-cient to assess trends.
A greater number of estuaries were reportedto have worsening conditions for chlorophylla, epiphytes, macroalgae, nuisance blooms,toxic blooms, and submerged aquatic vegeta-tion loss, than the number of estuaries forwhich conditions improved. For dissolved oxy-gen, conditions improved in more estuariesthan those that worsened. Overall, eutrophicconditions worsened in 48 estuaries and im-proved in 14. In 26 systems, there was no trendin overall eutrophic conditions since 1970. Mostof the estuaries that showed overall improve-ment were located in the Gulf of Mexico. Thegreatest number of estuaries in which condi-tions worsened were in the Gulf of Mexico andMiddle Atlantic regions.
Worsening trends have been attributed to ageneral increase in population density in es-tuarine watersheds. Some of these estuaries arehistorically rural, with farming and urban de-velopment intensifying concurrently. Notably,recent toxic blooms in the Middle Atlantic andSouth Atlantic regions are thought to be linkedto the increase in confined animal operationsand the release of untreated animal wastes intolocal water bodies. Successes have also beenreported, with improvements in water qualityover time. These trends are attributed to theimplementation of strategies that primarilyreduce point sources, as mandated by the CleanWater Act. In addition, some of the NationalEstuary Program estuaries, such as Tampa andSarasota Bays, are good examples of success-ful nutrient-reduction strategies that have re-versed eutrophic conditions.
Past Trends in Eutrophication
In 17 estuaries, there was insufficient datato assess overall eutrophic conditions:
Merrimack RiverAlbemarle SoundPamlico SoundSt. Helena SoundLake BorgneSanta Monica BayDrakes EsteroRogue RiverCoquille River
Coos BayUmpqua RiverSiuslaw RiverAlsea RiverSiletz BayNetarts BayTillamook BayNehalem River
aries during the next 20 years. At present, overalleutrophic conditions are moderate to low in 43 of theestuaries that are predicted to worsen; conditions areunknown in 12 additional estuaries predicted toworsen. The 10 estuaries that currently exhibit loweutrophic conditions, and are highly susceptible, areat particular risk of developing worsening conditionsif nutrient inputs increase. Most of the estuaries withnegative outlooks are located in the Pacific and Gulfof Mexico regions. These predictions tend to mirror
historic trends; over time, more estuaries have experi-enced worsening conditions.
Data Gaps and Research NeedsThe greatest need is for data that better characterizethe levels of eutrophic symptoms in estuaries. For 17estuaries, there is insufficient information to assessconditions, and for many more (31), the assessmentreliability is low due to limited or uncertain data. Theseestuaries represent 25% of the nation’s estuarine area.Physical processes and levels of nutrient inputs alsoneed to be better characterized, so that causal link-ages can be made and used to develop appropriatemanagement plans.
Process-oriented research is needed to improve un-derstanding of the mechanisms involved in the pro-gressive development of eutrophication. For example,little is known about “thresholds,” such as the level ofnutrient inputs above which toxic blooms will flour-ish. Research must be done to improve the understand-ing of historically higher levels of biological grazingas a controlling mechanism, and of the ways in whichthe decline of this mechanism affects the rate of de-velopment of eutrophic symptoms. The influence ofphosphorus and other nutrients as contributors toeutrophication, relative to nitrogen, also needs furtherclarification. Climate change, specifically global warm-ing, will affect water levels, circulation, temperatureand salinity, all of which will have an effect on thesusceptibility of estuaries, and, thus, the potential de-velopment of symptoms. Finally, the combined effectsof nutrient inputs and other pollutant stressors on thehealth of estuaries should be investigated. All of thisinformation should be used to develop predictivemodels that will enhance and ensure effective man-agement actions.
EXHIBIT 21 (AR L.30)

19
This section focuses on five major regions of the coterminous U.S. It highlights regional differences in overall eutrophic condi-tions; the factors influencing the development of these conditions; the associated impairments to human uses of estuarine re-sources; the future outlook; and the priorities for management, data and research. Differences between regions occur due tovariations in estuarine susceptibility in combination with the level of nutrient inputs reaching estuarine waters. In some re-gions, the climate, shoreline structure, coastal topography, and circulation and flushing patterns are similar across the entireregion, and its estuaries respond similarly, for the most part, to nutrient inputs. In other regions, these characteristics varygreatly among estuaries, and identifiable subregional differences occur in response to inputs. Therefore, in addition to regionalsummaries, detailed results are provided for each of the 138 estuaries and the Mississippi River Plume. To facilitate comparisonamong the regions, brief descriptions are provided of physical settings, general land-use characteristics and the locations ofmajor population centers. Also provided are confidence levels for the assessments.
Eutrophic Conditions and Expression of Symptoms.The overall eutrophic condition is a reflection of thecombined levels of expression of six individualsymptoms: three primary symptoms (chlorophyll a,epiphyte abundance, and macroalgal abundance)and three secondary symptoms (dissolved oxygenconditions, loss of submerged aquatic vegetation,and the occurrence of nuisance/toxic algal blooms).Each estuary received an overall rating, as well asratings for the level of impact of each individualsymptom. The overall eutrophic condition, and thelevel of impact for each individual symptom, arecharacterized as high, medium, or low. In addition,improving symptoms, as indicated by the most recenttrend direction, are noted with an upward-pointingarrow. A summary table is provided to facilitate com-parison of the individual symptom levels with theoverall level of eutrophic condition (Figures 16, 19,22, 25, 28).
Data Quality. The level of confidence in the assess-ment of eutrophic conditions was determined foreach estuary characterized in this report and wasbased on the temporal and spatial representative-ness of the data. Figure 14 illustrates the varying con-fidence levels among the five regions. There are 17
estuaries for which an assessment of overalleutrophic condition was not possible due to insuffi-cient information (see box, page 18). Whenever pos-sible, information on individual symptoms was pro-vided for these estuaries.
Factors Influencing Eutrophic Conditions. Partici-pants at the National Assessment Workshop com-bined nitrogen input estimates with susceptibilityvalues for each estuary to determine the overall in-fluence of human activities on the development ofeutrophic conditions. The overall human influenceis characterized as high, moderate or low. A sum-mary table facilitates the comparison of individualand overall influencing factors with the severity ofeutrophic conditions (Figures 17, 20, 23, 26, 29).
Impaired Uses in Estuaries. Experts at the NationalAssessment Workshop identified general impair-ments due to eutrophic conditions within estuaries.The regional assessments highlight this information.
Future Outlook on Eutrophic Conditions. When con-sidering the outlook for 20 years hence, the expertsreviewed present conditions and inputs, historic con-ditions and inputs, and projections of future inputsbased primarily on projected population growth.Each regional map shows the estuaries in which con-ditions are expected to worsen or develop, and thosein which conditions are expected to improve. In otherestuaries, conditions are expected to remain thesame, or there is insufficient information with whichto make a prediction.
Management Concerns, Data and Research Needs.Workshop participants identified management tar-gets, data gaps, and research needs for each estuary.
Figure 14. Eutrophication Assessment Confidence Levels
Regional Summaries
5
10
15
20
25
30
35
North Atlantic
Middle Atlantic
South Atlantic
Gulf of Mexico
Pacific
Nu
mb
er o
f E
stu
arie
s
Level
High
Medium
Low
Confidence
EXHIBIT 21 (AR L.30)

20
North AtlanticNorth Atlantic
2
3
45
67
8
9
10
11
12
13
14
15
1617
18
Eutrophic Conditions and Trends
?
?
1. St. Croix R./Cobscook Bay2. Englishman Bay3. Narraguagus Bay4. Blue Hill Bay5. Penobscot Bay6. Muscongus Bay7. Damariscotta River8. Sheepscot Bay9. Kennebec/Androscoggin R.10. Casco Bay11. Saco Bay12. Great Bay13. Hampton Harbor Estuary14. Merrimack River15. Plum Island Sound16. Massachusetts Bay17. Boston Harbor18. Cape Cod Bay
1
Figure 15. Level of expression of eutrophic conditions and future trends
More than half of the North Atlantic estuaries have moderate to high eutrophic conditions, as assessed by work-shop participants. Only a few, however, have a substantial level of human influence. The major nutrient source formost North Atlantic estuarine and coastal systems is from offshore coastal waters; consequently, many of theeutrophic symptoms expressed in the region are thought to be primarily natural conditions, especially for chloro-phyll a concentrations and toxic algae. Additionally, the high degree of tidal flushing and low freshwater inputscharacteristic of many of the systems tend to minimize impacts due to human-related nutrient inputs. Futureincreases in nutrient inputs are likely to exacerbate some of these naturally occurring conditions.
High: symptoms generally occur pe-riodically and/or over extensive area.
Moderate: symptoms generally oc-cur less periodically and/or overmedium area.
Low: few symptoms occur at morethan minimal levels.
Insufficient data for analysis
Worsen: symptoms are expected todevelop or become more pro-nounced by 2020.
Improve: symptoms are expectedto decline through 2020.
EXHIBIT 21 (AR L.30)

21
North Atlantic
Eutrophic ConditionsOverall Conditions. Moderate or higher levels ofeutrophic conditions occurred in more than half ofthe estuarine systems, with six being in the high cat-egory. Estuaries with these conditions were locatedalong the length of the coast, with estuaries exhibit-ing low eutrophic conditions interspersed betweenthem.
Expression of Symptoms. Close to half of the estu-aries exhibited at least one of the six symptoms athigh levels. For the primary symptoms, chlorophylla was expressed at moderate levels for a majority ofestuaries; macroalgal abundance problems occurredin almost half of the systems; and epiphyte prob-lems were minimal. For the secondary symptoms,moderate to high levels of nuisance/toxic bloomsoccurred in more than half of the systems; depleteddissolved oxygen occurred at low levels in more thanhalf, and losses of submerged aquatic vegetationwere minimal.
In general, for those systems with high eutrophicconditions, nuisance/toxic algal blooms and over-abundance of macroalgae were the principle symp-toms contributing to the observed overall condition.Moderate expression of chlorophyll a and low ex-pression of depleted dissolved oxygen were also ob-served in most of the systems with high eutrophicconditions, although these symptoms tended to oc-cur regardless of overall eutrophic condition.
The North Atlantic region includes 18 estuarine systems,encompassing roughly 2,000 square miles of water sur-face area. In the northern part of the region, the coastalshoreline consists mainly of drowned river valleys char-acterized by numerous small embayments, rocky shore-line, wave-cut cliffs, and large, rocky islands. The south-ern part of the region contains more cobble, gravel, andsand beaches, and tidal marshes are more extensive. Ahigh degree of tidal flushing and low freshwater input arecharacteristic of many of these systems. Major popula-tion centers, including Portland and Boston, are locatedin this southern portion.
Submerged aquatic vegetation improved in a few es-tuaries, largely due to replanting efforts as well as re-covery from wasting disease. In Casco Bay, improve-ments in levels of dissolved oxygen appeared to berelated to point-source controls and declining Atlan-tic Menhaden runs.
The confidence levels for the assessment of eutrophicconditions were low for four estuaries. Informationwas sparsest on trends in submerged aquatic veg-etation. There are less data for the Merrimack Riverestuary than for any other system in the region.
Influencing FactorsNutrient inputs from human sources are thought tobe high in only three North Atlantic estuarine sys-tems, primarily because freshwater inflow in the re-gion is generally low and drains from watershedswith sparse populations. Susceptibility to nutrientinputs is low in most systems because of the domi-nance of tidal flushing. As a result of the low nutri-ent inputs and low susceptibility, human influenceis generally very low in the region.
Of the six estuaries exhibiting high eutrophic con-
Figure 16. Eutrophic conditions and symptoms
The major nutrient source for manyNorth Atlantic estuarine and coastalsystems is from offshore coastal wa-ters. Consequently, many of theeutrophic symptoms expressed in theregion, such as toxic algal blooms, arethought to be primarily natural con-ditions.
Eut
roph
icC
ondi
tion
Kennebec/Androscoggin Rivers
Chl
orop
hyll
a
Epi
phyt
es
Mac
roal
gae
SA
V L
oss
Low
Dis
solv
edO
xyge
n
Nui
sanc
e/T
oxic
Blo
oms
Estuary
St. Croix River/Cobscook Bay
Englishman Bay
Narraguagus Bay
Blue Hill Bay
Penobscot Bay
Muscongus Bay
Damariscotta River
Sheepscot Bay
Casco Bay
Saco Bay
Great Bay
Hampton Harbor Estuary
Merrimack River
Plum Island Sound
Massachusetts Bay
Boston Harbor
Cape Cod Bay
?
?
?
?
?
?
??
? ? ? ? ?
Symptom Expression
Primary Secondary
No Expression
High Moderate Low Insufficient Data
?
ImprovingSymptom
EXHIBIT 21 (AR L.30)

22
North Atlantic
Potential Management ConcernsThe most frequently noted nutrient sources to tar-get for management efforts were wastewater treat-ment plants and combined sewer overflows. Urbanrunoff, agriculture, aquaculture, and atmospheric in-puts were also identified as sources of concern, butin relatively few estuaries.
Future Outlook to 2020By the year 2020, eutrophication symptoms are ex-pected to worsen in about one-third of the systems,primarily due to increased nutrient inputs frompopulation increases and the growth of the aqua-culture industry. Of these estuaries, St. Croix River/Cobscook Bay, Great Bay, and Plum Island Soundare expected to worsen the most. Conversely, CascoBay and Boston Harbor are expected to improve, toa limited extent.
The confidence levels for the assessment of the fu-ture outlook was low for two estuaries.
Data Gaps and Research NeedsSeveral estuaries were identified as requiring betterbaseline symptom data, although only four systemswere noted to have low confidence levels for assess-ment.
Important data and research needs generally includeimproved assessments of nutrient inputs from riv-ers, groundwater, and aquaculture; better under-standing of circulation dynamics; and improved es-timates of population growth and land use. For sys-tems with seasonal population changes, research isneeded to assess the effects of winter-summer popu-lation changes on eutrophic conditions.
ditions, only one, Boston Harbor, had high humaninfluences. Furthermore, according to expert consen-sus at the National and Regional Assessment Work-shops, offshore coastal waters are the major nutri-ent source for most estuarine systems in this region.Consequently, certain eutrophic symptoms, such astoxic algal blooms, are thought to be primarily natu-ral conditions. Human-related nutrient inputs, how-ever, may exacerbate these natural conditions.
The confidence level of the assessment of anthropo-genic influence was low for three estuaries.
Impaired UsesVery few uses of estuarine resources were identifiedas being impaired by eutrophication in this region.The impaired use of shellfish resources was the mostextensive problem identified; however, shellfish-areaclosures were attributed mainly to natural toxic al-gal blooms, which can lead to paralytic shellfish poi-soning in people. Minor problems were also notedfor boating.
Figure 17. Eutrophic conditions and influencing factors
Eut
roph
icC
ondi
tion
Moderate Low
Sus
cept
ibili
ty
Nitr
ogen
Inpu
t
Ove
rall
Hum
an
Influ
ence
Englishman Bay
Narraguagus Bay
Blue Hill Bay
Penobscot Bay
Muscongus Bay
Damariscotta River
Sheepscot Bay
Kennebec/Androscoggin Rivers
Casco Bay
Saco Bay
Great Bay
Hampton Harbor Estuary
Plum Island Sound
Massachusetts Bay
Boston Harbor
Cape Cod Bay
Merrimack River
Insufficient Data
Estuary
St. Croix River/Cobscook Bay
High
?
?
Influencing Factors
EXHIBIT 21 (AR L.30)

23
North Atlantic
A high degree of tidal flushing and low freshwater input, characteristic of many North Atlantic estuaries, tend to minimize impactsdue to human-related nutrient inputs. Photo courtesy of Miranda Harris, NOAA.
EXHIBIT 21 (AR L.30)

24
Middle Atlantic
1
2
34
5
67
8
9
10
11
12
13
14
15
16
17
18
19
20
21
22
1. Buzzards Bay2. Narragansett Bay3. Gardiners Bay4. Long Island Sound5. Connecticut River6. Great South Bay7. Hudson River/Raritan Bay8. Barnegat Bay9. New Jersey Inland Bays10. Delaware Bay11. Delaware Inland Bays12. Maryland Inland Bays13. Chincoteague Bay14. Chesapeake Bay15. Patuxent River16. Potomac River17. Rappahannock River18. York River19. James River20. Chester River21. Choptank River22. Tangier/Pocomoke Sounds
Eutrophic Conditions and Trends
?
High: symptoms generally occur pe-riodically and/or over extensive area.
Moderate: symptoms generally oc-cur less periodically and/or overmedium area.
Low: few symptoms occur at morethan minimal levels.
Insufficient data for analysis
Worsen: symptoms are expected todevelop or become more pro-nounced by 2020.
Improve: symptoms are expectedto decline through 2020.
Middle Atlantic
Figure 18. Level of expression of eutrophic conditions and future trends
In this region, the expression of high eutrophic conditions is extensive and the level of human influence is high.Eutrophic symptoms are widespread and likely have substantial impacts on many estuarine natural resources. Theexpression of pronounced eutrophic symptoms tends to be more pervasive in enclosed or river-dominated estuar-ies, while ocean-influenced systems exhibit fewer impacts. There are numerous ongoing efforts to control nutrientinputs; however, the ecological response to nutrient reductions is often slow in many of these systems, and conse-quently, the positive effects of these efforts may have yet to materialize. The widespread influence of atmosphericnutrient sources, together with rapid rates of development, pose a great challenge to the control of nutrient inputsand eutrophication.
EXHIBIT 21 (AR L.30)

25
Middle Atlantic
Eutrophic ConditionsOverall Conditions. Estuaries with moderate to higheutrophic conditions were widespread and evenlyspaced throughout the region, with close to half ofthe estuarine systems exhibiting high levels ofeutrophic conditions, and an additional five show-ing moderate conditions.
high expressions of primary symptoms. The fiveestuaries exhibiting moderate eutrophic conditionsdisplayed similar symptoms, except that the second-ary symptoms were somewhat less severe.
An improvement in at least one symptom is notedas the most recent trend in close to half of the estu-aries. Unfortunately, most of these improvements aremodest, and follow long periods of declining condi-tions. Improving trends are a positive sign that man-agement efforts are working; however, where con-ditions are moderate to high, there is still much roomfor improvement, and efforts at nutrient controlshould be maintained and fortified. In the Chesa-peake Bay and its tributaries, for example, sub-merged aquatic vegetation suffered severe declinesin the 1960s and 1970s, primarily as the result of nu-trient enrichment, and only recently have nutrientmanagement and other factors contributed to theslight improvement.
The Middle Atlantic region includes 22 estuarine sys-tems, encompassing more than 7,790 square miles of wa-ter surface area. Coastal areas are characterized by irregu-lar shorelines, wide, sandy beaches, numerous barrier is-land formations, and extensive salt marshes. Tides rangefrom one to six feet but generally fall within the lowerpart of the range. Tidal flushing is most dominant in thenorthern part of the region, while freshwater inflow ismore important in the Chesapeake Bay systems. Land useis characterized by large urban tracts and extensive agri-cultural areas. Major population centers include Provi-dence, Hartford, New York City, Philadelphia, Baltimore,Washington, D.C., and Richmond.
Figure 19. Eutrophic conditions and symptoms
The expression of severe eutrophicconditions tends to be more pervasivein enclosed or river-dominated estu-aries, while the more ocean-influencedsystems experience fewer impacts.
Expression of Symptoms. Well over half of the es-tuaries exhibited at least one of the six symptoms athigh levels. Of the primary symptoms, chlorophylla had the most pronounced expression, with highlevels in half of the estuaries and moderate levels inthe rest. Macroalgal abundance problems occurredin 10 estuaries, and in five of these at moderate tohigh levels. Epiphyte abundance problems occurredin more than one-quarter of the estuaries. Extensiveexpressions of secondary symptoms were also notedin the region. Depleted dissolved oxygen occurredin every estuary, although it tended to be expressedat low levels. Both submerged aquatic vegetationloss and nuisance/toxic algal blooms were problemsin more than half of the estuaries, primarily occur-ring at moderate to high levels.
There did not appear to be a single symptom domi-nating the overall expression of high eutrophic con-ditions. Rather, there was a wide and varied arrayof symptoms contributing to the overall conditionsobserved. The 10 estuaries exhibiting high eutrophicconditions had varying combinations of low dis-solved oxygen, submerged aquatic vegetation loss,and nuisance/toxic algal blooms. In most of theseestuaries, these secondary symptoms coincided with
Eut
roph
ic
Con
ditio
n
Symptom Expression
Chl
orop
hyll
a
Epi
phyt
es
Mac
roal
gae
SA
V L
oss
Low
Dis
solv
ed
Oxy
gen
Nui
sanc
e/T
oxic
Blo
oms
Estuary
Buzzards Bay
Narragansett Bay
Gardiners Bay
Long Island Sound
Connecticut River
Great South Bay
Hudson River/Raritan Bay
Barnegat Bay
New Jersey Inland Bays
Delaware Bay
Delaware Inland Bays
Maryland Inland Bays
Chincoteague Bay
Chesapeake Bay (mainstem)
Patuxent River
Potomac River
Rappahannock River
York River
James River
Chester River
Choptank River
Tangier/Pocomoke Sounds
?
?
?
?
?
?
? ? ?
? ?
Primary Secondary
No Expression
High Moderate Low Insufficient Data
?
ImprovingSymptom
EXHIBIT 21 (AR L.30)

26
Middle Atlantic
The confidence levels for the assessment of eutrophicconditions were generally high, although three es-tuaries were rated as low. The Connecticut River hadthe least data and the lowest confidence. Informa-tion was sparsest for trends in epiphyte abundance.
Influencing FactorsThe expression of severe eutrophic conditionstended to be more pervasive in enclosed or river-dominated estuaries, such as the Chesapeake Bayand its tributaries and the Delaware Inland Bays,while ocean-influenced systems, such as BuzzardsBay and Delaware Bay, exhibited fewer impacts (al-though these systems may have had small, more lo-calized areas of high symptoms). Nitrogen inputswere moderate to high in 15 estuaries, and suscepti-bility was moderate to high in all systems. Accord-ingly, human influence was considered to be ex-tremely strong in this region. Of the 15 estuaries with
moderate to high eutrophic conditions, 12 also ex-hibited high human influence.
Additionally, several systems displayed minimaleutrophic conditions despite a substantial level ofhuman influence. It is possible that some of thesesystems are close to developing full-scale eutrophicsymptoms. Alternatively, some of the systems maynot be as susceptible as the data indicated, or theestimates of nitrogen inputs may have been too high.
The confidence levels for the assessment of overallhuman influence were generally high; three estuar-ies were rated as low.
Impaired UsesThe loss of habitat (primarily submerged aquaticvegetation) was the most cited impaired use (15 es-tuaries), followed closely by degradation of recre-ational and commercial fishing (12 estuaries). Shell-fish resources, swimming, and aesthetic values wereimpaired in a moderate number of estuaries, whiletourism and boating were affected to a small extent.Almost all impaired uses occurred in systems inwhich eutrophic symptoms were moderate or high.
Potential Management ConcernsThe most important sources to target to managenutrient inputs in the region were identified as at-mospheric inputs, agricultural runoff, and dis-charges from wastewater treatment plants. Urbanrunoff, septic systems, combined sewer overflows,and animal operations were also noted as importanttargets, but in fewer estuarine basins.
Future Outlook to 2020Eutrophication conditions are expected to worsenslightly in 10 estuaries, and to worsen more severelyin three. In eight systems (primarily those from Buz-zards Bay south through Delaware Bay), no substan-tial changes are predicted. Great improvement is notexpected in any of the region’s estuaries.
The confidences levels for the assessment of the fu-ture outlook was low for four estuaries. The reliabil-ity of all of this information is, however, inherentlyvulnerable to unforeseen changes.
Figure 20. Eutrophic conditions and influencing factors
Eut
roph
ic
Con
ditio
n
Moderate Low
Sus
cept
ibili
ty
Nitr
ogen
Inpu
t
Ove
rall
Hum
an
Influ
ence
Insufficient Data
Estuary
High ?
Chesapeake Bay
Barnegat Bay
Delaware Inland Bays
Patuxent River
Potomac River
Tangier/Pocomoke Sounds
Long Island Sound
York River
Great South Bay
Gardiners Bay
Rappahannock River
Hudson River/Raritan Bay
Chester River
Choptank River
Maryland Inland Bays
Narragansett Bay
New Jersey Inland Bays
Delaware Bay
James River
Connecticut River
Chincoteague Bay
Buzzards Bay
Influencing Factors
EXHIBIT 21 (AR L.30)

27
Middle Atlantic
Data Gaps and Research NeedsBetter quantification of nutrient sources, especiallyfrom the atmosphere and groundwater, is neededto determine a more accurate assessment of nutri-ent loading pressures. A major research need for thisregion is a concrete determination of, and a moredefinitive knowledge of, the relationship betweenthe human factors that influence eutrophication andthe quality and quantity of living marine resourcesin the estuaries. This will entail clarifying and quan-tifying water-quality pathways; that is, both human-related and naturally occurring nutrient inputs, andthe nature of their cascading effects throughout thetrophic levels of the various estuarine systems.
This dense bloom of cyanobacteria (blue-green algae) occurred in the Potomac River estuary downstream of Washington, D.C.Photo courtesy of W. Bennett, U.S. Geological Survey.
EXHIBIT 21 (AR L.30)
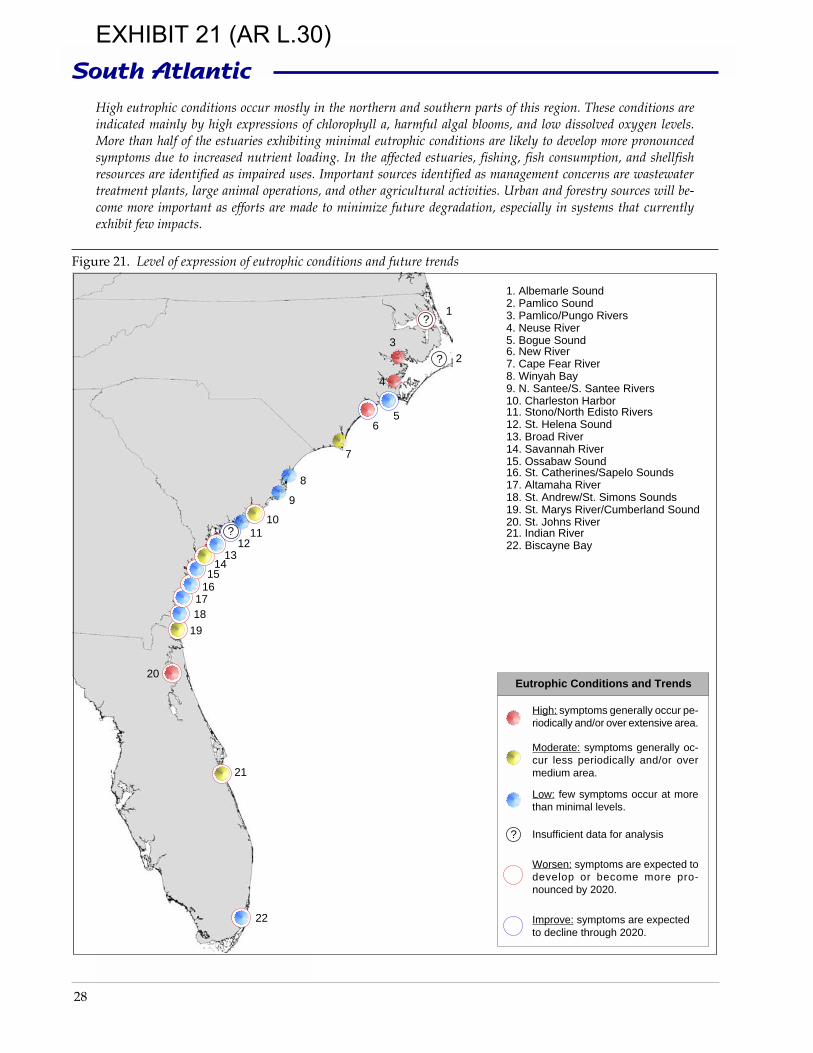
28
South Atlantic
1. Albemarle Sound2. Pamlico Sound3. Pamlico/Pungo Rivers4. Neuse River5. Bogue Sound6. New River7. Cape Fear River8. Winyah Bay9. N. Santee/S. Santee Rivers10. Charleston Harbor11. Stono/North Edisto Rivers12. St. Helena Sound13. Broad River14. Savannah River15. Ossabaw Sound16. St. Catherines/Sapelo Sounds17. Altamaha River18. St. Andrew/St. Simons Sounds19. St. Marys River/Cumberland Sound20. St. Johns River21. Indian River22. Biscayne Bay
1
23
4
56
7
8
9
1011
1213
1415
161718
19
20
21
22
Eutrophic Conditions and Trends
?
?
?
?
South Atlantic
Figure 21. Level of expression of eutrophic conditions and future trends
High: symptoms generally occur pe-riodically and/or over extensive area.
Moderate: symptoms generally oc-cur less periodically and/or overmedium area.
Low: few symptoms occur at morethan minimal levels.
Insufficient data for analysis
Worsen: symptoms are expected todevelop or become more pro-nounced by 2020.
Improve: symptoms are expectedto decline through 2020.
High eutrophic conditions occur mostly in the northern and southern parts of this region. These conditions areindicated mainly by high expressions of chlorophyll a, harmful algal blooms, and low dissolved oxygen levels.More than half of the estuaries exhibiting minimal eutrophic conditions are likely to develop more pronouncedsymptoms due to increased nutrient loading. In the affected estuaries, fishing, fish consumption, and shellfishresources are identified as impaired uses. Important sources identified as management concerns are wastewatertreatment plants, large animal operations, and other agricultural activities. Urban and forestry sources will be-come more important as efforts are made to minimize future degradation, especially in systems that currentlyexhibit few impacts.
EXHIBIT 21 (AR L.30)

29
South AtlanticFigure 22. Eutrophic conditions and symptomsThe South Atlantic region includes 22 estuaries, encom-
passing more than 4,440 square miles of water surfacearea. The region is comprised of extensive barrier and seaislands that parallel the shoreline. The coastal environ-ment consists of shallow lagoonal estuaries, extensive tidalmarshes and drowned river valleys. Estuarine circula-tion patterns are dominated mainly by wind and seasonalfreshwater inflow in North Carolina, and mainly by fresh-water inflow and tides in South Carolina and Georgia.Estuarine circulation along the Florida coast is dominatedby wind forcing and human engineering. Tidal rangethroughout the region is moderately low to high (1.5-7.0feet) and influences mixing in the water column, prima-rily near the inlets. The dominant land uses are agricul-ture and industry, and, to a lesser extent, forestry. Majorpopulation centers include Miami, Jacksonville, and Sa-vannah.
Eutrophic ConditionsOverall Conditions. The South Atlantic region con-tains only four estuarine systems characterized ashaving high levels of eutrophic conditions: the NeuseRiver, Pamlico/Pungo Rivers, New River, and theSt. John’s River. Most of the other systems were rela-tively unaffected. Nevertheless, almost half of theregion’s estuaries exhibited eutrophic conditions atlow to moderate levels. Most of these estuaries arein South Carolina and Georgia.
Expression of Symptoms. In five estuaries, at leastone of the six individual symptoms was expressedat high levels. Of the primary symptoms, chlorophylla had the most pronounced expression in five estu-aries located in North Carolina and Florida. Of thesecondary symptoms, depleted dissolved oxygenwas considered high only in the Neuse River; how-ever, low to moderate conditions occurred in almostevery other estuary in the region. Nuisance/toxicalgal blooms occurred at high levels in both the Newand Neuse Rivers and at moderate levels in thePamlico/Pungo Rivers of North Carolina. The lossof submerged aquatic vegetation was a problem inalmost half of the estuaries, but mainly at low tomoderate levels.
In general, the symptoms most often associated withhigh expressions of eutrophic conditions were highchlorophyll a and nuisance/toxic algal blooms, al-though various levels of other symptoms wereknown to occur.
Some data existed for the Albemarle and PamlicoSounds, but it was for very limited portions of thesystems. St. Helena Sound also had insufficient datafor an overall assessment. In 10 other estuaries, theconfidence levels for assessments were low. Infor-mation was sparsest for trends in submerged aquaticvegetation.
Influencing FactorsThe overall level of human influence was low in halfof the region’s estuaries, especially in South Caro-lina and Georgia, and moderate in most of the re-maining estuaries. Human influence was most pro-nounced in the Pamlico/Pungo Rivers, the NeuseRiver and the New River.
While few estuaries in the South At-lantic exhibit high eutrophic condi-tions, many estuaries have moderateto high susceptibility. Furthermore,conditions are expected to worsen in10 estuaries that currently exhibit lowto moderate eutrophic conditions.
Eut
roph
ic
Con
ditio
n
Symptom Expression
Chl
orop
hyll
a
Epi
phyt
es
Mac
roal
gae
SA
V L
oss
Low
Dis
solv
edO
xyge
n
Nui
sanc
e/T
oxic
Blo
oms
Estuary
Albemarle Sound
Pamlico Sound
Pamlico/Pungo Rivers
Neuse River
Bogue Sound
New River
Cape Fear River
Winyah Bay
N. Santee/S. Santee Rivers
Charleston Harbor
Stono/North Edisto Rivers
St. Helena Sound
Broad River
Savannah River
Ossabaw Sound
St. Catherines/Sapelo Sounds
Altamaha River
St. Andrew/St. Simons Sounds
St. Marys River/Cumberland Sd.
St. Johns River
Indian River
Biscayne Bay
?
?
? ?
?
?
? ?
?
? ? ? ?
? ? ?
?
Primary Secondary
?
No Expression
High Moderate Low Insufficient Data
?
ImprovingSymptom
EXHIBIT 21 (AR L.30)
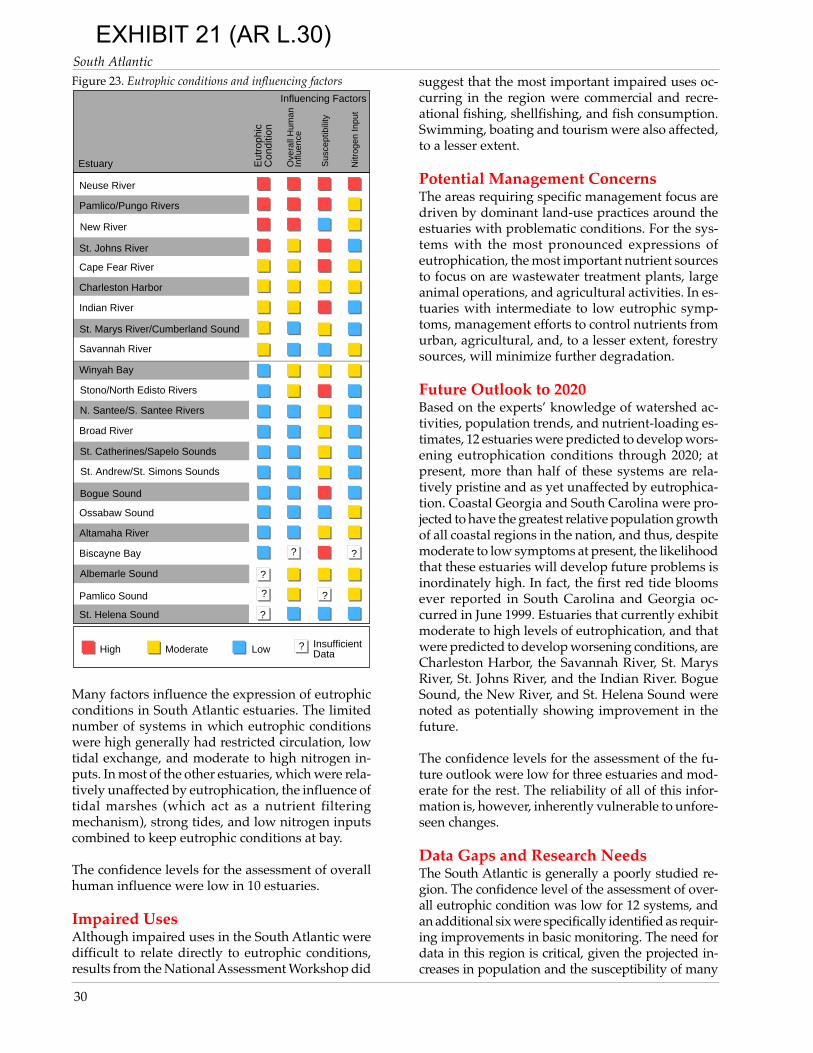
30
South AtlanticFigure 23. Eutrophic conditions and influencing factors
Many factors influence the expression of eutrophicconditions in South Atlantic estuaries. The limitednumber of systems in which eutrophic conditionswere high generally had restricted circulation, lowtidal exchange, and moderate to high nitrogen in-puts. In most of the other estuaries, which were rela-tively unaffected by eutrophication, the influence oftidal marshes (which act as a nutrient filteringmechanism), strong tides, and low nitrogen inputscombined to keep eutrophic conditions at bay.
The confidence levels for the assessment of overallhuman influence were low in 10 estuaries.
Impaired UsesAlthough impaired uses in the South Atlantic weredifficult to relate directly to eutrophic conditions,results from the National Assessment Workshop did
suggest that the most important impaired uses oc-curring in the region were commercial and recre-ational fishing, shellfishing, and fish consumption.Swimming, boating and tourism were also affected,to a lesser extent.
Potential Management ConcernsThe areas requiring specific management focus aredriven by dominant land-use practices around theestuaries with problematic conditions. For the sys-tems with the most pronounced expressions ofeutrophication, the most important nutrient sourcesto focus on are wastewater treatment plants, largeanimal operations, and agricultural activities. In es-tuaries with intermediate to low eutrophic symp-toms, management efforts to control nutrients fromurban, agricultural, and, to a lesser extent, forestrysources, will minimize further degradation.
Future Outlook to 2020Based on the experts’ knowledge of watershed ac-tivities, population trends, and nutrient-loading es-timates, 12 estuaries were predicted to develop wors-ening eutrophication conditions through 2020; atpresent, more than half of these systems are rela-tively pristine and as yet unaffected by eutrophica-tion. Coastal Georgia and South Carolina were pro-jected to have the greatest relative population growthof all coastal regions in the nation, and thus, despitemoderate to low symptoms at present, the likelihoodthat these estuaries will develop future problems isinordinately high. In fact, the first red tide bloomsever reported in South Carolina and Georgia oc-curred in June 1999. Estuaries that currently exhibitmoderate to high levels of eutrophication, and thatwere predicted to develop worsening conditions, areCharleston Harbor, the Savannah River, St. MarysRiver, St. Johns River, and the Indian River. BogueSound, the New River, and St. Helena Sound werenoted as potentially showing improvement in thefuture.
The confidence levels for the assessment of the fu-ture outlook were low for three estuaries and mod-erate for the rest. The reliability of all of this infor-mation is, however, inherently vulnerable to unfore-seen changes.
Data Gaps and Research NeedsThe South Atlantic is generally a poorly studied re-gion. The confidence level of the assessment of over-all eutrophic condition was low for 12 systems, andan additional six were specifically identified as requir-ing improvements in basic monitoring. The need fordata in this region is critical, given the projected in-creases in population and the susceptibility of many
Eut
roph
ic
Con
ditio
n
Moderate Low
Sus
cept
ibili
ty
Nitr
ogen
Inpu
t
Ove
rall
Hum
an
Influ
ence
Insufficient Data
Estuary
High ?
Neuse River
Pamlico Sound
Pamlico/Pungo Rivers
New River
St. Johns River
Cape Fear River
Charleston Harbor
Indian River
St. Marys River/Cumberland Sound
Savannah River
Winyah Bay
Stono/North Edisto Rivers
N. Santee/S. Santee Rivers
Broad River
St. Catherines/Sapelo Sounds
St. Andrew/St. Simons Sounds
Bogue Sound
Ossabaw Sound
Altamaha River
Biscayne Bay
St. Helena Sound ?
Albemarle Sound ?
?
?
?
Influencing Factors
?
EXHIBIT 21 (AR L.30)

31
South Atlantic
of the systems. Other identified needs were better dataon organic as well as inorganic nutrient loads and con-centrations; time-series data sets in both impacted andpristine systems; and more data on the comparativeroles of shallow intertidal habitats and water-columnprocesses. Research on the effects of nutrient loadingin blackwater systems, and comparative data on nu-trient processing in blackwater versus alluvial rivers,were also deemed imperative.
Population growth and the associated development of relatively pristine estuarine watersheds is a major concern for the South Atlantic.Photograph courtesy of Michael A. Mallin, Center for Marine Science Research, University of North Carolina at Wilmington.
EXHIBIT 21 (AR L.30)

32
Gulf of Mexico
1. Florida Bay2. S. Ten Thousand Islands3. N. Ten Thousand Islands4. Rookery Bay5. Charlotte Harbor6. Caloosahatchee River7. Sarasota Bay8. Tampa Bay9. Suwannee River10. Apalachee Bay11. Apalachicola Bay12. St. Andrew Bay13. Choctawhatchee Bay14. Pensacola Bay15. Perdido Bay16. Mobile Bay17. East Mississippi Sound18. West Mississippi Sound19. Lake Borgne20. Lake Pontchartrain
21. Breton/Chandeleur Sounds22. Mississippi River23. Barataria Bay24. Terrebonne/Timbalier Bays25. Atchafalaya/Vermilion Bays26. Mermentau Estuary27. Calcasieu Lake28. Sabine Lake29. Galveston Bay30. Brazos River31. Matagorda Bay32. San Antonio Bay33. Aransas Bay34. Corpus Christi Bay35. Upper Laguna Madre36. Baffin Bay37. Lower Laguna Madre38. Mississippi River Plume
1
23
4
5 6
7
8
9
1011
121314151617
1819
20
21
2223
2425
262728
29
3031
3233
343536
37
38
Eutrophic Conditions and Trends
?
?
The expression of high eutrophic conditions is extensive, and human influence is substantial, in the Gulf of Mexicoregion. Although there is a great diversity of estuary types, common characteristics, such as low tidal flushing,warm water, and long algal growing seasons, create conditions that make many of the region’s estuaries suscep-tible to eutrophic problems. The most significant symptoms in the overall expression of eutrophic conditions arelow dissolved oxygen and loss of submerged aquatic vegetation. Impaired resource uses are evident in many, butnot all, of the affected systems. Conditions are expected to worsen in more than half of the estuaries by 2020.
Gulf of Mexico
Figure 24. Level of expression of eutrophic conditions and future trends
High: symptoms generally occur pe-riodically and/or over extensive area.
Moderate: symptoms generally oc-cur less periodically and/or overmedium area.
Low: few symptoms occur at morethan minimal levels.
Insufficient data for analysis
Worsen: symptoms are expected todevelop or become more pro-nounced by 2020.
Improve: symptoms are expectedto decline through 2020.
EXHIBIT 21 (AR L.30)

33
Gulf of MexicoFigure 25. Eutrophic conditions and symptomsThe Gulf of Mexico region includes 37 estuaries plus the
Mississippi River Plume, encompassing more than 24,000square miles of water surface area. The region is com-prised of a gently sloping, lowland area as part of the GulfCoastal Plain. Estuarine and coastal environments arehighly diverse, consisting of unrestricted open bays, semi-enclosed lagoons, tidal marshes and delta complexes. Thefresh water that flows naturally into estuaries can fluc-tuate greatly in the Gulf, and depends on seasonal rain-fall patterns. Estuarine circulation patterns are gener-ally wind driven, and coastal waters are usually warmerthan in other regions due to the subtropical climate. Es-tuaries have fairly low tidal energy (0.5-3.5 ft. tide range),and water depths are typically shallow when compared toestuaries in other regions. Land-use activity in the wa-tersheds is typically dominated by agricultural practices.Major population centers include Houston, New Orleansand Tampa.
Eutrophic ConditionsOverall Conditions. The Gulf of Mexico was sig-nificantly affected by elevated expressions ofeutrophication. Almost half of the estuaries werecharacterized as having high levels of eutrophic con-ditions. Estuaries noted as having the highest-levelconditions were Florida Bay, Lake Pontchartrain,Calcasieu Lake, the Mississippi River Plume, Cor-pus Christi Bay and the Laguna Madre system. Four-teen estuaries were characterized as having moder-ate levels of eutrophic conditions, and only six werecharacterized as having low-level conditions.
Expression of Symptoms. In 20 estuaries, at leastone of the six individual symptoms was expressedat high levels. Of the primary symptoms, chlorophyll awas expressed at high levels in 12 estuaries that werelocated mainly on the coasts of western Florida,Louisiana and lower Texas. In eight estuaries, epi-phytes were considered moderate to high; in sevenestuaries, magroalgal abundance was consideredmoderate to high. Of the secondary symptoms, lowdissolved oxygen occurred at high levels in four es-tuaries, mainly along the Florida coast and in theMississippi River Plume. The loss of submerged
aquatic vegetation was a problem in almost half ofthe estuaries, but usually at low to moderate levels.Nuisance/toxic algal blooms also tended to be per-
Of all regions, the Gulf of Mexico hasthe greatest percentage of estuarieswith high eutrophic conditions, de-spite low to moderate nutrient inputs.In addition to the prevalence of mod-erate to high susceptibility, the gen-erally long growing season and warmwaters result in higher levels of ex-pression of eutrophic conditions.
Eut
roph
icC
ondi
tion
Symptom Expression
Chl
orop
hyll
a
Epi
phyt
es
Mac
roal
gae
SA
V L
oss
Low
Dis
solv
edO
xyge
n
Nui
sanc
e/T
oxic
Blo
oms
Estuary
Florida Bay
South Ten Thousand Islands
North Ten Thousand Islands
Rookery Bay
Charlotte Harbor
Caloosahatchee River
Sarasota Bay
Tampa Bay
Suwannee River
Apalachee Bay
Apalachicola Bay
St. Andrew Bay
Choctawhatchee Bay
Pensacola Bay
Perdido Bay
Mobile Bay
East Mississippi Sound
West Mississippi Sound
Lake Borgne
Lake Pontchartrain
Breton/Chandeleur Sounds
Mississippi River
Barataria Bay
Terrebonne/Timbalier Bays
Atchafalaya/Vermilion Bays
Mississippi River Plume
Mermentau Estuary
Calcasieu Lake
Sabine Lake
Galveston Bay
Brazos River
Matagorda Bay
San Antonio Bay
Aransas Bay
Corpus Christi Bay
Upper Laguna Madre
Baffin Bay
Lower Laguna Madre
?
?
?
? ?
? ? ? ?
? ?
?
Primary Secondary
No Expression
High Moderate Low Insufficient Data
?
ImprovingSymptom
EXHIBIT 21 (AR L.30)

34
Gulf of MexicoFigure 26. Eutrophic conditions and influencing factorsvasive, occurring in 28 estuaries, eight of which
showed high levels. All eight of these estuaries werelocated in the coastal systems of Florida, westernLouisiana and the lower Texas coast.
In the systems with high eutrophic conditions, thesymptoms that generally contribute the most to theobserved overall condition were the loss of sub-merged aquatic vegetation, increased turbidity as-sociated with high concentrations of chlorophyll a,and low levels of dissolved oxygen. Moderate tohigh levels of nuisance/toxic algal blooms and epi-phyte abundance were also major factors in systemswith pronounced expressions of eutrophication.
In general, recent improving trends are due prima-rily to better management of point and nonpointnutrient sources. Where conditions are moderate tohigh, however, there is still much room for improve-ment, and efforts to control nutrient inputs shouldbe maintained and fortified.
The Gulf of Mexico is generally a well studied re-gion; the confidence levels for the assessment ofoverall eutrophic conditions were medium to highfor 31 systems. The confidence levels for the assess-ment of overall eutrophic conditions were low foronly six systems. Data availability was generallyvery good; Lake Borgne was the only estuary withinsufficient data for an assessment.
Overall Human InfluenceThe overall level of human influence was high inmore than half of all Gulf systems and correspondedwell with high levels of eutrophic conditions (Fig-ure 27). Human influence was considered mostprominent in the Mississippi River Plume, LakePontchartrain, Upper and Lower Laguna Madre, andBaffin Bay. Noted for having relatively low humaninfluence were Rookery Bay, the Suwannee River,Apalachee Bay, and Breton/Chandeleur Sounds.
Many factors influenced the expression of eutrophi-cation in Gulf estuaries. The following influencingfactors were generally associated with moderate topronounced levels of expression: low tidal energy,low flushing rates with increased nutrient inputs,and low dissolved oxygen levels generally due towarmer waters and the longer growing season.These factors contributed significantly to the highlevels of human influence in many Gulf estuarieswith pronounced eutrophic conditions, even thoughnitrogen inputs were generally moderate (Figure 27).For example, although population density is rela-tively low in the Baffin Bay and Upper LagunaMadre watersheds, human influence is magnified
Eut
roph
ic
Con
ditio
n
Moderate Low
Sus
cept
ibili
ty
Nitr
ogen
Inpu
t
Ove
rall
Hum
an
Influ
ence
Insufficient Data
Estuary
High ?
Lake Pontchartrain
Baffin Bay
Upper Laguna Madre
Lower Laguna Madre
Calcasieu Lake
Corpus Christi Bay
Caloosahatchee River
Charlotte Harbor
Sarasota Bay
Tampa Bay
Choctawhatchee Bay
Perdido Bay
Apalachicola Bay
Pensacola Bay
Sabine Lake
Galveston Bay
San Antonio Bay
Matagorda Bay
St. Andrew Bay
Mobile Bay
East Mississippi Sound
Lake Borgne
Terrebonne/Timbalier Bays
Atchafalaya/Vermilion Bays
Brazos River
Aransas Bay
Suwannee River
West Mississippi Sound
Mississippi River
Apalachee Bay
Breton/Chandeleur Sounds
Mermentau Estuary
Barataria Bay
?
Mississippi River Plume ? ?
Florida Bay ?
South Ten Thousand Islands ?
North Ten Thousand Islands ?
Rookery Bay ?
Influencing Factors
EXHIBIT 21 (AR L.30)

35
Gulf of Mexico
due to these estuaries’ high susceptibility.
The confidence level in the assessment of human in-fluence was low for 11 estuaries.
Impaired UsesImpaired uses were difficult to define as being di-rectly related to eutrophication. Results from theWorkshop, however, did suggest that the most im-paired uses were recreational and commercial fish-ing and shellfishing. Habitat-level impacts, such asthe loss of submerged aquatic vegetation, were alsonoted.
Potential Management ConcernsThe areas requiring specific management focus aredriven by agriculture, which is the dominant landuse in the region’s watersheds. Management targetareas are diverse because of the varied physicalmakeup and forcing mechanisms that drive condi-tions in the estuaries. Wastewater treatment plants,industrial discharges, and agricultural practices arecommon management targets. Atmospheric inputsare important in low-flow systems. Upland inputsshould be targeted for large fluvial systems such asthe Mississippi, Mobile, and Apalachicola Rivers.
Future Outlook to 2020Of the 38 Gulf estuaries studied, 23 were predictedto develop worsening conditions over the next 20years, six of them to a high degree (Mississippi RiverPlume, Lake Pontchartrain, Corpus Christi Bay,Upper and Lower Laguna Madre, and Baffin Bay).Florida Bay, Breton/Chandeleur Sounds, andMermentau Estuary were noted as potentially show-ing signs of future improvement. The level of confi-dence for the assessment of the future outlook waslow for 12 estuaries.
Data Gaps and Research NeedsResearch areas, such as biogeochemical cycling andnutrient budget analyses, require an understandingof the processes by which elements are recycledwithin estuaries. According to the experts, these pro-cesses are poorly understood and in need of moreattention. Participants at the workshop noted thatphosphorus may be an important contributor toeutrophication in some Gulf of Mexico estuaries;however, the relative roles of nitrogen and phospho-rus need clarification. The experts also called forbetter understanding of individual estuaries’ assimi-lative capacity, and more research on inlet circula-tion and approaches to inlet management.
In Florida Bay, this macroalgae bloom smothered the surrounding submerged aquatic vegetation.Photograph courtesy of Brian LaPointe, Harbor Branch Oceanographic Institute.
EXHIBIT 21 (AR L.30)

36
Pacific
12
3
4
56
7
8
9
1011
12
13
14
15
1. Tijuana Estuary2. San Diego Bay3. Mission Bay4. Newport Bay5. San Pedro Bay6. Alamitos Bay7. Anaheim Bay8. Santa Monica Bay9. Morro Bay10. Monterey Bay11. Elkhorn Slough12. San Francisco Bay13. Central San Francisco/ San Pablo/Suisun Bays14. Drakes Estero15. Tomales Bay16. Eel River17. Humboldt Bay18. Klamath River19. Rogue River20. Coquille River
21. Coos Bay22. Umpqua River23. Siuslaw River24. Alsea River25. Yaquina Bay26. Siletz Bay27. Netarts Bay28. Tillamook Bay29. Nehalem River30. Columbia River31. Willapa Bay32. Grays Harbor33. Puget Sound34. Hood Canal35. Whidbey Basin/Skagit Bay36. South Puget Sound37. Port Orchard System38. Bellingham/Padilla/Samish Bays39. Sequim/Discovery Bays
16
17
18
19
20212223242526272829
3031
32
33
35
34
36
37
3839
Eutrophic Conditions and Trends
?
?
?
???
???
????
Pacific
Figure 27. Level of expression of eutrophic conditions and future trends
High eutrophic conditions occur in the extreme north and south of the region, and on the central California coast.These estuaries tend to have restricted circulation and high nutrient inputs. Symptoms are expected to develop orworsen in the majority of systems, primarily due to projected population increases and development pressures.Estuarine habitats and shellfisheries are the most affected resources. In general, the most important nutrientsources for management concern are agriculture, forestry, wastewater treatment plants, and urban runoff. Theassessment confidence is generally low, except in San Francisco Bay and Puget Sound.
High: symptoms generally occur pe-riodically and/or over extensive area.
Moderate: symptoms generally oc-cur less periodically and/or overmedium area.
Low: few symptoms occur at morethan minimal levels.
Insufficient data for analysis
Worsen: symptoms are expected todevelop or become more pro-nounced by 2020.
Improve: symptoms are expectedto decline through 2020.
EXHIBIT 21 (AR L.30)

37
PacificFigure 28. Eutrophic conditions and symptomsThe Pacific region includes 39 estuaries, encompassing
more than 2,750 square miles of water surface area. Theregion consists of a relatively straight and uninterruptedshoreline with rocky shores, sandy beaches and occasionalriver outlets. Limited areas of flat, lowland environmentssupport estuaries, bays and lagoons. Estuaries are typi-cally small and separated by large distances. Estuarinecirculation patterns are dominated mainly by seasonalfreshwater inflow in Southern California and by fresh-water inflow and tides in the larger estuaries of centralCalifornia and Washington state. The tidal range is mod-erately high (5.0-7.5 feet). Forestry, agriculture and in-dustry are the dominant land uses in the region’s water-sheds. Some of the major population centers include LosAngeles, San Diego, San Francisco and Seattle.
Eutrophic ConditionsOverall Conditions. Pacific Coast estuaries exhib-ited a wide range of eutrophic conditions. High-levelconditions occurred in seven estuaries, mainly in thenorthern and southern sections of the region (Fig-ure 29). Among these were Tijuana Estuary, New-port Bay, and San Francisco Bay. Eleven estuariesfell into the moderate range; these were interspersedthroughout California and the Pacific Northwest.Nine estuaries were relatively unaffected byeutrophic conditions.
Expression of Symptoms. In 19 estuaries, at leastone of the six individual symptoms was expressedat high levels. Of the primary symptoms, chlorophylla was expressed at high levels in 11 systems, most ofthem in Southern California and northern Washing-ton. Macroalgal abundance was observed at moder-ate to high levels in 13 estuaries, most of them alsofound in Southern California and Washington. Epi-phyte abundance was minimal. Eight estuaries ex-hibited losses in submerged aquatic vegetation; twoof these at high levels. Nuisance/toxic algal bloomsoccurred in 21 estuaries, 12 of which were in themoderate to high range.
In general, the symptoms contributing most to higheutrophic conditions were elevated levels of chloro-
The Pacific region, more than anyother, is characterized by insufficientdata. Although the estuaries with un-known conditions are generally per-ceived to have few eutrophic prob-lems, many have moderate suscepti-bility and are predicted to developeutrophic symptoms by 2020.
Eut
roph
ic
Con
ditio
n
Symptom Expression
Chl
orop
hyll
a
Epi
phyt
es
Mac
roal
gae
SA
V L
oss
Low
Dis
solv
edO
xyge
n
Nui
sanc
e/T
oxic
Blo
oms
Estuary
Tijuana Estuary
Mission Bay
Newport Bay
San Pedro Bay
Monterey Bay
Elkhorn Slough
San Francisco Bay
Central San Francisco/San Pablo/Suisun Bays
Eel River
Humboldt Bay
Klamath River
Yaquina Bay
Columbia River
Willapa Bay
Puget Sound
San Diego Bay
Alamitos Bay
Anaheim Bay
Santa Monica Bay ?
Morro Bay
Drakes Estero ?
Tomales Bay
Rogue River ?
Coquille River ?
Coos Bay ?
Umpqua River ?
Siuslaw River ?
Alsea River ?
Siletz Bay ?
Netarts Bay ?
Tillamook Bay ?
Nehalem River ?
Grays Harbor
Hood Canal
Whidbey Basin/Skagit Bay
South Puget Sound
Port Orchard System
Bellingham/Padilla/Samish Bays
Sequim/Discovery Bays
? ?
?
? ?
? ? ?
? ?
? ? ?? ?
?
? ? ? ?
? ??
?
? ? ? ?
? ? ?
? ? ?
? ? ? ? ?
? ? ?
? ? ?
? ? ?
?
? ? ?
? ? ?
? ?
?
?
? ?
Primary Secondary
No Expression
High Moderate Low Insufficient Data
?
ImprovingSymptom
EXHIBIT 21 (AR L.30)

38
PacificFigure 29. Eutrophic conditions and influencing factorsphyll a, coupled with various combinations of
macroalgal abundance, nuisance/toxic algal blooms,and low dissolved oxygen. High chlorophyll a con-centrations is also a fairly common natural condi-tion in some North Pacific estuaries due to naturallyoccurring seasonal blooms.
Recent improvements in certain symptoms were pri-marily attributed to point source controls and hy-drologic changes.
The confidence levels for the assessment of eutrophicconditions was generally low in this region. Of the27 estuaries that were characterized, 11 had low con-fidence levels. Twelve estuaries, most of them in Or-egon, had insufficient data for an assessment of con-ditions. Part of the reason for the paucity of data,however, is that eutrophication generally is not per-ceived to be a problem in these systems.
Overall Human InfluenceIn general, estuaries with high-level eutrophic con-ditions also had high levels of human influence (Fig-ure 30). Human influence on the expression ofeutrophic symptoms was most pronounced in theTijuana Estuary, Newport Bay, San Pedro Bay, Ana-heim Bay and San Francisco Bay. Three of these—Newport, Anaheim and San Pedro—are among thetop 10 U.S. estuaries with respect to population den-sity in the watershed. Tijuana Estuary is also notablebecause three-quarters of the watershed is locatedin Mexico, making management an internationalchallenge. The Tijuana River is the primary sourceof freshwater to the estuary; it is also a source ofuntreated sewage from the city of Tijuana.
Although 12 estuaries had insufficient data for anassessment of eutrophic conditions, these systemswere generally small, with good flushing capabili-ties, and nutrient loading appeared to be moderate.In general, restricted circulation and moderate tohigh levels of nutrient inputs were noted as the prin-ciple factors contributing to elevated eutrophicsymptoms in Pacific Coast systems.
The level of confidence in the assessment of overallhuman influence was low for 30 estuaries.
Impaired UsesThe uses most often cited as impaired were fishing,shellfishing, swimming and aesthetic value. Most ofthese responses addressed the estuaries of SouthernCalifornia and Washington; impaired uses were un-known in Oregon and northern California.
Eut
roph
ic
Con
ditio
n
Moderate Low
Sus
cept
ibili
ty
Nitr
ogen
Inpu
t
Ove
rall
Hum
an
Influ
ence
Insufficient Data
Estuary
High ?
?
?
Tijuana Estuary
Newport Bay
San Francisco Bay
Elkhorn Slough
Tomales Bay
Hood Canal
South Puget Sound
Port Orchard System
Anaheim Bay
San Diego Bay
Morro Bay
Whidbey Basin/Skagit Bay
Bellingham/Padilla/Samish Bays
Sequim/Discovery Bays
Willapa Bay
Grays Harbor
Puget Sound
Central San Francisco/San Pablo/Suisun Bays
San Pedro Bay
Mission Bay
Humboldt Bay
Eel River
Monterey Bay
Yaquina Bay
Klamath River
Columbia River
Alamitos Bay
Santa Monica Bay
Drakes Estero
Coos Bay
Siuslaw River
Tillamook Bay
Rogue River
Alsea River
Netarts Bay
Nehalem River
Coquille River
Umpqua River
Siletz Bay ?
?
?
?
?
?
?
?
?
?
?
?
?
?
Influencing Factors
EXHIBIT 21 (AR L.30)

39
Pacific
Potential Management ConcernsPotential sources to target to improve conditions inWashington estuaries are wastewater treatmentplants, on-site animal operations, agriculture andforestry. In Southern California, wastewater treat-ment plants, urbanization, agriculture and forestrywere cited.
With the exception of three estuaries—San FranciscoBay, Central San Francisco Bay and the ColumbiaRiver—experts noted that reductions in nutrient in-puts would significantly improve water-quality con-ditions. Workshop participants also recommendedthat management efforts focus primarily on thecoastal portions of the watersheds.
Future Outlook to 2020Thirty-one estuaries were predicted to develop wors-ening conditions during the next 20 years. Five ofthese—Tijuana Estuary, San Diego Bay, Newport Bay,Hood Canal and South Puget Sound—are expectedto get much worse. The reported reason for worsen-ing conditions was increasing population pressuresalong most of the coast.
The level of confidence in the assessment of the fu-ture outlook was low for 24 (nearly two-thirds) ofPacific estuaries.
Data Gaps and Research NeedsThe estuaries of the Pacific Coast are predominantlyunderstudied, particularly in Oregon and in someareas of California. Thus, there is a need for baselinemonitoring of basic water-quality parameters inthese areas. In addition, research is needed to deter-mine the fate of nutrients and their eventual impactson primary production and human uses of the re-sources. If water quality is to be managed properlyin the presently pristine systems, as well as in thosewith insufficient data, a much better understandingis needed of the linkages between nutrient inputs,productivity and eutrophic symptoms.
A bloom of nuisance algae mars an estuary in the state of Washington. Photo courtesy of Puget Sound Water Quality Action Team.
EXHIBIT 21 (AR L.30)

40
Conclusions
EXHIBIT 21 (AR L.30)

41
Conclusions
The National Estuarine Eutrophication Assessment provides a picture of nutrient-enrichment related water quality condi-tions in the nation’s estuaries. These conclusions are based on data and information about water quality conditions, theinfluence of natural and human-related factors, estuarine use impairments, and management recommendations compiledfor 138 estuaries (>90% of U.S. estuarine surface area) and also for the Mississippi River Plume. The results, which werereviewed and synthesized by experts at a National Assessment Workshop, provide a comprehensive assessment of thelocation, magnitude, and consequences of eutrophication in the nation’s estuaries.
Eutrophic Conditions in EstuariesThe overall expression of eutrophic conditions was highin 44 (one-third) of the 138 estuaries studied, and mod-erate in an additional 40 estuaries. Thus, 84 estuaries—60% of those studied—exhibited moderate to higheutrophic conditions. Although the greatest numberof estuaries with pronounced problems were foundin the Gulf of Mexico and Middle Atlantic regions,estuaries showing high levels of eutrophic conditionswere found along all of the nation’s coasts. Further-more, it is important to note that the estuaries assessedas having a high expression of eutrophic conditionswere those that have been the best studied. In themany estuaries that are understudied or for whichvery little is known, eutrophication may be more se-rious than the limited data reveal.
Symptoms and Related Use ImpairmentsAbout 40 percent (58) of the nation’s estuaries show highlevels of chlorophyll a, epiphytes, or macroalgae, signsof the initial stages of eutrophication. In terms of theirimpacts on estuaries, the most important symptoms in-dicative of eutrophication are low dissolved oxygen, theloss of submerged aquatic vegetation, and blooms ofnuisance and toxic algae. More than half (82) of U.S.estuaries, representing 67% of the estuarine surface areastudied, had moderate to high expressions of at leastone of these symptoms. This finding is of concern be-cause these symptoms can have serious consequences,including negative impacts on commercial fisheries, theloss of recreational opportunities, and potential risks tohuman health.
The experts identified more than half of the studiedestuaries as having use impairments related toeutrophic conditions. The implications are serious andaffect not only the natural resources but also theeconomy and human health. The resource uses mostfrequently reported as being impaired were commer-cial fishing and shellfish harvesting. Recreational fish-ing, swimming, and boating, all of which contributeto tourism in coastal areas, were also reported as im-paired to some degree. The reported risks to humanhealth include the consumption of tainted shellfish,as well as direct skin contact or the inhalation/inges-tion of water during an active bloom of toxic algae.
High expressions of eutrophic conditions are ex-hibited in 44 estuaries, representing 40% of thetotal estuarine surface area studied.
High conditions occur in estuaries along allcoasts, but are most prevalent along the Gulfof Mexico and Middle Atlantic coasts.
Key Findings
82 estuaries, representing 67% of the surfacearea studied, exhibit moderate to high expres-sions of either depleted dissolved oxygen, lossof submerged aquatic vegetation, or nuisance/toxic algal blooms.
69 estuaries were identified by workshop par-ticipants as having human use impairments re-lated to eutrophication.
Compared to other impaired uses, commercial/recreational fishing and shellfisheries wereidentified as impaired for human use in thegreatest number of estuaries (43 and 46, respec-tively).
Key Findings
Conclusions
EXHIBIT 21 (AR L.30)

42
Conclusions
Influencing Factors on EutrophicationMost estuaries that showed high levels of eutrophic con-ditions were moderately to highly influenced by hu-man-related nutrient inputs (e.g., wastewater treatment,agriculture, urban runoff, atmospheric deposition). Ofthe 44 estuaries with high expressions of eutrophic con-ditions, 36 were assessed as being highly influenced byhuman activities despite relatively moderate nutrientinputs. Most of these estuaries were in the Gulf ofMexico, the Middle Atlantic, and the Pacific regions.Most of the 44 estuaries (86 %) also had moderate tohigh susceptibility to retaining nutrient inputs; that is,their unique physical characteristics made them vul-nerable to developing the symptoms of eutrophication.It follows that susceptibility is an important factor inthe expression of high eutrophic conditions, especiallywhen nutrient inputs are not extremely high. Further-more, of the 38 estuaries with a low expression ofeutrophic conditions, 10 had high susceptibility, sug-gesting that they are at risk of future degradation, ifhuman-related nutrient inputs increase.
Implications for ManagementThe assessment of eutrophic conditions and influencingfactors provides a basis for identifying priority estuariesneeding remedial and preventive management action. Thelevel of human influence is a factor in determining to whatdegree management actions can reduce or reverseeutrophic problems; if the major influence is natural, thenit is likely that little can be done, except to plan appropri-ately. If the major influence is human-related, then impactsmay be reduced with appropriate management actions.Therefore, in the 36 estuaries with high expressions ofeutrophic conditions and high human influence, conditionscan be moderated or reversed with appropriate manage-ment action. The success of these efforts depends in parton susceptibility; low susceptibility enhances the effective-ness of nutrient reductions by flushing or diluting nutri-ents at the same time that inputs are reduced, while highlysusceptible estuaries may require greater effort due to theirnatural tendency to retain nutrients.
Of the non-impacted estuaries, those with moderate to highsusceptibility are in need of preventive action because theyare most at risk of developing problems if nutrient inputsincrease. In contrast, the estuaries that have low overallexpressions of eutrophic conditions, low human influenceand low susceptibility may not benefit as much from man-agement action. In general, these estuaries are less suscep-tible to developing problems to begin with. Some estuar-ies, such as many of those in Maine, exhibit naturally highlevels of eutrophic symptoms, mostly due to toxic algalblooms. In these estuaries, however, reductions in nutrientinputs are not likely to greatly affect conditions. While theseestuaries should not be ignored, nutrient control is not ur-gent at the present time.
A high level of human influence is associatedwith 36 of the 44 estuaries (82%) with a highexpression of eutrophic conditions.
Only six of the 44 estuaries (14%) with high-level eutrophic conditions have correspondinghigh-level nitrogen inputs.
Of the 44 estuaries with high-level eutrophicconditions, more than half (25) exhibit a highsusceptibility to retaining nutrients.
Key Findings
The 23 estuaries with high expressions ofeutrophic conditions and high susceptibilitywill likely require greater management effortand longer response time for results than thoseestuaries with low susceptibility. These estu-aries represent approximately 10% of nationalestuarine surface area in the study.
There are 10 estuaries, representing 3% of thenational estuarine surface area studied, thathave low eutrophic conditions and high suscep-tibility. Of the non-impacted estuaries, theseare the most at risk of developing problems.
Key Findings
EXHIBIT 21 (AR L.30)

43
Conclusions
Future Outlook and Management ConcernsExperts at the National Assessment Workshop esti-mated that the severity and extent of eutrophic con-ditions would worsen in 86 (nearly two-thirds) ofthe studied estuaries and in the Mississippi RiverPlume during the next 20 years, during which timethe coastal population is expected to increase bymore than 10 percent. The estuaries most at risk arethose that presently do not show symptoms but arehighly susceptible to retaining nutrients and are lo-cated in watersheds in which significant populationgrowth is projected. Most of these estuaries are lo-cated in the South Atlantic and Gulf of Mexico re-gions. Only eight (6%) of 138 estuaries are expectedto improve unless more is done to resolve this per-vasive environmental problem.
There is reason for optimism that eutrophication effectscan be moderated or reversed. The predictions of futureoutlook may not have taken into account the effective-ness of management efforts presently being pursued butnot yet completely effective, and those presently plannedbut not yet implemented. There have been measurableimprovements in estuaries (e.g., Tampa Bay, Sarasota Bay,and parts of Chesapeake Bay) for which there are com-prehensive watershed nutrient reduction strategies inplace, and from which lessons can be learned. The im-provements are mainly a result of point source treatment.However, there is a continued need to further reducenutrient inputs in order to counteract the effects of ex-pected population growth and other factors that promotethe development of eutrophic problems. If further man-agement actions are implemented and better coordinatednow, it is possible that the future outlook will be morepositive.
Nutrient inputs from agriculture, wastewater treat-ment, urban runoff, and atmospheric depositionwere identified as the most important managementtargets. Agricultural nutrient sources were men-tioned as especially important for management con-sideration in the Pacific, Gulf of Mexico, and SouthAtlantic regions. Wastewater treatment plants wereidentified most often in the North Atlantic. In theMiddle Atlantic, agriculture and atmospheric depo-sition were equally recommended as sources requir-ing management. The participants also emphasizedthe importance of managing nutrient inputs from awatershed perspective. Management plans must alsotake into account human and natural factors, includingsources of nutrients as well as watershed alterations thataffect the delivery of nutrients (e.g., the loss of wetlands)to maximize the benefit from nutrient reductions.
Eutrophic conditions could worsen in 86 estu-aries by the year 2020 if projected developmentpatterns are realized.
Of the 86 estuaries projected to worsen, 43 ex-hibit only low to moderate eutrophic condi-tions.
Of particular concern, especially if human-re-lated nutrient inputs increase, are the 10 estu-aries with low eutrophic conditions and highsusceptibility.
All of the typical point and nonpoint pollu-tion sources were identified at the National As-sessment Workshop as important to target inorder to manage nutrient problems. There are,however, some regional differences in impor-tant nutrient sources (e.g., combined seweroverflows in the North Atlantic).
Key Findings
EXHIBIT 21 (AR L.30)
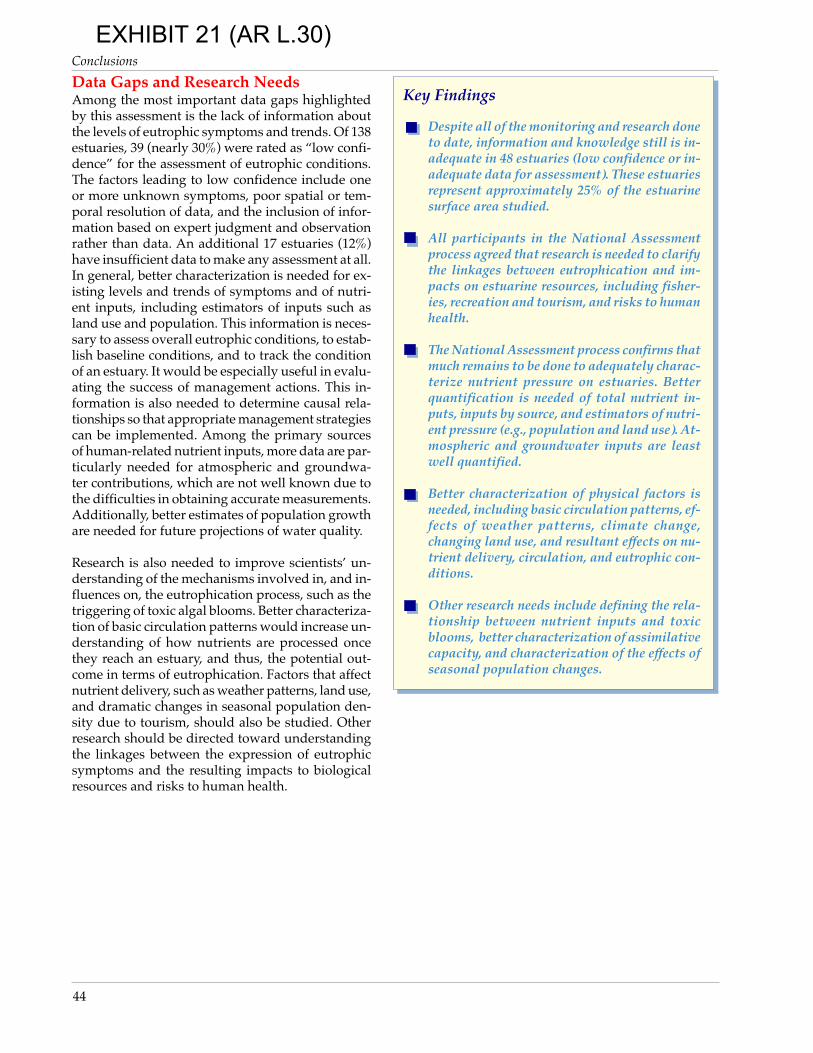
44
Conclusions
Data Gaps and Research NeedsAmong the most important data gaps highlightedby this assessment is the lack of information aboutthe levels of eutrophic symptoms and trends. Of 138estuaries, 39 (nearly 30%) were rated as “low confi-dence” for the assessment of eutrophic conditions.The factors leading to low confidence include oneor more unknown symptoms, poor spatial or tem-poral resolution of data, and the inclusion of infor-mation based on expert judgment and observationrather than data. An additional 17 estuaries (12%)have insufficient data to make any assessment at all.In general, better characterization is needed for ex-isting levels and trends of symptoms and of nutri-ent inputs, including estimators of inputs such asland use and population. This information is neces-sary to assess overall eutrophic conditions, to estab-lish baseline conditions, and to track the conditionof an estuary. It would be especially useful in evalu-ating the success of management actions. This in-formation is also needed to determine causal rela-tionships so that appropriate management strategiescan be implemented. Among the primary sourcesof human-related nutrient inputs, more data are par-ticularly needed for atmospheric and groundwa-ter contributions, which are not well known due tothe difficulties in obtaining accurate measurements.Additionally, better estimates of population growthare needed for future projections of water quality.
Research is also needed to improve scientists’ un-derstanding of the mechanisms involved in, and in-fluences on, the eutrophication process, such as thetriggering of toxic algal blooms. Better characteriza-tion of basic circulation patterns would increase un-derstanding of how nutrients are processed oncethey reach an estuary, and thus, the potential out-come in terms of eutrophication. Factors that affectnutrient delivery, such as weather patterns, land use,and dramatic changes in seasonal population den-sity due to tourism, should also be studied. Otherresearch should be directed toward understandingthe linkages between the expression of eutrophicsymptoms and the resulting impacts to biologicalresources and risks to human health.
Despite all of the monitoring and research doneto date, information and knowledge still is in-adequate in 48 estuaries (low confidence or in-adequate data for assessment). These estuariesrepresent approximately 25% of the estuarinesurface area studied.
All participants in the National Assessmentprocess agreed that research is needed to clarifythe linkages between eutrophication and im-pacts on estuarine resources, including fisher-ies, recreation and tourism, and risks to humanhealth.
The National Assessment process confirms thatmuch remains to be done to adequately charac-terize nutrient pressure on estuaries. Betterquantification is needed of total nutrient in-puts, inputs by source, and estimators of nutri-ent pressure (e.g., population and land use). At-mospheric and groundwater inputs are leastwell quantified.
Better characterization of physical factors isneeded, including basic circulation patterns, ef-fects of weather patterns, climate change,changing land use, and resultant effects on nu-trient delivery, circulation, and eutrophic con-ditions.
Other research needs include defining the rela-tionship between nutrient inputs and toxicblooms, better characterization of assimilativecapacity, and characterization of the effects ofseasonal population changes.
Key Findings
EXHIBIT 21 (AR L.30)

45
Toward A National Strategy
At present, there is not a comprehensive national strategy to address the potentially worsening problems of estuarine eutrophi-cation. However, the results from this Assessment can help provide an improved basis for setting national priorities for manage-ment, monitoring, and research. In combination with successes in individual estuaries, such as those recently reported forTampa and Sarasota Bays, these results can provide the information necessary to help guide the development of a comprehensivenational strategy to reduce problems where they are presently observed and protect the nation’s coastal waters from furtherdegradation.
Why is a National Strategy Needed?This National Assessment confirms that estuarineeutrophication is indeed a problem of national sig-nificance. It indicates that human-related nutrientsources, both nearby and far removed, are substan-tial contributors to eutrophic conditions within es-tuaries. Furthermore, many estuarine watershedscross the boundaries of states, requiring regional,subregional and interagency cooperation. Similarly,there are many important needs with regard to re-search, monitoring, and assess-ment that also call for a cogent na-tional strategy. In many instances, forexample, eutrophication research hasbeen conducted on a parochial andpiecemeal basis, which can impede therapid advance of scientific under-standing of the linkages betweeneutrophication and marine resources.
A national strategy is needed, espe-cially one that effectively integrateswatershed-specific approaches to as-sessment and management into acomprehensive approach.
How Can These Results BeUsed?National Assessment results can beused to help better focus national at-tention on existing and emerging pri-ority areas for action; i.e., management,monitoring, and research. The frame-work shown (Figure 30) can be usedto organize assessment results for thispurpose. In particular, estuaries thatare in serious condition should be pri-orities for management actions; thosein less serious condition, but at risk ofdeterioration, should be closely moni-tored, and efforts should be made toidentify preventive measures. In ad-dition, estuaries for which there is in-sufficient information should be tar-geted for basic monitoring and assess-ment activities.
The framework incorporates the overall eutrophiccondition of an estuary, its natural susceptibility toretain nutrients, and the level of nutrient inputs, tohelp set priorities for appropriate actions that willallow the most effective results given environmen-tal concerns and resource limitations. This processcan be considered environmental triage—necessarydue to limited resources—which allows the sortingof estuaries into groups based on their need for, or
Toward a National Strategy
Figure 30. A framework for developing a national strategy
Estuaries with No or Low symptoms
Impacted Estuaries - “Naturally Occurring”
Impacted Estuaries -Human Influenced Eutrophication
Moderate to High Susceptibility
Low Susceptibility
•Nutrient Management (reduce inputs)•Research
•Nutrient Management (reduce inputs)•Remediation (restore sea grasses, oyster beds, wetlands, etc.)•Research
•Research (linkages between nutrients and symptoms - e.g. harmful algal bloom research)
None to Low Secondary Symptoms
None to Low Primary Symptoms
Low Overall Eutrophic Conditions
Moderate to High Human Influence Nutrient Inputs
MANAGEMENT RESPONSEENVIRONMENTAL TRIAGE
Moderate to High Eutrophic Conditions
Low Human Influence
Unknown or Low Confidence in Susceptibility
•Susceptibility Research and Analysis
Considerations for Priority Setting and Actions Needed
Assessment of Eutrophic Condition and Human Influence
Assessment of Susceptibility
Unknown/Low Assessment Confidence
•Assessment of Eutrophic Condition
•Assessment of Nutrient Inputs
• Preventive Measures • Early Warning Monitoring
Moderate to High Susceptibility
Low Susceptibility
•Susceptibility Research and Analysis
•Preventive Measures•Early Warning Monitoring
“Naturally Occurring”Symptoms
Unknown or Low Confidence in Susceptibility
e.g. Toxic Blooms
Eutrophic ConditionsNutrient Inputs
priority need for basic assessments
requires more intensive effort
requires less intensive effort
EXHIBIT 21 (AR L.30)
46
Toward A National Strategy
Nutrient enrichment and associatedeutrophic conditions have been identi-fied as a critical problem in the nation’sestuaries for over three decades.
As the 20th century comes to a close, acogent and comprehensive nationalstrategy still remains elusive.
likely benefit from, treatment. By such sorting, aframework is created that allows for logical and ef-fective decisions on how to allocate limited manage-ment, monitoring, and research resources among alarge number of estuaries. Note that this is not theonly way that the National Assessment results mightbe used; this framework is offered as guidance forhow the information might be used in planning anational strategy.
ManagementThe national assessment indicates that eutrophicsymptoms are driven, in large measure, by human-related nutrient sources. However, the response of asystem to reductions in nutrient input is dependentupon its natural susceptibility in combination withthe level of nutrient input it receives. Thus, in themanagement of nutrient sources, no one nutrientcontrol strategy is likely to achieve the desired re-sults in all estuaries across the nation.
The proposed assessment framework provides abasis for distinguishing between the remediation ofsystems that are already impacted, and preventivemeasures in systems that are at risk due to potentialincreases in nutrient loading. Both are necessary forimproving and protecting the health of the nation’sestuaries, and the assessment results should be usedto guide appropriate management and remediationplans. For instance, different plans should be imple-mented for those estuaries that, although in seriouscondition, might be improved with additional man-agement effort; those in less serious condition but atrisk of worsening that should be closely monitoredand managed; and those for which a basic assess-ment is needed because there is presently insuffi-cient information to evaluate conditions. The selec-tion of priority estuaries for management actionwithin these groups should be based on the level ofeutrophic conditions, the influence of human activi-ties, and the natural sensitivity to nutrients, to as-sure the most effective results within the constraintsof limited resources. The national assessment pro-vides a heretofore unavailable capability to targetthe nation’s investments to control eutrophication.
Monitoring and ResearchSome of the most useful information that has beendeveloped while conducting this assessment is acomprehensive understanding of what is actuallyknown about the phenomenon called “eutrophica-tion,” how well it is known, and whether it is un-derstood well or not at all. When taken together, theassessment data base and framework provide a“working model” for designing and evaluating the
efficiency and effectiveness of alternative nationalstrategies for monitoring and research.
For example, there is a need to strike the right bal-ance between monitoring designed primarily to de-scribe spatial patterns or extent (e.g., EPA’s Environ-mental Monitoring and Assessment Program) andfixed, continuous monitoring that emphasizes tem-poral resolution (both short- and long-term) and thetracking of nutrients and eutrophic symptoms. Thedata base and framework can also be used to deter-mine how monitoring programs can be integratedacross scales (local, regional, national) and across me-dia (water, air, land).
The assessment results also reconfirm the need formonitoring programs that are capable of document-ing ephemeral or real-time changes in symptoms,such as day-to-night fluctuations in dissolved oxy-gen, as well as over long time frames. Observationalsystems, such as the Global Ocean Observing Sys-tem that is presently being developed, need to bepromoted and sustained.
Within the framework of research, the detail that theassessment provides on the perspective of estuariesas mixing zones between rivers and oceans is invalu-able for determining where to direct many researchefforts. For example, the results of this national as-sessment should provide useful input to the NationalResearch Council’s ongoing study of the causes andmanagement of coastal eutrophication, which willhelp to further identify key science needs.
EXHIBIT 21 (AR L.30)
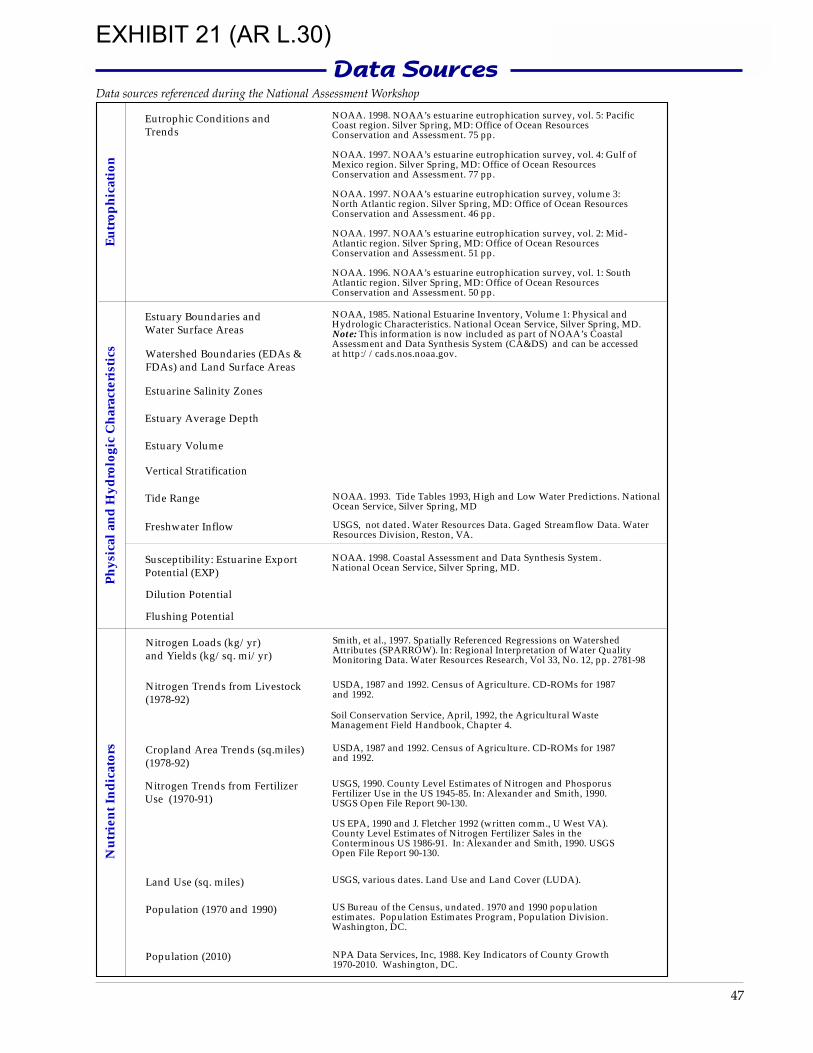
47
Toward A National Strategy
Data sources referenced during the National Assessment Workshop
Data Sources
Ph
ysic
al a
nd
Hyd
rolo
gic
Ch
arac
teri
stic
sN
utr
ien
t In
dic
ator
s
NOAA, 1985. National Estuarine Inventory, Volume 1: Physical and Hydrologic Characteristics. National Ocean Service, Silver Spring, MD.Note: This information is now included as part of NOAA’s Coastal Assessment and Data Synthesis System (CA&DS) and can be accessed at http://cads.nos.noaa.gov.
NOAA. 1993. Tide Tables 1993, High and Low Water Predictions. National Ocean Service, Silver Spring, MD
USGS, not dated. Water Resources Data. Gaged Streamflow Data. Water Resources Division, Reston, VA.
Smith, et al., 1997. Spatially Referenced Regressions on Watershed Attributes (SPARROW). In: Regional Interpretation of Water Quality Monitoring Data. Water Resources Research, Vol 33, No. 12, pp. 2781-98
USDA, 1987 and 1992. Census of Agriculture. CD-ROMs for 1987 and 1992.
USGS, 1990. County Level Estimates of Nitrogen and Phosporus Fertilizer Use in the US 1945-85. In: Alexander and Smith, 1990. USGS Open File Report 90-130.
US EPA, 1990 and J. Fletcher 1992 (written comm., U West VA). County Level Estimates of Nitrogen Fertilizer Sales in the Conterminous US 1986-91. In: Alexander and Smith, 1990. USGS Open File Report 90-130.
USGS, various dates. Land Use and Land Cover (LUDA).
US Bureau of the Census, undated. 1970 and 1990 population estimates. Population Estimates Program, Population Division. Washington, DC.
NPA Data Services, Inc, 1988. Key Indicators of County Growth 1970-2010. Washington, DC.
Estuary Boundaries and Water Surface Areas
Estuarine Salinity Zones
Estuary Average Depth
Estuary Volume
Watershed Boundaries (EDAs & FDAs) and Land Surface Areas
Vertical Stratification
Freshwater Inflow
Dilution Potential
Flushing Potential
Susceptibility: Estuarine Export Potential (EXP)
Tide Range
NOAA. 1998. Coastal Assessment and Data Synthesis System. National Ocean Service, Silver Spring, MD.
Nitrogen Loads (kg/yr)and Yields (kg/sq. mi/yr)
Nitrogen Trends from Livestock (1978-92)
Nitrogen Trends from Fertilizer Use (1970-91)
Cropland Area Trends (sq.miles) (1978-92)
Land Use (sq. miles)
Population (1970 and 1990)
Population (2010)
Soil Conservation Service, April, 1992, the Agricultural Waste Management Field Handbook, Chapter 4.
USDA, 1987 and 1992. Census of Agriculture. CD-ROMs for 1987 and 1992.
Eu
trop
hic
atio
nNOAA. 1998. NOAA’s estuarine eutrophication survey, vol. 5: Pacific Coast region. Silver Spring, MD: Office of Ocean Resources Conservation and Assessment. 75 pp.
NOAA. 1997. NOAA’s estuarine eutrophication survey, vol. 4: Gulf of Mexico region. Silver Spring, MD: Office of Ocean Resources Conservation and Assessment. 77 pp.
NOAA. 1997. NOAA’s estuarine eutrophication survey, volume 3: North Atlantic region. Silver Spring, MD: Office of Ocean Resources Conservation and Assessment. 46 pp.
NOAA. 1997. NOAA’s estuarine eutrophication survey, vol. 2: Mid-Atlantic region. Silver Spring, MD: Office of Ocean Resources Conservation and Assessment. 51 pp.
NOAA. 1996. NOAA’s estuarine eutrophication survey, vol. 1: South Atlantic region. Silver Spring, MD: Office of Ocean Resources Conservation and Assessment. 50 pp.
Eutrophic Conditions and Trends
EXHIBIT 21 (AR L.30)

48
EXHIBIT 21 (AR L.30)

Appendix A: Methods
49
National Survey: Data Collection andSynthesisNOAA conducted three workshops in 1991-92 withlocal and regional estuarine scientists and coastal re-source managers. Two workshops held in January1991 consisted of presentations by invited speakersand discussions of the measures and effects associ-ated with nutrient problems. The purpose was tofacilitate the exchange of ideas on how to best char-acterize eutrophication in U.S. estuaries and to con-sider suggestions for the design of NOAA's pro-posed data collection survey. A third workshop, heldin April 1992, focused specifically on developingrecommendations for conducting a nationwide sur-vey.
Given the limited resources available for this project,it was not practical to try to gather and consolidatethe existing data records. Even if it were possible todo this, it would be very difficult to merge these datainto a comprehensible whole due to incompatibledata types, formats, time periods, and methods. Al-ternatively, NOAA elected to systematically acquirea consistent and detailed set of qualitative data fromthe existing expert knowledge base (i.e., coastal andestuarine scientists) through a series of surveys, in-terviews, and regional workshops. Based on theworkshops and additional meetings with experts,NOAA identified information requirements for a setof parameters which could be used to characterizeestuarine nutrient enrichment and eutrophication
This appendix describes the methodology used in the National Eutrophication Survey and the National Estuarine Eutrophi-cation Assessment. The survey process was used to establish a database of current (ca. 1995) eutrophication conditions andtrends (ca. 1970-1995) for all coastal regions of the coterminous United States. The National Assessment is an aggregationand interpretation of the Eutrophication Survey data plus additional assessments of human influence, future outlook,impaired uses, potential management concerns, and data gaps and research needs.
conditions. To be included in the survey, a param-eter had to be (1) essential for accurate characteriza-tion of nutrient enrichment related phenomena; (2)generally available for most estuaries; (3) compa-rable among estuaries; and (4) based upon existingdata and/or knowledge (i.e., no new monitoring oranalysis required).
The next step was to establish response ranges foreach parameter to ensure discrete gradients amongresponses. For example, the survey asked whethertotal dissolved nitrogen in the water column is high,medium, or low based upon specific thresholds(High ≥ 1 mg/l, Medium ≥ 0.1 < 1 mg/l, low > 0<0.1 mg/l, or unknown). The ranges were deter-mined from reviewing nationwide data and fromdiscussions with eutrophication experts. The thresh-olds used to classify ranges are designed to distin-guish conditions among estuaries on a national ba-sis.
Data Collection Framework. For each parameter,information was collected for existing conditions andrecent trends (circa 1970-1995). Existing conditionsdescribe maximum parameter values observed overa typical annual cycle (e.g., normal freshwater in-flow, average temperatures, etc.). For instance, fornutrients, information was collected characterizingpeak concentrations observed during the annualcycle such as those associated with spring runoffand/or turnover. For chlorophyll a, information wascollected on peak concentrations that are typically
reached during a bloom period.Additional information describ-ing the timing and duration ofexisting conditions was col-lected.
SurveyDesign
testing, review
National Survey
next steps workshop
Site Visits
Assessment Workshops
Regional Reports
Eutrophication Survey Process
Appendix A: Methods
EXHIBIT 21 (AR L.30)

Appendix A: Methods
50
Eutrophication Survey Parameters
CHLOROPHYLL A
TURBIDITY
SUSPENDED SOLIDS
NUISANCE ALGAE
TOXIC ALGAE
MACROALGAE
EPIPHYTES
NITROGEN
ANOXIA (0 mg/l)
HYPOXIA (>0mg/l ≤ 2mg/l)
BIOL. STRESS (>2mg/l ≤ 5mg/l)
PRIMARY PRODUCTIVITY
PLANKTONIC COMMUNITY
SUBMERGED AQUATIC VEG.
INTERTIDAL WETLANDS
EXISTING CONDITIONS TRENDS
Hypereutrophic (>60 µg chl-a/l) High (>20, ≤60 µg chl-a/l)Medium (>5, ≤20 µg chl-a/l) Low (>0, ≤5 µg chl-a/l)
• Surface concentrations:
• Limiting factors to algal biomass (N, P, Si, light, other)
• Spatial coverage1, Months of occurrence, Frequency of occurrence2
• Secchi disk depths:
High (<1m), Medium (1≥m, ≤3m), Low (>3m), Blackwater area
• Concentrations3,4
• Concentrations:
Problem (significant impact upon biological resources)No Problem (no significant impact)
• Months of occurrence, Frequency of occurrence2
• Occurrence
• Dominant species
• Event duration (Hours, Days, Weeks, Seasonal, Other)
• Abundance
• Maximum dissolved surface concentration:
High (≥1 mg/l), Medium (≥0.1, <1 mg/l), Low (≥0, < 0.1 mg/l)
High (≥0.1 mg/l), Medium (≥0.01, <0.1 mg/l), Low (≥0, < 0.01 mg/l)
• Dissolved oxygen condition
(Surface, Bottom, Throughout water column)
(High, Medium, Low, Not a factor)• Stratification (degree of influence):
• Water column depth:
• Dominant primary producer:
Pelagic, Benthic, Other
• Temporal shift
• Dominant taxonomic group (number of cells):
Diatoms, Flagellates, Blue-green algae, Diverse mixture, Other
Crustaceans, Molluscs, Annelids, Diverse mixture, Other
• Temporal shift
BENTHIC COMMUNITY• Dominant taxonomic group (number of organisms): • Temporal shift
PARAMETERS
PHOSPHORUS
• Maximum dissolved surface concentration:
• Spatial coverage1, Months of occurrence
• Limiting factors
• Contributing factors5
• Concentrations3,4
• Contributing factors5
• Event duration3,4
• Frequency of occurrence3,4
• Contributing factors5
• Abundance3,4
• Contributing factors5
• Concentrations3,4
• Contributing factors5
• Concentrations3,4
• Contributing factors5
• Min. avg. monthly bottom dissolved oxygen conc.3,4
• Frequency of occurrence3,4
• Event duration3,4
• Spatial coverage3,4
• Contributing factors5
• Contributing factors5
• Contributing factors5
• Contributing factors5
• Spatial coverage3,4
• Contributing factors5
NOTES
(1) SPATIAL COVERAGE (% of salinity zone): High (>50, ≤100%), Medium (>25, ≤50% ), Low (>10, ≤25%), Very Low (>0, ≤10% ), No SAV / Wetlands in system
(2) FREQUENCY OF OCCURRENCE: Episodic (conditions occur randomly), Periodic (conditions occur annually or predictably), Persistent (conditions occur continually throughout the year)
(3) DIRECTION OF CHANGE: Increase, Decrease, No trend
(4) MAGNITUDE OF CHANGE: High (>50%, ≤100%), Medium (>25%, ≤50%), Low (>0%, ≤25%)
(5) POINT SOURCE(S), NONPOINT SOURCE(S), OTHER
• Spatial coverage1, Months of occurrence, Frequency of occurrence2
• Months of occurrence, Frequency of occurrence2
• Months of occurrence, Frequency of occurrence2
• Spatial coverage1, Months of occurrence
• Spatial coverage1, Months of occurrence, Frequency of occurrence2
• Spatial coverage1
(maximum values observed over a typical annual cycle) (1970 - 1995)
(no trends information collected)
Problem (significant impact upon biological resources)No Problem (no significant impact)
ObservedNo Occurrence
ALG
AL
CO
ND
ITIO
NS
NU
TR
IEN
TS
DIS
SO
LVE
D O
XY
GE
NE
CO
SY
ST
EM
/ C
OM
MU
NIT
Y R
ES
PO
NS
E
Problem (significant impact upon biological resources)No Problem (no significant impact)
EXHIBIT 21 (AR L.30)

Appendix A: Methods
51
NOAA's National Estuarine Inventory (NEI) wasused as a spatial framework to collect and organizeinformation. Each parameter was characterized forthree salinity zones as defined in the NEI (tidal fresh0-0.5 ppt, mixing 0.5-25 ppt, and seawater >25 ppt),providing a consistent basis for comparisons amongthe estuarine systems.
Data Collection. Survey forms designed to collectinformation on 16 parameters related to nutrient en-richment and eutrophication were mailed in 1993 toover 400 experts who had agreed to participate inthe survey. The response rate was approximately 25percent with at least one response for 112 of the 129estuaries being surveyed. The survey methods and
Regional Workshop Assessment Review Process
Part 3
• –––––––• –––––––• –––––––• –––––––• –––––––
Part 2
• –––––––• –––––––• –––––––• –––––––• –––––––
Estuary 1 Salinity Zone Considerations
Part 1
• –––––––• –––––––• –––––––• –––––––• –––––––
question 1 question 2 question 3
Not Answerable
Notes
Consensus
Next Part
Next Estuary
Part 1
Spatial Framework Example
initial results were evaluated in May 1994 by a panelof NOAA, state, and academic experts. The panelrecommended that NOAA proceed with a regionalapproach for completing data collection, includingsite visits with selected experts to fill data gaps, re-gional assessment workshops to finalize and reachconsensus on the responses to each question, andregional reports on the results. Estuaries were tar-
geted for site visits based upon the completenessof the data received from the original mailed sur-vey forms. The new information collected fromsite visits was incorporated into the project database and summary materials were then preparedfor regional workshops.
Workshop participants included local and re-gional experts (at least one per estuary represent-ing the group of people with the most extensiveknowledge and insight about an estuary). In gen-eral, these persons had either filled out a surveyform and/or participated in a site visit. Prepara-tions included sending all regional data to par-ticipants prior to workshops. Participants werealso encouraged to bring to the workshops rel-evant data and reports. During the workshops,NOAA staff facilitated a careful discussion andreview of the survey data and salinity maps foreach estuary and recorded the results accordingly.
Participants were also asked to rank the reliabil-ity as either highly certain or speculative infer-ence, reflecting the robustness of the data the re-sponse is based on. This is especially importantgiven that responses are based upon a range of
information sources from statistically tested moni-toring data to general observations. Following theworkshops, results were summarized for review byworkshop participants. The information was thencompiled into regional reports that were also re-viewed by participants prior to publication.
EXHIBIT 21 (AR L.30)

Appendix A: Methods
52
Analysis of Data Completeness andReliability (DCR)The estuarine eutrophication survey is a compila-tion of information for 16 water quality parametersthat are related to nutrient enrichment. These pa-rameters, in various combinations and at specificlevels, are reflections of eutrophic conditions. Foreach of these parameters, information on charac-teristics of timing, duration, spatial coverage, andfrequency of occurrence was also collected as ap-propriate. The robustness of this data set is affectedby two factors - missing data and data that arejudged to be based on speculative inference. Datagaps were created when respondents could not sup-ply information —either information was not avail-able or was of insufficient quality or quantity to give
a reasonable answer. Responses were deemed specu-lative when, in the respondents judgment, they werebased on either very limited data or general observa-tions. The extent of data gaps and speculative re-sponses is important because formulations developedto assess the rating of eutrophication status on a na-tional basis use combinations of the parameters andparameter characteristics. The power of these formu-lations to accurately discriminate among systems isreduced if they contain significant gaps or a high de-gree of speculative inferences.
Data completeness and reliability was defined as thepercent of the total area of the estuary for which therewas a known value that was considered highly cer-tain for each parameter. DCR was calculated as follows:
2. A rating based on the DCR score was assigned to each parameter and to the entire system as follows:
High = 75 - 100 %Medium = 50 - 74%Low = 0 - 49%
The entire estuarine system DCR value was then computed as the mean of the parameter DCRs.
Chlorophyll a Concentration * Spatial Coverage * Frequency * ReliabilityEpiphytes Concentration * Frequency * ReliabilityMacroalgae Concentration * Frequency * ReliabilityDissolved Oxygen** Concentration * Spatial Coverage * Frequency * ReliabilitySAV Direction of change * Magnitude *ReliabilityNuisance algae Concentration * Frequency * Duration * ReliabilityToxic algae Concentration * Frequency * Duration * Reliability
** (mean of Anoxia, Hypoxia, and Biological Stress
The DCR scores were used by participants at the National Assessment Workshop to help assign confidenceratings to the overall eutrophic conditions assessment of estuaries (see Appendix B).
Surf. Area (sq. mi.)
Concen-tration Reliability
Spatial Coverage Reliability
Freq-uency Reliability
Sum of DCR Area
Survey response 3 Low Highly
certain Not eval. Not eval. Not eval. Not eval. --
DCR value 3 1 1 1 1 1 1 3
Survey response 28.8 Medium Highly
certain High Spec-ulative Periodic Highly certain --
DCR value 28.8 1 1 1 0 1 1 0
Survey response 18.1 Unknown Unknown Unknown Unknown Unknown Unknown --
DCR value 18.1 0 0 0 0 0 0 0
49.9 -- -- -- -- -- -- 3System Total
Tidal Fresh
Mixing
Seawater
Salinity Zone
Note that the speculative reliability rating for the spatial coverage call in the mixing zone and theunknown call for chlorophyll a concentration in the seawater zone result in the areas of these zonesbeing zeroed out in the calculation. Note also that spatial coverage and frequency are not evaluatedwhen concentrations are low. Thus, the DCR value for this parameter for this estuary would be:
(3 (tidal fresh) + 0 (mixing) + 0 (seawater))/System Total = 3/49.9 = 0 .061
Thus the DCR in the example above would be rated Low (6.1%).
The following is an example of the DCR calculation of chlorophyll a for an estuary.
1. A DCR calculation was made for each estuary by using the following combinations of parameter characteristics:
EXHIBIT 21 (AR L.30)
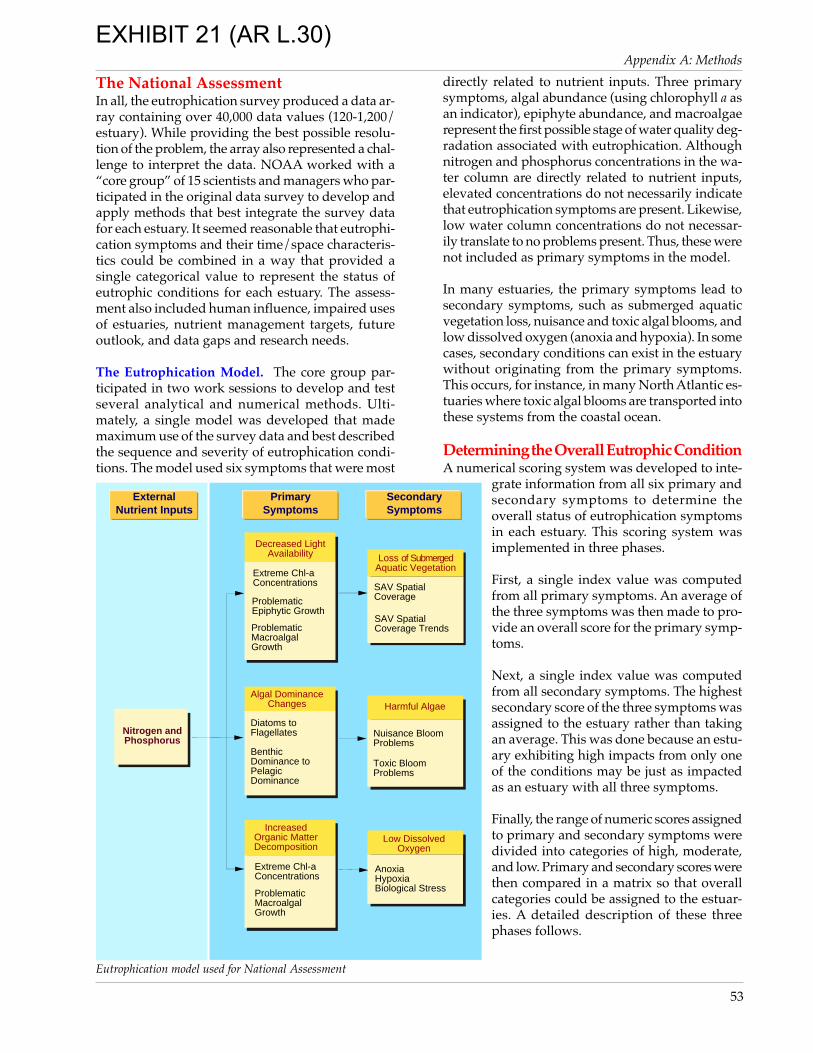
Appendix A: Methods
53
The National AssessmentIn all, the eutrophication survey produced a data ar-ray containing over 40,000 data values (120-1,200/estuary). While providing the best possible resolu-tion of the problem, the array also represented a chal-lenge to interpret the data. NOAA worked with a“core group” of 15 scientists and managers who par-ticipated in the original data survey to develop andapply methods that best integrate the survey datafor each estuary. It seemed reasonable that eutrophi-cation symptoms and their time/space characteris-tics could be combined in a way that provided asingle categorical value to represent the status ofeutrophic conditions for each estuary. The assess-ment also included human influence, impaired usesof estuaries, nutrient management targets, futureoutlook, and data gaps and research needs.
The Eutrophication Model. The core group par-ticipated in two work sessions to develop and testseveral analytical and numerical methods. Ulti-mately, a single model was developed that mademaximum use of the survey data and best describedthe sequence and severity of eutrophication condi-tions. The model used six symptoms that were most
Nitrogen and Phosphorus
Extreme Chl-a Concentrations
Problematic Epiphytic Growth
SAV Spatial Coverage
Diatoms to Flagellates
Benthic Dominance to Pelagic Dominance
AnoxiaHypoxiaBiological Stress
Nuisance Bloom Problems
Toxic Bloom Problems
Primary Symptoms
Secondary Symptoms
Extreme Chl-a Concentrations
Problematic MacroalgalGrowth
Problematic MacroalgalGrowth
Loss of Submerged Aquatic Vegetation
SAV Spatial Coverage Trends
Decreased Light Availability
Algal Dominance Changes Harmful Algae
Increased Organic MatterDecomposition
Low Dissolved Oxygen
External Nutrient Inputs
Eutrophication model used for National Assessment
directly related to nutrient inputs. Three primarysymptoms, algal abundance (using chlorophyll a asan indicator), epiphyte abundance, and macroalgaerepresent the first possible stage of water quality deg-radation associated with eutrophication. Althoughnitrogen and phosphorus concentrations in the wa-ter column are directly related to nutrient inputs,elevated concentrations do not necessarily indicatethat eutrophication symptoms are present. Likewise,low water column concentrations do not necessar-ily translate to no problems present. Thus, these werenot included as primary symptoms in the model.
In many estuaries, the primary symptoms lead tosecondary symptoms, such as submerged aquaticvegetation loss, nuisance and toxic algal blooms, andlow dissolved oxygen (anoxia and hypoxia). In somecases, secondary conditions can exist in the estuarywithout originating from the primary symptoms.This occurs, for instance, in many North Atlantic es-tuaries where toxic algal blooms are transported intothese systems from the coastal ocean.
Determining the Overall Eutrophic ConditionA numerical scoring system was developed to inte-
grate information from all six primary andsecondary symptoms to determine theoverall status of eutrophication symptomsin each estuary. This scoring system wasimplemented in three phases.
First, a single index value was computedfrom all primary symptoms. An average ofthe three symptoms was then made to pro-vide an overall score for the primary symp-toms.
Next, a single index value was computedfrom all secondary symptoms. The highestsecondary score of the three symptoms wasassigned to the estuary rather than takingan average. This was done because an estu-ary exhibiting high impacts from only oneof the conditions may be just as impactedas an estuary with all three symptoms.
Finally, the range of numeric scores assignedto primary and secondary symptoms weredivided into categories of high, moderate,and low. Primary and secondary scores werethen compared in a matrix so that overallcategories could be assigned to the estuar-ies. A detailed description of these threephases follows.
EXHIBIT 21 (AR L.30)

Appendix A: Methods
54
Chlorophyll a Level of Expression Determination
Concentration
Hypereutrophic
or
High
Spatial Coverage
High
Moderate
Low
Frequency
Periodic
Periodic
Periodic
EpisodicHigh
EpisodicModerate
Spatial coverage and frequency of occurrence are used to determine the level of expression for each salinity zone and are then aggregated up to the estuary level (See Estuary Aggregation Rules ).
Expression
High
High
Moderate
Moderate
High
THEN
Concentration
Medium
1
1
0.5
1
0.5
Very Low Periodic Moderate 0.5
Spatial Coverage
High
Moderate
Low/Very Low
Frequency
EpisodicHigh
EpisodicMod/Low/Very Low
High
Moderate
Low
Low
Moderate
1
0.5
0.25
0.5
0.25
Unknown Flag A 0.5
Unknown Flag A 0.5
Concentration
Low Low 0.25
Value
Expression
Expression
Any Frequency
Any Frequency
EpisodicLow/Very Low Low 0.25
Unknown Flag A 0.5
Unknown Flag A 0.5
Any SpatialCoverage
Spatial Coverage Frequency
Any Frequency
Concentration Spatial Coverage Frequency
Unknown Unknown UnknownNot included in calculation
at zone level
AND ANDIF
Periodic
Periodic
Periodic
Any SpatialCoverage
Any SpatialCoverage
Phase 1: Primary Symptoms Method Description. This method assesses the level of expression of chlorophylla concentrations, epiphyte abundance problems, and macroalgal abundance problems. The method uses onlythe survey information pertinent to each particular symptom to determine the level of expression. For chloro-phyll a, concentration, spatial coverage and frequency of occurrence are used; for epiphytes and macroalgae, thefrequency of occurrence of problem conditions was used.
Classification Criteria. The following is a set of decision rules which were applied to the eutrophication surveydata to determine the level of expression of the primary symptoms.
EXHIBIT 21 (AR L.30)

Appendix A: Methods
55
Flags A through C are used to identify components for which not enough data was available. In these cases, assumptionswere made based on conservative estimates that unknown spatial coverage is at least 10 percent of a zone, and thatunknown frequency is at least episodic.
Phase 1: Primary Symptoms Method, continued.
Epiphyte Problem Level of Expression DeterminationThe frequency of problematic epiphytic growth is used to determine level of expression at the salinity zone level and is then aggregated up to the estuary level (See Estuary Aggregation Rules).
Epiphyte Problems
Observed
High
Moderate
Frequency
Episodic
Unknown Flag B
Expression Value
1
0.5
0.5
Unknown UnknownNot included in calculation at zone level
Periodic
ANDIF THEN
Macroalgae Problem Level of Expression DeterminationThe frequency of problematic macroalgal growth is used to determine level of expression at the salinity zone level and is then aggregated up to the estuary level (See Estuary Aggregation Rules).
Macroalgae Problems
Observed
High
Moderate
Frequency
Episodic
Unknown Flag C
Expression Value
1
0.5
0.5
Periodic
Unknown UnknownNot included in calculation at zone level
ANDIF THEN
Estuary Aggregation Rules
For each symptom (chlorophyll a, epiphytes, and macroalgae), an area weighted expression value for each zone is determined. First the surface area of the salinity zone is multiplied by the symptom expression value for the zone and then divided by the surface area of the entire estuary to obtain an area weighted value for the zone. The area weighted values are then summed to obtain the estuary level of expression value for the symptom.
Estuary Expression Value
≥ 0 to ≤ 0.3>0.3 to ≤ 0.6>0.6 to ≤ 1
Level of Expression Category Assigned
LowModerateHigh
The level of expression of the primary symptoms for the estuary is determined by calculating the average of the three estuary level of expression values (chlorophyll a, epiphytes, and macroalgae).
The estuary is then assigned a category for Primary Symptoms as follows:
n= total number of zones in estuary
Az= surface area of a single zone
At= total surface area of estuary
Symbols:
At
A z∑i = 1
nExpression
Value= symptom level of expression value for estuary
1.
2.
3.
EXHIBIT 21 (AR L.30)

Appendix A: Methods
56
Low Dissolved Oxygen Level of Expression Determination
Spatial coverage and frequency of occurrence are used to determine level of expression at the zone level and are then aggregated up to the estuary level (See Estuary Aggregation Rules ).
Anoxia
Observed
Spatial Coverage
High
Moderate
Low
Frequency
Periodic
Periodic
Periodic
EpisodicHigh
EpisodicModerate/Low/Very Low
Expression
High
High
Moderate
Low
Moderate
Hypoxia
Observed
1
1
0.5
0.5
0.25
Very Low Periodic Low 0.25
Spatial Coverage
High
Mod
Low/Very Low
Frequency
Periodic
Periodic
Periodic
EpisodicHigh
EpisodicModerate/Low/Very Low
High
Moderate
Low
Low
Moderate
1
0.5
0.25
0.5
0.25
Unknown Flag A 0.25
Unknown Flag B 0.25
Biological Stress
Observed
Spatial Coverage
High
Moderate/Low /Very Low
Frequency
Periodic
Periodic
Episodic
Moderate
Low
Low
0.5
0.25
0.25
Unknown Flag C 0.25
Any Spatial Coverage
Value
Expression Value
Expression Value
Any frequency
Any frequency
Any frequency
AND ANDIF THEN
Phase 2: Secondary Symptoms Method Description. This method uses the same approach as used for theprimary symptoms in order to assess the level of expression of depleted dissolved oxygen (anoxia, hypoxia,biological stress), submerged aquatic vegetation decline, and nuisance/toxic blooms. The method uses the in-formation pertinent to each particular symptom to determine the level of expression. For depleted dissolvedoxygen, spatial coverage and frequency of occurrence were used; for submerged aquatic vegetation decline, themagnitude of change of the decline in spatial extent was used; for nuisance/toxic blooms, the duration of bloomevents and frequency of occurrence was used.
Classification Criteria. The following is a set of decision rules which were applied to the eutrophication surveydata to determine the level of expression for low dissolved oxygen conditions, submerged aquatic vegetationdeclines, and nuisance/toxic blooms.
EXHIBIT 21 (AR L.30)

Appendix A: Methods
57
Phase 2: Secondary Symptoms Method Description, continued.
Flags A through F are used to identify impacts for which not enough data was available for the components. In thesecases, assumptions were made based on conservative estimates that unknown spatial coverage is at least 10 percent ofthe zone, unknown duration is at least days, and unknown frequency is at least episodic.
Nuisance and Toxic Blooms Level of Expression Determination
Submerged Aquatic Vegetation (SAV) Loss Level of Expression Determination
The magnitude of loss of the decline is used to determine the level of expression at the zone level and is then aggregated up to the estuary level (See Estuary Aggregation Rules ).
SAV Loss
Observed
High
Moderate
Low
Magnitude of Loss
High
Moderate
Low
Unknown Flag D
Expression Value
1
0.5
0.25
0.25
ANDIF THEN
The duration of bloom events and frequency of occurrence is used to determine impact severity at the salinity zone level, and are then aggregated up to the estuary level (See Estuary Aggregation Rules).
S = seasonal, M = months, V = variable, W = weeks, D = days, WS = weeks to seasonal, WM = weeks to months, DW = days to weeks
FrequencyNuisance Blooms
Problem
Duration Expression
DW, V, W
D
Moderate
Low
Episodic
Unknown
M, WM, WS, S, PR Periodic High 1
Value
Periodic 0.5
Periodic 0.25
DW, V, W
D
M, WM, WS, S, PR
Episodic
Episodic
Moderate
Low
0.5
0.25
Low 0.25
Flag E 0.25
FrequencyToxic Blooms
Problem
Duration Expression
DW, W, V
D
Moderate
Low
Episodic
Unknown
M, WM, WS, S, PR Periodic High 1
Value
Periodic 0.5
Periodic 0.25
DW, W, V
D
M, WM, WS, S, PR
Episodic
Episodic
Moderate
Low
0.5
0.25
Low 0.25
Flag F 0.25
Any Frequency
Any frequency
ANDIF THENAND
EXHIBIT 21 (AR L.30)

Appendix A: Methods
58
Phase 3: Determination of the OverallLevel of Expression of Eutrophic Condi-tions. The primary and secondary symp-toms were next compared in a matrix to de-termine an overall ranking of eutrophic con-ditions for the estuary. The overall assess-ments were reviewed by experts at the Na-tional Assessment Workshop. In some caseschanges were made to these assessmentsbased on the experts knowledge of the es-tuary. For instance, if an estuary was nearthe borderline of moderate and moderatelyhigh, expert judgement may have been usedto move the category up or down based oncomparison with the condition of othersimilar estuaries in the area.
In this report low and moderate low aregrouped together as low; moderate high andhigh are grouped together as high.
Phase 2: Secondary Symptoms Method Description, Continued.
Interpretation and Review. At the NationalAssessment Workshop, experts reviewedeach primary and secondary symptom as-sessment for all 138 estuaries in the survey.In some cases changes were made to theseassessments based on the experts knowl-edge of the estuary. For instance, borderlineestuaries with values around 0.3 and 0.6were sometimes moved up or down a cat-egory level based on the experts knowledgeof recent conditions not reflected by theoriginal survey data.
OVERALL LEVEL OF EXPRESSION OF EUTROPHIC CONDITIONS
LOW
MODERATE
MODERATE LOW MODERATE HIGH
Moderate secondary symptoms indicate substantial eutrophic conditions, but low primary indicates other factors may be involved in causing the conditions.
Level of expression of eutrophic conditions is minimal.
High secondary symptoms indicate serious problems, but low primary indicates other factors may also be involved in causing the conditions.
Primary symptoms begining to indicate possible problems but still very few secondary symptoms expressed.
Primary symptoms high but problems with more serious secondarysymptoms still not being expressed.
Level of expression of eutrophic condtions is substantial.
Substantial levels of eutrophic conditions occurring with secondary symptoms indicating serious problems.
Primary symptoms high and substantial secondary symptoms becoming more expressed, indicating potentially serious problems.
High primary and secondary symptom levels indicate serious eutrophication problems.
MODERATE LOW HIGH
MODERATE MODERATE HIGH HIGH
Low Secondary Symptoms
Moderate Secondary Symptoms
High Secondary Symptoms
0 0.3 0.6 1
Low
Prim
ary
Sym
ptom
sM
oder
ate
Prim
ary
Sym
ptom
sH
igh
Prim
ary
Sym
ptom
s
0.3
0.6
1
n= total number of zones in estuary
Az= surface area of a single zone
At= total surface area of estuary
Symbols:
At
A z∑i = 1
nExpression
Value
symptom levelof expressionvalue for estuary
=
For each symptom (anoxia, hypoxia, biological stress, submerged aquaticvegetation loss, nuisance blooms, toxic blooms), an area weighted expres-sion value for each zone is determined. First the surface area of the salinityzone is multiplied by the symptom expression value for the zone and thendivided by the surface area of the entire estuary to obtain an area weightedvalue for the zone. The area weighted values are then summed to obtainthe estuary level of expression value for the symptom.
The level of expression of the secondary symptoms for the estuary is de-termined by choosing the highest of the three estuary level symptom ex-pression values (depleted dissolved oxygen, submerged aquatic vegeta-tion loss, and nuisance/toxic blooms). For dissolved oxygen the highestvalue is chosen from the anoxia, hypoxia, or biological stress values. Forblooms the highest value is chosen from the nuisance or toxic bloom val-ues.
The estuary is then assigned a category for Secondary Symptoms as follows:
1.
2.
3.
Expression Value
≥ 0 to ≤ 0.3 >0.3 to ≤ 0.6>0.6 to ≤ 1
Level of Expression Category Assigned
LowModerateHigh
Estuary Aggregation Rules
EXHIBIT 21 (AR L.30)

Appendix A: Methods
59
IF: Vertical Stratification THEN: Dilution Volume IF: Dilution Value Dilution Potential
Vertically Homogenous •all year•throughout estuary
Minor Vertical Stratification•navigation channels•upper estuary
Vertically Stratified•most of year•most of estuary
1 / VOLestuary
1 / VOLestuary
1 / VOLfwf
10-13
10-12HIGH
10-10
10-09
10-11 MODERATE
LOW
Number of Estuaries
30
63
45
Type
A
B
C(fwf = freshwater fraction)
Determining Overall Human InfluenceThis analysis was performed as an attempt to determinethe extent to which human activities have contributed tothe observed eutrophic symptoms and conditions. Theunderlying assumption is that any particular level ofnutrient input will have varying effects in different estu-aries due to varying levels of susceptibility to the nutri-ent inputs. Therefore, separate analyses of both suscepti-bility and nutrient inputs were made and then the resultsof each were combined to determine the overall level ofhuman influence.
Susceptibility: Determining the Estuarine Export Po-tential (EXP)Estuarine susceptibility to nutrients is dependent in largepart on the amount of time that nutrients entering a sys-
tem stay in the system before exiting the system. The es-tuarine export potential is a method, developed as partof NOAA’s Coastal Assessment and Data Synthesis sys-tem, to estimate relative determinations of this amountof time by defining the relative capacity of estuaries todilute and flush dissolved nutrient loads. The analysisuses physical and hydrologic data to define separately 1)a dilution rating and 2) a flushing rating. In both cases,the higher the rating, the greater the capacity to dilute orflush nutrient loads (conversely, lower ratings suggest agreater tendency to retain nutrient loads).
2. Decision Rules for FLUSHING Potential. This analysis assumes that a greater capacity to flush nutrientloads exists for estuaries that have large tide and freshwater influences.
Type Tide Range (ft) Freshwater Inflow/Estuary Volume Flushing Potential Number of Estuaries
1 macro (>6) large or moderate HIGH 12
2 21
3 meso (>2.5) large HIGH 15
4 meso (>2.5) MODERATE 16
5 meso (>2.5) small LOW 26
6 micro (<2.5) large 4HIGH
7 micro (<2.5) 13
8 micro (<2.5) 31LOW
and
and
and
and
and
and
and
and
(1000 to 10-02)
macro (>6) small (10-03, 10-04) MODERATE
(1000, 10-01)
moderate (10-02)
(10-03, 10-04)
(1000, 10-01)
moderate (10-02) MODERATE
small (10-03, 10-04)
1. Decision Rules for DILUTION Potential. This analysis assumes that a larger portion of the water column is poten-tially available to dilute nutrient loads in a vertically homogenous estuary than in a vertically stratified system. Theassumption is that for stratified systems, nutrients are most often retained in the upper portion (freshwater fraction) ofthe water column. In contrast, downward transport (more complete mixing) is likely in vertically homogenous sys-tems. Type B estuaries are generally vertically homogenous, although stratification is observed (confined) in narrownavigation channels or the extreme upper reaches of an estuary. In this case, nutrients are assumed to be dilutedthroughout the entire water column.
EXHIBIT 21 (AR L.30)

Appendix A: Methods
60
Combining Dilution Potential and Flushing Po-tential. By combining dilution and flushing com-ponents, an EXP is determined. Estuaries in the up-per left portion of the matrix generally have a highEXP that suggests an ability to dilute and flush nu-trient loads. Estuaries in the lower right portion sug-gest estuaries that lack the ability to dilute or flushnutrients, making them more susceptible to nutri-ent pollution.
Nutrient Inputs. In order to develop an understand-ing of the amount of nutrient inputs being deliv-ered to the estuarine systems from human activi-ties, nationally comparable data sets had to be de-veloped. Estimates of nitrogen and phosphorusloads from point, nonpoint, and atmospheric sourceswere developed for each estuarine watershed. TheUSGS' SPARROW (spatially referenced regressionsof contaminant transport on watershed attributes)model was used as the primary indicator of nitro-gen pressure. In addition, a host of other data setswere used as surrogate nutrient pressure indicatorsto help substantiate load estimates. These includedEPA's county level estimates of fertilizer sales, USGS'county level estimates of fertilizer use, USGS' LandUse/Land Cover, U.S. Census Bureau PopulationCensus, and U.S. Department of Agriculture Cen-sus of Agriculture (see Data Sources Table).
A brief description of the SPARROW model isprovided here, as this was the principal data setused to evaluate the extent of nitrogen pressurewith respect to the observed eutrophic symp-toms. Estimates of total nitrogen loads are pro-vided for five major nutrient source types: pointsources, fertilizer, livestock, atmospheric depo-sition, and nonpoint/nonagricultural. Data areavailable for all USGS 8-digit hydrologic cata-log units and are based on measurements froma national network of stream gaging stations(NASQAN) that operated during 1970-1988. Forthe purposes of the national workshop, NOAAaggregated data for the 8-digit units to the wa-tershed scale, though this may have overesti-mated actual loads to some estuaries. The mod-eled estimates provide a snapshot of conditionsduring the early-1980s and do not offer timeseries data.
Determination of the Overall Level of Human In-fluence. The susceptibility to retain nutrients andthe level of nitrogen inputs were compared in a ma-trix to determine an overall ranking of the overalllevel of expression of human influence on eutrophicconditions in the estuary.
Low Nutrient Input Moderate Nutrient Input High Nutrient Input
Hig
h S
usce
ptib
ility
Mod
erat
e S
usce
ptib
ility
Low
Sus
cept
ibili
ty
Symptoms observed in the estuary are likely predominantly naturally related or caused by human factors other than nutrient additions.
Symptoms observed in the estuary are predominantly naturally related or caused by factors other than nutrient additions.
Symptoms observed in the estuary may be naturally related or the high level of nutrient additions may cause problems despite low susceptibility.
Symptoms observed in the estuary are minimally to moderately related to nutrient inputs.
Symptoms observed in the estuary are moderately related to nutrient inputs.
Symptoms observed in the estuary are moderately to highly related to nutrient additions.
Even low nutrient additions may result in problem symptoms in these estuaries.
Symptoms observed in the estuary are moderately to highly related to nutrient additions.
Symptoms observed in the estuary are probably closely related to nutrient additions.
MODERATE
MODERATE
MODERATE HIGH
MODERATE HIGH
HIGH
MODERATE LOW
MODERATE LOWLOWLOW
OVERALL LEVEL OF HUMAN INFLUENCE
Hig
hM
oder
ate
Low
High Moderate Low
DILUTION Potential
FLU
SH
ING
Pot
entia
l
HIGH EXP. Estuary has capacity to dilute and flush nutrients
MODERATE EXP. Estuary has capacity to either dilute or flush nutrients
LOW EXP. Estuary does not have capacity to dilute or flush nutrients
ESTUARINE EXPORT POTENTIAL AND SUSCEPTIBILITY
Low Susceptibility
Low Susceptibility
Low Susceptibility
Moderate Susceptibility
Moderate Susceptibility
Moderate Susceptibility
High Susceptibility
High Susceptibility
High Susceptibility
Experts at the National Assessment Workshop re-viewed and, when appropriate, modified the sus-ceptibility or nutrient pressure assessments. Modi-fications were made based on higher quality dataavailable for some estuaries and expert knowledgeand judgement.
EXHIBIT 21 (AR L.30)

Appendix A: Methods
61
Determining Future OutlookThis analysis was performed as an attempt to de-termine the likelihood of whether conditions inan estuary will worsen, improve, or stay the sameover the next twenty years. In the analysis, nu-trient input changes are predicted to determinewhich direction conditions will move. The estua-rine susceptibility to nutrients is then used to de-termine the magnitude. Population projectionsare used as a primary indicator of the level offuture nutrient input changes. However, popu-lation projections are subject to unpredictablechanges. Therefore, experts at the National As-sessment Workshop were asked to make modifi-cations to the determinations of future nutrientchanges, based on their knowledge of plannedor likely changes that will take place in the es-tuarine basins that will affect the level of nutri-ents entering the system.
Identifying Impaired Uses and PotentialManagement ConcernsExperts at the National Assessment Workshop iden-tified impaired uses which they judged to be relatedto the expression of eutrophic conditions in the wa-ter body. These impaired uses included recreationaland commercial fishing, fish consumption, shellfish,swimming, boating, aesthetics, tourism, SAV andhabitat loss, and loss of assimilative capacity. Al-though this information is not supported by a com-prehensive data set, it does provide a rough pictureof the extent of problems stemming from eutrophicconditions. The experts also identified the point andnonpoint sources which they judged as most impor-tant to target for managing nutrients. These sourcesincluded wastewater treatment, combined seweroverflow, on-site waste disposal such as septic sys-tems, industrial discharge, large animal operations,urban runoff, agriculture, forestry practices, range-land use, atmospheric inputs, and aquaculture. Alsoevaluated were potential effectiveness of nutrient re-ductions and watershed focus areas. Although theseassessments were not based on a national data set,the expert evaluations are useful for gaining a firstorder understanding at the national level of whattypes and level of actions will be required to addresseutrophication.
Identifying Data Gaps and Research NeedsExperts at the National Assessment Workshop iden-tified data gaps and research needs for improvingthe assessment of the severity, human influence,impacts, and appropriate response to eutrophication
in estuaries. The experts used their experience andknowledge, in combination with data completenessand reliability analysis of the eutrophication surveyresults, to produce these findings.
Future Nutrient Pressures Decrease
No Change in Future Nutrient Pressures
Future Nutrient Pressures Increase
Hig
h S
usce
ptib
ility
Mod
erat
e S
usce
ptib
ility
Low
Sus
cept
ibili
ty
Nutrient related symptoms observed in the estuary will most likely remain unchanged.
Nutrient related symptoms observed in the estuary are likely to worsen only minimally.
Nutrient related symptoms observed in the estuary are likely to improve.
Nutrient related symptoms observed in the estuary will most likely remain unchanged.
Nutrient related symptoms observed in the estuary are likely to substantially worsen.
Nutrient related symptoms observed in the estuary are likely to improve somewhat.
Nutrient related symptoms observed in the estuary will most likely remain unchanged.
Nutrient related symptoms observed in the estuary are likely to substantially worsen.
FUTURE OUTLOOK FOR EUTROPHIC CONDITIONS
Nutrient related symptoms observed in the estuary are likely to improve substantially.
IMPROVE HIGH NO CHANGE WORSEN LOW
IMPROVE LOW
IMPROVE LOW
NO CHANGE
NO CHANGE
WORSEN HIGH
WORSEN HIGH
EXHIBIT 21 (AR L.30)

Appendix A: Methods
62
Data sources referenced during the National Assessment Workshop.P
hys
ical
an
d H
ydro
logi
c C
har
acte
rist
ics
Nu
trie
nt I
nd
icat
ors
NOAA, 1985. National Estuarine Inventory, Volume 1: Physical and Hydrologic Characteristics. National Ocean Service, Silver Spring, MD.Note: This information is now included as part of NOAA’s Coastal Assessment and Data Synthesis System (CA&DS) and can be accessed at http://cads.nos.noaa.gov.
NOAA. 1993. Tide Tables 1993, High and Low Water Predictions. National Ocean Service, Silver Spring, MD
USGS, not dated. Water Resources Data. Gaged Streamflow Data. Water Resources Division, Reston, VA.
Smith, et al., 1997. Spatially Referenced Regressions on Watershed Attributes (SPARROW). In: Regional Interpretation of Water Quality Monitoring Data. Water Resources Research, Vol 33, No. 12, pp. 2781-98
USDA, 1987 and 1992. Census of Agriculture. CD-ROMs for 1987 and 1992.
USGS, 1990. County Level Estimates of Nitrogen and Phosporus Fertilizer Use in the US 1945-85. In: Alexander and Smith, 1990. USGS Open File Report 90-130.
US EPA, 1990 and J. Fletcher 1992 (written comm., U West VA). County Level Estimates of Nitrogen Fertilizer Sales in the Conterminous US 1986-91. In: Alexander and Smith, 1990. USGS Open File Report 90-130.
USGS, various dates. Land Use and Land Cover (LUDA).
US Bureau of the Census, undated. 1970 and 1990 population estimates. Population Estimates Program, Population Division. Washington, DC.
NPA Data Services, Inc, 1988. Key Indicators of County Growth 1970-2010. Washington, DC.
Estuary Boundaries and Water Surface Areas
Estuarine Salinity Zones
Estuary Average Depth
Estuary Volume
Watershed Boundaries (EDAs & FDAs) and Land Surface Areas
Vertical Stratification
Freshwater Inflow
Dilution Potential
Flushing Potential
Susceptibility: Estuarine Export Potential (EXP)
Tide Range
NOAA. 1998. Coastal Assessment and Data Synthesis System. National Ocean Service, Silver Spring, MD.
Nitrogen Loads (kg/yr)and Yields (kg/sq. mi/yr)
Nitrogen Trends from Livestock (1978-92)
Nitrogen Trends from Fertilizer Use (1970-91)
Cropland Area Trends (sq.miles) (1978-92)
Land Use (sq. miles)
Population (1970 and 1990)
Population (2010)
Soil Conservation Service, April, 1992, the Agricultural Waste Management Field Handbook, Chapter 4.
USDA, 1987 and 1992. Census of Agriculture. CD-ROMs for 1987 and 1992.
Eu
trop
hic
atio
nNOAA. 1998. NOAA’s estuarine eutrophication survey, vol. 5: Pacific Coast region. Silver Spring, MD: Office of Ocean Resources Conservation and Assessment. 75 pp.
NOAA. 1997. NOAA’s estuarine eutrophication survey, vol. 4: Gulf of Mexico region. Silver Spring, MD: Office of Ocean Resources Conservation and Assessment. 77 pp.
NOAA. 1997. NOAA’s estuarine eutrophication survey, volume 3: North Atlantic region. Silver Spring, MD: Office of Ocean Resources Conservation and Assessment. 46 pp.
NOAA. 1997. NOAA’s estuarine eutrophication survey, vol. 2: Mid-Atlantic region. Silver Spring, MD: Office of Ocean Resources Conservation and Assessment. 51 pp.
NOAA. 1996. NOAA’s estuarine eutrophication survey, vol. 1: South Atlantic region. Silver Spring, MD: Office of Ocean Resources Conservation and Assessment. 50 pp.
Eutrophic Conditions and Trends
EXHIBIT 21 (AR L.30)

Appendix B: Table of Results
63
This appendix contains results of the National Estuarine Eutrophication Assessment, including some information that is not provided elsewhere in thereport, i.e., overall primary and secondary assessments, nutrient reduction effectiveness, and the type of watershed focus. The data is also presented asdetermined at the Assessment Workshop, i.e., “moderate low” was not combined with “low,” nor was “moderate high” combined with “high.”Impaired uses are indicated by their assessment basis: highly certain, moderately certain, or reasonable inference.
Prim
ary
Sec
onda
ryIn
fluen
cing
Fut
ure
Impa
ired
Use
sP
oten
tial M
anag
emen
t Con
cern
s
Eutrophic Condition
Wastewater Treatment
Combined Sewer Overflow
On-site (septics, etc.)
Industry
Animal Operations
Urban Runoff
Agriculture
Forestry Activities
Rangeland Use
Atmosphere
Aquaculture
Other
Would Nutrient ReductionsImprove Conditions?
Watershed Focus
Rec./Comm. Fishing
Fish Consumption
Shellfish
Swimming
Boating
Aesthetics
Tourism
SAV/Habitat Loss
Assimilative Capacity
Expected Change (2020)
Confidence
Overall Human Influence
Confidence
Susceptibility
Nitrogen Yield
Low Dissolved Oxygen
SAV Loss
Nuisance/Toxic Blooms
Overall Secondary Level
Chlorophyll a
Epiphyte Abundance
Macroalgal Abundance
Overall Primary Level
N -
non
e ob
serv
ed; L
- lo
w; M
L -
mod
erat
e lo
w; M
- m
oder
ate;
MH
- m
oder
ate
high
; H -
hig
h; U
- u
nkno
wn;
IH -
impr
ove
high
; IL
- im
prov
e lo
w; N
C -
no
chan
ge; W
L -
wor
sen
low
; WH
- w
orse
n hi
gh R
I - r
easo
nabl
e in
fere
nce;
MC
- m
oder
atel
y ce
rtai
n; H
C -
hig
hly
cert
ain;
WC
- w
ater
col
umn;
EN
TR
- e
ntire
wat
ersh
ed; E
DA
- e
stua
rine
drai
nage
are
a; F
DA
- fl
uvia
l dra
inag
e ar
ea
No
rth
A
tlan
tic
St.
Cro
ix R
iver
/Cob
scoo
k B
ayM
HM
HL
LH
LL
NH
HL
HL
MW
HM
HC
NO
WC
√E
nglis
hman
Bay
MH
MH
MN
HH
NU
MM
LM
HL
LN
CM
HH
CN
OW
C√
Nar
ragu
agus
Bay
MH
MH
MN
NM
NU
HH
LM
HL
LN
CM
HH
CN
OW
C√
Blu
e H
ill B
ayM
LM
LM
NN
MN
NL
LL
HL
LW
LM
HC
NO
U
Pen
obsc
ot B
ayL
MH
LN
NL
NU
NL
ML
MH
LM
NC
MH
NO
ED
A√
√M
usco
ngus
Bay
ML
LM
NN
ML
UL
LL
LL
MN
CM
HC
NO
ED
A√
Dam
aris
cotta
Riv
erM
HM
NN
MN
NM
MM
HM
MW
LM
MC
NO
WC
√S
heep
scot
Bay
MH
MH
MN
MM
LU
HH
ML
HM
MN
CM
HH
CN
OE
DA
Ken
nebe
c/A
ndro
scog
gin
Riv
ers
ML
HM
NN
ML
NN
LL
HL
MN
CM
HN
OU
√C
asco
Bay
MH
HM
LM
LL
MH
HM
LM
HL
LIL
MH
HC
UE
NTR
√√
√S
aco
Bay
MM
HL
UN
LL
UH
HL
MH
LL
NC
MR
IN
OE
NTR
√√
Gre
at B
ayM
MH
ML
MM
LN
LM
ML
MH
ML
WH
MH
MC
UFD
A√
√H
ampt
on H
arbo
r E
stua
ryM
LL
MN
NM
LN
NL
LM
LL
LW
LM
MC
NO
U√
Mer
rimac
k R
iver
UU
UU
UL
UM
UM
LM
LL
LN
CM
LU
U
Plu
m Is
land
Sou
ndM
LM
HM
NN
ML
NN
LM
HM
MH
WH
LU
FDA
√M
assa
chus
etts
Bay
MM
HM
NH
HN
LM
MM
MH
LH
WL
MH
HC
YE
SE
DA
√√
√B
osto
n H
arbo
rM
HH
MH
MH
ML
NL
MH
HM
HIL
MH
YE
SE
DA
√√
√C
ape
Cod
Bay
MM
HM
NL
ML
LL
MM
LH
ML
NC
HN
OE
NTR
√√
Mid
dle
A
tlan
tic
Buz
zard
s B
ayM
LH
ML
LL
LL
NL
ML
HM
LN
CH
UU
Nar
raga
nset
t B
ayM
LH
MN
LL
LL
MM
MH
HM
HN
CH
UU
Gar
dine
rs B
ayM
HH
MN
NM
LH
MH
ML
MM
LN
CM
HC
HC
HC
HC
HC
HC
YE
SE
NTR
√√
√Lo
ng Is
land
Sou
ndM
HH
HL
HH
ML
MM
MH
HH
MN
CH
HC
HC
HC
YE
SE
NTR
√√
√C
onne
ctic
ut R
iver
ML
LM
UU
ML
UN
LM
LM
MN
CL
UU
Gre
at S
outh
Bay
MH
HH
NN
HL
MM
MM
HH
LN
CH
HC
HC
HC
HC
YE
SE
NTR
√√
Hud
son
Riv
er/R
arita
n B
ayM
HH
LL
MM
NM
MM
HH
MH
NC
HH
CH
CM
CY
ES
EN
TR√
√√
Bar
nega
t B
ayH
HH
NH
HL
UH
HM
HH
HM
WL
HM
CY
ES
EN
TR√
New
Jer
sey
Inla
nd B
ays
ML
LM
NL
ML
UL
LM
HL
HM
WH
LU
U
Del
awar
e B
ayM
LH
MN
NM
LN
NL
MH
HM
HN
CH
UE
NTR
√√
Del
awar
e In
land
Bay
sH
HM
UH
HL
NH
HM
HM
HH
LN
CM
HC
MC
MC
HC
RI
YE
SE
NTR
√√
√M
aryl
and
Inla
nd B
ays
MM
HM
NM
LN
MM
MH
HL
WL
LR
IR
IR
IR
IY
ES
ED
A√
√C
hinc
otea
gue
Bay
ML
LM
UU
ML
NN
LM
LH
LW
LL
UU
Che
sape
ake
Bay
HH
HH
NH
HH
NH
HH
HM
WL
HR
IH
CH
CR
IY
ES
EN
TR√
√√
Pat
uxen
t R
iver
HH
HU
NH
MH
HH
MH
HH
MW
LH
RI
HC
RI
MC
YE
SE
NTR
√√
√P
otom
ac R
iver
HH
HU
LM
HM
MH
MH
HH
MW
LH
RI
HC
MC
YE
SE
NTR
√√
√R
appa
hann
ock
Riv
erM
HH
NN
MM
NN
MH
HH
MW
LH
RI
HC
MC
YE
SE
NTR
√√
√Y
ork
Riv
erM
HH
MN
NM
MM
NM
MH
HH
LW
HH
RI
HC
RI
MC
YE
SE
NTR
√√
√Ja
mes
Riv
erM
LH
HN
NM
LN
NL
MH
HM
MW
LH
RI
RI
YE
SE
NTR
√√
√C
hest
er R
iver
MH
MU
NM
LL
NL
MH
HH
MW
LH
RI
MC
YE
SE
NTR
√√
Cho
ptan
k R
iver
MH
MH
MH
LH
MH
MH
HH
MW
LH
RI
MC
YE
SE
NTR
√√
Tan
gier
/Poc
omok
e S
ound
sM
HH
HH
HH
LH
LM
HH
HH
WH
HH
CH
CH
CR
IU
EN
TR√
Appendix B: Table of Results
EXHIBIT 21 (AR L.30)

Appendix B: Table of Results
64
Prim
ary
Sym
ptom
sS
econ
dary
Sym
ptom
sIn
fluen
cing
Fac
tors
Fut
ure
Out
look
Impa
ired
Use
sP
oten
tial M
anag
emen
t Con
cern
s
Eutrophic Condition
Confidence
Wastewater Treatment
Combined Sewer Overflow
On-site (septics, etc.)
Industry
Animal Operations
Urban Runoff
Agriculture
Forestry Activities
Rangeland Use
Atmosphere
Aquaculture
Other
Would Nutrient ReductionsImprove Conditions?
Watershed Focus
Rec./Comm. Fishing
Fish Consumption
Shellfish
Swimming
Boating
Aesthetics
Tourism
SAV/Habitat Loss
Assimilative Capacity
Expected Change (2020)
Confidence
Overall Human Influence
Confidence
Susceptibility
Nitrogen Yield
Low Dissolved Oxygen
SAV Loss
Nuisance/Toxic Blooms
Overall Secondary Level
Chlorophyll a
Epiphyte Abundance
Macroalgal Abundance
Overall Primary Level
N -
non
e ob
serv
ed; L
- lo
w; M
L -
mod
erat
e lo
w; M
- m
oder
ate;
MH
- m
oder
ate
high
; H -
hig
h; U
- u
nkno
wn;
IH -
impr
ove
high
; IL
- im
prov
e lo
w; N
C -
no
chan
ge; W
L -
wor
sen
low
; WH
- w
orse
n hi
ghR
I - r
easo
nabl
e in
fere
nce;
MC
- m
oder
atel
y ce
rtai
n; H
C -
hig
hly
cert
ain;
WC
- w
ater
col
umn;
EN
TR
- e
ntire
wat
ersh
ed; E
DA
- e
stua
rine
drai
nage
are
a; F
DA
- fl
uvia
l dra
inag
e ar
ea
So
uth
A
tla
nti
c
Alb
emar
le S
ound
UU
LN
NL
LL
LL
ML
MM
WL
MN
OE
DA
√√
√P
amlic
o S
ound
UU
MN
NM
LL
MH
ML
MM
NC
MM
CY
ES
EN
TR√
√P
amlic
o/P
ungo
Riv
ers
MH
HH
NN
HM
MM
MM
HH
HM
NC
MH
CM
CR
IY
ES
EN
TR√
√√
Neu
se R
iver
HH
HN
NH
HL
HH
HH
HH
NC
MH
CM
CM
CH
CM
CM
CY
ES
EN
TR√
√√
Bog
ue S
ound
ML
MM
UN
MN
UL
LL
LH
LIL
MU
ED
A√
√√
New
Riv
erM
HM
HN
NH
LU
HH
MH
ML
MIL
MM
CR
IR
IM
CY
ES
EN
TR√
√√
Cap
e F
ear
Riv
erM
MH
NN
HL
UN
LM
LH
MN
CM
MC
RI
UE
NTR
√√
√W
inya
h B
ayM
LL
MN
NM
MN
NM
MM
MM
NC
MR
IN
OE
DA
√√
N.
San
tee/
S.
San
tee
Riv
ers
ML
LU
NN
LM
UN
MM
LM
ML
NC
MN
OU
Cha
rlest
on H
arbo
rM
HM
NM
MM
NN
MM
MM
MW
HM
HC
HC
YE
SE
NTR
√√
√S
tono
/Nor
th E
dist
o R
iver
sM
LM
UN
NL
MN
NM
MM
HL
NC
MN
OE
DA
√√
St.
Hel
ena
Sou
ndU
UL
UU
LM
UU
ML
ML
LIL
MN
OE
DA
√√
Bro
ad R
iver
ML
ML
UU
LM
UN
MM
LM
ML
WH
MN
OE
NTR
√√
√S
avan
nah
Riv
erM
MM
NN
MM
NN
LL
ML
MW
LM
HC
HC
NO
EN
TR√
√√
Oss
abaw
Sou
ndM
LL
MN
NM
LU
NL
LM
LL
MW
LM
NO
EN
TR√
√√
St.
Cat
herin
es/S
apel
o S
ound
sM
LL
MN
NM
LN
NL
ML
LM
LW
HM
NO
ED
A√
√A
ltam
aha
Riv
erM
LM
MN
NM
LN
NL
LM
MM
WL
MN
OE
NTR
√√
√S
t. A
ndre
w/S
t. S
imon
s S
ound
sM
LL
MN
NM
LN
NL
ML
LM
LW
HM
NO
ED
A√
√S
t. M
arys
R./C
umbe
rland
Snd
.M
LM
NN
MM
NN
LM
LL
ML
WH
MR
IN
OE
DA
√√
√√
St.
John
s R
iver
MH
LH
MN
HM
LL
MM
LH
LW
HL
UU
Indi
an R
iver
ML
MM
MM
MM
LM
ML
HL
WH
LU
U
Bis
cayn
e B
ayL
LL
NN
LL
NN
LU
UH
UW
HL
UU
Gul
f of
M
exic
o
Flo
rida
Bay
HM
HM
HH
HH
MM
HM
HL
MU
ILM
HC
HC
RI
RI
HC
HC
YE
SE
NTR
√√
√S
outh
Ten
Tho
usan
d Is
land
sM
HL
MN
NM
HL
NH
MH
LH
UW
LM
UU
Nor
th T
en T
hous
and
Isla
nds
MM
MN
NM
MU
NM
ML
HU
WL
LU
U
Roo
kery
Bay
ML
ML
NN
LL
NN
LM
LL
HU
NC
LU
U
Cha
rlotte
Har
bor
MH
MH
MN
MH
LM
HM
HM
HL
WL
MU
EN
TR√
√√
Cal
oosa
hatc
hee
Riv
erM
HM
HN
NH
LL
NL
MH
MM
MW
LM
RI
RI
MC
YE
SFD
A√
Sar
asot
a B
ayM
HH
MH
LM
MN
HM
MH
HM
HW
LM
RI
YE
SE
NTR
√√
√T
ampa
Bay
MH
HH
NN
HL
NM
MM
HH
MM
NC
MM
CM
CY
ES
EN
TR√
√√
Suw
anne
e R
iver
MM
MN
ML
LN
LL
ML
MM
LW
LM
NO
FDA
√√
√A
pala
chee
Bay
ML
LM
NN
ML
NM
MM
LL
ML
WL
LU
U
Apa
lach
icol
a B
ayM
HM
NN
MM
NM
MM
HH
MM
WL
MU
U
St.
And
rew
Bay
MM
ML
LL
MU
LM
ML
ML
WL
LY
ES
ED
A
Cho
ctaw
hatc
hee
Bay
MH
MM
HL
MM
MH
HM
HM
MM
WL
LR
IR
IY
ES
ED
A
Pen
saco
la B
ayM
MM
UU
MM
MN
MM
HM
MM
WL
LR
IY
ES
ED
A√
√P
erdi
do B
ayM
MM
NH
HM
NL
MM
HM
HM
WL
LR
IM
CY
ES
ED
A√
√M
obile
Bay
MM
MN
NM
ML
MM
MM
MM
NC
MH
CU
EN
TR√
√E
ast
Mis
siss
ippi
Sou
ndM
LM
NN
MM
ML
MM
LM
MN
CL
MC
UU
Wes
t M
issi
ssip
pi S
ound
ML
MM
LN
LL
ML
MM
MM
MN
CL
UU
H
EXHIBIT 21 (AR L.30)

Appendix B: Table of Results
65
Prim
ary
Sym
ptom
sS
econ
dary
Sym
ptom
sIn
fluen
cing
Fac
tors
Fut
ure
Out
look
Impa
ired
Use
sP
oten
tial M
anag
emen
t Con
cern
s
Eutrophic Condition
Confidence
Wastewater Treatment
Combined Sewer Overflow
On-site (septics, etc.)
Industry
Animal Operations
Urban Runoff
Agriculture
Forestry Activities
Rangeland Use
Atmosphere
Aquaculture
Other
Would Nutrient ReductionsImprove Conditions?
Watershed Focus
Rec./Comm. Fishing
Fish Consumption
Shellfish
Swimming
Boating
Aesthetics
Tourism
SAV/Habitat Loss
Assimilative Capacity
Expected Change (2020)
Confidence
Overall Human Influence
Confidence
Susceptibility
Nitrogen Yield
Low Dissolved Oxygen
SAV Loss
Nuisance/Toxic Blooms
Overall Secondary Level
Chlorophyll a
Epiphyte Abundance
Macroalgal Abundance
Overall Primary Level
N -
non
e ob
serv
ed; L
- lo
w; M
L -
mod
erat
e lo
w; M
- m
oder
ate;
MH
- m
oder
ate
high
; H -
hig
h; U
- u
nkno
wn;
IH -
impr
ove
high
; IL
- im
prov
e lo
w; N
C -
no
chan
ge; W
L -
wor
sen
low
; WH
- w
orse
n hi
ghR
I - r
easo
nabl
e in
fere
nce;
MC
- m
oder
atel
y ce
rtai
n; H
C -
hig
hly
cert
ain;
WC
- w
ater
col
umn;
EN
TR
- e
ntire
wat
ersh
ed; E
DA
- e
stua
rine
drai
nage
are
a; F
DA
- fl
uvia
l dra
inag
e ar
ea
Gul
f of
M
exic
o (c
ontin
ued)
Lake
Bor
gne
UU
UU
UL
NU
MM
ML
MM
NC
LU
U
Lake
Pon
tcha
rtra
inH
MM
HH
HL
HM
HH
MM
MW
HM
YE
SU
Bre
ton/
Cha
ndel
eur
Sou
nds
ML
LU
UN
LL
LN
LM
LL
ML
ILL
UU
Mis
siss
ippi
Riv
erM
LM
MN
NM
LN
NL
MH
LM
NC
MU
U
Bar
atar
ia B
ayM
MH
NN
HM
NL
MM
MM
MN
CM
UU
Ter
rebo
nne/
Tim
balie
r B
ays
MM
HN
NH
LU
LL
MM
HL
WL
MU
U
Atc
hafa
laya
/Ver
mil i
on B
ays
MM
HN
NH
LL
NL
MM
LL
NC
MU
U
Mis
siss
ippi
Riv
er P
lum
eH
HH
NN
HH
NH
HH
HU
UW
HM
UU
Mer
men
tau
Est
uary
LL
UN
NL
NN
NL
LL
MM
ILL
UU
Cal
casi
eu L
ake
HM
HN
NH
MM
HH
MH
MM
MW
LM
YE
SU
Sab
ine
Lake
MM
MN
NM
LN
LL
MH
MM
MN
CM
RI
YE
SE
DA
√√
√√
√G
alve
ston
Bay
MH
HM
NN
ML
HL
HM
HM
MM
WL
MH
CH
CH
CH
CH
CY
ES
ED
A√
√√
√√
Bra
zos
Riv
erM
MM
NN
LM
NL
MM
MM
LN
CM
RI
MC
RI
RI
YE
SE
DA
√√
√M
atag
orda
Bay
MM
MN
NM
LN
LL
MH
MH
LW
LM
MC
RI
YE
SE
DA
√√
√√
√√
√S
an A
nton
io B
ayM
HM
MH
HH
LL
LL
MH
MM
LW
LM
RI
RI
YE
SE
NTR
√√
√√
√A
rans
as B
ayM
MM
MH
ML
LL
LM
MH
MN
CL
RI
RI
RI
RI
YE
SE
NTR
√√
√√
Cor
pus
Chr
isti
Bay
HM
HH
HH
LN
HH
MH
MH
LW
HH
MC
RI
RI
YE
SE
DA
√√
√√
Upp
er L
agun
a M
adre
HH
HN
NH
MM
HH
HM
HM
WH
MM
CM
CM
CY
ES
ED
A√
√√
√B
affin
Bay
HL
HN
NH
LN
HH
HL
HM
WH
LM
CM
CM
CM
CY
ES
EN
TR√
√√
√√
√Lo
wer
Lag
una
Mad
reH
HH
NN
HL
MH
HH
MH
LW
HH
MC
MC
MC
MC
YE
SE
NTR
√√
√√
√√
Pa
cif
ic
Tiju
ana
Est
uary
HH
HN
HH
MN
LM
HH
HH
WH
HR
IR
IH
CH
CY
ES
ED
A√
San
Die
go B
ayM
LU
NH
HL
UL
LM
HL
HM
WH
LU
U
Mis
sion
Bay
ML
LL
NN
LN
NN
LM
HL
HM
WL
LU
U
New
port
Bay
HM
HH
NH
HH
ML
MH
HH
HW
HH
HC
HC
HC
HC
YE
SE
DA
√√
San
Ped
ro B
ayL
LL
NN
LN
NL
LH
LH
HW
LU
U
Ala
mito
s B
ayM
LL
UN
NL
MN
LM
UU
HU
UU
U
Ana
heim
Bay
MM
UN
HH
LU
LL
HM
HH
WL
MM
CM
CY
ES
EN
TR√
√S
anta
Mon
ica
Bay
UU
UU
LL
UN
LL
MH
LM
HN
CU
U
Mor
ro B
ayM
LU
UH
HL
HH
HM
HL
HM
NC
UU
Mon
tere
y B
ayM
LM
MN
NL
LN
MM
ML
ML
LL
WL
MU
EN
TR√
√E
lkho
rn S
loug
hM
HL
MH
HH
MN
MM
MH
LH
MN
CU
U√
√S
an F
ranc
isco
Bay
HH
HN
NH
LH
NH
HH
MM
WL
MN
OE
DA
√√
Cen
t. S
F./S
an P
ablo
/Sui
sun
Bay
sM
HM
NN
ML
MH
ML
HL
MN
CM
HN
OE
NTR
√√
√D
rake
s E
ster
oU
UU
UU
LU
UN
LM
HL
LM
WH
UU
Tom
ales
Bay
MH
LU
NN
LN
NH
HM
HL
HM
WH
UU
Eel
Riv
erL
LL
NN
LN
NN
LM
LM
MW
LU
U
Hum
bold
t Bay
LL
LN
NL
NN
NL
MH
LH
MN
CU
U
Kla
mat
h R
iver
LL
LN
NL
NN
NL
ML
LM
LN
CU
U
Rog
ue R
iver
UU
UU
UL
NL
UL
ML
MM
WL
LU
U
Coq
uille
Riv
erU
UL
UU
LN
NU
LM
LL
ML
WL
LY
ES
ED
A√
EXHIBIT 21 (AR L.30)

Appendix B: Table of Results
66
Prim
ary
Sym
ptom
sS
econ
dary
Sym
ptom
sIn
fluen
cing
Fac
tors
Fut
ure
Out
look
Impa
ired
Use
sP
oten
tial M
anag
emen
t Con
cern
s
Eutrophic Condition
Confidence
Wastewater Treatment
Combined Sewer Overflow
On-site (septics, etc.)
Industry
Animal Operations
Urban Runoff
Agriculture
Forestry Activities
Rangeland Use
Atmosphere
Aquaculture
Other
Would Nutrient ReductionsImprove Conditions?
Watershed Focus
Rec./Comm. Fishing
Fish Consumption
Shellfish
Swimming
Boating
Aesthetics
Tourism
SAV/Habitat Loss
Assimilative Capacity
Expected Change (2020)
Confidence
Overall Human Influence
Confidence
Susceptibility
Nitrogen Yield
Low Dissolved Oxygen
SAV Loss
Nuisance/Toxic Blooms
Overall Secondary Level
Chlorophyll a
Epiphyte Abundance
Macroalgal Abundance
Overall Primary Level
N -
non
e ob
serv
ed; L
- lo
w; M
L -
mod
erat
e lo
w; M
- m
oder
ate;
MH
- m
oder
ate
high
; H -
hig
h; U
- u
nkno
wn;
IH -
impr
ove
high
; IL
- im
prov
e lo
w; N
C -
no
chan
ge; W
L -
wor
sen
low
; WH
- w
orse
n hi
ghR
I - r
easo
nabl
e in
fere
nce;
MC
- m
oder
atel
y ce
rtai
n; H
C -
hig
hly
cert
ain;
WC
- w
ater
col
umn;
EN
TR
- e
ntire
wat
ersh
ed; E
DA
- e
stua
rine
drai
nage
are
a; F
DA
- fl
uvia
l dra
inag
e ar
ea
Pa
cifi
c (c
on
tin
ue
d)
Coo
s B
ayU
UM
MM
MN
NU
LM
LM
MW
LL
YE
SU
Um
pqua
Riv
erU
UL
UU
LN
UU
LM
LL
ML
WL
LU
U
Siu
slaw
Riv
erU
UM
UU
LL
NU
LM
LM
MW
LL
UU
Als
ea R
iver
UU
MU
UL
NN
UL
ML
MM
WL
LU
U
Yaq
uina
Bay
ML
HM
NN
ML
NN
LM
LL
ML
WL
LU
U
Sile
tz B
ayU
UU
UU
LN
UU
LM
LL
ML
WL
LU
U
Net
arts
Bay
UU
MU
UM
NN
UL
ML
HM
WL
LU
U
Till
amoo
k B
ayU
UL
UU
LN
NU
LM
LM
MW
LL
UU
Neh
alem
Riv
erU
UL
UU
LN
NU
LM
LM
MW
LL
UU
Col
umbi
a R
iver
ML
MH
NN
HN
NL
LL
ML
LL
NC
ML
NO
FDA
√W
illap
a B
ayM
MM
NH
HN
MM
MM
LM
LM
WL
MR
IR
IY
ES
ED
A√
√√
Gra
ys H
arbo
rM
MM
NH
HN
UM
MM
LM
LL
MW
LM
RI
RI
YE
SE
DA
√√
√P
uget
Sou
ndM
MH
NH
HL
LM
MM
LM
LM
WL
MM
CM
CM
CY
ES
ED
A√
√√
Hoo
d C
anal
MH
MH
UU
HM
UN
MM
HM
HL
WH
MH
MC
MC
YE
SE
DA
√√
√W
hidb
ey B
asin
/Ska
git
Bay
MM
HU
UH
LU
LL
MM
LM
MW
LM
RI
RI
YE
SE
DA
√√
√S
outh
Pug
et S
ound
MH
MH
UN
HL
UM
MM
HM
HM
WH
MH
MC
MC
MC
MC
YE
SE
DA
√√
√P
ort
Orc
hard
Sys
tem
MH
MH
UH
HL
LM
MM
ML
MM
WL
MR
IR
IY
ES
ED
A√
√√
Bel
lingh
am/P
adill
a/S
amis
h B
ays
MM
HU
MH
NN
MM
MM
LM
UW
LM
RI
RI
YE
SE
DA
√√
Seq
uim
/Dis
cove
ry B
ays
ML
HU
HH
LU
MM
MM
LM
UW
LM
RI
HC
YE
SE
DA
√√
EXHIBIT 21 (AR L.30)

Appendix B: Table of Results
67
The individuals listed here contributed to the creation of this report. A check mark for a survey form indicates that a participant filledout all or part of an initial data collection form for one or more estuaries. The regional assessment column indicates that the partici-pant was involved in site visits or attendance at regional assessment workshops. Individuals noted for methods development and theNational Assessment Workshop columns contributed to the development of data aggregation methods and/or analyzed and reviewednational-level assessments of the resulting data.
Survey FormRegional
AssessmentMethods
DevelopmentNational
Assessment
North Atlantic
Arnold Banner U.S. Fish and Wildlife Service √Seth Barker Maine Dept. of Marine Resources √Joceline Boucher Maine Maritime Academy √ √Laurice Churchill Maine Dept. of Marine Resources √Philip Colarusso U.S. Environmenal Protection Agency √Canthy Coniaris University of New HampshireMichael Connor Massachusetts Water Resources Auth. √Jerome Cura Menzie-Cura & Associates Inc. √ √Lee Doggett Maine Dept. of Environmental Protection √ √William Ellis Maine Maritime Academy √Bernie Gardner University of Massachusetts √ √Hap Garritt Woods Hole Oceanographic Institute √Chris Garside Bigelow Laboratory for Ocean Sciences √ √Diane Gould Massachusetts Bay Program √ √Chris Heinig Intertide Corporation √Charles Hopkinson, Jr. Woods Hole Oceanographic Institute √John Hurst Maine Dept. of Marine Resources √Kenneth Keay Massachusetts Water Resources Auth. √Maureen Keller Bigelow Laboratory for Ocean Sciences √ √Jack Kelly U.S. Environmenal Protection Agency √ √ √Peter Larsen Bigelow Laboratory for Ocean Sciences √ √ √Theodore Loder University of New Hampshire √ √ √ √Caroline Martorano University of New HampshireLawrence Mayer University of Maine √Bernard McAlice Darling Marine Center √Mike Mickelson Massachusetts Water Resources Auth. √ √Paul Mitnik Maine Dept. of Env. Protection √ √Byard Mosher University of New Hampshire √Carter Newell Great Eastern Mussel Farm √Judith Pederson MIT Sea Grant √David Phinney Bigelow Laboratory for Ocean Sciences √Frederick Short University of New Hampshire √John Sowles Maine Dept. of Env. Protection √ √David Taylor Massachusetts Water Resources Auth. √ √David Townsend Bigelow Laboratory for Ocean Sciences √Robert Vadas University of Maine √
Middle AtlanticJosephine Aller State University of New York at Stony Brook √Charles App U.S. Environmenal Protection Agency √Sima Bagheri New Jersey Institute of Technology √Robert Biggs Roy F. Weston Inc. √Donald Boesch University of Maryland - Horn Point √ √ √Henry Bokuniewicz State University of New York at Stony Brook √Walter Boynton University of Maryland √ √ √Denise Breitburg Academy of Natural Sciences √Thomas Brosnan National Oceanic and Atmospheric Administration √ √ √Claire Buchanon Interstate Commission on the Potomac River Basin √ √Nick Carter Maryland Dept. of Natural Resources √James Casey Maryland Dept. of Natural Resources √Carl Cerco Army Corps of Engineers √Jonathon Cole Institute of Ecosystem Studies √Robert Connel New Jersey Dept. of Env. Protection √ √Sherri Cooper Duke University √David Correll Smithsonian Environmental Res. Cent. √ √Elizabeth Cosper Cosper Environmental Services, Inc. √ √ √Joseph Costa Buzzards Bay Project √ √Christopher D'Elia State University of New York at Albany √ √Christopher DeAcutis Rhode Island Dept. of Env. Mgmt. √Robert Diaz Virginia Institute of Marine Science √ √Diana Domotor Maryland Dept. of the Environment √Bill Eisele New Jersey Dept. of Env. Protection √ √Deborah Tan Everitt Maryland Dept. of the Environment √ √Thomas Fisher University of Maryland - Horn Point √Anne Giblin Marine Biological Laboratory √Howard Golub Interstate Sanitation Commission √Sandy Groppenbucher New Jersey Dept. of Env. Protetion √ √
Appendix C: Participants
EXHIBIT 21 (AR L.30)

Appendix C: Participants
68
Survey FormRegional
AssessmentMethods
DevelopmentNational
Assessment
Middle Atlantic (continued)Marilyn Harlin University of Rhode Island √Donald Heinle CH2M Hill √ √Frederick Hoffman Virginia Water Control Board √ √Norbert Jaworski U.S. Environmental Protection Agency √Tom Jones Salisbury State University √Stephen Jordan Maryland Dept. of Natural Resources √Renee Khan Maryland Dept. of Natural Resources √Grace Klein-MacPhee University of Rhode Island √Al Korndoerhfer New Jersey Dept. of Env. Protection √ √Robert Magnien Maryland Dept. of Natural Resources √ √ √Thomas Malone University of Maryland - Horn Point √ √ √ √James Maughan CH2M HILL √Bruce Michael Maryland Dept. of the Environment √ √Doreen Monteleone New York St. Dept. of Economic Development √Jon Morrison U.S. Geological Survey √James Mummam New Jersey Dept. of Env. Protection √ √Robert Nuzzi Suffolk County Dept. of Health Services √ √Jay O' Reilly NOAA, National Marine Fisheries Service √Paul Olsen New Jersey Dept. of Env. Protection √ √Christine Olsen Connecticut Dept. of Env. Protection √Robert Orth College of William and Mary √Candace Oviatt University of Rhode Island √John Paul U.S. Environmental Protection Agency √ √Jonathan Pennock University of Alabama/Dauphin Island Sea Lab √ √ √ √Ernest Pizzuto Connecticut. Dept. of Environmental Protection √ √Kent Price University of Delaware √Ananda Ranasinghe Versar Inc. √Louis Sage Bigelow Laboratory for Ocean Sciences √ √James Sanders Benedict Estuarine Research Lab √Sybil Seitzinger Rutgers University √Valerie Shaffer Virginia Institute of Marine Science √Frederick Short University of New Hampshire √ √David Simpson Connecticut Dept. of Env. Protection √Carl Sindermann Oxford Laboratory √Theodore Smayda University of Rhode Island √Paul Stacey Connecticut Dept. of Env. Protection √ √R. Lawrence Swanson State University of New York at Stony Brook √Robert Thomann Manhattan College √James Thomas NOAA, National Marine Fisheries Service √Elaine Trench U.S. Geological Survey √Jefferson Turner University of Massachusetts-Dartmouth √Steve Weisberg Versar Inc. √ √Richard Wetzel College of William and Mary √ √Robert Whitlatch University of Connecticut √Gary Wikfors NOAA, NMFS/N.E. Fisheries Science Center √Charles Yarish University of Connecticut √
South AtlanticMerryl Alber University of Georgia √ √Jim Alberts University of Georgia √ √Clark Alexander Skidaway Institute of Oceanography √Richard Alleman South Florida Water Management Dist. √Dennis Allen University of South Carolina √Richard Barber Duke University Marine Laboratory √Diane Barile Marine Res. Council of East Florida √Vincent Bellis East Carolina University √Jackson Blanton Skidaway Institute of Oceanography √Elizabeth Blood J. W. Jones Ecological Research Center √ √Bob Brody St. Johns River Water Mgmt. Dist. √ √Deborah Bronk University of Georgia √Ramesh Buch Dade County Env. Resources Mgmt. √JoAnn Burkholder North Carolina State University √Larry Cahoon Univ. of North Carolina at Wilmington √ √David Chestnut South Carolina Dept. of Health & Env. Control √ √ √Daniel Childers Nat. Marine Fisheries Service/NOAA √Robert Christian East Carolina University √John Cooper East Carolina University √Terry Davis Florida Dept. of Environmental Reg. √Betsy Deuerling City of Jacksonville √Phillip Dunstan College of Charleston √Bob Frease Marine Resources Council of East Fl. √Greg Graves Florida Dept. of Environmental Reg. √Guy Hadley Florida Dept. of Environmental Reg. √Jess Hawkins III North Carolina Div. of Marine Fisheries √Jim Henry Georgia State University √John Higman St. Johns Water Management District √Robert Hodson University of Georgia √ √Fred Holland South Carolina Dept. of Wildlife and Marine Res. √ √ √
EXHIBIT 21 (AR L.30)

Appendix C: Participants
69
Survey FormRegional
AssessmentMethods
DevelopmentNational
Assessment
South Atlantic (continued)Jeff Hyland NOAA, National Ocean Service √William Kirby-Smith Duke University √David Knott South Carolina Wildlife & Marine Res. √Alan Lewitus University of South Carolina, Baruch Institute √Wayne Magley Florida Dept. of Environmental Reg. √ √Michael Mallin Univ. of North Carolina - Wilmington √ √ √Susan Markley Dade County Environmental Resources Mgmt. √Hank McKellar University of South Carolina √ √ √Mary Ann Moran University of Georgia √James Nelson Skidaway Institute of Oceanography √Jimmie Overton North Carolina Division of Env. Mgmt. √Hans Paerl University of North Carolina √James Pinckney University of North Carolina - Chapel Hill √Lawrence Pomeroy University of Georgia √Joe Rudek North Carolina Environmental Defense Fund √Russell Sherer South Carolina Dept. of Health and Env. Cntrl. √Donald Stanley East Carolina University √ √ √Stuart Stevens Georgia Dept. of Natural Resources √Steve Tedder North Carolina Div. of Environmental Management √Patricia Tester NOAA, National Marine Fisheries Service √Bob Van Dolah South Carolina Dept. of Wildlife and Marine Res. √ √ √ √Peter Verity Skidaway Institute of Oceanography √ √ √Robert Virnstein St. Johns River Water Mgmt. Dist. √Randy Walker Skidaway Institute of Oceanography √Cecelia Weaver Dade County Env. Resources Mgmt. √A. Quinton White Jacksonville University √Richard Wiegert University of Georgia √Herbert Windom Skidaway Inst. of Oceanography √John Windsor Jr. Florida Institute of Technology √ √
Gulf of MexicoNeil Armingeon Lake Pontchartrain Foundation √Don Axelrad Florida Dept. of Environmental Protection √Bruce Baird U.S. Army Corp of Engineers √Ronnie Best National Biological Survey √Tom Bianchi Tulane University √ √Jan Boydstun Louisiana Dept. of Env. Quality √Joe Boyer Florida International University √Jim Bowman Texas Natural Resources Cons. Comm. √David Brock Texas Water Development Board √ √Fred Bryan Louisiana State University √David Burke Gulf Coast Research Laboratory √Dave Buzon Texas Parks and Wildlife Department √Tom Cardinale Hillsborough County Env. Prot. Comm. √Sneed Collard University of West Florida √Emelise Cormier Louisiana Dept. of Env. Quality √Michael Dagg Louisiana Universities Marine Consortium √John Day Louisiana State University √Charly Demas U.S. Geological Survey √Richard DeMay Barataria/Terrebonne National Estuary Program √Dennis Demcheck U.S.Geological Survey √Hudson Deyoe Texas A&M University √Robert Dickey Gulf Coast Research Laboratory √Juli Dixson University of Southern Mississippi √Kelly Dixon Mote Marine Laboratory √Peter Doering South Florida Water Mgmt. Dist. √ √Quay Dortch Louisiana Universities Marine Consortium √ √Tom Doyle National Biological Survey √Ken Dunton University of Texas √H. Lee Edmiston Apalachicola Natl. Est. Research Reserve √ √Ernest Estevez Mote Marine Laboratory √ √ √Janice Fellers Suwannee River Water Mgmt. District √Nichole Fisher Texas A&M University √David Flemer U.S. Environmental Protection Agency √ √ √ √James Fourqurean Florida International University √Gary Gaston University of Mississippi √ √Cynthia Gorham-Test U.S. Environmental Protection Agency √Holly Greening Tampa Bay Estuary Program √ √ √George Guillen Texas Water Commission √Joe Hand Florida Dept. of Environmental Protection √Albert Hindrichs Louisiana Dept. of Env. Quality √Dan Haurnet South Florida Water Mgmt. Dist. √Richard Iverson Florida State University √ √
EXHIBIT 21 (AR L.30)

Appendix C: Participants
70
Survey FormRegional
AssessmentMethods
DevelopmentNational
Assessment
Gulf of Mexico (continued)J. O. Roger Johansson City of Tampa Bay Study Group √Lori Johnson National Biological Survey √Clifford Kenwood Lake Pontchartrain Foundation √Larry Land U.S. Geological Survey √Brian LaPointe Harbor Branch Oceanographgic Inst. √ √Graham Lewis North West Florida Water Mgmt. District √Skip Livingston Florida State University √Steven Lohrenz University of Southern Mississippi √Rodney Mach U.S. Army Corp of Engineers √Robert Mattson Suwannee River Water Mgmt. Dist. √ √Jerry McLelland Gulf Coast Research Laboratory √Ben McPherson U.S. Geological Survey √Russell Miget Texas A&M University √Cynthia Moncrieff Gulf Coast Research Laboratory √Paul Montagna University of Texas at Austin √ √Ralph Montgomery Environmental Quality Lab √Gerold Morrison S.W. Florida Water Mgmt. District √ √Harriet Perry Gulf Coast Research Laboratory √Michael Perry Southwest Florida Water Mgmt. District √Michael Poirrier University of New Orleans √ √Gary Powell Texas Water Development Board √ √Warren Pulich Texas Parks and Wildlife Department √Nancy Rabalais Louisiana Universities Marine Cons. √ √Chet Rakocinski Gulf Coast Research Laboratory √Donald Ray Florida Dept. of Environmental Reg. √Donald Redalje University of Southern Mississippi √ √Bill Rizzo National Biological Survey √Patrick Roques Texas Natural Resources Cons. Comm. √Dugan Sabins Louisiana Dept. of Env. Quality √ √William Schroeder University of Alabama √ √James Seagle Florida Dept. of Natural Resources √ √Frank Shipley Galveston Bay Natl. Estuary Program √Thomas Smith III Rookery Bay Natl. Est. Research Reserve √Kerry St. Pe' LA Dept. of Environmental Quality √Dean Stockwell University of Texas at Austin √ √J. Kevin Summers U.S. Environmental Protection Agency √ √ √Carmelo Tomas U.S. Environmental Protection Agency √David Tomasko S.W. Florida Water Management District √ √ √R. Eugene Turner Louisiana State University √ √Steven Twidwell TNRCC/Water Plan. & Assmnts. Div. √Robert Twilley University of Southwestern Louisiana √ √ √Gabriel Vargo University of South Florida √ √Richard Volk Corpus Christi Bay National Estuary Program √Michael Waldon University of Southwestern Louisiana √Albert Walton Jr. Florida Dept. of Environmental Reg. √William Wardle Texas A&M University at Galveston √Jeff Waters Lake Ponchartrain Basin Foundation √James Webb Jr. Texas A&M University at Galveston √Jay Zieman University of Virginia √
Paci f icJim Arthur Bureau of Reclamation √Shirley Birosik Los Angeles Water Quality Control Bd. √ √Milton Boyd Humboldt State University √Karleen Boyle University of California - Los Angeles √Donald Brown California St. University at Long Beach √ √Randall Brown California Dept. of Water Resources √Barbara Ann Butler Oregon Institute of Marine Biology √Jane Caffrey Elkhorn Slough Nat. Est. Research Reserve √John Chapman Hatfield Marine Science Center √James Cloern U.S. Geological Survey √Brian Cole U.S. Geological Survey √ √Eugene Collias Northwest Consultant Oceanographers Inc. √Barry Collins California Dept. of Fish and Game √Andrea Copping Washington Sea Grant √Frank Cox Washington Dept. of Health √Clayton Creech Hatfield Marine Science Center √Scott Dawson Santa Ana Regional Water Quality Control Board √Andrew DeVogelare Elkhorn Slough Natl. Est. Research Reserve √Robert Emmett NOAA, National Marine Fisheries Service √Peggy Fong University of California - Los Angeles √ √
EXHIBIT 21 (AR L.30)

Appendix C: Participants
71
Survey FormRegional
AssessmentMethods
DevelopmentNational
Assessment
Pacific (continued)Jon Graves Columbia R. Estuary Study Task Force √Michael Graybill South Slough Nat. Est. Research Reserve √John Hannum North Coast Regional Water Quality Control Board √ √Jan Hodder Oregon Institute of Marine Biology √James Hollibaugh San Francisco State University √Carol Janzen University of Delaware √John Johnson Oregon Dept. of Fish and Wildlife √ √Deborah Johnston California Dept. of Fish and Game √ √Michael Josselyn San Francisco State √Christopher Kinner Irvine Ranch Water District √Eric Klein Orange Co. Public Facilities & Resources Dept. √Katie Kropp Morro Bay National Estuary Program √Gregg Langlois California Dept. of Health Services √Peggy Lehman California Dept. of Water Resources √Lisa Levin Scripps Institution of Oceanography √Michael Martin California Dept. of Fish and Game √Larry Marxer Oregon Dept. of Environmental Quality √Gregory McMurray Oregon Dept. of Environmental Quality √ √ √Peter Michael San Diego Water Quality Control Board √ VBruce Moore Orange Co. Public Facilities & Resources Dept. √Chad Nelsen Oregon Dept. of Land Cons. & Dev. √Avis Newell Oregon Dept. of Environmental Quality √Jan Newton Washington State Dept. of Ecology √ √ √ √Frederic Nichols U.S. Geological Survey √James Nybakken Moss Landing Marine Laboratory √Don Oswalt Oregon Dept. of Land Cons. & Dev. √Bill Paznokas California Dept. of Fish and Game √Greig Peters San Diego Water Quality Control Board √Bill Peterson Hatfield Marine Science Center √Chris Prescott Puget Sound Water Quality Authority √Harlan Proctor California Dept. of Water Resources √Don Reish California State University √Jack Rensel University of Washington √Curtis Roegner Oregon Institute of Marine Biology √Greg Ruiz Smithsonian Env. Research Center √Steve Rumrill South Slough Nat. Est. Research Reserve √Mary Beth Saffo University of California at Santa Cruz √Kathleen Sayce Shoalwater Botanical √Larry Schemel U.S. Geological Survey √Lynda Shapiro Oregon Institute of Marine Biology √Randy Shuman Metropolitan King County √ √Mark Silberstien Elkhorn Slough Nat. Est. Research Reserve √Lawrence Small Oregon State University √David Specht U.S. Environmental Protection Agency √Pete Striplin Striplin Environmental Assoc. √Barbara Sullivan Oregon State University √Kathy Taylor Columbia R. Estuary Study Taskforce √Ronald Thom Battelle/Marine Sciences Laboratory √ √ √Bruce Thompson San Francisco Estuary Institute √Ken Thompson Irvine Ranch Water District √Tim Unterwegner Oregon Dept. of Fish and Wildlife √William Winchester North Coast Reg. Water Quality Control Board √Karen Worcester Cent. Coast Reg. Water Quality Control Board √ √Jack Word Battelle Ocean Sciences √Joy Zedler University of Wisconsin √ √
NationalRichard Alexander U.S. Geological Survey √Darrell Brown U.S. Environmental Protection Agency √ √Andrew Robertson National Oceanic and Atmospheric Administration √ √Dick Smith U.S. Geological Survey √Richard Valigura National Oceanic and Atmospheric Administration √ √Terry Whitledge University of Alaska Fairbanks √ √ √ √
EXHIBIT 21 (AR L.30)

EXHIBIT 21 (AR L.30)