national employment policies: a guide for workers ...€¢ national employment policies - a guide...
TRANSCRIPT

4 Gathering and analysing labour market data
National employment policies: A guide for workers’ organisations

Gathering and analysing labour market data
Copyright © International Labour Organization 2015
First published 2015
Publications of the International Labour Office enjoy copyright under Protocol 2 of the Universal Copyright Convention. Nevertheless, short excerpts from them may be reproduced without authorization, on condition that the source is indicated. For rights of reproduction or translation, application should be made to ILO Publications (Rights and Permissions), International Labour Office, CH-1211 Geneva 22, Switzerland, or by email: [email protected]. The International Labour Office welcomes such applications.
Libraries, institutions and other users registered with reproduction rights organizations may make copies in accordance with the licences issued to them for this purpose. Visit www.ifrro.org to find the reproduction rights organization in your country.
NATIONAL EMPLOYMENT POLICIES - A guide for workers’ organisations
International Labour Office. – Geneva: ILO, 2015
ISBN: 978-92-2-129343-9 (print)
ISBN: 978-92-2-129344-6 web pdf
International Labour Office
employment policy / trade union role / promotion of employment / plan of action / data collecting / labour force / informal economy / labour market
13.01.3
ILO Cataloguing in Publication Data
The designations employed in ILO publications, which are in conformity with United Nations practice, and the presentation of material therein do not imply the expression of any opinion whatsoever on the part of the International Labour Office concerning the legal status of any country, area or territory or of its authorities, or concerning the delimitation of its frontiers.
The responsibility for opinions expressed in signed articles, studies and other contributions rests solely with their authors, and publication does not constitute an endorsement by the International Labour Office of the opinions expressed in them.
Reference to names of firms and commercial products and processes does not imply their endorsement by the International Labour Office, and any failure to mention a particular firm, commercial product or process is not a sign of disapproval.
ILO publications and electronic products can be obtained through major booksellers or ILO local offices in many countries, or direct from ILO Publications, International Labour Office, CH-1211 Geneva 22, Switzerland. Catalogues or lists of new publications are available free of charge from the above address, or by email: [email protected]
Visit our web site: www.ilo.org/publns
This publication was produced by the Document and Publications Production,
Printing and Distribution Branch (PRODOC) of the ILO.
Graphic and typographic design, manuscript preparation, copy editing, layout
and composition, proofreading, printing, electronic publishing and distribution.
PRODOC endeavours to use paper sourced from forests managed
in an environmentally sustainable and socially responsible manner.
Code: CMD - STA
Photos: UN Photo; The World Bank; UNDP; CMD;ILO; Zabara.org; Vyacheslav Oseledko; Dmitry Ryzhkov; IMB Photo; Nick Story; CIMMYT;
ILO • NATIONAL EMPLOYMENT POLICIES - A guide for workers’ organisations
v
Quick overview
Analysing labour market data is important for three reasons:
1. To identify and understand issues in the labour market so that you know what you are talking about when you enter into dialogue with others around employment policy.
2. To inform decisions about national employment policy with objective, empirical foundations.
3. To evaluate the costs and benefits of policies, measures and programmes.
Labour market data helps to shed light on policy concerns. We can use it as a baseline or starting point when we make policy or set employment targets and we can use it to evaluate the effects of our policies over time.
This part of the guide introduces you to the basics of collecting and analysing labour market data. It explains where to find good data and when trade unions might want to collect it themselves. It explains labour force concepts and the indicators we use to measure them.
When it comes to employment, the International Labour Organization’s primary objective is to achieve “full and productive employment and Decent Work for all, including for women and young people”. We look at the indicators the ILO has chosen to measure progress toward that target.
All through this section, we give you examples of how countries are using indicators and data analysis. We look briefly at how to analyse data from single and multiple indicators to build a case for a policy position.


ILO • NATIONAL EMPLOYMENT POLICIES - A guide for workers’ organisations
vii
Contents
Gathering and analysing labour market data
Quick overview v
4.1. The basics
Why is data analysis important for trade unions? 1Where do we get good data? 1What do we want to find out by collecting data? 1How do we use the data? 3The basic building blocks of the labour force 3
4.2. Understanding labour force concepts and the indicators we use to measure them
The concept of employment 4The concept of unemployment 7The concepts of underemployment and inadequate employment situations 7
4.3. Choosing indicators for your data collection
The employment-to-population ratio 9Unemployment rate 10Labour force participation rate 12
4.4. Measuring full and productive employment
Working poverty rate 13Labour productivity level and labour productivity growth rate 14Vulnerable employment rate 15Indicators of precarious employment 16
4.5. Measuring equal opportunity and treatment in employment
Occupational segregation by sex 17Gender wage gap 18Share of women in wage employment in the non-agricultural sector 20
viii
4.6. Other indicators of decent work
Youth not in education and not in employment 21Informal employment rate 21Low pay rate 22Excessive hours 22
4.7. Using good data to build a case
Example for a single indicator 23Example for multiple indicators 23
References 25
Resources and tools 26
ILO • NATIONAL EMPLOYMENT POLICIES - A guide for workers’ organisations
1
4.1. The basics
Why is data analysis important for trade unions?
Analysing labour market data is important for three reasons:
1. To identify and understand issues in the labour market so that you know what you are talking about when you enter into dialogue with others around employment policy.
1. To inform decisions about national employment policy with objective, empirical foundations.
2. To evaluate the costs and benefits of policies, measures and programmes.
Where do we get good data?
Every country has statistical agencies that produce data through labour force surveys and a national census. The data is often limited or very general, often due to resource limitations. Trade unions can and should play a lead role in encouraging the collection of good data.
Trade unions should also collect data on their own membership and the conditions in their workplaces. Some data is in collective bargaining agreements. You can also survey your membership, preferably with the help of experienced researchers.
What do we want to find out by collecting data?
We want to get a good description of the labour market situation at one point in time and over time. We want to know whether people who want to work can find jobs, and what kind of jobs there are out there, both in quantity and quality. Do we have people who are underemployed in activities that keep them in poverty? If there are unemployed or underemployed people, who are they? Are they young or old, men or women? Where do they live? What educational background do they have?
The statistics that we collect by asking these kinds of questions are called indicators. Here are some examples of things we want to know and the indicators that can provide this information:
2
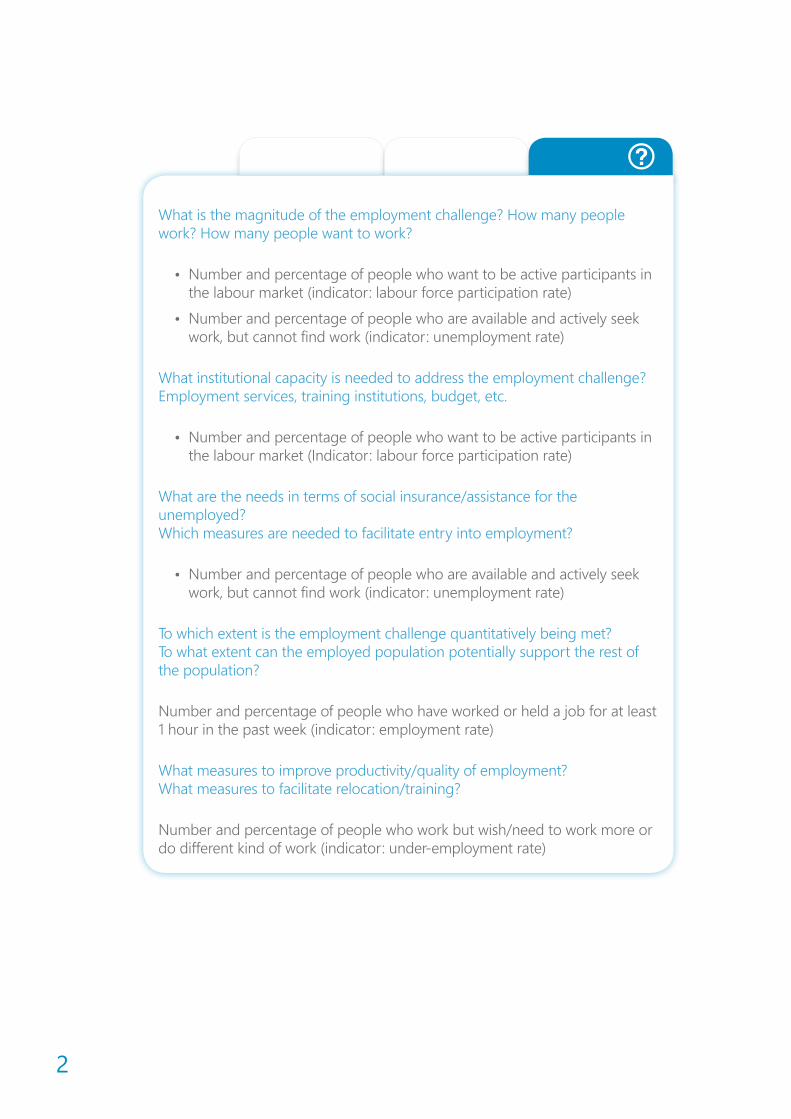
What is the magnitude of the employment challenge? How many people work? How many people want to work?
• Number and percentage of people who want to be active participants in the labour market (indicator: labour force participation rate)
• Number and percentage of people who are available and actively seek work, but cannot find work (indicator: unemployment rate)
What institutional capacity is needed to address the employment challenge? Employment services, training institutions, budget, etc.
• Number and percentage of people who want to be active participants in the labour market (Indicator: labour force participation rate)
What are the needs in terms of social insurance/assistance for the unemployed? Which measures are needed to facilitate entry into employment?
• Number and percentage of people who are available and actively seek work, but cannot find work (indicator: unemployment rate)
To which extent is the employment challenge quantitatively being met? To what extent can the employed population potentially support the rest of the population?
Number and percentage of people who have worked or held a job for at least 1 hour in the past week (indicator: employment rate)
What measures to improve productivity/quality of employment? What measures to facilitate relocation/training?
Number and percentage of people who work but wish/need to work more or do different kind of work (indicator: under-employment rate)
ILO • NATIONAL EMPLOYMENT POLICIES - A guide for workers’ organisations
3
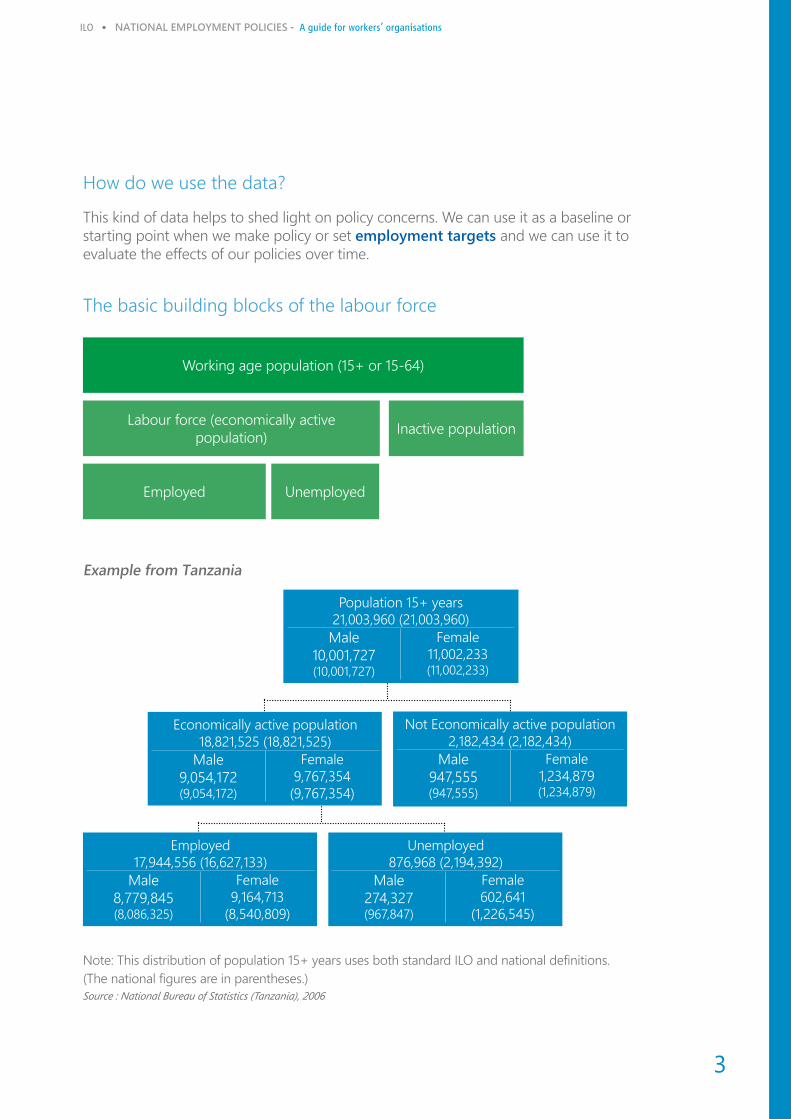
How do we use the data?
This kind of data helps to shed light on policy concerns. We can use it as a baseline or starting point when we make policy or set employment targets and we can use it to evaluate the effects of our policies over time.
The basic building blocks of the labour force
Working age population (15+ or 15-64)
Labour force (economically active population)
Employed Unemployed
Inactive population
Example from Tanzania
Not Economically active population 2,182,434 (2,182,434)
Male 947,555 (947,555)
Female 1,234,879 (1,234,879)
Population 15+ years 21,003,960 (21,003,960)Male
10,001,727 (10,001,727)
Female 11,002,233 (11,002,233)
Employed 17,944,556 (16,627,133)
Male 8,779,845 (8,086,325)
Female 9,164,713
(8,540,809)
Unemployed 876,968 (2,194,392)
Male 274,327 (967,847)
Female 602,641
(1,226,545)
Economically active population 18,821,525 (18,821,525)
Male 9,054,172 (9,054,172)
Female 9,767,354
(9,767,354)
Note: This distribution of population 15+ years uses both standard ILO and national definitions. (The national figures are in parentheses.)Source : National Bureau of Statistics (Tanzania), 2006
4
4.2. Understanding labour force concepts and the indicators we use to measure them
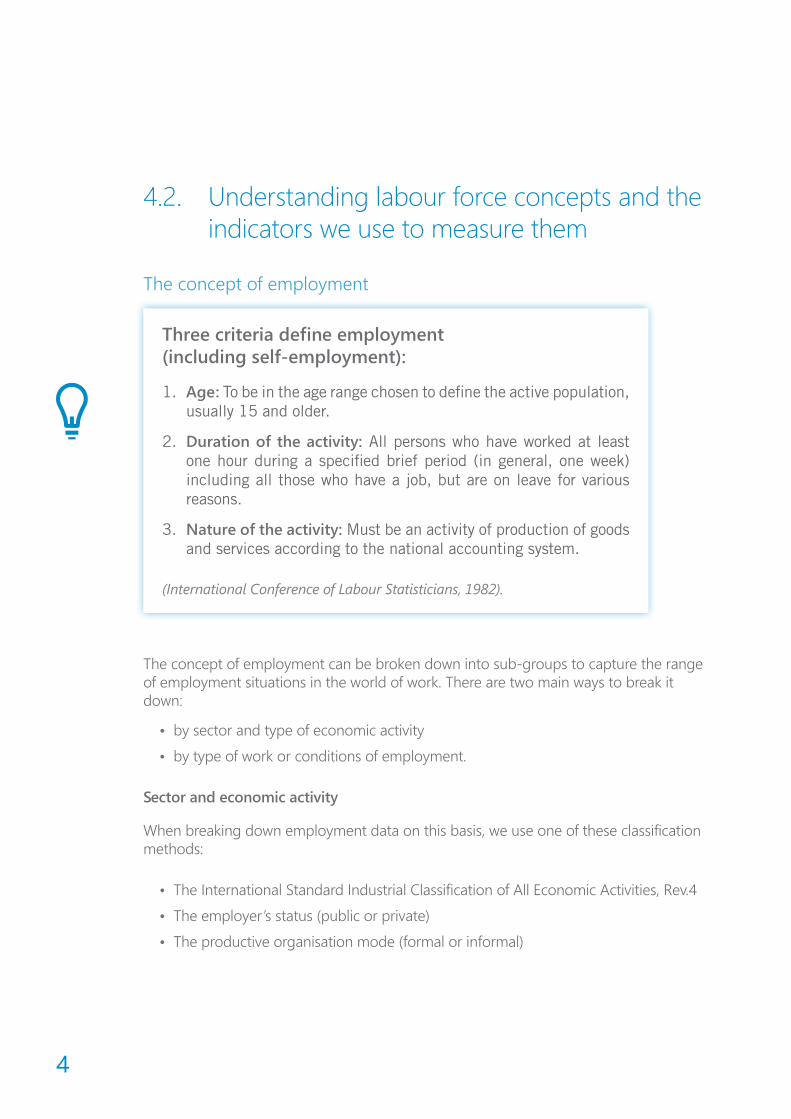
The concept of employment
Three criteria define employment (including self-employment):
1. Age: To be in the age range chosen to define the active population, usually 15 and older.
2. Duration of the activity: All persons who have worked at least one hour during a specified brief period (in general, one week) including all those who have a job, but are on leave for various reasons.
3. Nature of the activity: Must be an activity of production of goods and services according to the national accounting system.
(International Conference of Labour Statisticians, 1982).
The concept of employment can be broken down into sub-groups to capture the range of employment situations in the world of work. There are two main ways to break it down:
• by sector and type of economic activity
• by type of work or conditions of employment.
Sector and economic activity
When breaking down employment data on this basis, we use one of these classification methods:
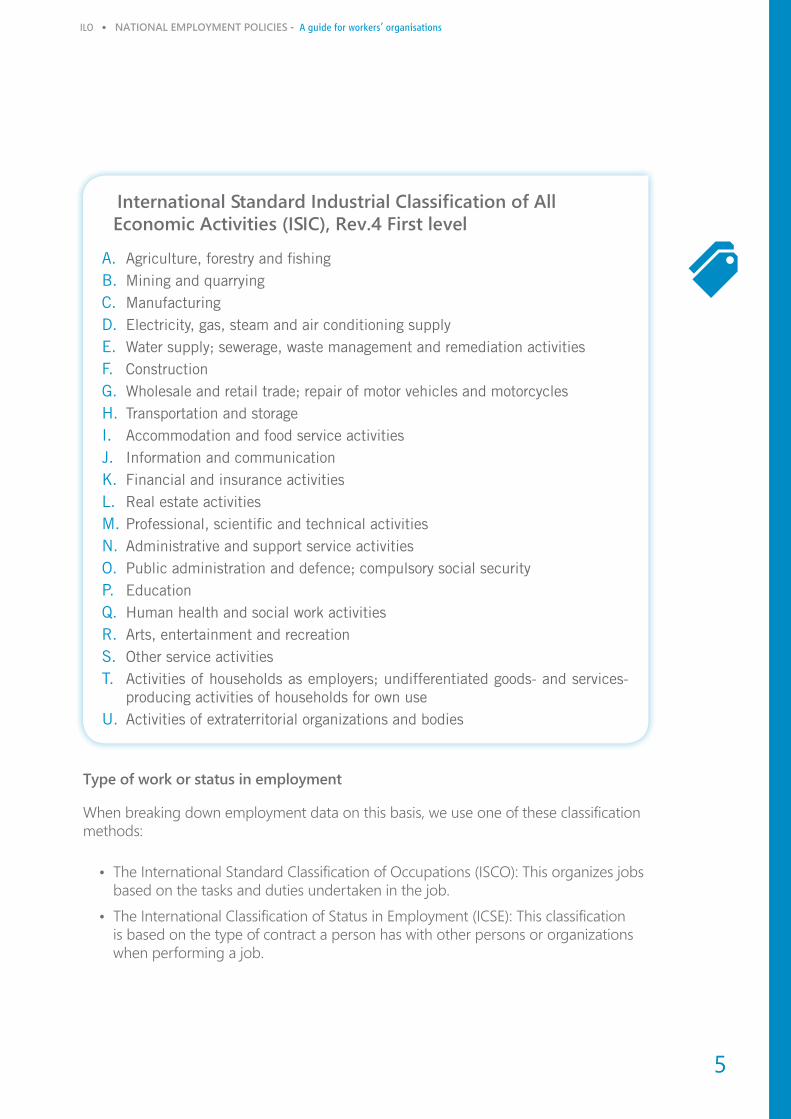
• The International Standard Industrial Classification of All Economic Activities, Rev.4
• The employer’s status (public or private)
• The productive organisation mode (formal or informal)
ILO • NATIONAL EMPLOYMENT POLICIES - A guide for workers’ organisations
5
International Standard Industrial Classification of All Economic Activities (ISIC), Rev.4 First level
A. Agriculture, forestry and fishingB. Mining and quarryingC. ManufacturingD. Electricity, gas, steam and air conditioning supplyE. Water supply; sewerage, waste management and remediation activitiesF. ConstructionG. Wholesale and retail trade; repair of motor vehicles and motorcyclesH. Transportation and storageI. Accommodation and food service activitiesJ. Information and communicationK. Financial and insurance activitiesL. Real estate activitiesM. Professional, scientific and technical activitiesN. Administrative and support service activitiesO. Public administration and defence; compulsory social securityP. EducationQ. Human health and social work activitiesR. Arts, entertainment and recreationS. Other service activitiesT. Activities of households as employers; undifferentiated goods- and services-
producing activities of households for own useU. Activities of extraterritorial organizations and bodies
Type of work or status in employment
When breaking down employment data on this basis, we use one of these classification methods:
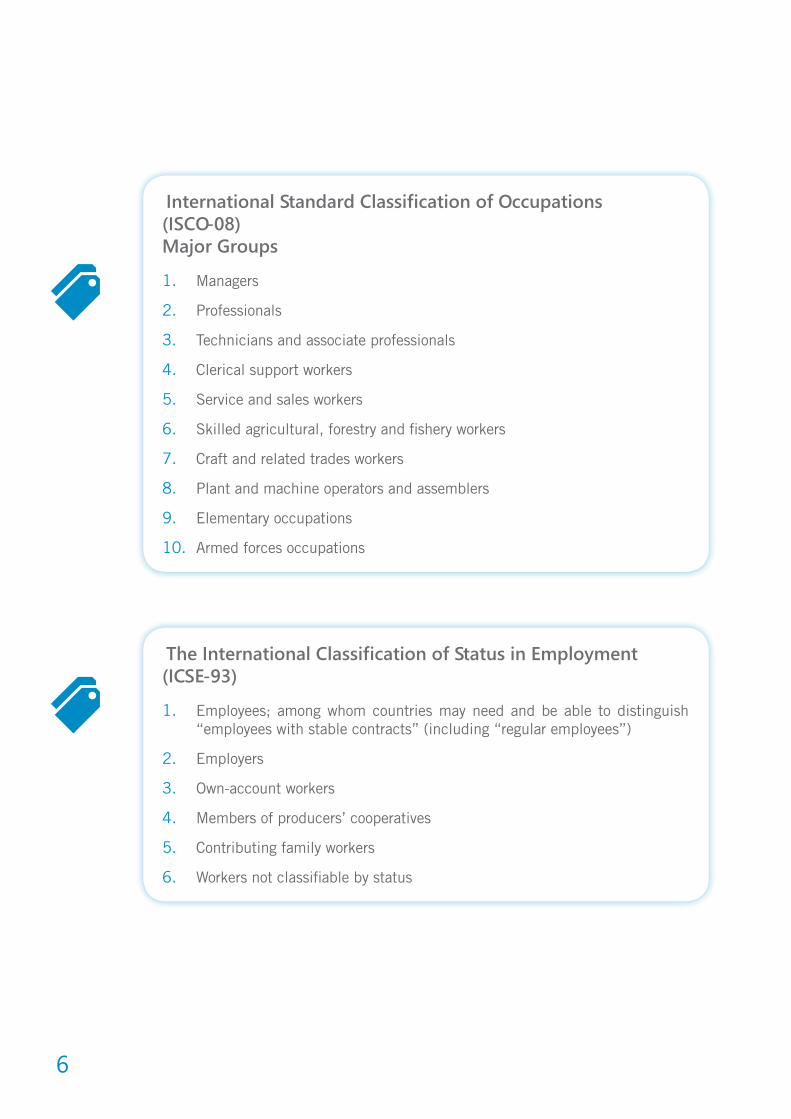
• The International Standard Classification of Occupations (ISCO): This organizes jobs based on the tasks and duties undertaken in the job.
• The International Classification of Status in Employment (ICSE): This classification is based on the type of contract a person has with other persons or organizations when performing a job.
6
International Standard Classification of Occupations (ISCO-08) Major Groups
1. Managers
2. Professionals
3. Technicians and associate professionals
4. Clerical support workers
5. Service and sales workers
6. Skilled agricultural, forestry and fishery workers
7. Craft and related trades workers
8. Plant and machine operators and assemblers
9. Elementary occupations
10. Armed forces occupations
The International Classification of Status in Employment (ICSE-93)
1. Employees; among whom countries may need and be able to distinguish “employees with stable contracts” (including “regular employees”)
2. Employers
3. Own-account workers
4. Members of producers’ cooperatives
5. Contributing family workers
6. Workers not classifiable by status
ILO • NATIONAL EMPLOYMENT POLICIES - A guide for workers’ organisations
7
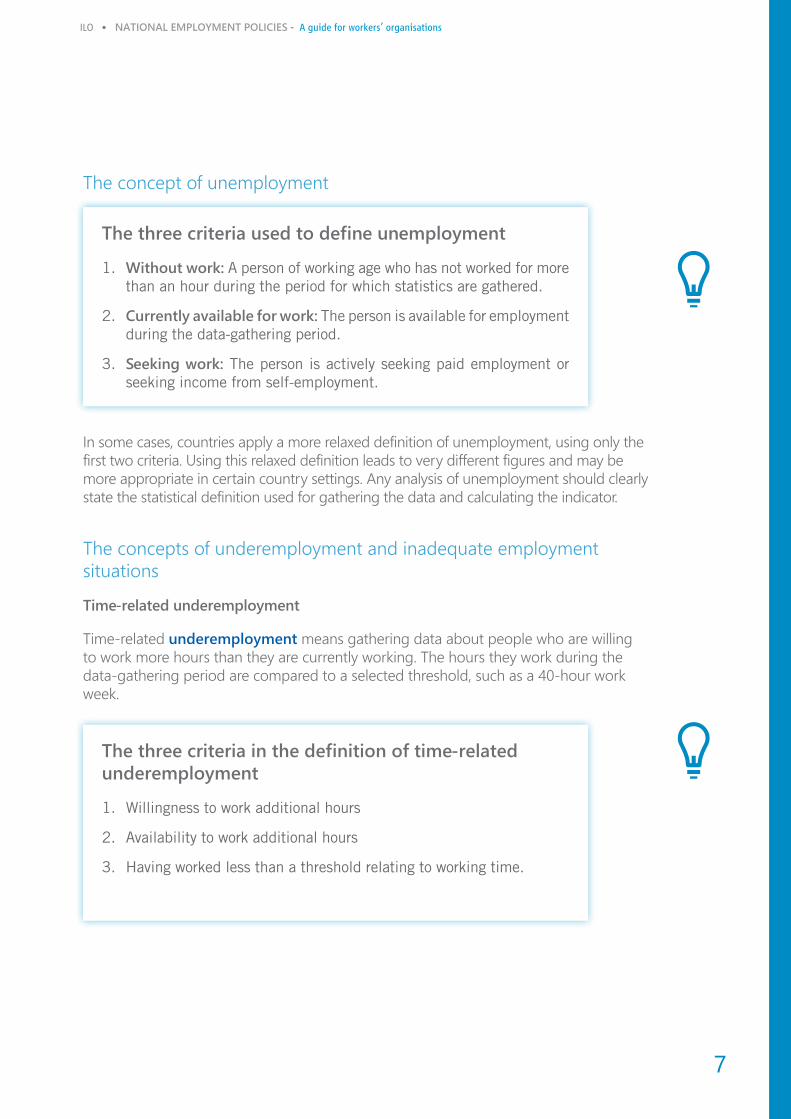
The concept of unemployment
The three criteria used to define unemployment
1. Without work: A person of working age who has not worked for more than an hour during the period for which statistics are gathered.
2. Currently available for work: The person is available for employment during the data-gathering period.
3. Seeking work: The person is actively seeking paid employment or seeking income from self-employment.
In some cases, countries apply a more relaxed definition of unemployment, using only the first two criteria. Using this relaxed definition leads to very different figures and may be more appropriate in certain country settings. Any analysis of unemployment should clearly state the statistical definition used for gathering the data and calculating the indicator.
The concepts of underemployment and inadequate employment situations
Time-related underemployment
Time-related underemployment means gathering data about people who are willing to work more hours than they are currently working. The hours they work during the data-gathering period are compared to a selected threshold, such as a 40-hour work week.
The three criteria in the definition of time-related underemployment
1. Willingness to work additional hours
2. Availability to work additional hours
3. Having worked less than a threshold relating to working time.
8
Inadequate employment situations
There are three types of inadequate employment situations:
1. Skill-related inadequate employment: This includes people who want to change their current work situation to use their current occupational skills more fully, and are available to do so.
2. Income-related inadequate employment: This includes people who want to change their current work situation to increase their income by increasing their productivity, by getting such things as better tools and equipment, training or improved infrastructure.
3. Inadequate employment related to excessive hours: This includes people who want to work fewer hours with a corresponding reduction of income.
ILO • NATIONAL EMPLOYMENT POLICIES - A guide for workers’ organisations
9
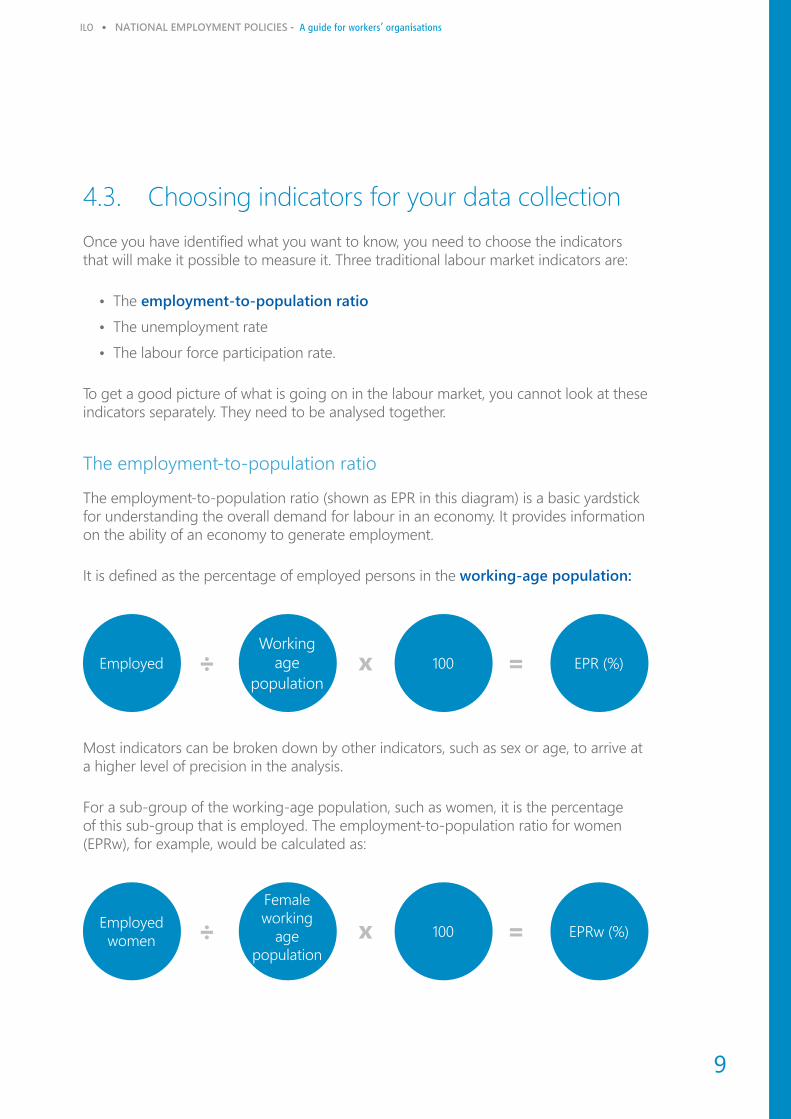
4.3. Choosing indicators for your data collectionOnce you have identified what you want to know, you need to choose the indicators that will make it possible to measure it. Three traditional labour market indicators are:
• The employment-to-population ratio
• The unemployment rate
• The labour force participation rate.
To get a good picture of what is going on in the labour market, you cannot look at these indicators separately. They need to be analysed together.
The employment-to-population ratio
The employment-to-population ratio (shown as EPR in this diagram) is a basic yardstick for understanding the overall demand for labour in an economy. It provides information on the ability of an economy to generate employment.
It is defined as the percentage of employed persons in the working-age population:
EmployedWorking
age population
100 EPR (%)
Most indicators can be broken down by other indicators, such as sex or age, to arrive at a higher level of precision in the analysis.
For a sub-group of the working-age population, such as women, it is the percentage of this sub-group that is employed. The employment-to-population ratio for women (EPRw), for example, would be calculated as:
Employed women
Female working
age population
100 EPRw (%)
10
Interpreting the data
When the employment-to-population rate rises over time, it usually means there is increasing demand for workers within the economy.
This may not always be a positive thing. It may signal, for example, that there are limited education options for young people so they are joining the workforce. Or, it could mean there is little unemployment assistance or other social benefits in a country. A number above 80 per cent often indicates an abundance of low quality jobs. If sharp increases are not matched by a corresponding increase in the Gross Domestic Product, it could point to decreasing levels of labour productivity (the Gross Domestic Product or GDP is the main measure of a country’s economic output – the total value of all the goods and services it produces).
A low percentage means that a large share of the working-age population is unemployed or not attached to the labour force. Reasons for inactivity could include being in school, being retired, doing unpaid housework, or being ill or unable work. This kind of information is essential for interpreting the employment-to-population ratio.
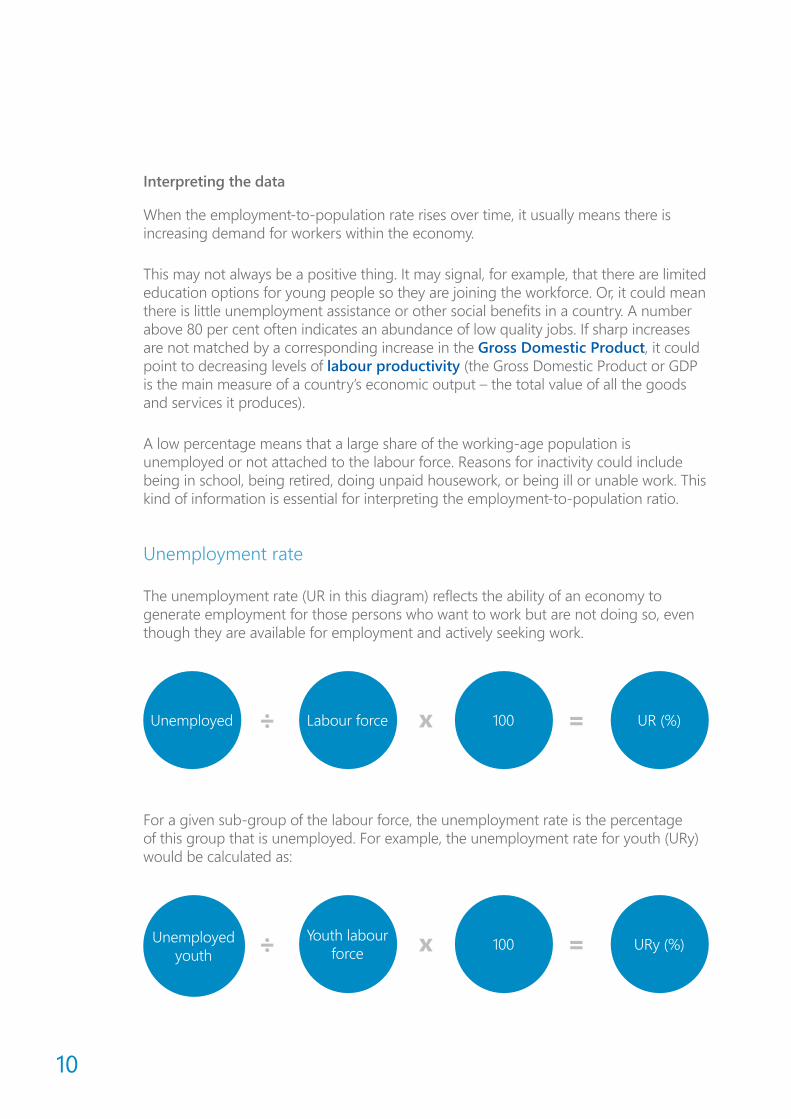
Unemployment rate
The unemployment rate (UR in this diagram) reflects the ability of an economy to generate employment for those persons who want to work but are not doing so, even though they are available for employment and actively seeking work.
Unemployed Labour force 100 UR (%)
For a given sub-group of the labour force, the unemployment rate is the percentage of this group that is unemployed. For example, the unemployment rate for youth (URy) would be calculated as:
Unemployed youth
Youth labour force 100 URy (%)
ILO • NATIONAL EMPLOYMENT POLICIES - A guide for workers’ organisations
11
Interpreting the data
In most developed countries, the unemployment rate is an important indicator of labour market performance, and a key measure of labour underutilization. In developing countries, the significance and meaning of the unemployment rate is much more limited. In the absence of unemployment insurance or other social safety nets, most people of working age must engage in some form of economic activity, however inadequate. They often work in the informal economy and in self-employment.
Unemployment trends should be analysed with changes in total output measured by the Gross Domestic Product (GDP). Healthy economic growth is often associated with a decrease in the unemployment rate. However at the start of economic expansion, the unemployment rate may actually increase, as discouraged workers and others previously not in the labour force start their job searches.
In most cases, a decline in the unemployment rate is accompanied by an increase in the employment-to-population ratio. The unemployment rate should also be analysed with indicators such as:
• duration of unemployment
• time-related underemployment
• proportion of the unemployed who benefit from unemployment insurance schemes or temporary work schemes (where they exist)
• availability of job skills training and apprenticeships
• number of people benefitting from such programmes.
12
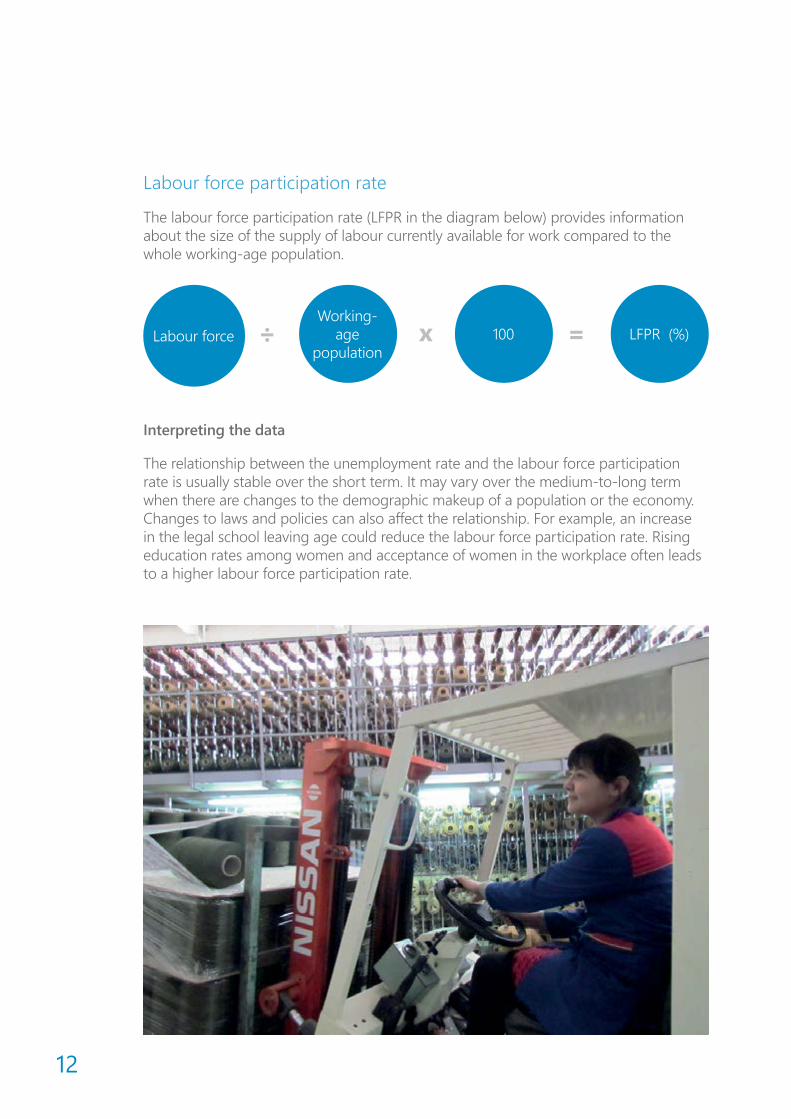
Labour force participation rate
The labour force participation rate (LFPR in the diagram below) provides information about the size of the supply of labour currently available for work compared to the whole working-age population.
Labour forceWorking-
age population
100 LFPR (%)
Interpreting the data
The relationship between the unemployment rate and the labour force participation rate is usually stable over the short term. It may vary over the medium-to-long term when there are changes to the demographic makeup of a population or the economy. Changes to laws and policies can also affect the relationship. For example, an increase in the legal school leaving age could reduce the labour force participation rate. Rising education rates among women and acceptance of women in the workplace often leads to a higher labour force participation rate.
ILO • NATIONAL EMPLOYMENT POLICIES - A guide for workers’ organisations
13
4.4. Measuring full and productive employmentThe international community has established Millennium Development Goals, the first of which is to “eradicate extreme poverty and hunger” (ILO, 2013c). It has set a target to “achieve full and productive employment and Decent Work for all, including women and young people”. To monitor progress toward this target, the ILO has selected four indicators:
1. Employment-to-population ratio (%)
2. Working poverty rate (%)
3. Labour productivity growth rate (%)
4. Vulnerable employment rate (%)
We discussed the employment-to-population ratio in the previous section. Here, we explain the other three indicators.
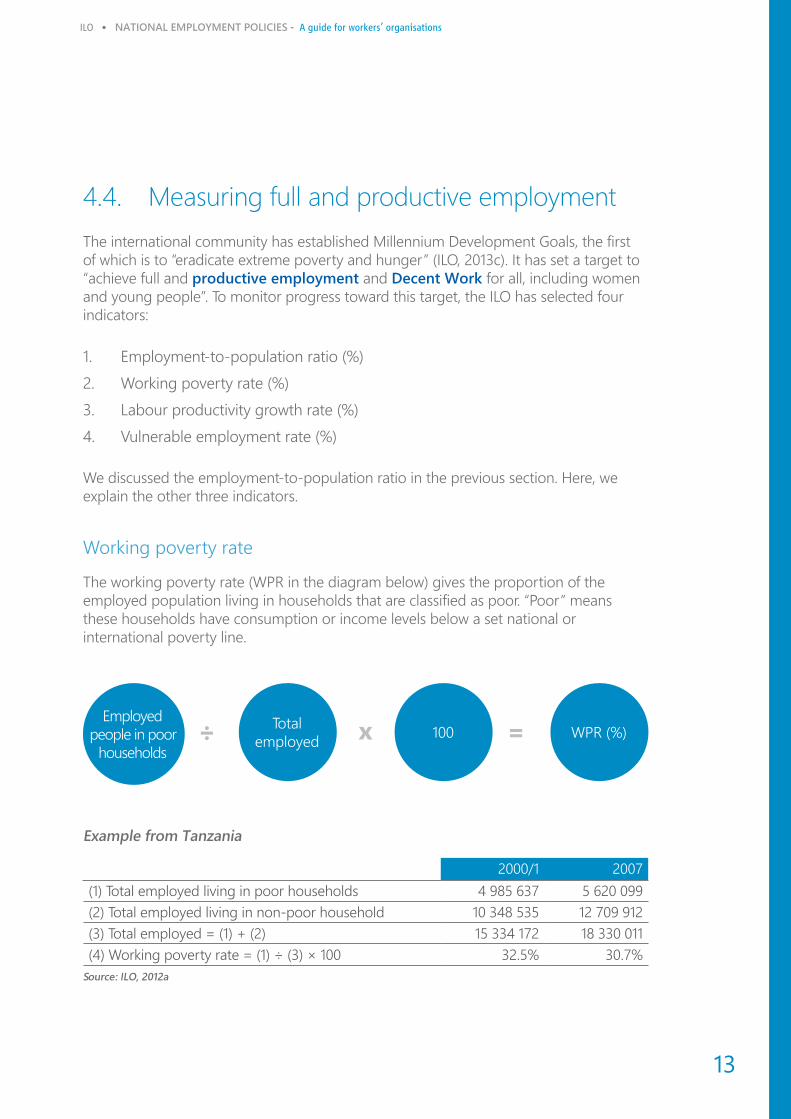
Working poverty rate
The working poverty rate (WPR in the diagram below) gives the proportion of the employed population living in households that are classified as poor. “Poor” means these households have consumption or income levels below a set national or international poverty line.
Employed people in poor
households
Total employed 100 WPR (%)
Example from Tanzania
2000/1 2007(1) Total employed living in poor households 4 985 637 5 620 099(2) Total employed living in non-poor household 10 348 535 12 709 912(3) Total employed = (1) + (2) 15 334 172 18 330 011(4) Working poverty rate = (1) ÷ (3) × 100 32.5% 30.7%
Source: ILO, 2012a
14
Interpreting the data
Poverty is a concept that is applied to households, and not to individuals, based on the assumption that households pool their income. The question is whether a household’s total income is sufficient to lift the entire household out of poverty. Whether a worker is counted as working poor depends on his or her own income, the income of other household members and the number of household members who need to be supported, including children, elders, and other dependents.
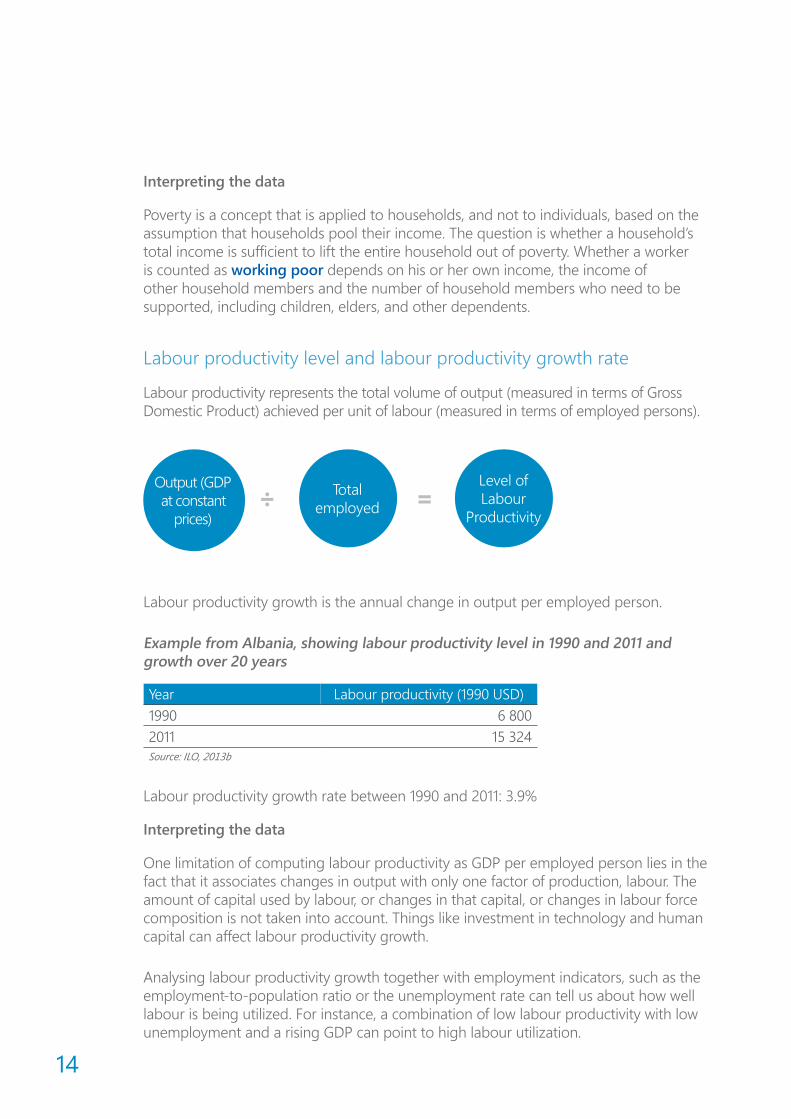
Labour productivity level and labour productivity growth rate
Labour productivity represents the total volume of output (measured in terms of Gross Domestic Product) achieved per unit of labour (measured in terms of employed persons).
Output (GDP at constant
prices)
Total employed
Level of Labour
Productivity
Labour productivity growth is the annual change in output per employed person.
Example from Albania, showing labour productivity level in 1990 and 2011 and growth over 20 years
Year Labour productivity (1990 USD)1990 6 8002011 15 324Source: ILO, 2013b
Labour productivity growth rate between 1990 and 2011: 3.9%
Interpreting the data
One limitation of computing labour productivity as GDP per employed person lies in the fact that it associates changes in output with only one factor of production, labour. The amount of capital used by labour, or changes in that capital, or changes in labour force composition is not taken into account. Things like investment in technology and human capital can affect labour productivity growth.
Analysing labour productivity growth together with employment indicators, such as the employment-to-population ratio or the unemployment rate can tell us about how well labour is being utilized. For instance, a combination of low labour productivity with low unemployment and a rising GDP can point to high labour utilization.
ILO • NATIONAL EMPLOYMENT POLICIES - A guide for workers’ organisations
15
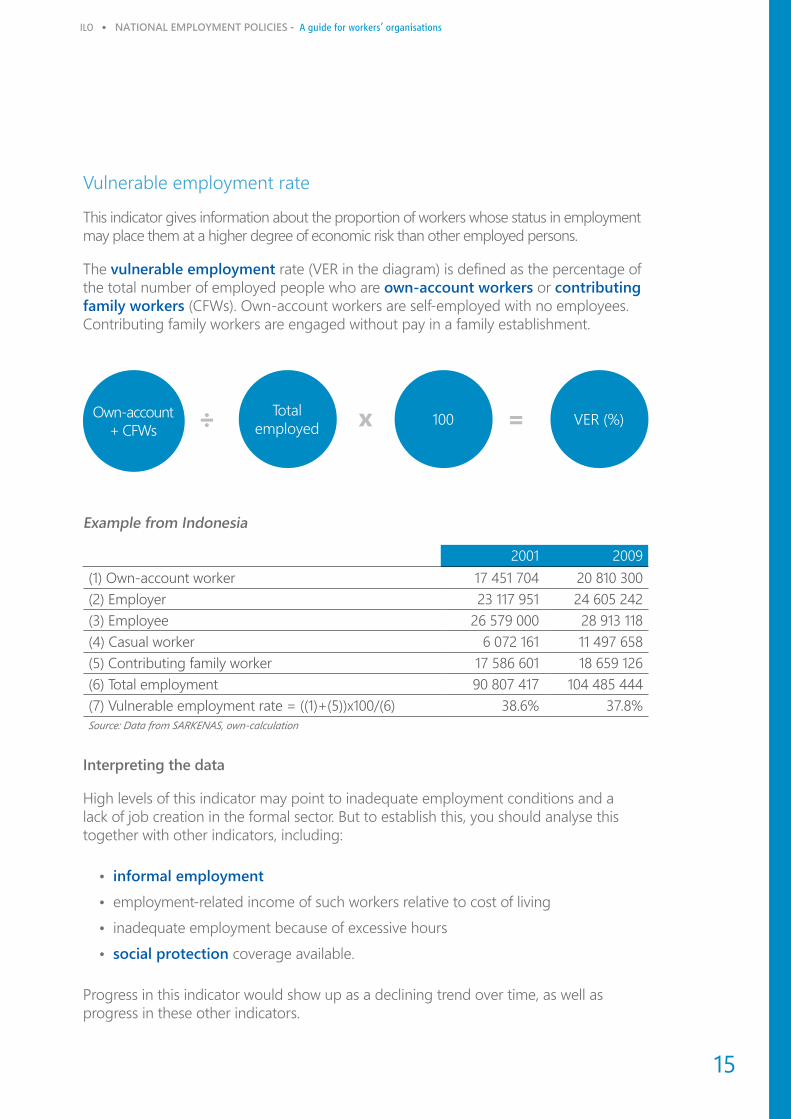
Vulnerable employment rate
This indicator gives information about the proportion of workers whose status in employment may place them at a higher degree of economic risk than other employed persons.
The vulnerable employment rate (VER in the diagram) is defined as the percentage of the total number of employed people who are own-account workers or contributing family workers (CFWs). Own-account workers are self-employed with no employees. Contributing family workers are engaged without pay in a family establishment.
Own-account + CFWs
Total employed 100 VER (%)
Example from Indonesia
2001 2009(1) Own-account worker 17 451 704 20 810 300(2) Employer 23 117 951 24 605 242(3) Employee 26 579 000 28 913 118(4) Casual worker 6 072 161 11 497 658(5) Contributing family worker 17 586 601 18 659 126(6) Total employment 90 807 417 104 485 444(7) Vulnerable employment rate = ((1)+(5))x100/(6) 38.6% 37.8%Source: Data from SARKENAS, own-calculation
Interpreting the data
High levels of this indicator may point to inadequate employment conditions and a lack of job creation in the formal sector. But to establish this, you should analyse this together with other indicators, including:
• informal employment
• employment-related income of such workers relative to cost of living
• inadequate employment because of excessive hours
• social protection coverage available.
Progress in this indicator would show up as a declining trend over time, as well as progress in these other indicators.
16
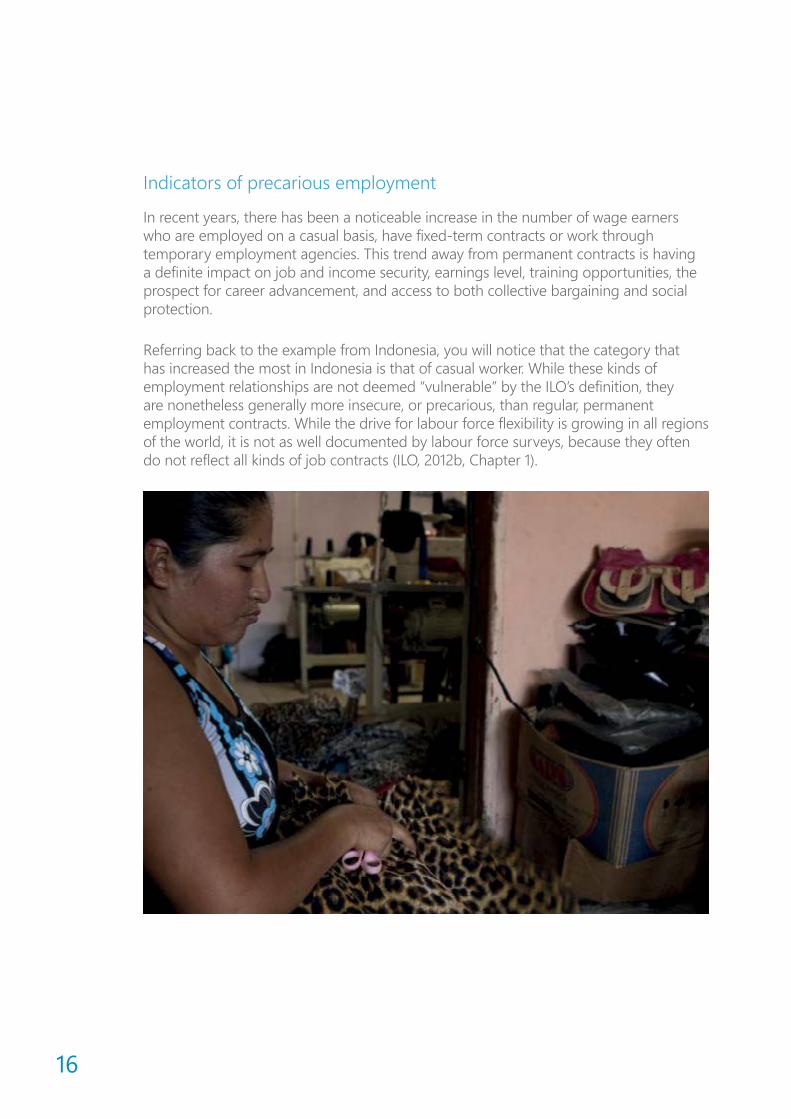
Indicators of precarious employment
In recent years, there has been a noticeable increase in the number of wage earners who are employed on a casual basis, have fixed-term contracts or work through temporary employment agencies. This trend away from permanent contracts is having a definite impact on job and income security, earnings level, training opportunities, the prospect for career advancement, and access to both collective bargaining and social protection.
Referring back to the example from Indonesia, you will notice that the category that has increased the most in Indonesia is that of casual worker. While these kinds of employment relationships are not deemed “vulnerable” by the ILO’s definition, they are nonetheless generally more insecure, or precarious, than regular, permanent employment contracts. While the drive for labour force flexibility is growing in all regions of the world, it is not as well documented by labour force surveys, because they often do not reflect all kinds of job contracts (ILO, 2012b, Chapter 1).

ILO • NATIONAL EMPLOYMENT POLICIES - A guide for workers’ organisations
17
4.5. Measuring equal opportunity and treatment in employment
Occupational segregation by sex
This indicator provides information about men’s and women’s occupations. By “occupation” we mean a set of jobs whose main tasks and duties are highly similar. The indicator sheds light on the extent to which women and men benefit from different opportunities and treatment in work life.
There are three measures of occupational segregation by sex. All of them use the International Standard Classification of Occupations sub-groups.
1. Female share of employment
This measure shows where there are concentrations of women and men in each group of occupations. A group in which the female share of employment is high (for example, more than 80 per cent), may be considered as “female dominated”. If the female share is low (for example, less than 20 per cent), it may be taken as “male dominated”.
2. Occupational distribution
This measure shows the number of women and the number of men employed in each occupational group, as a proportion of total female and male employment, respectively. This data may reflect gender differences in access to employment opportunities in some occupational groups.
3. Duncan Index of Dissimilarity
This is the most popular indicator of the labour markets segmentation on the basis of sex in various occupational group or by employer’s status. Higher numbers indicate more occupational segregation. A zero value means there is no occupational segregation.
Example: Sex segregation by type of enterprises, Cameroon 2005 and 2010
Enterprise Type Duncan Index of sex segregation 2005
Duncan Index of sex segregation 2010
Public administration 15.38 11.56State or parastatal enterprises (enterprises with functions related to government) 19.33 10.45
Large private companies 17.26 18.50Small and medium enterprises 15.16 19.56Micro-enterprises and self-employed 10.11 8.78Agricultural unit 14.64 6.55Cooperatives 15.43 21.79Source: Institut National de la Statistique, 2011
18
Interpreting the data
The index does not identify which occupational groups create these differences. As a single value, the index has the advantage that comparisons over time and between countries are easy to present. A disadvantage of using this index is that changes over time and differences between countries are not driven only by the sex composition of occupations. They may also reflect differences or changes in the occupational structure of the labour market.
Gender wage gap
The gender wage gap measures the differences in pay between men and women. A positive gender wage gap indicates that men earn more than women in the occupation concerned. A negative gender wage gap indicates that women earn mor than men.
Earnings data are typically only available for employees, which means that it does not reflect large numbers of own-account workers or employers, especially in the informal sector. There, income differences between men and women may be larger.
The gender pay gap also does not capture income differences between the sexes that result from uneven access to paid employment. For instance, when men are over-represented among paid employees (with relatively high incomes) and women are over-represented among the self-employed in the informal sector (with relatively low incomes), the overall gap in incomes is likely to be greater than what can be captured by the gender wage gap.
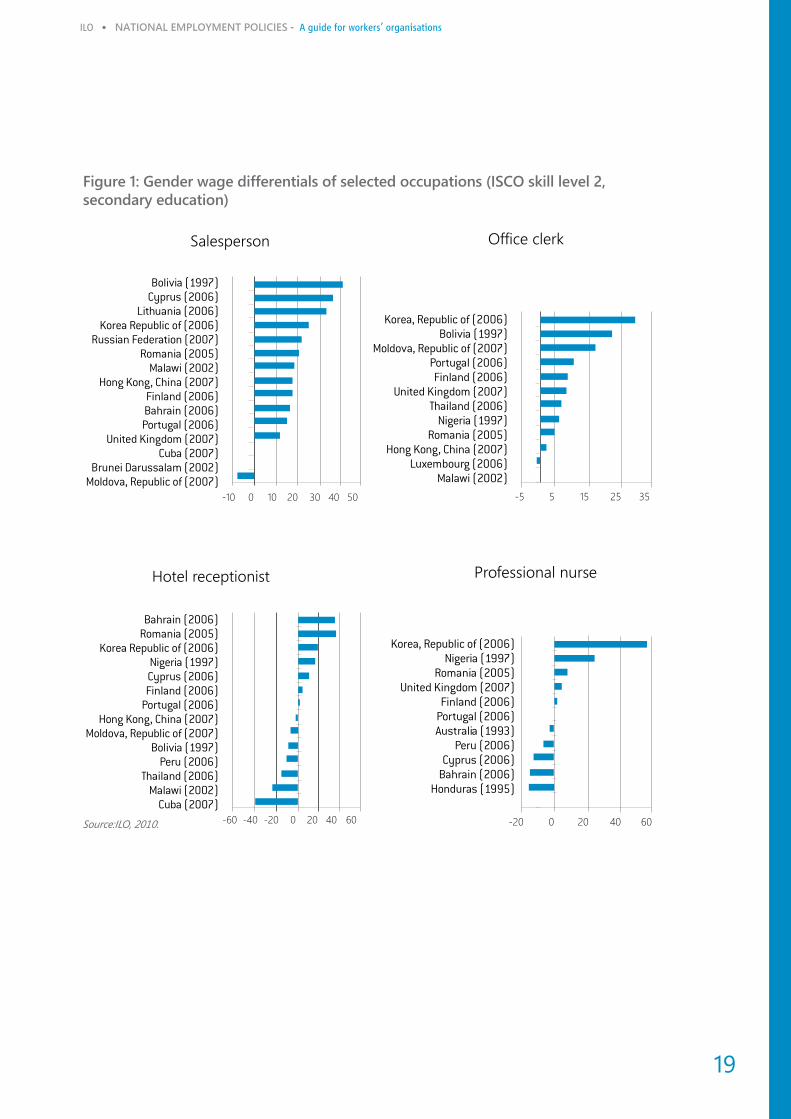
The following series of figures demonstrates that male-female pay differentials are firmly present. The occupations showing the lowest differentials were professional nurse and office clerk – all occupations that are likely to be dominated by women. The gender wage differential for salespersons reached over 40 per cent in Bolivia, with the majority of countries in the range of 10-30 per cent. Even hotel receptionists and professional nurses – traditional female occupations – had large gaps, although there were also more incidences where wages in these occupations were higher for women than men.
ILO • NATIONAL EMPLOYMENT POLICIES - A guide for workers’ organisations
19
Figure 1: Gender wage differentials of selected occupations (ISCO skill level 2, secondary education)
Bolivia (1997)Cyprus (2006)
Lithuania (2006)Korea Republic of (2006)
Russian Federation (2007)Romania (2005)
Malawi (2002)Hong Kong, China (2007)
Finland (2006)Bahrain (2006)
Portugal (2006)United Kingdom (2007)
Cuba (2007)Brunei Darussalam (2002)
Moldova, Republic of (2007)-10 0 10 20 30 40 50
Salesperson
Bahrain (2006)Romania (2005)
Korea Republic of (2006)Nigeria (1997)Cyprus (2006)Finland (2006)
Portugal (2006)Hong Kong, China (2007)
Moldova, Republic of (2007)Bolivia (1997)
Peru (2006)Thailand (2006)
Malawi (2002)Cuba (2007)
-60 -40 -20 0 20 40 60
Hotel receptionist
Korea, Republic of (2006)Bolivia (1997)
Moldova, Republic of (2007)Portugal (2006)Finland (2006)
United Kingdom (2007)Thailand (2006)
Nigeria (1997)Romania (2005)
Hong Kong, China (2007)Luxembourg (2006)
Malawi (2002)
-5 5 15 25 35
Office clerk
Korea, Republic of (2006)Nigeria (1997)
Romania (2005)United Kingdom (2007)
Finland (2006)Portugal (2006)Australia (1993)
Peru (2006)Cyprus (2006)
Bahrain (2006)Honduras (1995)
-20 0 20 40 60
Professional nurse
Source:ILO, 2010.

20
Share of women in wage employment in the non-agricultural sector
This indicator shows the percentage of women in paid employment in sectors other than agriculture. The indicator may vary from 0 per cent (only men) to 100 per cent (only women). Equal numbers of women and men in the sectors would give an indicator value of 50 per cent.
In some countries, non-agricultural wage employment represents only a small portion of total employment. Therefore, this indicator should be considered together with additional information on the situation of women in the labour market. For instance, it is important to look at the share of women in total employment − by status in employment, level of education, level of remuneration, wage differentials, and women’s and men’s access to social protection.
ILO • NATIONAL EMPLOYMENT POLICIES - A guide for workers’ organisations
21
4.6. Other indicators of decent work
Youth not in education and not in employment
This indicator measures all youth who are outside the educational system and not in employment. It is a broader measure of potential youth labour market entrants than just measuring youth unemployment.
A high rate for this indicator, when compared with the youth unemployment rate, could mean that a large number of youths are discouraged workers, or do not have access to education or training. It is important, for potential policy interventions, to find out why youth are disengaged, using tools such as youth surveys.
A high rate among females as compared to males is often an indication that female youths are engaged in housework and child care. When such activities prevent female youth from going to school, they place young women at risk of not gaining the skills they need to succeed in the labour market.
It may also be useful to analyse information on the number of youth benefitting from training and apprenticeship programmes, and to get a separate figure for the number of unemployed youth who benefit. If no such programmes exist, it could be useful to identify the skills gaps for jobs that exist or are likely to be in demand. This would give you information for policy action.
Informal employment rate
The informal employment rate is an important indicator of the quality of employment in an economy. It is defined as the percentage of all employed people who are in informal employment.
Informal employment is measured according to guidelines from the 17th International Conference of Labour Statisticians. It includes the following sub-categories of workers:
• paid employees in informal jobs ( jobs without either a social security entitlement, paid annual leave, or paid sick leave), whether in the formal or informal sector
• paid employees in an unregistered and/or small and unincorporated private enterprise.
• own-account workers in an unregistered and/or small and unincorporated private enterprise.
• employers in an unregistered enterprise and/or small and unincorporated private with fewer than five employees.
• contributing family workers.
22
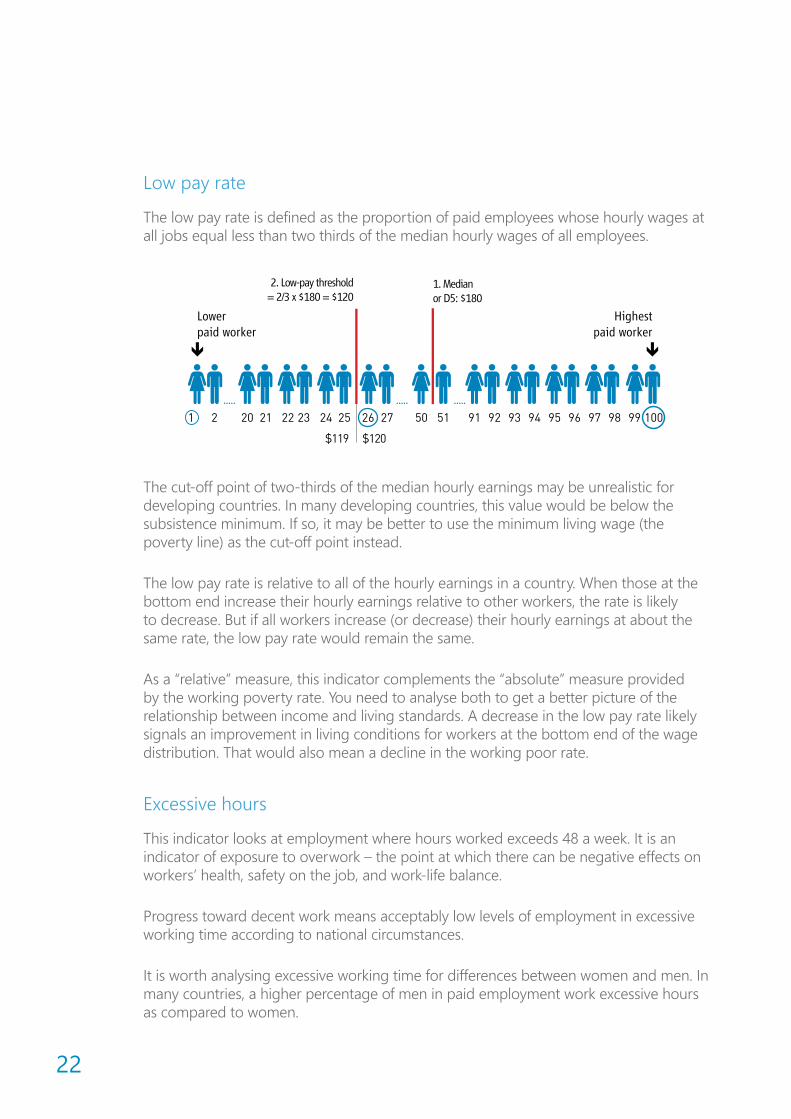
Low pay rate
The low pay rate is defined as the proportion of paid employees whose hourly wages at all jobs equal less than two thirds of the median hourly wages of all employees.
1 2 20 21 22 23 24 25
$119 $120
26 27 50 51 91 92 93 94 95 96 97 98 99 100
Highestpaid worker
2. Low-pay threshold= 2/3 x $180 = $120
Lowerpaid worker
1. Medianor D5: $180
The cut-off point of two-thirds of the median hourly earnings may be unrealistic for developing countries. In many developing countries, this value would be below the subsistence minimum. If so, it may be better to use the minimum living wage (the poverty line) as the cut-off point instead.
The low pay rate is relative to all of the hourly earnings in a country. When those at the bottom end increase their hourly earnings relative to other workers, the rate is likely to decrease. But if all workers increase (or decrease) their hourly earnings at about the same rate, the low pay rate would remain the same.
As a “relative” measure, this indicator complements the “absolute” measure provided by the working poverty rate. You need to analyse both to get a better picture of the relationship between income and living standards. A decrease in the low pay rate likely signals an improvement in living conditions for workers at the bottom end of the wage distribution. That would also mean a decline in the working poor rate.
Excessive hours
This indicator looks at employment where hours worked exceeds 48 a week. It is an indicator of exposure to overwork – the point at which there can be negative effects on workers’ health, safety on the job, and work-life balance.
Progress toward decent work means acceptably low levels of employment in excessive working time according to national circumstances.
It is worth analysing excessive working time for differences between women and men. In many countries, a higher percentage of men in paid employment work excessive hours as compared to women.
ILO • NATIONAL EMPLOYMENT POLICIES - A guide for workers’ organisations
23
4.7. Using good data to build a case
Example for a single indicator
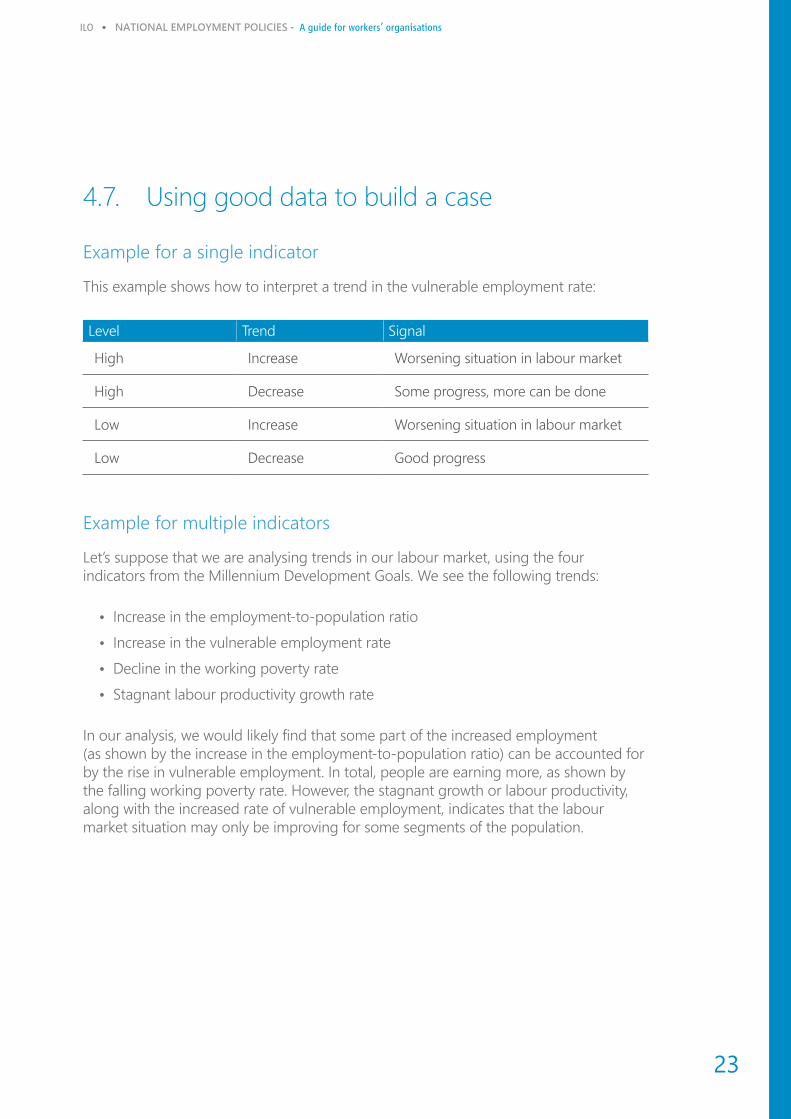
This example shows how to interpret a trend in the vulnerable employment rate:
Level Trend Signal
High Increase Worsening situation in labour market
High Decrease Some progress, more can be done
Low Increase Worsening situation in labour market
Low Decrease Good progress
Example for multiple indicators
Let’s suppose that we are analysing trends in our labour market, using the four indicators from the Millennium Development Goals. We see the following trends:
• Increase in the employment-to-population ratio
• Increase in the vulnerable employment rate
• Decline in the working poverty rate
• Stagnant labour productivity growth rate
In our analysis, we would likely find that some part of the increased employment (as shown by the increase in the employment-to-population ratio) can be accounted for by the rise in vulnerable employment. In total, people are earning more, as shown by the falling working poverty rate. However, the stagnant growth or labour productivity, along with the increased rate of vulnerable employment, indicates that the labour market situation may only be improving for some segments of the population.

24
ILO • NATIONAL EMPLOYMENT POLICIES - A guide for workers’ organisations
25
References
Institut National de la Statistique. 2011. Enquêtes sur l’emploi et le secteur informel (EESI 2), 2010 (Yaoundé).
International Conference of Labour Statisticians. 1982. “Resolution concerning statistics of the economically active population, employment, unemployment and underemployment” in Report of the Conference (Geneva). Available online at http://www.ilo.org/public/libdoc/ilo/1982/82B09_651_engl.pdf.
International Labour Office. 2010. Women in labour markets: Measuring progress and identifying challenges (Geneva).
International Labour Organization (ILO). 2012a. Decent work country profile Tanzania (mainland) (Dar es Salaam and Geneva). Available online at http://www.ilo.org/public/english/region/afpro/daressalaam/download/decent_work_tz.pdf.
—. 2012b. World of Work (Geneva). Available online at http://www.ilo.org/wcmsp5/groups/public/@dgreports/@dcomm/@publ/documents/publication/wcms_179453.pdf.
ILO. 2013a. Decent work indicators: Concepts and definitions (Geneva). Available online at http://www.ilo.org/integration/resources/pubs/WCMS_229374/lang--en/index.htm.
ILO. 2013b. Key indicators of the labour market, 8th edition, Indicator 17: Labour productivity (Geneva). Available online at http://www.ilo.org/empelm/what/WCMS_114240/lang--en/index.htm.
ILO. 2013c. Guide to the new Millennium Development Goals employment indicators (including the full set of decent work indicators) (Geneva). Available online at http://www.ilo.org/global/topics/post-2015/documents/WCMS_208796/lang--en/index.htm.
National Bureau of Statistics (Tanzania). 2006. Integrated labour force survey 2006: Analytical report (Tanzania).
26
Resources and tools
Guide to the new Millennium Development Goals Employment Indicators, including the full set of Decent Work Indicators, International Labour Office. Geneva: ILO , 2013http://www.ilo.org/global/topics/post-2015/documents/WCMS_208796/lang--en/index.htm
Understanding deficits of productive employment and setting targets; A Methodological guide/International Labour Office, Geneva: ILO, 2012
New standard on statistics of work, International Conference of Statisticians, 2013.http://www.ilo.org/global/statistics-and-databases/standards-and-guidelines/resolutions-adopted-by-international-conferences-of-labour-statisticians/WCMS_230304/lang--en/index.htmhttp://www.ilo.org/global/statistics-and-databases/meetings-and-events/international-conference-of-labour-statisticians/19/WCMS_234124/lang--en/index.htm
The International Standard Industrial Classification of All Economic Activities (ISIC), Rev.4http://unstats.un.org/unsd/cr/registry/regcst.asp?Cl=27
The International Standard Classification of Occupations (ISCO)http://www.ilo.org/public/english/bureau/stat/isco/docs/resol08.pdf
The International Classification of Status in Employment (ICSE)http://www.ilo.org/wcmsp5/groups/public/---dgreports/---stat/documents/normativeinstrument/wcms_087562.pdf
ISBN 978-92-2-129343-9
9 7 8 9 2 2 1 2 9 3 4 3 9
Bureau for Workers' Activities (ACTRAV)
International Labour OfficeRoute des Morillons 4CH-1211 Geneva 22www.ilo.org/[email protected]
Employment Policy Department (EMPLOYMENT)
International Labour OfficeRoute des Morillons 4CH-1211 Geneva 22www.ilo.org/[email protected]