national employer survey - department of education … · graduate recruitment from outside of ......
TRANSCRIPT

NATIONALEMPLOYERSURVEYEMPLOYERS’ VIEwS ON IRIShfURThER ANd hIghEREdUcATION ANd TRAININgOUTcOMES
commissioned by the higherEducation Authority, SOLAS andQuality and QualificationsIreland
May 2015
National Employer Survey covers_Layout 1 07/05/2015 16:49 Page 1

National Employer Survey – Employers’ Views on Irish Further and Higher Education Outcomes – May 2015
2 | P a g e
Table of Contents Acknowledgements...................................................................................................................... 4
List of Figures ............................................................................................................................... 5
List of Tables ................................................................................................................................ 5
Executive Summary ...................................................................................................................... 6
1 KEY FINDINGS ....................................................................................................................... 7
Reasons for not employing graduates ................................................................................................ 7
Graduate profile by discipline and skill category ................................................................................ 7
Qualifications recruited ...................................................................................................................... 7
Satisfaction with graduates ................................................................................................................ 7
Minimum entry standards .................................................................................................................. 8
Skills not currently available ............................................................................................................... 8
Future supply of graduates ................................................................................................................. 8
Collaboration....................................................................................................................................... 9
Enterprise–education relationships .................................................................................................. 10
Languages ......................................................................................................................................... 10
Graduate recruitment from outside of Ireland ................................................................................. 11
2 RESEARCH BACKGROUND AND METHODOLOGY .................................................................. 12
3 RESPONSE CHARACTERISTICS .............................................................................................. 15
Reasons for not employing graduates .............................................................................................. 16
Graduates from Higher Education (HE) and Further Education and Training (FET) ......................... 17
Key reporting classifications ............................................................................................................. 17
Graduate profile by discipline and skill category .............................................................................. 21
Qualifications recruited .................................................................................................................... 23
Doctoral degrees [NFQ Level 10] ...................................................................................................... 24
National Framework of Qualifications .............................................................................................. 24
4 SATISFACTION WITH GRADUATES ....................................................................................... 26
Comparison of satisfaction with HE and FET Graduates ................................................................... 31
5 SKILLS REQUIREMENT ......................................................................................................... 33
Minimum entry standards ................................................................................................................ 33
Skills not currently available ............................................................................................................. 34
Future supply of graduates ............................................................................................................... 35

National Employer Survey – Employers’ Views on Irish Further and Higher Education Outcomes – May 2015
3 | P a g e
6 COLLABORATION BETWEEN ENTERPRISE AND EDUCATION .................................................. 37
Enterprise-education relationships................................................................................................... 40
7 LANGUAGES AND GRADUATE RECRUITMENT OUTSIDE OF IRELAND ..................................... 42
Language proficiency ........................................................................................................................ 44
Graduate recruitment from outside of Ireland ................................................................................. 45
Glossary..................................................................................................................................... 47
Appendix 1 - Questionnaire ........................................................................................................ 48

National Employer Survey – Employers’ Views on Irish Further and Higher Education Outcomes – May 2015
4 | P a g e
Acknowledgements
The commissioning agencies HEA, SOLAS and QQI would like to thank Insight Statistical
Consulting for their assistance on producing this national employers survey. David Harmon
and Professor Myra O’Regan of Insight designed and managed the online survey and
subsequent analysis as well as authoring the final report. The Insight consulting team would
like to thank all of the members of the steering group (listed below) for their help and
assistance throughout the project and in obtaining responses to the survey. Particular
thanks to Tim Conlon who was the main liaison on the project.
Member Title Organisation
Jasmina Behan Senior Research Officer SOLAS
Dermot Carey Head of Department Construction Industry Federation
Liz Carroll Training and Development Manager ISME
Tim Conlon Skills & Enterprise Engagement unit HEA
Brian Cotter Public Affairs Director American Chamber of Commerce
Pat Gilmore President Education and Training Boards Ireland
Diarmuid Hegarty President HECA/Griffith College Dublin
Barbara Kelly Head of Industry & External Partnerships
Quality and Qualifications Ireland (QQI)
Deirdre McDonnell Principal Officer, Policy and Skills Department of Education and Skills
Seamus McEvoy Careers Advisor and Head of Service AHECS / UCC
Kara McGann Policy Executive IBEC
John McGrath Research Manager SOLAS
Tommy Moloney I.M.S Manager Construction Industry Federation / G&T Crampton
Keith Moynes Assistant Principal, Policy and Skills Department of Education and Skills
Jim Murray Director of Academic Affairs IOTI
Breda O’Sullivan Senior Economist IDA
Vivienne Patterson Head of Statistics HEA
Lewis Purser Director of Academic Affairs IUA
Kathleen Quinlan Client Skills Unit Enterprise Ireland
Donal Quill Financial Director HECA/ Dublin Business School
Mary-Liz Trant Head of Skills & Enterprise Engagement unit
HEA
Gerard Walker Senior Policy Advisor EGFSN / DJEI

National Employer Survey – Employers’ Views on Irish Further and Higher Education Outcomes – May 2015
5 | P a g e
List of Figures Figure 1: Source of final sample size ..................................................................................................... 15
Figure 2: Reason(s) for not employing any graduates .......................................................................... 16
Figure 3: Number of employer organisations with HE and/or FET graduates ...................................... 17
Figure 4: Source of all graduates recruited by employer organisations ............................................... 19
Figure 5: Source of all HE graduates ..................................................................................................... 20
Figure 6: Levels at which HE graduates were recruited ........................................................................ 23
Figure 7: Levels at which FET graduates were recruited ...................................................................... 23
Figure 8: Awareness of the National Framework of Qualifications (NFQ)............................................ 25
Figure 9: Satisfaction with selected workplace attributes by main disciplines for HE ......................... 27
Figure 10: Comparison of satisfaction with HE disciplines across workplace and personal attributes 29
Figure 11: Comparison of satisfaction with FET Skill Categories across workplace and personal
attributes .............................................................................................................................................. 30
Figure 12: Comparison of HE and FET satisfaction rates for workplace attributes .............................. 31
Figure 13: Comparison of HE and FET satisfaction rates for personal attributes ................................. 32
Figure 14: Proportion of employer organisations with minimum entry standards .............................. 33
Figure 15: Minimum entry standards required .................................................................................... 33
Figure 16: Are there skills not currently available that are required now (or in the next three to five
years)? ................................................................................................................................................... 34
Figure 17: Likelihood that there will be an adequate supply of graduates in the next three to five
years ...................................................................................................................................................... 35
Figure 18: Collaboration with HE and/or FET ....................................................................................... 37
Figure 19: Collaborations with HEIs by employer organisations of HE graduates ................................ 38
Figure 20: Collaborations with HEIs by employer organisations of FET graduates .............................. 38
Figure 21: Comparison of collaboration rating by HE & FET employer organisations .......................... 39
Figure 22: Established relationship with a higher education institution as a source of graduates ...... 40
Figure 23: Specific requirement for foreign language proficiency skills in their organisation ............. 42
Figure 24: Specific languages required by employers .......................................................................... 43
Figure 25: Minimum required proficiency (at least full professional level) .......................................... 44
Figure 26: Graduate recruitment from outside of Ireland .................................................................... 45
List of Tables Table 1: Employer organisations and graduates recruited ................................................................... 18
Table 2: Profile of HE disciplines (multiple response)........................................................................... 21
Table 3: Profile of FET Skill Categories (multiple responses) ................................................................ 22
Table 4: Level of satisfaction with HE graduates across workplace attributes ..................................... 26
Table 5: Level of satisfaction with HE graduates across personal attributes ....................................... 28
National Employer Survey – Employers’ Views on Irish Further and Higher Education Outcomes – May 2015
6 | P a g e
Executive Summary The National Employer Survey provides valuable information on the views of employers on further
and higher education outcomes in 2014. The responding employer organisations recruited 9,344
recent graduates from further and higher education. Based on an assumption that approximately
60,000 graduates were recruited in the Republic of Ireland during the past two years, this accounted
for an estimated 12% of the total graduate recruitment.
For the purposes of this survey, a graduate is someone who has been recruited within the last 24
months and who has also completed their qualification within the last 24 months.
1,378 organisations accessed the survey with 914 organisations answering the opening questions on
staff recruited within the past two years. 383 organisations completed the entire survey.
In terms of satisfaction, employers were very satisfied with graduate recruits across a range of workplace and personal attributes. These included ICT skills; teamwork; communication; adaptability and flexibility; positive attitude and energy. A lower level of satisfaction was noted for foreign language capability, entrepreneurial skills and business acumen/awareness.
The majority of recruitment efforts concentrated on science, technology, engineering and mathematics-related subjects. The main qualification being recruited is an honours degree for higher education graduates and a FETAC award for further education and training graduates.
There was evidence to support the finding that employers from large and/or foreign owned employer organisations were distinctive for their responses on a range of questionnaire topics. These employer organisations were:
more satisfied with workplace and personal attributes of graduate recruits
more likely to collaborate with education through internships/placements (82% for large organisations and 61% for small organisations) and have a greater level of satisfaction with these collaborations
more likely to establish a relationship with an education provider to source graduates (71% of large organisation and 42% of small organisations)
more likely to have a need for foreign language skills in their organisation (32% for foreign employer organisations and 22% for indigenous employer organisations) and require a higher level of proficiency for specific European languages, and
more likely to recruit graduates from institutions outside Republic of Ireland (47% for large employer organisations and 30% for small/medium organisations).
Approximately 40% of employer organisations indicated that there were skills not currently available that are required now or in the next five years. The main skills cited were engineering, languages, ICT and specific quantitative skills.
The primary reasons for establishing a relationship with a higher education institution as a source for future graduates were; near proximity, existing relationships with previous graduates who are now employees, and specific offerings such as internships, placements and work experience programmes.
Although collaboration between education and industry is high (approximately 70%), a range of suggestions on how employers and education institutions could further improve collaboration are described. There was a high level of employer engagement in the survey as evidenced by a large number of open-ended responses with two-thirds of employers willing to participate in follow-on research. A detailed review of the qualitative comments provided by employer organisations is planned following this report.

National Employer Survey – Employers’ Views on Irish Further and Higher Education Outcomes – May 2015
7 | P a g e
1 KEY FINDINGS
Reasons for not employing graduates
The main reason for not recruiting any recent graduates within the past two years is
because of there were no vacancies at this level (81% of all organisations) – Ref:
Figure 2.
Graduate profile by discipline and skill category
Engineering was the most prominent single discipline among foreign (63%),
manufacturing (59%) and large (63%) employer organisations. Graduates from the
Business and Law discipline were also prominent among the indigenous (43%),
service (45%) and large (50%) employer organisations – Ref: Table 2.
Approximately 30% of all employer organisations employed a further education
graduate from the Business Administration and Management skill category. The next
most prominent skill categories were Manufacturing/Engineering (24%) and IT (23%)
– Ref: Table 3.
Qualifications recruited
The majority of employers (72%) recruited graduates with an Honours Degree. The
next most frequently occurring level was a Masters Degree, Post-Graduate Diploma
(44%) and then a Higher Certificate and Ordinary Bachelors Degree (34%) –Ref:
Figure 6.
Over half of all employers of further education graduates (57%) recruited at least
one graduate with a FETAC1 award and approximately a quarter (26%) recruited at
least one qualified apprentice – Ref: Figure 7.
Approximately 11% of all employer organisations recruited at Doctoral Degree level
(18% of foreign employers and 8% of indigenous employers). The discipline with the
highest proportion of Doctoral Degrees was Science and Mathematics (18%).
Approximately 61% of all graduate employers had heard of the National Framework
of Qualifications (NFQ). This proportion was highest for foreign organisations (70%),
large organisations (75%) and the Manufacturing sector (68%). Of those
organisations who had heard of the NFQ, just over one-third (36%) had referred to it
during their recruitment process – Ref: Figure 8.
Satisfaction with graduates
Satisfaction rates were more positive for foreign-owned organisations and large
employer organisations across most workplace attributes. Although satisfaction
1 In 2012, Quality and Qualifications Ireland (QQI) was established as a new integrated agency (replacing the Further Education and Training Awards Council, the Higher Education and Training Awards Council and the National Qualifications Authority of Ireland and incorporating the functions of the Irish Universities Quality Board)

National Employer Survey – Employers’ Views on Irish Further and Higher Education Outcomes – May 2015
8 | P a g e
with ‘Computer and technical literacy’, ‘Working effectively with others’ and
‘Numeracy/processing numerical data’ was very high, satisfaction was relatively low
for the following attributes; ‘Foreign language capability’, ‘Business acumen/
awareness’ and ‘Entrepreneurial skills’ – Ref: Table 4.
Satisfaction rates with personal attributes of graduates were very high across all
cohorts, in particular for large and foreign employer organisations – Ref: Table 5.
Satisfaction with personal attributes of graduates within each discipline was higher
than (aggregated) workplace attributes for each discipline – Ref: Figure 10.
Satisfaction with personal attributes of graduates within each skill category was
higher than (aggregated) workplace attributes for each skill category – Ref: Figure
11.
Satisfaction rates between employers of HE graduates and employers of FET
graduates were similar for workplace attributes with the exception of ‘foreign
language capability’ where there was a lower rate of satisfaction expressed by
employer organisations of HE graduates – Ref: Figure 11.
Satisfaction rates between employer organisations of HE graduates and employer
organisations of FET graduates were similar across personal attributes for employer
organisations of HE and FET graduates – Ref: Figure 13.
Minimum entry standards
Approximately 79% of large employer organisations have a minimum entry standard
for graduate applications and this was 58% for medium-sized employer organisations
– Ref: Figure 14.
The most common minimum standard among all employer organisations is to have,
or expect, at least a 2.1 degree (approximately 70% of all employer organisations). A
higher proportion of foreign employer organisations (36%) indicated that graduate
applicants must first pass a psychometric or other in-house selection process (e.g.
assessment centre) than their indigenous counterparts – Ref: Figure 15.
Skills not currently available
Approximately four-in-ten of all employers indicated that there were skills not
currently available that were required now or in the next three to five years in the
Republic of Ireland. This proportion was highest among the mid-sized employer
organisations (44%) – Ref: Figure 16.
The most frequently occurring skills listed included engineering, specific languages,
data analysis and software/IT/programming-related skills.
Future supply of graduates
A higher proportion of foreign employer organisations (74%) feel that there will be
an adequate supply of graduates in the next three-to-five years than their indigenous
counterparts (59%). Organisations based in Dublin (68%) were marginally more
National Employer Survey – Employers’ Views on Irish Further and Higher Education Outcomes – May 2015
9 | P a g e
optimistic about there being an adequate supply of graduates than organisations
based outside of Dublin (61%) – Ref: Figure 17.
Collaboration
There was a higher level of collaboration with education reported by foreign
employers (79%) than by indigenous employers (68%). The size of the organisation
also appeared to influence this proportion in that larger organisations had a higher
collaboration rate (82% for large employer organisations) – Ref: Figure 18.
“Internships and placement” were the most popular form of collaboration between
employers and higher education institutions – Ref: Figure 19.
“On the job placement” is the most popular form of collaboration between
employers and further education and training providers (75% of all employers
involved in collaborations with further education providers) – Ref: Figure 20.
All employer organisations were asked what could educational institutions do better to
improve collaboration with enterprises and a summary of the most frequently occurring
open-ended responses2 is provided below:
Reach out, liaise, collaborate, engage, interact, be more proactive, be less bureaucratic and inflexible
Find out what skills are required and map that to course content
Implement a more practical component to courses by proactively seeking (long-term) placements, internships for their students
Collaborate and update companies on progress being made and/or changes to curriculum
Arrange industry/open days and career fairs bringing both sides together and organise interesting speakers
Organise secondment of staff to industry, up-skill lecturers with live working experiences and recognise the value of applied research
Market and promote themselves better
Conversely all employer organisations were also asked what enterprise could do to improve
collaboration with educational institutions. A summary of the most frequently occurring
open-ended responses is provided below:
General acceptance that they could do more and it is in their best mutual interest to engage, and at a high level
Up-skill career guidance about our industry so they can impart this to prospective candidates
Invest more time building the business and personal relationships between industry and education
Help devise more practical programmes and links for students to gain experience and become potential future employees, e.g. placements, scholarships, internships
2 A more detailed review of the open-ended responses in the survey is planned on completion of this report.

National Employer Survey – Employers’ Views on Irish Further and Higher Education Outcomes – May 2015
10 | P a g e
Provide constructive feedback to HEIs on graduates recruited from that institution
Clarify the lines of communication with education to allow free-flow of information and greater collaboration, i.e. nominate individuals and schedule interaction
Utilise the various governmental initiatives to attract skilled graduates, e.g. Springboard, JobBridge.
Enterprise–education relationships
A higher proportion of foreign organisations (69%) have established a relationship
with a higher education institute (HEI) as a source of graduates than their indigenous
counterparts (51%). The level of engagement appears to be related to the size of
organisation as the proportion increases from 42% of organisations with less than 50
employees to 71% for organisations with greater than 250 employees – Ref: Figure
22.
All employer organisations were asked for reasons why they chose a particular HEI for a
collaboration and a summary of the most frequently occurring open-ended responses is
provided below:
Near proximity to work, convenient for graduates, support local educational
institutions
Relationships already established with former students and current academic staff
through alumni and graduate recruitment office
Good experience from successfully recruiting previous graduates with the necessary
skills to satisfy requirements
Good reputation of institution
Specific offerings such as internships, placements, work experience, sponsorship
programmes and participation on advisory boards
Languages
Approximately a quarter (25%) of all employers indicated that they had a specific
requirement for foreign language proficiency skills in their organisation. This
proportion was highest for foreign employer organisations (32%) and lowest for
indigenous employer organisations (22%) – Ref: Figure 23.
The core European languages of French and German were the most popular
languages selected by employer organisations with a specific requirement for foreign
language proficiency – Ref: Figure 24.
A higher level of language proficiency is required by foreign employer organisations
where at least 60% of all employer organisations indicated that they require at least
full professional proficiency in their graduate recruits. Although a relatively high
proportion of indigenous employer organisations required Chinese language skills in
their organisation, a high degree of proficiency was not necessarily required – Ref:
Figure 25.
National Employer Survey – Employers’ Views on Irish Further and Higher Education Outcomes – May 2015
11 | P a g e
Graduate recruitment outside of Ireland
Foreign organisations were more likely to recruit from an external source (42%) than
indigenous organisations (32%). This proportion was highest for large organisations
(47%) and service-type organisations (42%). Organisations based in Dublin were also
relatively high (46%) – Ref: Figure 26.
All employer organisations were asked to explain why they recruited graduates from
institutions outside of the Republic of Ireland and a summary of the most frequently
occurring open-ended responses is provided below:
The best candidate got the position, regardless of where they were educated
Conscious decision by company to encourage diversity and multi-cultural aspect
within the workforce
Specific languages with a high degree of proficiency were not generally available in
Ireland
Specialist skills are not generally available locally and it is necessary to look further
afield provide a greater selection and graduates, e.g. mathematics, coding, analytics
Local graduates had a relatively low level of practical workplace experience
The need for local knowledge in export market the firm is working in at this time.

National Employer Survey – Employers’ Views on Irish Further and Higher Education Outcomes – May 2015
12 | P a g e
2 RESEARCH BACKGROUND AND METHODOLOGY
The National Strategy for Higher Education to 2030 and Further Education and Training
Strategy 2014–2019 present a vision of further and higher education which can successfully
meet the many economic and social challenges facing Ireland over the coming decades.
Both documents envisage the provision of a high quality learning experience leading to
better outcomes for all those who engage with education through excellence in teaching
and learning, research, scholarship and engagement with wider society as appropriate. The
strategies note that strong engagement between further/higher education and enterprise
has the potential to play a vital role in enhancing Ireland’s economic competitiveness and
that the education and training system is a core part of the enterprise, development and
innovation infrastructure in Ireland.
The National Strategy for Higher Education to 2030 identifies innovation as a driving force
behind such engagement: innovation in teaching, learning and research from higher
education; and innovation in taking advantage of learning opportunities from the business
community. The Strategy suggests activities that could be progressed in business–academic
partnerships range from knowledge transfer and the creation of joint research projects, to
the development and provision of education and training for employees, and problem-
solving and consulting services. Employer–education partnership could also facilitate high-
quality internships and work-placements for students and could be particularly useful as a
way of enabling employer feedback on graduate employability and in facilitating employer
input into curriculum design and development as well as course supply.
The Higher Education Strategy recommends that a national survey of employers should be
undertaken by the Higher Education Authority (HEA) on a regular basis and used as part of
an assessment of quality outcomes for the system. The Further Education and Training
Strategy continues this theme setting out the need for appropriate research on skills needs,
including collaboration with the HEA on a national employer survey of Irish further and
higher education and training outcomes.
Recent Action Plans for Jobs identified a second round of the National Employers Survey as
a priority. Action 181 in the 2014 Plan, under Aligning Education and Training Output with
Enterprise and Skills Needs (Action Plan, pg. 70), suggests that the HEA and SOLAS
‘undertake a full‐scale national employer survey of Irish higher education outcomes and
examine the feasibility of including employers’ views on further education and training. This
survey should build upon, and extend, the National Pilot Survey of Employer’ Views of Irish
Higher Education Outcomes conducted in 2012.’

National Employer Survey – Employers’ Views on Irish Further and Higher Education Outcomes – May 2015
13 | P a g e
This survey provides information on the views on further and higher education outcomes of
a broad range of businesses representing different sectors, ownership (multinational and
indigenous) and company size (small, medium and large).
The overall objectives of the survey were to ascertain, inter alia, employers’ views on a
range of items including (but not limited to):
Overall quality of recent further education and training and higher education
graduates with respect to workplace and personal attributes
Challenges in filling further/higher education graduate vacancies
Factors considered when recruiting further education and training and higher
education graduates (e.g. institution attended, course result, employability skills,
degree subject, foreign language capability, relevant work experience/ placement)
Further/Higher Education - business collaboration on research and innovation.
Project steering group The HEA, SOLAS and QQI convened a Steering Group made up of representatives from
enterprise and education:
Enterprise: American Chamber of Commerce Ireland (AMCHAM), British Irish Chamber of
Commerce, Chambers Ireland, Construction Industry Federation (CIF), EGFSN, Enterprise
Ireland, IBEC, ISME, IDA Ireland, Public Appointments Service, Small Firms Association.
Education: HEA, SOLAS, Association of Higher Education Careers Services (AHECS),
Department of Education and Skills, Education and Training Boards Ireland (ETBI), Higher
Education Colleges Association (HECA), IOTI, IUA, Quality and Qualifications Ireland (QQI).
A project group, comprising HEA, SOLAS and QQI representatives, managed the day-to-day
aspects of the project. Insight Statistical Consulting was engaged to undertake the study.
InsightSC (www.insightsc.ie) was established in 1989 and provides specialist marketing
research services to a range of public and private organisations.
Methodology The questionnaire was based on the pilot questionnaire conducted in 2012 with a number
of extensions and amendments made to address the specific research questions. A copy of
the questionnaire is contained in Appendix A.
There is no publicly available database of employers in Ireland which could be drawn upon for this research. Instead respondents were obtained through the bodies represented on the steering group committee. In order to address possible differences in responses by individual cohorts, results are shown separately, where possible, by each of the key

National Employer Survey – Employers’ Views on Irish Further and Higher Education Outcomes – May 2015
14 | P a g e
variables such as ownership (Irish, foreign), type (manufacturing/services) and size (micro/small, medium and large). It is assumed that respondents within each of the reporting cohorts are a random sample of all employers of graduates within that cohort and can therefore represent their collective response.
In summary, the questionnaire covered the following nine topics:
A profile of the total number of graduates recruited, the relevant recruitment
classifications and whether formal qualifications other than Leaving Certificate were
required
The levels in which graduates were recruited and awareness/usage of the National
Framework of Qualifications among employers
The level of satisfaction with graduate recruits across a range of workplace and
personal attributes. Graduates recruited from each discipline/skill category were
rated separately by employers
The existence of an established relationship with higher education institution(s)
The extent to which graduates were recruited from institutions outside of Republic
of Ireland
Nature of collaboration between industry and education with a series of
recommendations on how this could be improved
Specific requirement for foreign languages and associated proficiency levels
Minimum entry standards for graduate applications
Supply of graduate skills in Republic of Ireland and suggestions on how shortfalls
could be addressed.
The questionnaire went through a series of development stages and was conducted online
using Qualtrics survey software. A link to the survey was disseminated by the various
steering group participants to their relevant members during a six-week data collection
period (mid-October to End November 2014) and the response characteristics are
summarised in the next section. The data were analysed using SPSS statistical software with
results outputted to Microsoft Excel & Word. Across all respondents, the online survey took
approximately 15 minutes to complete (median) with three-quarters of all respondents
being completed within approximately 27 minutes.

National Employer Survey – Employers’ Views on Irish Further and Higher Education Outcomes – May 2015
15 | P a g e
3 RESPONSE CHARACTERISTICS
The source of the sample is summarised in Figure 1 below.
Figure 1: Source of final sample size
From Figure 1, a total of 1,378 organisations entered the online survey through the various
links available (i.e. one of 16 possible entry points) with 914 organisations answering the
opening questions on whether any staff had been recruited within the past two years (the
remainder did not enter any valid data). Approximately 83% (759 of the 914 organisations)
indicated they recruited at least one person within the past two years. Of the 759
organisations who recruited at least one employee within the past two years, 540 (or 71%)
indicated that they had recruited at least one graduate.
For the purposes of this survey, a graduate is someone who has been recruited to the
organisation within the last 24 months and who has also completed their qualification
within the last 24 months.
Approximately 71% of all eligible entrants to the online survey (or 383 organisations)
proceeded to complete the entire questionnaire providing the necessary classification data
with which to describe the results in more detail, i.e. region, size, sector, ownership. The
final sample, upon which the results are based, was drawn from a range of sources
including; The Higher Education Authority, Irish Business and Employers Confederation
(IBEC), Association for Higher Education Careers Services (AHECS), Irish Small and Medium
Enterprises (ISME), Enterprise Ireland (EI), American Chamber of Commerce, Construction
Accessed Online Link: 1,378
Answered Opening Question: 914
Recruited Any Staff: 759
Recruited Graduate(s): 540
Fully Completed Survey:
383 Organisations
National Employer Survey – Employers’ Views on Irish Further and Higher Education Outcomes – May 2015
16 | P a g e
Industry Federation (CIF), Irish University Alliance (IUA) and other supporting organisations
(listed in Page 3).
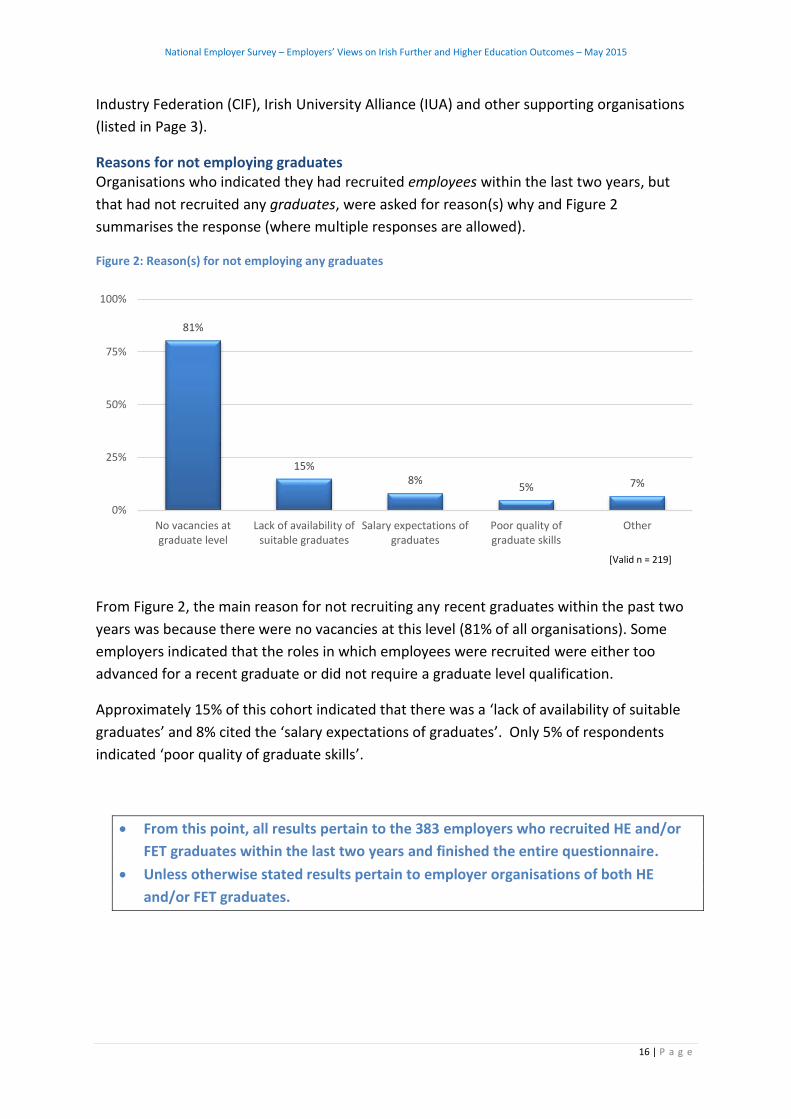
Reasons for not employing graduates Organisations who indicated they had recruited employees within the last two years, but
that had not recruited any graduates, were asked for reason(s) why and Figure 2
summarises the response (where multiple responses are allowed).
Figure 2: Reason(s) for not employing any graduates
From Figure 2, the main reason for not recruiting any recent graduates within the past two
years was because there were no vacancies at this level (81% of all organisations). Some
employers indicated that the roles in which employees were recruited were either too
advanced for a recent graduate or did not require a graduate level qualification.
Approximately 15% of this cohort indicated that there was a ‘lack of availability of suitable
graduates’ and 8% cited the ‘salary expectations of graduates’. Only 5% of respondents
indicated ‘poor quality of graduate skills’.
From this point, all results pertain to the 383 employers who recruited HE and/or
FET graduates within the last two years and finished the entire questionnaire.
Unless otherwise stated results pertain to employer organisations of both HE
and/or FET graduates.
81%
15%8%
5% 7%
0%
25%
50%
75%
100%
No vacancies atgraduate level
Lack of availability ofsuitable graduates
Salary expectations ofgraduates
Poor quality ofgraduate skills
Other
[Valid n = 219]

National Employer Survey – Employers’ Views on Irish Further and Higher Education Outcomes – May 2015
17 | P a g e
Graduates from Higher Education (HE) and Further Education and Training (FET) The term graduate includes persons qualifying from higher education institutions (e.g.
Universities and Institutes of Technology) and also persons qualifying from further
education and training where a wide range of programmes in terms of levels and fields of
study to a diverse group of learners are provided (e.g. National Craft Certificates for
qualified apprentices (e.g. plumber, electrician etc.), FETAC3 qualifications (e.g. childcare,
hairdressing etc.), specific industry related (vendor) qualifications (e.g. Microsoft)).
The number of organisations with graduates from HE and/or FET within the final sample is
shown in Figure 3.
Figure 3: Number of employer organisations with HE and/or FET graduates
From Figure 3 above, 279 organisations (of the 383 in the final sample, 73%) employed
recent graduates from HE only. A further 92 organisations employed recent graduates from
both HE and FET (24%). The remaining 3% (12 organisations) employed recent graduates
from FET only.
Key Reporting Classifications The primary analysis variables used in this report are;
1. Ownership (Indigenous or Foreign),
2. Type (Manufacturing or Service), and
3. Size (Small: Less than 50 employees, Medium: 51-250 employees, and Large: 251+
employees).
In some cases, Region (Dublin and outside-Dublin) was also used for selected questions.
3 In 2012, Quality and Qualifications Ireland (QQI) was established as a new integrated agency (replacing the Further Education and Training Awards Council, the Higher Education and Training Awards Council and the National Qualifications Authority of Ireland and incorporating the functions of the Irish Universities Quality Board)
HE
279
FET
129
2
[Valid n =
383]

National Employer Survey – Employers’ Views on Irish Further and Higher Education Outcomes – May 2015
18 | P a g e
Table 1 summarises the number of employer organisations contained within the sample
response and the corresponding number of graduates recruited.
Table 1: Employer organisations and graduates recruited
Organisations Graduates
Classification Count % Count %
Ownership Indigenous 255 67% 4,697 50%
Foreign 128 33% 4,647 50%
Type Manufacturing 148 39% 2,459 26%
Service 235 61% 6,885 74%
Size
<50 people 135 35% 625 7%
51-250 people 127 33% 1,552 17%
251+ people 121 32% 7,167 77%
Region Dublin 179 47% 6,437 69%
Outside-Dublin 204 53% 2,907 31%
Total 383 100% 9,344 100%
From Table 1:
Some 9,344 recent graduates were recruited to the 383 employer organisations
within the past two years. It is from these 383 employer organisations that the
results in the report are based.
Foreign employer organisations accounted for a third (33%) of all employer
organisations and half (50%) of all graduates.
Large employer organisations accounted for a third of all employer organisations
(32%) and over three-quarters of all graduates (77%).
Service-based organisations accounted for approximately 61% of the total number of
employer organisations and nearly three-quarters (74%) of all graduates.
Please note that Table 1 presents the profile of employer organisations who responded to
the survey within a backdrop of a public sector employment embargo since 2009 and
economic recessionary pressures.
Ownership is considered a key variable with which to split results as multinationals play an
important role in the Irish economy. In 2012, although foreign multinationals account for

National Employer Survey – Employers’ Views on Irish Further and Higher Education Outcomes – May 2015
19 | P a g e
just 2.2% of all enterprises in the business economy, they employed over 250,000 persons in
Ireland (22% of the total persons engaged) and exported goods and services in excess of
€180bn (56% of the total exports).4 Whenever possible, results are shown by ownership.
The 9,344 graduates covered by the 383 employer organisations are described in terms of
their source in Figure 4.
Figure 4: Source of all graduates recruited by employer organisations
From Figure 4, approximately 16% of graduates from responding organisations were
recruited from institutions outside of Ireland, i.e. 15% from higher education and 1% from
further education and training. The overall proportion of graduates being sourced from
Irish HE institutions was 75%.
Based on an assumption that approximately 60,000 graduates were recruited in the
Republic of Ireland during the past two years, the total number of graduates represented by
the 383 employer organisations account for approximately 12% of all graduates recruited.
4 Business in Ireland 2012 (CSO)
HE - Republic of Ireland, 6,942 , 75%
HE - Outside Republic of Ireland, 1,423 , 15%
FET - Republic of Ireland, 862 , 9%
FET - Outside Republic of Ireland, 117 , 1%
Valid n = 383 Employer Organisations [9,344 graduate employees]

National Employer Survey – Employers’ Views on Irish Further and Higher Education Outcomes – May 2015
20 | P a g e
The HE graduates from institutions in Republic of Ireland were further classified into
Universities and Institutes of Technology as shown in Figure 5.
Figure 5: Source of all HE graduates
From Figure 5, approximately three-quarters (75%) of all HE graduates were recruited from
the universities.5
5 Approximately 56% of all awards in HEA-funded Institutions were from universities in 2013 (full-time and part-time (including distance and e-learning)).
Universities, 5,239, 75%
Institutes of Technology, 1,568,
23%
Other (or Unknown), 135,
2%
Valid n = 371 Employer Organisations [6,942 HE graduate employees from Republic of Ireland]

National Employer Survey – Employers’ Views on Irish Further and Higher Education Outcomes – May 2015
21 | P a g e
Graduate profile by discipline and skill category Employer organisations of HE graduates are profiled in terms of ten distinct disciplines they
recruited from and Table 2 presents the results.
Table 2: Profile of HE disciplines (multiple response)
Discipline Ownership Type Size (Employees)
Indigenous Foreign Manu. Service <50 51-250 251+
Humanities & Arts 14% 7% 6% 15% 12% 12% 10%
Social Sciences 10% 5% 4% 11% 6% 7% 12%
Business & Law 43% 37% 33% 45% 33% 39% 50%
Science & Mathematics 23% 42% 31% 28% 16% 31% 42%
Computing 26% 35% 17% 37% 22% 27% 39%
Engineering 30% 63% 59% 30% 26% 36% 63%
Construction 8% 4% 13% 3% 5% 8% 8%
Agriculture & Veterinary 7% 2% 9% 3% 3% 5% 7%
Health & Welfare 6% 3% 5% 5% 5% 5% 4%
Services 14% 9% 6% 17% 11% 16% 9%
Total 100% 100% 100% 100% 100% 100% 100%
Valid n 236 123 141 218 123 118 118
STEM 6 59% 89% 77% 64% 56% 70% 82%
From Table 2, Engineering was the most prominent single discipline among foreign (63%),
manufacturing (59%) and large (63%) employer organisations. Graduates from the Business
& Law discipline were also prominent among the indigenous (43%), service (45%) and large
(50%) employer organisations.
6 STEM: Science, Technology, Engineering & Mathematics as represented by combined Science and Mathematics, Computing and Engineering disciplines.

National Employer Survey – Employers’ Views on Irish Further and Higher Education Outcomes – May 2015
22 | P a g e
Employer organisations from the indigenous sector were more likely to recruit from a wider
range of disciplines than their foreign counterparts.
In relation to STEM subjects, a greater proportion of foreign employers recruited HE
graduates from ‘Engineering’, ‘Science & Mathematics’ and ‘Computing’ disciplines than
their indigenous counterparts. Collectively, 89% of the foreign sector recruited from at least
one of these STEM disciplines, 82% for large employer organisations with at least 250
employees7).
Employer organisations of FET graduates are profiled in terms of 15 distinct skill categories
they recruited from. Table 3 presents the results.
Table 3: Profile of FET Skill Categories (multiple responses)
Skill Category All
Agriculture, Horticulture, and Mariculture 3%
Art, Craft and Media 1%
Business Admin and Management 30%
Construction 12%
Financial Services 15%
Food and Beverage/Hospitality 17%
IT 23%
Health /Family /Care/Other Personal Services 3%
Hairdressing/Beauty and Complimentary Therapies 4%
Manufacturing/Engineering 24%
Natural resources 0%
Sales and Marketing 15%
Science and Technology, Animal Science 13%
Transport Distribution/logistics 2%
Tourism and Sport 13%
Total 100%
Valid n 101
STEM8 50%
From Table 3, approximately 30% of all employer organisations employed a FET graduate
from the Business Administration and Management skill category. The next most prominent
skill categories were Manufacturing/Engineering (24%) and IT (23%).
Although there is no real comparison between the HE disciplines (or FET skill categories) and
the profile of enterprises by detailed sector as provided by the CSO Business Demography, it
7 HEA 2013: 44% of new entrants to higher education institutions enrolled in Science & Mathematics, Computing and Engineering Disciplines. 8 STEM: Science, Technology, Engineering & Mathematics as represented by combined IT, Science and Technology, Animal Science and Manufacturing/Engineering.

National Employer Survey – Employers’ Views on Irish Further and Higher Education Outcomes – May 2015
23 | P a g e
is clear that the profiles are not similar, i.e. a disproportionate number of employer
organisations recruited from Science, Technology, Engineering and Mathematics disciplines.
Qualifications recruited Employer organisations of HE graduates were asked at what levels graduates were recruited
and Figure 6 provides the overall results across all disciplines (multiple responses were
possible).
Figure 6: Levels at which HE graduates were recruited
From Figure 6, the majority of employers (72%) recruited from an Honours Degree. The
next most frequently occurring level was a Masters Degree, Post-Graduate Diploma (44%)
and then a Higher Certificate & Ordinary Bachelors Degree (34%).
Employer organisations of FET graduates were asked at what levels graduates were
recruited and Figure 7 provides the overall results across all skill categories (multiple
responses were possible).
Figure 7: Levels at which FET graduates were recruited
34%
72%
25%
44%
11%3%
0%
20%
40%
60%
80%
100%
Higher Certificate& Ordinary
Bachelor Degree[NFQ Level 6 & 7]
Honours Degree[NFQ Level 8]
Higher Diploma[NFQ Level 8]
Masters DegreePost-Graduate
Diploma[NFQ Level 9]
Doctoral Degree[NFQ Level 10]
Don't know
26%
57%
15%
22%16%
11%
0%
20%
40%
60%
80%
QualifiedApprentice
FETAC award(other than
apprenticeship)
City and Guildsaward
Vendor/ Industryaward (e.g.Microsoft)
Other Don't know

National Employer Survey – Employers’ Views on Irish Further and Higher Education Outcomes – May 2015
24 | P a g e
From Figure 7, over half of all employers of FET graduates (57%) recruited at least one
graduate with a FETAC9 award and approximately a quarter (26%) recruited at least one
qualified apprentice.
Doctoral degrees [NFQ Level 10] Approximately 11% of all employer organisations recruited at Doctoral Degree (18% of
foreign employers and 8% of indigenous employers). The discipline with the highest
proportion of Doctoral Degrees was Science and Mathematics (18%).
Approximately two-thirds (68%) of employer organisations who recruited graduates with
Doctoral Degrees (NFQ Level 10) agreed that the position(s) actually required this level of
education.
Despite being less likely to recruit at Doctoral level, a higher proportion of indigenous (and
smaller) organisations agreed that the position(s) required this level of education.
National Framework of Qualifications The National Framework of Qualifications (NFQ) is a ten-level system (1–10) giving an
academic or vocational value to qualifications obtained in Ireland. NFQ levels help indicate
how an award can be used for training, education and employment opportunities. Each level
is based on nationally (and internationally) agreed standards of what a learner is expected
to know and be able to do after receiving an award. QQI (Quality and Qualifications Ireland)
is a state agency with responsibility for the NFQ system in Ireland.
The level of awareness of employers surveyed in this report and their subsequent reference
to the system for recruitment is illustrated in Figure 8 below.
9 In 2012, QQI (Quality and Qualifications Ireland) was established as a new integrated agency (replacing the Further Education and Training Awards Council, the Higher Education and Training Awards Council and the National Qualifications Authority of Ireland and incorporating the functions of the Irish Universities Quality Board)

National Employer Survey – Employers’ Views on Irish Further and Higher Education Outcomes – May 2015
25 | P a g e
Figure 8: Awareness of National Framework of Qualifications (NFQ)
From Figure 8, approximately 61% of all graduate employers had heard of the National
Framework of Qualifications (NFQ). This proportion was highest for foreign organisations
(70%), large organisations (75%) and the manufacturing sector (68%). Nearly one-third
(31%) of all graduate employers had not heard of the NFQ and this was highest for small
organisations (45%).
Of those organisations who had heard of the NFQ, just over one-third (36%) had referred to
it during their recruitment process. Large organisations were most likely to refer to it during
their recruitment process (47%) than their smaller counterparts.
Although 64% of mid-sized employer organisations (51-250 employees) had heard of the
NFQ, only 22% had referred to it during their recruitment process.
Yes61%
No31%
Unsure8%
NFQ Awareness
[Valid n = 369]
Yes36%
No60%
Don't know
4%
If Yes, do you refer to it?
[Valid n = 225]

National Employer Survey – Employers’ Views on Irish Further and Higher Education Outcomes – May 2015
26 | P a g e
4 SATISFACTION WITH GRADUATES
All employer organisations of HE graduates were asked to rate their level of satisfaction with
graduate recruits as they relate to a series of workplace attributes. The level of satisfaction
was measured along a five-point scale from none-satisfactory to all satisfactory (exact scale
shown on Question 8 in Appendix A). Satisfaction was determined by employers being
satisfied with at least 75% of graduate(s) recruited.
Table 4 compares the satisfaction of employer organisations by each workplace attribute.
Table 4: Level of satisfaction with HE graduates across workplace attributes
Workplace Attributes Ownership Type Size (Employees)
Indig. Foreign Manu. Service <50 51-250 251+
Computer and technical literacy 82% 92% 84% 87% 78% 84% 92%
Foreign language capability 42% 35% 42% 38% 38% 28% 46%
Numeracy/ Processing and interpreting numerical data 77% 92% 86% 82% 77% 76% 93%
Application of technical knowledge 72% 84% 78% 76% 73% 70% 84%
Effective verbal communication 75% 84% 82% 77% 77% 76% 82%
Effective written communication 68% 76% 65% 74% 67% 64% 79%
Working effectively with others 82% 88% 84% 84% 84% 81% 87%
Working effectively on their own 67% 78% 76% 68% 70% 61% 80%
Attention to detail 72% 84% 81% 75% 73% 68% 88%
Business acumen/ awareness 47% 61% 58% 49% 50% 39% 64%
Entrepreneurial skills 43% 57% 48% 48% 45% 34% 62%
Overall 68% 78% 73% 71% 69% 65% 80%
Valid n 10 260 177 161 276 119 129 189
10 Valid n differs marginally for each attribute. This Valid n relates to the first attribute, Computer and technical literacy where employer organisations can rate graduates across a single or multiple disciplines.
National Employer Survey – Employers’ Views on Irish Further and Higher Education Outcomes – May 2015
27 | P a g e
From Table 4, satisfaction rates were more positive for foreign-owned organisations and
large employer organisations across most workplace attributes. Although satisfaction with
‘Computer and technical literacy’, ‘Working effectively with others’ and ‘Numeracy
/processing numerical data’ was very high, satisfaction was relatively low for the following
attributes; ‘Foreign language capability’, ‘Business acumen/ awareness’ and ‘Entrepreneurial
skills’.
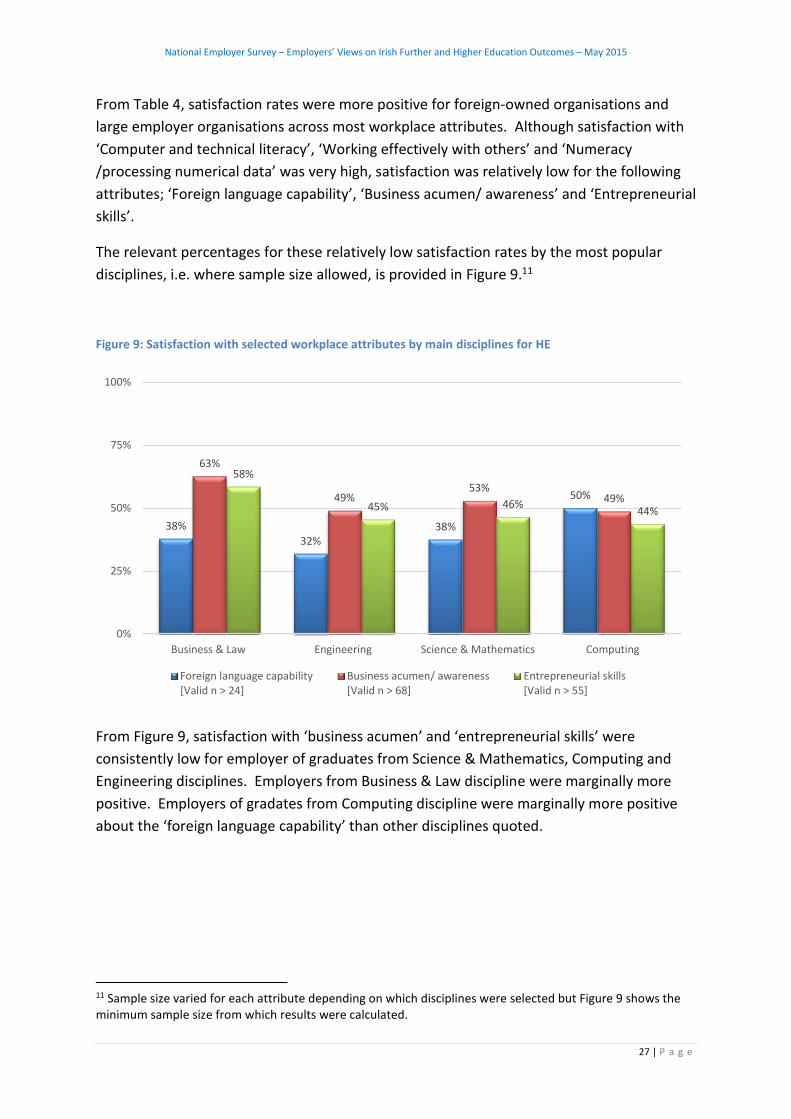
The relevant percentages for these relatively low satisfaction rates by the most popular
disciplines, i.e. where sample size allowed, is provided in Figure 9.11
Figure 9: Satisfaction with selected workplace attributes by main disciplines for HE
From Figure 9, satisfaction with ‘business acumen’ and ‘entrepreneurial skills’ were
consistently low for employer of graduates from Science & Mathematics, Computing and
Engineering disciplines. Employers from Business & Law discipline were marginally more
positive. Employers of gradates from Computing discipline were marginally more positive
about the ‘foreign language capability’ than other disciplines quoted.
11 Sample size varied for each attribute depending on which disciplines were selected but Figure 9 shows the minimum sample size from which results were calculated.
38%
32%38%
50%
63%
49%53%
49%
58%
45% 46%44%
0%
25%
50%
75%
100%
Business & Law Engineering Science & Mathematics Computing
Foreign language capability[Valid n > 24]
Business acumen/ awareness[Valid n > 68]
Entrepreneurial skills[Valid n > 55]

National Employer Survey – Employers’ Views on Irish Further and Higher Education Outcomes – May 2015
28 | P a g e
All employer organisations of HE graduates were asked to rate their level of satisfaction with
graduate recruits as they relate to a series of personal attributes. The level of satisfaction
was measured along a five-point scale from none-satisfactory to all satisfactory (exact scale
shown on Question 9 in Appendix A). Satisfaction was determined by employers being
satisfied with at least 75% of graduate(s) recruited.
Table 5 compares the satisfaction of employer organisations by each workplace attribute.
Table 5: Level of satisfaction with HE graduates across personal attributes
Personal Attributes Ownership Type Size (Employees)
Indig. Foreign Manu. Service <50 51-250 251+
Ability to cope with work pressure 76% 86% 80% 80% 77% 74% 87%
Adaptability and flexibility 82% 94% 87% 86% 87% 78% 93%
Positive attitude and energy 85% 94% 85% 90% 83% 84% 95%
Ethically and socially aware 87% 91% 82% 92% 86% 85% 92%
Reliability 89% 95% 92% 91% 90% 87% 96%
Personal commitment 85% 96% 92% 88% 84% 85% 96%
Professionalism and work ethic 81% 92% 82% 87% 81% 77% 95%
Overall 84% 92% 86% 88% 84% 81% 93%
Valid n12 298 182 166 314 136 151 193
From Table 5, satisfaction rates with personal attributes of graduates were very high across
all cohorts, in particular for large and foreign employer organisations.
12 Valid n differs marginally for each attribute and this Valid n relates to the first attribute, Ability to cope with work pressure where employer organisations can rate graduates across a single or multiple disciplines.

National Employer Survey – Employers’ Views on Irish Further and Higher Education Outcomes – May 2015
29 | P a g e
A summary of satisfaction with personal and workplace attributes (where individual
attributes have been aggregated into a single rating) is provided in Figure 10 for employer
organisations of HE graduates.
Figure 10: Comparison of satisfaction with HE disciplines across workplace and personal attributes
From Figure 10, satisfaction with personal attributes of graduates within each discipline was
higher than (aggregated) workplace attributes for each discipline. The relatively low rates of
satisfaction observed for ‘Foreign language capability’, ‘Business acumen/ awareness’ and
‘Entrepreneurial skills’ (See Figure 6) contributed towards the aggregated rate for workplace
attributes.
73%
75%
74%
74%
77%
68%
58%
63%
59%
59%
72%
85%
91%
87%
91%
89%
85%
79%
72%
82%
81%
87%
0% 25% 50% 75% 100%
Business & Law
Engineering
Science &Mathematics
Computing
Humanities & Arts
Social Sciences
Construction
Agriculture &Veterinary
Health & Welfare
Services
Overall
Workplace Attributes
Personal Attributes [Valid n = 69 (minimum) to 1,070 (maximum)]

National Employer Survey – Employers’ Views on Irish Further and Higher Education Outcomes – May 2015
30 | P a g e
A summary of satisfaction with personal and workplace attributes (where individual
attributes have been aggregated into a single rating) is provided in Figure 11 for employer
organisations of FET graduates.
Figure 11: Comparison of satisfaction with FET Skill Categories across workplace and personal attributes
From Figure 1113, satisfaction with personal attributes of graduates within each skill
category was higher than (aggregated) workplace attributes for each skill category. The
relatively low rates of satisfaction observed for ‘Foreign language capability’, ‘Business
13 * Low sample size for ‘Art, Craft and Media’ (not displayed) and no response from organisations employing graduates within ‘Natural Resources’ skill category
91%
80%
67%
81%
89%
79%
55%
91%
78%
82%
87%
84%
91%
82%
100%
88%
87%
89%
93%
87%
79%
98%
93%
86%
96%
88%
94%
90%
0% 25% 50% 75% 100%
Agriculture, Horticulture,and Mariculture
Art, Craft and Media*
Business Admin andManagement
Construction
Financial Services
Food and Beverage/Hospitality
IT
Health /Family /Care/Other Personal Services
Hairdressing/Beauty andComplimentary Therapies
Manufacturing/Engineering
Natural resources*
Sales and Marketing
Science and Technology,Animal Science
Transport Distribution/logistics
Tourism and Sport
Overall
Workplace Attributes
Personal Attributes[Valid n = 19 (minimum) to 583 (maximum)]

National Employer Survey – Employers’ Views on Irish Further and Higher Education Outcomes – May 2015
31 | P a g e
acumen/ awareness’ and ‘Entrepreneurial skills’ (See Figure 6) contributed towards the
aggregated rate for workplace attributes.
Comparison of satisfaction with HE and FET graduates All employer organisations were also asked to rate their level of satisfaction with FET
graduate recruits14 as they relate to a series of workplace attributes. The level of
satisfaction was measured along a five-point scale from none-satisfactory to all satisfactory
(exact scale shown on Question 18 in Appendix A). Satisfaction was determined by
employers being satisfied with at least 75% of graduate(s) recruited.
Figure 12 compares the satisfaction rates by each workplace attribute.
Figure 12: Comparison of HE and FET satisfaction rates for workplace attributes
From Figure 12, satisfaction rates between employer organisations of HE graduates and
employer organisations of FET graduates were similar for workplace attributes with the
14 Please note from Figure 3 that the majority of employer organisations recruiting FET graduates also recruited HE graduates, i.e. they are not mutually exclusive.
79%
64%
79%
81%
73%
72%
84%
74%
83%
62%
54%
74%
86%
39%
83%
76%
79%
71%
84%
71%
77%
53%
48%
72%
0% 25% 50% 75% 100%
Computer and technical literacy
Foreign language capability
Numeracy/ Processing andinterpreting numerical data
Application of technical knowledge
Effective verbal communication
Effective written communication
Working effectively with others
Working effectively on their own
Attention to detail
Business acumen/ awareness
Entrepreneurial skills
Overall
Employer organisations of FET graduates
Employer organisations of HE graduates

National Employer Survey – Employers’ Views on Irish Further and Higher Education Outcomes – May 2015
32 | P a g e
exception of ‘foreign language capability’ where there was a lower rate of satisfaction
expressed by employer organisations of HE graduates.
All employers of Further Education and Training graduates were asked to rate their level of
satisfaction with graduate recruits as they relate to a series of personal attributes. The level
of satisfaction was measured along a five-point scale from none-satisfactory to all
satisfactory (exact scale shown on Question 19 in Appendix A). Satisfaction was determined
by employers being satisfied with at least 75% of graduate(s) recruited.
Figure 13 compares the satisfaction rates by each personal attribute.
Figure 13: Comparison of HE and FET satisfaction rates for personal attributes
From Figure 13, satisfaction rates between employer organisations of HE graduates and
employer organisations of FET graduates were similar across personal attributes for
employer organisations of HE and FET graduates.
85%
86%
87%
83%
88%
86%
87%
86%
80%
87%
88%
88%
91%
89%
85%
89%
0% 25% 50% 75% 100%
Ability to cope with workpressure
Adaptability and flexibility
Positive attitude and energy
Ethically and socially aware
Reliability
Personal commitment
Professionalism and work ethic
Overall
Employer organisations of FET graduates
Employer organisations of HE graduates
National Employer Survey – Employers’ Views on Irish Further and Higher Education Outcomes – May 2015
33 | P a g e
5 SKILLS REQUIREMENT
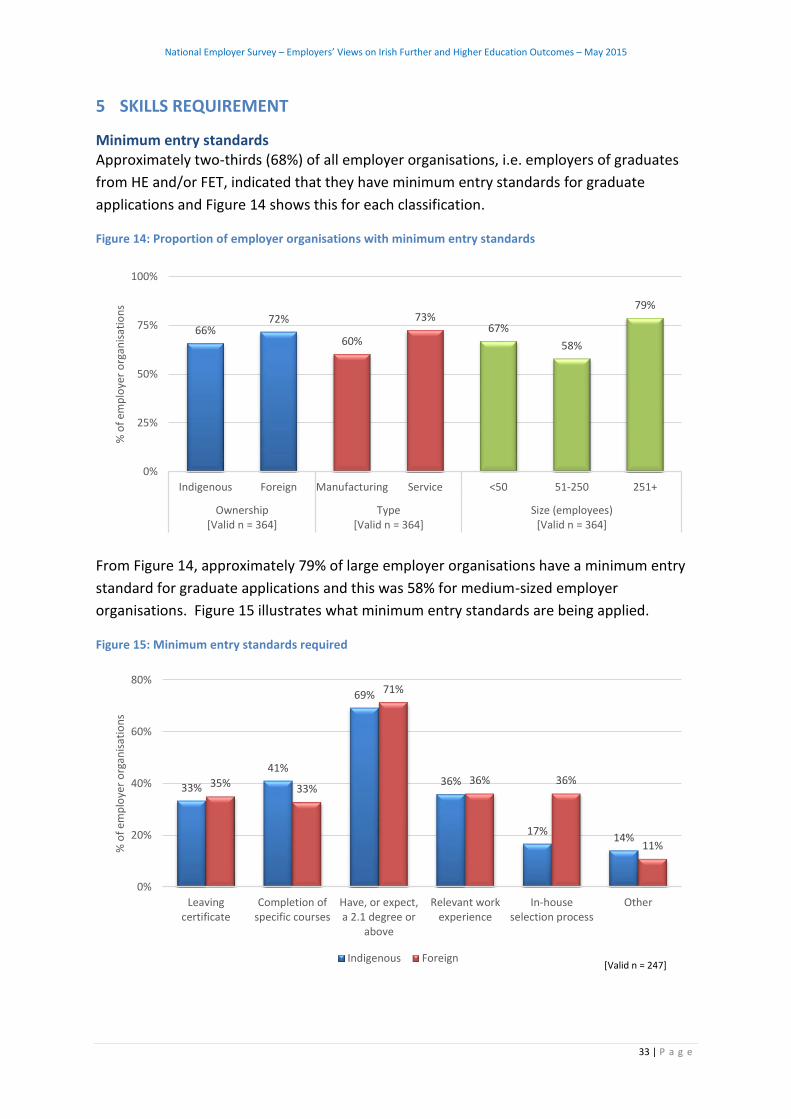
Minimum entry standards Approximately two-thirds (68%) of all employer organisations, i.e. employers of graduates
from HE and/or FET, indicated that they have minimum entry standards for graduate
applications and Figure 14 shows this for each classification.
Figure 14: Proportion of employer organisations with minimum entry standards
From Figure 14, approximately 79% of large employer organisations have a minimum entry
standard for graduate applications and this was 58% for medium-sized employer
organisations. Figure 15 illustrates what minimum entry standards are being applied.
Figure 15: Minimum entry standards required
66%72%
60%
73%67%
58%
79%
0%
25%
50%
75%
100%
Indigenous Foreign Manufacturing Service <50 51-250 251+
Ownership[Valid n = 364]
Type[Valid n = 364]
Size (employees)[Valid n = 364]
% o
f em
plo
yer
org
anis
atio
ns
33%
41%
69%
36%
17%14%
35% 33%
71%
36% 36%
11%
0%
20%
40%
60%
80%
Leavingcertificate
Completion ofspecific courses
Have, or expect,a 2.1 degree or
above
Relevant workexperience
In-houseselection process
Other
% o
f em
plo
yer
org
anis
atio
ns
Indigenous Foreign[Valid n = 247]

National Employer Survey – Employers’ Views on Irish Further and Higher Education Outcomes – May 2015
34 | P a g e
From Figure 15, the most common minimum standard among all employer organisations is
to have, or expect, at least a 2.1 degree (approximately 70% of all employer organisations).
A higher proportion of foreign employer organisations (36%) indicated that graduate
applicants must first pass a psychometric or other in-house selection process (e.g.
assessment centre) than their indigenous counterparts.
All employer organisations were asked to specify any other skills (beyond the minimum
entry requirements covered in Figure 20) that their organisation currently requires and the
Irish higher education system is currently not providing and a summary of the most
frequently occurring open-ended responses is provided below:
A greater level of soft skills transferrable into the working environment, e.g. verbal and
written communication, teamwork, grammar
More practical workplace experience through placements or work experience
programmes
More technical skills such as, problem solving, analytical skills, data analysis
An entrepreneurial spirit
Specific languages with a high level of proficiency in sufficient quantities
General presentation skills.
Skills not currently available All employer organisations were asked whether there were skills not currently available that
are required now (or in the next three to five years) in the Republic of Ireland. Figure 16
shows the outcome by each of the main classifications.
Figure 16: Are there skills not currently available that are required now (or in the next three to five years)?
From Figure 16, approximately four-in-ten of all employers indicated that there were skills
not currently available that were required now or in the next three to five years in the
40%37% 37%
40%34%
44%39%
0%
20%
40%
60%
Indigenous Foreign Manufacturing Service <50 51-250 251+
Ownership[Valid n = 355]
Type[Valid n = 355]
Size (employees)[Valid n = 355]
% o
f em
plo
yer
org
anis
atio
ns

National Employer Survey – Employers’ Views on Irish Further and Higher Education Outcomes – May 2015
35 | P a g e
Republic of Ireland. This proportion was highest among the mid-sized employer
organisations (44%).
All employer organisations were asked to list the specific skills they require and a summary
of the most frequently occurring open-ended responses is provided below:
Various classifications of engineers and other technical specialists
Specific languages
Business analytics, data analysts
Software, IT, programming.
Future supply of graduates All employers were asked how likely is that there will be an adequate supply of graduates
with the necessary skills needed to meet their organisations needs in the next three to five
years. Figure 17 shows the outcome at each classification where the percentage of
organisations who replied that it would be likely or very likely that there would be an
adequate supply of graduates.
Figure 17: Likelihood that there will be an adequate supply of graduates in the next three to five years
From Figure 17, a higher proportion of foreign employer organisations (74%) feel that there
will be an adequate supply of graduates in the next three-to-five years than their indigenous
counterparts (59%). Organisations based in Dublin (68%) were marginally more optimistic
about there being an adequate supply of graduates than organisations based outside of
Dublin.
59%
74%
62%66% 65% 64% 65%
68%61%
0%
25%
50%
75%
100%
Ind
ige
no
us
Fore
ign
Man
ufa
ctu
rin
g
Serv
ice
<50
51
-25
0
25
1+
Du
blin
Ou
tsid
e-D
ub
lin
Ownership[Valid n = 359]
Type[Valid n = 359]
Size (employees)[Valid n = 359]
Region[Valid n = 359]
% o
f em
plo
yer
org
anis
atio
ns

National Employer Survey – Employers’ Views on Irish Further and Higher Education Outcomes – May 2015
36 | P a g e
In Figure 16 (on previous page), approximately four-in-ten of all employers indicated that
there were skills not currently available that were required now or in the next three to five
years in the Republic of Ireland. Only 47% of these employers considered it likely that there
will be an adequate supply of graduates in the next three to five years.
All employer organisations were asked why an adequate supply of graduates will be less
than likely in the next three-to-five years and a summary of the most frequently occurring
open-ended responses is provided below:
General shortage of IT skills and relatively small cohort to choose from, therefore
competition for same graduates
General supply of graduates is very susceptible to changes in global economy
Strong demand from multinational sector for the same range of skills, difficulty for
small to medium enterprises to complete
Upswing in global economy has resulted in a high demand for engineering discipline
Not enough being done to encourage students to study what is required in the
marketplace, e.g. chefs
Graduates have emigrated and it is unlikely that they will return in time
Misalignment of course content to requirements of industry.
Employer organisations were also asked what could educational institutions do to assist
them to address the likely shortfall in graduate supply in the next three to five years and a
summary of the most frequently occurring open-ended responses is provided below:
Promote more students to study STEM subjects from secondary school as this is
where the jobs are, also specific others such as chefs
Increase intake and class sizes of specific courses
More work placements to allow student gain some practical experience
Better understanding of key requirements of industry and align course content
Add a language to many degree courses
Design specific courses to satisfy demand, e.g. injection moulding, games design.

National Employer Survey – Employers’ Views on Irish Further and Higher Education Outcomes – May 2015
37 | P a g e
6 COLLABORATION BETWEEN ENTERPRISE AND EDUCATION
All employer organisations were asked whether they were involved in collaboration with
any further or higher education institution in the Republic of Ireland. Collaboration
between industry and education can provide mutual benefits and Figure 18 shows the
proportions of all employer organisations who indicated they were involved with a higher
education institution and/or a further education and training provider.
Figure 18: Collaboration with HEIs and/or FETs
From Figure 18, there was a higher level of collaboration among foreign employers (79%)
than indigenous employers (68%). The size of the organisation also appeared to influence
this proportion in that larger organisations had a higher collaboration rate (82% for large
employer organisations).
The collaboration rate for organisations involved in recruiting from FET is higher than that
from HE, i.e. 65% for HE and 88% for FET.15
15 Note that the majority of employer organisations recruiting from FET also recruit from HE.
68%
79%71% 72%
61%
72%
82%
0%
25%
50%
75%
100%
Indigenous Foreign Manufacturing Service <50 51-250 251+
Ownership[Valid n = 383]
Type[Valid n = 383]
Size (employees)[Valid n = 383]
% o
f em
plo
yer
org
anis
atio
ns

National Employer Survey – Employers’ Views on Irish Further and Higher Education Outcomes – May 2015
38 | P a g e
Figure 19 provides a listing of the most prominent types of collaboration with HEIs
Figure 19: Collaborations with HEIs by employer organisations recruiting HE graduates
From Figure 19, ‘Internships and placement’ were the most popular forms of collaboration
between employers and higher education institutions. This is followed by ‘Research &
Development’ and ‘Training’ collaborations. Figure 20 provides a listing of the most
prominent collaborations by employer organisations involved in recruiting from FET.
Figure 20: Collaborations with HEIs by employer organisations of FET graduates
72%
35%
34%
23%
19%
19%
15%
13%
12%
9%
2%
10%
0% 25% 50% 75% 100%
Internships and placement
Research & Development
Training
Advisory panels
Skills needs
Knowledge
Curriculum reform
Community
Equipment and facilities
IP exploitation
Incubation services
Other[Valid n = 259]
5%
11%
11%
12%
13%
16%
41%
75%
0% 25% 50% 75% 100%
Other
Equipment & facilities
Knowledge
Exchange of informationregarding skills needs
Curriculum development
Advisory panels
Training
On the job placement
[Valid n = 75]

National Employer Survey – Employers’ Views on Irish Further and Higher Education Outcomes – May 2015
39 | P a g e
From Figure 20, “On the job placement” is the most popular form of collaboration between
employers and further education and training providers (75% of all employers involved in
collaborations with FET providers). This is followed by “Training” (41%).
In describing the current level of collaboration with Irish higher education institutions Figure
21 illustrates what proportion indicated that it was good or very good.
Figure 21: Comparison of collaboration rating by HE & FET employer organisations
From Figure 21, large employer organisations recruiting from HE (75%) and small employer
organisations recruiting from FET (71%) provided the most positive rating about the
collaboration.
All employer organisations were asked what could educational institutions do better to
improve collaboration with enterprises and a summary of the most frequently occurring
open-ended responses is provided below:
Reach out, liaise, collaborate, engage, interact, be more proactive, less bureaucratic and inflexible
Find out what skills are required and map that to course content
Implement a more practical component to courses by proactively seeking (long-term) placements, internships for their students
Collaborate and update companies on progress being made and/or changes to curriculum
Arrange industry/open days and career fairs bringing both sides together and organise interesting speakers
Organise secondment of staff to industry, up-skill lecturers with live working experiences and recognise the value of applied research
Market and promote themselves better.
55%60%
75%71%
53%
64%
0%
25%
50%
75%
100%
<50 people 51-250 people 251+ people
Size (employees)
% g
oo
d o
r ve
ry g
oo
d
HE Sector FET SectorValid n = 309 (HE)Valid n = 87 (FET)

National Employer Survey – Employers’ Views on Irish Further and Higher Education Outcomes – May 2015
40 | P a g e
Conversely all employer organisations were also asked what could enterprises do better to
improve collaboration with educational institutions and a summary of the most frequently
occurring open-ended responses is provided below:
General acceptance that they could do more and it’s in their best mutual interest to engage, and at a high level
Up-skill career guidance about our industry so they can impart this to prospective candidates
Invest more time building the business and personal relationships between industry and education
Help devise more practical programmes and links for students to gain experience and become potential future employees, e.g. placements, scholarships, internships, etc.
Provide constructive feedback to HEIs on graduates recruited from that institution
Clarify the lines of communication with education to allow free-flow of information and greater collaboration, i.e. nominate individuals and schedule interaction
Utilise the various governmental initiatives to attract skilled graduates, e.g. Springboard, JobBridge.
Enterprise – education relationships All organisations were asked whether they had an established relationship with a higher
education institution as a source of graduates and Figure 22 illustrates the results by the
main classifications.
Figure 22: Established relationship with a higher education institution as a source of graduates
From Figure 22, a higher proportion of foreign organisations (69%) have established a
relationship with a HEI as a source of graduates than their indigenous counterparts (51%).
The level of engagement appears to be related to the size of organisation as the proportion
increases from 42% of organisations with less than 50 employees to 71% for organisations
with greater than 250 employees.
51%
69%
53%61%
42%
61%
71%
0%
20%
40%
60%
80%
100%
Indigenous Foreign Manufacturing Service <50 51-250 251+
Ownership[Valid n = 347]
Type[Valid n = 347]
Size (employees)[Valid n = 347]
% o
f em
plo
yer
org
anis
atio
ns

National Employer Survey – Employers’ Views on Irish Further and Higher Education Outcomes – May 2015
41 | P a g e
All employer organisations were asked for reasons why they chose a particular HEI for a
collaboration and a summary of the most frequently occurring open-ended responses is
provided below:
Near proximity to work, convenient for graduates, support local educational
institutions
Relationships already established with former students and current academic staff
through alumni and graduate recruitment office
Good experience from successfully recruiting previous graduates with the necessary
skills to satisfy requirements
Good reputation of institution
Specific offerings such as internships, placements, work experience, sponsorship
programmes and participation on advisory boards.

National Employer Survey – Employers’ Views on Irish Further and Higher Education Outcomes – May 2015
42 | P a g e
7 LANGUAGES AND GRADUATE RECRUITMENT OUTSIDE OF IRELAND
The survey asked all employer organisations, i.e. both HE and FET employers, whether they
had a specific requirement for foreign language proficiency skills in their organisation.
Figure 23 provides the outcome.
Figure 23: Specific requirement for foreign language proficiency skills in their organisation
From Figure 23, approximately a quarter (25%) of all employers indicated that that they had
a specific requirement for foreign language proficiency skills in their organisation. This
proportion was highest for foreign employer organisations (32%) and lowest for indigenous
employer organisations (22%). The proportion did not differ significantly by type of
employer organisation (manufacturing and service).
22%
32%
26% 25%23%
25%
29%
0%
10%
20%
30%
40%
50%
Indigenous Foreign Manufacturing Service <50 51-250 251+
Ownership[Valid n = 379]
Type[Valid n = 379]
Size (employees)[Valid n = 379]
% o
f em
plo
yer
org
anis
atio
ns
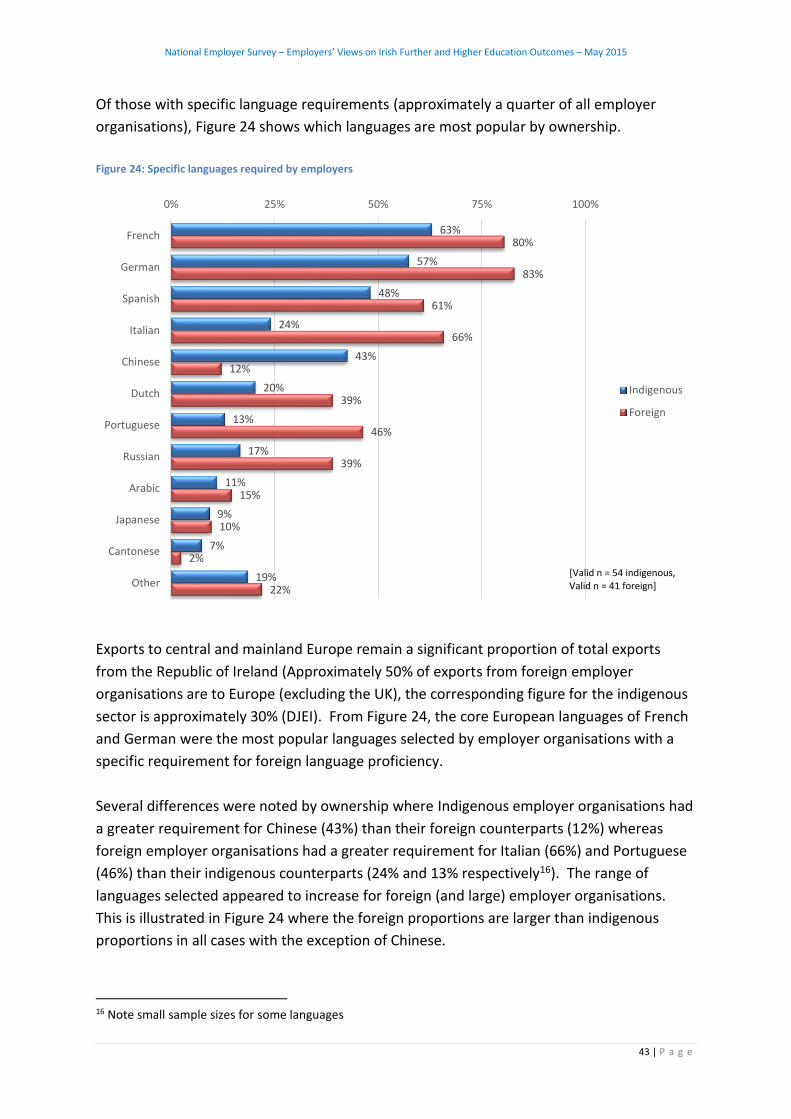
National Employer Survey – Employers’ Views on Irish Further and Higher Education Outcomes – May 2015
43 | P a g e
Of those with specific language requirements (approximately a quarter of all employer
organisations), Figure 24 shows which languages are most popular by ownership.
Figure 24: Specific languages required by employers
Exports to central and mainland Europe remain a significant proportion of total exports
from the Republic of Ireland (Approximately 50% of exports from foreign employer
organisations are to Europe (excluding the UK), the corresponding figure for the indigenous
sector is approximately 30% (DJEI). From Figure 24, the core European languages of French
and German were the most popular languages selected by employer organisations with a
specific requirement for foreign language proficiency.
Several differences were noted by ownership where Indigenous employer organisations had
a greater requirement for Chinese (43%) than their foreign counterparts (12%) whereas
foreign employer organisations had a greater requirement for Italian (66%) and Portuguese
(46%) than their indigenous counterparts (24% and 13% respectively16). The range of
languages selected appeared to increase for foreign (and large) employer organisations.
This is illustrated in Figure 24 where the foreign proportions are larger than indigenous
proportions in all cases with the exception of Chinese.
16 Note small sample sizes for some languages
63%
57%
48%
24%
43%
20%
13%
17%
11%
9%
7%
19%
80%
83%
61%
66%
12%
39%
46%
39%
15%
10%
2%
22%
0% 25% 50% 75% 100%
French
German
Spanish
Italian
Chinese
Dutch
Portuguese
Russian
Arabic
Japanese
Cantonese
Other
Indigenous
Foreign
[Valid n = 54 indigenous, Valid n = 41 foreign]
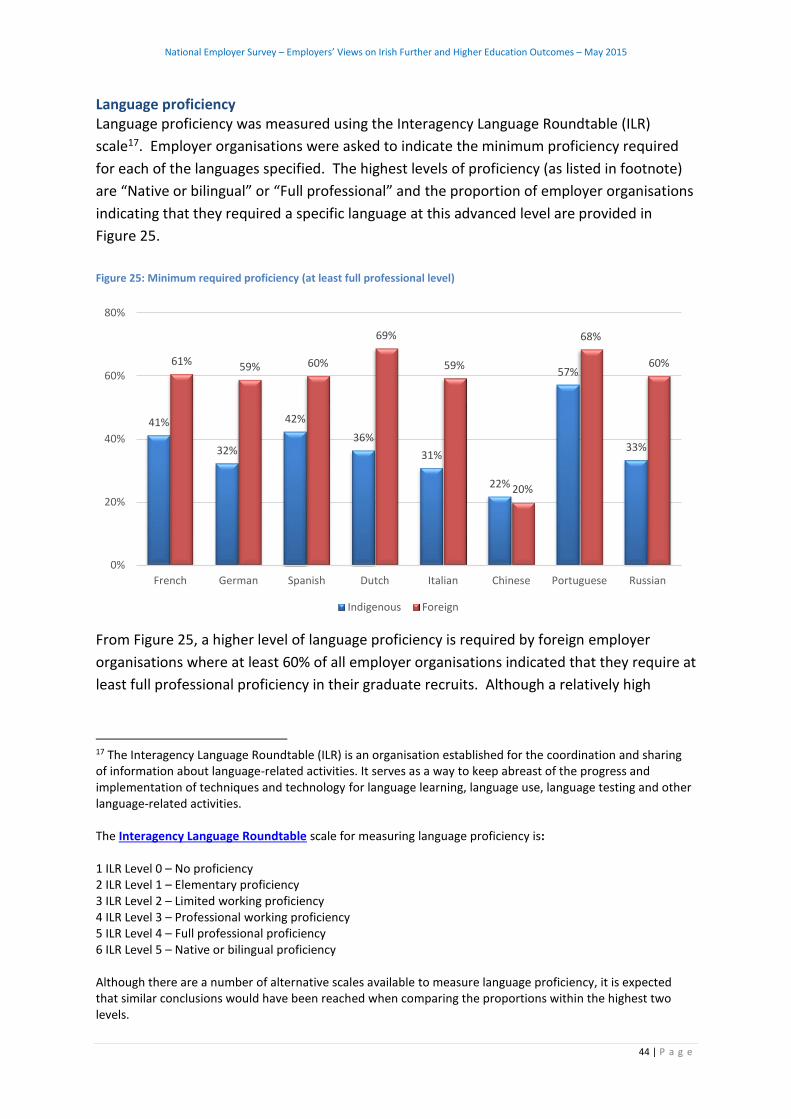
National Employer Survey – Employers’ Views on Irish Further and Higher Education Outcomes – May 2015
44 | P a g e
Language proficiency Language proficiency was measured using the Interagency Language Roundtable (ILR)
scale17. Employer organisations were asked to indicate the minimum proficiency required
for each of the languages specified. The highest levels of proficiency (as listed in footnote)
are “Native or bilingual” or “Full professional” and the proportion of employer organisations
indicating that they required a specific language at this advanced level are provided in
Figure 25.
Figure 25: Minimum required proficiency (at least full professional level)
From Figure 25, a higher level of language proficiency is required by foreign employer
organisations where at least 60% of all employer organisations indicated that they require at
least full professional proficiency in their graduate recruits. Although a relatively high
17 The Interagency Language Roundtable (ILR) is an organisation established for the coordination and sharing of information about language-related activities. It serves as a way to keep abreast of the progress and implementation of techniques and technology for language learning, language use, language testing and other language-related activities. The Interagency Language Roundtable scale for measuring language proficiency is: 1 ILR Level 0 – No proficiency 2 ILR Level 1 – Elementary proficiency 3 ILR Level 2 – Limited working proficiency 4 ILR Level 3 – Professional working proficiency 5 ILR Level 4 – Full professional proficiency 6 ILR Level 5 – Native or bilingual proficiency Although there are a number of alternative scales available to measure language proficiency, it is expected that similar conclusions would have been reached when comparing the proportions within the highest two levels.
41%
32%
42%
36%
31%
22%
57%
33%
61% 59% 60%
69%
59%
20%
68%
60%
0%
20%
40%
60%
80%
French German Spanish Dutch Italian Chinese Portuguese Russian
Indigenous Foreign

National Employer Survey – Employers’ Views on Irish Further and Higher Education Outcomes – May 2015
45 | P a g e
proportion of indigenous employer organisations required Chinese language skills in their
organisation, a high degree of proficiency was not necessarily required.
Graduate recruitment from outside of Ireland
All employers were asked whether they had recruited at least one graduate from an
academic institution outside of the Republic of Ireland. Figure 4 showed that 1,540
graduates from HE and FET met this description, i.e. 1,423 graduates from HE and 117
graduates from FET (approximately 16% of the total number of graduates recruited). Figure
26 illustrates the relative proportions of employer organisations recruiting from outside of
Ireland.
Figure 26: Graduate Recruitment from outside of Ireland
From Figure 26, foreign organisations were more likely to recruit from an external source
(42%) than indigenous organisations (32%). This proportion was highest for large
organisations (47%) and service-type organisations (42%). Organisations based in Dublin
were also relatively high (46%) as were employer organisations of graduates from FET
(42%).
In terms of graduate numbers, the majority (80%) of all HE graduates recruited from
institutions outside of Ireland were recruited from within the European Economic Area
(EEA) with the remainder coming from outside the EEA. The disciplines from which the
majority of graduates were sourced were ‘Engineering’ and ‘Computing’ for foreign
organisations and ‘Health & Welfare’ and ‘Engineering’ for indigenous organisations.
All employer organisations were asked to explain why they recruited graduates from
institutions outside of the Republic of Ireland and a summary of the most frequently
occurring open-ended responses is provided below:
The best candidate got the position, regardless of where they were educated
32%
42%
25%
42%
30% 30%
47%
-25%
0%
25%
50%
75%
Indigenous Foreign Manufacturing Service <50 people 51-250 people 251+ people
Ownership Type Size
% o
f em
plo
yer
org
anis
atio
ns

National Employer Survey – Employers’ Views on Irish Further and Higher Education Outcomes – May 2015
46 | P a g e
Conscious decision by company to encourage diversity and multi-cultural aspect
within the workforce
Specific languages with a high degree of proficiency were not generally available in
Ireland
Specialist skills are not generally available locally and it is necessary to look further
afield provide a greater selection and graduates, e.g. mathematics, coding, analytics
Local graduates had a relatively low level of practical workplace experience
The need for local knowledge in export market the firm is working in at this time
National Employer Survey – Employers’ Views on Irish Further and Higher Education Outcomes – May 2015
47 | P a g e
Glossary
ISC Insight Statistical Consulting
HEA Higher Education Authority
HE Higher Education
FET Further Education and Training
HEI Higher Education Institution
IoT Institute of Technology
DES Department of Education and Skills
EGFSN Expert Group on Future Skills Needs
QQI Quality and Qualifications Ireland
NFQ National Framework of Qualifications
DJEI Department of Jobs, Enterprise and Innovation
STEM Science, Technology, Engineering and Mathematics
National Employer Survey – Employers’ Views on Irish Further and Higher Education Outcomes – May 2015
48 | P a g e
Appendix 1 - Questionnaire
National Employer Survey
Employers’ Views of Irish Further and Higher Education Outcomes
The National Employer Survey on Graduates in Ireland 2014 is being run on a partnership basis
between the Higher Education Authority (HEA); SOLAS - the Further Education & Training Authority
and Quality & Qualifications Ireland (QQI), with the online survey being conducted on our behalf by
Insight Statistical Consulting.
The survey will provide a snapshot of employer opinion with the results helping to inform policy
direction in further and higher education. It offers you as an employer the opportunity to have your
say on the quality and employability of Irish graduates as well as to shape the future as Ireland
strives towards economic recovery. All respondents will receive a summary of the results in advance
of a detailed report which will be published in the coming months.
Thank you for taking the time to participate and sharing your valuable insight. The length of the
time required to complete the survey varies by organisation but on average, it should take about 15
minutes. It is possible to leave the survey and resume at a later stage (if you use the same computer)
but you should aim to complete the survey in one session if possible.
All information received will be treated in the strictest of confidence. If you have any queries in
relation to the survey please contact David Harmon at Insight Statistical Consulting
([email protected]). Queries about the research project should be directed to Tim Conlon at the
Higher Education Authority ([email protected]) or Jasmina Behan at SOLAS
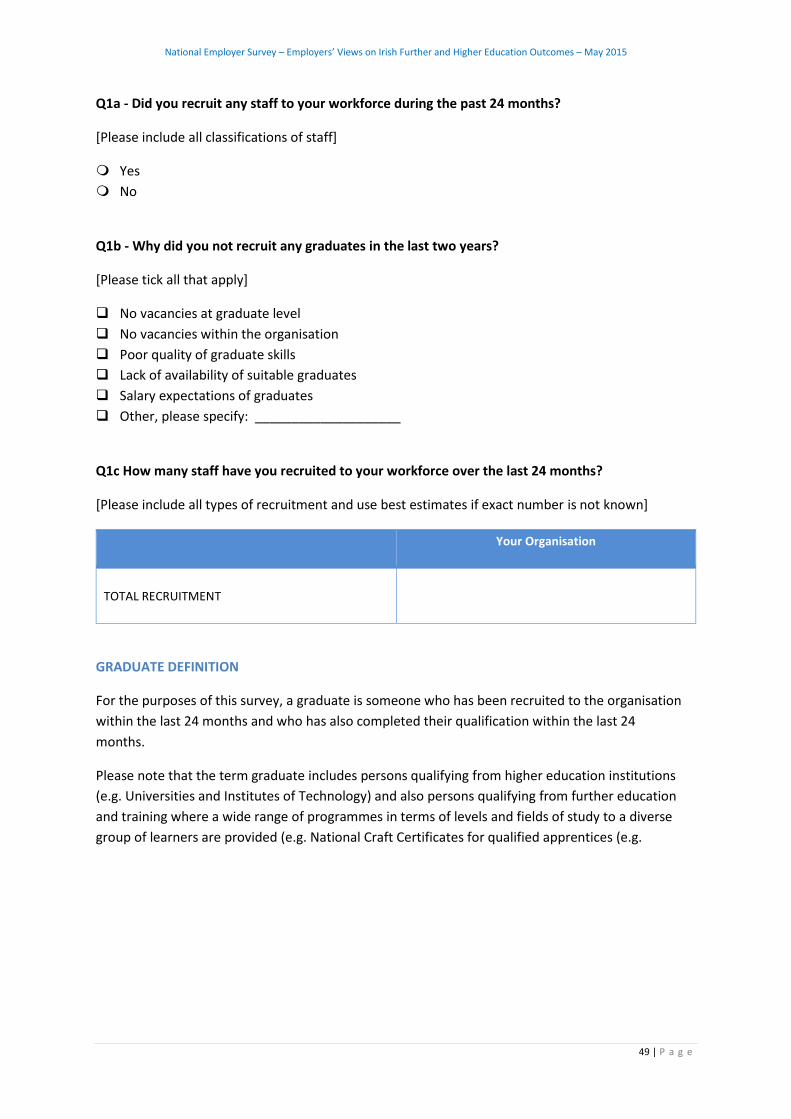
National Employer Survey – Employers’ Views on Irish Further and Higher Education Outcomes – May 2015
49 | P a g e
Q1a - Did you recruit any staff to your workforce during the past 24 months?
[Please include all classifications of staff]
Yes
No
Q1b - Why did you not recruit any graduates in the last two years?
[Please tick all that apply]
No vacancies at graduate level
No vacancies within the organisation
Poor quality of graduate skills
Lack of availability of suitable graduates
Salary expectations of graduates
Other, please specify: ____________________
Q1c How many staff have you recruited to your workforce over the last 24 months?
[Please include all types of recruitment and use best estimates if exact number is not known]
Your Organisation
TOTAL RECRUITMENT
GRADUATE DEFINITION
For the purposes of this survey, a graduate is someone who has been recruited to the organisation
within the last 24 months and who has also completed their qualification within the last 24
months.
Please note that the term graduate includes persons qualifying from higher education institutions
(e.g. Universities and Institutes of Technology) and also persons qualifying from further education
and training where a wide range of programmes in terms of levels and fields of study to a diverse
group of learners are provided (e.g. National Craft Certificates for qualified apprentices (e.g.

National Employer Survey – Employers’ Views on Irish Further and Higher Education Outcomes – May 2015
50 | P a g e
plumber, electrician etc.), FETAC qualifications (e.g. childcare, hairdressing etc.), specific industry
related (vendor) qualifications (e.g. Microsoft)).
Q2a - Have you recruited any graduates to your workforce over the last 24 months?
[Please note graduate definition below]
Yes
No
Q2b - Why did you not recruit any graduates in the last two years?
[Please tick all that apply]
No vacancies at graduate level
No vacancies within the organisation
Poor quality of graduate skills
Lack of availability of suitable graduates
Salary expectations of graduates
Other, please specify: ____________________
Q3a & Q3b - Approximately how many graduates have you recruited from each of the following
types of education institutions within the Republic of Ireland and outside of the Republic of
Ireland:
[Please use best estimates if exact numbers are not known]
Institution-type Institutions from within the Republic of Ireland
Institutions from outside the Republic of
Ireland
HIGHER EDUCATION [e.g. higher diploma, degree, masters or doctorate]
FURTHER EDUCATION AND TRAINING [e.g. National Craft Certificates for qualified apprentices (e.g. plumber, electrician etc.), FETAC qualifications (e.g. childcare, hairdressing etc.), specific industry related (vendor) qualifications (e.g. Microsoft)]
HIGHER EDUCATION
Q3c - Please indicate how many higher education graduate(s) are from each of the following types
of higher education institutions in Republic of Ireland:

National Employer Survey – Employers’ Views on Irish Further and Higher Education Outcomes – May 2015
51 | P a g e
Universities Institutes of Technology Other (or Unknown
Classifications)
Number of Graduates
Q4a - From which disciplines did you recruit the higher education graduates from the Republic of
Ireland?
[Please tick all that apply]
Business & Law - (incl. Marketing, Sales, Management, Accounting, Finance, Property Sales)
Engineering - (excl. Civil and/or Software Engineering)
Science & Mathematics - (incl. Food Science, Environmental Science)
Computing - (incl. Software Engineering)
Humanities & Arts - (incl. Teacher Education, Languages, History, Philosophy)
Social Sciences - (incl. Psychology, Sociology, Economics, Journalism)
Construction - (incl. Civil Engineering)
Agriculture & Veterinary
Health & Welfare - (incl. nursing, medical, social work)
Services - (incl. Hospitality, Tourism, Travel, Environmental Protection, Transport, Security)
Q4b - Did any of the higher education recruitment require formal qualifications other than Leaving
Certificate?
Yes No Don't Know
Business & Law
Engineering
Science & Mathematics
Computing
Humanities & Arts
Social Sciences
Construction
Agriculture & Veterinary
Health & Welfare
Services

National Employer Survey – Employers’ Views on Irish Further and Higher Education Outcomes – May 2015
52 | P a g e
NATIONAL FRAMEWORK OF QUALIFICATIONS (NFQ)
Q5a - Have you ever heard of the National Framework of Qualifications (NFQ)?
Yes
No
Unsure
Q5b - Do you refer to the National Framework of Qualifications (NFQ) at any point during your
recruitment process?
Yes
No
Don't know
Q6 - Please indicate all levels in which graduates were recruited from higher education:
[Please tick all levels that apply and refer to this publication if any clarifications are required]
Higher Certificate &
Ordinary Bachelor Degree
[NFQ Level 6 & 7]
Honours Degree
[NFQ Level 8]
Higher Diploma
[NFQ Level 8]
Masters Degree Post-
Graduate Diploma
[NFQ Level 9]
Doctoral Degree
[NFQ Level 10]
Don't know
Business & Law
Engineering
Science & Mathematics
Computing
Humanities & Arts
Social Sciences
Construction
Agriculture & Veterinary
Health & Welfare
Services

National Employer Survey – Employers’ Views on Irish Further and Higher Education Outcomes – May 2015
53 | P a g e
Q7 - If PhD level graduates were recruited [NFQ Level 10], do you agree or disagree that the
position(s) required this level of education?
Strongly Disagree
Disagree Neither Agree Strongly
Agree Don't know
Business & Law
Engineering
Science & Mathematics
Computing
Humanities & Arts
Social Sciences
Construction
Agriculture & Veterinary
Health & Welfare
Services

National Employer Survey – Employers’ Views on Irish Further and Higher Education Outcomes – May 2015
54 | P a g e
Q8 - Please rate your level of satisfaction with graduate recruits as they relate to the
following workplace attributes:
[In your assessment please rate the graduates collectively within disciplines, i.e. as a group]
Each Discipline Selected
All
satisfactory 75%
satisfactory 50%
satisfactory 25%
satisfactory None
satisfactory
Don't know/Not Applicable
Computer and technical literacy
Foreign language capability
Numeracy/ Processing and interpreting numerical data
Application of technical knowledge
Effective verbal communication
Effective written communication
Working effectively with others
Working effectively on their own
Attention to detail
Business acumen/ awareness
Entrepreneurial skills

National Employer Survey – Employers’ Views on Irish Further and Higher Education Outcomes – May 2015
55 | P a g e
Q9 - Please rate your level of satisfaction with graduate recruits as they relate to the following
personal attributes:
[In your assessment please rate the graduates collectively within disciplines, i.e. as a group]
Each Discipline Selected
All
satisfactory 75%
satisfactory 50%
satisfactory 25%
satisfactory None
satisfactory
Don't know/Not Applicable
Ability to cope with work pressure
Adaptability and flexibility
Positive attitude and energy
Ethically and socially aware
Reliability
Personal commitment
Professionalism and work ethic
Q10 - Do you have an established relationship with a higher education institution as a source of
graduates for each of the disciplines below?
Yes No Don't Know
Business & Law
Engineering
Science & Mathematics
Computing
Humanities & Arts
Social Sciences
Construction
Agriculture & Veterinary
Health & Welfare
Services

National Employer Survey – Employers’ Views on Irish Further and Higher Education Outcomes – May 2015
56 | P a g e
Q11 - Please indicate the higher education institution where there is an established relationship as
a source of graduates for each discipline and the reason(s) why this institution was selected.
Yes Each Discipline
Selected
Dublin City University
University College Cork
University College Dublin
National University of Ireland, Galway
National University of Ireland, Maynooth
University of Limerick
Trinity College
Dublin Institute of Technology
Athlone Institute of Technology
Institute of Technology, Blanchardstown
Institute of Technology, Carlow
Cork Institute of Technology
Dún Laoghaire IADT
Dundalk Institute of Technology
Galway-Mayo Institute of Technology
Letterkenny Institute of Technology
Limerick Institute of Technology
Institute of Technology, Sligo
Institute of Technology, Tallaght
Institute of Technology, Tralee
Waterford Institute of Technology
St Angela's College of Education, Sligo
Church of Ireland College of Education
Marino Institute of Education
Mary Immaculate College, Limerick
Mater Dei Institute of Education
St Patrick's College of Education
Other

National Employer Survey – Employers’ Views on Irish Further and Higher Education Outcomes – May 2015
57 | P a g e
Graduate Recruitment from Institutions Outside of Ireland
Q12 - Please indicate which disciplines graduates were recruited from across European Economic
Area (EEA) and outside of the EEA, if known.
EEA Outside EEA Unknown territory Reason(s)
Business & Law
Engineering
Social Sciences
Science & Mathematics
Computing
Humanities & Arts
Construction
Agriculture & Veterinary
Health & Welfare
Services
COLLABORATIONS
Q13 - Please indicate whether your organisation is involved in any of the following collaborations
with higher education institutions;
[Please tick all that apply, there is more information about each collaboration available by pointing
towards the blue text]
Curriculum reform
Skills needs
Internships and placement
Training
Advisory panels
Research & Development
IP exploitation
Equipment and facilities
Knowledge
Incubation services
Community
Other, please specify: ____________________

National Employer Survey – Employers’ Views on Irish Further and Higher Education Outcomes – May 2015
58 | P a g e
Q14a - How would you describe the current level of collaboration with Irish higher education
institutions by your organisation:
Very good
Good
Neither good nor bad
Poor
Very poor
Don't know/Not applicable
Q14b - What could educational institutions do (better) to improve collaboration with enterprise in
Republic of Ireland?
Q14c - What could enterprise do (better) to improve collaboration with education institutions in
Republic of Ireland?

National Employer Survey – Employers’ Views on Irish Further and Higher Education Outcomes – May 2015
59 | P a g e
FURTHER EDUCATION & TRAINING
This section asks a series of questions about the graduate(s) recruited from further education and
training organisations in the Republic of Ireland. These are persons qualifying from further
education and training where a wide range of programmes in terms of levels and fields of study to
a diverse group of learners are provided (e.g. National Craft Certificates for qualified apprentices
(e.g. plumber, electrician etc.), FETAC qualifications (e.g. childcare, hairdressing etc.), specific
industry related (vendor) qualifications (e.g. Microsoft)).
FURTHER EDUCATION AND TRAINING GRADUATES
Q15 - From which skill categories did you recruit graduates from Further Education and Training
institutions in the Republic of Ireland?
[Please tick all that apply]
Construction
Hairdressing/Beauty and Complimentary Therapies
IT
Health /Family /Care/Other Personal Services
Business Admin and Management
Financial Services
Manufacturing/Engineering
Transport Distribution/logistics
Sales and Marketing
Food and Beverage/Hospitality
Tourism and Sport
Science and Technology, Animal Science
Natural resources
Agriculture, Horticulture, and Mariculture
Art, Craft and Media

National Employer Survey – Employers’ Views on Irish Further and Higher Education Outcomes – May 2015
60 | P a g e
Q16 - Did any of the further education and training recruitment require formal qualifications other
than Leaving Certificate?
Yes No Don’t Know
Construction
Hairdressing/Beauty and Complimentary Therapies
IT
Health /Family /Care/Other Personal Services
Business Admin. and Management
Financial Services
Manufacturing/Engineering
Transport Distribution/logistics
Sales and Marketing
Food and Beverage/Hospitality
Tourism and Sport
Science and Technology, Animal Science
Natural resources
Agriculture, Horticulture, and Mariculture
Art, Craft and Media

National Employer Survey – Employers’ Views on Irish Further and Higher Education Outcomes – May 2015
61 | P a g e
Further education and training provides a wide range of programmes in terms of levels and fields
of study to a diverse group of learners. Some of the best known FET qualifications include National
Craft Certificates for qualified apprentices (e.g. plumber, electrician etc.), FETAC qualifications (e.g.
childcare, hairdressing etc.), specific industry related (vendor) qualifications (e.g. Microsoft).
Q17 - Please indicate the qualifications in which graduates were recruited from further education
and training:
[Please tick all that apply]
Qualifications
Qualified
Apprentice
FETAC award (other than
apprenticeship)
City and Guilds award
Vendor/ Industry
award (e.g. Microsoft)
Other Don't know
Construction
Hairdressing/Beauty and Complimentary Therapies
IT
Health /Family /Care/Other Personal Services
Business Admin. and Management
Financial Services
Manufacturing/Engineering
Transport Distribution/logistics
Sales and Marketing
Food and Beverage/Hospitality
Tourism and Sport
Science and Technology, Animal Science
Natural resources
Agriculture, Horticulture, and Mariculture
Art, Craft and Media
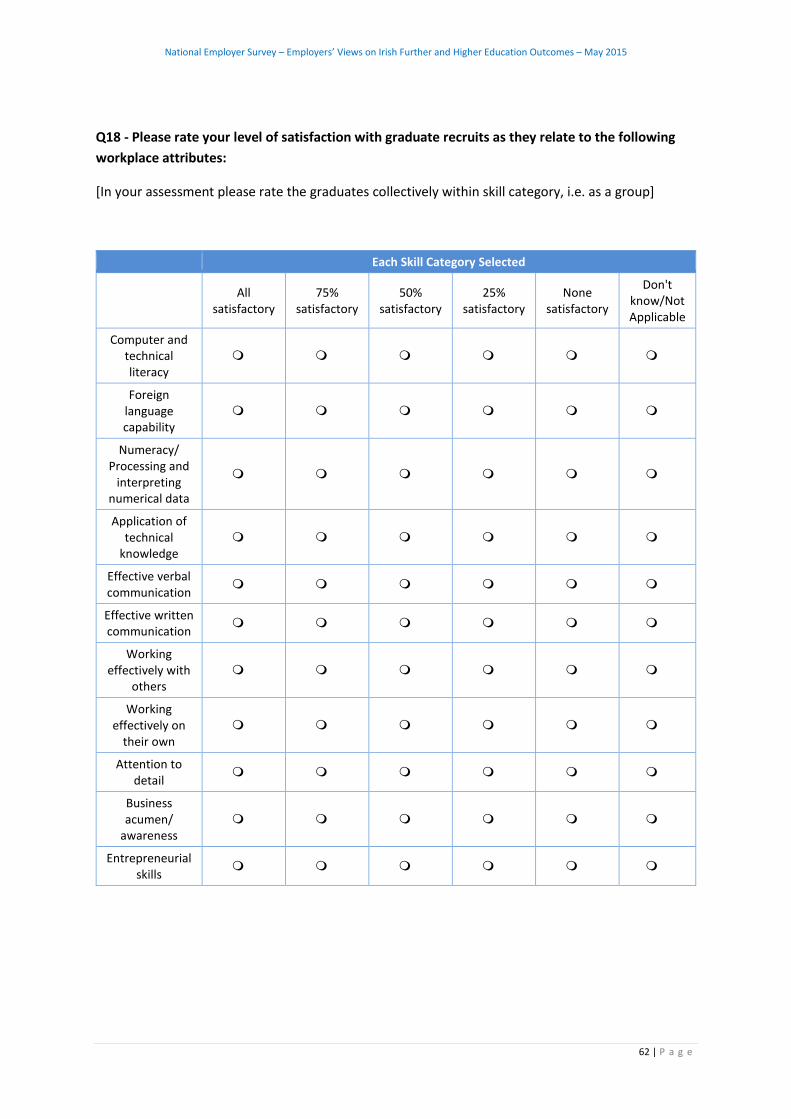
National Employer Survey – Employers’ Views on Irish Further and Higher Education Outcomes – May 2015
62 | P a g e
Q18 - Please rate your level of satisfaction with graduate recruits as they relate to the following
workplace attributes:
[In your assessment please rate the graduates collectively within skill category, i.e. as a group]
Each Skill Category Selected
All
satisfactory 75%
satisfactory 50%
satisfactory 25%
satisfactory None
satisfactory
Don't know/Not Applicable
Computer and technical literacy
Foreign language capability
Numeracy/ Processing and
interpreting numerical data
Application of technical
knowledge
Effective verbal communication
Effective written communication
Working effectively with
others
Working effectively on
their own
Attention to detail
Business acumen/
awareness
Entrepreneurial skills

National Employer Survey – Employers’ Views on Irish Further and Higher Education Outcomes – May 2015
63 | P a g e
Q19 - Please rate your level of satisfaction with graduate recruits as they relate to the following
personal attributes:
[In your assessment please rate the graduates collectively within skill category, i.e. as a group]
Each Skill Category Selected
All
satisfactory 75%
satisfactory 50%
satisfactory 25%
satisfactory None
satisfactory
Don't know/Not Applicable
Ability to cope with work pressure
Adaptability and flexibility
Positive attitude and energy
Ethically and socially aware
Reliability
Personal commitment
Professionalism and work ethic

National Employer Survey – Employers’ Views on Irish Further and Higher Education Outcomes – May 2015
64 | P a g e
GRADUATES RECRUITED FROM INSTITUTIONS OUTSIDE OF IRELAND
Q20 - Please indicate which skill categories they were recruited from across the European
Economic Area (EEA) and outside the EEA, if known.
EEA Outside EEA Unknown territory
Reason(s)
Construction
Hairdressing/Beauty and Complimentary Therapies
IT
Health /Family /Care/Other Personal Services
Business Admin. and Management
Financial Services
Manufacturing/Engineering
Transport Distribution/logistics
Sales and Marketing
Food and Beverage/Hospitality
Tourism and Sport
Science and Technology, Animal Science
Natural resources
Agriculture, Horticulture, and Mariculture
Art, Craft and Media

National Employer Survey – Employers’ Views on Irish Further and Higher Education Outcomes – May 2015
65 | P a g e
COLLABORATIONS
Q21 - Please indicate whether your organisation is involved in any of the following collaborations
with further education and training providers;
[Please tick all that apply, there is more information about each collaboration available by pointing
towards the blue text]
Curriculum development
Exchange of information regarding skills needs
On the job placement
Training
Advisory panels
Equipment & facilities
Knowledge
Other, please specify: ____________________
Q22a - How would you describe the current level of collaboration with further education and
training providers by your organisation:
Very good
Good
Neither good nor poor
Poor
Very poor
Don't know/Not applicable
Q22b - What could educational institutions do (better) to improve collaboration with enterprise in
Republic of Ireland?
Q22c - What could enterprise do (better) to improve collaboration with education institutions in
Republic of Ireland?

National Employer Survey – Employers’ Views on Irish Further and Higher Education Outcomes – May 2015
66 | P a g e
GENERAL - This is the final section about general issues facing employers of graduates such as a
requirement for a foreign language proficiency. It ends with some general classification questions
about your organisation for analysis purposes.
FOREIGN LANGUAGES
Q23a - Do you have a specific requirement for foreign language proficiency skills in your
organisation?
Yes
No
Don't know
Q23b - What foreign languages do you require in your organisation?
[Please tick all that apply]
French
German
Spanish
Dutch
Italian
Chinese
Japanese
Portuguese
Arabic
Russian
Cantonese
Other, please specify: ____________________
No foreign languages required
Q23c - Please indicate the minimum proficiency required for each of the languages below.
Elementary
Limited working
Professional working
Full professional
Native or bilingual

National Employer Survey – Employers’ Views on Irish Further and Higher Education Outcomes – May 2015
67 | P a g e
MINIMUM ENTRY STANDARDS
Q24a - Does your organisation have minimum entry standards for graduate applications?
Yes
No
Don't know
Q24b - Please indicate the minimum entry standards for graduate applications in your
organisation.
[Please tick all that apply]
Leaving certificate
Completion of specific courses
Have, or expect, a 2.1 degree or above
Relevant work experience
Pass psychometric or other in-house selection processes (e.g. assessment centres)
Other, please specify: ____________________
Q24c - Could you specify any other skills (beyond those covered above) that your organisation
currently requires and the Irish higher education system is currently not providing?

National Employer Survey – Employers’ Views on Irish Further and Higher Education Outcomes – May 2015
68 | P a g e
Q24d - Are there skills not currently available that you require now (or in the next three to five
years) in the Republic of Ireland?
Yes
No
Q25 - Please list the particular skills that your organisation requires (or will require in the next
three to five years):
When do (or will) you need these skills?
[Please tick one/both options]
Now (or within 1-2
years) From 3 to 5 years (or
beyond) Skills
First
Second
Third
Q26a - How likely is that there will be an adequate supply of graduates with the necessary skills
needed to meet your organisation's needs in the next three to five years:
Very likely
Likely
Neither likely nor unlikely
Unlikely
Very unlikely
Don't know/Not applicable
Q26b - Please describe why you feel the supply will be less than likely:
Q26c - What should educational institutions do to assist you to address this?

National Employer Survey – Employers’ Views on Irish Further and Higher Education Outcomes – May 2015
69 | P a g e
ABOUT YOUR ORGANISATION
Q27 - Please indicate region (or location of head office):
Dublin
South-West
Mid-East
Border
South-East
West
Mid-West
Midlands
Q28 - Please assign your organisation into the most appropriate NACE Rev. 2 classification below:
Agriculture, forestry and fishing
Mining and quarrying
Manufacturing
Electricity, gas, steam and air conditioning supply
Water supply; sewerage, waste management and remediation activities
Construction
Wholesale and retail trade; repair of motor vehicles and motorcycles
Transportation and storage
Accommodation and food service activities
Information and communication
Financial and insurance activities
Real estate activities
Professional, scientific and technical activities
Administrative and support service activities
Public administration and defence; compulsory social security
Education
Human health and social work activities
Arts, entertainment and recreation
Other service activities
Activities of households as employers; undifferentiated goods- and services-producing activities
of households for own use
Other, please specify: ____________________

National Employer Survey – Employers’ Views on Irish Further and Higher Education Outcomes – May 2015
70 | P a g e
Q29 - Please indicate the total size of your workforce into one of the following categories:
Fewer than 10 people
Between 10 and 50 people
Between 51 and 250 people
251 people and above
Q30 - Please indicate the primary ownership of your organisation:
Indigenous
Foreign
Other, please specify: ____________________
Q31 - Finally, would you be willing to participate in a further targeted follow-up survey or
discussion based on your responses?
Yes, I am willing to take part in a follow-up
Yes, but only if necessary
No thanks
Please provide your contact details below if you wish to receive a summary of the results from this
survey. Alternatively send a separate email to [email protected].
Name
Position
Organisation
Telephone
If you wish to provide any final comments about this survey, or related topics, please enter below:
Thank you for your help!
When you are ready to submit your response please click the SUBMIT button below and your
responses will be gratefully received.
Upon submission you will be redirected to the Higher Education Authority website.
NATIONALEMPLOYERSURVEYEMPLOYERS’ VIEwS ON IRIShfURThER ANd hIghEREdUcATION ANd TRAININgOUTcOMES
commissioned by the higherEducation Authority, SOLAS andQuality and QualificationsIreland
May 2015
National Employer Survey covers_Layout 1 07/05/2015 16:49 Page 1