national electric power regulatory authority (nepra… for generation plan and power... · national...
TRANSCRIPT

NATIONAL ELECTRIC POWER REGULATORY AUTHORITY (NEPRA) Form # - PPP 1
Summary of Projected Power Purchase Price of CPPA Pool
FY _________________
# Particulars Unit Jul Aug Sep Oct Nov Dec Jan Feb Mar Apr May Jun Total
1 Units Delivered to DISCOs and KESC GWh
2 Fuel Cost Component Rs. in Millions
3 Variable O&M Rs. in Millions
4 Capacity Charge Rs. in Millions
5 Transmission Charge (UOSC) Rs. in Millions
6 Total Power Purchase Price (2+3+4+5) Rs. in Millions
7 Fuel Cost Component (Row 2 / Row 1) Rs./kWh
8 Variable O&M (Row 3 / Row 1) Rs./kWh
9 Capacity Charge (Row 4 / Row 1) Rs./kWh
10 Transmission Charge (UOSC) (Row 5 / Row 1) Rs./kWh
11 Total Power Purchase Price (7+8+9+10) Rs./kWh

NATIONAL ELECTRIC POWER REGULATORY AUTHORITY (NEPRA) Form # - PPP 2
Assumptions for Fuel Prices for Projected Power Purchase Cost
FY __________________________
1 HSFO Price Assumption
Import Oil
prices-
Projection
Ex-GST / Ex-
FreightFreight cost
Ex-GST final
cost
Imported
oil price
Projected
exchnage
rate
Ex-GST
final cost
Rs./M. Ton Rs./M. Ton Rs./M. Ton Rs/$ $ $ / M. Ton Rs./M. Ton Rs./M. Ton
a b c = a + b d e = c/d f g h = f * g
1st Jul, 20X1 1st Jul, 20X2
16th Jul, 20X1 16th Jul, 20X2
1st Aug, 20X1 1st Aug, 20X2
16th Aug, 20X1 16th Aug, 20X2
1st Sep, 20X1 1st Sep, 20X2
16th Sep, 20X1 16th Sep, 20X2
1st Oct, 20X1 1st Oct, 20X2
16th Oct, 20X1 16th Oct, 20X2
1st Nov, 20X1 1st Nov, 20X2
16th Nov, 20X1 16th Nov, 20X2
1st Dec, 20X1 1st Dec, 20X2
16th Dec, 20X1 16th Dec, 20X2
1st Jan, 20X2 1st Jan, 20X3
16th Jan, 20X2 16th Jan, 20X3
1st Feb, 20X2 1st Feb, 20X3
16th Feb, 20X2 16th Feb, 20X3
1st Mar, 20X2 1st Mar, 20X3
16th Mar, 20X2 16th Mar, 20X3
1st Apr, 20X2 1st Apr, 20X3
16th Apr, 20X2 16th Apr, 20X3
1st May, 20X2 1st May, 20X3
16th May, 20X2 16th May, 20X3
1st Jun, 20X2 1st Jun, 20X3
16th Jun, 20X2 16th Jun, 20X3
Total HSFO
Market price
Rs./Ton
i = average of
each fortnight
in column h
Jul, 20X2
Aug, 20X2
Sep, 20X2
Oct, 20X2
Nov, 20X2
Dec, 20X2
Jan, 20X3
Feb, 20X3
Mar, 20X3
Apr, 20X3
May, 20X3
Jun, 20X3
Exchange
rate-actual
Import
Oil
Price
Projected Months
of FY 20X2-X3
The data of actual cost of HSFO on a fortnightly basis in the last Financial year is obtained from the website of PSO. Freight is added in the cost. This
cost is in Rs. /M.ton and is converted to $/M.ton by using the actual exchange rate. This cost is then prorated to next year on the basis of projected
exchange rate for the next financial year.
Month
Import Oil prices
Actual Months of
previous financial
year 20X1-20X2
Page 2 of Form PPP 2

2. HSD Price Assumption
Months
Projected
Cost for
FY20X1-X2
Actual Cost
for FY 20X1-
X2
Projected
Cost for
FY20X2 - X3
Rs./Ton Rs./Ton Rs./Ton
Jul
Aug
Sep
Oct
Nov
Dec
Jan
Feb
Mar
Apr
May
Jun
Jul
Average
3 Gas Price Assumption
The Gas price last year increased by _______in __________, therefore an increase of _______is assumed from __________:
Actual____ w.e.f. ____
GENCOs
IPPs
Descripton Increase % Rs/MMBTU
The data of actual cost of HSD is obtained from the website of PSO for the latest months. This cost is then prorated to the next year.
Page 3 of Form PPP 2
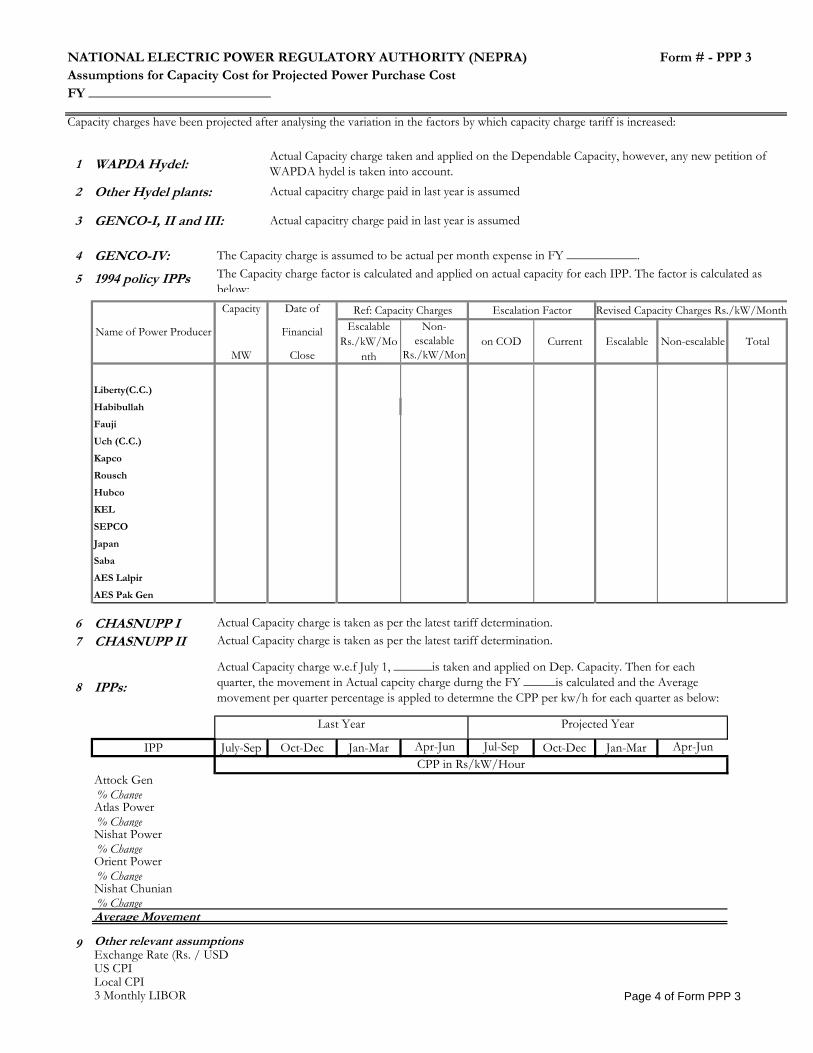
NATIONAL ELECTRIC POWER REGULATORY AUTHORITY (NEPRA) Form # - PPP 3
Assumptions for Capacity Cost for Projected Power Purchase Cost
FY __________________________
1 WAPDA Hydel:
2 Other Hydel plants:
3 GENCO-I, II and III:
4 GENCO-IV:
5 1994 policy IPPs
Ref: Capacity Charges Escalation Factor Revised Capacity Charges Rs./kW/Month
Escalable
Rs./kW/Mo
nth
Non-
escalable
Rs./kW/Mon
th
on COD Current Escalable Non-escalable Total
Liberty(C.C.)
Habibullah
Fauji
Uch (C.C.)
Kapco
Rousch
Hubco
KEL
SEPCO
Japan
Saba
AES Lalpir
AES Pak Gen
6 CHASNUPP I
7 CHASNUPP II
8 IPPs:
IPP July-Sep Oct-Dec Jan-Mar Apr-Jun Jul-Sep Oct-Dec Jan-Mar Apr-Jun
Attock Gen
% ChangeAtlas Power
% ChangeNishat Power
% ChangeOrient Power
% ChangeNishat Chunian
% ChangeAverage Movement
9 Other relevant assumptionsExchange Rate (Rs. / USDUS CPILocal CPI3 Monthly LIBOR
Actual Capacity charge taken and applied on the Dependable Capacity, however, any new petition of
WAPDA hydel is taken into account.
Actual capacitry charge paid in last year is assumed
Capacity charges have been projected after analysing the variation in the factors by which capacity charge tariff is increased:
Last Year Projected Year
The Capacity charge factor is calculated and applied on actual capacity for each IPP. The factor is calculated as
below;
CPP in Rs/kW/Hour
Actual capacitry charge paid in last year is assumed
The Capacity charge is assumed to be actual per month expense in FY ___________.
Actual Capacity charge is taken as per the latest tariff determination.
Name of Power Producer
Capacity
MW
Date of
Financial
Close
Actual Capacity charge is taken as per the latest tariff determination.
Actual Capacity charge w.e.f July 1, ______is taken and applied on Dep. Capacity. Then for each
quarter, the movement in Actual capcity charge durng the FY _____is calculated and the Average
movement per quarter percentage is appled to determne the CPP per kw/h for each quarter as below:
Page 4 of Form PPP 3

3 Monthly KIBORHours in the QuarterAverage Exchange Rate, CPI and WPI
Page 5 of Form PPP 3

NATIONAL ELECTRIC POWER REGULATORY AUTHORITY (NEPRA) Form # - PPP 4
Assumptions for Varialbe O&M Cost (part of energy charge)
FY __________________________
1
2
3 Transmission charges:
4 Energy Charge- Variable O&M
iWAPDA Hydel:
ii Other Hydel plants:
iii GENCO-I:
Month Variable
O&M in
Rs/kWhJuly,____ to Dec, _____ 0.0000
Jan, ____to June, ______ 0.0000
FactorJan-June
____
July-Dec
___
Jan-June
____
July-Dec
____
Jan-Jun
____
Variable O&M in Rs/kWhof Genco-I
iv GENCO-II, III:
GENCO Variable
O&M in
Rs/kWh
GENCO-II
GENCO-III
v GENCO-IV:
GENCO Variable
O&M in
Rs/kWh
GENCO-IV
vi 1994 policy IPPs
a b c = b/a d e = d x
(1+c)
Liberty(C.C.)
Habibullah
Fauji
Uch (C.C.)
Kapco - I ( F.O)
Kapco - I ( Gas)
Kapco - I ( HSD)
Kapco - II ( F.O)
Kapco - II ( Gas)
Kapco - II ( HSD)
Kapco - III ( Gas)
Kapco - III ( HSD)
Rousch
Hubco
KEL
SEPCO
Japan
Saba
AES Lalpir
AES Pak Gen
Chashnup
Davis
Altern
Northern
Zorlu
vii 2002 policy IPPs:
Average Movement in Var-O&M
As per the Order of Authority, the Variable O&M of GENCO-II and III is not subject to adjustment.
Adjustment will be made only when the GENCOs apply for new tariff. Therefore, no adjustment in O&M is
assumed for the FY 2011-12.
The Variable charge is as per the latest valid tariff determination
Actual Variable charge w.e.f July 1, ______is calculated as below and applied on Generation. Then for each quarter, the
movement in Actual Variable charge durng the FY ______is calculated and the Average movement per quarter percentage is
appled to determine the Variable O&M per kwh for each quarter as below:
As per the Order of Authority, the Variable O&M of GENCO-I is subject to adjustment on Bi-Annual basis.
Actual Variable charge w.e.f July 1, _____is taken and applied on Energy generated. Then Jan onwards, ______
the variable charge is enhanced by actual movement in this Component of enercgy charge as below:
Movement in Var-O&M
The Variable charge component of these IPPS is revised on a bi-annual basis. Therefore, for first six months of financial
year, the actual cost as per CPPA data is taken and for the next 6 months, the charge is assumed to increase based on the
percentage increase in last year.
Energy distribution in FY __________among DISCOs has been allocated in the same proportion as that of FY ____________.
load factors in FY ___________has been worked out as per the "NTDC demand forecast Report _______".
Transmission charges have been calculated @ Rs. _________/kW/Month of peak demand of each DISCO in the FY _____________ as per the
latest tariff determination of NTDC
Variable O&M charges have been projected after analysing the variation in the factors by which Variable charge tariff is increased:
Actual Variable charge taken and applied on the Energy Generated in GWh, however, any new tariff petition of
WAPDA is taken into account.
Actual Variable charge taken and applied on the Energy Generated in GWh.
Name of Power
Producer
Actual O&M Jan
to June, 20X2
Actual
O&M July
to Dec,
20X1
Increase
in 6
months
Actual
O&M July,
20X2 to
Dec, 20X2
Projected
O&M from
Jan, 20X3
to June,
20X3
Page 6 of Form PPP 4

Foreign Local Foreign Local Foreign Local Total Foreign Local Total
Rs./kWh Rs./kW/Hr. FY 13-14
Nishat Power
Nishat Chunian Power
Atlas Power
Attock Power
Liberty Power
Hub Power
Bestway Power
Gujranwala Energy
Japan Power
Grange Power
Star
Saif (gas)
Saif (hsd)
Sapphire (gas)
Sapphire (hsd)
Hallmore (gas)
Hallmore (hsd)
Green Electric
Uch II
Foundation
Engro
Orient (gas)
Orient (hsd)
HUBCO-Narowal
Indexation
IPP July-Sep Oct-Dec Jan-Mar Apr-Jun Jul-Sep Oct-Dec Jan-Mar
Attock Gen
% Change
Atlas Power
% Change
Nishat Power
% Change
Orient Power
% Change
Nishat Chunian
% Change
Average %
Change
Sr. No.
Ref. CPI
general
local
Ref. Variable O&M Ref. Fixed O&M
Rs./kWh
July-Sep,
2013 US
CPI
July-Sep,
2013 CPI
general
Last Year Projected Year
Ref. Exchange
Rate
Ref. US
CPIRs./kW/Hr.
NewNew Variable O&M New Fixed O&MRevised
Exchange
Rate
Page 7 of Form PPP 4
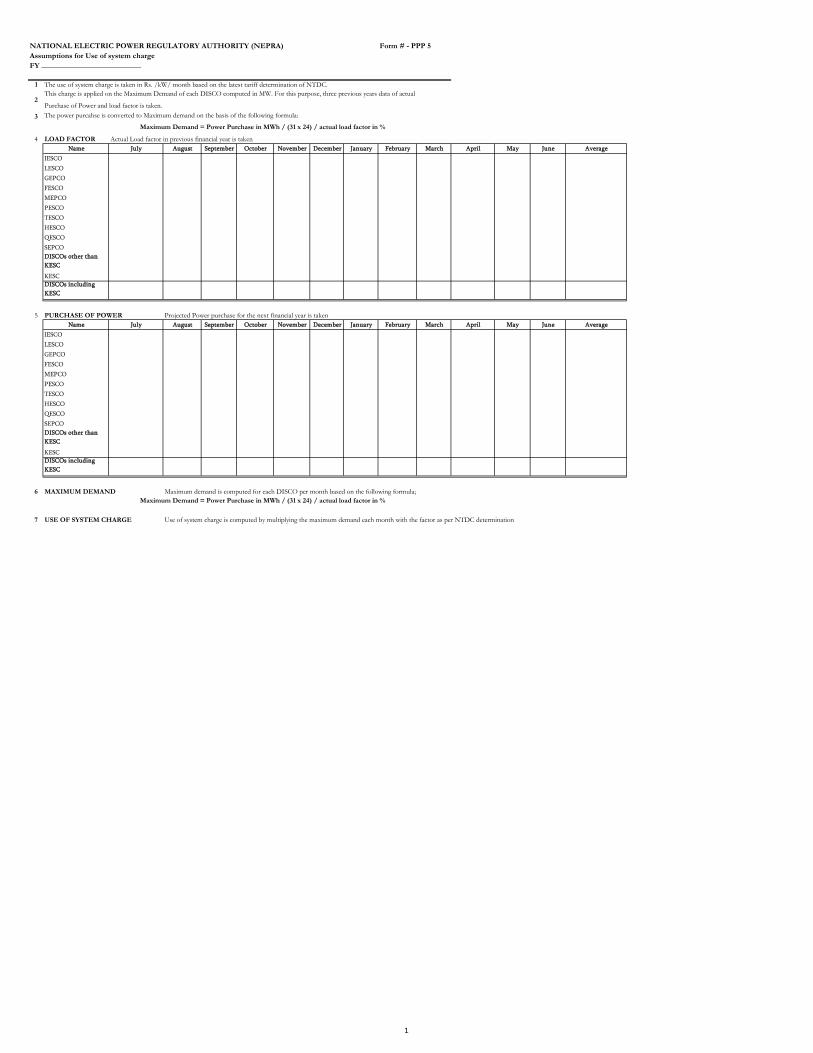
NATIONAL ELECTRIC POWER REGULATORY AUTHORITY (NEPRA) Form # - PPP 5
Assumptions for Use of system charge
FY __________________________
1
2
3
4 LOAD FACTOR Actual Load factor in previous financial year is taken
Name July August September October November December January February March April May June Average
IESCO
LESCO
GEPCO
FESCO
MEPCO
PESCO
TESCO
HESCO
QESCO
SEPCO
DISCOs other than
KESC
KESC
DISCOs including
KESC
5 PURCHASE OF POWER Projected Power purchase for the next financial year is taken
Name July August September October November December January February March April May June Average
IESCO
LESCO
GEPCO
FESCO
MEPCO
PESCO
TESCO
HESCO
QESCO
SEPCO
DISCOs other than
KESC
KESC
DISCOs including
KESC
6 MAXIMUM DEMAND Maximum demand is computed for each DISCO per month based on the following formula;
7 USE OF SYSTEM CHARGE Use of system charge is computed by multiplying the maximum demand each month with the factor as per NTDC determination
Maximum Demand = Power Purchase in MWh / (31 x 24) / actual load factor in %
Maximum Demand = Power Purchase in MWh / (31 x 24) / actual load factor in %
The use of system charge is taken in Rs. /kW/ month based on the latest tariff determination of NTDC.
This charge is applied on the Maximum Demand of each DISCO computed in MW. For this purpose, three previous years data of actual
Purchase of Power and load factor is taken.
The power purcahse is converted to Maximum demand on the basis of the following formula:
1

NATIONAL ELECTRIC POWER REGULATORY AUTHORITY (NEPRA) Form # - PPP 6
Assumptions for Generation for Projected Power Purchase Cost
FY __________________________
1 WAPDA Hydel:
Installed
Capacity Projected
Budgeted
by WAPDA
MW 2007-08
(Actual)
2008-09
(Actual)
2009-10
(Actual)
2010-11
(Actual)
2011-12
(Actual)
2012-13
(Provisional) 2013-14
1 Tarbela 3,478
2 Ghazi Brotha 1,450
3 Mangla 1,000
4 Warsak 243
5 Chashma 184
6 Jinnah HPP 96
7 Khan Khawar 72
8 Allai Khawar 121
9 Duber Khawar 130
10 Gomal Zam 17
11 Jabban 22
12 Rasul 22
13 Dargai 20
14 Nandipur 14
15 Shadiwal 14
16 Chichoki 13
17 Kuram Garhi 4
18 Renala Khurd 1
19 Chitral 1
Total 6,902 - - - - - - -
Month 2013 (GWh) 2012 (GWh) 2011
(GWh)
2010 (GWh) Average for
three years
(GWh)
month-
wise
generatio
n as a %
of total
Jul
Aug
Sep
Oct
Nov
Dec
Jan
Feb
Mar
Apr
May
Jun
Total
2 Jagran, Pehur, Malakand -III and Laraib
Month 2013 (GWh) 2012 (GWh) 2011
(GWh)
2010 (GWh)
July
August
September
October
November
December
Sr.No.
Hydel
Power
Station
Actual Net Electrical Output (GWh)
While projecting generation for FY _____ previous three-years trend has been kept in view.
Generation has been projected for each unit based on historical actual generation in last three financial years. This is duly adjusted by other factors as below;
While projecting generation for FY ____ last five-years trend has been kept in view. The total generation is
then sub-divided into months based on actual month-wise data
Page 9 of Form PPP 6

January
February
March
April
May
June
Total
3 GENCO-I, II and III:
4 KAPCO
5 IPPs
IPP Fuel type Capacity
(MW)
Generation
(GWh)
Plant
Factor
Generation
(GWh)
Plant
Factor
Generation
(GWh)
Plant
Factor
Projected
P.F.
Generation
(GWh)
Hub Power F.O. -
Kohinoor Energy F.O. -
AES Lalpir F.O. -
AES Pakgen F.O. -
Southern Power F.O. -
Habibullah Gas -
Fauji Kabirwala Gas -
Rousch Gas -
Saba Power F.O. -
Japan Power F.O. -
Uch Gas -
Altern Gas -
Liberty Gas -
Chashma-I Nuclear -
Chashma-II Nuclear -
Tavanir Iran Import -
Attock Gen. F.O. -
Atlas Power F.O. -
Nishat Power F.O. -
Foundation Gas -
Orient Power Gas -
HSD -
Nishat Chunia F.O. -
Saif Power Gas -
HSD -
Engro Gas -
-
Sapphire Power Gas -
HSD -
Hallmore Gas -
HSD -
Hubco Narowal F.O. -
Liberty F.O. -
Davis energen Gas -
Total -
6 OTHERS Generaton of TPS Quetta, TPS Shahadra, SPPs and Zorlu is assumed to be equal to the generation for Last financial year
7Any new plants to be added in each generation category in the next financial year are also incorporated based on dependeable capacity and plant factor of similar
plants.
While projecting generation for FY ___ previous three years month-wise trend has been kept in view. And
generation for FY _______ is taken as Average of last two years actual generation. The projection is done
for each block separately.
While projecting generation for FY ___ previous three years month-wise trend has been kept in view. And
generation for FY _______ is taken as Average of previous three years actual generation. The projection is
done for each block separately.
Actual 20X0 Actual 20X1 Actual 20X2 Projected finacial year
For projection of generation from IPPs analysis is done of generation in previous three years with Plant Factors and a
trend is observed. Based on the average plant factor the generation is projected for next financial year;
Page 10 of Form PPP 6
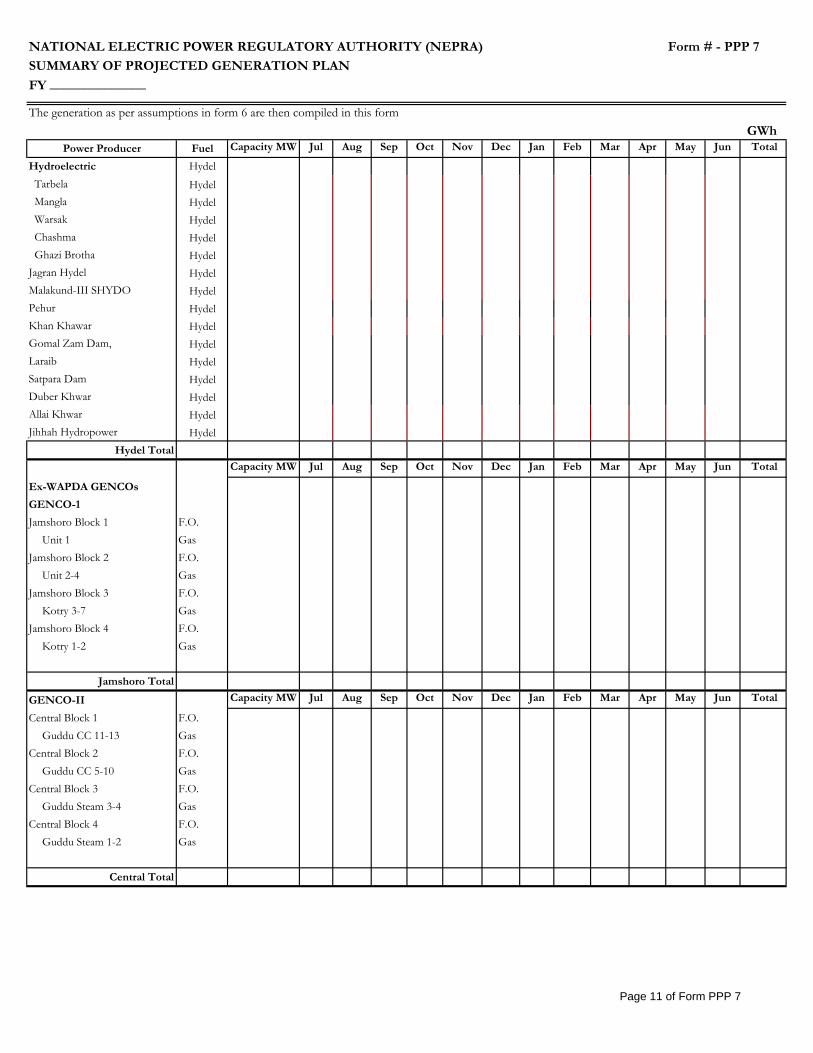
NATIONAL ELECTRIC POWER REGULATORY AUTHORITY (NEPRA) Form # - PPP 7
SUMMARY OF PROJECTED GENERATION PLAN
FY ______________
The generation as per assumptions in form 6 are then compiled in this form
GWh
Power Producer Fuel Capacity MW Jul Aug Sep Oct Nov Dec Jan Feb Mar Apr May Jun Total
Hydroelectric Hydel
Tarbela Hydel
Mangla Hydel
Warsak Hydel
Chashma Hydel
Ghazi Brotha Hydel
Jagran Hydel Hydel
Malakund-III SHYDO Hydel
Pehur Hydel
Khan Khawar Hydel
Gomal Zam Dam, Hydel
Laraib Hydel
Satpara Dam Hydel
Duber Khwar Hydel
Allai Khwar Hydel
Jihhah Hydropower Hydel
Hydel Total
Capacity MW Jul Aug Sep Oct Nov Dec Jan Feb Mar Apr May Jun Total
Ex-WAPDA GENCOs
GENCO-1
Jamshoro Block 1 F.O.
Unit 1 Gas
Jamshoro Block 2 F.O.
Unit 2-4 Gas
Jamshoro Block 3 F.O.
Kotry 3-7 Gas
Jamshoro Block 4 F.O.
Kotry 1-2 Gas
Jamshoro Total
GENCO-II Capacity MW Jul Aug Sep Oct Nov Dec Jan Feb Mar Apr May Jun Total
Central Block 1 F.O.
Guddu CC 11-13 Gas
Central Block 2 F.O.
Guddu CC 5-10 Gas
Central Block 3 F.O.
Guddu Steam 3-4 Gas
Central Block 4 F.O.
Guddu Steam 1-2 Gas
Central Total
Page 11 of Form PPP 7
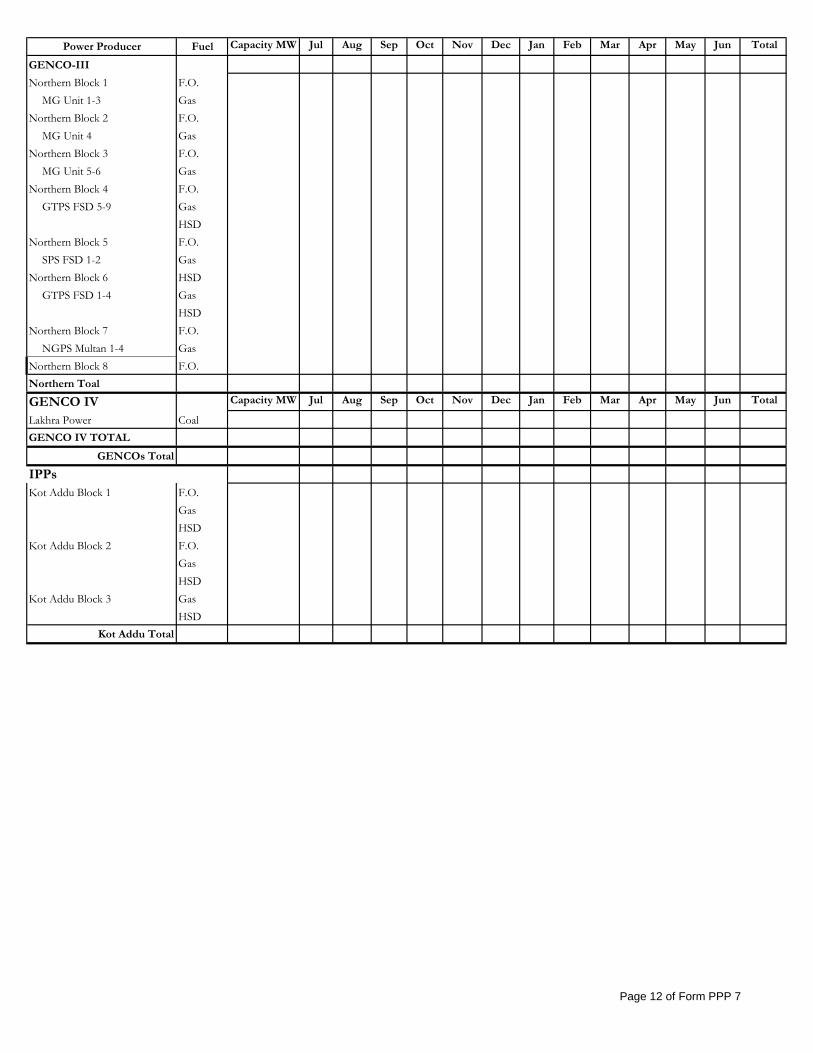
Power Producer Fuel Capacity MW Jul Aug Sep Oct Nov Dec Jan Feb Mar Apr May Jun Total
GENCO-III
Northern Block 1 F.O.
MG Unit 1-3 Gas
Northern Block 2 F.O.
MG Unit 4 Gas
Northern Block 3 F.O.
MG Unit 5-6 Gas
Northern Block 4 F.O.
GTPS FSD 5-9 Gas
HSD
Northern Block 5 F.O.
SPS FSD 1-2 Gas
Northern Block 6 HSD
GTPS FSD 1-4 Gas
HSD
Northern Block 7 F.O.
NGPS Multan 1-4 Gas
Northern Block 8 F.O.
Northern Toal
GENCO IV Capacity MW Jul Aug Sep Oct Nov Dec Jan Feb Mar Apr May Jun Total
Lakhra Power Coal
GENCO IV TOTAL
GENCOs Total
IPPs
Kot Addu Block 1 F.O.
Gas
HSD
Kot Addu Block 2 F.O.
Gas
HSD
Kot Addu Block 3 Gas
HSD
Kot Addu Total
Page 12 of Form PPP 7

Power Producer Fuel Capacity MW Jul Aug Sep Oct Nov Dec Jan Feb Mar Apr May Jun Total
Hub Power F.O.
Kohinoor Energy F.O.
AES Lalpir F.O.
AES Pakgen F.O.
Southern Power F.O.
Habibullah Gas
Fauji Kabirwala Gas
Rousch Gas
Saba Power F.O.
Japan Power F.O.
Uch Gas
Altern Gas
Liberty Gas
F.O.
Chashma Nuclear Nuclear
Chashma Nuclear-II Nuclear
Tavanir Iran Import
Attock Gen. F.O.
Atlas Power F.O.
Nishat Power F.O.
Foundation Gas
Orient Power Gas
" HSD
Nishat Chunia F.O.
Saif Power Gas
HSD
Engro Gas
Sapphire Power Gas
HSD
Hallmore Gas
HSD
Hubco Narowal F.O.
IPPs Total
Others Capacity MW Jul Aug Sep Oct Nov Dec Jan Feb Mar Apr May Jun Total
TPS-Quetta Gas
TPS-Shahdara Gas
SPPs Mixed
Zorlu Wind
Others Total
Grand Total
Hydel
Coal
HSD
F.O.
Gas
Nuclear
Mixed
Import from Iran
Wind Power
Grand Total
NTDC Losses
Net Delivered
NTDC Losses %Page 13 of Form PPP 7

NATIONAL ELECTRIC POWER REGULATORY AUTHORITY (NEPRA) Form # - PPP 8
LAST THREE YEARS ACTUAL GENERATION IN GWhs
FY ______________
The actual generation data of last three years is compiled on the below format for each year to perform comparison with the projection
GWh
Power Producer Fuel Capacity MW Jul Aug Sep Oct Nov Dec Jan Feb Mar Apr May Jun Total
Hydroelectric Hydel
Tarbela Hydel
Mangla Hydel
Warsak Hydel
Chashma Hydel
Ghazi Brotha Hydel
Jagran Hydel Hydel
Malakund-III SHYDO Hydel
Pehur Hydel
Khan Khawar Hydel
Gomal Zam Dam, Hydel
Laraib Hydel
Satpara Dam Hydel
Duber Khwar Hydel
Allai Khwar Hydel
Jihhah Hydropower Hydel
Hydel Total
Capacity MW Jul Aug Sep Oct Nov Dec Jan Feb Mar Apr May Jun Total
Ex-WAPDA GENCOs
GENCO-1
Jamshoro Block 1 F.O.
Unit 1 Gas
Jamshoro Block 2 F.O.
Unit 2-4 Gas
Jamshoro Block 3 F.O.
Kotry 3-7 Gas
Jamshoro Block 4 F.O.
Kotry 1-2 Gas
Jamshoro Total
GENCO-II Capacity MW Jul Aug Sep Oct Nov Dec Jan Feb Mar Apr May Jun Total
Central Block 1 F.O.
Guddu CC 11-13 Gas
Central Block 2 F.O.
Guddu CC 5-10 Gas
Central Block 3 F.O.
Guddu Steam 3-4 Gas
Central Block 4 F.O.
Guddu Steam 1-2 Gas
Central Total
Page 14 of Form PPP 8

Power Producer Fuel Capacity MW Jul Aug Sep Oct Nov Dec Jan Feb Mar Apr May Jun Total
GENCO-III
Northern Block 1 F.O.
MG Unit 1-3 Gas
Northern Block 2 F.O.
MG Unit 4 Gas
Northern Block 3 F.O.
MG Unit 5-6 Gas
Northern Block 4 F.O.
GTPS FSD 5-9 Gas
HSD
Northern Block 5 F.O.
SPS FSD 1-2 Gas
Northern Block 6 HSD
GTPS FSD 1-4 Gas
HSD
Northern Block 7 F.O.
NGPS Multan 1-4 Gas
Northern Block 8 F.O.
Northern Toal
GENCO IV Capacity MW Jul Aug Sep Oct Nov Dec Jan Feb Mar Apr May Jun Total
Lakhra Power Coal
GENCO IV TOTAL
GENCOs Total
IPPs Capacity MW Jul Aug Sep Oct Nov Dec Jan Feb Mar Apr May Jun Total
Kot Addu Block 1 F.O.
Gas
HSD
Kot Addu Block 2 F.O.
Gas
HSD
Kot Addu Block 3 Gas
HSD
Kot Addu Total
Page 15 of Form PPP 8

Power Producer Fuel Capacity MW Jul Aug Sep Oct Nov Dec Jan Feb Mar Apr May Jun Total
Hub Power F.O.
Kohinoor Energy F.O.
AES Lalpir F.O.
AES Pakgen F.O.
Southern Power F.O.
Habibullah Gas
Fauji Kabirwala Gas
Rousch Gas
Saba Power F.O.
Japan Power F.O.
Uch Gas
Altern Gas
Liberty Gas
F.O.
Chashma Nuclear Nuclear
Chashma Nuclear-II Nuclear
Tavanir Iran Import
Attock Gen. F.O.
Atlas Power F.O.
Nishat Power F.O.
Foundation Gas
Orient Power Gas
HSD
Nishat Chunia F.O.
Saif Power Gas
HSD
Engro Gas
Sapphire Power Gas
HSD
Hallmore Gas
HSD
Hubco Narowal F.O.
IPPs Total
Others Capacity MW Jul Aug Sep Oct Nov Dec Jan Feb Mar Apr May Jun Total
TPS-Quetta Gas
TPS-Shahdara Gas
SPPs Mixed
Zorlu Wind
Others Total
Grand Total
Hydel Capacity MW Jul Aug Sep Oct Nov Dec Jan Feb Mar Apr May Jun Total
Coal
HSD
F.O.
Gas
Nuclear
Mixed
Import from Iran
Wind PowerGrand Total
NTDC Losses
Net Delivered
NTDC Losses %Page 16 of Form PPP 8

NATIONAL ELECTRIC POWER REGULATORY AUTHORITY (NEPRA) Form # - PPP 9
LAST THREE YEARS ACTUAL COST IN Rs.
FY ______________
Power Producer Fuel
Total
Generation in
GWh
Energy
Charge
Fuel
Rs./kWh
Energy
Charge-
VO&M
Rs./kWh
Energy
Charge fuel
Rs.Million
Energy
Charge-
VO&M
Rs.Million
Total Energy
Charge
Rs.Million
Average Fuel
Charge
Rs./kWh
Hydroelectric Hydel
Tarbela Hydel
Mangla Hydel
Warsak Hydel
Chashma Hydel
Ghazi Brotha Hydel
Jagran Hydel Hydel
Malakund-III SHYDO Hydel
Pehur Hydel
Khan Khawar Hydel
Gomal Zam Dam, Hydel
Laraib Hydel
Satpara Dam Hydel
Duber Khwar Hydel
Allai Khwar Hydel
Jihhah Hydropower Hydel
Hydel Total
Ex-WAPDA GENCOs
GENCO-1
Jamshoro Block 1 F.O.
Unit 1 Gas
Jamshoro Block 2 F.O.
Unit 2-4 Gas
Jamshoro Block 3 F.O.
Kotry 3-7 Gas
Jamshoro Block 4 F.O.
Kotry 1-2 Gas
Jamshoro Total
GENCO-II
Central Block 1 F.O.
Guddu CC 11-13 Gas
Central Block 2 F.O.
Guddu CC 5-10 Gas
Central Block 3 F.O.
Guddu Steam 3-4 Gas
Central Block 4 F.O.
Guddu Steam 1-2 Gas
Central Total
The actual cost of generation data of last three years is compiled on the below format for each year to perform comparison with the
projection
Page 17 of Form PPP 9

Power Producer Fuel
Total
Generation in
GWh
Energy
Charge
Fuel
Rs./kWh
Energy
Charge-
VO&M
Rs./kWh
Energy
Charge fuel
Rs.Million
Energy
Charge-
VO&M
Rs.Million
Total Energy
Charge
Rs.Million
Average Fuel
Charge
Rs./kWh
GENCO-III
Northern Block 1 F.O.
MG Unit 1-3 Gas
Northern Block 2 F.O.
MG Unit 4 Gas
Northern Block 3 F.O.
MG Unit 5-6 Gas
Northern Block 4 F.O.
GTPS FSD 5-9 Gas
HSD
Northern Block 5 F.O.
SPS FSD 1-2 Gas
Northern Block 6 HSD
GTPS FSD 1-4 Gas
HSD
Northern Block 7 F.O.
NGPS Multan 1-4 Gas
Northern Block 8 F.O.
Northern Toal
GENCO IV
Lakhra Power Coal
GENCO IV TOTAL
GENCOs Total
IPPs
Kot Addu Block 1 F.O.
Gas
HSD
Kot Addu Block 2 F.O.
Gas
HSD
Kot Addu Block 3 Gas
HSD
Kot Addu Total
Page 18 of Form PPP 9

Power Producer Fuel
Total
Generation in
GWh
Energy
Charge
Fuel
Rs./kWh
Energy
Charge-
VO&M
Rs./kWh
Energy
Charge fuel
Rs.Million
Energy
Charge-
VO&M
Rs.Million
Total Energy
Charge
Rs.Million
Average Fuel
Charge
Rs./kWh
Hub Power F.O.
Kohinoor Energy F.O.
AES Lalpir F.O.
AES Pakgen F.O.
Southern Power F.O.
Habibullah Gas
Fauji Kabirwala Gas
Rousch Gas
Saba Power F.O.
Japan Power F.O.
Uch Gas
Altern Gas
Liberty Gas
F.O.
Chashma Nuclear Nuclear
Chashma Nuclear-II Nuclear
Tavanir Iran Import
Attock Gen. F.O.
Atlas Power F.O.
Nishat Power F.O.
Foundation Gas
Orient Power Gas
HSD
Nishat Chunia F.O.
Saif Power Gas
HSD
Engro Gas
Sapphire Power Gas
HSD
Hallmore Gas
HSD
Hubco Narowal F.O.
IPPs Total
Others
TPS-Quetta Gas
TPS-Shahdara Gas
SPPs Mixed
Zorlu Wind
Others Total
Grand Total
Hydel
Coal
HSD
F.O.
Gas
Nuclear
Mixed
Import from Iran
Wind Power
Grand Total
Page 19 of Form PPP 9

NATIONAL ELECTRIC POWER REGULATORY AUTHORITY (NEPRA) Form # - PPP 10
PROJECTION OF PPP FOR Distribution Companies
FY ___________
Energy Sold - GWh
Name Jul Aug Sep Oct Nov Dec Jan Feb Mar Apr May Jun Total
IESCO
LESCO
GEPCO
FESCO
MEPCO
PESCO
TESCO
HESCO
QESCO
SEPCO
KESC
Total
Maximum Demand in MW
Name Jul Aug Sep Oct Nov Dec Jan Feb Mar Apr May Jun Total
IESCO
LESCO
GEPCO
FESCO
MEPCO
PESCO
TESCO
HESCO
QESCO
SEPCO
KESC
Total - - - - - - - - - - - - -
Load Factor
Name Jul Aug Sep Oct Nov Dec Jan Feb Mar Apr May Jun Total
IESCO
LESCO
GEPCO
FESCO
MEPCO
PESCO
TESCO
HESCO
QESCO
SEPCO
KESC
Total
Energy Purchase Price Rs./kWh
Name Jul Aug Sep Oct Nov Dec Jan Feb Mar Apr May Jun Average
IESCO
LESCO
GEPCO
FESCO
MEPCO
PESCO
TESCO
HESCO
QESCO
SEPCO
KESC
Total
Page 20 of Form PPP 10