national earth and environmental science
TRANSCRIPT

David Heffernan • Rob Mahon
NATIONAL EARTH AND ENVIRONMENTAL SCIENCE
Unit 2 Earth Processes: Energy Transfers and Transformations

© Science Press 2015
Science PressBag 7023 Marrickville NSW 1475 AustraliaTel: (02) 9516 1122 Fax: (02) 9550 [email protected]
All rights reserved. No part of this publication may be reproduced, stored in a retrieval system, or transmitted in any form or by any means, electronic, mechanical, photocopying, recording or otherwise, without the prior permission of Science Press. ABN 98 000 073 861

Earth Processes: Energy Transfers and Transformations iiiScience Press
Surfing National Earth and Environmental Science
Contents
Use the table of contents to record your progress through this book. As you complete each chapter, write the date completed, then tick one of the three remaining columns to guide your revision for later. The column headers use the following codes:
?? = Don’t understand this very well at all. RR = Need to revise this. OK = Know this.
Page Date ?? RR OK
Introduction iv
Words to Watch iv
Energy for Earth Processes
1 Energy and the Earth 1
2 Sources of Energy 3
3 Science Skills: Graphing 6
4 Energy from the Sun 7
5 Science Skills: Design an Experiment 9
6 The Development of Plate Tectonic Theory
10
7 Science Skills: Dealing with Disbelief 12
8 Evidence for Plate Movement 13
9 How Plates Move 18
10 Measuring Plate Movements 21
11 Plate Interactions 23
Energy for Atmospheric and Hydrological Processes
12 Solar Energy and the Earth 27
13 Science Skills: Heating Sand and Water
29
14 Atmospheric Ozone 30
15 The Greenhouse Effect 32
16 State of the Climate 35
17 Atmospheric Circulation 36
18 Ocean Currents 39
19 Global Weather Patterns 42
20 Predicting the Weather 45
Page Date ?? RR OK
Energy for Biogeochemical Processes
21 Net primary Production 48
22 Carrying Capacity 52
23 Science Skills: Measuring Populations
55
24 Biogeochemical Cycling 56
25 The Carbon Cycle 60
26 Science Skills: Flow Charts and Diagrams
64
27 Science skills: Maps and Graphs 65
Topic Test 66
Answers 67
Index 79

Earth Processes: Energy Transfers and TransformationsivScience Press
Surfing National Earth and Environmental Science
Introduction
Each book in the Surfing series contains a summary, with occasional more detailed sections, of all the mandatory parts of the syllabus, along with questions and answers.
All types of questions – multiple choice, short response, structured response and free response – are provided. Questions are written in exam style so that you will become familiar with the concepts of the topic and answering questions in the required way.
Answers to all questions are included.
A topic test at the end of the book contains an extensive set of summary questions. These cover every aspect of the topic, and are useful for revision and exam practice.
Words To Watch
account, account for State reasons for, report on, give an account of, narrate a series of events or transactions.
analyse Interpret data to reach conclusions.
annotate Add brief notes to a diagram or graph.
apply Put to use in a particular situation.
assess Make a judgement about the value of something.
calculate Find a numerical answer.
clarify Make clear or plain.
classify Arrange into classes, groups or categories.
comment Give a judgement based on a given statement or result of a calculation.
compare Estimate, measure or note how things are similar or different.
conctruct Represent or develop in graphical form.
contrast Show how things are different or opposite.
create Originate or bring into existence.
deduce Reach a conclusion from given information.
define Give the precise meaning of a word, phrase or physical quantity.
demonstrate Show by example.
derive Manipulate a mathematical relationship(s) to give a new equation or relationship.
describe Give a detailed account.
design Produce a plan, simulation or model.
determine Find the only possible answer.
discuss Talk or write about a topic, taking into account different issues or ideas.
distinguish Give differences between two or more different items.
draw Represent by means of pencil lines.
estimate Find an approximate value for an unknown quantity.
evaluate Assess the implications and limitations.
examine Inquire into.
explain Make something clear or easy to understand.
extract Choose relevant and/or appropriate details.
extrapolate Infer from what is known.
hypothesise Suggest an explanation for a group of facts or phenomena.
identify Recognise and name.
interpret Draw meaning from.
investigate Plan, inquire into and draw conclusions about.
justify Support an argument or conclusion.
label Add labels to a diagram.
list Give a sequence of names or other brief answers.
measure Find a value for a quantity.
outline Give a brief account or summary.
plan Use strategies to develop a series of steps or processes.
predict Give an expected result.
propose Put forward a plan or suggestion for consideration or action.
recall Present remembered ideas, facts or experiences.
relate Tell or report about happenings, events or circumstances.
represent Use words, images or symbols to convey meaning.
select Choose in preference to another or others.
sequence Arrange in order.
show Give the steps in a calculation or derivation.
sketch Make a quick, rough drawing of something.
solve Work out the answer to a problem.
state Give a specific name, value or other brief answer.
suggest Put forward an idea for consideration.
summarise Give a brief statement of the main points.
synthesise Combine various elements to make a whole.

Earth Processes: Energy Transfers and Transformations 1Science Press
Surfing National Earth and Environmental Science
1 Energy and the Earth
Energy can be neither created nor destroyed. However, it can be transformed – changed from one form to another. Some of the main types of energy are listed in Table 1.1.
Figure 1.1 Energy in an erupting volcano differs from the Sun’s energy used by plants.
Transforming energy
Moving objects have kinetic energy. When a volcano throws stones into the atmosphere, the moving stones have kinetic energy (Figure 1.1). Thermal (or heat) energy from within the Earth is transformed into kinetic energy. As the stone gains height, the kinetic energy is transformed into gravitational potential energy – energy due to its height in the Earth’s gravitational field. As the stone falls back to the Earth the gravitational potential energy is transformed back into kinetic energy as it gains speed.
Inside the Sun, nuclear energy is transformed into light energy and thermal energy (Figure 1.2). The process involved nuclear fusion. The thermal energy from the Sun then evaporates water from the Earth and is transformed
Figure 1.2 Energy being transformed. In the Sun, nuclear energy is transformed into light energy and thermal energy.
into gravitational potential energy as the water vapour rises into the atmosphere. When the water falls to the Earth, the gravitational potential energy is transformed into the kinetic energy of falling raindrops and then kinetic energy of a flowing stream as it erodes away the stream bank.
Table 1.1 Types of energy.
Type of energy Description Examples
Chemical Energy stored in chemicals
Photosynthesis stores energy in plant matter
Elastic potential Energy stored in bending rocks
Energy stored along fault lines that can be released in an earthquake
Electrical Energy due to an electric current
Lightning
Gravitational potential Energy stored due to height in a planet’s gravity
Rocks on a hillside; rain in a cloud
Kinetic Energy due to motion Falling rock; flowing stream
Light Energy in particles of light
Light from the Sun or a volcanic eruption
Thermal Heat energy Energy from the Sun or released in volcanic eruptions

Earth Processes: Energy Transfers and Transformations2Science Press
Surfing National Earth and Environmental Science
Transferring energy
Energy can be transferred from one object to another. As water flows along a stream it has kinetic energy (Figure 1.3a). It may pick up sand grains and carry them along. The kinetic energy of the flowing water has been transferred to the sand grains.
(a)
(b)
Figure 1.3 Energy being transferred. (a) A stream transfers kinetic energy to sand grains. (b) Kinetic energy of the wind is transferred to the blades of a windmill.
Alternative energy sources can involve both transferring and transforming. In the case of windmills being used to generate electricity (Figure 1.3b), kinetic energy of the wind is transferred to the rotating blades. This kinetic energy is then transformed into electrical energy by a generator attached to the rotating blades.
QUESTIONS
1. Define kinetic energy.2. Identify the two ways in which nuclear energy can
be transformed inside the Sun.3. Identify the two sources of the Earth’s internal
energy.4. Identify the three ways energy can be transferred.5. Describe how energy can be destroyed.6. Distinguish between gravitational potential energy
and elastic potential energy.7. Identify the energy transformations that occur as
raindrops form in a cloud and then fall to the Earth’s surface.
8. Explosives are used in mining to shatter rocks so that they can be processed to extract the mineral content. Identify the energy transformations and transfers that take place during the explosion.
9. You are walking along a beach on a windy day. Using the concepts of transferring and transforming of energy, explain why the sand can hurt the legs.
10. Molten lava from a volcano is flowing into the sea, where it is cooled creating lots of steam (Figure 1.4). The lava then solidifies. Describe any energy transfers or transformations that take place during this process.
Figure 1.4 Molten lava enters the sea. What energy transfers and transformations occur here?

Earth Processes: Energy Transfers and Transformations 3Science Press
Surfing National Earth and Environmental Science
2 Sources of Energy
Energy from the Sun
Energy from the Sun is needed for life on Earth to exist. Photosynthesis traps the Sun’s energy and stores it in the chemical bonds of organic molecules. Water is combined with carbon dioxide to produce oxygen and sugars. The plant then converts these sugar molecules into plant matter that serves as food for animals and humans alike (Figure 2.1).
Figure 2.1 Energy from the Sun. Rainfall is needed for rainbows, the water being evaporated by the Sun. The Sun also provides energy for plants to grow.
The Sun’s energy is also needed to move water through the water cycle. It also powers transpiration as water moves through plants (Figure 2.1). The Sun’s energy is needed for winds to blow and for ocean currents to flow.
Energy from the Earth
Earth processes also involve energy. That the interior of the Earth is a source of thermal energy is easily seen in volcanic eruptions (Figure 2.2 (a)). Not only are ash and rocks thrown into the atmosphere, but red-hot lava
can sometimes be seen flowing down the volcano. Hot thermal springs also show rocks beneath the ground are hot (Figure 2.2 (b)). Some very deep mines, such as a 3.9 km deep mine in South Africa, have to be air conditioned so that the miners can work. Rocks become hotter as we go deeper into the Earth.
(a)
(b)
Figure 2.2 Heat from inside the Earth. (a) Hot flowing lava brings heat from inside the Earth. (b) Pohutu Geyser forms when water seeps into the Earth where it is heated and boils before rising to the surface.

Earth Processes: Energy Transfers and Transformations4Science Press
Surfing National Earth and Environmental Science
The puzzle is to explain where this energy is coming from. Some of the heat comes from how the Earth was formed. The Earth and other planets are the result of the combining of separate rocks orbiting the Sun (Figure 2.3). The more rocks that clumped together the Earth increased in size and mass. This meant that its gravity also grew and attracted a hail of meteorites. This period of meteorite bombardment melted the rocks of the young Earth and allowed the molten ingredients to differentiate according to density. The densest materials, such as iron and nickel, sank to the centre while the less dense materials, such as oxides and sulfides, were pushed to the surface. The Earth began to cool and formed a solid surface, but the centre remained hot.
Figure 2.3 Formation of the Solar System. The Earth and other planets are the result of the accretion of rocks orbiting the Sun.
The other main source of energy is from radioactivity (Figure 2.4). During this process, radioactive particles are emitted from a nucleus and nuclear energy is transformed into thermal energy. This energy then moves towards the Earth’s surface where it is transformed into kinetic, light and thermal energy during volcanic eruptions and earthquakes. It is estimated that more than half of the heat reaching the surface now comes from radioactive sources.
Parentnucleus
Daughternucleus
Parentnucleus
Daughternucleus
Particle
Gammaray
Figure 2.4 Radioactive decay. Three types of radioactive decay release energy.
Geothermal energy
The Earth’s internal energy – geothermal energy – is put to use in a positive way to provide heating and to generate electricity. The major advantage of geothermal energy is the low carbon emissions and the low environmental impacts. It also helps make a country less dependent on energy imports.
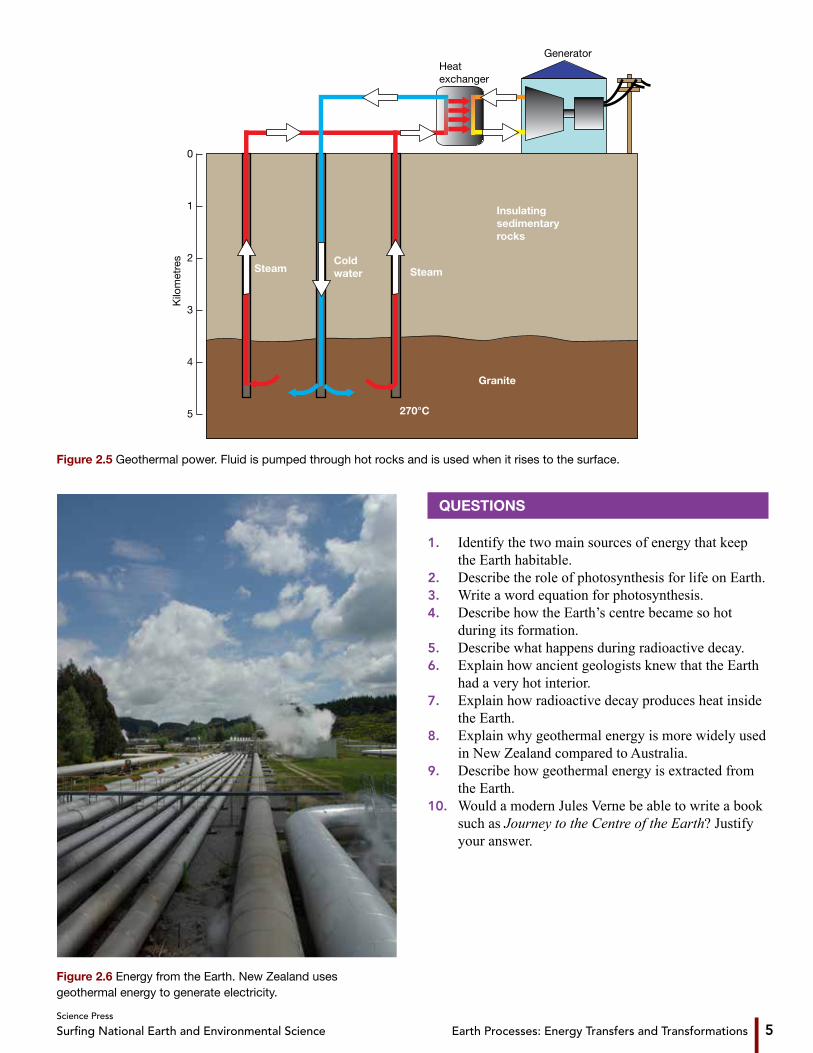
Geothermal systems involve a heat source – usually hot permeable rocks close to the surface (Figure 2.5). In some areas the underground rocks need to be fractured so that there are gaps between the fragments (called fracking). Water or other fluids are pumped through these gaps and in the process is heated. When this water rises to the surface it can be used to provide heat.
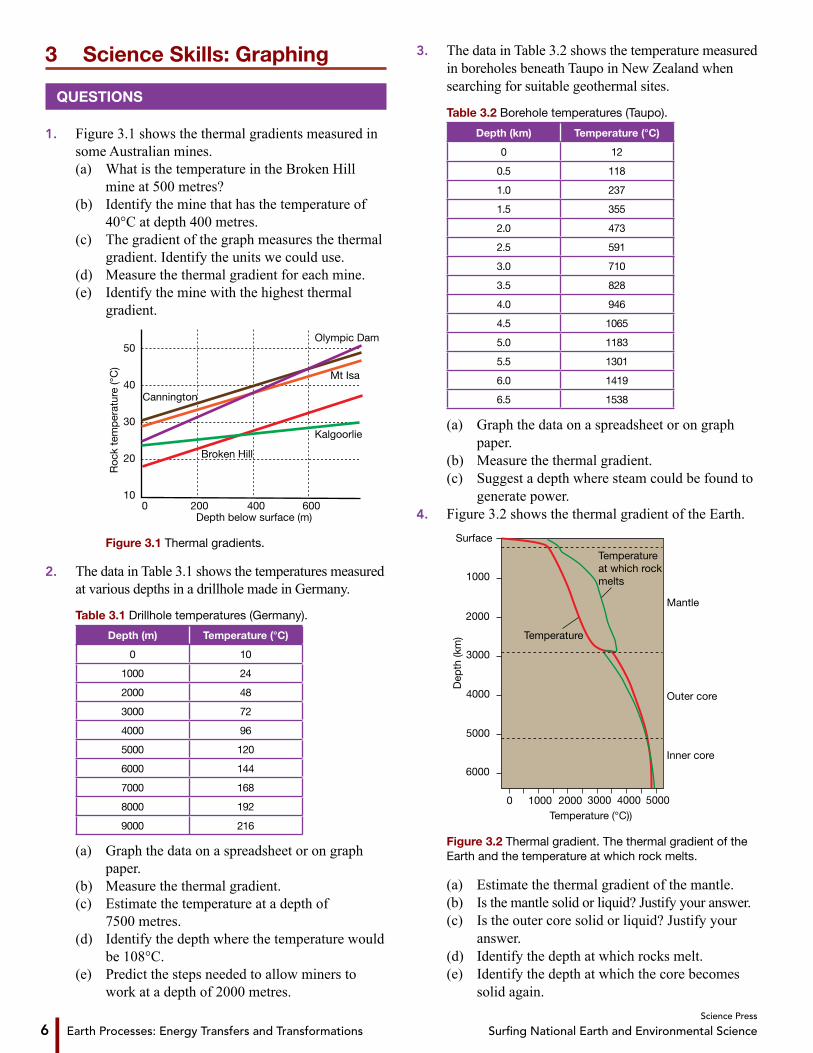
In some parts of the world, geothermal energy is used to heat homes, and to heat greenhouses for the growing of vegetables, fruits and flowers. New Zealand has used geothermal energy sources to heat hotels and other buildings for many decades, and to generate electricity since 1958 (Figure 2.6). New Zealand has many volcanic areas where there are very hot rocks relatively close to the surface.
Australia has no volcanic activity but there are a number of ‘hotspots’ where very hot rocks are relatively close to the surface. At present, drilling technology is limited to around 5 kilometres deep. At this depth in the Cooper Basin of Central Australia, the rocks are around 250°C. Water piped down to these rocks is turned into steam. When it returns to the surface it can be used to generate electricity. Demonstration projects are running and hope to become commercial.
Earth Processes: Energy Transfers and Transformations 5Science Press
Surfing National Earth and Environmental Science
0
1
2
3
4
5
Kilo
met
res
Heatexchanger
Generator
270°C
Granite
Insulatingsedimentaryrocks
SteamSteamColdwater
Figure 2.5 Geothermal power. Fluid is pumped through hot rocks and is used when it rises to the surface.
QUESTIONS
1. Identify the two main sources of energy that keep the Earth habitable.
2. Describe the role of photosynthesis for life on Earth.3. Write a word equation for photosynthesis.4. Describe how the Earth’s centre became so hot
during its formation.5. Describe what happens during radioactive decay. 6. Explain how ancient geologists knew that the Earth
had a very hot interior.7. Explain how radioactive decay produces heat inside
the Earth.8. Explain why geothermal energy is more widely used
in New Zealand compared to Australia.9. Describe how geothermal energy is extracted from
the Earth.10. Would a modern Jules Verne be able to write a book
such as Journey to the Centre of the Earth? Justify your answer.
Figure 2.6 Energy from the Earth. New Zealand uses geothermal energy to generate electricity.
Earth Processes: Energy Transfers and Transformations6Science Press
Surfing National Earth and Environmental Science
3 Science Skills: Graphing
QUESTIONS
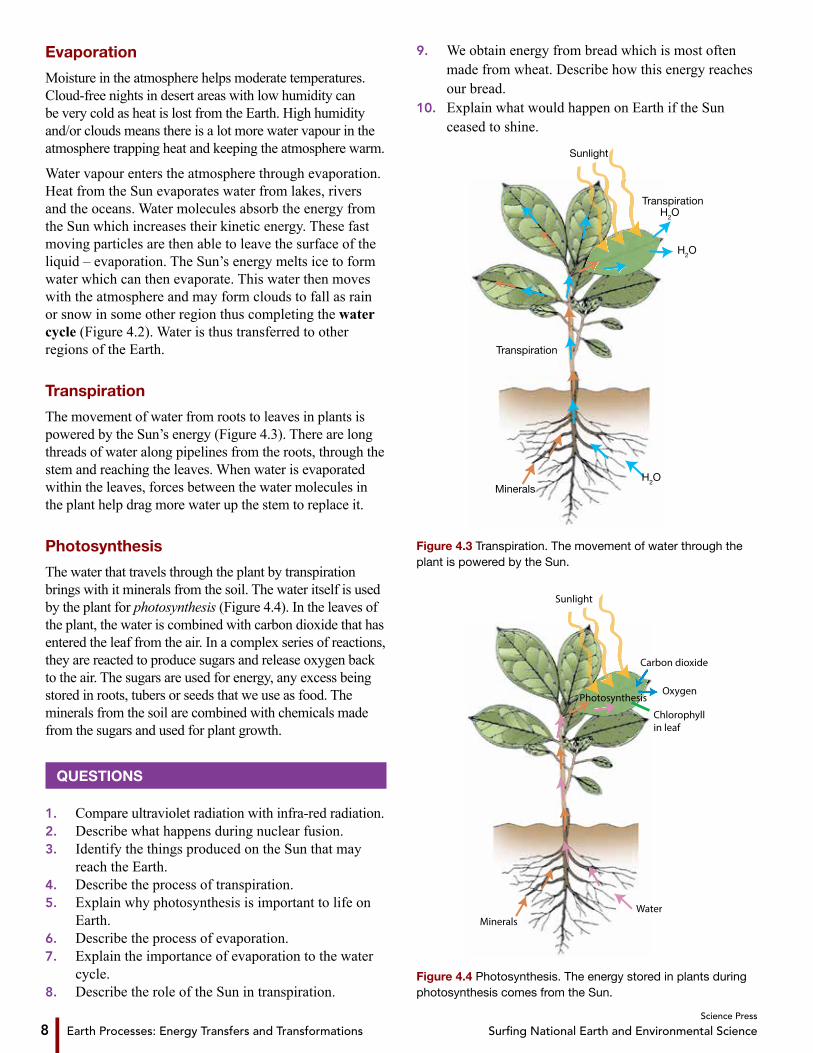
1. Figure 3.1 shows the thermal gradients measured in some Australian mines.
(a) What is the temperature in the Broken Hill mine at 500 metres?
(b) Identify the mine that has the temperature of 40°C at depth 400 metres.
(c) The gradient of the graph measures the thermal gradient. Identify the units we could use.
(d) Measure the thermal gradient for each mine. (e) Identify the mine with the highest thermal
gradient.
Depth below surface (m)
Roc
k te
mp
erat
ure
(°C
)
0 200 400 60010
20
30
40
50Olympic Dam
Cannington
Broken Hill
Kalgoorlie
Mt Isa
Figure 3.1 Thermal gradients.
2. The data in Table 3.1 shows the temperatures measured at various depths in a drillhole made in Germany.
Table 3.1 Drillhole temperatures (Germany).
Depth (m) Temperature (°C)
0 10
1000 24
2000 48
3000 72
4000 96
5000 120
6000 144
7000 168
8000 192
9000 216
(a) Graph the data on a spreadsheet or on graph paper.
(b) Measure the thermal gradient. (c) Estimate the temperature at a depth of
7500 metres. (d) Identify the depth where the temperature would
be 108°C. (e) Predict the steps needed to allow miners to
work at a depth of 2000 metres.
3. The data in Table 3.2 shows the temperature measured in boreholes beneath Taupo in New Zealand when searching for suitable geothermal sites.
Table 3.2 Borehole temperatures (Taupo).
Depth (km) Temperature (°C)
0 12
0.5 118
1.0 237
1.5 355
2.0 473
2.5 591
3.0 710
3.5 828
4.0 946
4.5 1065
5.0 1183
5.5 1301
6.0 1419
6.5 1538
(a) Graph the data on a spreadsheet or on graph paper.
(b) Measure the thermal gradient. (c) Suggest a depth where steam could be found to
generate power.4. Figure 3.2 shows the thermal gradient of the Earth.
Surface
1000
1000
2000
2000
3000
3000
4000
4000
5000
5000
6000
Dep
th (k
m)
Mantle
Outer core
Inner core
Temperature
Temperatureat which rockmelts
Temperature (°C))0
Figure 3.2 Thermal gradient. The thermal gradient of the Earth and the temperature at which rock melts.
(a) Estimate the thermal gradient of the mantle. (b) Is the mantle solid or liquid? Justify your answer. (c) Is the outer core solid or liquid? Justify your
answer. (d) Identify the depth at which rocks melt. (e) Identify the depth at which the core becomes
solid again.

Earth Processes: Energy Transfers and Transformations 7Science Press
Surfing National Earth and Environmental Science
4 Energy from the Sun
The Sun’s energy
The Sun’s energy is produced by nuclear fusion (Figure 1.2). In the centre of the Sun, there are huge pressures, as well as enormous temperatures of more than 15 000 000°C. These cause hydrogen nuclei to travel so fast that, when they collide with each other, they fuse together to form helium nuclei. The energy released during this process moves slowly to the surface of the Sun where the temperature is around 5500°C.
The energy released from the Sun is mostly in the form of electromagnetic radiation. The electromagnetic spectrum (Figure 4.1) allows us to see the many types of radiation that differ in their wavelength. Of the radiation
that reaches Earth, the short wavelength ultraviolet light can be dangerous. Infra-red (heat) radiation has a longer wavelength and is what mainly warms the Earth.
The Sun also emits many charged particles such as protons and electrons – the solar wind. The Earth is surrounded by a magnetic field that protects us from such particles. The energy from these particles is minor.
The effects of heat
Apart from helping keep the Earth at a comfortable temperature, the Sun’s energy is important in the hydrological cycle (water cycle) – melting ice, evaporating water and transpiration. Photosynthesis stores energy from the Sun in plants and their products that pass along food chains keeping us all alive.
Frequency (Hz)
10410210–210–410–610–810–1010–12 1
Gammarays
X-rays Ultra-violet
Infra-red Microwaves Radio waves
Wavelength (metres)
10181020 1015 5 x 10¹⁴ 1013 1010 108 106
Vis
ible
0
100
200
300
400
Alti
tud
e (k
m)
Atmosphere
Figure 4.1 The Sun’s electromagnetic spectrum. Radiation from the Sun varies in wavelength. Only some wavelengths reach the surface of the Earth.
Evaporation Precipitation
Transportover land
Run-off
Evaporation
Ocean
In sedimentaryrocks near surface
Precipitation
Figure 4.2 The water cycle. Heat from the Sun powers the water cycle.
Earth Processes: Energy Transfers and Transformations8Science Press
Surfing National Earth and Environmental Science
Evaporation
Moisture in the atmosphere helps moderate temperatures. Cloud-free nights in desert areas with low humidity can be very cold as heat is lost from the Earth. High humidity and/or clouds means there is a lot more water vapour in the atmosphere trapping heat and keeping the atmosphere warm.
Water vapour enters the atmosphere through evaporation. Heat from the Sun evaporates water from lakes, rivers and the oceans. Water molecules absorb the energy from the Sun which increases their kinetic energy. These fast moving particles are then able to leave the surface of the liquid – evaporation. The Sun’s energy melts ice to form water which can then evaporate. This water then moves with the atmosphere and may form clouds to fall as rain or snow in some other region thus completing the water cycle (Figure 4.2). Water is thus transferred to other regions of the Earth.
Transpiration
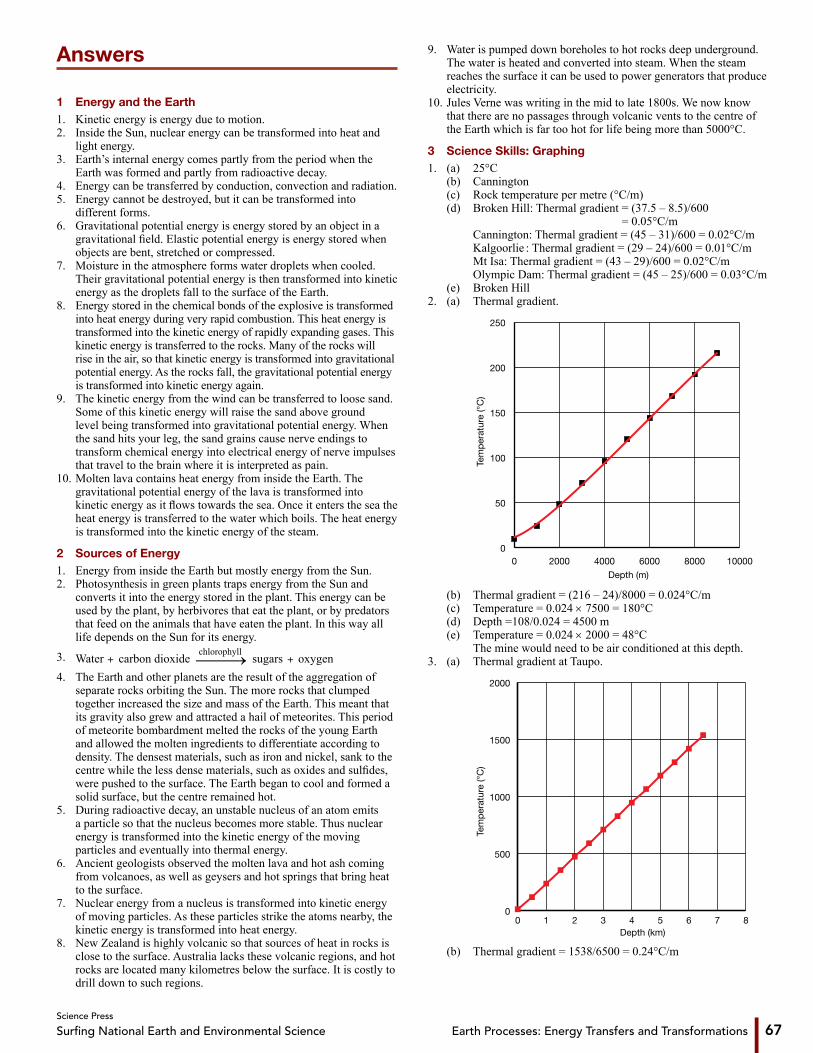
The movement of water from roots to leaves in plants is powered by the Sun’s energy (Figure 4.3). There are long threads of water along pipelines from the roots, through the stem and reaching the leaves. When water is evaporated within the leaves, forces between the water molecules in the plant help drag more water up the stem to replace it.
Photosynthesis
The water that travels through the plant by transpiration brings with it minerals from the soil. The water itself is used by the plant for photosynthesis (Figure 4.4). In the leaves of the plant, the water is combined with carbon dioxide that has entered the leaf from the air. In a complex series of reactions, they are reacted to produce sugars and release oxygen back to the air. The sugars are used for energy, any excess being stored in roots, tubers or seeds that we use as food. The minerals from the soil are combined with chemicals made from the sugars and used for plant growth.
QUESTIONS
1. Compare ultraviolet radiation with infra-red radiation.2. Describe what happens during nuclear fusion.3. Identify the things produced on the Sun that may
reach the Earth.4. Describe the process of transpiration.5. Explain why photosynthesis is important to life on
Earth.6. Describe the process of evaporation.7. Explain the importance of evaporation to the water
cycle.8. Describe the role of the Sun in transpiration.
9. We obtain energy from bread which is most often made from wheat. Describe how this energy reaches our bread.
10. Explain what would happen on Earth if the Sun ceased to shine.
H2OMinerals
Sunlight
H2O
H2O
Transpiration
Transpiration
Figure 4.3 Transpiration. The movement of water through the plant is powered by the Sun.
Minerals
Sunlight
Carbon dioxide
Oxygen
Water
Photosynthesis
Chlorophyllin leaf
Figure 4.4 Photosynthesis. The energy stored in plants during photosynthesis comes from the Sun.

Earth Processes: Energy Transfers and Transformations 9Science Press
Surfing National Earth and Environmental Science
5 Science Skills: Design an Experiment
Latitude and the Sun
Antarctica receives 24 hours of daylight when it is tilted towards the Sun (21 December) and 24 hours of darkness or near darkness when it is tilted away from the Sun (21 June). Emma and Elyse wondered how a person’s latitude affected the amount of sunlight reaching the Earth’s surface. To find out they used a photovoltaic cell and a multimeter to measure the amount of sunlight reaching the Earth. They thought that the maximum intensity would be when the Sun was overhead. The equipment used is shown in Figure 5.1.
3.21
θ Multimeter
Solar cells
Figure 5.1 Experiment. Using a photovoltaic cell and multimeter to measure the sunlight reaching the Earth at various angles.
The data they collected is recorded in Table 5.1.
Table 5.1 Effect of angle on intensity of the Sun.
Angle Current (mA)
0° (flat on the ground) 2.5
15° 2.7
30° 2.8
45° 2.7
60° 2.4
75° 1.9
90° (vertical) 1.4
QUESTIONS
1. Identify their hypothesis.2. Identify the prediction they made about their results.3. List the equipment they needed.4. Identify the piece of equipment they needed that is
not shown in Figure 5.1.5. Identify any safety precautions needed.6. Identify the controlled and uncontrolled variables in
this experiment.7. Identify any experimental controls needed.
8. Using a spreadsheet or graph paper, graph the data using appropriately labelled axes.
9 Was their prediction correct?10. Explain why the maximum reading was around 30°
and not overhead.11. How could the experiment be improved?12. Design an experiment to find out the amount of
ambient light due to reflections from surrounding objects.
The Sun during the day
Emma and Elyse decided to see how the intensity of the Sun varied during the day. They thought it may be at a maximum around midday. They placed their solar cell and multimeter (Figure 5.2) flat on the ground in a place that received sunlight all day. They recorded their multimeter readings every hour.
3.21
MultimeterSolar cells
Figure 5.2 Experiment. Using a photovoltaic cell and multimeter to measure the sunlight reaching the Earth at various times.
The data they collected is recorded in Table 5.2.
Table 5.2 The intensity of the Sun during a day.
Time Current (mA)
9 am 20
10 am 23
11 am 26
12 noon 28
1 pm 27
2 pm 24
3 pm 21
QUESTIONS
1. Identify their hypothesis.2. Identify any safety precautions needed.3. Identify the controlled and uncontrolled variables in
this experiment.4. Identify any experimental controls needed.5. Using a spreadsheet or graph paper, graph the data
using appropriately labelled axes.6 Was their prediction correct?7. How could the experiment be improved?

Earth Processes: Energy Transfers and Transformations10Science Press
Surfing National Earth and Environmental Science
6 The Development of Plate Tectonic Theory
Prior to the mid-20th century, the prevailing scientific theory about how the Earth’s surface features formed was known as the cooling-earth hypothesis. It stated:
‘The Earth formed thousands of millions of years ago from the accretion of meteorites and other debris in space. This material was originally molten, giving the Earth a near perfectly smooth surface. As the Earth cooled a surface crust formed. As the cooling continued, the Earth shrunk from thermal contraction and the rigid crust became fractured and distorted as a result. This produced surface features such as ocean basins and mountain ranges.’
Figure 6.1 Buckled but rigid. The continents seem so solid that it is hard to believe they move.
Given the available evidence, this theory was a perfectly reasonable explanation. It meant that the crust, even though fractured and distorted, was quite rigid. The continents were fixed in position and did not move (Figure 6.1). However, a few scientists dared to challenge the established theory with very different ideas. Foremost among them was German scientist Alfred Wegener (1880-1930), the Australian Sam Carey (1911-2002) and the British scientist Arthur Holmes (1890-1965).
The theory of continental drift
Alfred Wegener was a man who mixed scientific research with high adventure (Figure 6.2). In 1905 Wegener obtained a PhD in planetary astronomy but soon devoted his time to the study of meteorology. In 1906 he made a record 52-hour balloon ride with his brother to study the upper atmosphere. He also made several winter crossings of Greenland on foot in temperatures below minus 50 degrees Celsius. It was during one of these expeditions that he lost his life.
During his career Wegener taught not only meteorology and astronomy but also geophysics, while studying palaeontology, biology and numerous other fields.
Figure 6.2 Alfred Wegener. He proposed the highly controversial theory of continental drift.
Wegener became an excellent example of the benefits of scientists having interdisciplinary experience and expertise, something which is now encouraged by universities. It was for his radical and highly controversial theory of continental drift that he is best remembered.
Matching continents
While Wegener recovered in hospital from a neck wound suffered as a soldier during World War I, he had ample time to ponder a geological puzzle that had been on his mind for years. He was fascinated by the fact that Africa and South America seem to fit perfectly, like two adjacent pieces of a jigsaw puzzle, despite being separated by thousands of kilometres of ocean (Figure 6.3).
Figure 6.3 Matching continents. In 1915 Wegener used diagrams similar to this modern reconstruction to show that Africa and South America seem to fit perfectly, like two adjacent pieces of a jigsaw puzzle.
Wegener was not the first to notice this curiosity and many other people had discussed this fact and its possible causes in the three centuries before Wegener.

Earth Processes: Energy Transfers and Transformations 11Science Press
Surfing National Earth and Environmental Science
Against the tide
Unlike those before him, Wegener collected evidence from a wide range of fields to support the idea that various continents were once joined but had drifted apart over time. He outlined his theory of continental drift in lectures at scientific meetings, in scientific journals and his 1915 book Die Enstehung der Kontinente und Ozeane (The Origins of Continents and Oceans).
Wegener’s radically different theory was greeted with almost universal hostility. Part of the reason was that he could not explain which forces could be capable of causing such movements. Two of the suggested possibilities – the Earth’s centrifugal force and the tidal pull of the Moon – were quickly proven by mathematicians to be impossible as they could not generate enough force to move entire continents around.
It was also correctly argued that it would be physically impossible for continents of granite to push through the solid ocean floor, like icebreakers pushing through ice sheets, without breaking up. Thus in the absence of an identified underlying mechanism, many scientists disregarded the wealth of supporting evidence collected by Wegener.
Undeterred by this criticism, Wegener spent the last 15 years of his life in pursuit of further evidence supporting his theory. At the time of his death in 1930, however, the continental drift theory was thought to be disproved by most geologists. It was considered to be professional suicide to publicly advocate continental drift.
Gathering more evidence
However, a few scientists, such as Australian geologist Sam Carey (1911-2002) and British geologist Arthur Holmes (1890-1965), still did so. Sam Carey was one of the first to investigate the geology of Papua New Guinea. As the evidence for the movement of continents began to accumulate, he proposed a mechanism caused by an expanding Earth. While this theory was later replaced by plate tectonics, many of the ideas that it contained have been retained.
Arthur Holmes was one of the first to make extensive use of dating rocks using their radioactive content – radiometric dating. Holmes in particular, developed the idea that convection currents in the Earth’s mantle were responsible for moving the continents. Holmes wrote one of the most influential textbooks of the time called Principles of Geology where he explained his ideas to new students in geology.
Figure 6.4 Sam Carey. Early supporter of Wegener’s theory of continental drift.
It was not long after Wegener’s death that new technologies enabled us to glimpse the terrain beneath the oceans for the first time. Many observations had been made during World War Two and as observations flooded in during the 1950s the evidence for continental drift began to mount. This additional evidence was vital to gain widespread acceptance of the continental drift theory in the 1960s.
QUESTIONS
1. Explain why scientists thought the Earth’s crust was rigid.
2. Describe the role of Alfred Wegener in the development of continental drift.
3. Describe one major piece of evidence Wegener gave in support of continental drift.
4. Explain what is meant by interdisciplinary research.5. Describe how Wegener communicated his theory to
other scientists.6. Identify an Australian geologist who was an early
supporter of continental drift.7. Identify the mechanism for moving the continents
proposed by Arthur Holmes.8. Explain why Arthur Holmes was able to influence
a new generation of geologists to support plate tectonics.
9. Why do you think young scientists are more open to new ideas?
10. Explain why continental drift was eventually accepted as a theory.

Earth Processes: Energy Transfers and Transformations12Science Press
Surfing National Earth and Environmental Science
7 Science Skills: Dealing with Disbelief
QUESTIONS
1. Read the extract from the science magazine Nature (4 September 2013) and answer the question.
Harold Jeffreys (1891-1989) was an eminent professor of astronomy at the University of Cambridge, UK. Jeffreys rejected continental drift in the 1920s and plate tectonics in the 1970s. He believed that the solid Earth was too rigid to permit mantle convection and crustal motion. His view had a strong mathematical basis, but it remained unchanged, even as evidence to the contrary mounted.
Write a short newspaper article presenting evidence that Harold Jeffreys was not correct.
Figure 7.1 Harold Jeffreys. Early opponent of Wegener’s theory of continental drift.
2. Here is a history of the main ideas of continental drift taken from the website astrochix.com. Read the text and answer the questions.The idea of ‘continental drift’ has a very long history with the first recorded comments by Abraham Ortelius in his 1596 Thesaurus Geographicus, in which he suggested that the continents had ‘torn’ away from each other, as a result of earthquakes and floods.
Unfortunately the idea wasn’t brought up again in any serious way again until the 1880s when Roberto Mantovani was working on an island in the Indian Ocean, and happened to observe volcanic fractures on the island. He realised that all continents may have gone through the same process globally, to create separate continents. He published his ideas in 1889 – but they didn’t generate an enormous amount of interest at the time.
Following on from Mantovani, William Henry Pickering, in 1907, speculated in his work ‘The Place of Origin of the Moon – The Volcanic Problems’, that forces pulled apart the continents of America, Asia and Africa. Pickering suggested the Moon was the cause of the moving continents.
In 1908 Frank Bursley Taylor, a wealthy American amateur geologist, noted the coincidence that the continents looked like they might once have been located together, and perhaps continents had moved around. He didn’t have a fully developed idea, and was not taken seriously.
(a) Identify the year that the idea continents can move was first proposed.
(b) Describe the evidence that Roberto Mantovani used to suggest that continents could break apart and move.
(c) Suggest why such ideas were not accepted. (d) Did Alfred Wegener originate the theory of
continental drift? Suggest why Wegener is given such credit.
(e) Imagine you are a journalist in the late 1920s when Alfred Wegener has proposed his theory of continental drift. Write the headlines and the leading two paragraphs reporting the theory.
3. One of the great geological problems of the late 1800s was the origin of mountains. The current theory was that the Earth was cooling and thus contracting. This caused the surface of the Earth to wrinkle on a grand scale.
(a) Explain why a contracting Earth was not able to explain the existence of mountains.
(b) Describe how Wegener’s continental drift could explain the origin of mountains.
(c) Outline why Wegener’s theory was initially rejected.
(d) Describe discoveries that showed that Wegener’s theory was correct.
Earth Processes: Energy Transfers and Transformations 67Science Press
Surfing National Earth and Environmental Science
Answers
1 Energy and the Earth1. Kinetic energy is energy due to motion.2. Inside the Sun, nuclear energy can be transformed into heat and
light energy.3. Earth’s internal energy comes partly from the period when the
Earth was formed and partly from radioactive decay.4. Energy can be transferred by conduction, convection and radiation.5. Energy cannot be destroyed, but it can be transformed into
different forms.6. Gravitational potential energy is energy stored by an object in a
gravitational field. Elastic potential energy is energy stored when objects are bent, stretched or compressed.
7. Moisture in the atmosphere forms water droplets when cooled. Their gravitational potential energy is then transformed into kinetic energy as the droplets fall to the surface of the Earth.
8. Energy stored in the chemical bonds of the explosive is transformed into heat energy during very rapid combustion. This heat energy is transformed into the kinetic energy of rapidly expanding gases. This kinetic energy is transferred to the rocks. Many of the rocks will rise in the air, so that kinetic energy is transformed into gravitational potential energy. As the rocks fall, the gravitational potential energy is transformed into kinetic energy again.
9. The kinetic energy from the wind can be transferred to loose sand. Some of this kinetic energy will raise the sand above ground level being transformed into gravitational potential energy. When the sand hits your leg, the sand grains cause nerve endings to transform chemical energy into electrical energy of nerve impulses that travel to the brain where it is interpreted as pain.
10. Molten lava contains heat energy from inside the Earth. The gravitational potential energy of the lava is transformed into kinetic energy as it flows towards the sea. Once it enters the sea the heat energy is transferred to the water which boils. The heat energy is transformed into the kinetic energy of the steam.
2 Sources of Energy1. Energy from inside the Earth but mostly energy from the Sun.2. Photosynthesis in green plants traps energy from the Sun and
converts it into the energy stored in the plant. This energy can be used by the plant, by herbivores that eat the plant, or by predators that feed on the animals that have eaten the plant. In this way all life depends on the Sun for its energy.
3. + +Water carbon dioxidechlorophyll
sugars oxygen4. The Earth and other planets are the result of the aggregation of
separate rocks orbiting the Sun. The more rocks that clumped together increased the size and mass of the Earth. This meant that its gravity also grew and attracted a hail of meteorites. This period of meteorite bombardment melted the rocks of the young Earth and allowed the molten ingredients to differentiate according to density. The densest materials, such as iron and nickel, sank to the centre while the less dense materials, such as oxides and sulfides, were pushed to the surface. The Earth began to cool and formed a solid surface, but the centre remained hot.
5. During radioactive decay, an unstable nucleus of an atom emits a particle so that the nucleus becomes more stable. Thus nuclear energy is transformed into the kinetic energy of the moving particles and eventually into thermal energy.
6. Ancient geologists observed the molten lava and hot ash coming from volcanoes, as well as geysers and hot springs that bring heat to the surface.
7. Nuclear energy from a nucleus is transformed into kinetic energy of moving particles. As these particles strike the atoms nearby, the kinetic energy is transformed into heat energy.
8. New Zealand is highly volcanic so that sources of heat in rocks is close to the surface. Australia lacks these volcanic regions, and hot rocks are located many kilometres below the surface. It is costly to drill down to such regions.
9. Water is pumped down boreholes to hot rocks deep underground. The water is heated and converted into steam. When the steam reaches the surface it can be used to power generators that produce electricity.
10. Jules Verne was writing in the mid to late 1800s. We now know that there are no passages through volcanic vents to the centre of the Earth which is far too hot for life being more than 5000°C.
3 Science Skills: Graphing1. (a) 25°C (b) Cannington (c) Rock temperature per metre (°C/m) (d) Broken Hill: Thermal gradient = (37.5 – 8.5)/600
= 0.05°C/m Cannington: Thermal gradient = (45 – 31)/600 = 0.02°C/m Kalgoorlie : Thermal gradient = (29 – 24)/600 = 0.01°C/m Mt Isa: Thermal gradient = (43 – 29)/600 = 0.02°C/m Olympic Dam: Thermal gradient = (45 – 25)/600 = 0.03°C/m (e) Broken Hill2. (a) Thermal gradient.
0 2000 4000 6000 8000 100000
50
100
150
200
250
Depth (m)
Tem
per
atur
e (°
C)
(b) Thermal gradient = (216 – 24)/8000 = 0.024°C/m (c) Temperature = 0.024 × 7500 = 180°C (d) Depth =108/0.024 = 4500 m (e) Temperature = 0.024 × 2000 = 48°C The mine would need to be air conditioned at this depth.3. (a) Thermal gradient at Taupo.
0 1 2 3 4 5 6 7 80
500
1000
1500
2000
Depth (km)
Tem
per
atur
e (°
C)
(b) Thermal gradient = 1538/6500 = 0.24°C/m
Earth Processes: Energy Transfers and Transformations68Science Press
Surfing National Earth and Environmental Science
(c) Deeper than 1 kilometre.4. (a) Thermal gradient = 1400/4000 = 0.35°C/m (b) The thermal gradient (red) is less than the temperature at
which rock melts (green) and so the mantle is solid. (c) The outer core is liquid as it is hotter than the temperature at
which the rocks melt. (d) 2900 km. (e) Just over 5000 km.
4 Energy from the Sun1. Ultraviolet and infra-red radiation are both part of the
electromagnetic spectrum. However, ultraviolet radiation has a shorter wavelength than infra-red radiation.
2. During nuclear fusion two small atomic nuclei (e.g. hydrogen) are travelling so fast that they fuse together on collision releasing energy.
3. All parts of the electromagnetic spectrum reach the Earth from the Sun, but only radiation with wavelength greater than ultraviolet radiation is able to pass through the atmosphere. Charged particles such as electrons and protons reach the Earth but are deflected by the Earth’s magnetic field.
4. During transpiration, water with dissolved minerals enters the roots and then passes along the xylem system until reaching the leaves where the water is evaporated. This evaporation helps move more water and minerals along the system to replace the water that is lost.
5. Life on Earth needs energy to survive. Photosynthesis takes energy from the Sun and converts it to chemical energy in various carbohydrates. This stored energy is used by the plant for respiration and growth, but also passes along food chains to provide energy for many herbivores and carnivores.
6. During evaporation, heat energy from the Sun increases the kinetic energy of water particles so they travel at higher speeds. Eventually their speed increases to the point that some water particles can overcome attractive forces and leave the surface, a process we call evaporation.
7. Evaporation performs a number of functions as part of the water cycle. Evaporation from the skin helps cool animals and plants. Water travelling up the stems of plants carries dissolved nutrients. Water evaporated from oceans and even polluted sources is purified and becomes suitable for later use.
8. During transpiration, the Sun’s energy allows evaporation of water from the tissues inside a plant’s leaves. This water is then replaced from the roots and soil by capillary action.
9. Inside the Sun, nuclear fusion releases energy that migrates to the Sun’s surface before travelling through space to reach planet Earth. If this energy is absorbed by wheat plants it is used to make carbohydrates (and proteins) that are stored in the seeds of the plant. These seeds are harvested and ground into wheat before being made into bread.
10. If the Sun ceased to shine, the Earth’s weather systems would collapse and the Earth would freeze over. Long before this, plants would cease to photosynthesise and food would be no longer available for life on Earth.
5 Science Skills: Design an Experiment
Latitude and the Sun1. How does latitude affect the sunlight reaching the Earth’s surface?2. They predicted that the maximum intensity would be when the Sun
was overhead.3. Voltaic cells; multimeter; protractor.4. Protractor to measure the angle.5. Don’t look directly at the Sun. Take care with the equipment as it
is expensive.6. Controlled variable: angle of tilt for the voltaic cells. Uncontrolled
variable: weather; people walking past and casting shadows.7. Controls: ambient background radiation.
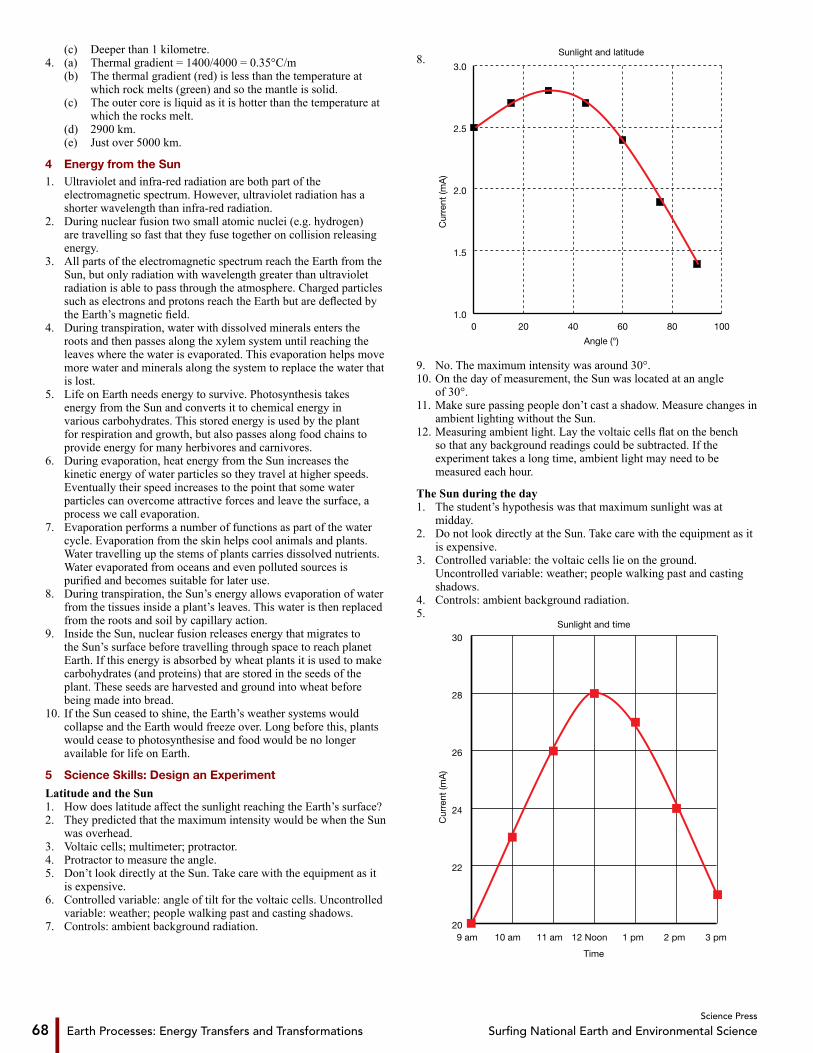
8.
0 20 40 60 80 1001.0
1.5
2.0
2.5
3.0
Angle (°)
Sunlight and latitude
Cur
rent
(mA
)
9. No. The maximum intensity was around 30°.10. On the day of measurement, the Sun was located at an angle
of 30°.11. Make sure passing people don’t cast a shadow. Measure changes in
ambient lighting without the Sun.12. Measuring ambient light. Lay the voltaic cells flat on the bench
so that any background readings could be subtracted. If the experiment takes a long time, ambient light may need to be measured each hour.
The Sun during the day1. The student’s hypothesis was that maximum sunlight was at
midday.2. Do not look directly at the Sun. Take care with the equipment as it
is expensive.3. Controlled variable: the voltaic cells lie on the ground.
Uncontrolled variable: weather; people walking past and casting shadows.
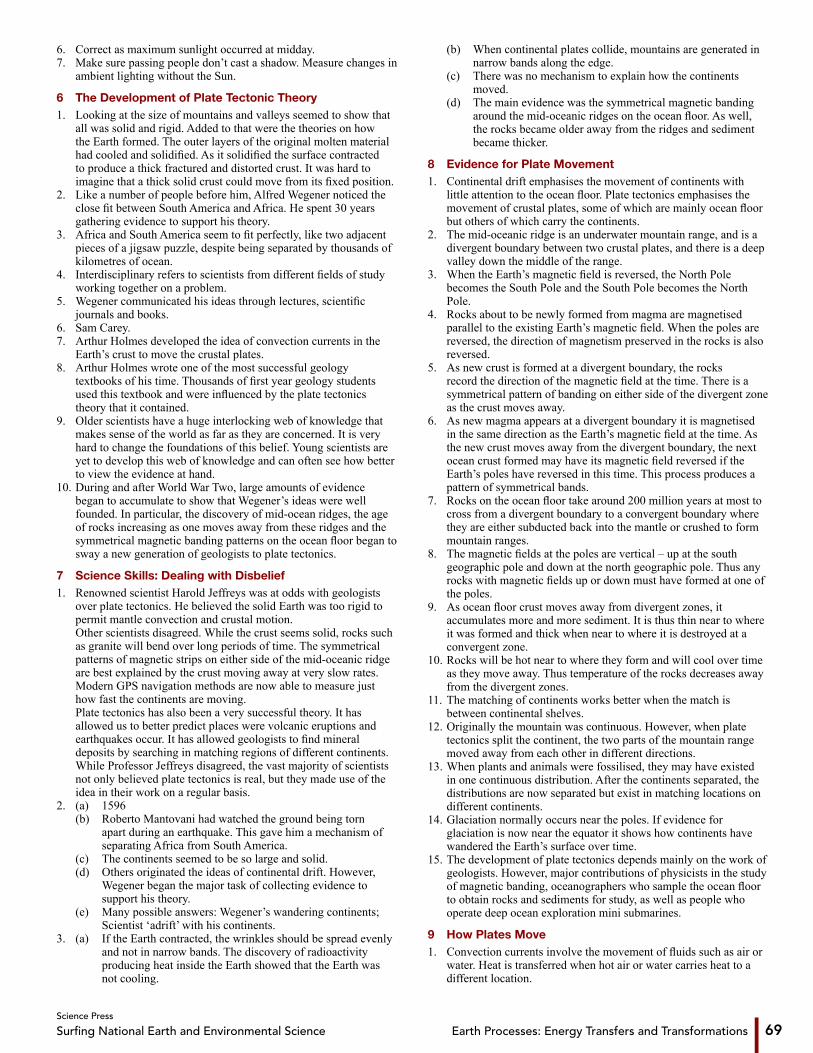
4. Controls: ambient background radiation.5.
20
22
24
26
28
30
Time
Sunlight and time
Cur
rent
(mA
)
9 am 10 am 11 am 12 Noon 1 pm 2 pm 3 pm
Earth Processes: Energy Transfers and Transformations 69Science Press
Surfing National Earth and Environmental Science
6. Correct as maximum sunlight occurred at midday.7. Make sure passing people don’t cast a shadow. Measure changes in
ambient lighting without the Sun.
6 The Development of Plate Tectonic Theory1. Looking at the size of mountains and valleys seemed to show that
all was solid and rigid. Added to that were the theories on how the Earth formed. The outer layers of the original molten material had cooled and solidified. As it solidified the surface contracted to produce a thick fractured and distorted crust. It was hard to imagine that a thick solid crust could move from its fixed position.
2. Like a number of people before him, Alfred Wegener noticed the close fit between South America and Africa. He spent 30 years gathering evidence to support his theory.
3. Africa and South America seem to fit perfectly, like two adjacent pieces of a jigsaw puzzle, despite being separated by thousands of kilometres of ocean.
4. Interdisciplinary refers to scientists from different fields of study working together on a problem.
5. Wegener communicated his ideas through lectures, scientific journals and books.
6. Sam Carey.7. Arthur Holmes developed the idea of convection currents in the
Earth’s crust to move the crustal plates.8. Arthur Holmes wrote one of the most successful geology
textbooks of his time. Thousands of first year geology students used this textbook and were influenced by the plate tectonics theory that it contained.
9. Older scientists have a huge interlocking web of knowledge that makes sense of the world as far as they are concerned. It is very hard to change the foundations of this belief. Young scientists are yet to develop this web of knowledge and can often see how better to view the evidence at hand.
10. During and after World War Two, large amounts of evidence began to accumulate to show that Wegener’s ideas were well founded. In particular, the discovery of mid-ocean ridges, the age of rocks increasing as one moves away from these ridges and the symmetrical magnetic banding patterns on the ocean floor began to sway a new generation of geologists to plate tectonics.
7 Science Skills: Dealing with Disbelief1. Renowned scientist Harold Jeffreys was at odds with geologists
over plate tectonics. He believed the solid Earth was too rigid to permit mantle convection and crustal motion.
Other scientists disagreed. While the crust seems solid, rocks such as granite will bend over long periods of time. The symmetrical patterns of magnetic strips on either side of the mid-oceanic ridge are best explained by the crust moving away at very slow rates. Modern GPS navigation methods are now able to measure just how fast the continents are moving.
Plate tectonics has also been a very successful theory. It has allowed us to better predict places were volcanic eruptions and earthquakes occur. It has allowed geologists to find mineral deposits by searching in matching regions of different continents.
While Professor Jeffreys disagreed, the vast majority of scientists not only believed plate tectonics is real, but they made use of the idea in their work on a regular basis.
2. (a) 1596 (b) Roberto Mantovani had watched the ground being torn
apart during an earthquake. This gave him a mechanism of separating Africa from South America.
(c) The continents seemed to be so large and solid. (d) Others originated the ideas of continental drift. However,
Wegener began the major task of collecting evidence to support his theory.
(e) Many possible answers: Wegener’s wandering continents; Scientist ‘adrift’ with his continents.
3. (a) If the Earth contracted, the wrinkles should be spread evenly and not in narrow bands. The discovery of radioactivity producing heat inside the Earth showed that the Earth was not cooling.
(b) When continental plates collide, mountains are generated in narrow bands along the edge.
(c) There was no mechanism to explain how the continents moved.
(d) The main evidence was the symmetrical magnetic banding around the mid-oceanic ridges on the ocean floor. As well, the rocks became older away from the ridges and sediment became thicker.
8 Evidence for Plate Movement1. Continental drift emphasises the movement of continents with
little attention to the ocean floor. Plate tectonics emphasises the movement of crustal plates, some of which are mainly ocean floor but others of which carry the continents.
2. The mid-oceanic ridge is an underwater mountain range, and is a divergent boundary between two crustal plates, and there is a deep valley down the middle of the range.
3. When the Earth’s magnetic field is reversed, the North Pole becomes the South Pole and the South Pole becomes the North Pole.
4. Rocks about to be newly formed from magma are magnetised parallel to the existing Earth’s magnetic field. When the poles are reversed, the direction of magnetism preserved in the rocks is also reversed.
5. As new crust is formed at a divergent boundary, the rocks record the direction of the magnetic field at the time. There is a symmetrical pattern of banding on either side of the divergent zone as the crust moves away.
6. As new magma appears at a divergent boundary it is magnetised in the same direction as the Earth’s magnetic field at the time. As the new crust moves away from the divergent boundary, the next ocean crust formed may have its magnetic field reversed if the Earth’s poles have reversed in this time. This process produces a pattern of symmetrical bands.
7. Rocks on the ocean floor take around 200 million years at most to cross from a divergent boundary to a convergent boundary where they are either subducted back into the mantle or crushed to form mountain ranges.
8. The magnetic fields at the poles are vertical – up at the south geographic pole and down at the north geographic pole. Thus any rocks with magnetic fields up or down must have formed at one of the poles.
9. As ocean floor crust moves away from divergent zones, it accumulates more and more sediment. It is thus thin near to where it was formed and thick when near to where it is destroyed at a convergent zone.
10. Rocks will be hot near to where they form and will cool over time as they move away. Thus temperature of the rocks decreases away from the divergent zones.
11. The matching of continents works better when the match is between continental shelves.
12. Originally the mountain was continuous. However, when plate tectonics split the continent, the two parts of the mountain range moved away from each other in different directions.
13. When plants and animals were fossilised, they may have existed in one continuous distribution. After the continents separated, the distributions are now separated but exist in matching locations on different continents.
14. Glaciation normally occurs near the poles. If evidence for glaciation is now near the equator it shows how continents have wandered the Earth’s surface over time.
15. The development of plate tectonics depends mainly on the work of geologists. However, major contributions of physicists in the study of magnetic banding, oceanographers who sample the ocean floor to obtain rocks and sediments for study, as well as people who operate deep ocean exploration mini submarines.
9 How Plates Move1. Convection currents involve the movement of fluids such as air or
water. Heat is transferred when hot air or water carries heat to a different location.