national drowning report 2016 - royal life saving · goals of the australian water safety strategy...
TRANSCRIPT

PEOPLE DROWNED IN AUSTRALIAN WATERWAYS
ROYAL LIFE SAVING
NATIONAL DROWNING REPORT 2016
Supported by

PEOPLE DROWNED IN AUSTRALIAN WATERWAYS 1 JULY 2015 TO 30 JUNE 2016
TOP 3 ACTIVITIES
TOP 3 LOCATIONS
BEACHES
RIVER/CREEK/STREAM
OCEAN/HARBOUR
14% FALLS INTO
WATER
26% SWIMMING & RECREATING
HELP MAKE YOUR COMMUNITY FREE FROM DROWNING
2
37
13
66
96
43
9
14
16% BOATING
23%
21%
19%

FOREWARD
We are pleased to present the Royal Life Saving National Drowning Report 2016. In urging you to study this report and to take action to reduce drowning, we wish to reinforce the following seven points;
People and Families, not Cases or DataThis is a report filled with the stories of real people impacted in a most tragic way by drowning. It includes people who lost their lives to drowning, the families they left behind, the rescuers who made valiant efforts to save their lives, and the communities that are reminded as they pass the causeway, swimming pool, rock platform, beach or river swimming holes. We share their anguish.
Non-fatal DrowningLast year we highlighted that drowning has two outcomes, fatal and non-fatal. Those who survive a drowning incident, often do so while suffering from an array of lifelong health impacts. In some cases these impacts lead to premature death.
In the past year we have added non-fatal drowning as a key issue to the Australian Water Safety Strategy, and commenced research to build our awareness and understanding of the impacts of non-fatal drowning. In coming years we hope to identify and report on our actions in response to this challenge.
Respect the RiverIn October 2015, on the banks of the Murray River, Albury, the Hon. Sussan Ley MP, Minister for Health and Aged Care, Minister for Sport helped us launch the Respect the River campaign, which reinforces the need to increase the focus on prevention in regional areas, along our major rivers and in remote Australia. Community responses have been tremendous and early signs are positive.
Swimming and Water Safety SkillsWe continue to commit to the notion that all Australian children have the right to a comprehensive swimming and water safety education.
The skills of swimming, survival swimming, and basic rescue are all life savers, yet we know that there are many barriers; cost, distance, awareness, and acceptance for communities most at risk of drowning. We continue to benchmark skills, strengthen partnerships, and build Swim and Survive equity programs to provide more children with these lifelong skills.
Strengthening PartnershipsThis year’s Royal Life Saving National Drowning Report is the 22nd iteration. It is our most rigorous and comprehensive analysis to date. The National Fatal Drowning Database now stretches back 14 years, and almost 4,000 cases. Partnerships with others are critical to its value in prevention terms. Coroners, Federal, State and Local Governments, Institutions and other industry bodies have used the dataset to inform the development of drowning prevention policy.
Global Drowning PreventionAustralia has relatively low drowning rates compared with other nations in our region. Over the past year we have supported the implementation of the WHO Global Report on Drowning, researched drowning impacts in nations like Kiribati, Cambodia and Vietnam and assisted in the hosting of the ILS World Conference on Drowning Prevention 2015 in Malaysia. We continue to support the International Drowning Research Centre – Bangladesh and their latest program as part of Grand Challenges Canada with the University of British Columbia. Why is this important? It’s simple, it makes us better lifesavers, more effective here and abroad.
Australian Water Safety Strategy 2016-2020The Australian Water Safety Council launched the latest Australian Water Safety Strategy 2016-2020 in April 2016. It is the result of the most comprehensive analysis and consultation yet. It will guide much of what we, and others do in coming years in an effort to reduce drowning by 50% by 2020.
This report serves as an important reminder to all Australians of the risks associated with visiting our beautiful waterways, rivers, beaches, and community and backyard swimming pools. I urge you to share the messages of the report, infographics, prevention tips and supporting resources provided by Royal Life Saving to help us reduce drowning in Australia.
Justin ScarrChief Executive Officer, Royal Life Saving Society - Australia
“THIS IS A REPORT FILLED WITH THE STORIES OF REAL PEOPLE IMPACTED IN A MOST TRAGIC WAY BY DROWNING.”
3
CASE STUDY: AUSTRALIAN WATER SAFETY STRATEGY 2016-2020The Australian Water Safety Strategy 2016-2020 was launched by the Hon. Sussan Ley MP, Minister for Health and Aged Care, Minister for Sport, in conjunction with the Australian Water Safety Council (AWSC).
The AWSC is a collective voice for Australia’s leading water safety organisations, utilising a collaborative approach to ensure continued commitment to drowning prevention in Australia.
This document continues the work of previous strategies in recommitting to the AWSC’s goal of reducing drowning deaths by 50% by the year 2020. It outlines priority areas in which Australian peak water safety bodies Royal Life Saving, Surf Life Saving and AUSTSWIM, AWSC Members and Federal, State/Territory and Local Governments must work together to prevent drowning.
The strategy identifies the supporting activities, or ‘Drowning Prevention Pillars’, which will play a key role in the achievement of the strategy’s goals.
Drowning Prevention Pillars• Advocacy• Research• Collaboration• Safe Venues• Workforce• Policy
• Education
4
DROWNING DEATHS IN 2015/16
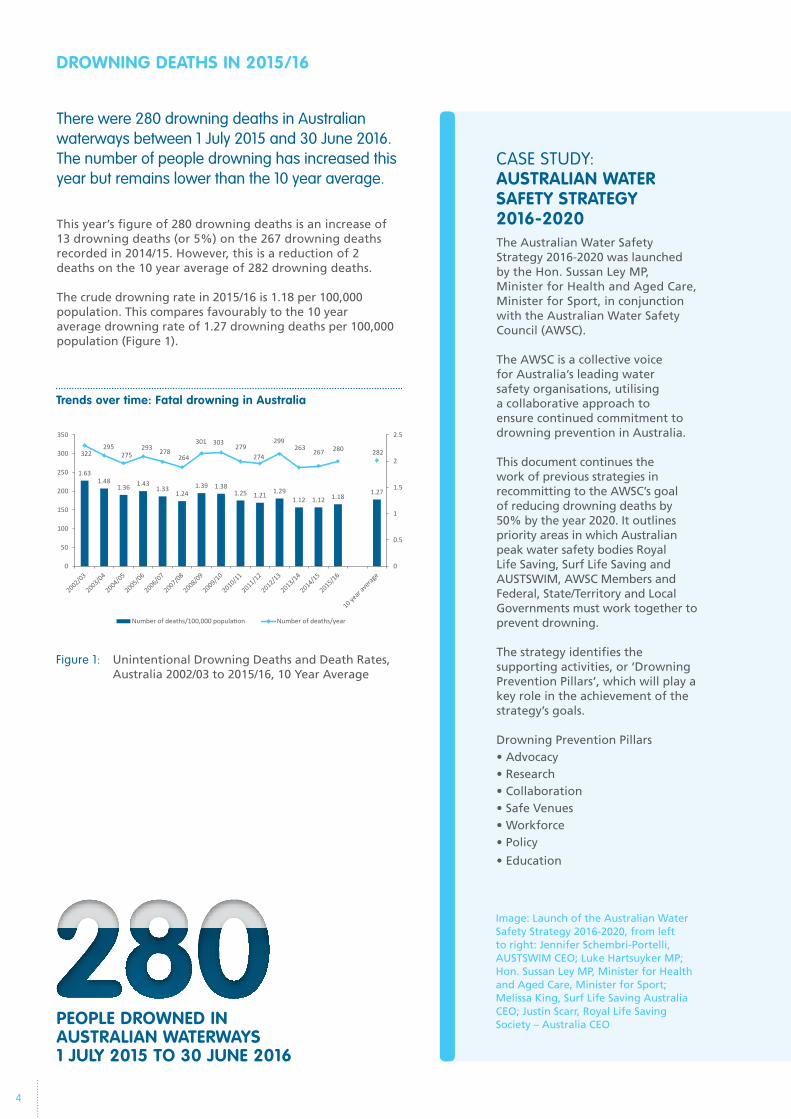
There were 280 drowning deaths in Australian waterways between 1 July 2015 and 30 June 2016. The number of people drowning has increased this year but remains lower than the 10 year average.
This year’s figure of 280 drowning deaths is an increase of 13 drowning deaths (or 5%) on the 267 drowning deaths recorded in 2014/15. However, this is a reduction of 2 deaths on the 10 year average of 282 drowning deaths.
The crude drowning rate in 2015/16 is 1.18 per 100,000 population. This compares favourably to the 10 year average drowning rate of 1.27 drowning deaths per 100,000 population (Figure 1).
Trends over time: Fatal drowning in Australia
Figure 1: Unintentional Drowning Deaths and Death Rates, Australia 2002/03 to 2015/16, 10 Year Average
1.631.48
1.36 1.431.33
1.241.39 1.38
1.25 1.21 1.291.12 1.12 1.18
1.27
322295
275293 278
264
301 303279
274
299263 267 280 282
0
0.5
1
1.5
2
2.5
0
50
100
150
200
250
300
350
Number of deaths/100,000 population Number of deaths/year
Image: Launch of the Australian Water Safety Strategy 2016-2020, from left to right: Jennifer Schembri-Portelli, AUSTSWIM CEO; Luke Hartsuyker MP; Hon. Sussan Ley MP, Minister for Health and Aged Care, Minister for Sport; Melissa King, Surf Life Saving Australia CEO; Justin Scarr, Royal Life Saving Society – Australia CEOPEOPLE DROWNED IN
AUSTRALIAN WATERWAYS 1 JULY 2015 TO 30 JUNE 2016

GOALS OF THE AUSTRALIAN WATER SAFETY STRATEGY 2016-2020Reduce drowning deaths by 50% by 2020
PRIORITY AREA ONE - TAKING A LIFE STAGES APPROACH
PRIORITY AREA TWO - TARGETING HIGH-RISK LOCATIONS
PRIORITY AREA THREE - FOCUSING ON KEY DROWNING CHALLENGES
5
Watch our video on the Australian Water Safety Strategy:
youtube.com/RoyalLifeSavingAust
GOAL 8 GOAL 9 GOAL 10 GOAL 11
GOAL 5 GOAL 6 GOAL 7
GOAL 1 GOAL 2 GOAL 3 GOAL 4

WHO DROWNS?
Of the 280 people who drowned, 83% were male. New South Wales recorded the highest number of drowning deaths with 96 (34%). This was followed by Queensland with 66 (24%) drowning deaths, Victoria with 43 (15%) and Western Australia with 37 (13%) (Figure 2).
When calculated as rates per 100,000 population over a 10 year period (2005/06-2014/15), Northern Territory (NT) recorded the highest rate of drowning in Australia at 3.88 per 100,000 population (10 year average). Tasmania (TAS) recorded the second highest rate at 2.11 drowning deaths per 100,000 population (10 year average). The Australian Capital Territory (ACT) had the lowest rate of drowning in Australia with 0.44 drowning deaths per 100,000 population (10 year average) (Figure 3).
The average age of those who drowned was 43.1 years, with the average age of females slightly lower than males (41.5 years for females and 43.4 years for males).
The largest number of drowning deaths occurred among people aged 25-34 years, with the age group recording a 27% increase against the 10 year average and accounting for 19% of all deaths in 2015/16. The 35-44 years age group recorded the second highest number of drowning deaths at 41 (15%), which was an increase of 11% against the 10 year average.
The number of children aged 0-4 years who drowned decreased by 30% against the 10 year average of 30 drowning deaths, with a decrease of 38% against the 10 year average recorded for children aged 5-9 years (Figure 4).
Figure 2: Drowning deaths by State, 2015/16
Northern Territory recorded the highest 10 year average drowning rate in Australia at 3.88 drowning deaths per 100,000 population
Figure 3: Drowning Deaths by Sex and State / Territory, Drowning Death Rates, 10 year average
The 0-4 years age group recorded a 30% decrease against the 10 year average
Figure 4: Drowning Deaths by Age Group, 10 Year Average, 2015/16
2
96
14
66
13 9
4337
0
20
40
60
80
100
120
ACT NSW NT QLD SA TAS VIC WA
1
80
8
53
12 931 28
0
22
1
16
4 2
8 70.44
1.42
3.88
1.550.96
2.11
0.71
1.51
0
0.5
1
1.5
2
2.5
3
3.5
4
4.5
0
20
40
60
80
100
120
ACT NSW NT QLD SA TAS VIC WA
Female (10 year average)Male (10 year average)Number of deaths/100,000 population (10 year average)
30
85 6
28
4137
3935
2825
21
5 63
23
52
41
3437
33
25
0
10
20
30
40
50
60
0-4 Years 5-9 Years 10-14Years
15-17Years
18-24Years
25-34Years
35-44Years
45-54Years
55-64Years
65-74Years
75+ Years
10 year average 2015/16
NSW recorded the highest number of drowning deaths in 2015/16
6
OF ALL DROWNING DEATHS IN 2015/16 OCCURRED IN NEW SOUTH WALES

CASE STUDY: REMOTE ABORIGINAL SWIMMING POOLSThe Remote Aboriginal Swimming Pool program in Western Australia is designed to increase Aboriginal participation in aquatic activities in remote locations, while achieving improvements in the areas of health, education and employment. There are six pools within the program, each located within a remote area. To ensure the needs of the local community are met, community consultation and engagement is ongoing, with targeted programs implemented at each pool.
In order to evaluate the program, feedback was gathered from the community, as well as school aged children. Identified benefits of the program included:
• Community participation – Community engagement was fostered through the relationship between the pool manager and patrons, creation of local employment and strategies to encourage parents to attend with their children to supervise them in the water. Additionally, free entry, flexible opening hours and targeted programs enabled widespread access and usage
• Health benefits – Community members stated the occurrence of ear and skin infections increased during the months that the pool was closed, while also noting benefits regarding the promotion of physical activity and safe swimming practices
• Improved skills – Aboriginal children are overrepresented in drowning data in Western Australia, highlighting the importance of delivering swimming and water safety programs in these communities within a safe and controlled environment
• Social benefits – Prevention of crime, improved social cohesion and the promotion of good behaviour were also reported, with the pools acting as a social hub and gathering place for all members of the community

CASE STUDY: FOR LIFE’S SAKE - THE DANGERS OF DRIVING THROUGH FLOODWATER
A study was conducted to explore the reasons why people drive through floodwater. In partnership with Griffith University, 20 drivers were interviewed to understand the motivation behind the decision, as well as people’s experiences of the actual event. A number of common themes emerged, including:
• Past experience – People who had driven through floodwater in the past believed they had the skills and experience to do it again
• Situations perceived as different to warnings – Drivers commonly viewed the situation they found themselves in as different to warnings they had seen, or disagreed on what constituted a flooded road
• Pressure to arrive at a destination – Whether they needed to get home to check on the welfare of family members and pets or get to work on time, people reported time pressures pushing them to proceed
• Social influences – Some drivers felt pressure from other motorists to continue, especially if they had watched others drive through successfully, while others reported their passengers urged them to drive through
• Environmental conditions – Drivers indicated they considered the speed at which the water was moving and its depth but explanations of how they would asses such factors were often limited
• Vehicle capabilities – Drivers often perceived four wheel drives or diesel powered vehicles to be capable of driving through floodwater, even if they had no prior experience of this
A Community Grant from NRMA Insurance allowed the development of a video infographic highlighting the dangers of driving through floodwater.
It was designed to show the consequences of choosing to drive through a flooded road, demonstrating that the social impacts extend far beyond the driver of the vehicle, with impacts on passengers, family and rescuers.
Watch For Life’s Sake - The Dangers of Driving through Floodwater:
youtube.com/RoyalLifeSavingAust

Drowning deaths occur throughout the year; during all seasons, days of the week and times of the day.
The highest number of drowning deaths occurred in summer (101 deaths), followed by spring (63 deaths), winter (59 deaths) and autumn (57 deaths) (Figure 5). January was the month with the highest number of drowning deaths (40) (Figure 6).
The highest number of drowning deaths occurred on Sundays, which accounted for a quarter of all deaths (69 deaths). Monday was the day of the week that recorded the lowest number of drowning deaths (29 deaths) (Figure 7).
Drowning deaths most commonly occurred in the afternoon (between 12:01pm and 6pm), with 127 deaths (45%) recorded, followed by the morning (between 6:01am and 12pm), with 66 deaths (24%). The time of drowning was unknown in 14 cases (5%) (Figure 8).
WHEN DO THESE DROWNING DEATHS OCCUR?
More than a third of drowning deaths occur in summer
Drowning deaths in Australia occur year round but peak in January
Figure 5: Drowning Deaths by Season, 2015/16
Figure 6: Drowning Deaths by Month of Incident, 2015/16
Sundays were the most common day for drowning deaths in 2015/16
Figure 7: Drowning Deaths by Day of the Week of Incident, 2015/16
Almost half of all drowning deaths in 2015/16 occurred in the afternoon
Figure 8: Drowning Deaths by Time of Incident Categories, 2015/16
Summer 36%
Autumn 20%
Winter 21%
Spring 23%
17
22
15
29
19
30
40
31
24
16 1720
0
5
10
15
20
25
30
35
40
45
2932
3734 36
43
69
0
10
20
30
40
50
60
70
80
Monday Tuesday Wednesday Thursday Friday Saturday Sunday
32
66
127
41
14
0
20
40
60
80
100
120
140
Early Morning(12:01am to
6am)
Morning(6:01am to
12pm)
Afternoon(12:01pm to
6pm)
Evening(6:01pm to
12am)
Unknown
9

WHERE AND HOW DO THESE DROWNING DEATHS OCCUR?
Drowning deaths in rivers, creeks and streams have decreased by 25% against the 10 year average
Figure 9: Drowning Deaths by Location, 2015/16
Swimming and recreating leads a diverse range of activities prior to drowning in Australia
Figure 10: Drowning Deaths by Activity Immediately Prior to Drowning, 2015/16
20
47
25
44
77
18
41
11
0
10
63
17
53
58
25
45
8
10
10
20
30
40
50
60
70
80
90
Bathtub / SpaBath
Beach Lake / Dam /Lagoon
Ocean /Harbour
River / Creek /Stream
Rocks SwimmingPool
Other Unknown
10 year average 2015/16
Bathing4%
Boating16%
Diving 9%
Fall14%
Fishing 1%Jumped In 3%
Non-aquatic transport 6%
Other1%
Rescue2%
Rock Fishing
4%
Swept Awayor Swept In
1%
Swimming and Recreating
26%
Unknown8%
Watercraft5%
The number of people drowning in rivers, creeks and streams has decreased, with 58 deaths (21%) recorded this year. This is a decrease of 19 deaths (or 25%) on the 10 year average.
Beaches were the location with the highest number of drowning deaths in 2015/16 with 63 deaths (23%). This is an increase of 16 deaths (or 34%) on the 10 year average. Ocean / harbour locations and swimming pools both recorded increases against the 10 year average, with 53 (19%) people drowning in an ocean or harbour and 45 (16%) drowning in swimming pools in 2015/16 (Figure 9).
More than one quarter (26%) of people were swimming and recreating immediately prior to drowning (74 deaths). A further 46 people (16%) were boating prior to drowning, while 39 people (14%) fell into water. The activity prior to drowning was unknown in 21 cases (8%), indicating there were a number of people who were alone when they drowned and the incident was not witnessed (Figure 10).
10
OF PEOPLE WHO DROWNED IN 2015/16 WERE SWIMMING AND RECREATING

DROWNING DEATHS IN RIVERS/CREEKS/STREAMS
DROWNING DEATHS IN SWIMMING POOLS
DROWNING DEATHS AT BEACHES
DROWNING DEATHS IN OCEAN/HARBOUR LOCATIONS

CASE STUDY: VISITS TO RIVER ENVIRONMENTSData from the National Social Survey was used to gather information on how many people visit rivers, how often they visit, how much time they spend per visit and what types of activities they participate in while visiting. The survey collected information from 1,318 people across Australia and found that:
• Almost three quarters (73%) of respondents had visited a river, creek or stream within the last 12 months
• Of those who had visited a river, 22% visited once every three months, while 17% visited once a month
• Respondents commonly spent 1-2 hours (38%) or less than an hour (34%) at a river
• Males were more likely to visit a river to swim or canoe and kayak, while females were more likely to walk beside the water or have a picnic
• Of those who had visited a river, approximately one quarter (26%) had used some sort of boat or watercraft
• Almost half (44%) of those who used a boat or watercraft stated they always wore a lifejacket

There were 75 drowning deaths in inland waterways (rivers, creeks, streams, lakes, dams and lagoons) in Australia between 1 July 2015 and 30 June 2016. Of these, 58 occurred in rivers, creeks or streams and 17 occurred in lakes, dams or lagoons.
The 75 drowning deaths in 2015/16 is a reduction of 27 drowning deaths (or 26%) on the 10 year average of 102 drowning deaths (Figure 11). Males accounted for 88% of all drowning deaths in inland waterways in 2015/16.The 25-34 years age group recorded an increase on the 10 year average, while all other age groups either remained steady or decreased. The number of people aged 25-34 years drowning in inland waterways increased by 20% against the 10 year average of 15 deaths. The 18-24 years and 75 years and over age groups recorded significant decreases (45%) against the 10 year averages (Figure 12). When examining inland waterway drowning deaths by State and Territory, Northern Territory was the only jurisdiction to record an increase against the 10 year average, with all other States and Territories either remaining steady or decreasing (Figure 13).
Swimming and recreating was the most common activity being undertaken prior to drowning in inland waterways in 2015/16, accounting for 21% of all deaths. Boating recorded an increase of 30% on the 10 year average of 10 drowning deaths, with all other activities either remaining steady or decreasing (Figure 14).
Inland waterways continue to be the leading location for drowning in Australia. Through support from the Federal Government, Royal Life Saving is working to reduce these figures through community driven drowning prevention initiatives at Australia’s river drowning blackspots. Now in its third year, the Respect the River program aims to raise awareness of the hazards at rivers, encouraging people to ‘respect’ this environment and ensure they are able to visit and enjoy these locations safely.
LOCATION IN FOCUS: INLAND WATERWAYS
Drowning deaths in inland waterways record a 26% decrease against the 10 year average
Drowning deaths in inland waterways have decreased in people aged 35 years and over
Figure 12: Inland Waterway Drowning Deaths 2002/03 to 2015/16, 10 Year Average
Inland waterway drowning deaths in New South Wales have decreased by 41% against the 10 year average
Figure 13: Inland Waterway Drowning Deaths by State / Territory, 10 Year Average
Boating was the only activity to record an increase against the 10 year average
Figure 14: Inland Waterway Drowning Deaths by Activity Immediately Prior, 10 Year Average, 2015/16
Figure 11: Inland Waterway Drowning Deaths by Age Group, 10 Year Average, 2015/16
115101 103 108
91 93 99108
126
99 102 10392
75
102
0
20
40
60
80
100
120
140
6
43 3
11
15
13 1314
1011
6
2
01
6
18
10
89 9
6
0
2
4
6
8
10
12
14
16
18
20
0-4 Years 5-9 Years 10-14Years
15-17Years
18-24Years
25-34Years
35-44Years
45-54Years
55-64Years
65-74Years
75+ Years
10 year average 2015/16
1
37
5
29
4 4
14
9
1
22
7
27
24
10
2
0
5
10
15
20
25
30
35
40
ACT NSW NT QLD SA TAS VIC WA
10 year average 2015/16
10
1
22
3 4
16
1 1 2
18 17
5
13
1
11
1 2
13
1 02
16
11
4
0
5
10
15
20
25
10 year average 2015/16
13

There were 63 drowning deaths at beaches in Australia between 1 July 2015 and 30 June 2016. This figure is an increase of 34% on the 10 year average (Figure 15).
Males accounted for 84% of all drowning deaths at beaches, with several age groups recording an increased number of deaths this year. The number of people aged 75 years and over who drowned was 9, which is three times higher than the 10 year average of 3 drowning deaths (Figure 16).
More than half (57%) of beach drowning deaths occurred while swimming and recreating, with watercraft incidents accounting for a further 14% of deaths and diving resulting in 10% of deaths (Figure 17). New South Wales recorded the highest number of drowning deaths at beaches, accounting for nearly half (48%) of all deaths. This year’s total of 30 deaths in New South Wales was a 50% increase on the 10 year average of 20 deaths. A further 11 deaths (17%) occurred in Queensland and 8 in Victoria (13%), which were both increases on the 10 year average (Figure 18).
Royal Life Saving continues to encourage people to swim at patrolled beaches during patrol times and between the red and yellow flags. Be aware of water conditions and the limitations of your own skills and fitness. Given the increase in beach drowning deaths among people aged 75 years and over, it is important that older people are aware of any pre-existing medical conditions that may have an impact on their fitness and ability in the water and therefore, their risk of drowning.
Drowning deaths at beaches recorded an increase of 34% against the 10 year average
Figure 15: Beach Drowning Deaths 2002/03 to 2015/16, 10 Year Average
Figure 18: Beach Drowning Deaths by State / Territory, 10 Year Average, 2015/16
Sharp increase against the 10 year average in people aged 75 years and over
Figure 16: Beach Drowning Deaths by Age Group, 10 Year Average, 2015/16
Swimming and recreating accounts for more than half of all beach drowning deaths
Figure 17: Beach Drowning Deaths by Activity Immediately Prior, 2015/16
New South Wales recorded a 50% increase against the 10 year average
3846 44
4855
3843 41
34
52
67
32
5963
47
0
10
20
30
40
50
60
70
80
0
1
0
1
6
9
6
7
8
4
3
0 0
3
0
7
11
6
10
11
6
9
0
2
4
6
8
10
12
0-4 Years 5-9 Years 10-14Years
15-17Years
18-24Years
25-34Years
35-44Years
45-54Years
55-64Years
65-74Years
75+ Years
10 year average 2015/16
0
20
1
8
4
1
7 6
0
30
1
11
5
1
8 7
0
5
10
15
20
25
30
35
ACT NSW NT QLD SA TAS VIC WA
10 year average 2015/16
LOCATION IN FOCUS: BEACHES
Diving10%
Fall 2%Fishing 3%
Rescue6%
Swimming and Recreating 57%
Unknown8%
Watercraft14%
14

CASE STUDY: BEFORE SCHOOL SURVIVAL SWIMMINGVictorian primary school students in years 5 and 6 participated in a Before School Survival Swimming program in a 10 day intensive format. This program aimed to teach key water safety and survival swimming skills in order to create safe behaviours and confidence around water, with a long term goal of reducing the number of drowning deaths in Victoria.
A total of 111 students participated, with 16 identified as non-swimmers at the start of the program. By the end of the program, of these 16 non-swimmers:
• 56% were able to swim 50m or more continuously and 25% were able to swim between 100m and 300m;
• 44% were able to float, scull and/or tread water continuously for 1 minute; and
• 50% were able to complete a survival sequence whilst fully clothed.
Of all students who completed the pre- and post-program skills tests (102 students):
• 90% were able to swim 50m or more continuously in lesson 10, a 20% increase from lesson 1;
• 84% could float, scull and/or tread water continuously for 1 minute, a 35% increase from lesson 1; and
• 78% of students were able to complete a survival sequence whilst fully clothed, placing them in good stead to be able to recover from an unexpected entry into water and move to a point of safety.
Barriers to water safety education include cost, transport and a crowded school curriculum. Although challenges were encountered when delivering the program, solutions were developed to create a feasible and cost effective model.

LOCATION IN FOCUS: OCEAN / HARBOUR
There were 53 drowning deaths in ocean/harbour locations in Australia between 1 July 2015 and 30 June 2016. This figure is an increase of 20% on the 10 year average (Figure 19).
Almost all drowning deaths in ocean / harbour locations were males, accounting for 92% of deaths. A sharp increase in deaths among people aged 35-44 years was recorded, increasing by 75% against the 10 year average. An increase of 67% against the 10 year average was also recorded for people aged 55-64 years and 65-74 years (Figure 20).
Boating was the leading activity being undertaken prior to drowning in ocean / harbour locations, accounting for 62% of all deaths. Just over a quarter (28%) of people were diving prior to drowning, including activities such as scuba diving and snorkelling (Figure 21).
The highest number of drowning deaths in ocean / harbour locations occurred in Queensland, which recorded 17 deaths (32%), followed by Victoria with 12 deaths (23%) and Western Australia with 11 deaths (21%). These three states (Queensland, Victoria and Western Australia) all recorded increases against the 10 year average (Figure 22).
Promoting safe boating practices is key to reducing the number of drowning deaths that occur in ocean / harbour locations. Royal Life Saving urges people to ensure they always wear a lifejacket, which is properly fitted and maintained, carry safety equipment such as an EPIRB, avoid alcohol around water and check weather conditions before heading out.
Figure 19: Ocean / Harbour Drowning Deaths, 2002/03 to 2015/16, 10 Year Average
Figure 22: Ocean / Harbour Drowning Deaths by State / Territory, 10 Year Average, 2015/16
Drowning deaths in ocean / harbour locations recorded an increase of 20% against the 10 year average
Sharp increase against the 10 year average in people aged 34-44 years
Figure 20: Ocean / Harbour Drowning Deaths by Age Group, 10 Year Average, 2015/16
Boating accounts for more than half of all ocean / harbour drowning deaths
Figure 21: Ocean / Harbour Drowning Deaths by Activity Immediately Prior, 2015/16
Increases against the 10 year average were recorded in Queensland, Victoria and Western Australia
74
4245 45
50
37
67
42 4144 43
3236
53
44
0
10
20
30
40
50
60
70
80
0 0 0 0
4
78
9
6 6
2
0 0 0 0
4
8
14
6
10 10
1
0
2
4
6
8
10
12
14
16
0-4 Years 5-9 Years 10-14Years
15-17Years
18-24Years
25-34Years
35-44Years
45-54Years
55-64Years
65-74Years
75+ Years
10 year average 2015/16
Boating 62%
Diving 28%
Fall 2%Rescue 2%
Swimming and Recreating 2% Watercraft 4%
0
11
1
12
3 3
67
0
8
1
17
2 2
1211
0
2
4
6
8
10
12
14
16
18
ACT NSW NT QLD SA TAS VIC WA
10 year average 2015/16
16

17
CASE STUDY: MULTIPLE FATALITY EVENTS There were 14 multiple fatality events (MFEs) in 2015/16 that claimed the lives of 29 people. A detailed analysis of these events found that:
• Males accounted for 79% of all drowning deaths as a result of MFEs
• The largest number of drowning deaths occurred in the 25-34 years age group, accounting for more than a quarter (28%) of all deaths as a result of MFEs
• Western Australia recorded 7 deaths as a result of MFEs, while New South Wales, Queensland and Victoria each recorded 6 deaths
• More than half (59%) of all drowning deaths as a result of MFEs occurred in ocean / harbour locations, while beaches accounted for a further 28% of deaths
• The leading activity related to MFEs was boating, accounting for 52% of deaths, followed by swimming and recreating (35%)
• In addition to these 29 deaths, 6 people drowned during a single severe weather event related to flooding
Multiple fatality events are tragic with far reaching effects on the victim’s families, communities and rescue personnel. In order to reduce the number of MFEs every year, as well as reduce the number of lives lost, a number of drowning prevention strategies can be undertaken. These include ensuring lifejackets are worn when boating or rock fishing, ensuring boats are seaworthy and fitted with appropriate safety equipment, monitoring weather reports and water conditions before and during activity and avoiding driving, walking or wading through floodwater.

There were 21 drowning deaths in children aged 0-4 years in Australian waterways between 1 July 2015 and 30 June 2016. This is a decrease of 9 drowning deaths (or 30%) on the 10 year average of 30 deaths (Figure 23).
Males accounted for 71% of drowning deaths in children aged 0-4 years. Although swimming pools were the leading location for drowning among this age group, accounting for over half (52%) of all deaths, there was a 31% decrease against the 10 year average. Reductions were also recorded for the number of children under five drowning in bathtubs and other locations (Figure 24).
The vast majority of drowning deaths in children under five resulted from a fall into water (81%), while a further 14% drowned while bathing (Figure 25).
Drowning deaths in children under five decreased by 30% against the 10 year average
LIFE STAGE IN FOCUS: CHILDREN AGED 0-4 YEARS
Figure 23: Drowning Deaths of Children 0-4 Years, 2002/03 to 2015/16, 10 Year Average
Figure 24: Drowning Deaths of Children 0-4 Years, 2002/03 to 2015/16, 10 Year Average
Figure 25: Drowning Deaths of Children 0-4 Years by Activity Immediately Prior, 2015/16
Swimming pool drowning deaths in children under five have decreased by 31% against the 10 year average
Falls into water account for most drowning deaths in children under five
4239
25
42
37
27
35 35
28
21
33
20
26
21
30
0
5
10
15
20
25
30
35
40
45
5
3 3
16
33 3 3
11
1
0
2
4
6
8
10
12
14
16
18
Bathtub / Spa Bath Lake / Dam / Lagoon River / Creek /Stream
Swimming Pool Other
10 year average 2015/16
Bathing 14%
Fall 81%
Non-aquatic transport 5%
18
OF DROWNINGS IN 0-4 YEAR OLDS OCCURRED DUE TO FALLS INTO WATER

CASE STUDY: DROWNING DEATHS IN CHILDREN UNDER FIVEPrivate swimming pool drowning deaths in children under five in New South Wales were reviewed. Between 1 July 2002 and 30 June 2015, 83 such drowning deaths were recorded. The key findings related to appropriate supervision, pool fencing and emergency care.
Supervision
• Supervision was completely absent in 59% of cases, with older siblings or other children left to supervise younger children in 6% of cases
• Among cases where it was known how long a child was left unsupervised for, 33% of children were left unattended for 5-10 minutes and 30% were left unattended for 3-5 minutes
Barriers
• Among cases with information on fencing available, fencing was present in 27% of cases, absent in 27% of cases and faulty in 35% of cases
• Among cases with available information, children most commonly gained access to the pool through a faulty fence or gate (38%), lack of a fence (31%) or a gate which was propped open (18%)
Resuscitation
• Among cases where it was known who initiated CPR, parents were the most common first responders (63%)
These findings serve as an important reminder of the Keep Watch program, which promotes four key actions.
Supervise – Be prepared and within arms’ reach of your child. Remember, all of your attention, all of the time
Restrict access – Restrict a child’s access to water by installing and maintaining a barrier, such as a pool fence with a gate which self-closes and self-latches
Water awareness – Enrol your child in water awareness classes to familiarise them with water and introduce water safety rules
Resuscitation – Family members are often the first on the scene in an emergency. Learn CPR and update your skills regularly
For more information on the Keep Watch program please visit www.keepwatch.com.au

20
There were 11 drowning deaths in children aged 5-14 years in Australian waterways between 1 July 2015 and 30 June 2016. This is a decrease of 2 drowning deaths (or 15%) on the 10 year average of 13 deaths (Figure 26).
Females accounted for 55% of drowning deaths in this age group, going against the overall trend of increased male drowning deaths. Swimming pools were the most common location for drowning among children aged 5-14 years, with 4 deaths (36%) recorded. There were no drowning deaths at rivers, creeks and streams (Figure 27).
Swimming and recreating was the most common activity prior to drowning among children aged 5-14 years, accounting for 7 deaths (64%). This highlights the importance of a basic level of swimming skills and water safety knowledge in this age group (Figure 28).
Drowning deaths in children aged 5-14 years decreased by 15% against the 10 year average
Figure 26: Drowning Deaths of Children 5-14 Years, 2002/03 to 2015/16, 10 Year Average
No drowning deaths were recorded in rivers, creeks and streams in children aged 5-14 years
Figure 27: Drowning Deaths of Children 5-14 Years by Location, 2015/16
14
11
16
10
22
1412
1614 14
10 109
1113
0
5
10
15
20
25
1
2 2
1
4
3
2
3
2
0 0
4
0
0.5
1
1.5
2
2.5
3
3.5
4
4.5
Bathtub / SpaBath
Beach Lake / Dam /Lagoon
Ocean /Harbour
River / Creek /Stream
Swimming Pool
10 year average 2015/16
Bathing 18%
Rescue 9%
Swimming and Recreating 64%
Unknown9%
OF DROWNINGS IN 5-14 YEAR OLDS OCCURRED WHILST SWIMMING & RECREATING
LIFE STAGE IN FOCUS: CHILDREN AGED 5-14 YEARS
Figure 28: Drowning Deaths of Children 5-14 Years by Activity Immediately Prior, 2015/16
Swimming and recreating accounts for more than half of all drowning deaths in children 5-14 years

CASE STUDY: SWIM AND SURVIVE ON THE SWANAs part of the Respect the River campaign, Swim and Survive on the Swan was developed. The program aims to promote safe aquatic recreation on the Swan River through established partnerships with government, recreation clubs and local aquatic centres. It targets all recreational users of the Swan, with a particular focus on children, youth, Culturally and Linguistically Diverse (CaLD) communities and marine education groups.
Swim and Survive on the Swan is designed to raise awareness of the potential hazards at river locations, while also educating participants on safe aquatic behaviours and encouraging the community to use the river, including migrant and indigenous populations.
The initial program ran through school holidays and was delivered to 31 participants (16 children and 15 adults). It incorporates Swim and Survive and Bronze Medallion to teach participants valuable swimming and lifesaving skills. The program was developed in consultation with Canoeing WA and in addition to swimming and water safety, includes canoeing drills and relevant scenarios.

22
There were 52 drowning deaths in people aged 25-34 years in Australian waterways between 1 July 2015 and 30 June 2016. This was a 27% increase against the 10 year average of 41 drowning deaths and the highest recorded number of deaths in a financial year for this age group (Figure 29). Males accounted for 89% of these drowning deaths.
Rivers, creeks and streams were the leading location for drowning among people aged 25-34 years, accounting for 15 deaths (29%). This was a 36% increase against the 10 year average. A further 11 people drowned at beaches (21%) and 8 in ocean / harbour locations (15%), both of which were also increases on the 10 year average (Figure 30).
People in this age group were undertaking a variety of activities prior to drowning. The most common activity was swimming and recreating (31%), followed by boating (15%) and diving (13%) (Figure 31).
Males continue to drown at a higher rate than females, which is particularly evident in this age group. The use of alcohol and illegal drugs while undertaking aquatic activity is an ongoing challenge, especially around rivers, creeks and streams, which accounted for the highest number of deaths in this age group and are often located in regional and remote locations.
LIFE STAGE IN FOCUS: PEOPLE AGED 25-34 YEARS
Figure 29: Drowning Deaths of People 25-34 Years, 2002/03 to 2015/16, 10 Year Average
Rivers, creeks and streams were the leading location for drowning in people aged 25-34 years
Figure 31: Drowning Deaths of People 25-34 Years by Activity Immediately Prior, 2015/16
Figure 30: Drowning Deaths of People 25-34 Years by Location, 10 Year Average, 2015/16
Highest number of drowning deaths in people aged 25-34 years recorded in 2015/16
Swimming and recreating accounted for almost a third of all drowning deaths in people aged 25-34 years
MALES AGED 25-34 YEARS DROWNED
45 4442
46
37
30
45 4543
4143
40 39
52
41
0
10
20
30
40
50
60
Boating15%
Diving 13%
Fall 11%
Jumped In4%
Non-aquatic transport
4%Rescue
4%
Rock Fishing8%
Swimming and Recreating
31%
Unknown6%
Watercraft4%
1
9
4
7
11
43
10
11
3
8
15
7 7
1
0
2
4
6
8
10
12
14
16
Bathtub /Spa Bath
Beach Lake / Dam/ Lagoon
Ocean /Harbour
River /Creek /Stream
Rocks SwimmingPool
Other
10 year average 2015/16

23
There were 58 drowning deaths in people aged 65 years and over in Australian waterways between 1 July 2015 and 30 June 2016. This was a 9% increase against the 10 year average of 53 drowning deaths but remains level with the 58 people who drowned in this age group last year (Figure 32). Males accounted for 79% of all drowning deaths in this age group.
Drowning deaths in rivers, creeks and streams decreased by 20% against the 10 year average of 15 drowning deaths. Among people aged 65 years and over, people most commonly drowned at beaches, which accounted for 15 deaths (26%) and rivers, creeks and streams with 12 deaths (21%) (Figure 33).
Half of all drowning deaths in people aged 65 years and over occurred while boating (26%) or swimming and recreating (24%). A further 19% of deaths occurred following a fall into water, an important reminder for older people to take care near water where surfaces may be slippery or uneven (Figure 34).
Older people are encouraged to test their skills and fitness in the controlled environment of a public swimming pool prior to recreating in open water locations, such as beaches and rivers. Participation in a Royal Life Saving Grey Medallion course or Adult Learn to Swim course are great ways to revise important swimming skills and water safety knowledge.
LIFE STAGE IN FOCUS: PEOPLE AGED 65 YEARS AND OVER
Figure 32: Drowning Deaths of People Aged 65+ Years, 2002/03 to 2015/16, 10 Year Average
Drowning deaths in rivers, creeks and streams in people aged 65 years and over decreased by 20% against the 10 year average
Figure 34: Drowning Deaths of People Aged 65+ Years by Activity Immediately Prior, 2015/16
Figure 33: Drowning Deaths of People Aged 65+ Years by Location, 10 Year Average, 2015/16
Drowning deaths in people aged 65 years and over remain level with last year
Boating was the leading activity prior to drowning in people aged 65 years and over
MALES AGED 65 YEARS AND OVER DROWNED
5046
54
4338 39
55
6360 61
66
50
58 5853
0
10
20
30
40
50
60
70
Bathing5%
Boating 26%
Diving5%
Fall19%
Non-aquatic transport
5%
Rock Fishing2%
Swept Away3%
Swimming and Recreating
24%
Unknown9%
Watercraft2%
4
7
5
8
15
2
8
3
0
3
15
3
1112
2
11
01
0
2
4
6
8
10
12
14
16
Bathtub /Spa Bath
Beach Lake / Dam/ Lagoon
Ocean /Harbour
River /Creek /Stream
Rocks SwimmingPool
Other Unknown
10 year average 2015/16

CASE STUDY: RESPECT THE RIVERRIVER SAFETY TIPS
1. Wear a lifejacket
Lifejackets need to be properly fitted for all participants, including children, as well as regularly maintained. Watercraft related drowning deaths can occur if people do not wear lifejackets, consume alcohol and fall overboard, are not prepared for changing weather conditions, collisions occur or their vessels are not seaworthy.
2. Avoid alcohol around water
Alcohol often contributes to drowning deaths, particularly around rivers. It impairs judgement, encourages greater risk taking behaviour, reduces coordination, impairs reaction time and reduces the effectiveness of CPR, should someone require it.
3. Never swim alone
It is important to take care when walking on slippery or uneven surfaces around or in water. Conditions should be checked before entering the water slowly, feet first. Avoid submerged obstacles, such as tree branches and rocks. Always swim with a friend, particularly in remote locations.
4. Learn how to save a life
Gain the knowledge and skills to administer first aid until medical help arrives. Anyone at any time may need to give urgent assistance. In fact, having the skills to react in an emergency situation can mean the difference between life and death while you wait for help to arrive.
For more information visit royallifesaving.com.au/respecttheriver


DROWNING RISK FACTORS
26
PRE-EXISTING MEDICAL CONDITIONS
Of the 280 people who drowned, 70 were known to have a pre-existing medical condition. This represents one quarter (25%) of all drowning deaths in this year’s National Drowning Report. Of these, 81% were male and more than half (57%) were aged 55 years and over.
The most common medical condition was cardiovascular disease, namely ischaemic heart disease. Cardiac conditions were recorded in 63% of cases where a pre-existing medical condition was known to be present. Other commonly occurring medical conditions were epilepsy (9%) and mental and behavioural disorders (11%).
A pre-existing medical condition was deemed to have been contributory to the chain of events that led to the drowning in 56% of cases where a medical condition was known to be present.
Royal Life Saving recommends that people aged 55 years and over undergo regular medical check-ups, allowing early detection of chronic disease, as well as appropriate monitoring and treatment. Children or adults with a history of epilepsy should always be supervised when in, on or around the water.
Risk factors that can increase a person’s chance of drowning can include age, sex and socioeconomic status, as well as the presence of pre-existing medical conditions and prior consumption of drugs and alcohol. The following are case studies investigating the frequency of several risk factors in the drowning deaths that occurred in 2015/16.
PEOPLE DROWNED WHO HAD PRE-EXISTING MEDICAL CONDITIONS

27
VISITOR STATUS
In 89 cases (32%) the person who drowned was known to be a visitor to the location where they drowned. Of these, 43 people drowned within their own State or Territory in a postcode that was 100km or further from their residential postcode. A further 21 people were visiting a different State or Territory when they drowned.
This year, 25 people who drowned were overseas tourists, predominantly from Asian (44%) and European (36%) countries. Overseas tourists commonly drowned at the beach (28%) or ocean / harbour locations (24%). The most common activities prior to drowning were swimming and recreating (32%) and diving (28%).
Regardless of how far you live from the aquatic environment you visit, particularly with inland waterways, conditions can change rapidly and without warning. Where possible you should check with a local resident regarding the conditions prior to entering the water. International tourists to Australia should ensure they take care when diving in the ocean, to always swim at patrolled beaches between the flags and to take care when recreating in and around our inland waterways.
DRUGS & ALCOHOL
There were 44 people who drowned who were known to have recorded positive readings for alcohol in their bloodstream at the time of drowning. More than half (57%) recorded a blood alcohol reading that was equal to or greater than the legal limit for operating boats and vehicles in most States and Territories (0.05mg/L). Of those, 40% recorded a blood alcohol reading that was four times the legal limit (0.2mg/L) or higher.
There were 41 people who drowned who were known to have some kind of drug in their system when they drowned. In almost a third of cases (29%), the drugs consumed were known to be illegal or an abuse of legal drugs. Commonly occurring illegal drugs were cannabis (58% of all drowning deaths which involved illegal drugs) and methamphetamine (33%).
The consumption of illegal drugs and/or alcohol prior to undertaking aquatic activity is known to increase the risk of drowning as they can impair judgement, slow reaction times, impair coordination and result in greater risk taking behaviour.
Some medications can also increase the risk of drowning as they may make people unsteady on their feet or slow reaction times. Mixing prescription medication with alcohol can also increase a person’s risk of drowning. Royal Life Saving strongly urges people to refrain from consuming alcohol or taking illicit drugs when around water, as well as considering the possible side effects of prescription medication.
PEOPLE DROWNED WHO WERE VISITORS TO THE INCIDENT LOCATION
PEOPLE DROWNED WHO RECORDED POSITIVE READINGS FOR ALCOHOL

CASE STUDY: DROWNING DEATHS BY REMOTENESSBy collecting data on the postcode of the drowning incident location, it is possible to determine the remoteness classification of the location of the drowning incident. Two thirds (67%) of drowning deaths in 2015/16 took place in areas deemed to be major cities or inner regional (Figure 35).
Drowning deaths in major cities most commonly occurred at swimming pools (26%) and beaches (25%), while swimming and recreating (29%) or following a fall into water (18%). Inland waterways accounted for almost a third (32%) of all drowning deaths at inner regional and outer regional locations, while 27% of people who drowned were swimming and recreating and 16% were boating.
Drowning deaths in areas deemed remote or very remote accounted for 13% of all deaths and most commonly occurred in ocean / harbour locations (41%) or inland waterways (32%). More than a third (38%) of people who drowned in remote and very remote locations were boating, while a further 19% were swimming and recreating. Access to timely medical assistance in remote and very remote areas is made all the more difficult due to isolation from major services. Therefore, promoting an increased awareness of the risk of undertaking aquatic recreation alone in isolated areas, and the importance of first aid and CPR skills for first responders is vital for reducing drowning deaths in these locations.
Figure 35: Drowning Deaths by Remoteness Classification of Incident Postcode, 2015/16
INNERREGIONAL 28%MAJOR
CITIES 39% OUTERREGIONAL 19% VERY
REMOTE 9%REMOTE 4%

Information presented in the Royal Life Saving National Drowning Report 2016 has been collated from the National Coronial Information System (NCIS), State and Territory Coronial offices and year round media monitoring. Cases are collated in partnership with Royal Life Saving State and Territory Member Organisations and analysed by Royal Life Saving Society – Australia.
Royal Life Saving uses a media monitoring service (both broadcast and print) all year round to identify drowning deaths reported in the media. This information is then corroborated with information from the NCIS, police reports and Royal Life Saving State and Territory Member Organisations (STMOs) before being included in the National Drowning Report.
All care is taken to ensure that the information in this report is as accurate as possible. However, these figures should be considered interim until the Australian Bureau of Statistics (ABS) releases its ‘causes of death’ figures for 2015 and 2016. Figures may change depending upon the ongoing coronial investigations and findings as 69% of cases were still under investigation (i.e. open) at the time of the production of this report.
This report contains information on 2015/16 drowning deaths known as of 21st August 2016. All other data is correct as of 1 July 2016, in accordance with Royal Life Saving’s ongoing data quality assurance policy. All cases in the Royal Life Saving National Fatal Drowning Database are checked against the NCIS on a regular basis and figures are updated in annual National Drowning Reports as cases close. The 10 year averages in this report were calculated from drowning death data from 2005/06 to 2014/15 inclusive.
Drowning rates per 100,000 population are calculated using population data from the ABS publication ‘Australian Demographic Statistics’ (Cat 3101.0). Percentages and averages are presented as whole numbers and have been rounded up or down accordingly.
Exclusions from this report include: drowning deaths as a result of suicide or homicide, deaths from natural causes, shark and crocodile attacks, or hypothermia. All information presented is about drowning deaths or deaths where drowning is known to be a factor (e.g. a car rolled into the water and a person drowned).
The category of ‘Non-aquatic Transport’ relates to drowning deaths involving means of transport not primarily designed or intended for aquatic use such as cars, motorbikes, bicycles and aeroplanes among others. Means of transport primarily used for aquatic purposes are captured in the ‘Boating’ (water-based wind or motor powered vessels, boats, ships and personal watercraft, e.g. boats, jet skis, sail boats, yachts) and ‘Watercraft’ categories (water-based non-powered recreational equipment such as those that are rowed or paddled, e.g. rowboats, surfboats, kayaks, canoes, boogie boards).
The category of ‘Swimming Pool’ includes home swimming pools, public swimming pools, hotel and motel pools and portable swimming pools among others.
METHODS
ACKNOWLEDGMENTS
Royal Life Saving would like to thank the following people and organisations for their assistance in producing the Royal Life Saving National Drowning Report 2016: • Royal Life Saving State and Territory
Member Organisations (STMOs)
• The National Coronial Information System (NCIS)
• The Queensland Family and Child Commission
• Surf Life Saving Australia (SLSA)
• Barbara Brighton (SLSA)
• Leanne Daking (NCIS)
• Bernadette Matthews (LSV)
• Lauren Nimmo (RLSSWA)
• Rick Carter (Studio One Another)
The drowning prevention research of the Royal Life Saving Society – Australia is supported by the Australian Government.
This report was compiled and written by Alison Mahony, Senior Project Officer – Research and Policy and Amy Peden, National Manager – Research and Policy, Royal Life Saving Society – Australia.
Suggested citation:
Royal Life Saving Society – Australia (2016) Royal Life Saving National Drowning Report 2016, Sydney Australia.
© Royal Life Saving Society – Australia 2016
29

Research into drowning is conducted for a number of reasons. It allows us to:
• Inform the public and relevant authorities about the size of the problem,
• Track trends and progress over time, which facilitates evaluation and
• Develop evidence-based prevention strategies, ensuring new programs and initiatives are based on data and directed towards areas of concern.
Accurate and timely research enables Royal Life Saving to identify key factors in drowning deaths, giving us the opportunity to design targeted solutions which can be implemented in communities across Australia by our State and Territory Member Organisations (STMOs).
COMMUNICATING OUR FINDINGSThe Royal Life Saving website ‘Facts and Figures’ section includes all our previous National Drowning Reports, research reports, fact sheets and information manuals. Our website is continually updated to include new research once complete.
Our recently developed ‘Research and Policy Summaries’, provide a snapshot of research in an area, including background to the issue, drowning data, recommendations for the future and case studies to highlight relevant programs.
We also communicate through our social media accounts, regularly posting new content and sharing the important work of others within our networks.
THE PURPOSE OF RESEARCH
30
AC
TIV
ITY
21%
FALLS27%
FALLS
18% UNKNOWN 17% NON-AQUATIC TRANSPORT 16% SWIMMING AND RECREATING
22% BOATING AND WATERCRAFT 19% SWIMMING AND RECREATING 14% UNKNOWN
RESEARCH & POLICY SUMMARY:
REDUCING DROWNING DEATHS IN INLAND WATERWAYS
DROWNING DEATHS IN RIVERS, CREEKS AND STREAMS
DROWNING DEATHS IN LAKES, DAMS AND LAGOONS
1,358 DROWNING DEATHS (2002/03-2014/15)
CAUSAL FACTORS• Drinking alcohol while swimming or boating• Not wearing a life jacket• Unseen hazards, e.g. currents and snags• New or unfamiliar aquatic locations• Remoteness of incident location• Changing weather patterns, e.g. flooding
PREVENTION STRATEGIES• Avoid alcohol around water• Wear a life jacket • Create Child Safe Play Areas for young children• Check conditions and hazards before entering the water • Never swim alone• Learn lifesaving skills (CPR, rescue skills)
AG
EG
END
ER
FACTORS & STRATEGIES
81% 84%19% 16%35-44 YEARS 25-34 YEARS 25-34 YEARS 45-54 YEARS15%
1,001 357
15%14% 14%
45-54 YEARS 55-64 YEARS 55-64 YEARS 0-4 YEARS14% 13%13% 11%
AC
TIV
ITY
24%
BOATING & WATERCRAFT
31%
FALLS
19% SWIMMING AND RECREATING 15% FALLS 12% UNKNOWN
17% SWIMMING AND RECREATING 17% UNKNOWN 11% BOATING AND WATERCRAFT
RESEARCH & POLICY SUMMARY:
REDUCING DROWNING DEATHS IN PEOPLE AGED 65+
DEATHS IN PEOPLE AGED 65-74 YEARS
DEATHS IN PEOPLE AGED 75 YEARS & OVER
687 DROWNING DEATHS (2002/03-2014/15)
CAUSAL FACTORS• Decreased physical fitness• Increased frailty and risk of falls• Not wearing a life jacket• Pre-existing medical conditions and use of
prescription medications• Drinking alcohol while swimming or boating• Mixing alcohol with prescription medications
PREVENTION STRATEGIES• Be aware of limitations in skills and fitness• Avoid alcohol around water• Wear a life jacket • Never swim alone• Be aware of medical conditions, medications
and attend regular check-ups with your doctor• Learn lifesaving skills (CPR, rescue skills)
AG
EG
END
ER
FACTORS & STRATEGIES
80% 67%20% 33%RIVER/CREEK/STREAM
RIVER/CREEK/STREAM
OCEAN/HARBOUR
SWIMMING POOL25%
358 329
31%23% 19%
BEACH BEACHSWIMMING POOL
LAKE/DAM/LAGOON15% 14%13% 11%
CHILDREN 0-4 YEARS 407 TOTAL DROWNING DEATHS (2002/03-2014/15)
CHILDREN 0-4 YEARS
CAUSAL FACTORS• Intermittent or entirely absent active adult supervision• Pool gates propped open• Faults with barriers (fences, gates)• Natural attraction to water• Unaware of consequences of actions• Little to no swimming ability • Lack of knowledge of resuscitation (CPR)
PREVENTION STRATEGIES• Active adult supervision • Adequate and well maintained pool fences and gates• Water familiarisation • Resuscitation (CPR)
CHILDREN 5-14 YEARS
CAUSAL FACTORS• Lack of adult supervision• Influence of peers• New or unfamiliar aquatic locations• Diverse range of activities prior to drowning
PREVENTION STRATEGIES• Basic swimming skills and water safety knowledge• Swim with a friend• Regular adult supervision• Resuscitation (CPR)
CHILDREN 5-14 YEARS 171 TOTAL DROWNING DEATHS (2002/03-2014/15)
LOC
ATIO
NG
END
ERA
CTI
VIT
YFA
CTO
RS
& S
TRAT
EGIE
S
SWIMMING POOL
FALLS
RIVER/CREEK/STREAM
SWIMMING & RECREATING
15% BATHTUB/SPA BATH 13% OTHER 10% LAKE/DAM/LAGOON 10% RIVER/CREEK/STREAM
15% BATHING 4% SWIMMING & RECREATING 3% OTHER
22% SWIMMING POOL 18% LAKE/DAM/LAGOON 11% BEACH 8% OTHER 6% BATHTUB/SPA BATH
25% FALLS 11% NON-AQUATIC TRANSPORT 11% OTHER 9% WATERCRAFT 6% BATHING
53%
78%
35%
38%
RESEARCH & POLICY SUMMARY:
REDUCING DROWNING DEATHS IN CHILDREN AGED 0-14
Royal Life Saving Research and Policy Summaries
To download visit royallifesaving.com.au/facts-and-figures

2016 SNAPSHOT OF FINDINGS
OVERALL
280 PEOPLE DROWNED IN AUSTRALIAN WATERWAYS BETWEEN 1 JULY 2015 AND 30 JUNE 2016
THIS YEAR’S FIGURE OF 280 DROWNING DEATHS IS AN INCREASE OF 13 DROWNING DEATHS (OR 5%) ON THE 267 DROWNING DEATHS RECORDED IN 2014/15
THIS IS A REDUCTION OF 2 DEATHS ON THE 10 YEAR AVERAGE OF 282 DROWNING DEATHS
SEX AND AGE GROUP
231 (83%) drowning deaths were male
49 (17%) drowning deaths were female
21 (8%) drowning deaths occurred in children aged 0-4 years
11 (4%) drowning deaths occurred in children aged 5-14 years
52 (19%) drowning deaths occurred in people aged 25-34 years
58 (21%) drowning deaths occurred in people aged 65 years and over
STATE AND TERRITORY
96 (34%) drowning deaths occurred in New South Wales
66 (24%) drowning deaths occurred in Queensland
43 (15%) drowning deaths occurred in Victoria
37 (13%) drowning deaths occurred in Western Australia
LOCATION AND ACTIVITY
63 (23%) drowning deaths occurred at beaches
58 (21%) drowning deaths occurred at rivers, creeks and streams
53 (19%) drowning deaths occurred in ocean / harbour locations
74 (26%) were swimming and recreating immediately prior to drowning
46 (16%) were boating immediately prior to drowning
39 (14%) drowned as a result of falls into water
Means an increase on the 10 year average
Means a decrease on the 10 year average
facebook.com/RoyalLifeSaving
twitter.com/royallifesaving
youtube.com/RoyalLifeSavingAust
www.royallifesaving.com.au
CONNECT WITH US
SHOW YOUR SUPPORT
#RLSDrowningReport2016

FOR MORE INFORMATION ABOUT THIS REPORT CONTACT:
Royal Life Saving Society - Australia
Phone 02 8217 3111 E-mail [email protected] Visit www.royallifesaving.com.au
CONTACT ROYAL LIFE SAVING IN YOUR STATE OR TERRITORY:
ACT Phone 02 6260 5800 E-mail [email protected]
NSW Phone 02 9634 3700 E-mail [email protected]
NT Phone 08 8981 5036 E-mail [email protected]
QLD Phone 07 3823 2823 E-mail [email protected]
SA Phone 08 8210 4500 E-mail [email protected]
TAS Phone 03 6243 7558
E-mail [email protected]
VIC Phone 03 9676 6900 E-mail [email protected]
WA Phone 08 9383 8200 E-mail [email protected]
Supported by
facebook.com/RoyalLifeSaving
twitter.com/royallifesaving
youtube.com/RoyalLifeSavingAust
www.royallifesaving.com.au
CONNECT WITH US
SHOW YOUR SUPPORT
#RLSDrowningReport2016