national district cooling potential study for india
TRANSCRIPT

National District Cooling Potential Study for India
1
National District Cooling Potential Study for India
2
Acknowledgement
United Nations Environment Programme (UNEP) and Energy Efficiency Services Limited (EESL)
acknowledge valuable inputs and recommendations provided by key stakeholders including Ministry of
Environment Forest and Climate Change (MoEFCC), Ministry of Housing and Urban Affairs (MoHUA),
NITI Aayog and the Bureau of Energy Efficiency (BEE) proved invaluable in designing the District
Energy in Cities Initiative’s activities in India and the approach and methodology for undertaking
district energy assessments in Indian cities. UNEP and EESL also acknowledge the support of the four
pilot cities in India of Amaravati, Hyderabad Pharma City, Rajkot and Thane and the leadership of their
city governments as well as the learning cities of Bhopal, Chennai, Coimbatore and Pune. Interactions
and activities in all these cities have proved invaluable and help to justify many of the recommendations
in the report.
UNEP and EESL acknowledge the support of PricewaterhouseCoopers Pvt Ltd (PwCPL) in drafting this
report based on an impartial analysis of primary and secondary sources and the work of the Copenhagen
Centre on Energy Efficiency (C2E2) to ensure the best of global best practices are included in the study.
UNEP and EESL appreciates the vision shown by Empower for agreeing to partially fund this study and
be a part of the District Energy in Cities.
We are grateful for all the support extended by partners of District Energy in Cities Initiative in India.
UNEP and EESL appreciate the efforts put in by all the reviewers and contributors that took part in this
study and for providing vital inputs. We are especially grateful to: Aalborg University, Adani
Transmission Limited, Alliance for an Energy Efficient Economy (AEEE), Asia Pacific Urban Energy
Association (APUEA), Broad Air Conditioning Group, The Carbon Trust, Clarke Energy, Copenhagen
Centre on Energy Efficiency, Danfoss, Edina, Empower, EuroHeat and Power, General Electric, Gift
City Gujarat, GIZ, Gujarat Energy Development Agency (GEDA), Gujarat Energy Research and
Management Institute (GERMI), Indian Society of Heating, Refrigerating & Air-conditioning
Engineers (ISHRAE), ICLEI South Asia Secretariat, International District Energy Association (IDEA),
International Finance Corporation, King&Spalding, National Resource Defence Council (NRDC),
Ramboll, Shakti Sustainable Energy Foundation, Thermax, TERI and Tabreed.
UNEP and EESL would also like to thank the donors of the District Energy in Cities Initiative: Global
Environmental Facility (the GEF), Danish International Development Agency (DANIDA), the Italian
Ministry of Environment Protection, Land and Sea and the Kigali Cooling Efficiency Programme
(KCEP)
Report authors:
EESL: Saurabh Kumar, S.P. Garnaik, Girja Shankar, Manoj Kumar M, Moumita Chandra,
Anant Shukla
UN Environment Programme: Benjamin Hickman and Lily Riahi
Copenhagen Centre on Energy Efficiency (C2E2): Dr. Zhuolun Chen
PricewaterhouseCoopers Pvt Ltd (PwCPL): Rajeev Ralhan, Akash Vajpai, Bhaskar Nath, Gurraj
Bhinder, Sanyukta Pande, Sandeep Dahiya (external consultant)
Published: 16th March 2021

National District Cooling Potential Study for India
3
The District Energy in Cities Initiative
The District Energy in Cities Initiative is a multi-stakeholder partnership coordinated by UN
Environment Programme. As one of six accelerators of the Sustainable Energy of All (SEforAll) Energy
Efficiency Accelerator Platform, the Initiative is supporting market transformation efforts to shift the
heating and cooling sector to energy efficient and renewable energy solutions. Over 60 organizations,
including industry associations, manufacturers, utilities, financiers, non-government groups, as well as
45 champion cities across the world have partnered with the District Energy in Cities Initiative to
support local and national governments implement district energy policies, programs and project
pipelines that will accelerate investment in modern district energy systems. The Initiative is supporting
14 countries including India, where UNEP is working in partnership with Energy Efficiency Services
Limited (EESL), the National Coordinator of the Initiative in India. The Initiative is supporting a variety
of activities:
Directly supporting pilot city projects, local policy development, local energy mapping and
district energy master planning for district energy;
National and state-level policy and regulatory recommendations and support to different
Ministries deemed crucial for accelerating district cooling market;
Supporting EESL to establish an investment programme on district cooling;
Establishing knowledge products, tools, methodologies, MRV framework and best practices on
district energy; and
Awareness raising and capacity building, including to real estate and HVAC industry.
For more information, other knowledge products and contact details please visit:
www.districtenergyinitiative.org

National District Cooling Potential Study for India
4

National District Cooling Potential Study for India
5
Foreword – United Nations Environment Programme (UNEP)
Cooling has long been a blind spot in the global energy debate despite clear impacts being
reported from countries with already high air conditioning demands for decades and the long
ongoing effort on transitioning to refrigerants that protect the ozone layer and, more recently,
that do not warm our planet. Shining light on this problem, the Ministry of Environment and
Climate Change (MoEFCC) has shown clear foresight and leadership in preparing the Indian
Cooling Action Plan (ICAP), a global first which links together climate, refrigerants and access
to cooling in one comprehensive plan which is now triggering similar plans in countries
worldwide. One learning from this Plan and other countries’ experience is that even with
strong building codes and standards, India will be left with a huge energy and refrigerant
demand for space cooling, likely larger than any other country globally. This is one reason why
the ICAP is advocating in the medium and long-term a shift to not-in-kind technologies such
as district cooling, trigeneration and thermal storage.
Such technologies need to become the backbone of cities’ transition to sustainable energy:
increasing access to cooling; relieving stress on our power grids which and balancing higher
shares of renewables; shifting to climate-friendly refrigerants faster, safer and cheaper;
reducing potable water used for cooling; reducing urban heat island; and, crucially, unlocking
highly-efficient and renewable technologies that transition cooling to net-zero emissions.
But starting India’s market for district cooling is not simple – the pace of real estate in cities,
the novelty of this technology and the diverse barriers that exist makes shifting the cities,
industry and the country to district cooling all the harder. UNEP and EESL’s work has shown
that capital cost is not the issue for district cooling, but coordination, capacity and willingness
to try a new technology. But all countries that have successfully developed district heating and
district cooling have faced the same challenges. Through the UNEP-led District Energy in
Cities Initiative we have a community of countries, cities and industry giving necessary
support and guidance. What is needed now is a concerted, all-government effort to embrace
this technology to deliver sustainable and affordable cooling. This report shows the full
potential and pathway to this and UNEP looks forward to work with Government of India,
state governments, cities and industry to bring about this vision.
I commend MoEFCC, Bureau of Energy Efficiency (BEE), EESL and Ministry of Housing and
Urban Affairs (MoHUA) for their close engagement with UNEP and partners on this crucial
topic.
Atul Bagai, Head, UNEP India Office

National District Cooling Potential Study for India
6
National District Cooling Potential Study for India
7

National District Cooling Potential Study for India
8
Table of Contents
Acknowledgement ........................................................................................................... 2
Foreword – Energy Efficiency Services Limited (EESL) .................................................. 4
Foreword – United Nations Environment Programme (UNEP) ...................................... 5
Preface – Energy Efficiency Services Limited (EESL) ..................................................... 6
Acknowledgement – Energy Efficiency Services Limited (EESL) .................................... 7
Executive Summary ........................................................................................................14
1. Introduction to district cooling .................................................................................. 25
1.1. Overview.......................................................................................................................................... 25
1.2. Technological overview .................................................................................................................. 27
1.2.1. Examples of technologies used in global district energy systems ..................................... 28
1.3. Benefits of DCS .............................................................................................................................. 29
1.3.1. End user benefits of district cooling ................................................................................... 30
1.3.2. Cost benefits in district cooling installation ...................................................................... 30
1.3.3. Infrastructure benefits ......................................................................................................... 33
1.3.4. Environmental benefits ....................................................................................................... 33
2. Global district energy systems (DES) best practices .................................................. 36
2.1. City leadership on energy, heating, and cooling .......................................................................... 37
2.2. International best practices and learnings India ......................................................................... 37
2.2.1. Key success driver of DCS adoption in Dubai - UAE ........................................................ 42
3. District cooling systems in India ............................................................................... 43
3.1. Initiatives in India for DCS ............................................................................................................ 45
3.1.1. Thane pilot city .................................................................................................................... 46
3.1.2. Rajkot pilot city ................................................................................................................... 48
4. Space cooling demand in commercial buildings in India ........................................... 51
4.1. India Cooling Action Plan (ICAP)- Demand estimates ................................................................ 51
4.1.1. Cooling demand .................................................................................................................... 51
4.1.2. Energy consumption of space cooling in buildings ............................................................ 52
4.2. Approaches adopted for assessment ............................................................................................ 54
4.3. Summary of national cooling demand, for new commercial buildings, from different
approaches ............................................................................................................................................ 54
5. Estimation of potential of district cooling in India .................................................... 56
5.1. Methodology of assessment ........................................................................................................... 56
5.2. Summary of the detailed analysis to estimate potential of DCS in Indian cities ....................... 57
5.3. Investment potential, energy saving, and energy demand reduction using district cooling
systems .................................................................................................................................................. 59
6. Business models, governance, and contracting for district energy systems ...............61
National District Cooling Potential Study for India
9
6.1. Cost components of district cooling ............................................................................................. 62
6.2. Business model classification .......................................................................................................63
6.3. Contracts for district cooling systems .......................................................................................... 65
6.4. Business models recommendations for India ............................................................................. 68
7. Barrier analysis for district cooling systems in India ................................................ 69
7.1. Policy and institutional barrier..................................................................................................... 69
7.1.1. Lack of promotion of district cooling at national and state level ...................................... 69
7.1.2. Absence of involvement of DISCOMs and municipal corporations ................................. 69
7.1.3. Lack of policy drivers .......................................................................................................... 69
7.1.4. Non-inclusion of DCS during development of master plans .............................................70
7.1.5. Non-inclusion in national building regulations and certifications ....................................70
7.2. Technological barriers ................................................................................................................... 71
7.2.1. Design risks (or planned developments) ............................................................................ 71
7.2.2. Insufficient research and case studies of district cooling in India .................................... 71
7.3. Financial barriers ........................................................................................................................... 71
7.3.1. Capital-intensiveness (or cost of capital) ............................................................................ 71
7.3.2. Distribution system construction & operation risks .......................................................... 72
7.3.3. Revenue generation risks .................................................................................................... 72
7.4. Capacity and human resource ....................................................................................................... 72
8. Recommendations and actions items ........................................................................ 73
8.1. General recommendations ............................................................................................................ 74
9. References ................................................................................................................. 78
10. Annexures ................................................................................................................ 79
10.1. Annexure 1: Assumption in calculation for space cooling demand in India by 2037-38 ......... 79
10.2. Annexure 2: Estimation of space cooling demand by various approaches .............................. 79
10.2.1. Estimation of cooling demand (in mn TR) as per Approach 1 ........................................ 79
10.2.2. Estimation of cooling demand (in mn TR) as per Approach 2....................................... 80
10.2.3. Estimation of cooling demand (in mn TR) as per Approach 3....................................... 80
10.3. Annexure 3: Analysis to estimate potential of DCS in Indian cities ......................................... 81
10.3.1. Analysis 1: Potential of DCS in commercial development in tier 1 and tier 2 cities (based
on master plan availability) ........................................................................................................... 81
10.3.2. Analysis 2: Potential of DCS in commercial development in tier 2 cities having
population more than 1 mn .......................................................................................................... 82
10.3.3. Analysis 3: Potential of DCS in residential sector for Tier I and Tier II cities .............. 82
10.4. Annexure 4: Technological overview ......................................................................................... 83
10.4.1. District Cooling Plants ...................................................................................................... 83
10.4.2. Chilled water distribution ................................................................................................ 90
10.4.3. Customer connection .........................................................................................................93

National District Cooling Potential Study for India
10
List of figures
Figure 1: A schematic of a typical district cooling system ......................................................................... 15 Figure 2: Global scenario of district cooling plants ................................................................................... 17 Figure 3: Potential saving opportunities from district cooling systems in India ..................................... 19 Figure 4: Key barriers for uptake of merchant district cooling systems in India ................................... 20 Figure 5: Possible business models for district cooling systems in India ................................................ 21 Figure 6: Key recommendations for all stakeholders ................................................................................23 Figure 7: A schematic of typical district cooling systems .......................................................................... 25 Figure 8: Key components of a typical district cooling system ................................................................. 27 Figure 9: Technological overview of DCS .................................................................................................. 28 Figure 10: Cooling load diversity analysed in city of Thane Ghodbunder road area ............................... 31 Figure 11: Peak demand reduction due to different district cooling technologies ...................................32 Figure 12: Refrigerant lifecycle ................................................................................................................... 35 Figure 13: Dubai Metro – The first mass transit network in the world to use district cooling ...............36 Figure 14: Overall cooling technology market share in Dubai (year 2015) ............................................. 42 Figure 15: GIFT one tower ......................................................................................................................... 44 Figure 16: View of DLF cyber city .............................................................................................................. 44 Figure 17: 10-step methodology for developing and promoting district energy in cities ....................... 46 Figure 18: Hiranandani Estate project (left) overview and Ghodbunder Road project (right) .............. 47 Figure 19: GIS Energy and Cool Mapping in Thane with Wagle Estate area detailed on right ............. 48 Figure 20: Various cooling sectors in India ............................................................................................... 51 Figure 21: Cooling demand in various sectors ........................................................................................... 52 Figure 22: Space cooling energy consumption by equipment in the year 2017-18 and projections in
2037-38 ........................................................................................................................................................ 53 Figure 23: Three-step analysis to access DCS potential in Indian cities .................................................. 57 Figure 24: Different scenarios for estimation of achievable potential of DC in India ............................ 59 Figure 25: Base requirements for a district cooling project ...................................................................... 61 Figure 26: Different stakeholders in DC project ....................................................................................... 62 Figure 27: Various components of a district cooling network ................................................................. 62 Figure 28: Comparison between private and public finance ....................................................................63 Figure 29: Business models of a district cooling project ...........................................................................63 Figure 30: Flow in single ownership type business model ...................................................................... 66 Figure 31: Flow in tender based business model ....................................................................................... 67 Figure 32: Flow in PPP type business model ............................................................................................. 67 Figure 33: Recommendations for stakeholders in nutshell ...................................................................... 73 Figure 34: Schematic of Vapor compression cycle ................................................................................... 84 Figure 35: Schematic of Vapor absorption cycle ....................................................................................... 84 Figure 36: Schematic of Trigeneration ...................................................................................................... 85 Figure 37: District Cooling Plant at Business Bay – Empower (Dubai) .................................................. 86 Figure 38: Cost of piping vs its diameter .................................................................................................. 92 Figure 39: Arrangements for piping installation ...................................................................................... 92

National District Cooling Potential Study for India
11
List of tables
Table 1: Estimated benefits of DCS in India compared to stand-alone water-cooled chillers ................ 15 Table 2: Summarized benefits of district cooling system attainable in India ......................................... 26 Table 3: Overall benefits of DCS vs Individual Building Chiller Plant ..................................................... 33 Table 4: International analysis on different parameters .......................................................................... 38 Table 5: Total potential air-conditioned area catered by district cooling in Tier I and Tier II cities for
new commercial buildings ......................................................................................................................... 58 Table 6: Total potential air-conditioned area catered by district cooling in Tier I and Tier II cities for
residential buildings ................................................................................................................................... 58 Table 7: Energy saving, energy demand, and investment potential ......................................................... 59 Table 8: Important attributes and characteristics of each type of business model ................................ 64 Table 9: Stakeholder specific general recommendations .......................................................................... 74 Table 10: Estimation of cooling demand as per approach 1 ...................................................................... 79 Table 11: Estimation of cooling demand as per approach 2 ..................................................................... 80 Table 12: Estimation of cooling demand as per approach 3 .................................................................... 80 Table 13: Analysis of commercial built up area in Tier I cities ................................................................. 81 Table 14: Analysis of commercial built up area in Tier 2 cities ................................................................ 82 Table 15: Analysis of residential built up area in Tier I and Tier II cities ............................................... 82 Table 16: Pros and cons of absorption chillers ......................................................................................... 84 Table 17: Comparison of instrument and control in typical commercial building and district cooling
plant ............................................................................................................................................................. 89

National District Cooling Potential Study for India
12
List of abbreviations
AHU Air handling units
AI Artificial intelligence
BAU Business as usual
BEE Bureau of Energy Efficiency
BMS Building management system
CFC Chlorofluorocarbons
CHP Combined heat and power
COGEN Co-generation
COP Coefficient of performance
CPWD Central Public Works Department
DCICS District cooling instrumentation and control system
DCP District cooling plants
DCS District cooling systems
DES District energy systems
DISCOM Distribution companies
ECBC Energy conservation building code
EESL Energy efficiency services limited
EIA Environmental impact assessment
ERC
ETS
Electricity Regulatory Commission
Energy transfer station (ETS)
GCC Gulf cooperation council
GHG Greenhouse gas
GRIHA Green Rating for Integrated Habitat Assessment
GWP Global warming potential
HC Hydrocarbon
HCFC Hydrochlorofluorocarbons
HDPE High-density polyethylene
HFC Hydrofluorocarbons
HFO Hydrofluoroolefins
HVAC Heating ventilation and air conditioning

National District Cooling Potential Study for India
13
IBCP Individual building chiller plants
ICAP India Cooling Action Plan
IGBC Indian Green Building Council
Kg Kilogram
lbs. Pounds
LEED Leadership in energy and environmental design
Mn Million
MOEF&CC Ministry of Environment, Forest and Climate Change
MOP Ministry of Power
MOUD Ministry of Urban Development
MS pipe Mild steel pipe
NBCC National Buildings Construction Corporation Ltd
ODP Ozone depletion potential
PPP Public private partnership
RAC Room air conditioning
RO Reverse osmosis
SDA State designated agency
sqft Square feet
Sqft/Tr Square feet per ton
sqm Square metre
STP Sewage treatment plant
TDS Total dissolved solids
TES Thermal energy storage
TR Tonnes of refrigeration
TSE Treated sewage effluent
TSS Total suspended solids
ULB Urban local body
UNEP United Nations Environment Programme
VFD Variable frequency drives
VPF Variable primary flow
VRF Variable refrigerant flow

National District Cooling Potential Study for India
14
Executive Summary
India is experiencing a rapid growth in space cooling demand driven by population growth,
urbanisation, increasing incomes and rising urban heat. According to the India Cooling Action Plan
(ICAP), urbanization and economic growth will increase commercial floor area by 2.5-3 times and the
number of urban households will almost double over the next two decades (2018-2038) (MoEFCC,
2019). Altogether, demand for space cooling in India is expected to increase 11 times over the same
period. Rapid increases in demand for cooling in cold chain, transportation and refrigeration are also
projected. Building efficiency and design, passive cooling, nature-based solutions, fans and coolers from
an environmental perspective should all be promoted before air conditioning. However, the reality of
urban and building design in India and rising incomes and urban heat means air conditioning is
becoming a necessity for many families and workers in Indian cities.
The Ministry of Power (MoP) through the Bureau of Energy Efficiency (BEE), has initiated a number of
energy efficiency initiatives such as standards and labelling of appliances including cooling
equipment/appliances, and minimum requirements for the energy-efficient design and construction of
buildings (both commercial and residential). The Ministry of Environment, Forests and Climate change
(MoEFCC) sets out in the ICAP that through these energy efficiency efforts, energy used for space
cooling may be 30% lower in 2038 compared to business-as-usual. Such efforts would bring widespread
socioeconomic and environmental benefits. However, approximately 700 TWh of energy and 80,000
Mt of refrigerants would still be required for space cooling (MoEFCC, 2019). Reducing this demand
further and shifting to sustainable energy supply and refrigerants will be crucial to reducing greenhouse
gas emissions, building a resilient energy system and improving access to cooling. To help achieve this,
ICAP recommends the promotion of not-in-kind technologies including trigeneration, district cooling
system (DCS) and thermal energy storage which should “significantly displace conventional air
conditioning systems” in the long-term. This report sets out a pathway to achieving this from a
technology, finance, policy and regulatory perspective.
At present, most air conditioning loads in India are met by on-site cooling technologies consisting of
either window or room air conditioners or central air-cooled or water-cooled chillers powered by the
electricity grid. The efficiency and refrigerant consumption of on-site cooling equipment varies
significantly depending on the product, building and cooling system design, operation and
maintenance, and even the building’s ownership structure. In general, in dense urban areas, energy and
refrigerant use for air conditioning is far lower if clusters of buildings and even whole townships are
connected to a District Cooling System (DCS). Global experience and detailed analyses and existing
projects in India show that these systems are also more reliable, cost-effective and would be highly
beneficial to strengthening and supporting urban power grids, especially through cheap thermal storage
and trigeneration.
DCS distributes (supplies and collects back) cooling energy in the form of chilled water from a central
district cooling plant to multiple buildings through a distribution network of insulated, underground
pipes for space and process cooling. Individual users purchase chilled water for their own building from
the operator of the DCS and do not need to install their own chillers or cooling towers. Globally, DCS
vary significantly in size from serving two buildings to serving an entire city. A DCS can serve a wide
variety of loads inter alia commercial offices, hotels, residential, industry units, data centres, cold chain,
sports arenas, malls, schools, institutional buildings and hospitals.

National District Cooling Potential Study for India
15
Figure 1: A schematic of a typical district cooling system
(Devcco District Energy Venture, 2018)
Much of the energy efficiency advantages of DCS result from combining many diverse load profiles,
which allows the district cooling plant equipment to operate at high load factors with resulting higher
levels of efficiency. This demand aggregation also provides the economies of scale that allows district
cooling systems to cost-effectively utilise high-efficiency and sustainable technologies, such as
trigeneration, that are less economically and technically feasible for an individual building. Aggregated
cooling loads makes creative alternative technologies such as free cooling from lake, river or ocean
water, grey water recovery and reuse, thermal energy storage, industrial waste heat capture etc., more
feasible in application as they reduce cost and environmental impact associated with space cooling
technologies. Additionally, district cooling offers huge benefit to building owners of not procuring,
installing, operating, and maintaining air conditioning plants, which consumes large portions of annual
budgets. This also offers them to have extra rooftop and basement space for commercial activities,
savings in capital and operational cost and enjoy the luxury of having reliable, uninterrupted, and
economical cooling as a service. Finally, the centralised approach of district cooling allows the safe and
controlled use of environmentally friendly refrigerants that are not appropriate or available at the
individual building level.
In brief, DCS offers several benefits which will vary dependent on the technology chosen to produce the
chilled water. The below diagram shows the expected savings compared to an individual building
operating a water-cooled chiller (as is common in many large commercial buildings in India). Compared
to room air conditioners or air-cooled chillers, the energy savings would be even more significant.
Table 1: Estimated benefits of DCS in India compared to stand-alone water-cooled chillers
Source: UNEP & C2E2
Reduction in primary energy
Reduction in peak power demand
Reduction in water use
Reduction in CO2 emissions
Lifecycle refrigerant saving in 20 years
DCS on electric chillers with 30% peak load thermal storage
25%-40% 25%-50% 15%-25% 25%-40% 55%-65%

National District Cooling Potential Study for India
16
Trigeneration DCS with 30% electric chillers
30%-50% 40%-60% 10%-20% 35%-55% 65%-75%
DCS with free cooling from rivers, seas or lakes
75%-85% 70%-75% 100% 100% 100%
The benefits of district cooling, trigeneration and thermal storage can be felt at the city level and help
improve a city’s climate resilience, reduce urban heat island, improve resource efficiency and circularity,
retain wealth, provide alternative revenues for city governments and crucially reduce grid stress and
blackouts. Globally, this model is generally termed ‘district energy’ and, besides district cooling, also
includes district heating, domestic hot water provision, waste heat capture and production and
balancing of local electricity. District energy systems have been adopted in Europe, the US, Canada,
Gulf nations, Japan, Korea, Malaysia, China, Egypt, Colombia etc. for many years. A quick snapshot of
different project examples globally is presented in figure below:

National District Cooling Potential Study for India
17
Figure 2: Global scenario of district cooling plants
National District Cooling Potential Study for India
18
These examples can act as learnings for India to promote the technology and required policy and
regulatory interventions. Some of the key learnings from global experiences (specifically from the
countries with hot climate and have significant cooling demand) are:
• Need for an integrated policy framework for promoting district cooling and strong government
engagement.
• Need involvements of municipalities and utilities as key stakeholders
• DCS pilot projects are critical for starting the adoption of technology in market and public sector
should take lead in establishing pilot projects. Prioritize dense industrial, commercial & mixed-use
developments
• Mandate or strongly prioritize district cooling in urban planning, especially for dense greenfield
developments having 8,000 to 10,000 TR/sqkm
• Residential district cooling is viable in dense, mixed-use areas but will likely be confined to
HIG without public investment
• Compulsory use of treated water in cooling towers can cut potable water consumption
• Should consider special power tariffs to promote thermal storage, DCS expansion and
residential connection
• Support access to low cost capital and project development costs
• Establish and standardize project development process, business models and contracting
In India, large central cooling plants have already been in use for many years in the commercial building
segment. Consumers like airports, IT campuses etc. do often provide space cooling by setting up large
centralised air conditioning plants, which are captive systems by nature, i.e. will not expand beyond the
development. However, adoption of Merchant district cooling systems (large central plants which
provide chilled water as a utility service) is still at a very nascent stage in India and it requires concerted
policymaker and industry attention.
Establishing the potential of such systems is critical for justifying the policy measures and action needed to
bring them about. The report authors undertook a detailed exercise of estimating India’s future (national)
space cooling demand and how much of that space cooling demand can be tapped by district cooling
systems in India’s largest cities. The national space cooling demand in new commercial
buildings, which typically could be met by a district cooling service, lies in the range of 51
million ± 15% tons of refrigeration (TR) by year 2037-38. This was estimated based on three
different approaches and could be even higher if public policy shifted to reduce room air conditioning in
favour of more centralised approaches to air conditioning in buildings and if brownfield projects are also
included.
If this level of demand were served by district cooling, an estimated 25 GW of peak power demand
could be reduced in the heart of cities, 27 million tonnes of CO2 and 4,361 tonnes of
refrigerant avoided and annual energy savings of 32 terawatt-hours (TWh). If this demand
were met by trigeneration DCS, peak reduction would increase to 32GW. These figures do not even include
district cooling that could serve brownfield development, industrial and cold chain demand or MIG/HIG
residential demand (which could be included if strong policy support existed).
Of course, in India and many other countries, numerous barriers to delivering such high levels of DCS up
to 2038 exist that make it highly unlikely this level of DCS would transpire. Lack of foresight in planning,
lack of public support and density of new developments are the key determiners that would prevent this
level of DCS being delivered. But India should take inspiration from leading district energy cities and

National District Cooling Potential Study for India
19
countries such as Dubai where 40% of all buildings (residential and commercial) will be connected to DCS
by 2030 and Denmark where almost all buildings in large cities are connected to district heating systems
and customers enjoy some of the lowest heat prices in Europe showing it is definitely possible and affordable
but requires strong government support to reach such levels. Although these countries are at a different
stage of development India does have the benefit that most of its buildings have not been built so cost-
effective and sustainable solutions like DCS could be incorporated early in urban design.
To evaluate less idealistic scenarios and considering district cooling as a “city-led initiative”, the projected
commercial and residential development in 21 Tier 1 and Tier 2 cities of India was analysed. This assessment
of 21 cities1 reveals that approximately 30 million TR of new commercial demand will exist in these
developed/developing cities by the year 2037-38 and an additional 48 mn TR of new residential demand.
Under an optimistic scenario, it is projected that around 9 Mn TR of space cooling in new commercial
buildings can be tapped by district cooling systems in these 21 cities, which would need about 274 district
cooling plants by 2037-382. With an assumption that a proportion of high-end residential apartments in
developed cities will use district cooling systems as solution for space cooling in near future, the potential
for DCS plants (for merchant district cooling) may go up to 300 by year 2037-38. It is also expected that a
greater number of tier 1 and tier 2 cities will be developed by year 2035 and as a result the requirement for
space cooling will increase, leading to increase in DCS potential. Overall, it is estimated that 12.57 million
TR of district cooling could be developed in these cities under an Optimistic scenario.
This enormous potential of DCS offers huge opportunities for energy savings, resource efficiency and
climate benefits to India:
Figure 3: Potential saving opportunities from district cooling systems in India
The application of DCS is best scalable in the case of ‘captive’ as well as ‘merchant district cooling’. While
‘captive’ application is broadly being driven on its own, the uptake of merchant district cooling system
in India is very limited. This can be attributed to the following barriers:
1 21 developed/developing tier 1&2 cities are selected based on population, availability of municipal corporations, availability of master
planning data, having high population density areas and high FAR for future commercial and residential developments 2 1 district cooling plant = 20,000 TR, Diversity considered as 60% in sizing a district cooling plant

National District Cooling Potential Study for India
20
Figure 4: Key barriers for uptake of merchant district cooling systems in India

National District Cooling Potential Study for India 21
Foreseeing enormous potential of district cooling systems in India, it is vital to establish trusted business
models, procurement models and contracting structures, which can attract investors, developers and
end-users for large scale expansion of DCS in the country. Globally, some of the trusted, adopted and generally
practiced business models are: Single ownership and hybrid ownership as shown in figure below.
Some of the key attributes of both these ownership models is depicted in the figure below:
Figure 5: Possible business models for district cooling systems in India
Currently in India the large central plants are “single ownership (designed, installed, and operated by a single
user for their own use)” in nature and completely private business models have been adopted for them. While the
DCS with Hybrid ownership has the potential in addressing the technical, financial and capacity related
barriers associated with the DCS implementation and can deliver better risk sharing between private and public
sector, the adoption of this model is currently limited, partly owing to its more complex contractual arrangements
between multi stakeholder groups (Government, City/ Municipality, Utility (Public / Private), DC service
provider).
Hybrid business models with an emphasis on PPPs and joint ventures should be prioritised and tested in the
Indian context and could benefit from special power and water tariff, financing options for district cooling
service companies and should have involvement of expert contracting firms for various types of contracts and
structuring. Going further in coming years the models of large neighbourhood or even city-level concession zones
should also be explored.
Business models for district cooling systems
Single Ownership
Completely Public
Completely Private
Hybrid Ownership
PPP
Tender based or concessions contract

National District Cooling Potential Study for India 22
Recommendations
A set of concrete policy, technology and financing intervention in terms of recommendations are developed in
order to support and promote merchant type DCS in India. These recommendations are developed through
review of best practice global examples and these are suggested for the short term (0-5 years), medium term (5
to 10 years) and long term (>10years) for various stakeholder categories. The key recommendations are:

National District Cooling Potential Study for India 23
Figure 6: Key recommendations for all stakeholders

National District Cooling Potential Study for India 24
District cooling systems are a proven technology that has been deployed for many years in growing number of
cities worldwide. DCS should be conceptualized in master planning stage of urban development for it to be a
major driver of urban sustainability as it has been in numerous countries. Roles and responsibilities of
municipalities and DISCOMs are utterly vital to promote DCS for large green field commercial developments in
India. There is a need of a District Cooling Code for the country which prescribes legal, administrative, leasing
and contracting guidelines for real estate developers, district cooling service providers, government departments
and financial institutes. It is recommended to implement a few pilot projects (under merchant district cooling)
to demonstrate the technology in Indian scenarios as a first step. In the long run, in order to reach higher shares
of district cooling, fully mandate DCS in urban development and protect customers a full regulatory framework
would likely be required.
National District Cooling Potential Study for India 25
1. Introduction to district cooling
1.1. Overview
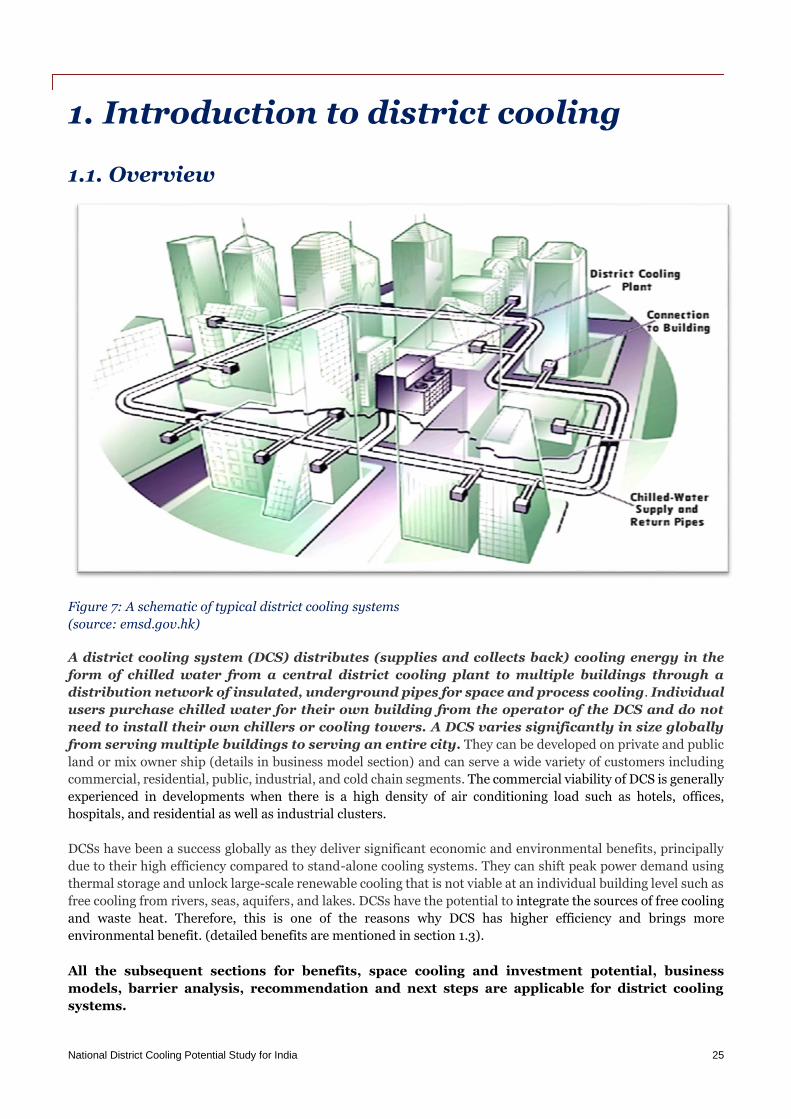
Figure 7: A schematic of typical district cooling systems
(source: emsd.gov.hk)
A district cooling system (DCS) distributes (supplies and collects back) cooling energy in the
form of chilled water from a central district cooling plant to multiple buildings through a
distribution network of insulated, underground pipes for space and process cooling. Individual
users purchase chilled water for their own building from the operator of the DCS and do not
need to install their own chillers or cooling towers. A DCS varies significantly in size globally
from serving multiple buildings to serving an entire city. They can be developed on private and public
land or mix owner ship (details in business model section) and can serve a wide variety of customers including
commercial, residential, public, industrial, and cold chain segments. The commercial viability of DCS is generally
experienced in developments when there is a high density of air conditioning load such as hotels, offices,
hospitals, and residential as well as industrial clusters.
DCSs have been a success globally as they deliver significant economic and environmental benefits, principally
due to their high efficiency compared to stand-alone cooling systems. They can shift peak power demand using
thermal storage and unlock large-scale renewable cooling that is not viable at an individual building level such as
free cooling from rivers, seas, aquifers, and lakes. DCSs have the potential to integrate the sources of free cooling
and waste heat. Therefore, this is one of the reasons why DCS has higher efficiency and brings more
environmental benefit. (detailed benefits are mentioned in section 1.3).
All the subsequent sections for benefits, space cooling and investment potential, business
models, barrier analysis, recommendation and next steps are applicable for district cooling
systems.

National District Cooling Potential Study for India 26
Efficiency savings vary significantly dependent on the cooling systems that are being replaced and the technology
the DCS uses to produce chilled water. In general, DCS projects deliver 30-70% primary energy savings compared
to best-in-class stand-alone systems in dense urban areas. Due to higher efficiency and its ability to phase out
HCFC and HFC refrigerants, DCS (together with trigeneration and thermal storage), is also prioritised in ICAP.
An analysis of the attainable benefits of DCS in India is provided in section 1.3 and summarized here:
Table 2: Summarized benefits of district cooling system attainable in India
Reduced primary energy consumption for cooling system: 30% - 70%3
Benefits to local power grid including local generation, resilience, and balancing
Reduced peak power demand: 30%-35% High reliability of cooling
Reduced potable water use: 15% -20% Greater resilience to power and fossil fuel price volatility
Lifecycle refrigerant saving (20 years)4 10%-15% Ability to use large scale renewable cooling (e.g. solar thermal, free cooling, geothermal, geo-exchange)
Reduced CO2 emissions: 30%-35% Alternative revenue stream for sources of waste heat or cool (e.g. incinerators, industry, LNG terminals)
Local jobs and alternative revenue to municipalities High reliability power (when using trigeneration)
Role in mitigating global warming 0.5 -1°C (high efficiency and phasing out HFC refrigerants)5
In some countries that have substantial heating demand or in industrial applications, the district cooling plant
can also be designed to supply hot water or steam to buildings or industries to form a district heating and cooling
system (DHCS). When cogeneration or trigeneration systems are used, the plant can also provide power for local
buildings or for export to the power grid.
3 The saving potential range is based on conventional to alternate technologies for DCS like trigeneration, free cooling, waste-to-energy plants,
etc. 4 Please refer to Figure 12 in Section 1.3.4 5 in accordance to the Paris Agreement

National District Cooling Potential Study for India 27
1.2. Technological overview
A DCS can be broadly divided into three parts:
An air conditioning plant – generates chilled water for cooling purposes
Distribution network (DN) – distributes chilled water to end users
Energy transfer station (ETS) - interface with buildings' own air-conditioning systems
Figure 8: Key components of a typical district cooling system
(source: fujita-ec.com)
Various technological considerations are required for each of these parts, i.e. chilled water generation,
chilled water distribution and customer connection. The air distribution is generally under the purview of
building owner/customer.
Figure 99 captures the major components involved in each part. The details of these considerations are
provided in Annexure 4 of the report.

National District Cooling Potential Study for India 28
Figure 9: Technological overview of DCS
1.2.1. Examples of technologies used in global district energy systems
Globally, the DCS approach is expanded beyond cooling, whereby systems can also provide hot water
and/or steam (for heating, hot water consumption or industry) dependent on local demands and electric
power for captive consumers, local mini-grids, or the wider power grid. Generally, these systems are called
district energy systems (DES)6. In India, as demand for cooling in buildings greatly exceeds that for heating,
the term district cooling may be taken forward. Globally, such systems have also been integrated with
municipal systems such as water, power, sanitation, sewage treatment, transport, and waste. Examples of
such innovative integration are given below7. This enables integrated energy grids that fuel low-carbon,
energy efficient heating and cooling, and maximize local renewable resources.8
Waste heat capture from waste-to-energy plants for heating or cooling (e.g. Paris, Tokyo)
Treated sewage effluent (TSE) used in cooling towers to reduce potable water use (e.g. Dubai)
6 Other terms used include community energy, district heating, heat networks, etc. For all the basic principle is the same – central
provision of heating or cooling. 7 Numerous cities globally have undertaken each innovation and the cities named are just specific examples. 8 District energy initiative by UNEP
District Cooling System (DCS)
District Cooling Plant
Chilled Water Production
Technologies
Compression Chillers
Absorption Chillers (fired or waste heat)
Heat Exchangers (Free Cooling)
Thermal Energy Storage
Ice Storage
Chilled Water
Heat Rejection
Cooling Towers
Once through with Reservior - Lake,
Sea, etc
Distribution Network
Piping Network Layout
Pumping Scheme
Pipe Material & Components
Energy Transfer Station
Direct Connection
Direct Connection with Tertiary Pumps
Indirect Connection - PHE

National District Cooling Potential Study for India 29
Wastewater system used to replace cooling towers in cooling season and as waste heat source in heating
season (e.g. Zhengzhou, Paris)
Waste heat extracted from metro system for district heating (e.g. London, Paris) and metro station
served with district cooling (e.g. Dubai)
Cogeneration/trigeneration directly powering city metros or electric transport (e.g. London)
Integrated district heating and cooling networks, whereby heat pumps extract heat from return pipes
of district cooling (e.g. Helsinki)
Geothermal wells used as emergency water wells for city (e.g. Paris)
Waste heat from local industries used for heating and cooling (e.g. Rotterdam, Gothenburg, Anshan)
Waste cool from LNG regasification used in district cooling (e.g. Barcelona)
Cogeneration used to provide emergency shelters and hospitals with back-up power and heat during
disasters (e.g. Toronto, New York)
Incentivized thermal storage used to reduce renewable power curtailment on the power grid (e.g.
Guangzhou, Hohhot, Copenhagen)
Free cooling extracted from potable water extraction from a nearby lake (e.g. Toronto)
Multi-utility tunnels house piping and cabling of numerous municipal services (e.g. GIFT City)
District heating pipelines used for district cooling service in cooling season (e.g. Zhengzhou)
Biogas and landfill gas used in gas cogeneration (e.g. Paris)
District heating or cooling plants placed underground and/or disguised as green parks (e.g. Paris,
Shenzhen)
Use of Open Cycle Gas Turbine Power Plant waste heat for desalination (e.g. Dubai)
1.3. Benefits of DCS
Why district cooling?
District cooling is being implemented worldwide by many kinds of organisations, including investor-owned
power utilities, government-owned utilities, privately owned district energy companies, universities,
airports, IT campuses, etc. District Cooling systems can serve a wide variety of buildings, viz. commercial
offices, hotels, residential, sports arenas, malls, schools and hospitals, Food Processing Industries, as well
as the cold chain.
District cooling is growing rapidly for many reasons (drivers and benefits):
Increasing demand for comfort cooling and process cooling (data centres, cold chain etc.)
Some cities and countries are beginning to view district cooling as a public service alongside water,
gas, and electricity
Outsourcing certain operations to specialist companies that can provide these services more cost
effectively, at a higher quality, reliability, and more sustainably
Economical/commercial benefits to the end users
Reduction in peak electricity demand provided by district cooling
Environmental policies to reduce emissions of CO2 and refrigerants and use of potable water in
cooling
Customer value provided by district cooling service, i.e., potential lifecycle and upfront cost savings,
superior comfort, convenience, flexibility, reliability, and space-saving in customers’ roofs and
basements

National District Cooling Potential Study for India 30
1.3.1. End user benefits of district cooling
1. Comfort - Comfort is the ultimate purpose of air conditioning. DCSs can keep people more
comfortable because industrial-grade equipment is used to provide a consistent and high-quality
source of cooling. In addition, expert operating teams can be focused on optimal operation and
maintenance of cooling systems, thus increasing the reliability significantly. Buildings are quieter
because there is no heavy equipment generating vibration and noise. Local urban heat island effects
can be reduced significantly by centrally producing chilled water, using renewables that reduce
dumping of heat in local atmosphere (e.g. free cooling with water bodies), and producing more
chilled water at night with thermal storage. District cooling operators can also advise buildings on
how to optimize and improve their internal HVAC systems for the good of the whole DCS network
and increased comfort. Systems providing domestic hot water can allow households or businesses
to do away with geysers and boilers and have high efficiency hot water whenever they require it.
2. Convenience - From the developer / building manager’s standpoint, it is attractive to be able to
provide reliable comfort without worrying about managing the equipment, labour, and material
required for operating and maintaining chillers and cooling tower systems. This allows the manager
to focus resources on more critical bottom-line tasks such as attracting and retaining tenants. For
a hotel, the critical bottom-line tasks are managing guest experience. For a hospital, these are
patient care and IEQ and the same in case of a mall include, managing its customer flow, lighting
and ambience.
3. Flexibility - The pattern and timing of cooling requirements in a building vary depending on
building use and weather. With building chiller systems, meeting air-conditioning requirements at
night or on weekends can be difficult and costly, particularly when the load is less. With district
cooling, these needs can be met easily and cost-effectively whenever necessary. Each building can
use as much or as little cooling as needed, whenever required, without worrying about chiller
cycling or efficiency.
4. Reliability - District cooling is more reliable than the conventional approach to cooling because
DCSs use highly reliable industrial equipment and can provide equipment redundancy in cost
effective manner. Staffed with professional operators around-the-clock, district cooling companies
are specialist with expert operations and preventive maintenance programmes. Survey of existing
DCS have shown reliability of > 99.9% as per International District Energy Association (IDEA).
5. Sustainability - Globally, building owners and tenants are demanding higher environmental
standards in building design and services. District cooling in combination with building efficiency
measures can significantly improve green building certifications, especially when the DCSs can
access waste heat or renewable sources of energy that are unavailable at a single building level.
1.3.2. Cost benefits in district cooling installation
District cooling has numerous fundamental cost advantages that offer cost-savings to buildings. These
include the following:
1. Reduced installed capacity - Not all buildings have their peak load at the same time. This “load
diversity” means that when cooling loads are combined in a DCS, more buildings can be reliably
National District Cooling Potential Study for India 31
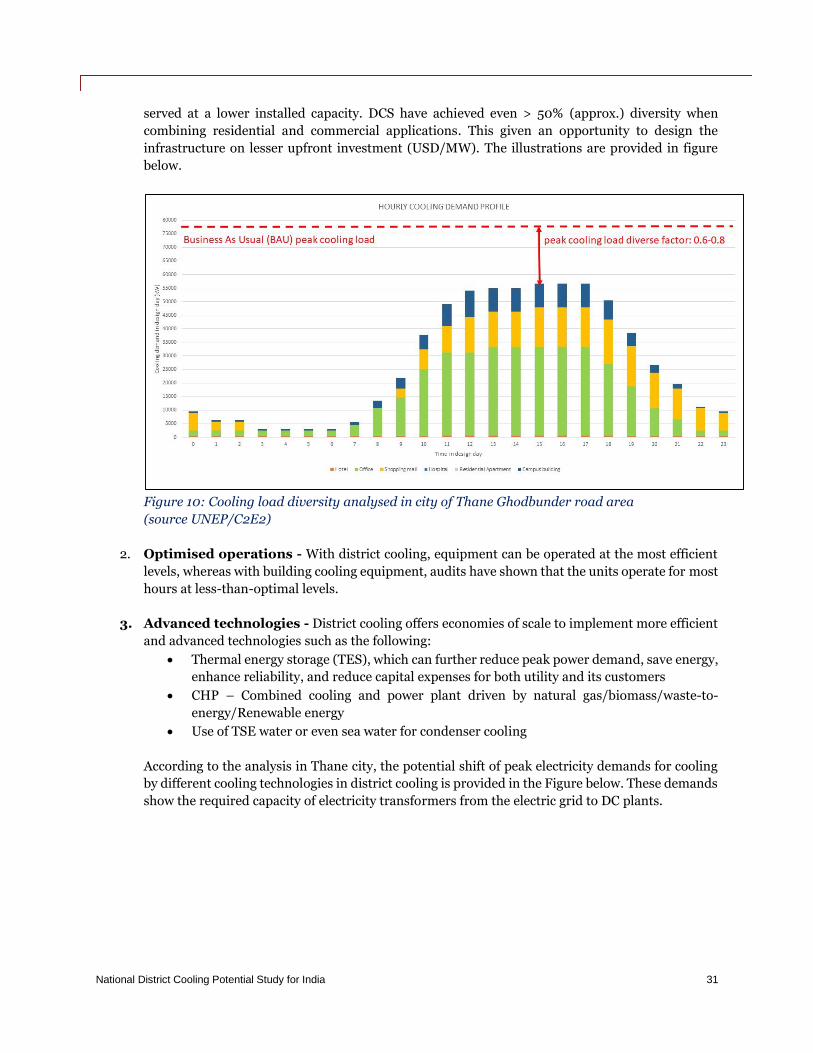
served at a lower installed capacity. DCS have achieved even > 50% (approx.) diversity when
combining residential and commercial applications. This given an opportunity to design the
infrastructure on lesser upfront investment (USD/MW). The illustrations are provided in figure
below.
Figure 10: Cooling load diversity analysed in city of Thane Ghodbunder road area
(source UNEP/C2E2)
2. Optimised operations - With district cooling, equipment can be operated at the most efficient
levels, whereas with building cooling equipment, audits have shown that the units operate for most
hours at less-than-optimal levels.
3. Advanced technologies - District cooling offers economies of scale to implement more efficient
and advanced technologies such as the following:
Thermal energy storage (TES), which can further reduce peak power demand, save energy,
enhance reliability, and reduce capital expenses for both utility and its customers
CHP – Combined cooling and power plant driven by natural gas/biomass/waste-to-
energy/Renewable energy
Use of TSE water or even sea water for condenser cooling
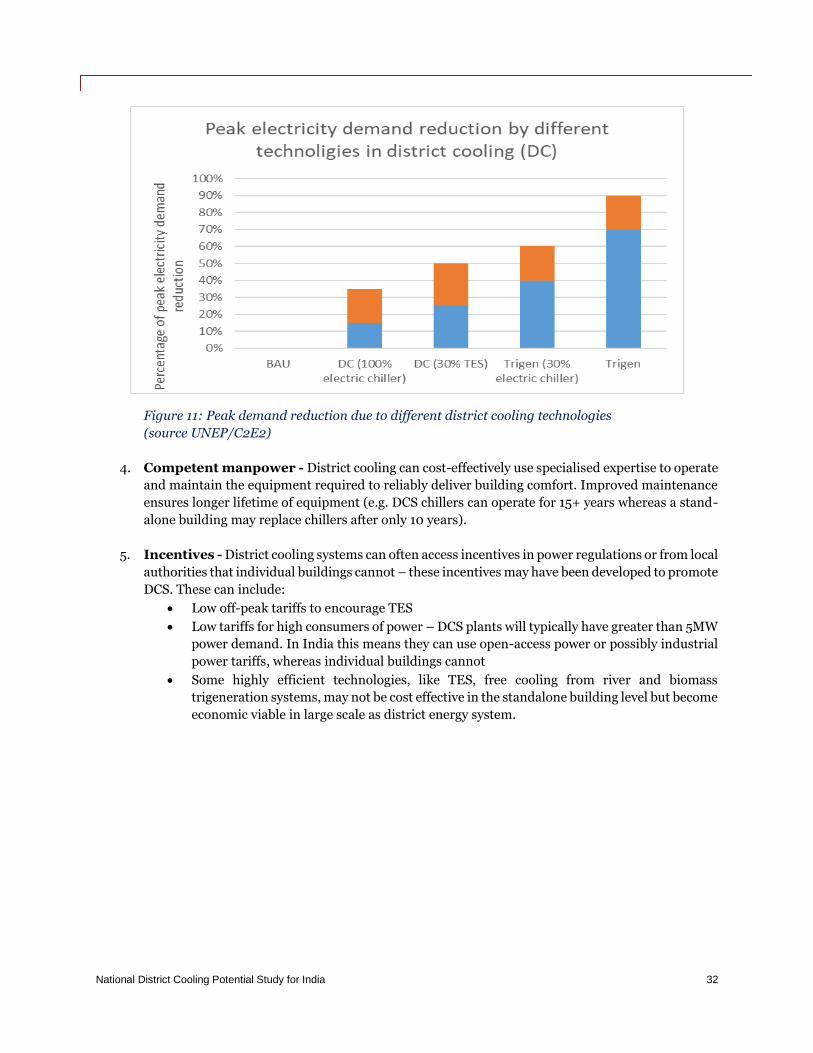
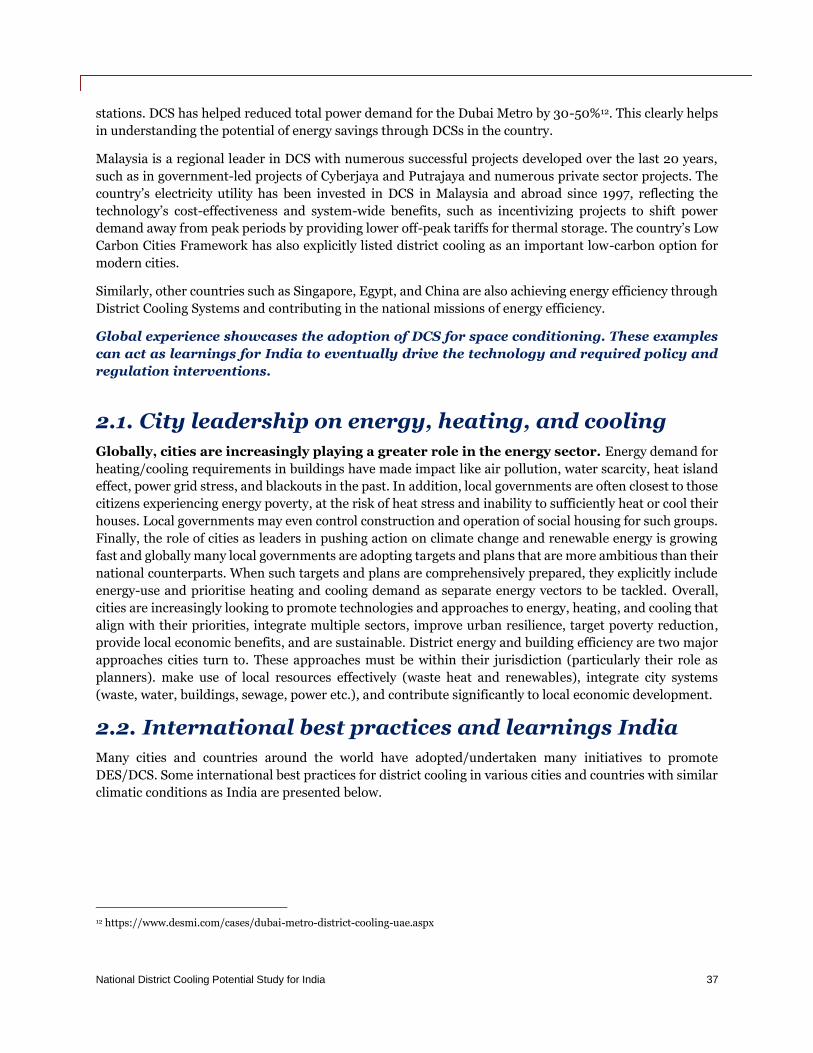
According to the analysis in Thane city, the potential shift of peak electricity demands for cooling
by different cooling technologies in district cooling is provided in the Figure below. These demands
show the required capacity of electricity transformers from the electric grid to DC plants.
National District Cooling Potential Study for India 32
Figure 11: Peak demand reduction due to different district cooling technologies
(source UNEP/C2E2)
4. Competent manpower - District cooling can cost-effectively use specialised expertise to operate
and maintain the equipment required to reliably deliver building comfort. Improved maintenance
ensures longer lifetime of equipment (e.g. DCS chillers can operate for 15+ years whereas a stand-
alone building may replace chillers after only 10 years).
5. Incentives - District cooling systems can often access incentives in power regulations or from local
authorities that individual buildings cannot – these incentives may have been developed to promote
DCS. These can include:
Low off-peak tariffs to encourage TES
Low tariffs for high consumers of power – DCS plants will typically have greater than 5MW
power demand. In India this means they can use open-access power or possibly industrial
power tariffs, whereas individual buildings cannot
Some highly efficient technologies, like TES, free cooling from river and biomass
trigeneration systems, may not be cost effective in the standalone building level but become
economic viable in large scale as district energy system.

National District Cooling Potential Study for India 33
Benefits of DCS vs Individual Building Chiller Plants
The overall benefits of district cooling plant with the individual chiller plant for buildings, is given below:
Table 3: Overall benefits of DCS vs Individual Building Chiller Plant
Capital cost benefits Operating cost benefits
By choosing district cooling service, a building avoids a large capital investment for the following:
Chillers and condenser cooling equipment
Power utility connection size deposit
Transformers, breakers, and cables
DG back-up cost and space
Water treatment plant
Water supply system for cooling towers and the electrical systems to support it
Construction cost for mechanic rooms for above systems (electric, cooling, water supply)
Construction and structure cost of cooling towers and their pipes to chillers
District cooling service allows the building owner to eliminate the annual cost of operating and maintaining for the following:
Scheduled annual maintenance
Periodic major maintenance
Unscheduled repairs
Refrigerant management
Spare parts and labour
Water treatment chemicals and monitoring system
Water and wastewater disposal costs
Management oversights
Predictable cost estimation
1.3.3. Infrastructure benefits
1. Peak power demand reduction - District cooling reduces peak power demand in new
development by 40 - 80% depending on the type of district cooling technology used and proportion
of TES. Gas based CCHP (combined cooling, heat and power) or trigeneration can reduce peak
power substantially and provide local power close to demand.
2. Reduction in cost to city governments and DISCOM – For city governments, district
cooling offers the benefits of utilisation of power/heat generated from WTE plant. This eventually
enables city governments in achieving their sustainable development goals by reducing carbon
emissions. For DISCOMS, district cooling reduces the capital investment required for additional
power generation, transmission, and distribution infrastructure.
3. Long-term grid balancing services - District cooling and district heating plants globally have
helped to support balancing of the power system and increased shares of renewable electricity,
reducing curtailment (e.g. Denmark, Germany, China). The combination of responsive, local power
production (CHP), demand (chillers/heat pumps), and storage enables this. For India, DCS should
be a key infrastructure for balancing the power grid as the share of renewables increases.
1.3.4. Environmental benefits
1. Energy efficiency - District cooling with DCPs using electric chillers can typically reduce annual
electricity consumption by ~25% over individual water-cooled central plant. In many cases, this
reduction can be higher, reaching 30-40%. When technologies such as CHP and/or free cooling are
used, electricity reductions can be up over 80%.

National District Cooling Potential Study for India 34
A substantial portion of energy savings results from ‘optimised operations and maintenance’ and
efficient use of quality water for cooling tower. Individual buildings use conventional water
treatment, which may not be suitable based on the available water quality. District cooling plants
could be designed to use no municipal water and use a variety of technologies such as:
Sea water / brackish water
RO plants
Treated sewage effluent (TSE)
Individual building systems use ‘standard water treatment’, i.e., water softener that may or may not
be suitable. Improper water quality is one of the biggest reasons for derationing of chillers and
cooling towers causing an impact of 30-35%, on equipment performance (in efficiency levels) in
many cases.
2. Climate change - With growing national and international interest in strong action on climate
change, climate change has become an increasingly important issue. District cooling can help
extensively in mitigating the impact of new development on climate change through higher energy
efficiency and this also leads to reduction in CO2 emissions by 30%-35%
3. Water savings - Cities are witnessing a looming water crisis. Buildings with central plants
continue to use ground water or potable municipal water in cooling towers. Most buildings just
have a softener for water treatment, which may not be enough.
With water supplies becoming scarcer, DCSs can be designed based on TSE provided by municipal
authorities. However, TSE quality may not be consistent or predictable but DCPs can design
suitable water treatment systems for this issue. In the DCS design proper filtration and real time
water treatment system is conceived for better water management and hence the DCP can operate
at better CoC (cycles of concentration) minimizing the water loss.
Although the make-up water requirements of DCS vs individual plants will not be drastically
different, DCS can and should be designed with “STP recycled water”, whereas individual building
chiller plants end up using “Municipal Water / Borewell Water”.
In present scenario, it can very well be estimated that > 50% of the make-up water being used in
individual building chiller plants is “fresh water” in India. With cities facing acute water shortages,
such wastage of “fresh water” can and should be avoided.
Based on 2,500 equivalent full load hours, a 20,000TR district cooling plant annual
make-up water consumption will be approx. 500 million litres. Therefore, a single
district cooling plant has the potential to save 250 million litres per annum of fresh
water from being used incorrectly in cooling towers.
4. Refrigerant savings - Refrigerant management is a larger issue that has more-or-less been
ignored in commercial buildings. Refrigerant leaks are not discovered timely and records of top-
ups are not maintained properly. Most plant rooms do not have refrigerant leak detectors and
almost none of them have a refrigerant storage and recovery unit.

National District Cooling Potential Study for India 35
In general, a chiller loses 2% of its refrigerant charge per annum9. With better maintenance, usage of
refrigerant leak detectors & RSR units, a DCS Plant can reduce refrigerant loss to less than 0.5% per annum.
Figure 12: Refrigerant lifecycle
(Source : UNEP/C2E2)
A 20,000TR DCS plant would replace roughly 30,000TR of individual building-level chiller
plants (due to diversity factor, stand-by, and TES Tank). Refrigerant top-up of 2% per
annum is considered as a thumb rule for chillers installed in commercial buildings vs 0.5%
per annum for DCS. Thus, annual savings in refrigerant top-up can be reduced by 1,250
lbs. This is equivalent to reducing direct CO2 emissions by ~750,000 kgs per annum per
plant.
9 LEED for new construction and major renovations V2.2, Credit EAc4 Enhanced Refrigerant Management, formula for refrigerant
leakage (2% default)

National District Cooling Potential Study for India 36
2. Global district energy systems (DES) best practices
Although projects for district energy systems, have existed for over 100 years, DES is experiencing a global
resurgence in Europe, the US, Canada, Gulf nations, Japan, Korea, Malaysia, China and some
projects are coming up in Latin America, North Africa, ASEAN, and island countries. This
resurgence can be attributed to the following:
Cities and countries having reviewed strategies to improve energy consumption (more reliable,
more sustainable, more cost-effective) and are increasingly engaged and active on heating and/or
cooling as stand-alone energy-uses that require specific market interventions10.
Cities are increasingly empowered to act upon energy in general, which is also enabled by an
increasingly decentralised energy system shifting from centralised fossil fuel power plants.
Increased best practice sharing between countries and rise of global players on DES pushing the
market in each continent.
Increased focus on efficiency, renewables, air pollution, water use, and climate change, as well as a
shift away from fossil fuels for reasons of energy security and environment, necessitates solutions
such as DES to be considered.
Different11 countries like Sweden, UAE, Singapore, China, Colombia, France, Malaysia, and Egypt
all have started meeting their air conditioning demand with (DCS). As an approach to cooling, DES is not
only applicable for hot countries or only developed countries. Indeed, the pace of real estate development
in emerging economies and increasing cooling demand makes these markets ideal for district cooling
investments.
For example, in the UAE, the first district-cooling scheme was commissioned in 1999 by Tabreed. By 2017,
the total installed district cooling had
reached 3 million TR, representing 10% of
the UAE’s total air-conditioning market.
Currently, air conditioning accounts for up
to 70% of the UAE’s electricity demand. By
2030, the cooling demand is expected to
increase to 20 million TR, of which 40%% is
targeted to be provided via District Cooling
Systems that will help in 30% reduction of
carbon emissions.
Additionally, the Dubai Metro system, is
the first mass transit network in the world to
use district cooling to lower temperature in
10 Previously, cooling had been seen as an ‘electricity sector problem’ when in fact it needs separate attention by policymakers
11 (different based on climate zones and cooling/heating requirements)
Figure 13: Dubai Metro – The first mass transit network in
the world to use district cooling
National District Cooling Potential Study for India 37
stations. DCS has helped reduced total power demand for the Dubai Metro by 30-50%12. This clearly helps
in understanding the potential of energy savings through DCSs in the country.
Malaysia is a regional leader in DCS with numerous successful projects developed over the last 20 years,
such as in government-led projects of Cyberjaya and Putrajaya and numerous private sector projects. The
country’s electricity utility has been invested in DCS in Malaysia and abroad since 1997, reflecting the
technology’s cost-effectiveness and system-wide benefits, such as incentivizing projects to shift power
demand away from peak periods by providing lower off-peak tariffs for thermal storage. The country’s Low
Carbon Cities Framework has also explicitly listed district cooling as an important low-carbon option for
modern cities.
Similarly, other countries such as Singapore, Egypt, and China are also achieving energy efficiency through
District Cooling Systems and contributing in the national missions of energy efficiency.
Global experience showcases the adoption of DCS for space conditioning. These examples
can act as learnings for India to eventually drive the technology and required policy and
regulation interventions.
2.1. City leadership on energy, heating, and cooling
Globally, cities are increasingly playing a greater role in the energy sector. Energy demand for
heating/cooling requirements in buildings have made impact like air pollution, water scarcity, heat island
effect, power grid stress, and blackouts in the past. In addition, local governments are often closest to those
citizens experiencing energy poverty, at the risk of heat stress and inability to sufficiently heat or cool their
houses. Local governments may even control construction and operation of social housing for such groups.
Finally, the role of cities as leaders in pushing action on climate change and renewable energy is growing
fast and globally many local governments are adopting targets and plans that are more ambitious than their
national counterparts. When such targets and plans are comprehensively prepared, they explicitly include
energy-use and prioritise heating and cooling demand as separate energy vectors to be tackled. Overall,
cities are increasingly looking to promote technologies and approaches to energy, heating, and cooling that
align with their priorities, integrate multiple sectors, improve urban resilience, target poverty reduction,
provide local economic benefits, and are sustainable. District energy and building efficiency are two major
approaches cities turn to. These approaches must be within their jurisdiction (particularly their role as
planners). make use of local resources effectively (waste heat and renewables), integrate city systems
(waste, water, buildings, sewage, power etc.), and contribute significantly to local economic development.
2.2. International best practices and learnings India
Many cities and countries around the world have adopted/undertaken many initiatives to promote
DES/DCS. Some international best practices for district cooling in various cities and countries with similar
climatic conditions as India are presented below.
12 https://www.desmi.com/cases/dubai-metro-district-cooling-uae.aspx

National District Cooling Potential Study for India 38
Table 4: International analysis on different parameters
Name of the
country
Assessment Parameters
Scenario of
DCS in the
country
Barriers for DCS
in the country
Success drivers
to the district
cooling systems
Learnings for
India
UAE - Dubai Multiple projects
installed in the
last 2 decades.
Over 75 plants of
DCS with
refrigeration
capacity of more
than 3 MnTR.
Most of the new
commercial and
residential
development are
addressed by
DCS.
Adoptability of
technology among
developers
Lack of
concentrated
loads/anchor loads
in initial phases
Lack of centrally
cooled buildings
that can be
converted into DCS
Government policy for adoption and enforcement of technology
Upcoming dense development in city
Trusted business models
Replacement of
air-cooled
chillers with
efficient water-
cooled district
cooling
technology
Awareness
among the end
users by efforts
of the
government
Climatic
conditions
favour the need
of DCSs in Dubai
Policy framework
supporting DCS
adoption at city-
level
Involvement of
municipal
corporation in
master planning
Different kind of
Business models
and energy
planning methods
Capturing market
of air-cooled
chiller as potential
consumer for DCS
Careful sizing and
commissioning of
DCS plants and
networks to avoid
overinvestment
before consumer
demand
Will of utilities in
district cooling as
strategy
Development of
awareness
programmes
Shenzhen –
China
China has one of
the largest
installations of
DCS with the
capacity of 0.4
million TR
designed air
conditioning
capacity serving
19 million sqm
area, mainly
covering offices,
Awareness towards
the technology Integration of
energy planning
to urban
planning and
incentive policy
to ensure the
connection of
DC
High density
areas that are
Involvement of
municipal
corporation in
integrating DCS in
master planning
Prioritise DCS for
commercial sector
Use of treated
wastewater for
cooling towers

National District Cooling Potential Study for India 39
commercial,
hotels, metro
stations, etc. The
phase wise
development of
this project
started in 2011
and will end by
2025 (phase III).
preferable for
DCS
Municipality
required land to
be set aside by
real estate
developers for
DCP
High land price
for the end-users
to build their
own systems
inside their
buildings
Climatic
conditions
Potential DCS
consumer in high
density area
Not feasible for
only residential
sector. It should be
clubbed with load
of commercial
buildings
Use of ice storage
in high density
areas significantly
lowers peak power
demand but limits
efficiency benefits
of DCS (ice storage
increases kW/TR
Singapore Biggest project of
Singapore for
DCS, having
2,60,000 TR
cooling capacity,
serving Marina
Bay. The
development is
mix use
commercial
development
having hotels,
offices,
community
centre, etc.
Project started in
2006 and first
phase was
commissioned in
year 2010.
The strong
regulations for EE in
buildings at design
stages limits the
requirement/scope of
DCSs in country.
Formation of
Singapore
district cooling
Pte Ltd, by
government in
year 2000
District cooling
act and licensing
provisions in the
country
Targeting dense
and greenfield
development as
potential
consumer of
DCS
Support from
green building
movement
Conducted
awareness and
training
programmes for
end users
Policy
development for
supporting DCS in
country
Formation of
regulatory body to
push DCS
adoption in India
Feasibility in
green field
development
Not feasible for
only residential
sector. It should be
clubbed with load
of commercial
buildings
Inclusion in green
building
guidelines
Awareness and
training
programmes
Paris -
France
District cooling
has been
operated in Paris
under a
Cooling season for
residential sector is
2 months, hence
Paris DCS is
Involvement of
municipal
corporation in
Involvement of
municipal
corporation in

National District Cooling Potential Study for India 40
concession since
1991, where
Climespace
constructed the
first cooling
network in
Europe. This
network replaces
air conditioning
and chillers for
many offices,
shops and hotels
as well as some of
the most famous
buildings in
Paris, such as the
Louvre, by
pumping cold
water around the
city. There are
number of
examples where
district heating is
being used in
residential sector.
connected to non-
residential sector
where anchors had
been predicted.
planning and
routing
Formation of
Paris Urban
Heating
Company
(PUHC)
Underground
connections are
made to the
River Seine
Possible low
tariff for social
housing
60% of the DCS
network in Paris
is run through
the city’s sewage
system.
integrating DCS in
master planning
Formation of task
force at city level
to drive DCS
For constructing a
DCS network,
involvement of the
city authorities
plays an important
role to coordinate
with other
utilities.
Special tariffs as
per user segment
Not feasible for
only residential
sector. It should be
clubbed with load
of commercial
buildings
Cyberjaya –
Malaysia
There are
numerous district
cooling plants in
Malaysia. The
first plant was
completed and
became
operational in
1999 and serves
various
commercial
buildings.
Malaysia now has
several DCSs,
including its
largest one in
Cyberjaya. This
serves 48
buildings with
14,000 TR
capacity in total.
It has TES
No specific body to
regulate the
development of
district energy.
Lack of awareness
about District
Cooling Systems’
benefits.
No specific acts or
regulations
applicable to
district energy in
Malaysia.
Lack of funding for
early-stage
assessments of
projects
Lack of innovative
business models.
Interest of
individuals have
resulted in
installation on
around 15 plants
in country
Cogeneration
plants are more
(may be due to
gas availability
and prices)
Capacity
building on the
benefits of DCS
If gas is available,
then COGEN
plants can be
option
Not feasible for
only residential
sector. The
existing plants
cover commercial
spaces for space
cooling.
Awareness among
the developers and
builders

National District Cooling Potential Study for India 41
capacity of
95,000 RTH
Smart
Village –
Egypt
One of the
projects “smart
village”, adopted
in May 2004,
has1,44,000 TR
air conditioning
requirement,
mainly covering
IT buildings of
the SEZ. First
stage was
inaugurated in
July 2006 with
8000 TR. The
project is
expected to be
completed by
2025.
Spread out
developments
Risk of early investments
Lack of awareness
Smart village
was designed
from master
planning phase.
Complete
development is
green field
development
and has not
included
residential in the
potential
consumers of
DCS.
Heating requirement also catered by DCS
Project viability due to low power cost and cheap gas availability
Spread out
development (low
density areas)
leads to extra cost
for piping
Not feasible for
only residential
sector. It should be
clubbed with load
of commercial
buildings
DCS inclusion in
master planning
stage. 8000 to
10000 TR/sqkm
as minimum
requirement for
viability of DCS in
India

National District Cooling Potential Study for India 42
2.2.1. Key success driver of DCS adoption in Dubai - UAE
Figure 14 below shows the current overall cooling technology market share in Dubai. The city has
diversified cooling technologies (by market share) adopted by various end users. The contribution of
centralised cooling in stand-alone buildings from air-cooled chillers is significantly higher compared to the
water-cooled systems. This is likely due to water scarcity and cost issues, given Dubai’s water comes from
desalination. The Government of Dubai has targeted to take district cooling share from 18% to 40% by 2030
as part of an overall strategy, including building efficiency measures, to reduce the city’s air-conditioning
power demand by 50%. This target for district cooling is achievable, in part, as the large, addressable market
of 25% of buildings with centralized air-cooled systems will be highly cost-effective to connect. End Users
will see a lot of cost savings with DCS if they are using air-cooled chillers as the kW/TR for Air Cooled is
more than 1.4 kW/TR compared to 0.9 to 1.0 kW/TR for DCS.13
Figure 14: Overall cooling technology market share in Dubai (year 2015) Source: RSB Dubai - Dubai Cooling Study
The target is to connect all new developments and all public sector building to the DCSs by 2030. This had
also been recently accompanied by stronger regulation. The market is regulated by Regulatory &
Supervisory Bureau for electricity and water in Dubai (RSB) in terms of licensing district cooling providers,
billing, disputes, etc.14
13 Dubai cooling study by RSB 14 Utilities Middle East, District Cooling In Dubai To Be Regulated For Disputes, 2018 https://www.utilities-me.com/news/12193-
district-cooling-in-dubai-to-be-regulated-for-disputes
18%
7%
25%
2%
30%
18%
Overall cooling technology market share in Dubai
District Cooling Central Cooling, Water Cooled Central Cooling, Air Cooled
Variable Refrigerant Flow Ducted Split/Packaged Units Split Units/Window Acs

National District Cooling Potential Study for India 43
3. District cooling systems in India
District cooling system is one of the not in-kind technology in India (as per ICAP). District cooling systems
enable higher flexibility to incorporate multiple energy vectors (solar cooling, tri-generation, and waste cold
energy) to meet cooling requirements and provide the ability to exploit thermal storage options or to adopt
a system level management of cooling consumption.
Based on the currently installed and operational DCSs in India, there are broadly two types of systems:
1. These are designed, installed, and operated by a single user for their own use like airports, IT
campuses, office complexes, malls, hospitals, etc. These large central plants can be termed
as “single ownership” executed through EPC route.
2. These are large central plants that are not necessarily owned by the user, but they cater to mixed
use areas such as special economic zones (SEZ), high density commercial developments, food
parks, etc. and serve multiple types of buildings for cooling purpose. These can be termed as
“merchant type district cooling plants” where chilled water is served as utility to
consumers/buildings.
Some examples of DCS systems in India are given below:
1. GIFT City, Ahmedabad – 180,000 TR capacity (at full long-term capacity)
2. DLF cyber city (trigeneration based) – 78,000 TR capacity
3. Delhi Airport – Approx. 20,000 TR capacity
4. Mumbai Airport – Approx. 20,000 TR capacity
5. Chennai Airport – Approx. 12,000 TR capacity
6. Kolkata Airport – Approx. 12,000 TR capacity
7. Dhirubhai Ambani Knowledge City, Navi Mumbai- Approx. 12,000 TR capacity
8. Infosys (various campuses) – Approx. 50,000 TR (approx.)
9. Pragati Maidan, Delhi - Approx. 12,000 TR capacity (In Construction)
10. India International Convention Centre, Delhi – Approx. 10,000 TR capacity (In Construction)
For large and dense mix-use developments in India, district cooling makes techno-commercial sense over
individual chiller plants. Existing district cooling plants and large central air conditioning plants are majorly
single ownership type of plants. Merchant district cooling offers greater potential of DCS technology due to
load diversity, flexibility in capital design, and installation. This needs to be planned and implemented to
mitigate all the risks using policy intervention and support. Please refer to section 2.2 for international case
studies of DCP. Single ownership type of plants is being adopted by the end users/developers
(like IT buildings, airports etc.) in business as usual scenarios.
All the subsequent sections for estimating potential, investment potential, business
models, barrier analysis and recommendations are applicable for merchant district
cooling only.

National District Cooling Potential Study for India 44
Gujarat International Finance Tech-City or
GIFT City is India’s first merchant DCS developed by
the Government of Gujarat. GIFT City has been
developed on 886 acres of land with a planned total
built up area of 5.76 Mn Sqm, and includes commercial
buildings, residential buildings, social buildings such
as hotel, club and malls, and a hospital. With DCS,
the total requirement of 270,000TR of air-
conditioning shall be met with just 180,000TR
of chillers. Each plant has been designed with chilled
water based stratified thermal energy storage tank,
which can be charged during off-peak period and
discharged during peak period, thus reducing the
electrical demand from 240MW to 135 MW
only.
GIFT City is a notable example of DCS that was properly planned with involvement of authorities and
municipal corporation for planning and implementation of DCS in Gift city. GIFT city has experienced
challenges in terms of demand assessment. Currently, only one plant of 10,000TR is operational
feeding eight buildings. In DCS, capital costs are “front-loaded” because of the high costs of installing basic
plant infrastructure and pipe mains in the early years.
Another successful example of district cooling for
commercial buildings is DLF Cyber city,
Gurgaon. DLF cyber city is India's Largest
Integrated Business District and it has private
captive power generation system. The project was
developed in 2012, based on trigeneration. It serves
10 buildings, with conditioned area of more than 1.7
Mn Sqm. Cooling demand of 78,000 TR and power
demand of 140 MW is served by trigeneration. This
technology helped DLF to reduce 100 MW power
demand and saves around 36,000 tonne CO2 per
year. The plant is operating well and serving all the
connected buildings. As the Cogen plant is
located in the basement of one of the buildings, there are some concerns regarding fire
safety. Also, the increase in the price of gas over time has impacted the viability of self-
generation of power.
Amaravati Government Complex, Andhra Pradesh
Envisioned as a future sustainable city for the new capital for the State of Andhra Pradesh, the Amaravati
master plan included several sustainability aspects including a city-wide network of district cooling plants
wherever cooling load density was sufficient for life cycle cooling costs to be lower with DCS vs stand-alone
cooling systems. The first amongst these DCS for 20,000 TR was planned for the government complex
area by Andhra Pradesh Capital Region Development Authority (APCRDA) to be implemented through a
33-year public-private partnership concession. APCRDA undertook a global tender (the first of its kind for
a district cooling system in India) following which the concession was signed with Tabreed India in
Figure 15: GIFT one tower
Figure 16: View of DLF cyber city

National District Cooling Potential Study for India 45
February 2019. The firm offered to invest, develop and operate the DCS included a district cooling plant
that would be expanded in a modular fashion in future, chilled water based stratified thermal energy storage
tank, and networks designed to accommodate connecting future plant rooms to serve up to 80,000 TR
whilst delivering a 20% life cycle cost savings versus stand-alone cooling and a 35% peak power
demand reduction.
The construction of the DCS is now pending completion of the ongoing review by the new state government
on changes to the planned capital city.
3.1. Initiatives in India for DCS
Foreseeing the growth in space cooling demand in India, in 2015 the UNEP-led District Energy in
Cities Initiative15 with EESL as its coordinator started supporting five Indian cities - Bhopal,
Coimbatore, Pune, Rajkot, and Thane to explore district cooling projects. Rapid assessments were
undertaken in five of these cities with ICLEI South Asia Secretariat where the feasibility of DCSs were
assessed and confirmed and diverse local policy recommendations prepared16. In November 2017, these
assessments were published alongside a high-level analysis on India’s national and state-level policy
framework for district cooling and potential measures and incentives at the state and national level that
could be used to kick-start district cooling in the country. Out of these cities, Rajkot and Thane were
selected as pilot cities. Rajkot has become the first Indian city to incorporate district cooling in the smart
city plan. The team is supporting Rajkot city to finalize the DPR tendering for DC in their Smart City
projects. Thane has a brownfield project under consideration by municipal corporation. In addition, the
cities of Hyderabad Pharmacity and Amaravati (as described in earlier section) have also been supported
as pilot cities.
City of Amaravati in Andhra Pradesh successfully tendered for a large DCS system in the government
complex area. However, the development of the Amaravati city is currently on hold. The procurement
documents and proposed business model can be used in other projects in India. The Initiative is also
supporting Hyderabad Pharmacity in Telangana which could have 210,000 RT of DCS and also a district
heating steam network. Technical support from the Initiative and other partners from the Initiative is being
provided to the project owners and local authorities for preparing the full tendering documents.
The Initiative is supporting pilot cities following a methodology established by UNEP after analysing 45
champion cities for district energy in 2015. This methodology is presented in ‘District Energy in Cities:
Unlocking the Potential of Energy Efficiency and Renewable Energy’17 and summarised below:
16 Available from: www.districtenergyinitiative.org/India 17 Available from: www.districtenergyinitiative.org/publications

National District Cooling Potential Study for India 46
Figure 17: 10-step methodology for developing and promoting district energy in cities Source: UNEP, 2015
3.1.1. Thane pilot city
Thane was selected as the Initiative’s first pilot city in India and has been supported to follow the 10-step
methodology in the above figure. Lead partners supporting the city are UNEP, ICLEI, EESL, IFC, C2E2 and
the Carbon Trust.
A rapid assessment18 was prepared and provided high-level technical and financial assessments of multiple
upcoming or existing real estate projects in the city and identified barriers to their implementation. Two
ideal sites for implementation of DCS were identified and taken to prefeasibility study19, technology options
were considered and both sites were found to be highly commercially viable either being a) entirely run on
electric chillers b) hybrid project of trigeneration and electric chillers:
1) Ghodbunder Road project: a 8,800 TR brownfield project connecting 6 diverse existing
buildings (malls, hospital, offices, etc.) with IRR20 of 31% for a CAPEX of $22 million for
trigeneration option; and
18 Available from:
http://www.districtenergyinitiative.org/sites/default/files/Thane%20Rapid%20Assessment%20Report%20Version%201.0-2.pdf 19 Available from: http://www.districtenergyinitiative.org/sites/default/files/Thane%20District%20Cooling%20Pre-
Feasibility%20Studies%20FINAL.pdf 20 Pre-tax, over 20 years

National District Cooling Potential Study for India 47
2) Hiranandani Estate project: a 9,700 TR greenfield DCS project in the Hiranandani Estate
in Thane connecting 6 large IT buildings and a hotel with IRR of 19% for a CAPEX of $27 million
for trigeneration option.
After the pre-feasibility studies, a UNEP-led team conducted numerous stakeholders’ discussions with the
city of Thane and Hiranandani Group to go through business models and procurement options. The
Ghodbunder road project is still under discussion with the city but has been setback several reasons
including COVID-19. As it is a brownfield project, these delays are not a significant issue, but the project
does need to be again championed by the city who has been crucial for bringing existing buildings on board
with the scheme. The numerous offers of support to the city to cover project development and tendering
costs need to be taken forward. Two likely business models and procurements being considered are a public
tender for a private sector concession or EESL establishing a PPP to take forward the project with the city.
The city has committed to making available land for the DCS plant and rights-of-way under municipal roads
for DCS network and encouraging buildings to connect in the concession area.
The Hiranandani project construction timetable was extremely fast and early inclusion of DCS in the
planning was not possible as the project was selected mid-construction. The time taken for awareness
raising, bringing the real estate developer on board, feasibility analysis and identifying the business model
meant that the project had moved from greenfield to brownfield before DCS could be confirmed. This shows
that for Greenfield projects very early consideration of DCS is needed to match the very fast real estate pace
in India or, if DCS is identified at midpoint of development, it is likely only a Business-to-Business
arrangement that could move fast enough to meet the timetable. The DES Initiative is in discussions with
Hiranandani Group to include DCS in the Panvel development in Mumbai where space is being left under
roads for DCS network.
Figure 18: Hiranandani Estate project (left) overview and Ghodbunder Road project (right) Source: UNEP, 2015
These were two of the first projects in India to go through a public prefeasibility process and the results and
economic tool are being made available for other projects in Thane and India.

National District Cooling Potential Study for India 48
Beyond supporting the pilot projects, UNEP and partners have also taken significant other measures in the
city:
Developed energy and cooling GIS mapping that can be used in a city to understand the cooling
demand in a city and to identify areas of high density (see figure below).
Identified the viability of district cooling in one selected high cooling density cluster which is
planned for future redevelopment and commented on next steps to determine feasibility of the
system.
Provided detailed policy recommendations to facilitate the use of district cooling in Thane
Proposed a coordination structure for a District Cooling Cell in Thane
Developed city-wide plan for DCS, defining a series of actions, policies and investments to deliver
the full potential of district energy alongside a pipeline of projects to serve as a starting point.
Building on the cooling demand mapping and deep assessment study, the Urban Revival Plan 12/
Wagle Estate area is indicated to support a viable district cooling network.
Significant training and capacity building to the city and local stakeholders
Designing a Monitoring, Reporting and Verification (MRV) framework for DCS in Thane and India
While these exercises have been applied to the city of Thane, the processes and methodologies are replicable
and all documents, tools, methodologies and trainings are being prepared to be made available in an online
Virtual Platform.
Figure 19: GIS Energy and Cool Mapping in Thane with Wagle Estate area detailed on right
3.1.2. Rajkot pilot city
The city of Rajkot was one of the first cities globally to sign up to the District Energy in Cities initiative
under UNEP in 2015. Following this a rapid assessment of district energy potential was undertaken by
UNEP, ICLEI, C2E2 and EESL covering amongst others the need, sustainability benefits and potential

National District Cooling Potential Study for India 49
impact from district cooling and the policy measures needed to take it forward. The assessment rightly
concluded that district cooling is indeed commercially viable in Rajkot without the need for any separate
viability gap funding or other policy measures from the state or the city. However the success for district
cooling adoption would depend on projects being well designed right at the planning stage, robust
implementation models being adopted either by the private sector or through PPP models and through
active involvement of RMC considering this as a quasi-public utility to ensure benefits are captured and all
stakeholders (consumers, real estate developers, city municipality, district cooling provider, electricity and
other utilities) benefit in a fair manner.
Rajkot with support from the Initiative decided to develop more detailed evaluation of district cooling for
the area-based development under its Smart City Plan as recommended in the rapid assessment. Rajkot
Municipal Corporation (RMC) with their consultants INI Design Studio undertook a high-level techno-
commercial analysis of district cooling versus other cooling options and analysed various scenarios for how
much of this development if not 100% of proposed FSI should adopt district cooling.
The master plan study concluded that a district cooling system (DCS) would both be more economical and
sustainable compared to decentralized water, air-cooled or DX systems within each building for air-
conditioning. The master plan further proposed to adopt following strategy:
All commercial, RMC, institutional, government and high-end residential buildings (3 or more-
bedroom units) alone should be included under the district cooling scope with a total cooling load
of 44,681 RT
Two plots be used within the master plan of size 80x40 meters for two district cooling plants of
14,000 RT each and thermal storage tanks (TES) for up to 4 hours of storage for 3,500 RT be
incorporated
Infrastructure design to include sufficient corridors for a district cooling network (400 mm to
800mm chilled water supply and return lines) that can be buried or routed in the utility duct.
The 66KV substation with dual sources/cabling be planned to ensure reliability of electricity
supply for the total demand of 25MW for the district cooling plant
Peak make-up water demand for the proposed district cooling plants of 3.78 MLD be met through
tertiary treated water from the proposed sewage treatment plant (STP)
In addition to the high-level parameters proposed above in planning a district cooling system, the master
plan rightly suggested suitable “mandated connection” be in place through bylaws that ensure a land parcel
developer mandatorily designs their buildings with DCS in mind and connects to the DCS. This is a key
policy for district cooling to be ‘de-risked’. The master plan study on DCS provided high level guidance for
Rajkot Smart City in taking a Go/No-Go decision with regards to incorporating DCS into the development
plan and demonstrated very generically possible options on how a DCS system could be planned along with
some institutional planning aspects that RMC would need to keep in mind when implementing district
cooling. RMC incorporated DCS into its Smart City Plan which has given the project a long-term support
even through changing administration and COVID-19.
RMC has acted fast and with engineering support from UNEP prepared design for DCS pipeline network
with a dedicated corridor for DCS pipelines. They also integrated DCS in their overall ‘integrated
infrastructure tender’ for the smart city area, prepared for laying out pipes for the other utilities like waste
water supply pipelines, drinking water pipelines, electrical ducts etc.

National District Cooling Potential Study for India 50
UNEP, ICLEI and RMC have decided to appoint a mix of local and international consultants to prepare a
detail project report to take the full project (including DCS plant and operation) to tender and design
appropriate policies. UNEP is supporting RMC to seek funding for this cost and is discussing with
development banks and EESL.
The key lesson Rajkot has shown is that early-stage analysis of DCS, strong leadership from a city and
inclusion of DCS in a city’s long-term strategy and plan are crucial for DCS development led by a city.

National District Cooling Potential Study for India 51
4. Space cooling demand in commercial buildings in India
The space cooling demand in India is expected to rise by 11 times from the year 2018 to the year 2038
(ICAP). According to the International Energy Agency (IEA), by 2050 India is going to be the largest
consumer of space cooling in the world with business-as-usual space cooling potentially responsible for
28% of electricity demand and 44% of the peak load21.
This provides a huge opportunity to opt for DCS in India to reduce energy demand, balance the power grid,
and gain the technological, socio economic, and sustainability benefits as have been described previously.
The following chapter details space cooling estimations enlisted in ICAP. Also, different
scenarios have been derived through other approaches, to evaluate the potential district
cooling market in India.
4.1. India Cooling Action Plan (ICAP)- Demand estimates
India Cooling Action Plan (ICAP), published by the Ministry of Environment, Forest & Climate Change, has
been referred to as the basis for estimating the demand for space cooling in India.
ICAP22 is the latest document referring specifically to India’s cooling demand with
appropriate approach to arrive at the conclusions for potential requirements of cooling
across the sectors. Therefore, this document is referred as the basis for the estimation.
4.1.1. Cooling demand
India, a growing economy, is characterised by rising per capita income, rapid urbanisation, and a largely
tropical climate. These factors will play a significant role in the rise of the cooling requirement in the
country. As per ICAP, the cooling requirements can be divided into the following major sectors.
According to the ICAP, the breakup of nationwide cooling requirement was 57% in space cooling in
buildings (residential and commercial), followed by 23% in transport air conditioning, 20% in refrigeration
and 0.5% in cold chain in 2017-18. By 2037-38, the nationwide cooling requirements is projected to grow
21 International Energy Agency, Future of Cooling 22 ICAP 2019
Space cooling in buildings
Refrigeration
Transport air conditioning
Cold chain
Figure 20: Various cooling sectors in India
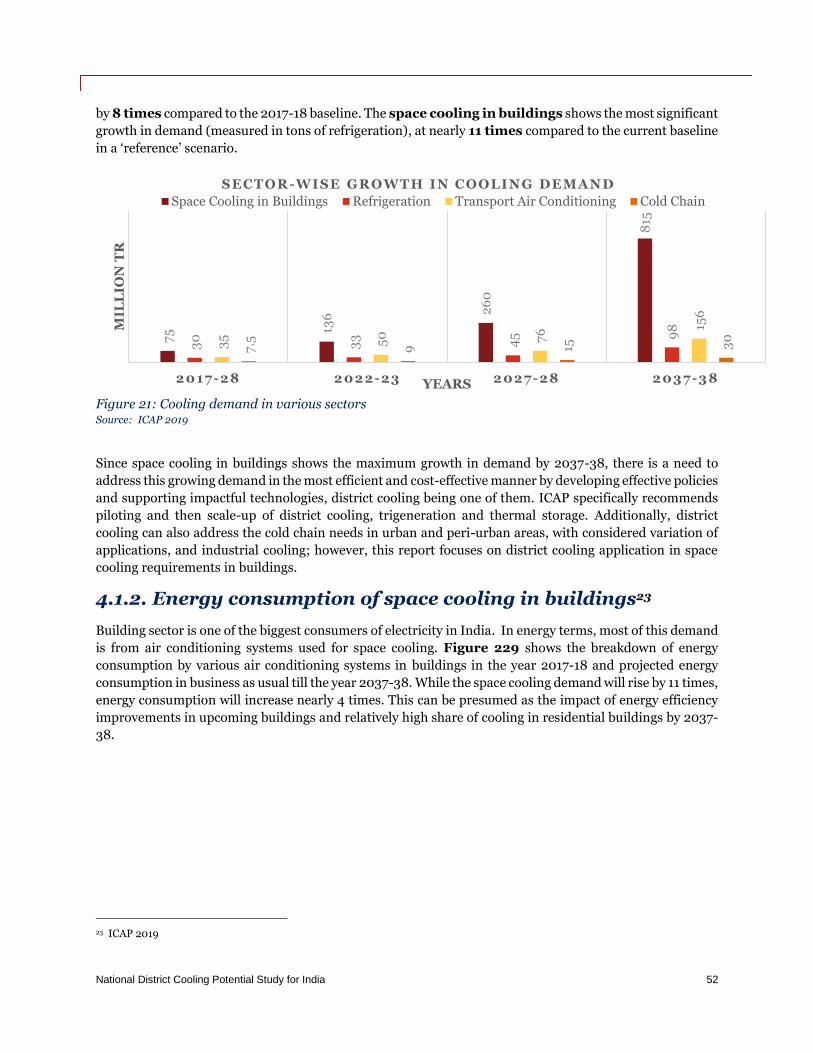
National District Cooling Potential Study for India 52
by 8 times compared to the 2017-18 baseline. The space cooling in buildings shows the most significant
growth in demand (measured in tons of refrigeration), at nearly 11 times compared to the current baseline
in a ‘reference’ scenario.
Figure 21: Cooling demand in various sectors Source: ICAP 2019
Since space cooling in buildings shows the maximum growth in demand by 2037-38, there is a need to
address this growing demand in the most efficient and cost-effective manner by developing effective policies
and supporting impactful technologies, district cooling being one of them. ICAP specifically recommends
piloting and then scale-up of district cooling, trigeneration and thermal storage. Additionally, district
cooling can also address the cold chain needs in urban and peri-urban areas, with considered variation of
applications, and industrial cooling; however, this report focuses on district cooling application in space
cooling requirements in buildings.
4.1.2. Energy consumption of space cooling in buildings23
Building sector is one of the biggest consumers of electricity in India. In energy terms, most of this demand
is from air conditioning systems used for space cooling. Figure 229 shows the breakdown of energy
consumption by various air conditioning systems in buildings in the year 2017-18 and projected energy
consumption in business as usual till the year 2037-38. While the space cooling demand will rise by 11 times,
energy consumption will increase nearly 4 times. This can be presumed as the impact of energy efficiency
improvements in upcoming buildings and relatively high share of cooling in residential buildings by 2037-
38.
23 ICAP 2019
75 13
6 26
0
815
30
33 45 9
8
35 50 76 15
6
7.5 9 15 30
2017-28 2022-23 2027-28 2037-38
MIL
LIO
N T
R
YEARS
SECTOR -WISE GROWTH IN COOLING DEMAND
Space Cooling in Buildings Refrigeration Transport Air Conditioning Cold Chain

National District Cooling Potential Study for India 53
Source: ICAP 2019
As observed in the figure above, within space cooling, room air conditioners hold a dominant share of the
sector’s cooling energy consumption – at 42% in 2017-18 and which could grow to 52% by 2037-38.
Currently, room air conditioners have a penetration of 7-9% in India, and most of the residences are cooled
by fans and air coolers. Fans and air coolers will remain universal in 2037-38 and will consume nearly as
much energy as systems such as chillers, DX, VRF and RAC. Energy efficiency in room air conditioner (RAC)
segment is already targeted through the following initiatives:
Standard and labelling programme of Bureau of Energy Efficiency (BEE) for fixed as well as
variable speed air conditioners
Energy Efficiency Services Limited (EESL’s) programme for promoting super-efficient and climate
friendly air conditioners
Therefore, this segment is already being covered by the government to improve energy efficiency.
The energy consumption for air conditioning not including RACs, i.e. chillers, VRF (already being used in
high end residences also apart from commercial buildings) and packaged AC is currently at 27 TWh and is
projected to grow by 433% to approx. 140 TWh in business as usual scenario by 2037-38. Such demand is
predominantly concentrated in the commercial sector and needs to be addressed in a cost-effective and
sustainable way.
42%
9%3%8%
30%
8%
2017-18 - 135 TWh
Room Air Conditioner Chiller System
VRF System Packaged AC
Fan Air Cooler
52%
11%
9%
4%
11%
13%
2037-38 - 585 TWh
Room Air Conditioner Chiller System
VRF System Packaged AC
Fan Air Cooler
Figure 22: Space cooling energy consumption by equipment in the year 2017-18 and projections in 2037-38

National District Cooling Potential Study for India 54
4.2. Approaches adopted for assessment
ICAP provides assessment of cooling demand and the project team has expanded on this and examined
different approaches to assess the national cooling demand in India that could be met by district cooling.
4.3. Summary of national cooling demand, for new
commercial buildings, from different approaches
A comprehensive analysis for estimating the cooling potential is performed with the above-mentioned
approaches. The detailed analysis can be found in annexure 1 & 2.
It was observed that the national cooling demand for space cooling, in new commercial
buildings that may typically be considered for DCS connection, by various approaches lies
in the range of 51 million TR ± 15%, by year 2037-38. If this level of demand were served by district
cooling an estimated 25 GW of peak power demand could be reduced in the heart of cities, 27
million tonnes of CO2 and 4,361 tonnes of refrigerant avoided and annual energy savings of
32 terawatt-hours (TWh). If this demand were met by trigeneration DCS, peak reduction would
increase to 32GW. These figures do not even include district cooling that could serve brownfield
Approach 1: Cooling demand based on total electricity consumption in space cooling for select technologies
Referring to the current electricity consumption and projected electricity consumption by select air conditioning equipments (chillers, VRF and Package DX) as given in ICAP
Estimating the consumption by space cooling equipments (chillers, VRF and package DX)
Projecting electricity consumption to 2037-38 (in TWh) by these seleceted space cooling equipments
Approach 2: Cooling demand based on total commercial air-conditioned area and air conditioning requirements
Referring to the current and projected commercial built up area by 2037-38 data and current and projected air conditioning demand for the said commercial built up area by 2037-38.
Estimating the additional space requirement by 2037-38
Considered rigours implementation of ECBC and accounting energy efficiency while designing buildings
Approach 3: Cooling demand based on stock of refrigerant based equipments
Referring to the current stock and potential stock of refrigerant based equipment
Considering equipment for commercial use (chiller, VRF and package DX) and its stock
Excluding the RAC component as chillers, VRF and package DX are typically commercial equipments
Discounting the standby stock (as we are estimating cooling load not the installed capacity)
Calculating stock projected (in million TR) by 2037-38

National District Cooling Potential Study for India 55
development, industrial and cold chain demand or MIG/HIG residential demand (which could be included
if strong policy support existed).
Of course, in India and many other countries, numerous barriers to delivering such high levels of DCS up
to 2038 exist that make it highly unlikely this level of DCS would transpire. Lack of foresight in
planning, lack of public support and density of new developments are the key determiners that would
prevent this level of DCS being delivered. But India should take inspiration from leading district energy
cities and countries such as Dubai where 40% of all buildings (residential and commercial) will be
connected to DCS by 2030 and Denmark where almost all buildings in large cities are connected to district
heating systems and customers enjoy some of the lowest heat prices in Europe showing it is definitely
possible and affordable but requires strong government support to reach such levels. Although these
countries are at a different stage of development India does have the benefit that most of its buildings have
not been built so cost-effective and sustainable solutions like DCS could be incorporated early in urban
design.
The next section evaluates less idealistic scenarios and by considering district cooling as a “city-led
initiative”, estimates how much cooling demand can be catered by district cooling in 21 Tier 1 and Tier 2
cities.
National District Cooling Potential Study for India 56
5. Estimation of potential of district cooling in India
The urban population of the country is expected to grow from 410 to 814 million from 2014 till 2050 (census
of India 2011). It is an enormous task to handle this urban evolution and its associated implications in
energy use and climate. India will likely be the largest consumer of space cooling in the world, with space
cooling responsible for 28% of electricity demand, by 205024. This demand for space cooling will be
concentrated in India’s rapidly growing cities raising the prospect for city-led approaches to space cooling
(including district cooling).
5.1. Methodology of assessment
Global experience shows that demonstrating DCS, and certainly expanding DCS from isolated projects to
large urban areas, is a ‘city-led initiative’ requiring non-financial/financial (case-to-case variation)
support from city governments, the most important being the incorporation of DCS into urban planning25.
Certainly, individual private sector led projects will (and do) take-off with minimal intervention from public
sector, but these will find it difficult to expand beyond private land without public support. For the high-
level analysis, the following parameters were adopted for an initial selection of Indian cities for
assessment that could cater significant shares of their space cooling demand by DCS26. After selection of
cities, a detailed analysis is conducted:
24 International Energy Agency, Future of Cooling. 25 In India, large tracts of land are also planned at the state-government level (e.g. industrial areas) making the State Planning
Departments also critical stakeholders for incorporating DCS into urban planning 26 None of these parameters are absolute and DCS will be able to develop in cities and regions where the parameters are not met, but
it will likely be more difficult.

National District Cooling Potential Study for India 57
Figure 23: Three-step analysis to access DCS potential in Indian cities
5.2. Summary of the detailed analysis to estimate
potential of DCS in Indian cities
Indian cities are developing rapidly. Infrastructure requirements keep increasing due to rapid urbanisation
and economic growth. All metro cities in India like Delhi NCR, Mumbai, Bangalore, Hyderabad, etc. are
developing vertically. Mixed-use development and high-rise premium residential buildings
have become a trend in construction practice, and this is favourable for viability of DCS. A
detailed analysis of master plans of such cities shows a significant proportion of air conditioning demand
of commercial and high-end residential buildings can be served by DCS.
For estimation of potential, master plans of 21 cities (including 12 cities of Tier 1 and 9 developing cities of
tier 2) were assessed. It was observed in Chapter 4 that the national cooling demand for space
cooling in new commercial buildings or similar, by various approaches, lies in the range
of 51 million TR ± 15%, by year 2037-38 (section 4.3). This assessment of 21 cities shows
that about 30 million TR will be required for commercial buildings in these
developed/developing cities, by year 2037-3827. Further, to estimate the potential of DCSs, out of
this total space cooling demand, different scenarios like conservative, moderate, and optimistic are
considered.
A summary of this analysis is presented in the table below. Please refer to annexure 3 for detailed analysis.
27 Although methodologies do differ due to data availability at different scales it is compared as a point of interest that these 21 cities
do represent the bulk of demand identified in Chapter 4.
Step 1: Assessment of developed Tier 1 and
developing Tier 2 cities, for commercial buildings
•Considering cities having population atleast 2.5 million (Census 2011)•Functional and forward looking municipal corporation•Availability of master plans for 2030-31•Cities with high population density for economic viability•Considering Cities with high FAR for future Commercial development
Step 2: Assessment of Tier 2 cities, for commercial
buildings
•Considering cities having population at least 1 million (Census 2011)•Presence of municipal corporation/municipality•Availability of master plans for 2030-31•Cities with high population density for economic viability•Considering Cities with high FAR for future Commercial development
Step 3: Assessment of Tier 1 and Tier 2 cities, for residential buildings
•Assessment for residential sector with potential of high rise premium apartments
•Considering all metro cities, developing cities of Tier 1 and Tier 2 (Census 2011)
•Cities with high population density for economic viability•Considering Cities with high FAR for future residential development

National District Cooling Potential Study for India 58
Table 5: Total potential air-conditioned area catered by district cooling in Tier I and Tier II cities for new
commercial buildings
Potential of DCS in new commercial buildings in India for year 2037-38
Potential in Tier 1, 12 developed cities
Potential in Tier 2, 9 developing cities
Estimated new commercial Built up area (BUA) (mn sqm) by 2037-38
1080 252
Derived air conditioned area based on growth rate on pro-rata comparison with ICAP (mn sqm)
689 161
Area, in mn sqm
AC requirement, in mn TR
Number of DCS plants*
Area, in mn sqm
AC requirement, in mn TR
Number of DCS plants*
Conservative scenario – Considering 10% as potential of DCS
69 2.47 74 16 0.58 17
Moderate scenario - Considering 15% as potential of DCS
103 3.71 111 24 0.87 26
Optimistic scenario - Considering 30% as potential of DCS
207 7.41 222 48 1.73 52
*Diversity considered as 60% in sizing a district cooling plant
It is also to be considered that more tier 1 and tier 2 cities (apart from listed cities in table 9 & 10) will be
coming up by year 2035 and hence the requirement for space cooling will increase, leading to increased
DCS potential but these are not considered here.
Table 6: Total potential air-conditioned area catered by district cooling in Tier I and Tier II cities for
residential buildings
Potential of DCS in residential buildings in India by year 2037-38
Estimated new residential BUA (mn sqm) by 2037-38
4546
Considering 30% as air-conditioned area, in mn sqm, by 2037-38
1364
Area, in mn sqm
AC requirement, in
mn TR
Number of district cooling
plants* Conservative scenario – Considering 3% as potential of DCS
41 1.5 18
Moderate scenario - Considering 5% as potential of DCS
68 2.4 29

National District Cooling Potential Study for India 59
Optimistic scenario - Considering 7% as potential of DCS
95 3.4 41
*Diversity considered as 80% in sizing a district cooling plant
It is considered that 30% of the residential demand catered by DCS would be catered for by their own,
dedicated district cooling plants. The majority, i.e. 70% of residential demand connecting to DCS need not
have separate DCS plants as this demand can be catered for by a district cooling plant which will have been
established for a commercial development. Since advantage of DCS is to benefit from load diversity,
residential sector needs can be met, in-part, by DCS plants included in the commercial-sector analysis
above.
Consideration of conservative, moderate and optimistic scenario is done based on policy push,
involvement of municipal corporations/municipalities, pilot, and awareness programmes and many
other factors. The scenarios are briefly described below:
Figure 24: Different scenarios for estimation of achievable potential of DC in India
This is the achievable potential of DCS for the targeted cities, which can be captured in next
10-18 years of time span. The above potential is based on application of space cooling only,
and does not include DCS for food parks, industrial zones, etc.
5.3. Investment potential, energy saving, and energy demand reduction using district cooling systems
The following chart summarises the investment potential of district cooling along with savings in energy
consumption and potential savings in energy demand in commercial developments in selected Tier 1 and
Tier 2 cities of India up by year 2037-38:
Table 7: Energy saving, energy demand, and investment potential
Attributes By Year 2037-2038
Conservative Scenario
Moderate Scenario
Optimistic Scenario
Conservative Scenario
•Business as usual scenario where big developers, campuses and individual building owners opt voluntarily for DCS through EPC route
•Limited pilot projects for Merchant DCS
•No policy push from government
•Non inclusion at master planning level
•Limited awareness / involvement of Utility
Moderate Scenario
•Few pilot projects•Light policy push from
government•Inclusion at master planning
levels and local area planning in SEZs and leading area-based developments
•Involvement of municipalities & utilities
•Awareness programs in place for developers, municipal corporations, utilities, financial institutions etc
•Incentive schemes in place
Optimistic Scenario
•Strong policy push from government for mandating DCS for large, dense developments
•Inclusion at master planning levels
•Pilot programmes supported by governments
•District cooling code in place•Municipal corporation &
DISCOM stake in DCS
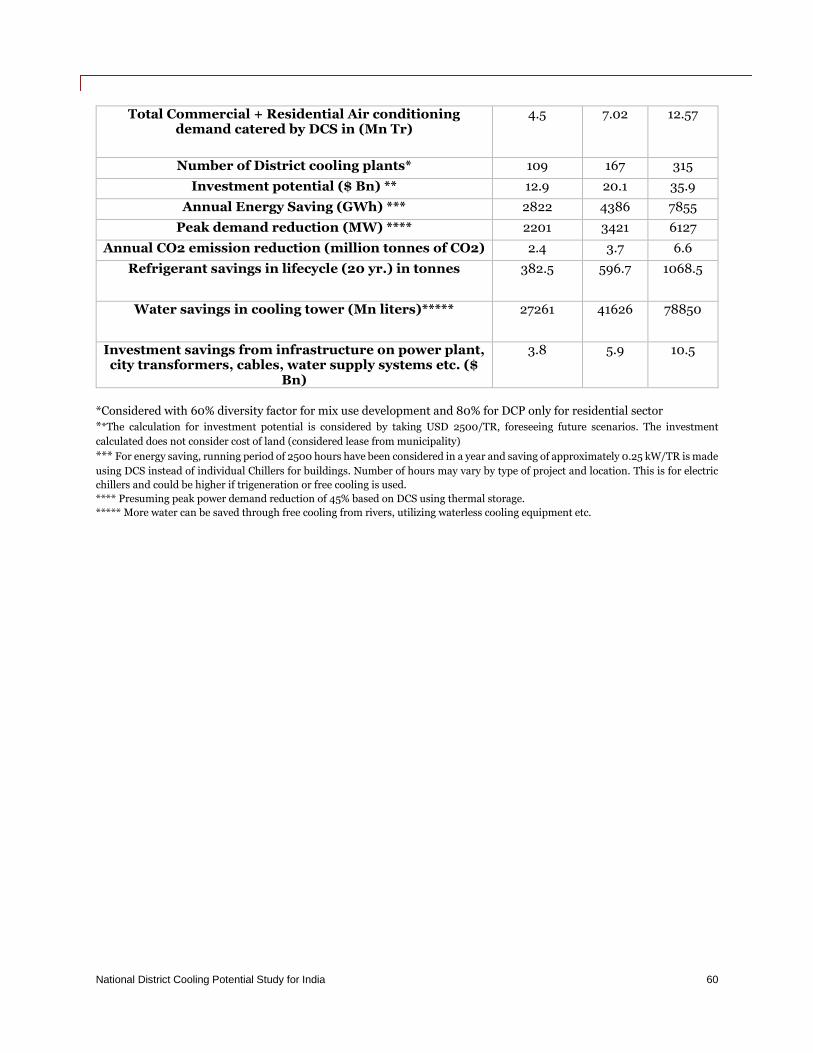
National District Cooling Potential Study for India 60
Total Commercial + Residential Air conditioning demand catered by DCS in (Mn Tr)
4.5 7.02 12.57
Number of District cooling plants* 109 167 315
Investment potential ($ Bn) ** 12.9 20.1 35.9
Annual Energy Saving (GWh) *** 2822 4386 7855
Peak demand reduction (MW) **** 2201 3421 6127
Annual CO2 emission reduction (million tonnes of CO2) 2.4 3.7 6.6
Refrigerant savings in lifecycle (20 yr.) in tonnes 382.5 596.7 1068.5
Water savings in cooling tower (Mn liters)***** 27261 41626 78850
Investment savings from infrastructure on power plant, city transformers, cables, water supply systems etc. ($
Bn)
3.8 5.9 10.5
*Considered with 60% diversity factor for mix use development and 80% for DCP only for residential sector
**The calculation for investment potential is considered by taking USD 2500/TR, foreseeing future scenarios. The investment
calculated does not consider cost of land (considered lease from municipality)
*** For energy saving, running period of 2500 hours have been considered in a year and saving of approximately 0.25 kW/TR is made
using DCS instead of individual Chillers for buildings. Number of hours may vary by type of project and location. This is for electric
chillers and could be higher if trigeneration or free cooling is used.
**** Presuming peak power demand reduction of 45% based on DCS using thermal storage.
***** More water can be saved through free cooling from rivers, utilizing waterless cooling equipment etc.

National District Cooling Potential Study for India 61
6. Business models, governance, and contracting for district energy systems
The first step toward building a business model for a district cooling project, is to understand the base
requirements which form the foundation of the project. The ownership pattern of the base requirements
determines, and ultimately shape up the applicable business model for the project. Before carrying out any
further work or analysis on the project, the ownership pattern of these foundations must be clearly scoped.
Any variation in the scoping of these essential requirements can:
upset the overall project viability; and
change the subsequent fundamentals and activities in the intricately linked developmental cycle of
the project
The base requirements in a district cooling project are as follows -
Figure 25: Base requirements for a district cooling project
Once the scoping of foundations is frozen, the degree of control (exercised by the public or private sector)
is broadly established. Majority of district cooling projects around the world (especially the developing
economies), involve a greater degree of control of public sector by acting as an investor, owner, operator or
consumer. Typical stakeholders’ groups and their roles in a district cooling project can be broadly
summarized as follows –
Land for the disctrict cooling plant
Equipments (Chillers, CT, pumps etc.) and Distribution/piping network - Dedicated corridor, route approval
Load Demand - Fixed anchor load for viability, mixed use variable load for scalability

National District Cooling Potential Study for India 62
Figure 26: Different stakeholders in DC project
Even the projects with a high degree of private sector control and ownership are facilitated by the public
sector through policy interventions and regulations.
6.1. Cost components of district cooling
The major driver of the district cooling business model is the availability of finance (and its structure) for
its various components. The major cost components of a district cooling project are –
Like all the other business propositions, ROI (Return on Investment) determines the profile of
stakeholders (private / public) investing in the project. The envisaged ROI of the project determines if the
major source of funding for a project is from private or public sector. For example, private sector generally
aims for higher ROI propositions because of its underlying motive of maximizing profit. The public sector
•Government, City / Municipality, DC cooling service provider
Investor / sponsor
•Government, City/ Municipality, Utility (Public / Private) , DC cooling service provider
Owner
• Municipality,Utility ( Public / Private), DC cooling service provider, community owned not for profit
Operator
• Goverment buildings, Anchor loads (govt / private), private commerial complexes, highly dense residential areas
Consumer
Costs for metering equipment for individual network or plot connections
Contruction and laying costs for individual network or plot connections
Contruction and laying costs for common distribution network
Equipment / Machinery costs
Land / lease costs for district cooling plantDistrict cooling plant
Consumer 1
Common
distribution
network
Individual
network /
Plot
connection
Consumer 2
Consumer 3
Figure 27: Various components of a district cooling
network
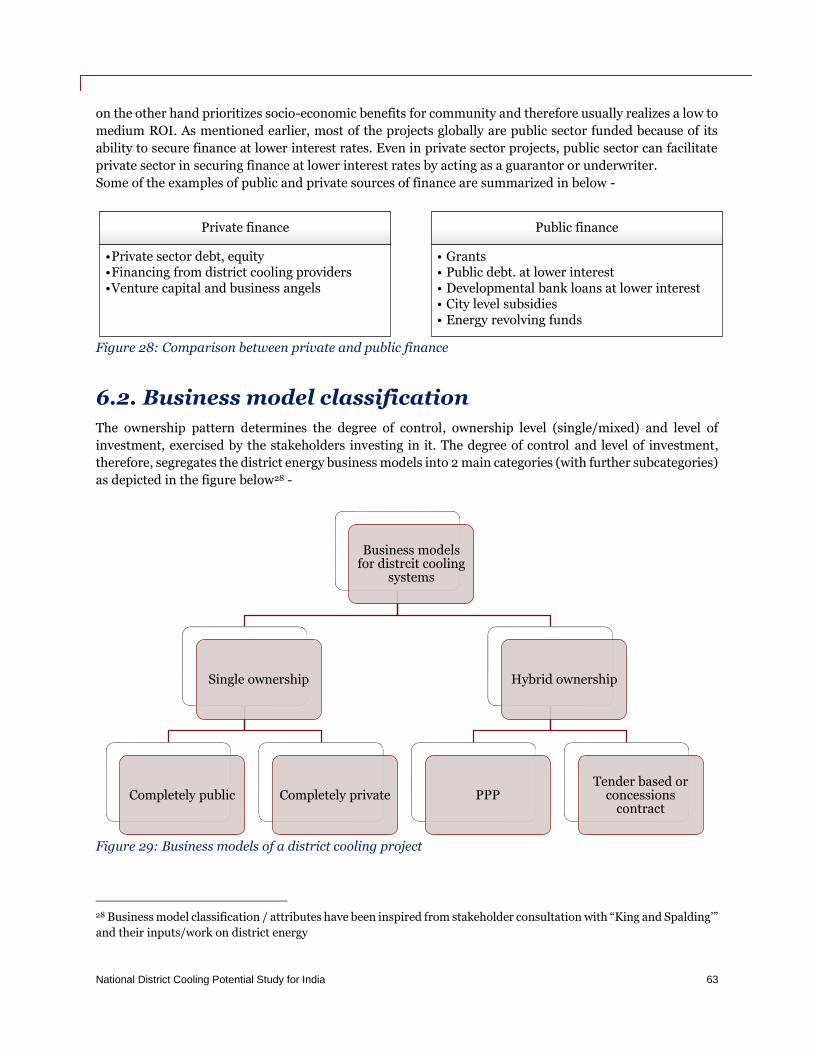
National District Cooling Potential Study for India 63
on the other hand prioritizes socio-economic benefits for community and therefore usually realizes a low to
medium ROI. As mentioned earlier, most of the projects globally are public sector funded because of its
ability to secure finance at lower interest rates. Even in private sector projects, public sector can facilitate
private sector in securing finance at lower interest rates by acting as a guarantor or underwriter.
Some of the examples of public and private sources of finance are summarized in below -
Figure 28: Comparison between private and public finance
6.2. Business model classification
The ownership pattern determines the degree of control, ownership level (single/mixed) and level of
investment, exercised by the stakeholders investing in it. The degree of control and level of investment,
therefore, segregates the district energy business models into 2 main categories (with further subcategories)
as depicted in the figure below28 -
Figure 29: Business models of a district cooling project
28 Business model classification / attributes have been inspired from stakeholder consultation with “King and Spalding’”
and their inputs/work on district energy
Private finance
•Private sector debt, equity•Financing from district cooling providers •Venture capital and business angels
Public finance
• Grants• Public debt. at lower interest• Developmental bank loans at lower interest• City level subsidies• Energy revolving funds
Business models for distrcit cooling
systems
Single ownership
Completely public Completely private
Hybrid ownership
PPPTender based or
concessions contract

National District Cooling Potential Study for India 64
The table below gives the important attributes and characteristics of each type of business model –
Table 8: Important attributes and characteristics of each type of business model
Business model Ownership Governance Control Source of
finance
Single
ownership
Completely
Public
Local authority or
public utility has
complete
ownership of
assets (100%
equity)
Ownership can be
transferred to
private sector in
full or partial
(through shares
etc.)
Completely
governed by the
public sector. The
authorities can
outsource
technical design,
construction
(EPC) and
operation /
Maintenance
Complete control
of local authority
on distribution
network
connections and
tariff policies
Utilities can easily
cater to the anchor
loads and
encourage
expansion /
scalability by
regulatory
interventions
(density bonus,
tax exemptions)
Grants, public
debt at lower
interest,
developmental
bank loans at
lower interest, city
level subsidies or
revolving funds
Single
ownership
Completely
Private
Private sector has
complete
ownership of
assets
The governance
structure is
determined by the
private party as
the ownership of
assets lies with it.
Small
representation of
local authority /
public sector
except for
regulatory aspects
/ project approvals
Financing is
sought by private
company’s
internal sources.
Local authorities
can contribute in
form of grants for
control in the
governance
structure
Hybrid
ownership
PPP
Ownership is split
between the
private
(10%~49%) and
public sector
through a JV
contract
Ownership and
control of assets is
distributed as per
the skillset. e.g.
Public sector can
own land,
common
distribution
network and
facilitate
regulatory barriers
to project
Board
representation
as pet the
ownership split of
the hybrid model
Each entity is
responsible for
sourcing finance
for the district
energy functions
they control.

National District Cooling Potential Study for India 65
development and
anchor loads.
Private sector can
own equipment /
machinery and
take on the design,
construction and
operations.
Hybrid
ownership
Tender based /
Concessions
contract
In this model an
SPV (generally
constituting of
District cooling
provider company
and a public
utility) takes over
the operation of
the already
existing public
project for a fixed
period through a
tender process
Operations and
design are
completely in the
hand of SPV
during the lease
period
The local authority
has limited control
during the tender
period. The tariff
policies of the
ESCO are
regulated to avoid
monopolization by
the presence of
public utility in
SPV
Major finance
from district
cooling service
provider
6.3. Contracts for district cooling systems
This section gives an overview of the contractual structures in different business models among various
stakeholders. The contracting structure in a single ownership model is much simpler as the complete
ownership of assets (and revenue stream) lies with a single type of owner, but the trade-off is increased level
of risk associated with the project. Whereas the hybrid ownership models transfer the risk away from a
single party, but this comes at increased number and complexity of contracts between the stakeholders. A
lot of restructuring is possible in the hybrid models subject to the legal and accounting advice from experts.
Depending upon the ownership model, comprehensive contracts must be developed to cover the following
issues:
Ownership – To streamline who pays for which of the cost component of district cooling in case
of PPP models. Lease agreements in case of tender based / concessions contract.
Power and water supply – To reserve power in the grid (with its tariff structure) and provision
of standby supply in case of outages. In case of CHP plants tariff structure for GAS or steam (with
its tariff structure) must be in place. Similar contracts for water supply for cooling tower (with its
tariff structure) and standby arrangement in case of outages.
Tariff structure for chilled water
o Connection charge - To cover the cost of connecting a consumer with the common
distribution network
o Capacity charge – To cover the operation and maintenance (routine/lifecycle) of the
distribution network

National District Cooling Potential Study for India 66
o Consumption charge – The cover the rate at which chilled water will be distributed to
consumers (INR/BTU) and captive issues
Profit / revenue spread – to cover distribution of profit, reimbursement, royalties, etc. among the
stakeholders of the PPP or JV
Termination and end of term issues - To cover ownership and transfer of assets during or after the
contract term
These contracts are drafted by a team of legal and accounting experts specialising in district energy systems.
Unfortunately, there is a dearth of such experts in India at the moment. For some initial projects, help can
be taken from international experts for drafting such contracts. Such experiences would also help in
capacity building of experts in India and eventually develop standard templates that can be easily replicated.
The contracting structures29 between stakeholders in different business models are represented in the
figures below:
Single ownership (Completely private / Completely public)
The owner contracts out the construction of plant, distribution network and interface to an EPC
contractor
Short duration contracts for district cooling operation and maintenance can be given to EPC
contractor or a 3rd party
Minimum transfer of risk
This model can be converted to hybrid ownership with suitable contracts in place
29 This contracting structures have been inspired from stakeholder consultation with “King and Spalding’” and their
inputs/work on district energy
100% Equity in DC Plant + Distribution network
EPC contractor DC provider / Operator
Combined construction
and O&M contract
O & M Contract
O & M Contract
construction
contract
Figure 30: Flow in single ownership type business model
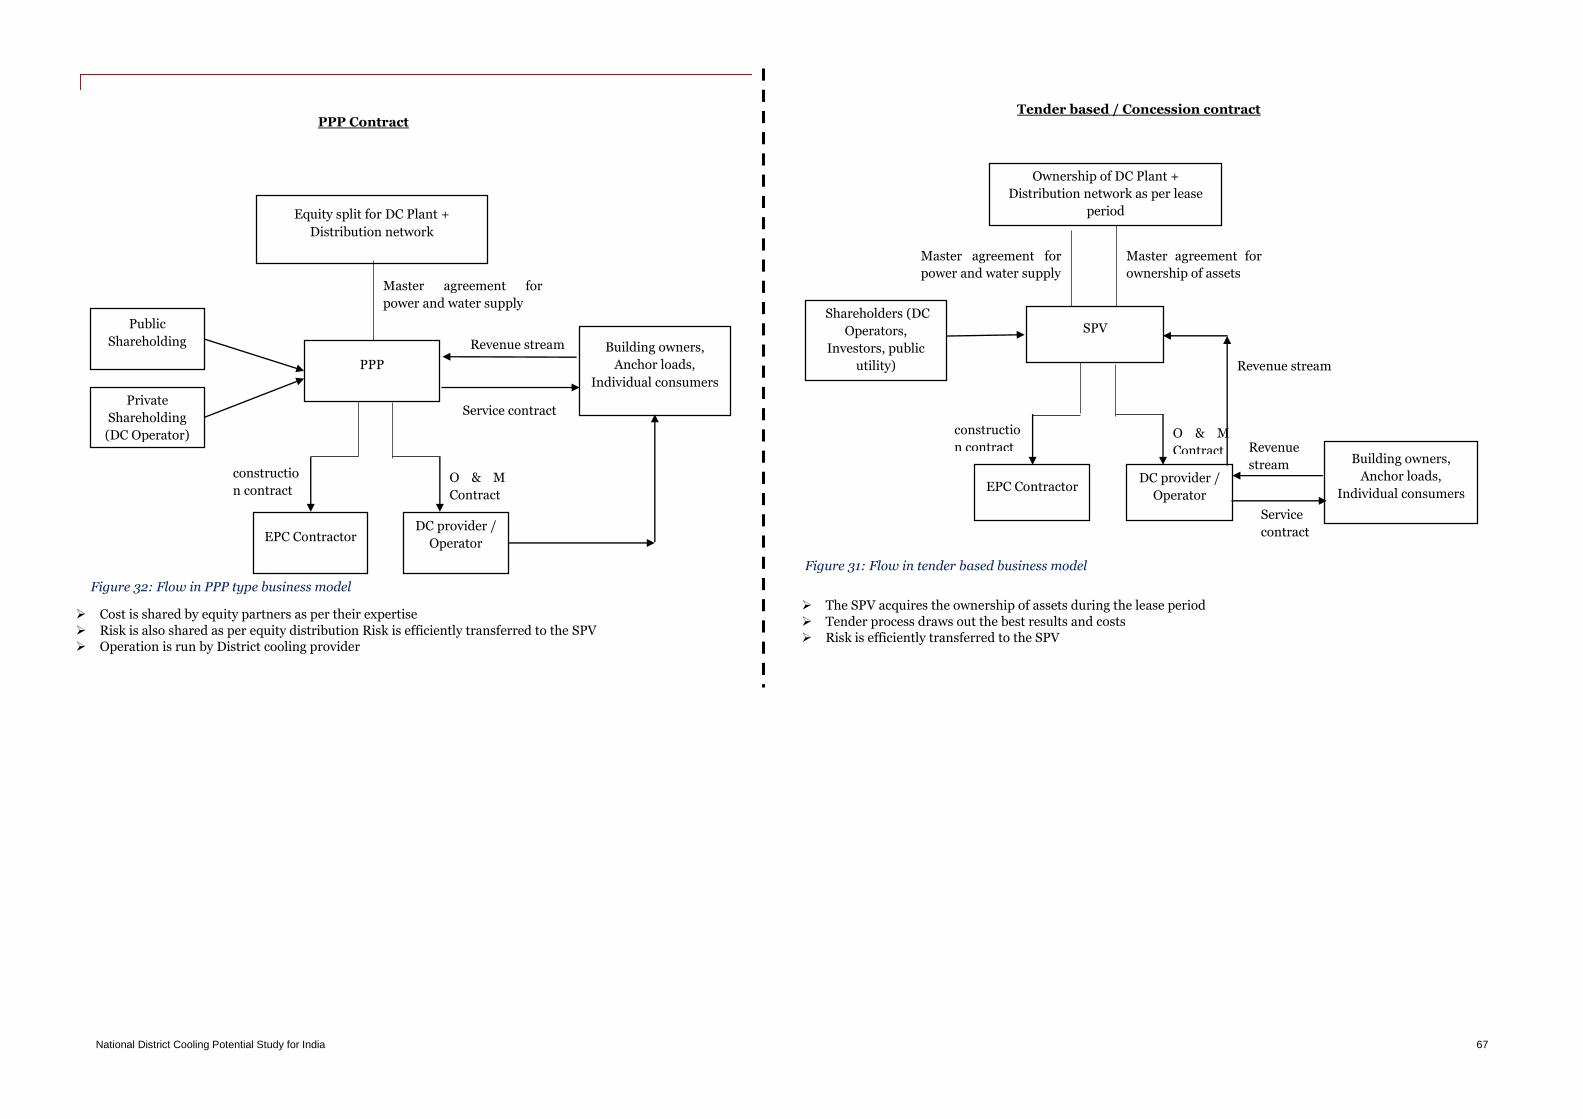
National District Cooling Potential Study for India 67
Equity split for DC Plant +
Distribution network
PPP
Public
Shareholding
O & M
Contract
constructio
n contract
Private
Shareholding
(DC Operator)
EPC Contractor DC provider /
Operator
Building owners,
Anchor loads,
Individual consumers
Service contract
Master agreement for
power and water supply
Revenue stream
Ownership of DC Plant +
Distribution network as per lease
period
SPV Shareholders (DC
Operators,
Investors, public
utility)
O & M
Contract
constructio
n contract
EPC Contractor DC provider /
Operator
Master agreement for
ownership of assets
Building owners,
Anchor loads,
Individual consumers
Master agreement for
power and water supply
Revenue
stream
Service
contract
Revenue stream
The SPV acquires the ownership of assets during the lease period
Tender process draws out the best results and costs
Risk is efficiently transferred to the SPV
Cost is shared by equity partners as per their expertise
Risk is also shared as per equity distribution Risk is efficiently transferred to the SPV
Operation is run by District cooling provider
Tender based / Concession contract PPP Contract
Figure 32: Flow in PPP type business model
Figure 31: Flow in tender based business model

National District Cooling Potential Study for India 68
6.4. Business models recommendations for India
The major hurdle in district cooling projects is the complexity and risks associated with the project. These can be
mitigated to an extent by the involvement of private sector players specializing in such projects. As discussed in
the previous sections, the private sector involvement in such projects can be done through JV’s, PPP, and tender
based/ concession contracts with expert district cooling service companies. Private sector interest and
participation in these projects can be increased by:
o Special power and water tariff – Tariff for power and water for such projects must be
regulated in such a manner that the ROI becomes lucrative for the district cooling service
companies.
o Finance at low interest rates – The public sector with its involvement can secure finance at
lower rates of finance for the district cooling service companies. This can be done by public sector
acting as a guarantor/underwriter for loans.
o Contracting experts – In India there is a dearth of lawyers’ which expertise in drawing
complex contracts for PPP and tender based business models for district cooling. Help can be
taken from international contracting experts, for executing transparent structures for boosting
stakeholder confidence and easy replication for future opportunities.
o Availability of reliable power – The paramount requirement for district cooling viability is
the availability of reliable power source. If the power supply is not reliable the investors /
sponsors have to provision for the standby arrangements such as DG sets etc. This substantially
increases the finance and land requirements for the project and dampens the interest of
stakeholders. Separate substations and transmission routes should be provided by the
government in order to increase private sector interest for such projects.

National District Cooling Potential Study for India 69
7. Barrier analysis for district cooling systems in India
In India, DCS are having potential to serve a wide variety of buildings, viz. commercial offices, hotels, sports
arenas, malls, schools & hospitals. However, a key point to note is that currently these large central plants are
‘single ownership’ and there are very few examples of ‘merchant district cooling’.
The application of DCS is best scalable in case both “single ownership” as well as “merchant district cooling” are
adopted. The possible barriers foreseen for adoption and implementation of this technology, in India, are
categorized as below:
7.1. Policy and institutional barrier
7.1.1. Lack of promotion of district cooling at national and state
level
Lack of awareness about benefits of district cooling.
No or limited engagement of national and state level stakeholders to address various mechanisms to
promote district cooling.
District cooling is not considered as the viable option for large dense green field development projects
by municipalities and real estate developers. It is excluded while formulating roadmaps for smart
cities, national mission, on sustainable habitat.
An action plan to recognize DCS as viable option for space cooling under state and city level initiatives
is not in place. At state level, energy departments and nodal agencies are not aware and not
promoting DCS in their local programmes. Also, there is no recognition that this technology is a key
tool for demand side management, balancing grid, and peak demand reduction. There is no cross
checking/verification of considering DCS as option by developers while submitting project details for
EIA clearances.
Limited pilots and case studies in place to motivate different stakeholders.
7.1.2. Absence of involvement of DISCOMs and municipal
corporations
Currently, utilities are not involved due to lack awareness of potential benefits to them. Demand
reduction for DISCOM and concentrated high loads are beneficial for DISCOM to consider DCS as
strategy for urban development scenarios. Industrial associations and cold chain sector can also be
benefitted by District Cooling Systems. Currently lack of awareness and willingness is restricting
application of technology for industrial applications and cold sector (for pack houses).
Municipal corporations will have to be ‘forward looking’ in working with district cooling service
providers so that chilled water can be offered as a utility at an attractive price. Utilities can play vital
role in steering district cooling in country.
7.1.3. Lack of policy drivers
Currently, India does not have a policy to promote DCS. Following are the key policy barriers:
No legal framework (DCS Act) or policy to promote DCS

National District Cooling Potential Study for India 70
No framework for defining roles of different stakeholders (supply and distribution network, utilities
commitments, etc.)
There is lack of tried and tested business model for district cooling application in India
No standard contracts and leasing agreements
DCS is not considered as a separate category for electricity tariffs
No fiscal instruments/preferential treatment for DCS projects
7.1.4. Non-inclusion of DCS during development of master plans
Urban planning departments have generally limited roles in planning and decision making in energy
sector. Notably, urban planning plays vital role in energy consumption as buildings (commercial and
residential) and infrastructure development consumes energy and resources. It has been observed
that urban planning and land use planning does not generally address the issues related to energy
and resource efficiency while doing the overall master planning. Also, there is lack of engagement
between urban development and energy department at the national level.
The opportunities to adopt and implement district cooling, were created by smart city missions. Due
to absence of necessary roadmaps to include DCS in infrastructure development, these opportunities
were not fetched by smart cities.
7.1.5. Non-inclusion in national building regulations and
certifications
Energy Conservation Building Code (ECBC) -
Currently in India, there is ECBC and ECBC-R in place to promote energy efficient design and
operation in the commercial and residential buildings.
ECBC 2017 promotes low energy comfort systems where trigeneration (waste to heat) is listed as one
of the options as low energy comfort systems. Buildings having any of the low energy thermal comfort
system installed for more than 50% and 90% of cooling/heating requirements of building, shall be
deemed equivalent to ECBC+ and Super ECBC building standard respectively. However, there is no
direct inclusion of district cooling in achieving compliances.
For ECBC – R (Eco Niwas Samhita 2018), BEE has released its part 1 for building envelope. Part 1
covers energy efficient envelope for residential buildings. Part 2 is under development and it is
expected that this will cover lighting and comfort systems in residential buildings. A general
recommendation to include DCS as one strategy for thermal comfort applications, can be given to
BEE.
Green building rating systems -
Demand for energy efficient new construction has led to the emergence of Green Building Rating
System worldwide. There are many rating systems that are recognised at the national level like
GRIHA, LEED, and IGBC for large developments, townships, green campus, and cities. The rating
systems consider energy, water, waste efficiency, use of renewable energy, refrigerant reduction,
primarily. Adoptability of rating systems is increasing in India as this is directly linked with
incentives offered by regulations. These rating systems offer specific incentives (vary state to state)
like extra FAR, subsidized rates of loan, fast track EIA clearance, etc.
None of these rating systems mentions/includes a clause that promotes the adoption
of DCSs in large developments where favourable conditions for district cooling are
foreseen and don’t offer any additional points for this technology.
Another international rating system Building Research Establishment’s Environmental Assessment
Method (BREEAM) was developed in the United Kingdom in 1990 and is one of the earliest building
environmental assessment methods. The Part L, regulation 25A document (standard for
BREEAM) also consider district cooling/heating as high efficiency alternative system.

National District Cooling Potential Study for India 71
7.2. Technological barriers
7.2.1. Design risks (or planned developments)
a. Load estimation:
Properly estimating cooling loads affects the design, operation, and cost-effectiveness of the DCSs in
many ways. Overestimation of load may be appropriate for a building HVAC consulting engineer who
wants to be sure that the customer has enough capacity. But for district cooling company, these
estimates can lead to:
over investment in district cooling infrastructure;
over projection of revenues; and
poor efficiencies in meeting low loads.
As elaborated in Section 2, the annual load profile enables calculation of the total annual energy,
which is critical for rate structure development and revenue projections.
b. Design temperatures and Delta T:
Delta T is the designed difference between chilled water supply and return temperatures. Delta T is a key
parameter in the design and operation of DCSs and is an excellent measure of total system performance
at any load condition. With high delta T, less flow, lower pump energy, and smaller pipeline size is
required to satisfy the cooling requirements. While it is very important to achieve high delta T, it should
not come at the expense of customer comfort or control.
Supply-water temperature is limited by the district cooling plant and distribution system performance.
Return water temperature is typically limited by cooling coil performance in customer building. These
factors are also interrelated. Based on all above, DCSs are designed with a delta T of 7.5 to 10°C (e.g.,
5.6/13.3 or 4.4/14.4).
The design risks can be mitigated to a large extent if the development is well planned &
clients were to design their airside properly. This basically means that DCS is most viable
in large & high-density new developments.
7.2.2. Insufficient research and case studies of district cooling in
India
There is lack in availability of research and case study of this technology in India. Since the technology is
not completely implemented in India, there are less successful examples in this domain. “Cooling as
service” is a very new concept in India. End users are not confident enough to get infrastructure for this
service from the relevant authorities like municipality and DISCOMs.
This is no supporting study/research that projects the potential of DCS and energy savings with it. UNEP
is working on creating awareness/case studies for DCS. More work is required in this regard.
7.3. Financial barriers
7.3.1. Capital-intensiveness (or cost of capital)
Development of DCSs can be a relatively capital-intensive undertaking if the load estimations and
execution is not planned in phases. Further, capital costs are “front-loaded” because of the high costs of
installing basic plant infrastructure and pipe mains in the early years. Therefore, a fundamental risk in
development of a merchant DCS is lower-than-projected customer load or significantly delayed customer
load. With the high capital investment, ROI can be for longer period.

National District Cooling Potential Study for India 72
Since there are not enough pilots (district cooling plants) in India, the cost estimations and implications
are still not very clear to any kind of stakeholder.
No targeted/dedicated capital support to establish District Cooling Plants. Provisions like soft loans to
support capital cost, are missing for DCS. Municipalities are also not able to take a step ahead due to
unavailability of project development costs.
Supplying chilled water from municipality will very likely come under any tax liability like GST/VAT for
DCSs, whereas stand-alone systems will not have this tax liability. The tax exemption for chilled water
supply can work as growth driver for adoption and penetration of DCS in India.
7.3.2. Distribution system construction & operation risks
Underground congestion: A significant risk is higher-than-anticipated costs in piping due to unforeseen
congestion in underground services already in the streets. In India, we may have multiple agencies that
have laid out their piping, sewer or cabling infrastructure underground and clarity of layout may not be
there. Underground congestion is one of the barriers in incorporating DCS for brownfield
projects with existing buildings.
Soil conditions can also present surprises and soil samples must be studied in advance. Distribution
system construction is a specialised area and the cost of rectifying problems is high.
7.3.3. Revenue generation risks
Metering cost: Risks related to inaccurate metering include low revenues leading to diminished profits
OR overbilling leading to spoiling customer relationship. Meters need to be high-quality with a regular
calibration programme and cross-checks.
Lesser than projected billing: This depends on district cooling rate structure. Normally, the district
cooling company will have a two-part rate structure - contracted capacity rate and consumption rate.
Connection charge (Plot Network + ETS + Metering) may be a separate head or built-in the contracted
capacity rate
Delta T penalty: The district cooling company would have a “delta T penalty” to protect themselves
from “excess flow and inefficiency issues”.
7.4. Capacity and human resource
Since there are limited installations of district cooling in India, the experiences of administrative and
technical challenges are yet to be faced by the experts.
There is lack of domestic consultancy experience in DCS: There are building services consultant but the
expertise for designing and execution of DCSs is lacking.
There is lack of awareness of technology, costs, energy savings, performance and benefits of district
cooling: The stakeholders are still not certain about the tangible and intangible benefits of technology.
The main reason behind this is lack of awareness.
There is lack of capacity and human resources to develop, integrate, and implement district cooling
projects among the stakeholders and within urban planning departments.

National District Cooling Potential Study for India 73
8. Recommendations and actions items
Although, district energy (cooling) system has been recognised as a cross-cutting technology in the "National
Cooling Action Plan”, there is need to have a long-term vision/action plan for adoption of DCS at the national
level. Based on the findings of this study and linking to the barrier analysis in the previous section,
recommendations/action plan is developed and divided into three process steps, i.e. short term (0 – 5 years),
medium (5-10 years) and long-term actions (> 10 years)
Figure 33: Recommendations for stakeholders in nutshell
The proposed recommendations are further divided as per specific stakeholder, which are presented under
section 8.1.

National District Cooling Potential Study for India 74
8.1. General recommendations
Table 9: Stakeholder specific general recommendations
Concerned stakeholder
Key Recommendations
Short term (0-5 years) Medium term (5-10 Years)
Long term (>10 Years)
Ministry of Power (MOP)/Ministry of Housing and Urban Affairs (MoHUA) (Any of the Ministries or both can take the lead in policy development)
Development of DCS roadmap/action plan for India
Steering committee formulation and special working group with the focused approach of development of DCS in India
Leading DCS awareness and trainings in India
Promote Pilots in different segments (Merchant as well as single ownership systems)
Develop Investment proposal and financing needs for DCS and Identify financial enabling instruments
Develop monitoring and verification frameworks
Develop/test business models for DCS which also includes standard contracting procedures, standard leasing agreements and roles of different stakeholders
Initiate work to include DCS in policy mandate (Initiate Developing DCS Code)*
Identify barriers in adoption of DCS and suggest/adopt mitigation measures
Linkage with Climate finance initiatives
Considering large real estate and industrial projects to assess district cooling as part of environmental clearances at EIA stage
Development/Adoption of DCS Code in India*
Engage key stakeholders (national as well as city level) to contribute developing policies.
Make policies/mechanism to have DCS at city level
Mandatory roles for ULBs/utilities as a key stakeholder
Engaging ULBs and energy departments to ensure incorporation of DCS at master planning stages
Linking with MoHUA’s existing programs like Local Area Plan (LAP) & Town Planning Scheme (TPS)
Integration of DCS in smart cities (initiative by MoHUA)
Recognition in existing national codes and regulations
Adopt sustainable financing mechanisms
Training/awareness for DCS success stories**
Large scale adoption of DCS in India (Commercial as well as residential)
Technical and financial support to large mix use developments in these smart cities
Testing different business models and contracting procedures and develop case studies
Knowledge exchange mechanisms developed
Mandatory inclusion of DCS in future master planning
Monitoring and verification of installed projects for larger adoption at country level
Expanding the ambition Coverage as well as scale for DCS in India)
Financing scope/business models revisited
Municipality/Town planning
Propose officials and other stakeholders for awareness and training on DCS benefits and models.
Inputs for finalisation for DCS Code in India.
Mandating municipalities to evaluate district cooling feasibility for high density development
Mandatory adoption of DCS in all city level /ULB level planning.
Mandatory requirements for providing utilities for DCS projects

National District Cooling Potential Study for India 75
departments at city/state level
Involvement of town planning department, at master planning stage, to suggest modification in planned infrastructure projects where prerequisites of DCS (dense variable load with anchor loads) can be identified.
Working with stakeholders to uptake few pilot programmes to showcase technology adoption. This will boost the penetration of DCS among developers.
Contributing in exploring treated sewage effluent TSE water usage in cooling tower (for makeup water) in order to maximize water savings in DCS projects.
Suggest changes in building byelaws for inclusion of DCS
Land parcels to be sold with the mandatory requirement of taking DCS connection.
Ensuring utilities supply and piping design network for pilot projects
Amending building byelaws based on stakeholder consultation inputs.
Adoption of incentive mechanisms like soft loans, extra FAR, etc. for DCS adoption (although area utilized by plant should not be considered in extra FAR allowed)
Enforcing treated sewage effluent TSE water usage in cooling tower (for makeup water) in order to maximize water savings
Reporting on success factors of DCS projects
Suggestions to pace adoption of DCS in all future planning
Distribution companies (DISCOMs)
Support MoP in developing guidelines for access to DCS projects
Support development of business models
Ensuring uninterrupted electricity (to operate plants) for land parcels sold with mandatory requirement of taking DCS connection
Inputs to MoHUA and MOP, for formation of DC code
Ensuring uninterrupted electricity (to operate plants) for land parcels sold with mandatory requirement of taking DCS connection
Electricity Regulation Commissions
Proposing mechanism for putting district cooling under “industry” category, with liaison with Ministry of industry. Once DCS is covered under industry category, the electricity tariffs will be lowered as compared to commercial category.
GST on chilled water supply shall be exempted or concessioned
Adoption of DCS under the industry category
Any other support to promote DCS in India
Preferential power tariffs for residential sector which should not be higher than cost of Supply or Residential category tariff in the state of consumption after considering subsidy amount passed on to customers through DBT
Support in improvement and active development of the DCS programme
To promote DCS and tri generation exemptions like cross subsidy surcharge wavier, additional surcharge wavier, Waiver of 100% banking, transmission & wheeling charges for drawl of banked power or power through open access, Waiver of T&D losses, Unutilized banked power shall be purchased by State Discoms at their Average Power Purchase Price, Waiver of Electricity Duty / GST as and when applicable, Grid connectivity and infrastructure to be provided by Govt. at its own cost, GST /Tax (Central and State

National District Cooling Potential Study for India 76
Taxes) waivers on Capital items shall be offered
MOEFCC Give suggestions for environmental clearances under MoEFCC, if any, for adoption of DCS.
Finalizing environmental guidelines/environment impact assessment for DCS in India
Inputs to MoHUA and MOP, for formation of DC code
Bureau of Energy Efficiency and State designated agencies (SDAs)
ECBC 2017 promotes to adopt for low energy comfort systems where trigeneration (waste to heat) is recognized as one of the low energy comfort systems. However, the advantages if multiple buildings opt for DCS, can be included. Since states are free to amend ECBC as per state conditions, they may include district cooling technology.
As per EC ACT, section 13, enables BEE to provide technical administration of DC market and ensuring EE gain. BEE can consider including provisions of including DCS in ECBC and ENS, by some means.
Additionally, provision of readiness of buildings, to connect with DC network can be amended. These provisions could be space requirements, façade readiness, monitoring equipment etc.
Technical and financial support programs for pilot projects
Training and awareness programs to SDAs and energy departments
Any other role as defined by MoP for evolution of DC Code and its larger adoption in India.
Support in DCS programme development and monitoring as per their role.
Institutional support
Large government development organizations like NBCC and CPWD should consider district cooling as a strategy in their projects. The potential developments under NBCC and CPWD can support smart city initiatives of MoHUA. Systematic approach during planning stage, with focused technical expertise is needed in green field developments in smart cities.
Green building rating system
GRIHA, LEED, IGBC etc. can work in integrating DCS in design for campus and large developments, as energy saving strategy. State and city level governments can offer incentives linked to green development with district cooling for thermal comfort in buildings (commercial and residential)
Financial enabling mechanisms
Consideration of incentives linked with extra FAR, property taxes, land approvals, fast track environmental clearances, and load guarantees. Provision of soft loans and other incentives promote DCS Consideration of district cooling under industrial category to avail benefits of lower electricity tariffs. Clarity on tax liability when serving chilled water as utility for operation of DCSs. Corporate Tax waivers for DCS developer can also be considered. Assessment of impact if chilled water is covered under tax liability. The business model will be amended accordingly. In the initial

National District Cooling Potential Study for India 77
stages of development of policy framework, government can consider providing tax rebates/relaxations.
Capacity building through training and awareness**
Benefits of DCS in comparison to conventional cooling (workshops, webinars, other outreach activities) from prospective of end user
Comparison between standalone DCS and merchant DCS and different business models and its successes/challenges
Organise national as well international study tours to witness standalone as well as merchant DCS operation
Develop case studies of demonstration projects such as Gift City, Cyber City, and other future projects
At city level, explore strategic partnerships with international private sector in city-promoted projects and create knowledge exchange forums.
*A DC Code should be formulated, which defines DCS definitions, administrative requirements, service areas for
district cooling services, licensing of district cooling services, control of licenses, matters related to licenses,
offenses and role of key government departments, for successful implementation of DCS pan India. Similar
codes/acts/regulations have been formulated in other countries for district cooling such as Egypt, Singapore and
UAE and have existed for decades on district heating in numerous countries.
National District Cooling Potential Study for India 78
9. References
1. Demand Analysis for Cooling by Sector in India in 2027 by BEE
2. District energy in cities initiative by UNEP
3. Unlocking the potential of district cooling-The need for GCC Government to take action by Strategy &
Formerly Booz and company
4. Indian Action Cooling Plan 2019 by MOEFCC
5. Development of Bhubaneshwar Solar City by MONRE
6. Town Planning Schemes Pardi, Punapur, Bharatwada, Bhandewadi No. 1, Nagpur
7. Final Development Plan-DSIRDA Report 1 and 2
8. Mandal Becharaji special Investment region (MBSIR) Report-1 Draft Development Plan Report
9. Annual Report and Annual Account year 2014-2015-DSIRDA
10. Naya Raipur Development Plan-2031
11. ‘Naya Raipur’- A city of sustainable mobility by NRDA
12. MERC Mid-Term Review Order for MSEDCL for FY 2016-17 to FY 2019-20
13. MID TERM REVIEW PETITION FOR FINAL TRUE UP OF FY 2015-16 & FY 2016-17, PROVISIONAL
TRUE UP FOR FY 2017-18 AND REVISED ARR AND TARIFF FOR FY 2018-19 TO FY 2019-20.
14. Gujrat Electricity Regulatory Commission-Tariff Order-Truing up for FY 2016-17 and determination
of Tariff for FY 2018-19
15. Gujrat Electricity Regulatory Commission
16. Master Plan Guwahati 2025
17. Alliance for an energy efficient economy-Building Stock Modelling
18. Smart City Ahmedabad by Amadavad Municipal Corporation
19. Revised master plan for Bengaluru-2031 (Draft)-Volume 3 master plan Document
20. Revised master plan for Bengaluru-2031 (Draft)-Volume 4 Planning District report
21. Smart City Bhopal Brochure by Bhopal Smart City Corporation Limited
22. Faridabad Master Plan-2031
23. Comprehensive Transportation study for Hyderabad Metropolitan Area
24. Greater Mumbai Draft Development Plan
25. Rajkot Comprehensive Development Plan 2031
26. Smart City Indore-Proposed Master Plan
27. Master Development Plan-2025 Jaipur Region-Volume 3
28. Vision 2025: Perspective plan of CMA: 2025- Kolkata Metropolitan Development Authority.
29. Lucknow Masterplan-2031
30. Nagpur Metropolitan Development Area Development Plan 2012-2032
31. Draft Development Plan for Navi Mumbai Airport Influence notified Area (NAINA)
32. Detailing of Master plan- New Chandigarh 2031
33. Noida Master Plan-2031
34. Master Plan for Patna-2031 by CEPT
35. Smart City Patna Proposal
36. Draft Development Plan-2034 of 3 areas transferred to MCGM
37. Surat Development Plan 2035
38. Smart Thane
39. Integrated Smart City Framework Plan for Vishakhapatnam
40. Federation of European Heating, Ventilation and Air Conditioning Associations

National District Cooling Potential Study for India 79
10. Annexures
10.1. Annexure 1: Assumption in calculation for space cooling demand in India by 2037-38
The following assumptions were taken from ICAP in the analysis to derive at the national cooling demand by
2037-38.
Equivalent full load hours (EFLH) of operation of 2500 hours in a year, for a typical commercial building
(refer to Demand Analysis for Cooling by Sector in India in 2027, page 31)
Considering 1 kW/TR for chiller plant (including auxiliary equipment), note this is the more efficient end of
the expected range
All new commercial buildings will follow minimum ECBC standard as it is assumed that ECBC will be notified
by 2020-21 in India.
Before ECBC/green building movement the general design practice for central plant design for typical
commercial building was 200-225 sqft/TR.
It is assumed that due to impact of ECBC and green building movement the design practice shall be 300-350
sqft/TR, for a typical commercial building
With high energy efficiency measures, the design of 400 sqft/TR can also be achieved
In residential sector VRF demand could be replaced by DCS, but not RAC30
An average district cooling plant can be considered as 20,000 TR (although far smaller and far larger DCPs
are common globally, this is a good average)
A rule of thumb viability of DCS is when AC load density is greater than 10,000TR/sqkm although this is very
approximate and depends on many factors
10.2. Annexure 2: Estimation of space cooling demand by various approaches
10.2.1. Estimation of cooling demand (in mn TR) as per Approach
131
Table 10: Estimation of cooling demand as per approach 1
Year of assessment 2017-18 2037-38
Total Electricity consumption (in TWh) 135 585
Electricity consumption (by percentage) by space cooling equipment
Chiller 9% 11%
VRF 3% 9%
Package DX 8% 4%
Subtotal of electricity consumption by selected space cooling
equipment
20% 24%
30 This is a conservative assumption and reflects the fact that residential with VRF is most likely in HIG buildings. Dense residential
developments that would otherwise have RACs could alternatively be designed with district cooling (especially in mixed-use developments).
However, this is more complicated than connecting commercial buildings to DCS and is unlikely to materialise without strong public support
for DCS. 31 Data from ICAP

National District Cooling Potential Study for India 80
Electricity consumption by selected space cooling equipment (in
TWh)
27 140
Projection of electricity consumption in new commercial construction
by 2037-38 (in TWh)
113
Estimated Demand (in mn TR) served by chillers, VRF,
Package DX and RAC in new commercial buildings by
2037-38
45.2
10.2.2. Estimation of cooling demand (in mn TR) as per Approach
232
Table 11: Estimation of cooling demand as per approach 2
Year of assessment 2017-18 2037-38
Commercial air-conditioned area (in mn sqm) 300 1600
Sqft/Tr to calculate estimated demand (for 2037-28, 23% improvement is considered due to rigours implementation of ECBC)
225 290
Deriving mn TR from above estimation of design applied to
commercial air-conditioned area.
14.34 59.36
Estimated Demand (in mn TR) in new commercial sector by
2037-38
45
10.2.3. Estimation of cooling demand (in mn TR) as per Approach
333
Table 12: Estimation of cooling demand as per approach 3
Year wise stock 2017-18 2037-38
Total refrigerant based equipment stock (in mn TR) as per ICAP 70 720
Chillers 8% 5%
VRF 4% 5%
Package DX 7% 2%
Room air conditioners 81% 88%
Non-RAC equipment as per ICAP in mn TR as a proxy for
commercial equipment relevant for DCS
13.3 86.4
New addition in non-RAC (in mn TR) by 2037-38 as a proxy for
new commercial equipment relevant for DCS
73.1
Discounting the 20% as this includes back up/stand by system 20%
Demand in new commercial construction (in mn TR)
by 2037-38
58.48
32 ICAP 2019 33 ICAP 2019
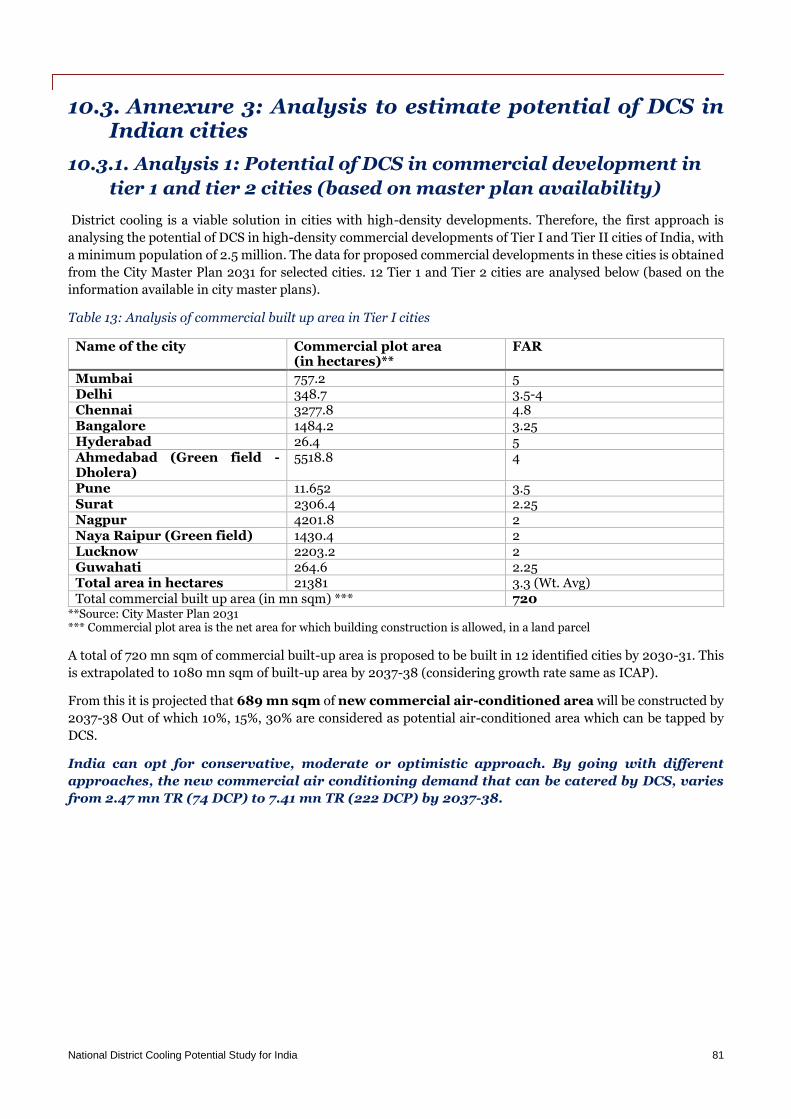
National District Cooling Potential Study for India 81
10.3. Annexure 3: Analysis to estimate potential of DCS in Indian cities
10.3.1. Analysis 1: Potential of DCS in commercial development in
tier 1 and tier 2 cities (based on master plan availability)
District cooling is a viable solution in cities with high-density developments. Therefore, the first approach is
analysing the potential of DCS in high-density commercial developments of Tier I and Tier II cities of India, with
a minimum population of 2.5 million. The data for proposed commercial developments in these cities is obtained
from the City Master Plan 2031 for selected cities. 12 Tier 1 and Tier 2 cities are analysed below (based on the
information available in city master plans).
Table 13: Analysis of commercial built up area in Tier I cities
Name of the city Commercial plot area (in hectares)**
FAR
Mumbai 757.2 5 Delhi 348.7 3.5-4 Chennai 3277.8 4.8 Bangalore 1484.2 3.25 Hyderabad 26.4 5 Ahmedabad (Green field -Dholera)
5518.8 4
Pune 11.652 3.5 Surat 2306.4 2.25 Nagpur 4201.8 2 Naya Raipur (Green field) 1430.4 2 Lucknow 2203.2 2 Guwahati 264.6 2.25 Total area in hectares 21381 3.3 (Wt. Avg) Total commercial built up area (in mn sqm) *** 720
**Source: City Master Plan 2031 *** Commercial plot area is the net area for which building construction is allowed, in a land parcel
A total of 720 mn sqm of commercial built-up area is proposed to be built in 12 identified cities by 2030-31. This
is extrapolated to 1080 mn sqm of built-up area by 2037-38 (considering growth rate same as ICAP).
From this it is projected that 689 mn sqm of new commercial air-conditioned area will be constructed by
2037-38 Out of which 10%, 15%, 30% are considered as potential air-conditioned area which can be tapped by
DCS.
India can opt for conservative, moderate or optimistic approach. By going with different
approaches, the new commercial air conditioning demand that can be catered by DCS, varies
from 2.47 mn TR (74 DCP) to 7.41 mn TR (222 DCP) by 2037-38.
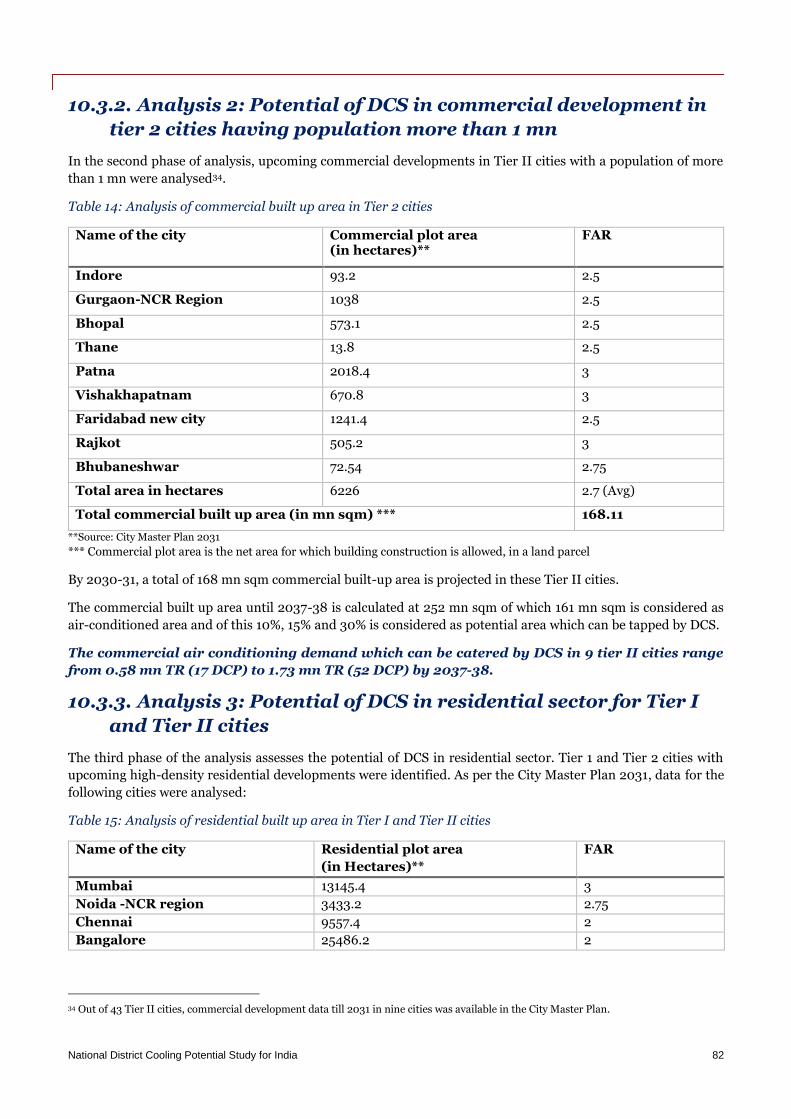
National District Cooling Potential Study for India 82
10.3.2. Analysis 2: Potential of DCS in commercial development in
tier 2 cities having population more than 1 mn
In the second phase of analysis, upcoming commercial developments in Tier II cities with a population of more
than 1 mn were analysed34.
Table 14: Analysis of commercial built up area in Tier 2 cities
Name of the city Commercial plot area (in hectares)**
FAR
Indore 93.2 2.5
Gurgaon-NCR Region 1038 2.5
Bhopal 573.1 2.5
Thane 13.8 2.5
Patna 2018.4 3
Vishakhapatnam 670.8 3
Faridabad new city 1241.4 2.5
Rajkot 505.2 3
Bhubaneshwar 72.54 2.75
Total area in hectares 6226 2.7 (Avg)
Total commercial built up area (in mn sqm) *** 168.11
**Source: City Master Plan 2031
*** Commercial plot area is the net area for which building construction is allowed, in a land parcel
By 2030-31, a total of 168 mn sqm commercial built-up area is projected in these Tier II cities.
The commercial built up area until 2037-38 is calculated at 252 mn sqm of which 161 mn sqm is considered as
air-conditioned area and of this 10%, 15% and 30% is considered as potential area which can be tapped by DCS.
The commercial air conditioning demand which can be catered by DCS in 9 tier II cities range
from 0.58 mn TR (17 DCP) to 1.73 mn TR (52 DCP) by 2037-38.
10.3.3. Analysis 3: Potential of DCS in residential sector for Tier I
and Tier II cities
The third phase of the analysis assesses the potential of DCS in residential sector. Tier 1 and Tier 2 cities with
upcoming high-density residential developments were identified. As per the City Master Plan 2031, data for the
following cities were analysed:
Table 15: Analysis of residential built up area in Tier I and Tier II cities
Name of the city Residential plot area
(in Hectares)**
FAR
Mumbai 13145.4 3
Noida -NCR region 3433.2 2.75
Chennai 9557.4 2
Bangalore 25486.2 2
34 Out of 43 Tier II cities, commercial development data till 2031 in nine cities was available in the City Master Plan.

National District Cooling Potential Study for India 83
Ahmedabad (Green field -
Dholera)
5868 1.8
Surat 1764 1.8
Nagpur 22860 1.25
Naya Raipur (Green field) 1268.0 1.3
Lucknow 20037 1.5
Guwahati 6229.8 1.75
Indore 116.7 1.75
Gurgaon- NCR Region 9612.6 1.5
Bhopal 5527.6 1.75
Patna 18928.2 1.8
Vishakhapatnam 8066.4 1.75
Faridabad new city 8596.8 1.5
Rajkot 7845 1.8
Bhubaneshwar 28.08 2
Total Residential area 168370 Avg- 1.8
Total Residential built up area in mn sq. m 3030
**Source: City Master Plan 2031
The upcoming residential area in the cities is projected at 3,030 mn sqm area by year 2031. The average
permissible Floor to Area Ratio (FAR) for residential buildings of these cities is 1.8. Extrapolating to 2037-38 it
can be expected that 4546 mn sqm of built up residential area will be developed. Considering 30% as air
conditioning area in residential buildings, the estimated new conditioned area until 2037-38 is calculated at
1364 mn sqm and 3%, 5%, 7% as potential area which can be tapped by DCS.
With policy intervention from central and local governments, the air conditioning requirement
in residential sector that can be tapped by DCS varies from 1.5 mn TR to 3.4 mn TR, by 2037-28.
It is experienced from the learnings derived from various other countries that DCS in residential
sector is not easily implementable due to various techno-commercial reasons and it is
recommended to look at residential sector as add-on / mixed use development.
10.4. Annexure 4: Technological overview
10.4.1. District Cooling Plants
This section will provide an overview of various aspects of District Cooling Plants.
(i) Chilled-water production technologies
There are basically two major categories of commercial chilling technologies: compression and absorption
(a) Compression Chillers

National District Cooling Potential Study for India 84
District Cooling Plants (DCP) are large in
capacity and would mostly use centrifugal
compressors. In Individual Building Chiller
Plants (IBCP) up to 1200TR, screw
compressors are more commonly used.
In IBCP, there are few chillers and no thermal storage,
so the focus is on chiller performance at part load
conditions. In case of DCP, the chiller loading
tends to be higher due to a greater number of
chillers and usage of thermal energy storage
tank.
Capacity control of compressors can be done with the
use of inlet guide vanes or variable speed or both. Variable Frequency Drives (VFD) on compressors can
dramatically improve part-load efficiency when the lift is lower than design. Low-voltage VFDs are economical
but medium-voltage and high-voltage VFDs are very expensive. Normally, chillers are not selected for low voltage
beyond 1200 TR capacity. Hence, while VFD Centrifugal Chillers have almost become the norm in
IBCP, DCS may not use VFD due to cost, chiller loading and TES operating philosophy.
It is not uncommon that a large DCP is envisioned, but in the early years it must supply only a fraction of the
ultimate load. It can also be such that the loads are less in off-peak season. VFD chiller can be very beneficial to
maintain plant efficiency even in low load conditions. The other technology that can be used is TES which shall
be discussed separately.
(b) Absorption Chillers
The absorption cycle uses heat to generate cooling
using two media: a refrigerant and an absorbent.
Water/Lithium Bromide is the most common
refrigerant/absorbent media pair. The absorption
process uses an absorber, generator, pump and
recuperative heat exchangers to replace the
compressor in the vapor-compression cycle. Heat
source may be Natural Gas, Steam or Hot Water.
Table 16: Pros and cons of absorption chillers
Pros of absorption chiller Cons of absorption chillers
Significantly lower electrical requirement for
chiller operation
Minimal sound and vibration
Ability to utilize recovered waste heat from
diverse sources (e.g. power stations,
industry, solar etc.)
Use of natural refrigerants with no threat of
environmental degradation
Substantial capacity and performance
degradation at high condenser water
entering temperatures and fouling
Higher heat rejection and make-up water
requirements
Larger space requirements
Higher installed cost per TR
Limitations in producing lower chilled water
supply temperatures
Limitations of variable flow
Threat of crystallization and corrosion
Figure 34: Schematic of Vapor compression cycle
Figure 35: Schematic of Vapor absorption cycle

National District Cooling Potential Study for India 85
Coefficient of performance (COP) achievable is 0.65 to 0.7 for single-effect and 1.2 to 1.3 for
double-effect. However, a low COP may still yield a lower operating cost depending on cost of
heat source.
Capacity deration in absorption chillers for typical district cooling operating conditions can be as high as 40%.
Also, absorption chillers are not well-suited for low supply-temperature production. In case of DCP, it makes
sense to develop a series plant configuration with absorption chillers as the upstream chiller.
(c) CHP or Cogeneration (COGEN) – Electricity & Cooling
Technologies for indirectly producing cooling with natural gas include:
Engine / Turbine power generators, feeding electric chillers
Exhaust from engine or turbine may be used to generate steam, which can then be used to drive
compressor or be fed to a steam absorption chiller
Exhaust and hot water from engine / turbine that can be directly fed to an absorption chiller.
These are integrated technology systems and can have
many possible combinations depending on cost
effectiveness, energy efficiency, space requirements,
regulation and flexibility. These approaches have the
potential to increase energy efficiency, promote
operational flexibility and enhance the ability to deal
with uncertain future costs of natural gas and electric
energy.
Depending on the relative price of electricity and gas,
CHP can improve cost-effectiveness. For example, one
configuration is a central electrical combined CHP
consisting of reciprocating gas engines, producing
electricity, with heat recovery of jacket water and
exhaust. The electrical power generated would be used
to supply large electric motor driven centrifugal chillers.
Jacket water heat would be used in single effect
absorption chiller and exhaust gases would be used in a
double effect absorption chiller.
If the power prices are low (e.g. due to coal-based power) and natural gas is priced higher (natural gas is a clean
fuel and is in high demand for Fertilizer, Transportation, Residential, Steel and other sectors), CHP may not be
economical. The selection of the optimum configuration is dependent on the assumptions for electrical utility
price, natural gas fuel price, cost of capital, space availability and safety regulations.
In India, there are COGEN installations with Absorption Chillers. A case in point is DLF
Cybercity, Gurgaon that has 2 x 40 MW COGEN plants. Each plant has exhaust / exhaust + hot
water driven absorption chillers totalling ~17,500 TR.
(ii) Thermal energy storage
Storage of chilled water or ice is normally an integral part of many District Cooling Systems. Thermal energy
storage (TES) allows cooling energy to be generated at night for use during peak loads. This process helps manage
the electrical demand and reduce the need to build electrical infrastructure for generation, transmission &
distribution of electricity. TES also allows a reduction in installed chiller plant capacity, often reducing net capital
cost.
Load-levelling thermal energy storage can typically achieve a 20% reduction in peak chiller
plant TR load for District Cooling Systems.
Figure 36: Schematic of Trigeneration (source – Thermax Trigenie Catalogue)

National District Cooling Potential Study for India 86
TES types can be as below:
(a) Chilled Water Stratification Tank
Chilled water is the most common and simplest form of TES, using concrete or steel tanks to store chilled water
at 4 to 5.5°C.
Due to the difference in densities of water at different temperatures, a stable stratification of layers of water can
be obtained.
(b) Ice thermal storage allows storage in a more compact space. However, it requires lower evaporating
temperature and hence, higher kW/TR. Ice thermal storage makes sense if there is a large differential tariff
between peak and off-peak electricity tariffs and/or limited space for chilled water tanks.
Benefits of TES are as below:
Peak load management – This is especially important in dense urban areas where the electrical
distribution grid is capacity constrained. For CHP, implementing chilled water TES ensures a large
economic benefit by reducing the amount of installed power generation required and leads to better
loading of power generating sets, which results into higher waste heat recovery.
Energy efficiency – Chilled water TES leads to higher loading, and hence, avoids higher kW/TR on
auxiliary equipment of the system
Capital cost avoidance – TES used for load levelling can reduce the necessary installed chiller plant
capacity and provide redundancy. Chilled water storage can even double as fire protection water storage.
Operational flexibility – TES can help in avoiding frequent chiller cycling for night-time low load
operation or off-season cooling needs. TES can also facilitate chiller maintenance.
In India, IBCP is mostly designed without considering TES due to space, cost and simplicity
parameters. DCP does integrate thermal storage in its design and this aspect leads to huge
impact on peak electrical demand of cities apart from enhancing efficiencies at partial loads.
(iii) District cooling plant configuration
Figure 37: District Cooling Plant at Business Bay – Empower (Dubai)

National District Cooling Potential Study for India 87
(a) Chiller sizing and configuration
The type, number and arrangement of chillers for a district cooling plant are dependent on the cooling load profile
for the system and delta T due to sequencing challenges. (Delta T is the difference of chilled water return & supply
temperatures)
(b) Series counterflow configuration
The series counterflow puts pairs of chillers in series with one another, with flow through evaporator and
condenser in opposite directions. This reduces the ‘compressor lift’ and hence improves the chiller kW/TR.
Series counterflow arrangement can be quite beneficial for CHP where the absorption chiller can be the
downstream chiller.
(c) Voltage option for compressor motor
For electric chillers > 1200 TR, it is common to use medium voltage motors (3.3KV/6.6KV/11KV). The advantages
of high voltage are:
DOL starter can be used
Step-down transformer may not be required
Space for electrical eqpt is reduced
Cable size is reduced
I2R losses are reduced
Plant efficiency is increased
(d) Heat exchanger design
Chillers come with enhanced copper tubes for both evaporator and condenser. However, depending on water
quality, it may be necessary to consider alternate materials. For e.g., CuNi 90/10, CuNi 70/30, SS, Titanium, etc.
With Titanium, one can even use sea water in condensers and even avoid using cooling towers.
In IBCP, capex considerations drive purchases, and chillers being installed are with standard
metallurgy. However, DCP will tend to focus on life-cycle cost and go for customization if
beneficial. A case in point is DCP in Bahrain Bay that was designed with Titanium Tubes in
Condenser and directly used sea water for cooling.
(iv) Refrigerants
For chillers, CFCs were the most common refrigerants in the world. R11 was the refrigerant with the highest cycle
efficiency. However, due to concerns of ozone depletion, there was a transition from CFC to HCFC and HCFC to
HFC brought about world over by the Montreal Protocol. HFCs are refrigerants with zero ozone depletion
potential (ODP).
Climate change is the greatest environmental challenge facing the earth and HFC refrigerants have significant
global warming potential (GWP). As part of Kigali Amendment to the Montreal Protocol, there is a phase-down
timetable for HFCs, and newer refrigerants are coming up that have zero ODP & very low GWP.
Low GWP alternates like R-513A & R-514A (HFO Blends) are being offered as refrigerants in place of R-134a &
R-123 (HFC). A refrigerant of note is R-1233zd (HFO) that has zero ODP & near zero GWP. Many manufacturers
are now offering centrifugal chillers with this new HFO refrigerant.
Refrigerant management is a larger issue that has more-or-less been ignored in Commercial
Buildings. Refrigerant leaks are not discovered timely and records of top-ups are not
maintained properly. Most plant rooms do not have Refrigerant Leak detectors and almost none of them has
a Refrigerant Storage and Recovery unit. This is one of the strongest reasons in favour of district cooling for
sustainability.

National District Cooling Potential Study for India 88
While IBCP continues to use R-134a refrigerant, DCP can be mandated to use Low GWP
alternates.
(v) Heat rejection
Heat absorbed from the chilled-water production process along with compressor power must be rejected from
the chiller condenser to the outside environment. The proper selection and control of the heat rejection
equipment are significant components of district cooling plant operating costs. Heat rejection systems can be
based on one of the following:
Cooling towers with potable water for make-up
Cooling towers with recycled wastewater for make-up
Once through use of fresh water, sea water or wastewater
Variable speed drives can be very beneficial for cooling tower fans. Also, cooling towers should be designed to
operate well at lower water flow rates.
IBCP continues to use Municipal / Borewell Water in cooling towers due to lack of proper water
treatment plant in its design. DCP can and should be designed on recycled wastewater or once
thru’ wherever feasible.
(vi) Water treatment
As water quality varies from region to region, there is no recommended water treatment program. The objectives
of a successful water treatment program are to
Minimize deposition (scale or sediments)
Minimize corrosion (ion concentration in circulating cooling water)
Control microbiological activity
Achieving these goals will lead to maximized plant life, enhanced efficiency of system, eliminating risk of failure
of components and ensuring safe operating waterside conditions.
Sources of make-up water for cooling towers can be:
Municipal water
Ground water (may be brackish or have high Total Dissolved Solids or TDS)
Treated sewage effluent (TSE or recycled water from sewage treatment plants)
Sea water or brackish water treated using reverse osmosis (RO) or other technologies
Sea water or lake water may also be used in “once through” arrangement, in which case there are no cooling
towers or make-up water requirements.
With water supplies becoming scarcer, DCSs can be designed based on TSE. Singapore and
Middle East regions are conscientiously using recycled water for chiller plants. However, TSE
quality may not be consistent or predictable and can create problems in the tower and condenser systems.
In DCP, it is possible to circulate sea water straight through the chiller condensers so that no cooling towers are
required. However, there are formidable challenges in using this strategy:
Sea water piping and pumping (distance)
Allowable temperature increase and discharge point (environmental clearances)
Pipe and heat exchanger Material of Construction (MOC)
Pre-treatment requirements (filtration, chlorination, etc)

National District Cooling Potential Study for India 89
District Cooling Plants have automatic dosing and control for both chilled water and condenser
water circuits. In addition, blowdown is automated. These aspects are ignored to a large extent
in individual plants, thus leading to deration in capacity, reduced efficiency, increased make-
up water and chemicals consumption.
(vii) Miscellaneous items
District cooling operators rely on high efficiency and expert operation and maintenance to ensure a profit and
often use various other technologies that a stand-alone building’s chiller plant may not incorporate.
Total suspended solids (TSS) is also a concern as condenser water circuit is open. Side stream filters and
cooling tower basin sweepers are being used in DCP.
Proper equipment access for better & faster maintenance (for example - use of overhead cranes, hoisting points,
proper lighting, tools & tackles, space for carrying out repairs, etc) are other seemingly minor points in DCP
design but these go a long way in ensuring reliable and efficient operations.
Similarly, electrical systems design and maintenance is very important for District Cooling Plants.
(viii) District cooling instrumentation and control system (DCICS)
District cooling instrumentation and control system is required to perform the following functions:
Control and monitor process conditions for sequencing of equipment
Automatically gather and archive accurate energy metering data at Plant and energy transfer station
(ETS) level
Automatically gather and archive data for predictive maintenance and energy efficiency optimization
Provide alarms for detecting performance drifts as well as failures
Improved data gathering ensures strong Monitoring, Reporting and Verification frameworks for GHG
emission reductions and other benefits
DCICS is a “key tool & differentiator” that makes District Cooling Plants perform better than individual building
chiller plants.
Table 17: Comparison of instrument and control in typical commercial building & district cooling plant
Instrumentation and
control for
Common Issues/Advantages
Typical Commercial
Building
• Use of minimum efficiency equipment (capital cost considerations
dominate)
• Improperly applied equipment (load estimation and Bill of Quantity based
on thumb rules)
• No system level commissioning (Building Management System is not
installed / bypassed in most Plant Rooms)
• Reactive maintenance (breakdown maintenance)
• No optimization (no consciousness about system efficiency)
• No tracking of data or reporting (manual data recording which is never
analysed)
District Cooling Plant • High efficiency equipment (life-cycle cost considerations)
• Best-in-class equipment application (well-designed in terms of sizing, specs,
load profile, etc)
• Data recording & analytics (proper metering, data archiving, data analysis)
• Predictive maintenance (condition-based maintenance which leads to
higher realized efficiency)

National District Cooling Potential Study for India 90
• Perpetual optimization (system level efficiency measurements & advanced
tools like AI)
• Real-time measurement & dashboard reporting; fault analysis (ensures
reliability, efficiency & uptime)
District Cooling Plants are designed, commissioned and operated at a much higher efficiency
levels compared to ‘typical building chiller plants. It is not uncommon to see chiller plants in
commercial buildings running at ‘1.20 kW/TR’ whereas well designed, commissioned and
operated DCS can consistently run at lower than ‘0.95 kW/TR’ averaged over the year (~25%
lower energy consumption).
10.4.2. Chilled water distribution
A chilled-water distribution system is one of the largest capital expenses in any District Cooling Systems (30%-
40%) of the total District Cooling Systems cost. It is imperative for DCS designers to carefully assess the load,
diversity, flow rate and pressure requirements as well as heat gain to ensure available capacity and eliminate
unnecessary waste or excess load estimation in the design. Unlike IBCP, the distribution system should be
designed to accommodate future expansion and designed to last as it is very expensive to replace or resize buried
pipe once it is installed.
(i) Hydraulic design
A hydraulic model is a critical tool for optimizing the design and operation of a District Cooling Systems. The
model should consider the below:
Customer loads and system diversity
Start-up and growth
Piping layout
Delta T (increasing Delta T reduces pipeline size and chilled water pump energy
consumption. However, Delta T has to be provided by the load and it is essential that Air
Side is designed accordingly. Delta T of 9-10°C is common in DCS vs 5-6°C, being used
mostly in centrally conditioned buildings)
Pipe sizing based on life-cycle cost analysis
Pressure loss due to fittings
(ii) Pumping schemes
In general, variable primary flow (VPF) is the growing trend and is considered to have modest energy and first-
cost savings advantages, a smaller footprint but some added control complexity. Primary-secondary system
design is considered reliable, conservative and easy to operate.
VPF should only be used if the following applies:
Chillers are compatible with variable flow
Modest variations in chilled water supply temperatures are acceptable
Flow and temperature measurement instruments are accurate
System design incorporates and operators are trained to maintain minimum evaporator flow rates
One can even design all variable-speed primary-secondary systems with primary pump as headered so that
chillers can be over-pumped if delta T is low.
One can also design “distributed secondary pumps” (secondary pumps located at individual customer buildings)
system but should be considered only if chilled water system loads and extents are clearly defined.
For very large distribution systems, and for interconnection of multiple sub-systems, to have booster pumps at a
strategic point seems to be necessary in the distribution system. Also, booster pumps can allow chilled-water

National District Cooling Potential Study for India 91
transmission further away from a central plant as an alternative to increasing distribution pipe size. Booster
pumps may even be an attractive option for existing systems with constrained capacity, where replacing existing
pipeline main is impractical or cost-prohibitive, but delta T improvement opportunities should generally be
investigated first.
Chilled water pumping system in IBCP is mostly Primary Constant – Secondary Variable. In
DCS, with enhanced automation and skilled operators, pumping scheme is chosen as per
application and is fully optimized.
(iii) Distribution system: materials and components
Steel pipe may be a good choice if
a tough and leak-tight piping system with high reliability is valued
insulation is required
clean water can be maintained in the chilled-water distribution
the ability to operate at higher velocities is desired
Cons with steel pipe are the low speed of installation & high first cost.
In IBCP, MS pipe is most used. For DCS, HDPE (high-density polyethylene) may be a good choice if
Trench conditions are aggressive
System is low-pressure
System has routings with small directional changes
Pipe sizes are smaller
In DCS, there is a growing trend towards pre-insulated piping along with sensor-wire leak-detection system. The
system uses electric resistance to detect moisture in the insulation. Another option is to use acoustic leak-
detection sounding equipment.
A distribution system should have isolation valves at all major branch points. Valves could be “in-chamber” or
“direct-buried”.
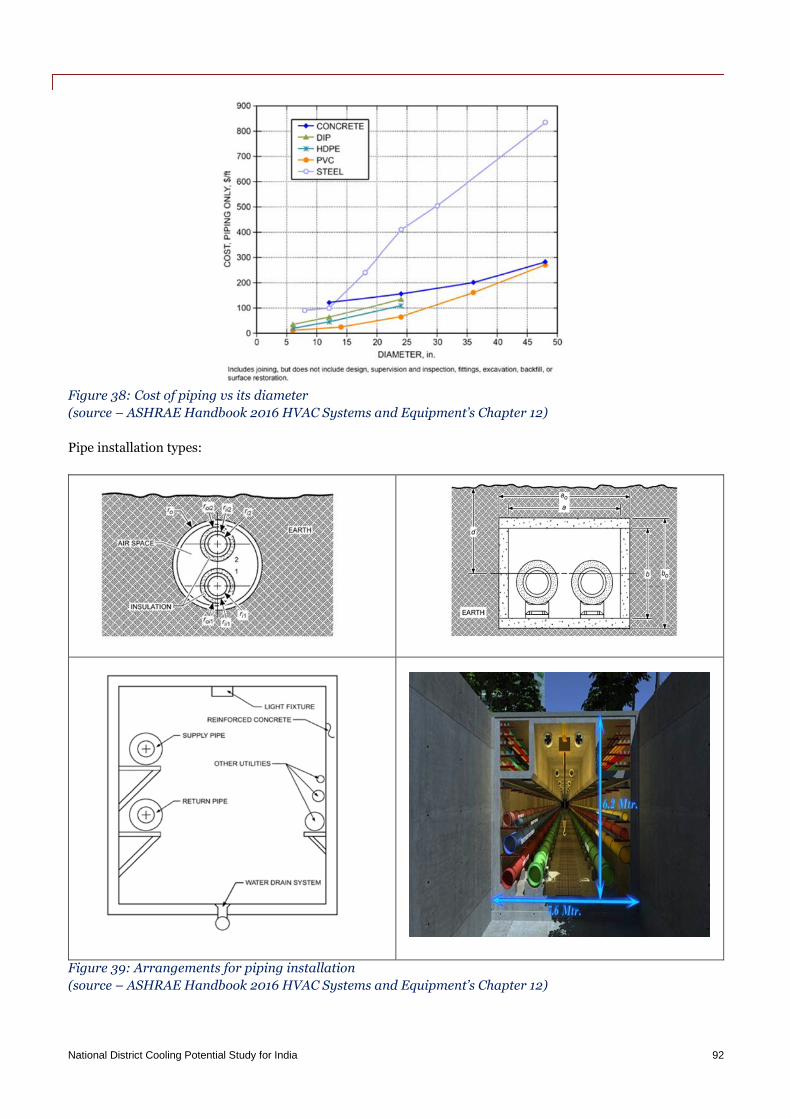
National District Cooling Potential Study for India 92
Figure 38: Cost of piping vs its diameter
(source – ASHRAE Handbook 2016 HVAC Systems and Equipment’s Chapter 12)
Pipe installation types:
Figure 39: Arrangements for piping installation
(source – ASHRAE Handbook 2016 HVAC Systems and Equipment’s Chapter 12)

National District Cooling Potential Study for India 93
10.4.3. Customer connection
An energy transfer station (ETS) serves as the thermal energy transfer point between the
district cooling company and each customer’s HVAC (heating ventilation and air conditioning)
system. It also demarcates the physical boundary for ownership, responsibility and maintenance of equipment.
At the ETS, a revenue-grade flow meter and temperature sensors are used to calculate cooling energy
consumption and demand for customer billing.
There are both direct and indirect ETS connections, and there are optimal circumstances for the use of each in
DCS. In comparison, IBCP will always use direct connection.
With or without an indirect connection, it is essential for the district cooling company to
maintain proper chilled water supply temperature control in customer buildings. It is equally
important for customer building to deliver high return water temperature to the plant.
Direct Connection
Recommended for low rise with total capacity below 15,000 TR
Precautions should be taken for monitoring buildings highest point pressure with motorized valve to isolate buildings with potential leakage
Is the most energy efficient method and simplest to control low ΔT syndrome
Direct Connection with Tertiary Customer Pumps
Recommended for low rise with large customer buildings
De-coupler between secondary & tertiary circuit and control secondary pumping to achieve minimal pressure of 5 psig at the suction of tertiary pump
Difficult to control and manage, require careful design details
Indirect Connection with Plate Heat Exchanger
Recommended for high rise with large commercial buildings
Separate secondary and tertiary circuit increases reliability

National District Cooling Potential Study for India 94