national disaster preparedness baseline assessment: el
TRANSCRIPT

National Disaster Preparedness Baseline Assessment: El Salvador © Pacific Disaster Center 2015 1

National Disaster Preparedness Baseline Assessment: El Salvador © Pacific Disaster Center 2015 2

National Disaster Preparedness Baseline Assessment: El Salvador © Pacific Disaster Center 2015 3
Authors
Erin Hughey, PhD Director of Disaster Services Pacific Disaster Center [email protected]
Cassie Stelow, MS Disaster Services Analyst Pacific Disaster Center [email protected]
Dan Morath, MS, GISP Senior Disaster Risk Analyst Pacific Disaster Center [email protected]
Paulo Fernandes, GISP Disaster Services Analyst Pacific Disaster Center [email protected]
Sharon Mielbrecht Hazard Mitigation Specialist Pacific Disaster Center [email protected]
Rachel Leuck, MS Disaster Services Analyst Pacific Disaster Center [email protected]
HeatherLyn Gray Disaster Services Analyst Pacific Disaster Center [email protected]
Joseph Green, PhD Epidemiologist and Health Risk Specialist Pacific Disaster Center [email protected]
Todd Bosse NDPBA El Salvador Country Lead Pacific Disaster Center [email protected]
© Pacific Disaster Center 2015 1305 North Holopono Street, Suite 2 Kihei, Hawaii 96753 Website: www.pdc.org Phone: 808.891.0525 To request additional information on this report email: [email protected]

National Disaster Preparedness Baseline Assessment: El Salvador © Pacific Disaster Center 2015 4
Acknowledgements The Pacific Disaster Center and the authors of this report would like to acknowledge the partnership and
many insightful inputs and guidance provided by representatives of the various agencies and
organizations that participated in the El Salvador National Disaster Preparedness Baseline Assessment
(NDPBA) workshops, surveys, interviews, and data validation and analysis process.
A special mahalo to Dirección General de Protección Civil (DGPC) and the Ministerio de Medio Ambiente
y Recursos Naturales (MARN) for providing leadership and insight throughout the NDPBA project. Your
commitment and dedication to developing the foundation for a disaster resilient El Salvador helped to
reduce loses and save lives.
This project was directly supported by representatives from the following agencies and organizations:
• Administración Nacional de Acueductos y Alcantarillados
• AmeriCares
• AmeriCares Fundación Salvadoreña para la Salud y el Desarrollo Humano
• Banco Central de Reserva
• Centro Nacional de Registros
• Comandos de Salvamento
• Dirección de Adaptación al Cambio Climático y Gestión Estratégica del Riesgo
• Dirección de Política Económica y Fiscal
• Dirección General de Estadística y Censos
• Dirección General de Protección Civil
• Fondo del Mileno El Salvador II
• Fuerza Armada de El Salvador
• International Organization for Migration
• Japan International Cooperation Agency
• Lutheran World Federation
• Millennium Challenge Corporation
• Ministerio de Agricultura y Ganadería
• Ministerio de Economía
• Ministerio de Educación
• Ministerio de Gobernación y Desarrollo Territorial
• Ministerio de Hacienda
• Ministerio de Justicia y Seguridad Pública
• Ministerio de Medio Ambiente y Recursos Naturales
• Ministerio de Obras Publicas, Transporte, Vivienda y Desarrollo Urbano
• Ministerio de Relaciones Exteriores
• Ministerio de Salud
• Nippon Koei Latinoamerica
• Organización de Mujeres Salvadoreñas
• Oxfam
• Pan American Health Organization
• Plan International

National Disaster Preparedness Baseline Assessment: El Salvador © Pacific Disaster Center 2015 5
• Policia Nacional Civil
• Progeria Schubert
• Redhum
• Save The Children
• Sistema de Emergencias 9-1-1
• Solidar Suiza AOS
• Unidad Ecológica Salvadoreña
• United Nations Children’s Fund
• United Nations Development Program
• United Nations Food and Agriculture Organization
• United Nations Office for the Coordination of Humanitarian Affairs
• United Nations World Food Programme
• United States Embassy
• Universidad Centroamericana
• Universidad de El Salvador
• World Vision
National Disaster Preparedness Baseline Assessment: El Salvador © Pacific Disaster Center 2015 6
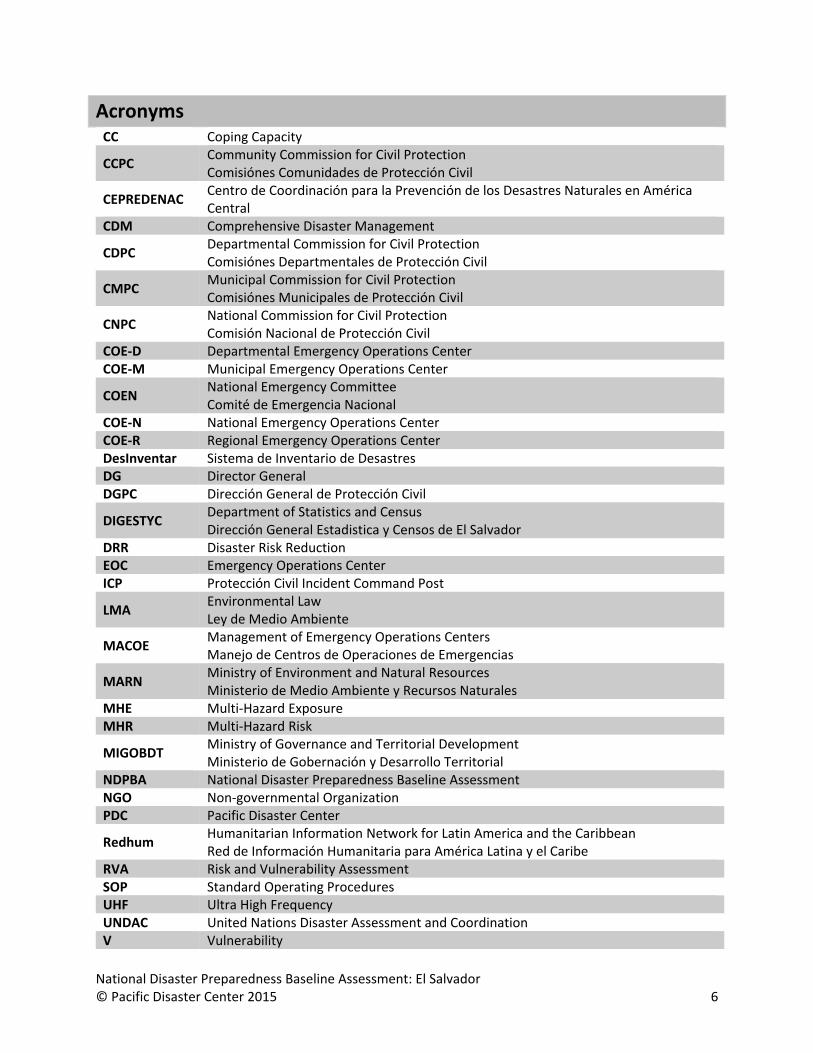
Acronyms CC Coping Capacity
CCPC Community Commission for Civil Protection Comisiónes Comunidades de Protección Civil
CEPREDENAC Centro de Coordinación para la Prevención de los Desastres Naturales en América Central
CDM Comprehensive Disaster Management
CDPC Departmental Commission for Civil Protection Comisiónes Departmentales de Protección Civil
CMPC Municipal Commission for Civil Protection Comisiónes Municipales de Protección Civil
CNPC National Commission for Civil Protection Comisión Nacional de Protección Civil
COE-D Departmental Emergency Operations Center COE-M Municipal Emergency Operations Center
COEN National Emergency Committee Comité de Emergencia Nacional
COE-N National Emergency Operations Center COE-R Regional Emergency Operations Center DesInventar Sistema de Inventario de Desastres DG Director General DGPC Dirección General de Protección Civil
DIGESTYC Department of Statistics and Census Dirección General Estadistica y Censos de El Salvador
DRR Disaster Risk Reduction EOC Emergency Operations Center ICP Protección Civil Incident Command Post
LMA Environmental Law Ley de Medio Ambiente
MACOE Management of Emergency Operations Centers Manejo de Centros de Operaciones de Emergencias
MARN Ministry of Environment and Natural Resources Ministerio de Medio Ambiente y Recursos Naturales
MHE Multi-Hazard Exposure MHR Multi-Hazard Risk
MIGOBDT Ministry of Governance and Territorial Development Ministerio de Gobernación y Desarrollo Territorial
NDPBA National Disaster Preparedness Baseline Assessment NGO Non-governmental Organization PDC Pacific Disaster Center
Redhum Humanitarian Information Network for Latin America and the Caribbean Red de Información Humanitaria para América Latina y el Caribe
RVA Risk and Vulnerability Assessment SOP Standard Operating Procedures UHF Ultra High Frequency UNDAC United Nations Disaster Assessment and Coordination V Vulnerability

National Disaster Preparedness Baseline Assessment: El Salvador © Pacific Disaster Center 2015 7
Executive Summary This report details the final results of the National Disaster Preparedness Baseline Assessment (NDPBA) in
coordination with and in support of stakeholders in El Salvador. The goals of this project were to assess
disaster risk at the subnational level and place it in the context of disaster risk reduction (DRR) efforts
currently underway in El Salvador. The NDPBA provides a baseline for evidence-based DRR decision-
making while supporting the enhancement of data holdings to establish trends in the drivers of disaster
risk.
The NDPBA is a stakeholder-facilitated assessment with four key components:
1. Focused stakeholder engagements in the form of facilitated knowledge exchanges;
2. Risk and Vulnerability Assessment (RVA) at the department level;
3. Comprehensive Disaster Management (CDM) assessment at the national level; and
4. The creation and promotion of a common foundation for data gathering and sharing.
RVA Findings The results of this analysis determined that Usulután, La Libertad, La Paz, Ahuachapán, and Cuscatlán have
the highest risk. Risk is composed of Multi-Hazard Exposure (MHE), Vulnerability (V), and Coping Capacity
(CC). Risk in Usulután and La Libertad is primarily driven by a high level of hazard exposure. High levels of
vulnerability contribute to La Paz and Ahuachapán’s risk. Risk in Cuscatlán is driven by low coping capacity.
Department MHR MHE V CC
Score Rank Score Rank Score Rank Score Rank
Usulután 0.573 1 0.757 3 0.458 10 0.495 5
La Libertad 0.565 2 0.846 1 0.450 12 0.603 2
La Paz 0.559 3 0.489 6 0.556 5 0.366 9
Ahuachapán 0.554 4 0.424 8 0.592 3 0.352 12
Cuscatlán 0.539 5 0.379 10 0.455 11 0.217 13
CDM Findings Results from the CDM analysis highlight key areas where disaster management capacity and capability
could be strengthened:
1. A standardized training program for disaster managers at the national and departmental level has
not been implemented. Training programs for disaster management professionals at the
community level do not exist.
2. A centralized repository for disaster management training achievements does not exist,
preventing the validation of credentials to ensure adequately trained staff.
3. Lack of a formalized exercise program including planning and execution guidelines at the national
and subnational level. Standardized procedures, exercise evaluation, and after-action reporting
does not occur.
a. Budget constraints inhibit the formalization of an exercise program.

National Disaster Preparedness Baseline Assessment: El Salvador © Pacific Disaster Center 2015 8
4. Exercises are not coordinated among the different administrative levels, limiting effectiveness.
5. El Salvador has a limited annual budget for disaster management activities.
6. National disaster reserve fund allocations focus primarily on response, and are not being used in
a way that allows for comprehensive disaster management.
7. There is no direct cabinet-level position for disaster management in El Salvador.
8. Implementation of the legal framework for disaster management has not been fully realized at
the subnational level due to a lack of clear guidelines.
9. Limited availability and integration of response plans and SOPs across all administrative levels.
10. A lack of historical information on disaster declarations inhibits planning efforts.
11. Damage and needs assessments lack accuracy and standardization, inhibiting the ability of
emergency responders and disaster managers to effectively respond to the needs of the
community post-event.
12. A centralized repository of NGOs and partner nations that have active disaster management or
DRR projects in El Salvador does not exist, increasing potential overlap or duplication of efforts.
13. Shelter location information for nine departments does not exist or is not available.
14. No inventory of available resources for response was provided, indicating decision makers would
not have access to the information.
15. Formalized mutual-aid agreements do not exist or are not available.
16. Regional EOCs lack adequate space, equipment, and supplies for sustainment during a major
disaster.
a. Regional EOCs lack robust communication requirements.
b. Some regional EOCs do not have city water, support from fire department to fill 5000L
water tanks periodically is required. Often the fire department is unable to support and
the EOCs have no water.
17. EOCs do not have internal SOPs and staff have not received proper EOC training.

National Disaster Preparedness Baseline Assessment: El Salvador © Pacific Disaster Center 2015 9
RVA and CDM Integration
Risk and Vulnerability Recommendations

National Disaster Preparedness Baseline Assessment: El Salvador © Pacific Disaster Center 2015 10
Comprehensive Disaster Management Recommendations

National Disaster Preparedness Baseline Assessment: El Salvador © Pacific Disaster Center 2015 11
This page is intentionally left blank.

National Disaster Preparedness Baseline Assessment: El Salvador © Pacific Disaster Center 2015 12
Contents Authors .......................................................................................................................................................... 3
Acknowledgements ....................................................................................................................................... 4
Acronyms ...................................................................................................................................................... 6
Executive Summary ....................................................................................................................................... 7
RVA Findings ............................................................................................................................................. 7
CDM Findings ............................................................................................................................................ 7
RVA and CDM Integration ......................................................................................................................... 9
Risk and Vulnerability Recommendations ............................................................................................ 9
Comprehensive Disaster Management Recommendations ............................................................... 10
Introduction ................................................................................................................................................ 16
Methods ...................................................................................................................................................... 17
Facilitated Knowledge Exchanges ........................................................................................................... 17
Risk and Vulnerability Assessment ......................................................................................................... 17
Data Gathering .................................................................................................................................... 18
Data Processing and Analysis .............................................................................................................. 18
RVA Findings ....................................................................................................................................... 19
Comprehensive Disaster Management (CDM) Assessment ................................................................... 19
Data Gathering .................................................................................................................................... 20
Data Processing and Analysis .............................................................................................................. 21
CDM Findings ...................................................................................................................................... 21
Findings: Risk and Vulnerability Assessment (RVA) .................................................................................... 25
Summary ................................................................................................................................................. 25
Multi-Hazard Exposure ....................................................................................................................... 25
Vulnerability ........................................................................................................................................ 26
Coping Capacity ................................................................................................................................... 27
Lack of Resilience ................................................................................................................................ 28
Usulután: Risk ......................................................................................................................................... 34
La Libertad: Risk ...................................................................................................................................... 39
La Paz: Risk .............................................................................................................................................. 44
Ahuachapán: Risk .................................................................................................................................... 49
Cuscatlán: Risk ........................................................................................................................................ 54
San Miguel: Risk ...................................................................................................................................... 59

National Disaster Preparedness Baseline Assessment: El Salvador © Pacific Disaster Center 2015 13
Cabañas: Risk .......................................................................................................................................... 64
Sonsonate: Risk ....................................................................................................................................... 69
La Unión: Risk .......................................................................................................................................... 74
Santa Ana: Risk ........................................................................................................................................ 79
San Vincente: Risk ................................................................................................................................... 84
San Salvador: Risk ................................................................................................................................... 89
Chalatenango: Risk .................................................................................................................................. 94
Morazán: Risk .......................................................................................................................................... 99
RVA Recommendations ............................................................................................................................ 104
Programmatic Recommendations to Support Risk and Vulnerability Assessments in El Salvador ...... 104
Strategies to Reduce Vulnerability and Increase Coping Capacity at the Department Level ........... 104
Findings: Comprehensive Disaster Management ..................................................................................... 109
Summary ............................................................................................................................................... 109
Good Leadership by Professionally Trained Officials ................................................................................ 111
Findings: Training Programs .............................................................................................................. 111
Findings: Training Frequency ............................................................................................................ 112
Findings: Exercise Frequency ............................................................................................................ 112
Gaps .................................................................................................................................................. 112
Recommendations ............................................................................................................................ 113
Foundation of Supportive Values for Government Action ................................................................... 114
Findings: Annual Budget ................................................................................................................... 114
Findings: National Disaster Reserve Fund ......................................................................................... 115
Findings: Appointed/Cabinet-Level Position ..................................................................................... 115
Gaps .................................................................................................................................................. 115
Recommendations ............................................................................................................................ 116
Legal Authority to Act ........................................................................................................................... 117
Findings: Disaster Management Legislation ..................................................................................... 117
Findings: Designated Authorities ...................................................................................................... 118
Findings: Disaster Management Documentation Availability........................................................... 121
Findings: Documentation/SOP Update Frequency ........................................................................... 122
Gaps .................................................................................................................................................. 122
Recommendations ............................................................................................................................ 122
Advocacy Supporting Action ................................................................................................................. 123

National Disaster Preparedness Baseline Assessment: El Salvador © Pacific Disaster Center 2015 14
Findings: Recent Disaster Events ...................................................................................................... 123
Findings: Recent Disaster Legislation ................................................................................................ 125
Findings: Agencies with a Disaster Focus Active in the Country ....................................................... 125
Gaps .................................................................................................................................................. 125
Recommendations ............................................................................................................................ 126
Necessary Institutional Resources ........................................................................................................ 127
Findings: Resources Designated for Disaster Management ............................................................. 127
Findings: Inventory of Available Resources ...................................................................................... 128
Findings: Mutual-Aid Agreements .................................................................................................... 128
Findings: EOC Equipment and Facilities List...................................................................................... 129
Gaps .................................................................................................................................................. 129
Recommendations ............................................................................................................................ 129
Recommended Projects to Enhance CDM ................................................................................................ 130
CDM Recommendations for El Salvador by Cost ...................................................................................... 135
Conclusion ................................................................................................................................................. 136
RVA and CDM Integration ..................................................................................................................... 137
Risk and Vulnerability Recommendations ........................................................................................ 137
Comphrensive Disaster Management Recommendations ............................................................... 138
Appendix A: RVA Component Index Hierarchies & Thematic Rationale .................................................. 141
Multi-Hazard Exposure ......................................................................................................................... 141
Vulnerability .......................................................................................................................................... 143
Coping Capacity ..................................................................................................................................... 148
Appendix B: RVA Index Construction ........................................................................................................ 152
Appendix C: El Salvador – CDM Preparedness Survey (February 2015) ................................................... 155
Introduction .......................................................................................................................................... 155
Responses to Quantitative Survey Questions (1-28) ............................................................................ 155
Availability and Accessibility of Disaster Plans ................................................................................. 155
Planning Collaboration ...................................................................................................................... 156
Composition of Disaster Plans .......................................................................................................... 156
Perceptions of Disaster Management Leadership Programs ........................................................... 157
Responses to Qualitative Survey Questions (29-33) ............................................................................. 157
Annex A: Frequency Tables for CDM Preparedness Survey (Questions 1-28) ...................................... 160
Annex B: Definitions of Disaster Management ..................................................................................... 170

National Disaster Preparedness Baseline Assessment: El Salvador © Pacific Disaster Center 2015 15
Appendix D: El Salvador – CDM Response Survey (February 2015) ......................................................... 173
Introduction .......................................................................................................................................... 173
Responses to Quantitative Survey Questions (1-25) ............................................................................ 173
Effectiveness of Response to Recent Disaster Events ...................................................................... 173
Disaster Early Warning ...................................................................................................................... 174
Organizational Resources and Capacity Building for Disaster Response .......................................... 174
Post-Disaster Damage and Needs Assessments ............................................................................... 174
Emergency Operations Center .......................................................................................................... 174
Roles and Responsibilities in Disaster Response .............................................................................. 174
Responses to Qualitative Survey Questions (26-30) ............................................................................. 174
Annex C: Frequency Tables for CDM Response Survey (Questions 1-25) ............................................ 176
Appendix E: EOC Information ................................................................................................................... 185
National EOC ......................................................................................................................................... 185
Capabilities ........................................................................................................................................ 185
Equipment ......................................................................................................................................... 185
Training ............................................................................................................................................. 185
Santa Ana EOC ....................................................................................................................................... 186
Capabilities ........................................................................................................................................ 186
Equipment ......................................................................................................................................... 186
Training ............................................................................................................................................. 186
San Miguel EOC ..................................................................................................................................... 187
Capabilities ........................................................................................................................................ 187
Equipment ......................................................................................................................................... 187
Training ............................................................................................................................................. 187
San Vicente EOC .................................................................................................................................... 188
Capabilities ........................................................................................................................................ 188
Equipment ......................................................................................................................................... 188
Training ............................................................................................................................................. 188

National Disaster Preparedness Baseline Assessment: El Salvador © Pacific Disaster Center 2015 16
Introduction This report describes the results of the National Disaster Preparedness Baseline Assessment (NDPBA)
project conducted by the Pacific Disaster Center (PDC) in partnership with stakeholders in El Salvador.
The objective of the NDPBA project was to identify the conditions in El Salvador that influence the
preparedness and capability to effectively respond to and recover from disasters. The findings from this
project are designed to support evidence-based decision making to enhance disaster risk reduction (DRR).
The NDPBA stakeholder-driven approach facilitated the integration of national DRR objectives into the
Risk and Vulnerability and Comprehensive Disaster Management assessments.
The goal of the project was to enhance disaster resilience by:
• Summarizing disaster risk within the environmental, social, and economic context of El Salvador;
• Cataloguing and assessing disaster risk governance in order to provide actionable information that
can be used to strengthen disaster management;
• Better understanding the disaster management capabilities in El Salvador to prepare for, respond
to, and recover from any event;
• Analyzing multi-hazard risk to provide actionable information to guide DRR efforts to strengthen
resilience; and
• Providing a forum for all vested stakeholders to share and communicate successes and challenges
encountered in the understanding and management of disaster risk.
The NDPBA project provided a repeatable and measurable approach to examining key elements of DRR.
The NDPBA approach consists of four distinct yet complimentary components. These components are: 1)
focused stakeholder engagements in the form of facilitated knowledge exchanges; 2) risk and vulnerability
assessment (RVA) at the department level; 3) a comprehensive disaster management (CDM) assessment
at the national level; and 4) the creation and promotion of a common foundation for data gathering and
sharing.
The NDPBA project was uniformly undertaken to support short- and long-term preparedness activities, to
include:
• A detailed subnational risk and vulnerability assessment that included the following elements:
multi-hazard exposure, vulnerability, coping capacity, lack of resilience, and multi-hazard risk;
• A review of national and subnational CDM capabilities to identify gaps and provide
recommendations for strengthening preparedness and response;
• A proposed five-year plan to build capacity and capability; and
• Data integration and information sharing.
The data and final analysis provided in this report are integrated into the Pacific Disaster Center’s (PDC)
decision-support system known as DisasterAWARE™ allowing for open and free access to critical DRR data
and information. Access to the data and system can be requested through [email protected].
National Disaster Preparedness Baseline Assessment: El Salvador © Pacific Disaster Center 2015 17
Methods This section of the report summarizes the NDPBA methodology implemented in El Salvador, to include
data gathering procedures, data processing, and analysis.
Facilitated Knowledge Exchanges Facilitated stakeholder engagements acknowledge the Guiding Principles of the Sendai Framework for
Disaster Risk Reduction (DRR) and serve as a key component of the NDBPA. Over the duration of the El
Salvador project, stakeholders were invited to attend three Knowledge Exchanges (Initial, Midterm, and
Final) as well as participate in data reviews, archival research, detailed interviews, and standardized
surveys. The Knowledge Exchanges provided a venue for stakeholders to present on disaster management
topics of interest and highlight the important work each organization is undertaking to support DRR.
Leveraging a participatory approach, a diverse group of traditional and non-traditional disaster
management stakeholders were engaged. This encouraged active participation and promoted diversity
among participants and partners.
In advance of the Knowledge Exchanges, in-depth archival research was conducted to identify disaster
management stakeholders as well as their capacities. Once this was complete, stakeholders were invited
to attend an Initial Knowledge Exchange. At the event, presentations outlined the NDPBA methodology.
In-country stakeholders were invited to give presentations on disaster management topics of interest to
them. Question and answer sessions identified data gaps, information availability, as well as identified
other stakeholders in the disaster management community within El Salvador. Following the exchange,
meetings with stakeholders were scheduled to conduct detailed interviews and share data and
information.
This process was facilitated by key partners to include, Protección Civil; Ministerio de Medio Ambiente y
Recursos Naturales, MARN; Dirección General de Estadistica y Censos de El Salvador, DIGESTYC; Director
de Adaptación al Cambio Climático y Gestión Estratégica del Riesgo (DACGER); Red de Información
Humanitaria para América Latina y el Caribe, Redhum; and national and international NGOs.
Risk and Vulnerability Assessment The purpose of conducting a subnational baseline Risk and Vulnerability Assessment (RVA) was to
characterize elements of multi-hazard risk. The subnational NDBPA RVA was adapted from PDC’s
established Global RVA framework to meet the specific needs of El Salvador. To capture the complex
concept of risk, PDC’s RVA leverages a composite index approach. Composite indices were constructed by
combining data sets that represent general themes that contribute to risk (e.g., access to information,
health status, or governance). The individual variables, or indicators, are uniform and quantifiable
characteristics that reflect the overall concepts required for analysis. Appropriate subnational indicators
were identified in partnership with stakeholders. The data were combined to represent the components
of hazard exposure, vulnerability, and coping capacity.
The index created represents Multi-Hazard Risk (MHR) as a function of component indices, Multi-Hazard
Exposure (MHE), Vulnerability (V), and Coping Capacity (CC).
• Multi-Hazard Exposure describes the population present in hazard zones that are thereby subject
to potential losses.

National Disaster Preparedness Baseline Assessment: El Salvador © Pacific Disaster Center 2015 18
• Vulnerability describes the characteristics and circumstances of a community, system, or asset
that make it susceptible to the damaging effects of a hazard.
• Coping Capacity characterizes the ability of people, organizations, and systems, using available
skills and resources, to face and manage adverse conditions, emergencies, or disasters.
The assessment considered exposure to the following hazards: flooding, landslides (mass movement),
volcanic ash, low temperature, earthquakes, and tsunamis. The basic model for the Multi-Hazard Risk
Index is:
Multi-Hazard Risk Index = (MHE + V + (1 – CC)) / 3
The Lack of Resilience (LR) Index represents the combination of Vulnerability (V) and Coping Capacity (CC).
This basic model for Lack of Resilience Index is:
Lack of Resilience Index = (V + (1 –CC)) / 2
The methodological process for the NDPBA RVA is illustrated below in Figure 1.
Figure 1. NDPBA Risk and Vulnerability Assessment (RVA) Methodological Process
Data Gathering In partnership with stakeholders, a review of archival research and stakeholder interviews were
conducted to identify potential data to be included in the study. Each indicator was gathered from vetted
sources, and evaluated for potential use in the RVA model. Data were scrutinized to identify possible gaps,
missing values, and to document any caveats regarding data quality or completeness. In certain cases,
missing documentation or lack of data lineage precluded the use of datasets in the analysis. For details
on the RVA datasets used in this analysis see Appendix A: RVA Component Index Hierarchies & Thematic
Rationale.
Data Processing and Analysis Datasets used in the analysis were standardized for use as indicators in order to make meaningful
comparisons. For details on RVA index construction see Appendix B: RVA Index Construction.
National Disaster Preparedness Baseline Assessment: El Salvador © Pacific Disaster Center 2015 19
RVA Findings The results of the analysis helped to identify potential areas to focus limited resources in an effort to
reduce disaster risk. As part of the final report, programmatic recommendations to support future RVAs
and specific strategies to reduce vulnerabilities and increase coping capacities at the subnational level are
provided. The analyzed data have been integrated into PDC’s DisasterAWARETM .
Comprehensive Disaster Management (CDM) Assessment Comprehensive Disaster Management (CDM) is the integrated approach of managing hazards through all
phases of disaster management. Leveraging the latest academic research, the CDM analysis examines
core elements of effective disaster management. The assessment is constructed to provide a systematic
understanding of the challenges to operationalizing disaster management techniques in support of
diverse community needs. The results of the assessment provide necessary information for policy makers
to effectively direct investments in an effort to save lives and reduce losses. The CDM assessment can
provide greater context to the RVA by placing the risk of each region into the larger DRR framework of El
Salvador.
For the purposes of this assessment, CDM is conceptualized as the function of five components (see Figure
2).
• Good Leadership by Professionally Trained Officials: examines the professionalization of the
disaster management field.
• Foundation of Supportive Values for Government Action: examining the backing, support, and
sponsorship of CDM efforts.
• Legal Authority to Act: examines the legal framework that governs disaster management.
• Advocacy Supporting Action: examining stakeholder support and backing to include the general
public, NGOs, and those providing assistance before, during, and after an event.
• The Necessary Institutional Resources: examines available resources (material and human) that
are provided by the jurisdiction or through mutual-aid agreements and partnerships with
neighboring jurisdictions.

National Disaster Preparedness Baseline Assessment: El Salvador © Pacific Disaster Center 2015 20
Figure 2. Comprehensive Disaster Management Model (Hughey, 2003)
The methodological process for the NDPBA CDM is illustrated below in Figure 3. The CDM data were
analyzed using a mixed methods approach. The approach combines both qualitative and quantitative
data and methods of analysis, allowing for a more complete assessment of the CDM theoretical
framework.
Figure 3. NDPBA Comprehensive Disaster Management (CDM) Methodological Process.
Data Gathering Archival research, surveys, and interviews were conducted by PDC staff in partnership with stakeholders
in El Salvador. Using the CDM framework as a guide, researchers sought documentation on the disaster
management structure. The goal was to assess the presence of official documents outlining the
components necessary to examine El Salvador’s framework for disaster management. Data were
compiled, sorted by CDM component (as shown in Figure 2), and appropriate information was abstracted
for analysis.

National Disaster Preparedness Baseline Assessment: El Salvador © Pacific Disaster Center 2015 21
Data Processing and Analysis Surveys were administered during the Midterm Knowledge Exchange focusing on aspects of preparedness
and response. Responses were compiled and prepared for analysis. Summary statistics and frequencies
were generated for ranked-response questions. Open-ended questions were analyzed qualitatively to
produce commonly occurring themes to guide further investigation and inform the perceived status of
preparedness and response in El Salvador.
Figure 4, below, illustrates the type of data gathered and analyzed as part of the CDM analysis.
Figure 4. Datasets for CDM Analysis
CDM Findings The results of the analysis helped to identify potential areas that may limit the full implementation of
CDM. As part of this report, recommendations to support the implementation of a complete CDM are
given with the goal of increasing DRR capacity in El Salvador.


National Disaster Preparedness Baseline Assessment: El Salvador © Pacific Disaster Center 2015 23

National Disaster Preparedness Baseline Assessment: El Salvador © Pacific Disaster Center 2015 24

National Disaster Preparedness Baseline Assessment: El Salvador © Pacific Disaster Center 2015 25
Findings: Risk and Vulnerability Assessment (RVA) The RVA results presented in this section represent the analysis of the 14 departments in El Salvador. An
overview of the national results is provided, followed by a detailed review of each department.
Summary Multi-Hazard Risk (MHR), Multi-Hazard Exposure (MHE), Vulnerability (V), and Coping Capacity (CC) scores
and rank are summarized below in Table 1. A five-page detailed review of each department follows this
section.
The RVA helps to:
• Identify the level of exposure of an area to multiple hazards;
• Assess the aspects of populations that make them susceptible to hazard impacts;
• Identify aspects of an area that can be improved to support coping strategies following hazard
events; and
• Place resources in areas that may need additional support following disasters.
Table 1. Multi-Hazard Risk (MHR) Index Scores, Rankings, and Component indices for El Salvador
Department MHR MHE V CC
Score Rank Score Rank Score Rank Score Rank
Usulután 0.573 1 0.757 3 0.458 10 0.495 5
La Libertad 0.565 2 0.846 1 0.450 12 0.603 2
La Paz 0.559 3 0.489 6 0.556 5 0.366 9
Ahuachapán 0.554 4 0.424 8 0.592 3 0.352 12
Cuscatlán 0.539 5 0.379 10 0.455 11 0.217 13
San Miguel 0.537 6 0.649 4 0.527 6 0.566 3
Cabañas 0.531 7 0.177 13 0.616 1 0.200 14
Sonsonate 0.531 8 0.556 5 0.526 7 0.491 6
La Unión 0.501 9 0.399 9 0.582 4 0.478 7
Santa Ana 0.465 10 0.469 7 0.435 13 0.511 4
San Vicente 0.463 11 0.266 11 0.486 8 0.363 10
San Salvador 0.439 12 0.761 2 0.237 14 0.681 1
Chalatenango 0.417 13 0.188 12 0.458 9 0.395 8
Morazán 0.413 14 0.000 14 0.594 2 0.355 11
Multi-Hazard Exposure Multi-Hazard Exposure describes the population present in hazard zones that are thereby subject to
potential losses. For this assessment, exposure considers six hazard types: tropical cyclone winds
(Categories 1-5), tsunami inundation, earthquakes (areas of historical earthquake intensity MMI VII and
above), flood susceptibility (moderate, high, and very high), landslide susceptibility (high and very high),
and volcanic ash (for the San Miguel and Santa Ana, and San Salvador volcanoes).

National Disaster Preparedness Baseline Assessment: El Salvador © Pacific Disaster Center 2015 26
The Multi-Hazard Exposure Index is a function of both raw and relative population exposure. Raw
population exposure provides an indication of how many people are exposed, which can assist in planning
and provide an idea of the raw scale of potential response activities such as evacuation or sheltering. In
contrast, relative population exposure is expressed as a proportion of base population. This provides an
indication of how important a hazard is within a region, helping to facilitate prioritization in the decision-
making process. Relative exposure helps highlight the relevance of hazards within regions that have
relatively small populations.
Examining hazard exposure data for each hazard type provides a cross-section that can be used to identify
the specific hazards contributing to exposure in each department. Understanding exposure to specific
hazards is valuable for determining appropriate mitigation actions. Differences in the type of hazard
inherently dictate which mitigation options could be most effective in reducing losses and casualties in El
Salvador. For example, while levees my help to control flood water in La Paz, they would be ineffective in
preventing losses from Volcanic Ash in San Miguel. This assessment demonstrates the importance of
understanding hazard exposure not only in terms of the total number of people exposed, but also the
hazards that threaten them.
Note that due to El Salvador’s geographic location and size, 100% of the population is potentially exposed
to tropical cyclone winds. This was considered during calculation of the RVA. However, to avoid
redundancy, they are not displayed in any of the Multi-Hazard Exposure graphics in the following sections.
Vulnerability Vulnerability refers to the characteristics and circumstances of a community, system, or asset that make
it susceptible to the damaging effects of a hazard. Areas with higher Vulnerability Index scores are more
susceptible to harm from hazards, often lacking the resources to adequately prepare for, respond to, and
recover from disasters. Recognizing the sensitivities of vulnerable locales, the Vulnerability Index can be
used for decision support in comparing and prioritizing disaster mitigation projects and allocating aid
following hazard events.
An examination of the Vulnerability Index sub-components reveals the drivers of vulnerability within the
departments. In El Salvador, Cabañas (ranked 1 of 14) not only represents the highest overall vulnerability,
but also ranks highest in economic constraints and environmental stress, and exhibits high clean water
access vulnerability, gender inequality, and information access vulnerability. Morazán (ranked 2 of 14)
and Ahuachapán (ranked 3 of 14) show similar distributions, strongly influenced by information access
vulnerability, gender inequality, and population pressures.
In context, these sensitivities translate to increased susceptibility to hazard impacts as a result of limited
economic resources, inability to access and comprehend vital emergency information, compromised
water and sanitation services, large shifts in population, and gender-based differences in access to
resources, services, and opportunities. While many of these factors are inextricably linked, vulnerability
is multifaceted and a single intervention may not acknowledge all components. In the case of Cabañas,
emergency managers and policymakers may take action to target humanitarian aid and promote
economic growth to reduce vulnerability. In Morazán and Ahuachapán education programs might be
targeted to improve literacy and school enrollment, improving access to information and reducing
vulnerability. Analysis of the vulnerability sub-components is important for understanding where sensitive

National Disaster Preparedness Baseline Assessment: El Salvador © Pacific Disaster Center 2015 27
populations are located and how to design interventions to reduce their susceptibility to negative hazard
impacts.
Coping Capacity Coping capacity describes the ability of people, organizations, and systems, using available skills and
resources, to face and manage adverse conditions, emergencies, or disasters. The Coping Capacity Index
represent factors that influence the ability of a department to effectively absorb negative impacts
associated with a hazard event. Where departments show high Coping Capacity, this indicates a
combination of strong governance, economic capacity at the household level, environmental capacity and
availability of infrastructure that supports the population, both in normal conditions and during an
emergency. Low Coping Capacity Index scores represent limitations in a departments’ ability to absorb,
manage, and recover from hazard events. This information can be used to help decision makers focus on
areas of lower capacity and identify areas for focused improvement.
The Coping Capacity Index was calculated using a weighted average of the four sub-components. This was
done to address differences in data quality and availability. As a result, Governance was weighted at 30%,
Infrastructure at 30%, Economic Capacity at 30% and Environmental Capacity at 10%, thereby placing less
emphasis on the environmental dimension of coping capacity.
By analyzing the different sub-components of the Coping Capacity Index it becomes possible to identify
distinct factors that drive a departments’ ability to cope with hazards. For example, low Coping Capacity
in Cabañas is attributable to very low scores across all of the sub-components (Governance, Infrastructure,
Economic Capacity, and Environmental Capacity) ranking in the bottom five for each. In relative terms,
Cabañas has less infrastructure and low economic and environmental capacity when compared to the
other departments. Cuscatlán similarly exhibits low scores in each of the sub-components. Cuscatlán ranks
lowest in the country in governance, and has less healthcare infrastructure. Ahuachapán ranks lowest in
the country in economic strength and very low in infrastructure, while having higher scores in strength of
governance and environmental strength.
Low economic capacity across the three departments (Cabañas, Cuscatlán, and Ahuachapán) suggests
that households in these areas may not have the financial reserves to absorb or manage hazard losses.
This can lead to greater dependence on external aid during response and recovery. Lower Infrastructure
scores can indicate a reduction in the exchange of information, and reduced access to vital resources and
health services. Weaker governance can lead to a range of problems in the management of hazards
including reduced public safety and ineffective disaster planning. Example interventions could include
fostering economic production and small business growth to raise incomes, and national campaigns to
improve equity of infrastructure. Additional support for local police, firefighters, and emergency medical
resources may improve public safety, both in normal conditions and during an emergency. Finally,
adopting comprehensive plans for each phase of disaster management, and engaging the public to both
understand and inform these plans could improve governance in the context of this assessment.
Examining the pattern of coping capacity across the country gives disaster managers and decision makers
the opportunity to identify areas that may benefit from mutual-aid agreements. For example, the
departments of San Salvador (ranked 1 of 14) and Cuscatlán (ranked 13 of 14) share a border in central El
Salvador but exhibit scores on opposite sides of the Coping Capacity Index. In the context of a disaster,
resource sharing could be beneficial to Cuscatlán, taking the form of mutual aid. San Salvador may provide

National Disaster Preparedness Baseline Assessment: El Salvador © Pacific Disaster Center 2015 28
assistance to neighboring departments in disaster response and recovery. In this way, Cuscatlán could
benefit from San Salvador’s increased coping capacity despite not having the resources within its own
borders.
Lack of Resilience Lack of Resilience combines Vulnerability and Coping Capacity to represent the combination of
susceptibility to impact and the relative inability to absorb, respond to, and recover from negative impacts
that occur over the short term. Vulnerability and Coping Capacity are composed of closely related
indicators. Because Vulnerability and Coping Capacity are measured independent of the hazard, disaster
managers can overlay the Lack of Resilience Index with real-time hazard data to estimate risk on a per-
event basis as new threats occur.

National Disaster Preparedness Baseline Assessment: El Salvador © Pacific Disaster Center 2015 29
Figure 5. Distribution of Multi-Hazard Risk Index scores across departments and relative ranking of each department by MHR score.

National Disaster Preparedness Baseline Assessment: El Salvador © Pacific Disaster Center 2015 30
Figure 6 Distribution of Multi-Hazard index scores across departments with relative ranking of departments by Multi-Hazard Exposure score.

National Disaster Preparedness Baseline Assessment: El Salvador © Pacific Disaster Center 2015 31
Figure 7. Distribution of Vulnerability Index scores across departments and relative ranking of departments by Vulnerability score.

National Disaster Preparedness Baseline Assessment: El Salvador © Pacific Disaster Center 2015 32
Figure 8. Distribution of Coping Capacity Index scores and relative ranking of each department by Coping Capacity score.

National Disaster Preparedness Baseline Assessment: El Salvador © Pacific Disaster Center 2015 33
Figure 9. Distribution of Lack of Resilience Index scores across departments and relative ranking of each department by Lack of Resilience score.

National Disaster Preparedness Baseline Assessment: El Salvador 34 © Pacific Disaster Center 2015
Usulután: Risk Usulután ranks 1st of 14 on the Multi-Hazard Risk Index with a score of 0.573. Usulután’s score and ranking
are due to high Multi-Hazard Exposure combined with moderate Coping Capacity and Vulnerability scores.
Usulután has the 3rd highest Multi-Hazard Exposure in the country, the 10th highest Vulnerability and, the
5th highest Coping Capacity.

National Disaster Preparedness Baseline Assessment: El Salvador 35 © Pacific Disaster Center 2015
Usulután: Lack of Resilience Usulután ranks 10th of 14 on Lack of Resilience Index with a score of 0.481. Usulután’s score and ranking
are due to moderate coping capacity combined with low vulnerability scores. Usulután has the 10th highest
Vulnerability and, the 5th highest Coping Capacity.
The three thematic areas with the weakest relative scores for the department of Usulután are:
Governance, Economic Capacity, and Economic Constraints.
Table 2. Lack of Resilience Index and Component scores for Usulután
Index Usulután
Score Rank
Lack of Resilience 0.481 10
Components
Vulnerability 0.458 10
Coping Capacity 0.495 5
Usulután: Coping Capacity Usulután’s coping capacity is 5th out of 14 with a score of 0.495. The thematic areas with the weakest
relative scores are Governance and Economic Capacity. These two thematic areas appear to constrain
coping capacity within this department.
Figure 10. Coping Capacity sub-components for Usulután
0 0.2 0.4 0.6 0.8 1
Governance
Economic Capacity
Infrastructure
Environmental Capacity

National Disaster Preparedness Baseline Assessment: El Salvador 36 © Pacific Disaster Center 2015
Table 3 Coping Capacity Index, sub-component and sub-index scores for Usulután
Index Usulután
Score Rank Coping Capacity 0.495 5 Sub-components
Governance 0.352 10 Economic Capacity 0.385 7 Environmental Capacity 1.000 1 Infrastructure 0.581 4
Infrastructure Sub-indices
Health Care 0.270 6 Transportation 0.903 2 Communications 0.570 4
Usulután: Vulnerability Usulután ranks 10th out of 14 on the Vulnerability Index with a score of 0.458. Vulnerability in Usulután is
strongly influenced by Economic Constraints, Vulnerable Health Status, and Information Access
Vulnerability sub-component scores.
Table 4. Vulnerability Index and sub-component index scores for Usulután
Index Usulután Score Rank
Vulnerability 0.458 10 Sub-Components
Economic Constraints 0.602 4 Info Access Vulnerability 0.559 6
Vulnerable Health Status 0.536 6
Clean Water Vulnerability 0.484 7
Population Pressures 0.312 10
Environmental Stress 0.298 13
Gender Inequality 0.415 9

National Disaster Preparedness Baseline Assessment: El Salvador 37 © Pacific Disaster Center 2015
Figure 11. Vulnerability sub-components for Usulután
Usulután: Multi-Hazard Exposure Usulután ranks 3rd out of 14 on the Multi-Hazard Exposure index with a score of 0.757. A large proportion
of the population is exposed to seismic activity, landslides and volcanic ash. While Usulután is also
exposed to tsunami, this hazard affects a smaller proportion of the population.
Figure 12 Raw population exposure by hazard type for Usulután
0 0.2 0.4 0.6 0.8
Usulután
Economic Constraints
Info Access Vulnerability
Vulnerable Health Status
Clean Water Vulnerability
Population Pressures
Environmental Stress
Gender Inequality

National Disaster Preparedness Baseline Assessment: El Salvador 38 © Pacific Disaster Center 2015
Figure 13. Percent population exposure to hazard type for Usulután
Table 5. Multi-Hazard Exposure Index, Raw and Relative Exposure Index scores for Usulután
Index Usulután Score Rank
Multi-Hazard Exposure 0.757 3
Sub-Components Raw Exposure 0.514 6
Relative Exposure 1.000 1

National Disaster Preparedness Baseline Assessment: El Salvador 39 © Pacific Disaster Center 2015
La Libertad: Risk La Libertad ranks 2nd of 14 on the Multi-Hazard Risk Index with a score of 0.565. La Libertad’s score and
ranking are driven primarily by very high Multi-Hazard Exposure. La Libertad has the highest Multi-Hazard
Exposure in the country, the 12th highest Vulnerability and, the 2nd highest Coping Capacity.

National Disaster Preparedness Baseline Assessment: El Salvador 40 © Pacific Disaster Center 2015
La Libertad: Lack of Resilience La Libertad ranks 13th of 14 on the Lack of Resilience Index with a score of 0.424. La Libertad’s score and
ranking are due to very low Vulnerability combined with very high Coping Capacity. La Libertad has the
12th highest Vulnerability and the 2nd highest Coping Capacity.
While La Libertad exhibits minimal Lack of Resilience overall, two thematic areas with weak relative scores
for the department of La Libertad are: Population Pressures, Gonvernance and Health Care Capacity.
Table 6: Lack of Resilience Index and Component scores for La Libertad
Index La Libertad
Score Rank
Lack of Resilience 0.424 13
Components
Vulnerability 0.450 12
Coping Capacity 0.603 2
La Libertad: Coping Capacity La Libertad’s Coping Capacity is 2nd out of 14 with a score of 0.603. The thematic areas with the weakest
relative scores are Environmental Capacity, Health Care Capacity and Governance. In the Coping
Capacity Index, Environmental Capacity is weighted lower than Governance. Therefore, it’s, relative
contribution is less than that of Governance. These two thematic areas appear to constrain Coping
Capacity within this department.
Figure 14: Coping Capacity sub-components for La Libertad
0 0.2 0.4 0.6 0.8 1
La Libertad
Governance
Economic Capacity
Infrastructure
Environmental Capacity

National Disaster Preparedness Baseline Assessment: El Salvador 41 © Pacific Disaster Center 2015
Table 7: Coping Capacity Index, sub-component and sub-index scores for La Libertad
Index La Libertad
Score Rank Coping Capacity 0.603 2 Sub-components
Governance 0.536 7 Economic Capacity 0.645 2 Environmental Capacity 0.441 7 Infrastructure 0.682 2
Infrastructure Sub-indices
Health Care 0.089 10 Transportation 0.957 1 Communications 1.000 1
La Libertad: Vulnerability La Libertad ranks 12th out of 14 on the Vulnerability Index with a score of 0.450. Though La Libertad
exhibits relatively low vulnerability overall, the index is influenced by a high Population Pressures sub-
component score.Table 8: Vulnerability Index and sub-component index scores for La Libertad
Index La Libertad Score Rank
Vulnerability 0.450 12 Sub-Components
Economic Constraints 0.474 10 Info Access Vulnerability 0.371 13 Vulnerable Health Status 0.318 12 Clean Water Vulnerability 0.184 13 Population Pressures 1.000 1
Environmental Stress 0.357 12 Gender Inequality 0.450 8
National Disaster Preparedness Baseline Assessment: El Salvador 42 © Pacific Disaster Center 2015
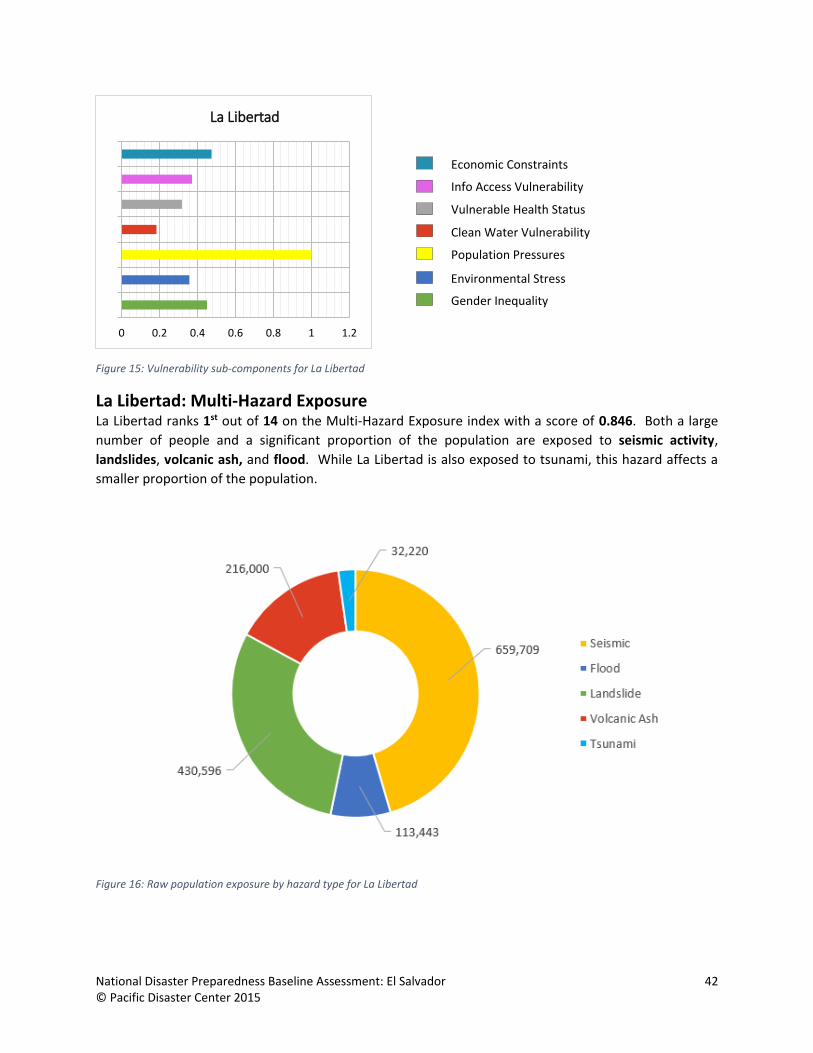
Figure 15: Vulnerability sub-components for La Libertad
La Libertad: Multi-Hazard Exposure La Libertad ranks 1st out of 14 on the Multi-Hazard Exposure index with a score of 0.846. Both a large
number of people and a significant proportion of the population are exposed to seismic activity,
landslides, volcanic ash, and flood. While La Libertad is also exposed to tsunami, this hazard affects a
smaller proportion of the population.
Figure 16: Raw population exposure by hazard type for La Libertad
0 0.2 0.4 0.6 0.8 1 1.2
La Libertad
Economic Constraints
Info Access Vulnerability
Vulnerable Health Status
Clean Water Vulnerability
Population Pressures
Environmental Stress
Gender Inequality

National Disaster Preparedness Baseline Assessment: El Salvador 43 © Pacific Disaster Center 2015
Figure 17: Percent population exposure to hazard type for La Libertad
Index La Libertad
Score Rank
Multi-Hazard Exposure 0.846 1
Sub-Components Raw Exposure 1.000 1
Relative Exposure 0.692 3

National Disaster Preparedness Baseline Assessment: El Salvador 44 © Pacific Disaster Center 2015
La Paz: Risk La Paz ranks 3rd out of 14 on the Multi-Hazard Risk Index with a score of 0.559. The Multi-Hazard Risk in
La Paz is due to low Multi-Hazard Exposure, high Vulnerability, and low Coping Capacity scores. The
department has the 6th highest Multi-Hazard Exposure, the 5th highest Vulnerability, and 9th highest Coping
Capacity.
National Disaster Preparedness Baseline Assessment: El Salvador 45 © Pacific Disaster Center 2015
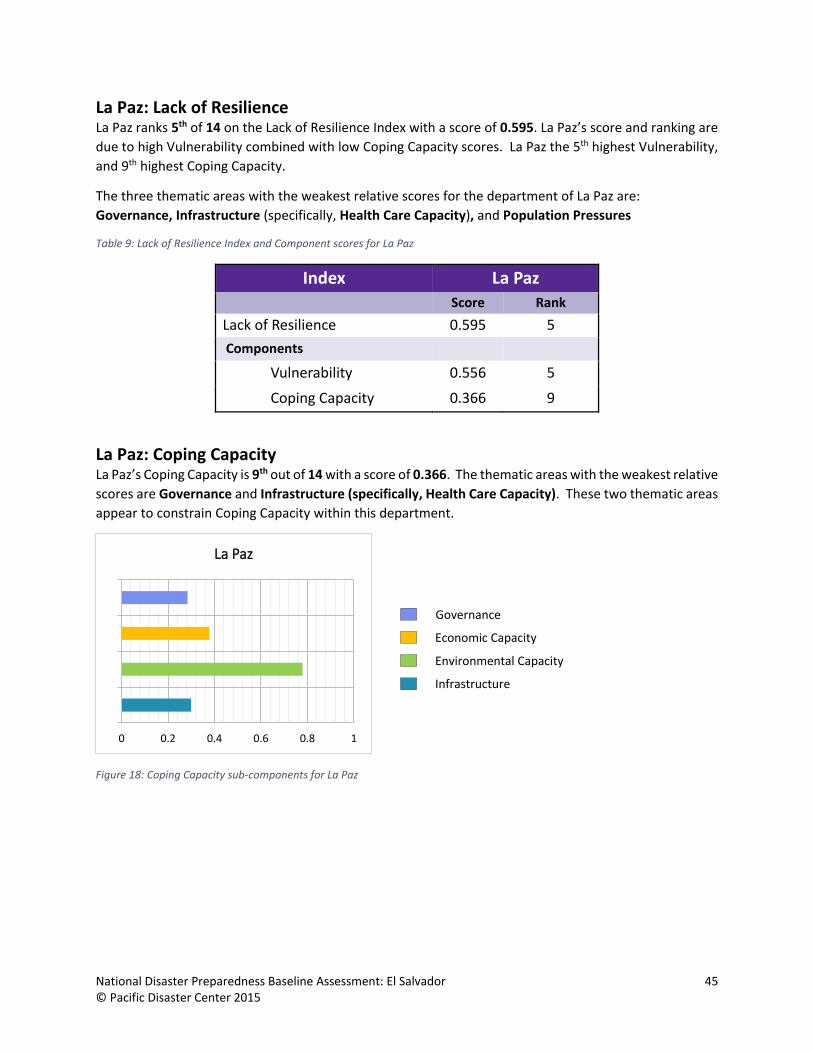
La Paz: Lack of Resilience La Paz ranks 5th of 14 on the Lack of Resilience Index with a score of 0.595. La Paz’s score and ranking are
due to high Vulnerability combined with low Coping Capacity scores. La Paz the 5th highest Vulnerability,
and 9th highest Coping Capacity.
The three thematic areas with the weakest relative scores for the department of La Paz are:
Governance, Infrastructure (specifically, Health Care Capacity), and Population Pressures
Table 9: Lack of Resilience Index and Component scores for La Paz
Index La Paz
Score Rank
Lack of Resilience 0.595 5
Components
Vulnerability 0.556 5
Coping Capacity 0.366 9
La Paz: Coping Capacity La Paz’s Coping Capacity is 9th out of 14 with a score of 0.366. The thematic areas with the weakest relative
scores are Governance and Infrastructure (specifically, Health Care Capacity). These two thematic areas
appear to constrain Coping Capacity within this department.
Figure 18: Coping Capacity sub-components for La Paz
0 0.2 0.4 0.6 0.8 1
La Paz
Governance
Economic Capacity
Infrastructure
Environmental Capacity

National Disaster Preparedness Baseline Assessment: El Salvador 46 © Pacific Disaster Center 2015
Table 10: Coping Capacity Index, sub-component and sub-index scores for La Paz
Index La Paz Score Rank Coping Capacity 0.366 9 Sub-components
Governance 0.284 13 Economic Capacity 0.378 8 Environmental Capacity 0.779 2 Infrastructure 0.299 10
Infrastructure Sub-indices
Health Care 0.072 13 Transportation 0.711 4 Communications 0.115 13
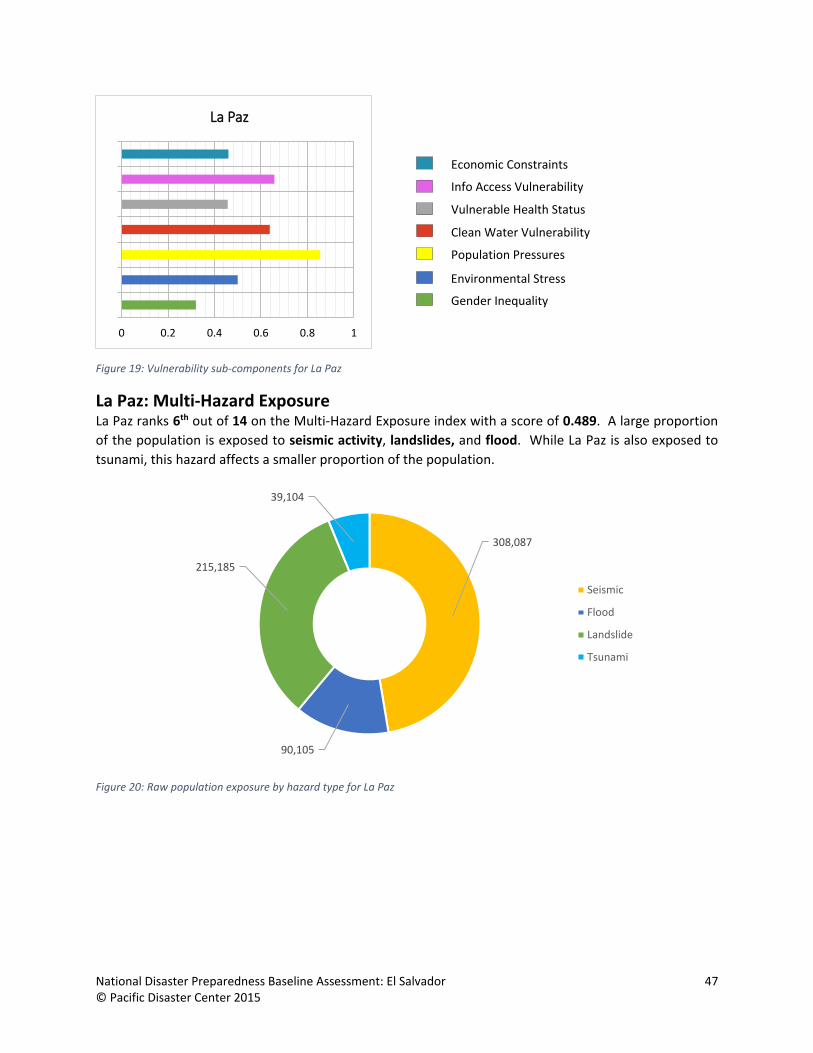
La Paz: Vulnerability La Paz ranks 5th out of 14 on the Vulnerability Index with a score of 0.556. Vulnerability in La Paz is strongly
influenced by Population Pressures, Information Access Vulnerability and Clean Water Vulnerability sub-
component scores.
Table 11. Vulnerability Index and sub-component index scores for La Paz
Index La Paz Score Rank
Vulnerability 0.556 5 Sub-Components
Economic Constraints 0.460 11 Info Access Vulnerability 0.658 4 Vulnerable Health Status 0.457 10 Clean Water Vulnerability 0.638 2 Population Pressures 0.855 3
Environmental Stress 0.500 7 Gender Inequality 0.320 11
National Disaster Preparedness Baseline Assessment: El Salvador 47 © Pacific Disaster Center 2015
Figure 19: Vulnerability sub-components for La Paz
La Paz: Multi-Hazard Exposure La Paz ranks 6th out of 14 on the Multi-Hazard Exposure index with a score of 0.489. A large proportion
of the population is exposed to seismic activity, landslides, and flood. While La Paz is also exposed to
tsunami, this hazard affects a smaller proportion of the population.
Figure 20: Raw population exposure by hazard type for La Paz
0 0.2 0.4 0.6 0.8 1
La Paz
308,087
90,105
215,185
39,104
Seismic
Flood
Landslide
Tsunami
Economic Constraints
Info Access Vulnerability
Vulnerable Health Status
Clean Water Vulnerability
Population Pressures
Environmental Stress
Gender Inequality

National Disaster Preparedness Baseline Assessment: El Salvador 48 © Pacific Disaster Center 2015
Figure 21: Percent population exposure to hazard type for La Paz
Table 12. Multi-Hazard Exposure Index, Raw and Relative Exposure Index scores for La Paz
Index La Paz Score Rank
Multi-Hazard Exposure 0.489 6
Sub-Components Raw Exposure 0.339 7
Relative Exposure 0.639 4
National Disaster Preparedness Baseline Assessment: El Salvador 49 © Pacific Disaster Center 2015
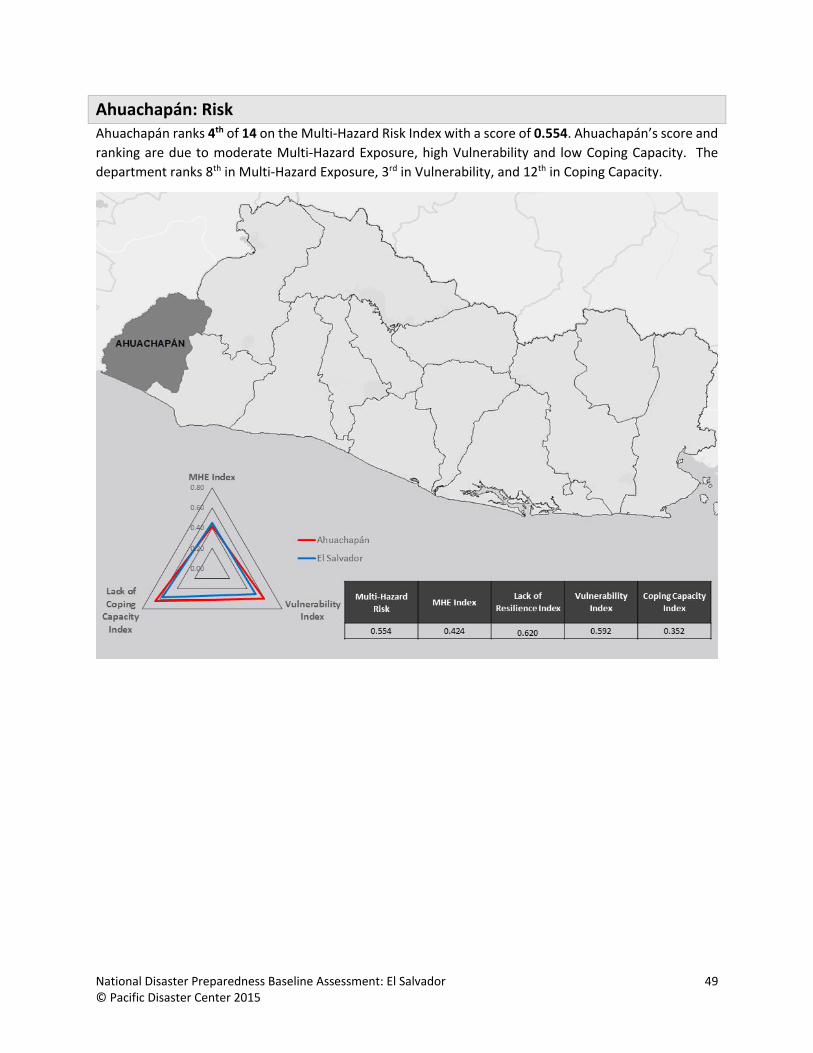
Ahuachapán: Risk Ahuachapán ranks 4th of 14 on the Multi-Hazard Risk Index with a score of 0.554. Ahuachapán’s score and
ranking are due to moderate Multi-Hazard Exposure, high Vulnerability and low Coping Capacity. The
department ranks 8th in Multi-Hazard Exposure, 3rd in Vulnerability, and 12th in Coping Capacity.

National Disaster Preparedness Baseline Assessment: El Salvador 50 © Pacific Disaster Center 2015
Ahuachapán: Lack of Resilience Ahuachapán ranks 2nd of 14 on the Lack of Resilience Index with a score of 0.620. Ahuachapán’s score
and ranking are due to high Vulnerability and low Coping Capacity. The department ranks 3rd in
Vulnerability, and 12th in Coping Capacity.
The three thematic areas with the weakest relative scores for the department of Ahuachapán are:
Economic Capacity, Infrastructure (especially Communications) and Information Access Vulnerability.
Table 13. Lack of Resilience Index and Component scores for Ahuachapán
Index Ahuachapán
Score Rank
Lack of Resilience 0.620 2
Components
Vulnerability 0.592 3
Coping Capacity 0.352 12
Ahuachapán: Coping Capacity Ahuachapán’s Coping Capacity is 12th out of 14 with a score of 0.352. The thematic areas with the weakest
relative scores are Economic Capacity and Infrastructure (Communications). These two thematic areas
appear to constrain Coping Capacity within this department.
Figure 22. Coping Capacity sub-components for Ahuachapán
0 0.2 0.4 0.6 0.8 1
Ahuachapán
Governance
Economic Capacity
Infrastructure
Environmental Capacity

National Disaster Preparedness Baseline Assessment: El Salvador 51 © Pacific Disaster Center 2015
Table 14 Coping Capacity Index, sub-component and sub-index scores for Ahuachapán
Index Ahuachapán Score Rank Coping Capacity 0.352 12 Sub-components
Governance 0.608 3 Economic Capacity 0.161 14 Environmental Capacity 0.604 4 Infrastructure 0.204 13
Infrastructure Sub-indices
Health Care 0.142 9 Transportation 0.357 11 Communications 0.115 14
Ahuachapán: Vulnerability Ahuachapán ranks 3rd out of 14 on the Vulnerability Index with a score of 0.592. Vulnerability in
Ahuachapán is strongly influenced by Information Access Vulnerability, Population Pressures, and
Gender Inequality sub-component scores.
Table 15. Vulnerability Index and sub-component index scores for Ahuachapán
Index Ahuachapán Score Rank
Vulnerability 0.592 3 Sub-Components
Economic Constraints 0.570 5 Info Access Vulnerability 0.725 3 Vulnerable Health Status 0.506 7 Clean Water Vulnerability 0.511 6 Population Pressures 0.690 4
Environmental Stress 0.545 4 Gender Inequality 0.593 5

National Disaster Preparedness Baseline Assessment: El Salvador 52 © Pacific Disaster Center 2015
Figure 23: Vulnerability sub-components for Ahuachapán
Ahuachapán: Multi-Hazard Exposure Ahuachapán ranks 8th out of 14 on the Multi-Hazard Exposure index with a score of 0.424. A large
proportion of the population is exposed to seismic activity, and landslides. A small proportion of
Ahuachapán’s population is also exposed to tsunami.
Figure 24: Raw population exposure by hazard type for Ahuachapán
0 0.2 0.4 0.6 0.8 1
Ahuachapán
Economic Constraints
Info Access Vulnerability
Vulnerable Health Status
Clean Water Vulnerability
Population Pressures
Environmental Stress
Gender Inequality

National Disaster Preparedness Baseline Assessment: El Salvador 53 © Pacific Disaster Center 2015
Figure 25: Percent population exposure to hazard type for Ahuachapán
Table 16. Multi-Hazard Exposure Index, Raw and Relative Exposure Index scores for Ahuachapán
Index Ahuachapán Score Rank
Multi-Hazard Exposure 0.424 8
Sub-Components Raw Exposure 0.326 8
Relative Exposure 0.522 8

National Disaster Preparedness Baseline Assessment: El Salvador 54 © Pacific Disaster Center 2015
Cuscatlán: Risk Cuscatlán ranks 5th out of 14 on the Multi-Hazard Risk Index with a score of 0.539. Cuscatlán’s score and
ranking are primarily driven by very low Coping Capacity. The department ranks 10th for Multi-Hazard
Exposure, 11th in Vulnerability, and 13th in Coping capacity.

National Disaster Preparedness Baseline Assessment: El Salvador 55 © Pacific Disaster Center 2015
Lack of Resilience: Cuscatlán Cuscatlán ranks 4th of 14 on the Lack or Resilience Index with a score of 0.619. Cuscatlán’s score and
ranking are due to its very low Coping Capacity. The department ranks 11th in Vulnerability and 13th in
Coping Capacity.
The three thematic areas with the weakest relative scores for the department of Cuscatlán are:
Governance, Economic Capacity and Population Pressures.
Table 17. Lack of Resilience Index and Component scores for Cuscatlán
Index Cuscatlán
Score Rank
Lack of Resilience 0.619 4
Components
Vulnerability 0.455 11
Coping Capacity 0.217 13
Cuscatlán: Coping Capacity Cuscatlán’s Coping Capacity is 13th out of 14 with a score of 0.217. While Cuscatlán exhibits low scores
across all sub-components of Coping Capacity, the thematic areas with the weakest relative scores are
Governance and Economic Capacity. These weaknesses appear to constrain Coping Capacity within this
department.
Figure 26. Coping Capacity sub-components for Cuscatlán
0 0.2 0.4 0.6 0.8 1
Cuscatlán
Governance
Economic Capacity
Infrastructure
Environmental Capacity

National Disaster Preparedness Baseline Assessment: El Salvador 56 © Pacific Disaster Center 2015
Table 18 Coping Capacity Index, sub-component and sub-index scores for Cuscatlán
Index Cuscatlán Score Rank Coping Capacity 0.217 13 Sub-components
Governance 0.168 14 Economic Capacity 0.223 12 Environmental Capacity 0.234 10 Infrastructure 0.255 11
Infrastructure Sub-indices
Health Care 0.082 11 Transportation 0.312 12 Communications 0.370 9
Cuscatlán: Vulnerability Cuscatlán ranks 11th out of 14 on the Vulnerability Index with a score of 0.455. While Vulnerability in
Cuscatlán is relatively low, the Index is strongly influenced by Population Pressures and Environmental
Stress sub-component scores.
Table 19. Vulnerability Index and sub-component index scores for Cuscatlán
Index Cuscatlán Score Rank
Vulnerability 0.455 11 Sub-Components
Economic Constraints 0.385 13 Info Access Vulnerability 0.543 9 Vulnerable Health Status 0.233 14 Clean Water Vulnerability 0.257 11 Population Pressures 0.907 2
Environmental Stress 0.661 2 Gender Inequality 0.199 14

National Disaster Preparedness Baseline Assessment: El Salvador 57 © Pacific Disaster Center 2015
Figure 27: Vulnerability sub-components for Cuscatlán
Cuscatlán: Multi-Hazard Exposure Cuscatlán ranks 10th out of 14 on the Multi-Hazard Exposure index with a score of 0.379. A large
proportion of the population is exposed to seismic activity and landslides.
Figure 28: Raw population exposure by hazard type for Cuscatlán
0 0.2 0.4 0.6 0.8 1
Cuscatlán
231,480
17,574
216,403
Seismic
Flood
Landslide
Economic Constraints
Info Access Vulnerability
Vulnerable Health Status
Clean Water Vulnerability
Population Pressures
Environmental Stress
Gender Inequality

National Disaster Preparedness Baseline Assessment: El Salvador 58 © Pacific Disaster Center 2015
Figure 29: Percent population exposure to hazard type for Cuscatlán
Table 20. Multi-Hazard Exposure Index, Raw and Relative Exposure Index scores for Cuscatlán
Index Cuscatlán
Score Rank
Multi-Hazard Exposure 0.379 10
Sub-Components Raw Exposure 0.187 10
Relative Exposure 0.570 6

National Disaster Preparedness Baseline Assessment: El Salvador 59 © Pacific Disaster Center 2015
San Miguel: Risk San Miguel ranks 6th of 14 on the Multi-Hazard Risk Index with a score of 0.537. San Miguel’s score and
ranking are due to high Multi-Hazard Exposure, moderate Vulnerability, and high Coping Capacity. San
Miguel has the 4th highest Multi-Hazard Exposure in the country, the 6th highest Vulnerability and, the 3rd
highest Coping Capacity.

National Disaster Preparedness Baseline Assessment: El Salvador 60 © Pacific Disaster Center 2015
San Miguel: Lack of Resilience San Miguel ranks 11th of 14 on the Lack of Resilience Index with a score of 0.480. San Miguel’s score and
ranking are due to its moderate Vulnerability, and high coping capacity. The department ranks 6th in
Vulnerability and 3rd in Coping Capacity.
The three thematic areas with the weakest relative scores for the department of San Miguel are:
Governance, Economic Constraints and Gender Inequality.
Table 21. Lack of Resilience Index and Component scores for San Miguel
Index San Miguel
Score Rank
Lack of Resilience 0.480 11
Components
Vulnerability 0.527 6
Coping Capacity 0.566 3
San Miguel: Coping Capacity San Miguel’s Coping Capacity is 3rd out of 14 with a score of 0.566. The thematic areas with the weakest
relative scores are Economic Capacity and Governance. These two thematic areas appear to constrain
Coping Capacity within this department.
Table 22: Coping Capacity sub-components for San Miguel
0 0.2 0.4 0.6 0.8 1
San Miguel Governance
Economic Capacity
Infrastructure
Environmental Capacity

National Disaster Preparedness Baseline Assessment: El Salvador 61 © Pacific Disaster Center 2015
Table 23 Coping Capacity Index, sub-component and sub-index scores for San Miguel
Index San Miguel Score Rank Coping Capacity 0.566 3 Sub-components
Governance 0.545 6 Economic Capacity 0.502 4 Environmental Capacity 0.622 3 Infrastructure 0.632 3
Infrastructure Sub-indices
Health Care 0.887 2 Transportation 0.528 8 Communications 0.481 7
San Miguel: Vulnerability San Miguel ranks 6th out of 14 on the Vulnerability Index with a score of 0.527. Vulnerability in San Miguel
is strongly influenced by Economic Constraints, Gender Inequality, and Information Access Vulnerability.
Table 24. Vulnerability Index and sub-component index scores for San Miguel
Index San Miguel Score Rank
Vulnerability 0.527 6 Sub-Components
Economic Constraints 0.643 2 Info Access Vulnerability 0.555 8 Vulnerable Health Status 0.479 9 Clean Water Vulnerability 0.529 5 Population Pressures 0.484 8
Environmental Stress 0.438 11 Gender Inequality 0.559 6

National Disaster Preparedness Baseline Assessment: El Salvador 62 © Pacific Disaster Center 2015
Figure 30: Vulnerability sub-components for San Miguel
San Miguel: Vulnerability San Miguel ranks 4th out of 14 on the Multi-Hazard Exposure index with a score of 0.649. A large
proportion of the population is exposed to seismic activity, landslides and volcanic ash. A small
proportion of San Miguel’s population is also exposed to flood.
Figure 31 : Raw population exposure by hazard type for San Miguel
0 0.2 0.4 0.6 0.8
San Miguel
385,114
58,203
264,433
255,561
Seismic
Flood
Landslide
Volcanic Ash
Economic Constraints
Info Access Vulnerability
Vulnerable Health Status
Clean Water Vulnerability
Population Pressures
Environmental Stress
Gender Inequality

National Disaster Preparedness Baseline Assessment: El Salvador 63 © Pacific Disaster Center 2015
Figure 32: Percent population exposure to hazard type for San Miguel
Table 25. Multi-Hazard Exposure Index, Raw and Relative Exposure Index scores for San Miguel
Index San Miguel Score Rank
Multi-Hazard Exposure 0.649 4
Sub-Components
Raw Exposure 0.591 3
Relative Exposure 0.708 2

National Disaster Preparedness Baseline Assessment: El Salvador 64 © Pacific Disaster Center 2015
Cabañas: Risk Cabañas ranks 7th out of 14 on the Multi-Hazard Risk Index with a score of 0.531. Cabañas has moderate
Multi-Hazard Exposure, very high Vulnerability and very low Coping Capacity. Though Cabañas ranks just
13th for Multi-Hazard Exposure, it ranks 1st in Vulnerability, and 14th in Coping Capacity.

National Disaster Preparedness Baseline Assessment: El Salvador 65 © Pacific Disaster Center 2015
Cabañas: Vulnerability Cabañas ranks 1st of 14 on the Lack of Resilience Index with a sore of 0.708. Cabañas’s score and ranking
are due to its very high Vulnerability and very low Coping Capacity. The department ranks 1st in
Vulnerability and 14th in Coping Capacity.
The three thematic areas with the weakest relative scores for the department of Cabañas are: Economic
Capacity, Infrastructure, and Economic Constraints.
Table 26. Lack of Resilience Index and Component scores for Cabañas
Index Cabañas
Score Rank
Lack of Resilience 0.708 1
Components
Vulnerability 0.616 1
Coping Capacity 0.200 14
Cabañas: Coping Capacity Cabañas’s Coping Capacity is 14th out of 14 with a score of 0.200. While Cabañas exhibits low scores across
all sub-components of Coping Capacity, the thematic areas with the weakest relative scores are Economic
Capacity, Environmental Capacity, and Infrastructure. These weaknesses appear to constrain Coping
Capacity within this department.
Figure 33. Coping Capacity sub-components for Cabañas
0 0.2 0.4 0.6 0.8 1
Cabañas
Governance
Economic Capacity
Infrastructure
Environmental Capacity

National Disaster Preparedness Baseline Assessment: El Salvador 66 © Pacific Disaster Center 2015
Table 27 Coping Capacity Index, sub-component and sub-index scores for Cabañas
Index Cabañas Score Rank Coping Capacity 0.200 14 Sub-components
Governance 0.294 11 Economic Capacity 0.187 13 Environmental Capacity 0.048 13 Infrastructure 0.171 14
Infrastructure Sub-indices
Health Care 0.194 8 Transportation 0.034 13 Communications 0.284 11
Cabañas: Vulnerability Cabañas ranks 1st out of 14 on the Vulnerability Index with a score of 0.616. Vulnerability in Cabañas is
strongly influenced by Economic Constraints, Environmental Stress, Gender Inequality, Clean Water
Vulnerability, and Information Access Vulnerability sub-component scores.
Table 28. Vulnerability Index and sub-component index scores for Cabañas
Index Cabañas Score Rank
Vulnerability 0.616 1 Sub-Components
Economic Constraints 0.815 1 Info Access Vulnerability 0.627 5 Vulnerable Health Status 0.278 13 Clean Water Vulnerability 0.636 3 Population Pressures 0.462 9
Environmental Stress 0.754 1 Gender Inequality 0.742 3

National Disaster Preparedness Baseline Assessment: El Salvador 67 © Pacific Disaster Center 2015
Figure 34: Vulnerability sub-components for Cabañas
Cabañas: Multi-Hazard Exposure Cabañas ranks 13th out of 14 on the Multi-Hazard Exposure Index with a score of 0.177. Despite this low
rank, a large proportion of Cabañas’s population is exposed to seismic activity and landslides. A smaller
proportion of Cabañas’s population is also exposed flood.
Figure 35: Raw population exposure by hazard type for Cabañas
0 0.2 0.4 0.6 0.8 1
Cabañas
95,911
9,377
141,455
Seismic
Flood
Landslide
Economic Constraints
Info Access Vulnerability
Vulnerable Health Status
Clean Water Vulnerability
Population Pressures
Environmental Stress
Gender Inequality

National Disaster Preparedness Baseline Assessment: El Salvador 68 © Pacific Disaster Center 2015
Figure 36: Percent population exposure to hazard type for Cabañas
Table 29. Multi-Hazard Exposure Index, Raw and Relative Exposure Index scores for Cabañas
Index Cabañas
Score Rank
Multi-Hazard Exposure 0.177 13
Sub-Components Raw Exposure 0.015 13
Relative Exposure 0.339 12
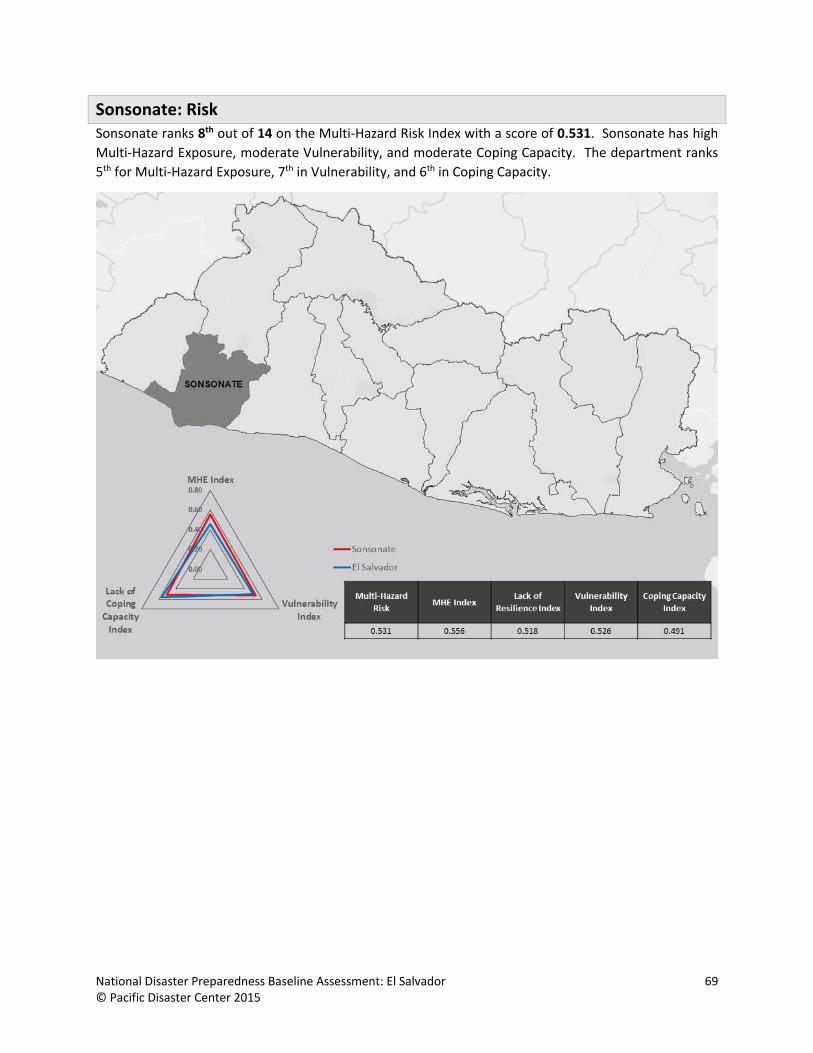
National Disaster Preparedness Baseline Assessment: El Salvador 69 © Pacific Disaster Center 2015
Sonsonate: Risk Sonsonate ranks 8th out of 14 on the Multi-Hazard Risk Index with a score of 0.531. Sonsonate has high
Multi-Hazard Exposure, moderate Vulnerability, and moderate Coping Capacity. The department ranks
5th for Multi-Hazard Exposure, 7th in Vulnerability, and 6th in Coping Capacity.

National Disaster Preparedness Baseline Assessment: El Salvador 70 © Pacific Disaster Center 2015
Sonsonate: Lack of Resilience Sonsonate ranks 9th of 14 on the Lack of Resilience Index with a score of 0.518. Sonsonate’s score and
ranking are due to its moderate Vulnerability and Coping Capacity. The department ranks 7th in
Vulnerability and 6th in Coping Capacity.
The three thematic areas with the weakest relative scores for the department of Sonsonate are: Economic
Capacity, Vulnerable Health Status, and Health Care Capacity.
Table 30. Lack of Resilience Index and Component scores for Sonsonate
Index Sonsonate
Score Rank
Lack of Resilience 0.518 9
Components
Vulnerability 0.526 7
Coping Capacity 0.491 6
Sonsonate: Coping Capacity Sonsonate’s Coping Capacity is 6th out of 14 with a score of 0.491. The thematic areas with the weakest
relative scores are Economic Capacity and Infrastructure (Health Care Capacity). These two thematic
areas appear to constrain Coping Capacity within this department.
Figure 37: Coping Capacity sub-components for Sonsonate
0 0.2 0.4 0.6 0.8 1
Sonsonate
Governance
Economic Capacity
Infrastructure
Environmental Capacity

National Disaster Preparedness Baseline Assessment: El Salvador 71 © Pacific Disaster Center 2015
Table 31 Coping Capacity Index, sub-component and sub-index scores for Sonsonate
Index Sonsonate Score Rank Coping Capacity 0.491 6 Sub-components
Governance 0.692 1 Economic Capacity 0.335 10 Environmental Capacity 0.488 6 Infrastructure 0.445 7
Infrastructure Sub-indices
Health Care 0.215 7 Transportation 0.599 5 Communications 0.520 5
Sonsonate: Vulnerability Sonsonate ranks 7th out of 14 on the Vulnerability Index with a score of 0.526. Vulnerability in Sonsonate
is influenced by Vulnerable Health Status, Environmental Stress, and Information Access Vulnerability
sub-component scores.
Table 32. Vulnerability Index and sub-component index scores for Sonsonate
Index Sonsonate Score Rank
Vulnerability 0.526 7 Sub-Components
Economic Constraints 0.453 12 Info Access Vulnerability 0.556 7 Vulnerable Health Status 0.643 1 Clean Water Vulnerability 0.471 9 Population Pressures 0.502 7
Environmental Stress 0.582 3 Gender Inequality 0.474 7

National Disaster Preparedness Baseline Assessment: El Salvador 72 © Pacific Disaster Center 2015
Figure 38: Vulnerability sub-components for Sonsonate
Sonsonate: Multi-Hazard Exposure Sonsonate ranks 5th out of 14 on the Multi-Hazard Exposure index with a score of 0.556. A large
proportion of the population is exposed to seismic activity and landslides. Smaller proportions of
Sonsonate’s population are also exposed to flood and tsunami.
Figure 39: Raw population exposure by hazard type for Sonsonate
0 0.2 0.4 0.6 0.8 1
Sonsonate
438,960
49,708
361,811
29,373
Seismic
Flood
Landslide
Tsunami
Economic Constraints
Info Access Vulnerability
Vulnerable Health Status
Clean Water Vulnerability
Population Pressures
Environmental Stress
Gender Inequality

National Disaster Preparedness Baseline Assessment: El Salvador 73 © Pacific Disaster Center 2015
Figure 40: Percent population exposure to hazard type for Sonsonate
Table 33. Multi-Hazard Exposure Index, Raw and Relative Exposure Index scores for Sonsonate
Index Sonsonate
Score Rank
Multi-Hazard Exposure 0.556 5
Sub-Components Raw Exposure 0.545 5
Relative Exposure 0.567 7

National Disaster Preparedness Baseline Assessment: El Salvador 74 © Pacific Disaster Center 2015
La Unión: Risk La Unión ranks 9th out of 14 on the Multi-Hazard Risk index with a score of 0.501. La Unión has low Multi-
Hazard Exposure, high Vulnerability, and moderate Coping Capacity. The department ranks 9th for Multi-
Hazard Exposure, 4th in Vulnerability, and 7th in Coping Capacity.

National Disaster Preparedness Baseline Assessment: El Salvador 75 © Pacific Disaster Center 2015
La Unión: Lack of Resilience La Unión ranks 7th of 14 on Lack of Resilience Index with a score of 0.552. La Unión’s score and ranking
are due to the department’s high Vulnerability combined with moderate Coping Capacity. The department
ranks 4th in Vulnerability, and 7th in Coping Capacity.
The three thematic areas with the weakest relative scores for the department of La Unión are:
Infrastructure (Health Care Capacity), Clean Water Vulnerability, and Information Access Vulnerability
Table 34. Lack of Resilience Index and Component scores for La Unión
Index La Unión
Score Rank
Lack of Resilience 0.552 7
Components
Vulnerability 0.582 4
Coping Capacity 0.478 7
La Unión: Coping Capacity La Unión’s Coping Capacity is 7th out of 14 with a score of 0.478. The thematic areas with the weakest
relative scores are Infrastructure (Health Care Capacity) and Governance. These two thematic areas
appear to constrain Coping Capacity within this department.
Figure 41: Coping Capacity sub-components for La Unión
0 0.2 0.4 0.6 0.8 1
La Unión
Governance
Economic Capacity
Infrastructure
Environmental Capacity

National Disaster Preparedness Baseline Assessment: El Salvador 76 © Pacific Disaster Center 2015
Table 35 Coping Capacity Index, sub-component and sub-index scores for La Unión
Index La Unión Score Rank Coping Capacity 0.478 7 Sub-components
Governance 0.489 9 Economic Capacity 0.552 3 Environmental Capacity 0.547 5 Infrastructure 0.371 8
Infrastructure Sub-indices
Health Care 0.079 12 Transportation 0.538 7 Communications 0.496 6
La Unión: Vulnerability La Unión ranks 4th out of 14 on the Vulnerability Index with a score of 0.582. Vulnerability in La Unión is
strongly influenced by Clean Water Vulnerability, Information Access Vulnerability, Gender Inequality,
and Economic Constraints. sub-component scores.
Table 36. Vulnerability Index and sub-component index scores for La Unión
Index La Unión Score Rank
Vulnerability 0.582 4 Sub-Components
Economic Constraints 0.634 3 Info Access Vulnerability 0.820 1 Vulnerable Health Status 0.494 8 Clean Water Vulnerability 0.980 1 Population Pressures 0.205 11
Environmental Stress 0.196 14 Gender Inequality 0.748 2
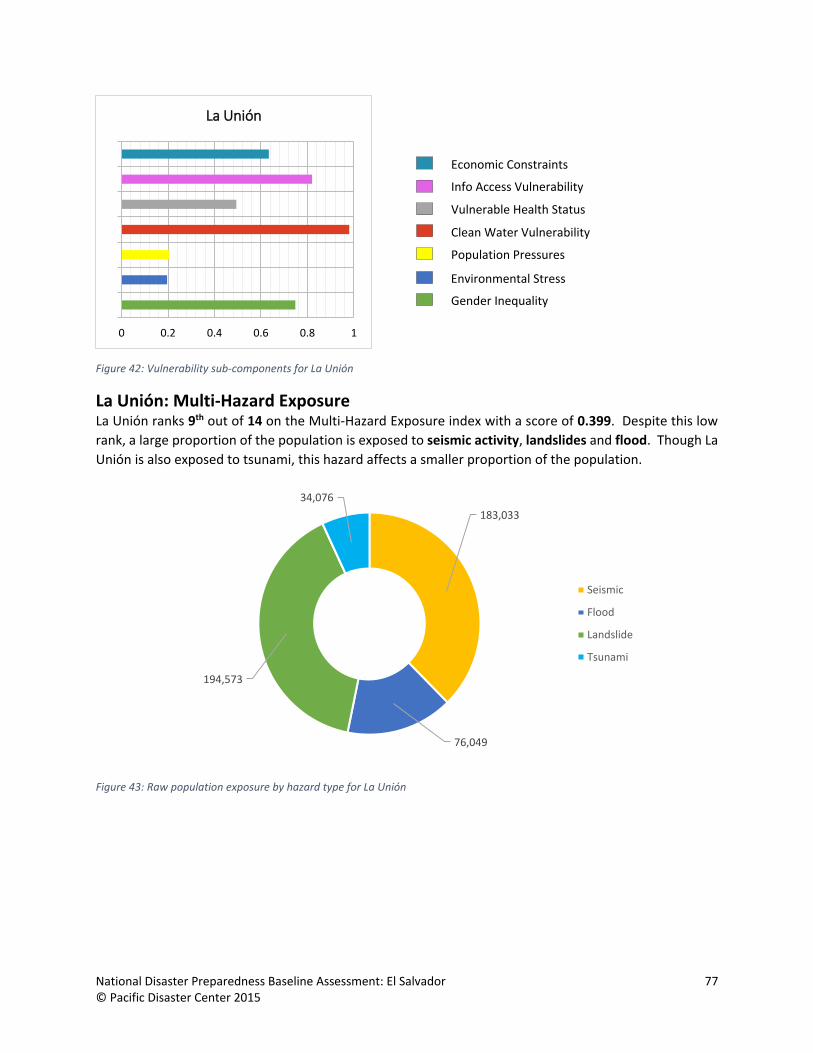
National Disaster Preparedness Baseline Assessment: El Salvador 77 © Pacific Disaster Center 2015
Figure 42: Vulnerability sub-components for La Unión
La Unión: Multi-Hazard Exposure La Unión ranks 9th out of 14 on the Multi-Hazard Exposure index with a score of 0.399. Despite this low
rank, a large proportion of the population is exposed to seismic activity, landslides and flood. Though La
Unión is also exposed to tsunami, this hazard affects a smaller proportion of the population.
Figure 43: Raw population exposure by hazard type for La Unión
0 0.2 0.4 0.6 0.8 1
La Unión
183,033
76,049
194,573
34,076
Seismic
Flood
Landslide
Tsunami
Economic Constraints
Info Access Vulnerability
Vulnerable Health Status
Clean Water Vulnerability
Population Pressures
Environmental Stress
Gender Inequality
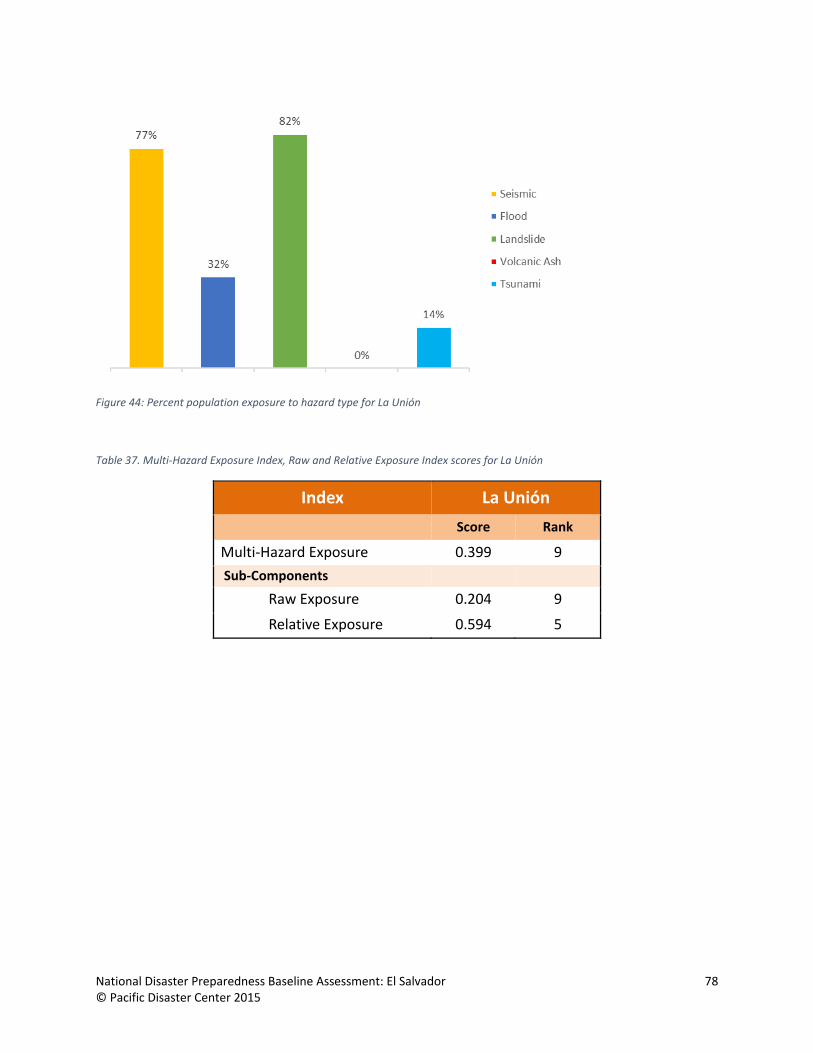
National Disaster Preparedness Baseline Assessment: El Salvador 78 © Pacific Disaster Center 2015
Figure 44: Percent population exposure to hazard type for La Unión
Table 37. Multi-Hazard Exposure Index, Raw and Relative Exposure Index scores for La Unión
Index La Unión Score Rank
Multi-Hazard Exposure 0.399 9
Sub-Components Raw Exposure 0.204 9
Relative Exposure 0.594 5
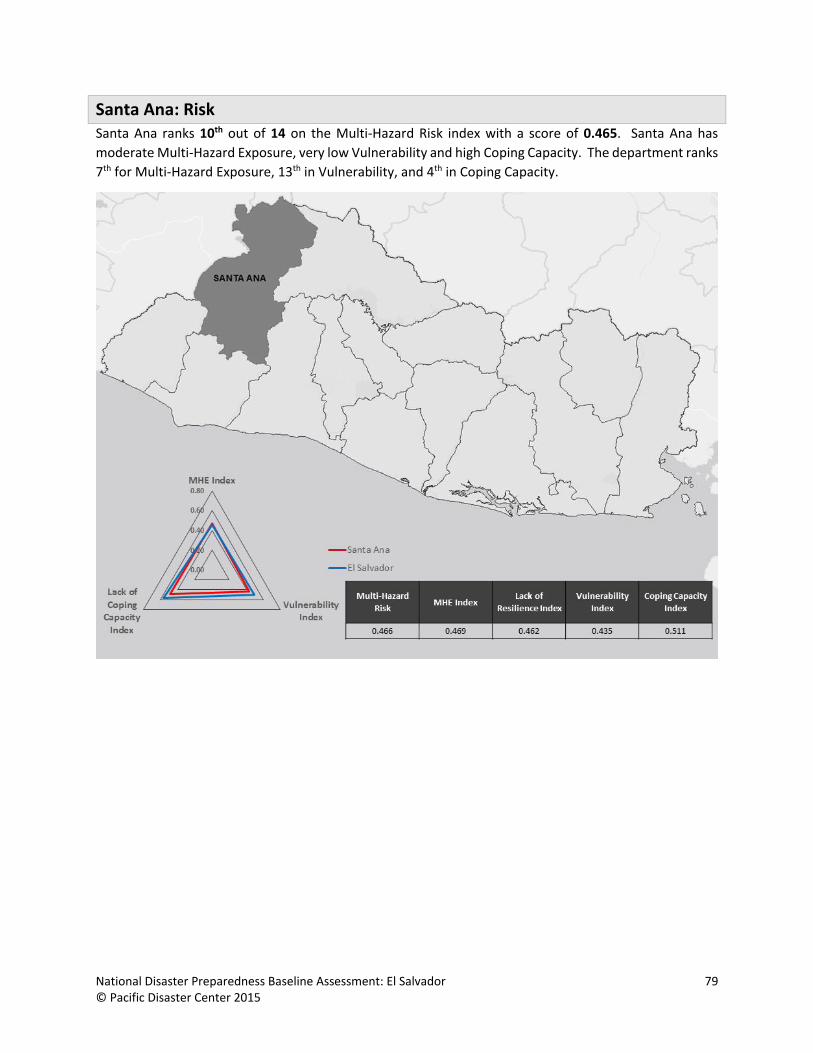
National Disaster Preparedness Baseline Assessment: El Salvador 79 © Pacific Disaster Center 2015
Santa Ana: Risk Santa Ana ranks 10th out of 14 on the Multi-Hazard Risk index with a score of 0.465. Santa Ana has
moderate Multi-Hazard Exposure, very low Vulnerability and high Coping Capacity. The department ranks
7th for Multi-Hazard Exposure, 13th in Vulnerability, and 4th in Coping Capacity.
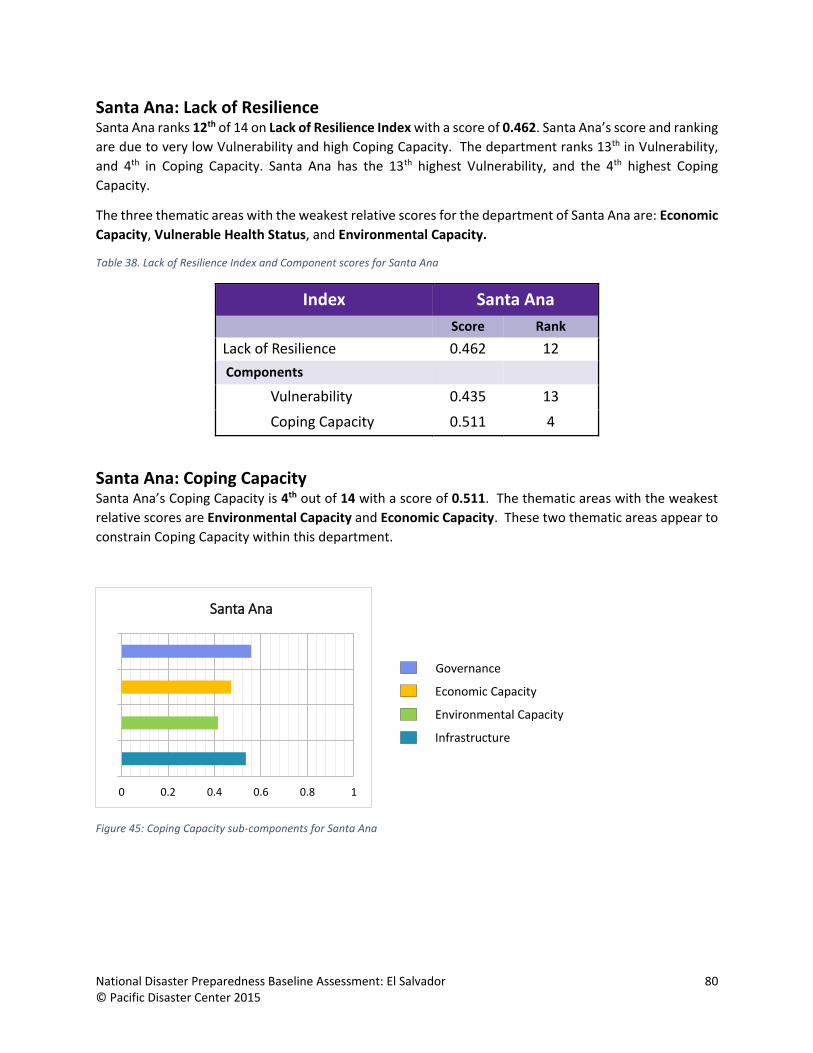
National Disaster Preparedness Baseline Assessment: El Salvador 80 © Pacific Disaster Center 2015
Santa Ana: Lack of Resilience Santa Ana ranks 12th of 14 on Lack of Resilience Index with a score of 0.462. Santa Ana’s score and ranking
are due to very low Vulnerability and high Coping Capacity. The department ranks 13th in Vulnerability,
and 4th in Coping Capacity. Santa Ana has the 13th highest Vulnerability, and the 4th highest Coping
Capacity.
The three thematic areas with the weakest relative scores for the department of Santa Ana are: Economic
Capacity, Vulnerable Health Status, and Environmental Capacity.
Table 38. Lack of Resilience Index and Component scores for Santa Ana
Index Santa Ana
Score Rank
Lack of Resilience 0.462 12
Components
Vulnerability 0.435 13
Coping Capacity 0.511 4
Santa Ana: Coping Capacity Santa Ana’s Coping Capacity is 4th out of 14 with a score of 0.511. The thematic areas with the weakest
relative scores are Environmental Capacity and Economic Capacity. These two thematic areas appear to
constrain Coping Capacity within this department.
Figure 45: Coping Capacity sub-components for Santa Ana
0 0.2 0.4 0.6 0.8 1
Santa Ana
Governance
Economic Capacity
Infrastructure
Environmental Capacity

National Disaster Preparedness Baseline Assessment: El Salvador 81 © Pacific Disaster Center 2015
Table 39 Coping Capacity Index, sub-component and sub-index scores for Santa Ana
Index Santa Ana Score Rank Coping Capacity 0.511 4 Sub-components
Governance 0.558 5 Economic Capacity 0.471 5 Environmental Capacity 0.415 8 Infrastructure 0.535 5
Infrastructure Sub-indices
Health Care 0.602 4 Transportation 0.360 10 Communications 0.643 3
Santa Ana: Vulnerability Santa Ana ranks 13th out of 14 on the Vulnerability Index with a score of 0.435. Though Vulnerability in
Santa Ana is relatively low, the Index is influenced by Vulnerable Health Status and Economic Constraints
sub-component scores.
Table 40. Vulnerability Index and sub-component index scores for Santa Ana
Index Santa Ana Score Rank
Vulnerability 0.435 13 Sub-Components
Economic Constraints 0.566 7 Info Access Vulnerability 0.483 10 Vulnerable Health Status 0.610 2 Clean Water Vulnerability 0.473 8 Population Pressures 0.132 12
Environmental Stress 0.465 9 Gender Inequality 0.315 12

National Disaster Preparedness Baseline Assessment: El Salvador 82 © Pacific Disaster Center 2015
Figure 46: Vulnerability sub-components for Santa Ana
Santa Ana: Multi-Hazard Exposure Santa Ana ranks 7th out of 14 on the Multi-Hazard Exposure index with a score of 0.469. A large proportion
of the population is exposed to seismic activity and landslides. While Santa Ana is also exposed to flood
and volcanic ash, these hazards affect a smaller proportion of the department’s population.
Figure 47: Raw population exposure by hazard type for Santa Ana. *1,567 people are potentially exposed to volcanic ash.
0 0.2 0.4 0.6 0.8 1
Santa Ana
512,097
23,583
336,277Seismic
Flood
Landslide
Economic Constraints
Info Access Vulnerability
Vulnerable Health Status
Clean Water Vulnerability
Population Pressures
Environmental Stress
Gender Inequality

National Disaster Preparedness Baseline Assessment: El Salvador 83 © Pacific Disaster Center 2015
Figure 48: Percent population exposure to hazard type for Santa Ana.
Table 41. Multi-Hazard Exposure Index, Raw and Relative Exposure Index scores for Santa Ana
Index Santa Ana
Score Rank
Multi-Hazard Exposure 0.469 7
Sub-Components Raw Exposure 0.590 4
Relative Exposure 0.349 11
98%
5%
64%
<1% 0%
Seismic Flood Landslide Volcanic Ash Tsunami
Seismic
Flood
Landslide
Volcanic Ash
Tsunami

National Disaster Preparedness Baseline Assessment: El Salvador 84 © Pacific Disaster Center 2015
San Vincente: Risk San Vincente ranks 11th out of 14 on the Multi-Hazard Risk index with a score of 0.463. San Vincente has
low Multi-Hazard Exposure, moderate Vulnerability and low Coping Capacity. The department ranks 11th
in Multi-Hazard Exposure, 8th in Vulnerability and 10th in Coping Capacity.

National Disaster Preparedness Baseline Assessment: El Salvador 85 © Pacific Disaster Center 2015
San Vincente: Lack of Resilience San Vincente ranks 6th of 14 on Lack of Resilience Index with a score of 0.561. San Vincente’s score and
ranking are due to moderate Vulnerability and low Coping Capacity. The department ranks 8th in
Vulnerability and 10th in Coping Capacity.
The three thematic areas with the weakest relative scores for the department of San Vincente are:
Governance, Environmental Capacity, and Economic Capacity.
Table 42. Lack of Resilience Index and Component scores for San Vincente
Index San Vincente
Score Rank
Lack of Resilience 0.561 6
Components
Vulnerability 0.486 8
Coping Capacity 0.363 10
San Vincente: Coping Capacity San Vincente’s Coping Capacity is 10th out of 14 with a score of 0.363. The thematic areas with the weakest
relative scores are Environmental Capacity and Governance. These two thematic areas appear to
constrain Coping Capacity within this department.
Figure 49: Coping Capacity sub-components for San Vincente
0 0.2 0.4 0.6 0.8 1
San Vincente
Governance
Economic Capacity
Infrastructure
Environmental Capacity

National Disaster Preparedness Baseline Assessment: El Salvador 86 © Pacific Disaster Center 2015
Table 43 Coping Capacity Index, sub-component and sub-index scores for San Vincente
Index San Vincente
Score Rank Coping Capacity 0.363 10 Sub-components
Governance 0.288 12 Economic Capacity 0.328 11 Environmental Capacity 0.260 9 Infrastructure 0.508 6
Infrastructure Sub-indices
Health Care 0.719 3 Transportation 0.472 9 Communications 0.332 10
San Vincente: Vulnerability San Vincente ranks 8th out of 14 on the Vulnerability Index with a score of 0.486. Vulnerability in San
Vincente is influenced by Vulnerable Health Status, Population Pressures, and Environmental Stress sub-
component scores.
Table 44. Vulnerability Index and sub-component index scores for San Vincente
Index San Vincente Score Rank
Vulnerability 0.486 8 Sub-Components
Economic Constraints 0.507 9 Info Access Vulnerability 0.457 12 Vulnerable Health Status 0.605 4 Clean Water Vulnerability 0.366 10 Population Pressures 0.531 6
Environmental Stress 0.523 6 Gender Inequality 0.411 10

National Disaster Preparedness Baseline Assessment: El Salvador 87 © Pacific Disaster Center 2015
Figure 50: Vulnerability sub-components for San Vincente
San Vincente: Multi-Hazard Exposure San Vincente ranks 11th out of 14 on the Multi-Hazard Exposure index with a score of 0.266. Despite this
low rank, large proportion of the population is exposed to seismic activity and landslides. Smaller
proportions of the population are also exposed to flood and tsunami.
Figure 51: Raw population exposure by hazard type for San Vincente
0 0.2 0.4 0.6 0.8 1
San Vincente
161,645
18,069
116,043
6,299
Seismic
Flood
Landslide
Tsunami
Economic Constraints
Info Access Vulnerability
Vulnerable Health Status
Clean Water Vulnerability
Population Pressures
Environmental Stress
Gender Inequality
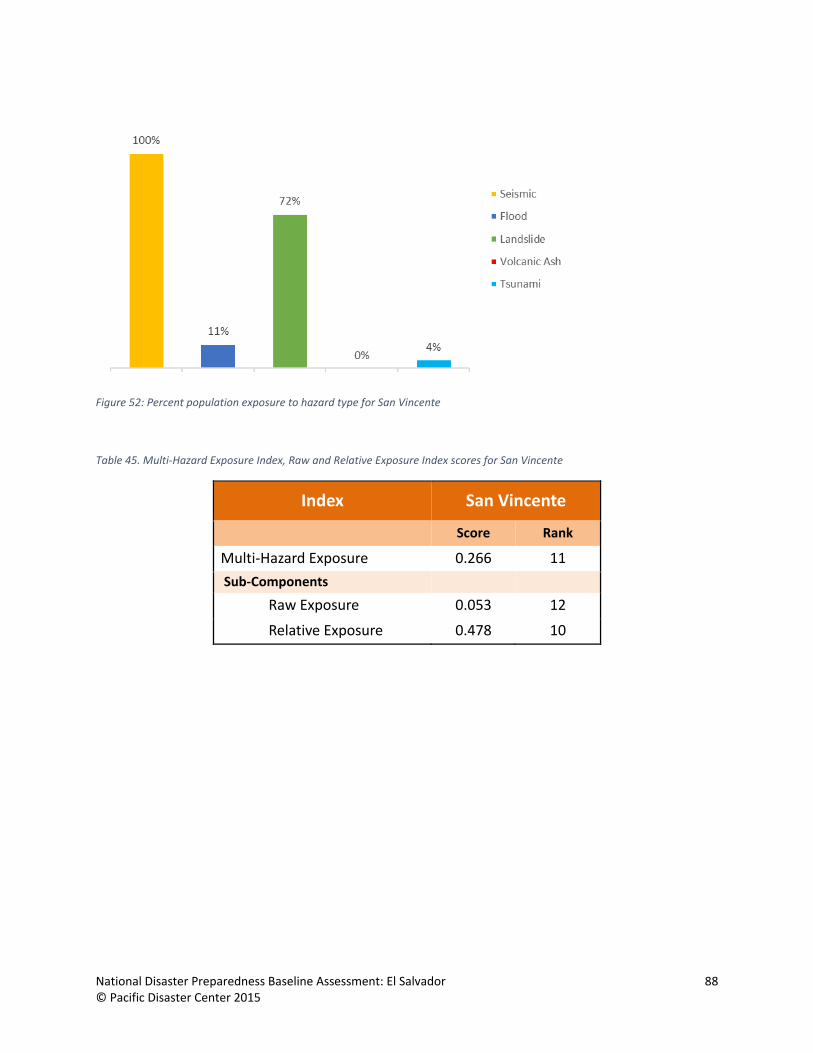
National Disaster Preparedness Baseline Assessment: El Salvador 88 © Pacific Disaster Center 2015
Figure 52: Percent population exposure to hazard type for San Vincente
Table 45. Multi-Hazard Exposure Index, Raw and Relative Exposure Index scores for San Vincente
Index San Vincente
Score Rank
Multi-Hazard Exposure 0.266 11
Sub-Components Raw Exposure 0.053 12
Relative Exposure 0.478 10

National Disaster Preparedness Baseline Assessment: El Salvador 89 © Pacific Disaster Center 2015
San Salvador: Risk San Salvador ranks 12th out of 14 on the Multi-Hazard Risk index with a score of 0.439. Though San
Salvador has very high Multi-Hazard Exposure, this is combined with very low Vulnerability, and very high
Coping Capacity for lower relative Risk. The department ranks 2nd for Multi-Hazard Exposure, 14th in
Vulnerability, and 1st in Coping Capacity.

National Disaster Preparedness Baseline Assessment: El Salvador 90 © Pacific Disaster Center 2015
San Salvador: Lack of Resilience San Salvador ranks 14th of 14 on Lack of Resilience Index with a score of 0.278. San Salvador’s score and
ranking are due to very low Vulnerability and very high Coping Capacity. San Salvador has the lowest
Vulnerability and highest Coping Capacity in the country, indicating high resilience overall. Overall, San
Salvador exhibits relatively few thematic weaknesses in Vulnerability and Coping Capacity with one
exception: Environmental Capacity.
Table 46. Lack of Resilience Index and Component scores for San Salvador
Index San Salvador
Score Rank
Lack of Resilience 0.278 14
Components
Vulnerability 0.237 14
Coping Capacity 0.681 1
San Salvador: Coping Capacity San Salvador’s Coping Capacity is 1st out of 14 with a score of 0.681. Consequently, San Salvador exhibits
only one area of thematic weakness in Coping Capacity: Environmental Capacity. This thematic area may
constrain Coping Capacity within this department.
Figure 53: Coping Capacity sub-components for San Salvador
0 0.2 0.4 0.6 0.8 1
San Salvador
Governance
Economic Capacity
Infrastructure
Environmental Capacity

National Disaster Preparedness Baseline Assessment: El Salvador 91 © Pacific Disaster Center 2015
Table 47 Coping Capacity Index, sub-component and sub-index scores for San Salvador
Index San Salvador Score Rank Coping Capacity 0.681 1 Sub-components
Governance 0.660 2 Economic Capacity 0.667 1 Environmental Capacity 0.072 12 Infrastructure 0.917 1
Infrastructure Sub-indices
Health Care 0.999 1 Transportation 0.791 3 Communications 0.962 2
San Salvador: Vulnerability San Salvador ranks 14th out of 14 on the Vulnerability Index with a score of 0.237. Though San Salvador
exhibits the lowest Vulnerability in the country, the Index is influenced by Environmental Stress and
Vulnerable Health Status sub-component scores.
Table 48. Vulnerability Index and sub-component index scores for San Salvador
Index San Salvador Score Rank
Vulnerability 0.237 14 Sub-Components
Economic Constraints 0.295 14 Info Access Vulnerability 0.076 14 Vulnerable Health Status 0.395 11 Clean Water Vulnerability 0 14 Population Pressures 0.129 13
Environmental Stress 0.458 10 Gender Inequality 0.305 13
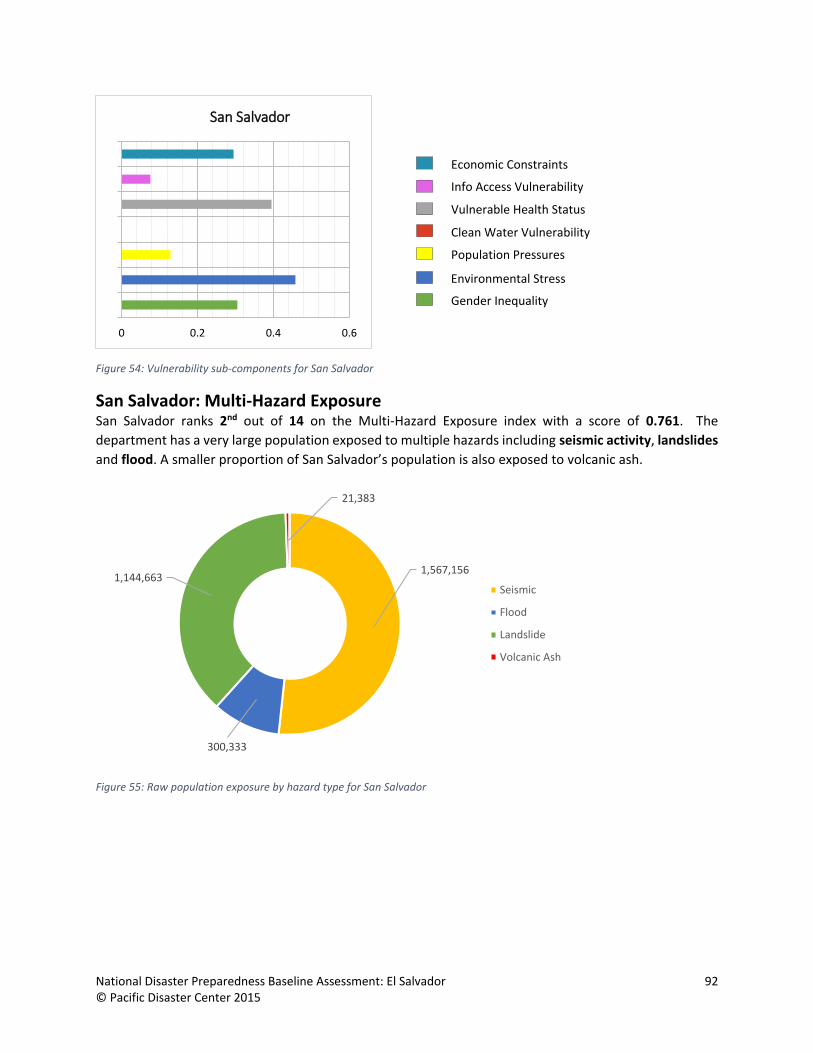
National Disaster Preparedness Baseline Assessment: El Salvador 92 © Pacific Disaster Center 2015
Figure 54: Vulnerability sub-components for San Salvador
San Salvador: Multi-Hazard Exposure San Salvador ranks 2nd out of 14 on the Multi-Hazard Exposure index with a score of 0.761. The
department has a very large population exposed to multiple hazards including seismic activity, landslides
and flood. A smaller proportion of San Salvador’s population is also exposed to volcanic ash.
Figure 55: Raw population exposure by hazard type for San Salvador
0 0.2 0.4 0.6
San Salvador
1,567,156
300,333
1,144,663
21,383
Seismic
Flood
Landslide
Volcanic Ash
Economic Constraints
Info Access Vulnerability
Vulnerable Health Status
Clean Water Vulnerability
Population Pressures
Environmental Stress
Gender Inequality

National Disaster Preparedness Baseline Assessment: El Salvador 93 © Pacific Disaster Center 2015
Figure 56: Percent population exposure to hazard type for San Salvador
Table 49. Multi-Hazard Exposure Index, Raw and Relative Exposure Index scores for San Salvador
Index San Salvador
Score Rank
Multi-Hazard Exposure 0.761 2
Sub-Components Raw Exposure 1.000 1
Relative Exposure 0.522 9

National Disaster Preparedness Baseline Assessment: El Salvador 94 © Pacific Disaster Center 2015
Chalatenango: Risk Chalatenango ranks 13th out of 14 on the Multi-Hazard Risk index with a score of 0.417. Chalatenango has
very low Multi-Hazard Exposure, low Vulnerability and moderate Coping Capacity. The department ranks
12th in Multi-Hazard Exposure, 9th in Vulnerability and 8th in Coping Capacity

National Disaster Preparedness Baseline Assessment: El Salvador 95 © Pacific Disaster Center 2015
Chalatenango: Lack of Resilience Chalatenango ranks 8th of 14 on Lack of Resilience Index with a score of 0.532. Chalatenango’s score and
ranking are due to low Vulnerability and moderate Coping Capacity. Chalatenango has the 12th highest
Multi-Hazard Exposure in the country, the 9th highest Vulnerability, and the 8th highest Coping Capacity.
The three thematic areas with the weakest relative scores for the department of Chalatenango are:
Environmental Capacity, Gender Inequality, and Vulnerable Health Status.
Table 50. Lack of Resilience Index and Component scores for Chalatenango
Index Chalatenango
Score Rank
Lack of Resilience 0.532 8
Components
Vulnerability 0.458 9
Coping Capacity 0.395 8
Chalatenango: Coping Capacity Chalatenango’s Coping Capacity is 8th out of 14 with a score of 0.395. The thematic areas with the weakest
relative scores are Environmental Capacity and Infrastructure (Transportation). These two thematic
areas appear to constrain Coping Capacity within this department.
Figure 57: Coping Capacity sub-components for Chalatenango
0 0.2 0.4 0.6 0.8 1
Chalatenango
Governance
Economic Capacity
Infrastructure
Environmental Capacity

National Disaster Preparedness Baseline Assessment: El Salvador 96 © Pacific Disaster Center 2015
Table 51 Coping Capacity Index, sub-component and sub-index scores for Chalatenango
Index Chalatenango
Score Rank Coping Capacity 0.395 8 Sub-components
Governance 0.561 4 Economic Capacity 0.377 9 Environmental Capacity 0.107 11 Infrastructure 0.344 9
Infrastructure Sub-indices
Health Care 0.581 5 Transportation 0.000 14 Communications 0.451 8
Chalatenango: Vulnerability Chalatenango ranks 9th out of 14 on the Vulnerability Index with a score of 0.458. Despite this low rank,
Vulnerability in Chalatenango is strongly influenced by high sub-component scores in the thematic areas
of Gender Inequality, Vulnerable Health Status, and Economic Constraints.
Table 52. Vulnerability Index and sub-component index scores for Chalatenango
Index Chalatenango Score Rank
Vulnerability 0.458 9 Sub-Components
Economic Constraints 0.566 6 Info Access Vulnerability 0.471 11 Vulnerable Health Status 0.609 3 Clean Water Vulnerability 0.212 12 Population Pressures 0.000 14
Environmental Stress 0.544 5 Gender Inequality 0.806 1

National Disaster Preparedness Baseline Assessment: El Salvador 97 © Pacific Disaster Center 2015
Figure 58: Vulnerability sub-components for Chalatenango
Chalatenango: Multi-Hazard Exposure Chalatenango ranks 12th out of 14 on the Multi-Hazard Exposure index with a score of 0.188. Despite this
low rank, a large proportion of Chalatenango ‘population is exposed to landslides, seismic activity, and
flood.
Figure 59: Raw population exposure by hazard type for Chalatenango
0 0.2 0.4 0.6 0.8 1
Chalatenango
Economic Constraints
Info Access Vulnerability
Vulnerable Health Status
Clean Water Vulnerability
Population Pressures
Environmental Stress
Gender Inequality

National Disaster Preparedness Baseline Assessment: El Salvador 98 © Pacific Disaster Center 2015
Figure 60: Percent population exposure to hazard type for Chalatenango
Table 53. Multi-Hazard Exposure Index, Raw and Relative Exposure Index scores for Chalatenango
Index Chalatenango
Score Rank
Multi-Hazard Exposure 0.188 12
Sub-Components Raw Exposure 0.074 11
Relative Exposure 0.301 13
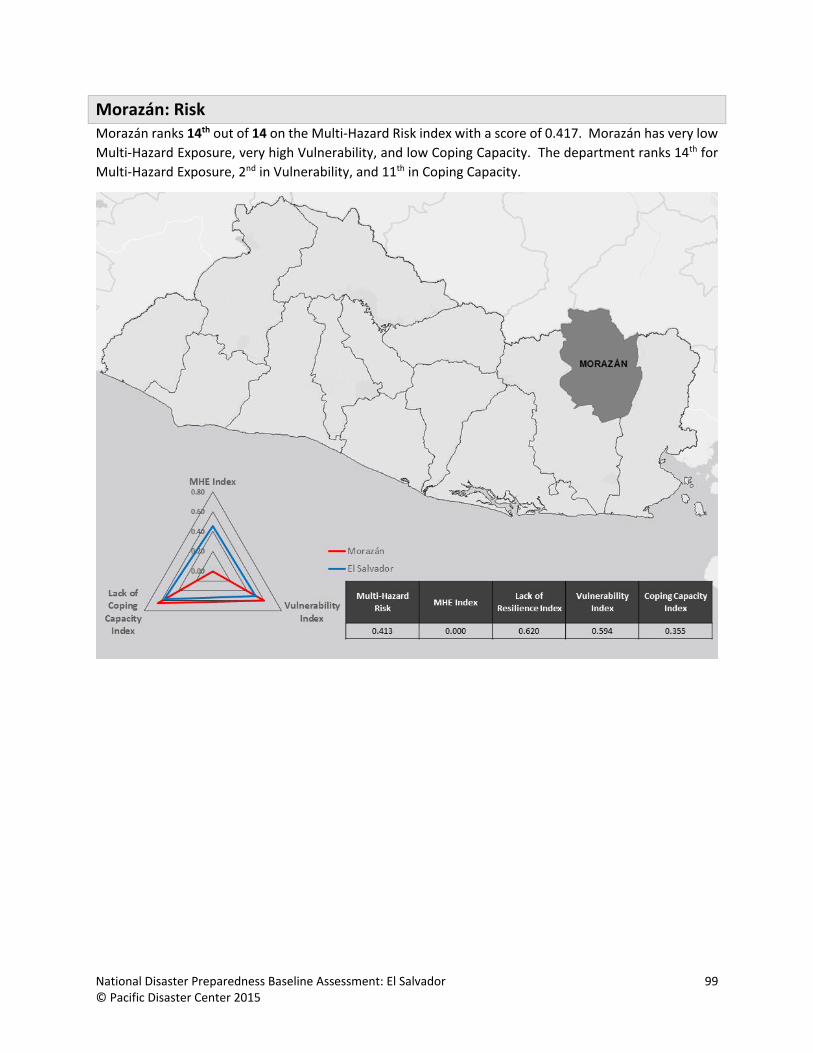
National Disaster Preparedness Baseline Assessment: El Salvador 99 © Pacific Disaster Center 2015
Morazán: Risk Morazán ranks 14th out of 14 on the Multi-Hazard Risk index with a score of 0.417. Morazán has very low
Multi-Hazard Exposure, very high Vulnerability, and low Coping Capacity. The department ranks 14th for
Multi-Hazard Exposure, 2nd in Vulnerability, and 11th in Coping Capacity.
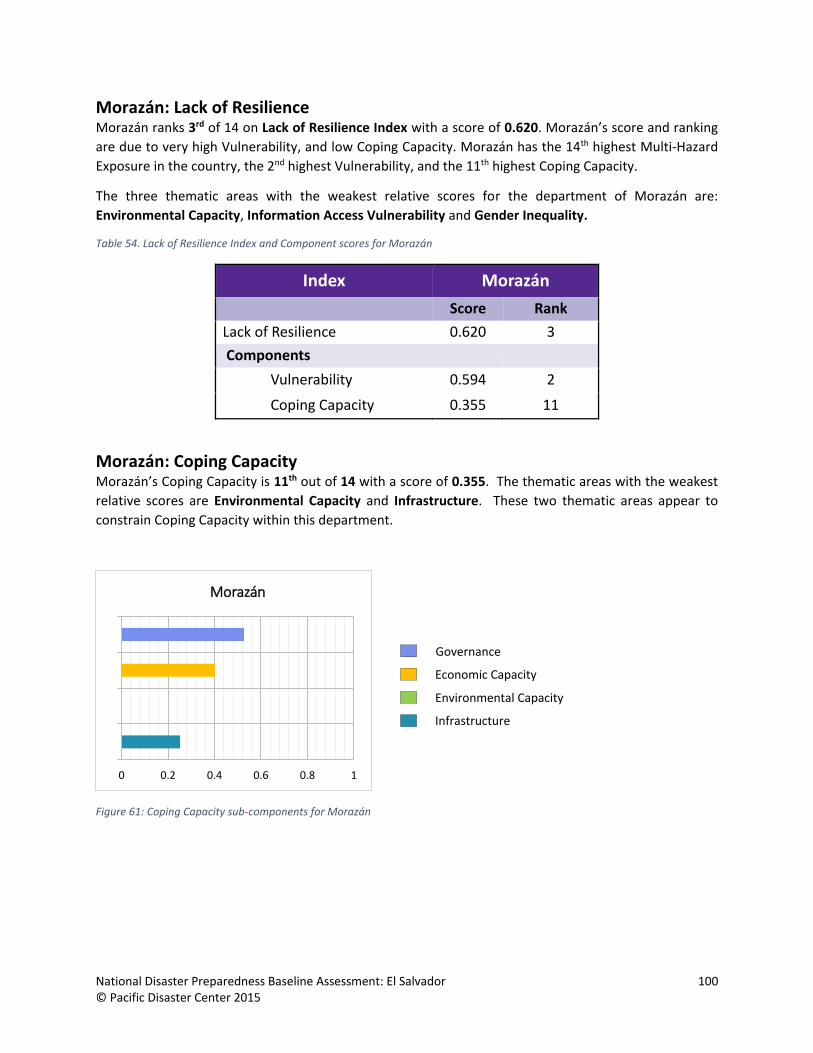
National Disaster Preparedness Baseline Assessment: El Salvador 100 © Pacific Disaster Center 2015
Morazán: Lack of Resilience Morazán ranks 3rd of 14 on Lack of Resilience Index with a score of 0.620. Morazán’s score and ranking
are due to very high Vulnerability, and low Coping Capacity. Morazán has the 14th highest Multi-Hazard
Exposure in the country, the 2nd highest Vulnerability, and the 11th highest Coping Capacity.
The three thematic areas with the weakest relative scores for the department of Morazán are:
Environmental Capacity, Information Access Vulnerability and Gender Inequality.
Table 54. Lack of Resilience Index and Component scores for Morazán
Index Morazán
Score Rank
Lack of Resilience 0.620 3
Components
Vulnerability 0.594 2
Coping Capacity 0.355 11
Morazán: Coping Capacity Morazán’s Coping Capacity is 11th out of 14 with a score of 0.355. The thematic areas with the weakest
relative scores are Environmental Capacity and Infrastructure. These two thematic areas appear to
constrain Coping Capacity within this department.
Figure 61: Coping Capacity sub-components for Morazán
0 0.2 0.4 0.6 0.8 1
Morazán
Governance
Economic Capacity
Infrastructure
Environmental Capacity

National Disaster Preparedness Baseline Assessment: El Salvador 101 © Pacific Disaster Center 2015
Table 55 Coping Capacity Index, sub-component and sub-index scores for Morazán
Index Morazán
Score Rank Coping Capacity 0.355 11 Sub-components
Governance 0.527 8 Economic Capacity 0.403 6 Environmental Capacity 0.000 14 Infrastructure 0.252 12
Infrastructure Sub-indices
Health Care 0.038 14
Transportation 0.580 6
Communications 0.139 12
Morazán: Vulnerability Morazán ranks 2nd out of 14 on the Vulnerability Index with a score of 0.594. Vulnerability in Morazán is
strongly influenced by Information Access Vulnerability, Population Pressures, and Gender Inequality
sub-component scores.
Table 56. Vulnerability Index and sub-component index scores for Morazán
Index Morazán Score Rank
Vulnerability 0.594 2 Sub-Components
Economic Constraints 0.558 8
Info Access Vulnerability 0.751 2
Vulnerable Health Status 0.571 5
Clean Water Vulnerability 0.579 4
Population Pressures 0.654 5
Environmental Stress 0.474 8
Gender Inequality 0.654 4

National Disaster Preparedness Baseline Assessment: El Salvador 102 © Pacific Disaster Center 2015
Figure 62: Vulnerability sub-components for Morazán
Morazán: Multi-Hazard Exposure Morazán ranks 14th out of 14 on the Multi-Hazard Exposure index with a score of 0.000. It is important to
note that a score of zero on the MHE Index does not indicate “zero exposure.” Despite the low rank, a
large proportion of the population is exposed to landslides. While Morazán is also exposed to seismic
activity and flood, these hazards threaten a smaller proportion of the population.
Figure 63: Raw population exposure by hazard type for Morazán
0 0.2 0.4 0.6 0.8 1
Morazán
18,042
11,333
166,928Seismic
Flood
Landslide
Economic Constraints
Info Access Vulnerability
Vulnerable Health Status
Clean Water Vulnerability
Population Pressures
Environmental Stress
Gender Inequality

National Disaster Preparedness Baseline Assessment: El Salvador 103 © Pacific Disaster Center 2015
Figure 64: Percent population exposure to hazard type for Morazán
Table 57. Multi-Hazard Exposure Index, Raw and Relative Exposure Index scores for Morazán
Index Morazán
Score Rank
Multi-Hazard Exposure 0.000 14
Sub-Components Raw Exposure 0.000 14
Relative Exposure 0.000 14

National Disaster Preparedness Baseline Assessment: El Salvador 104 © Pacific Disaster Center 2015
RVA Recommendations The following recommendations are based on the results of the El Salvador NDPBA RVA. These
overarching recommendations are designed to acknowledge the complex drivers of risk that are prevalent
throughout the country. As presented in the previous section, the specific drivers of risk can vary widely
across departments. Consequently, to direct interventions that reduce vulnerability and increase coping
capacity at the department level, decision makers must carefully examine these drivers for each
department.
Programmatic Recommendations to Support Risk and Vulnerability Assessments
in El Salvador 1. Implement strategies to formalize data sharing between all organizations active in disaster
management to support evidence based decision making.
2. Implement plans to improve, standardize, and update documentation of recent disaster impacts
to provide a more comprehensive understanding of vulnerability by identifying areas that may
still be recovering from a disaster.
3. Strengthen strategic multi-stakeholder partnerships to expand disaster risk reduction resources
to include non-traditional disaster management partners.
Strategies to Reduce Vulnerability and Increase Coping Capacity at the
Department Level The following strategies are designed to acknowledge and prioritize prevalent drivers of risk throughout
El Salvador. These recommendations represent a summary of the subnational RVA assessment for the
country. To identify or prioritize specific DRR investments for each department, refer to the detailed 5-
page summaries provided above. By examining the specific drivers that increase risk in each department,
focused interventions can be tailored to reduce vulnerability, increase coping capacity, and acknowledge
exposure at the subnational level.
1. Foster economic development to support a healthy local GDP and to improve the quality and
equity of critical infrastructure in rural areas. Improving access to communications, transportation
and health care increases capacity to prepare for, respond to, and recover from disasters.
2. Support efforts to reduce disparities in access to quality education by implementing programs to
maintain school enrollment and increase investment in teaching resources (human and material).
3. Increase access to information by distributing disaster information across multiple platforms
(radio, television, internet) and increasing investment for supply-side interventions that ensure
that information can be received in vulnerable communities.
4. Support efforts to promote gender equality including equal access to education, labor
participation, wages and access to credit, and political rights and representation.

National Disaster Preparedness Baseline Assessment: El Salvador 105 © Pacific Disaster Center 2015
5. Develop mutual aid agreements to support the sharing of vital disaster management resources to
increase coping capacity in less-equipped Departments.
a. For example, the neighboring departments of San Salvador and Cuscatlán represent
opposite ends on the Coping Capacity spectrum. Formal mutual aid from San Salvador
(very high coping capacity) can be established to leverage critical resources and increase
capacity in Cuscatlán (very low coping capacity).
6. Institutionalize multi-hazard planning at the Department and Municipal levels.


National Disaster Preparedness Baseline Assessment: El Salvador 107 © Pacific Disaster Center 2015

National Disaster Preparedness Baseline Assessment: El Salvador 108 © Pacific Disaster Center 2015

National Disaster Preparedness Baseline Assessment: El Salvador 109 © Pacific Disaster Center 2015
Findings: Comprehensive Disaster Management The CDM results presented in this section provide a summary of the CDM analysis, followed by a
discussion of each CDM theme, to include identified gaps and recommendations. Detailed
recommendations for each CDM theme, along with a five-year implementation plan, have been designed
to strengthen CDM in El Salvador.
The CDM helps to:
1. Provide a contextual overview of El Salvador’s disaster management capabilities,
2. Identify the strengths and challenges of El Salvador’s disaster management system, and
3. Provide context to the RVA results previously discussed by highlighting the larger DRR framework
in El Salvador.
The CDM data gathering process included a review of over 100 documents, survey administration
(Appendix C and Appendix D), detailed stakeholder interviews, and site visits to critical facilities. Data were
analyzed using a mixed-methods approach, whereby both quantitative and qualitative information were
integrated into overall findings and recommendations. This approach allowed for a more complete
assessment of policy, legal environment, resources, public support, and perceptions of disaster
management within El Salvador.
Summary CDM findings indicate the legal framework governing disaster management is comprehensive and concise
but has not been fully implemented at all administrative levels. Resource and budgetary constraints have
impacted the country’s ability to meet disaster management needs. This is made evident through the
training and exercise programs which are limited in scope and do not meet the requirements for ensuring
a well-trained team of professionals. NGOs with the goal of enhancing disaster management capacity are
active in the country, and work to promote a participatory approach to strengthening the nation.
Significant gaps identified in El Salvador’s disaster management system include:
1. A standardized training program for disaster managers at the national and departmental level has not been implemented. Training programs for disaster management professionals at the community level do not exist.
2. A centralized repository for disaster management training achievements does not exist, preventing the validation of credentials to ensure adequately trained staff.
3. Lack of a formalized exercise program including planning and execution guidelines at the national and subnational level. Standardized procedures, exercise evaluation, and after-action reporting does not occur.
a. Budget constraints inhibit the formalization of an exercise program.
4. Exercises are not coordinated among the different administrative levels, limiting effectiveness.
5. El Salvador has a limited annual budget for disaster management activities.
6. National disaster reserve fund allocations focus primarily on response, and are not being used in a way that allows for comprehensive disaster management.
7. There is no direct cabinet-level position for disaster management in El Salvador.

National Disaster Preparedness Baseline Assessment: El Salvador 110 © Pacific Disaster Center 2015
8. Implementation of the legal framework for disaster management has not been fully realized at the subnational level due to a lack of clear guidelines.
9. Limited availability and integration of response plans and SOPs across all administrative levels.
10. A lack of historical information on disaster declarations inhibits planning efforts.
11. Damage and needs assessments lack accuracy and standardization, inhibiting the ability of emergency responders and disaster managers to effectively respond to the needs of the community post-event.
12. A centralized repository of NGOs and partner nations that have active disaster management or DRR projects in El Salvador does not exist, increasing potential overlap or duplication of efforts.
13. Shelter location information for nine departments does not exist or is not available.
14. No inventory of available resources for response was provided, indicating decision makers would not have access to the information.
15. Formalized mutual-aid agreements do not exist or are not available.
16. Regional EOCs lack adequate space, equipment, and supplies for sustainment during a major disaster.
a. Regional EOCs lack robust communication requirements.
b. Some regional EOCs do not have city water, support from fire department to fill 5000L water tanks periodically is required. Often the fire department is unable to support and the EOCs have no water.
17. EOCs do not have internal SOPs and staff have not received proper EOC training.
The following is an overview of CDM findings to include recommendations and a five-year plan to strengthen the disaster management capabilities of El Salvador.
Figure 65. Comprehensive Disaster Management Model (Hughey, 2003)

National Disaster Preparedness Baseline Assessment: El Salvador 111 © Pacific Disaster Center 2015
Good Leadership by Professionally Trained Officials
The basis of successful disaster management centers upon the importance of well-trained professionals. A
community or country that has established professionalization of the disaster management field through
standardized training and education programs is ensuring a foundation of understanding and leadership
among disaster management personnel at all levels.
Formalized training and exercise programs increase the professionalization of the disaster management
field by establishing well-trained disaster management personnel at all levels. Protección Civil is the
national agency responsible for disaster management training and exercise programs in El Salvador.
According to Law 777, Art. 6 (b) Protección Civil is required to develop and coordinate plans to educate
and inform the public on how to prevent potential disaster. Protección Civil’s Training and Education
Department is responsible for overseeing training for disaster management professionals. The capacity
of the department is limited with most training provided in an uncoordinated fashion by multiple agencies
and NGOs. The lack of formalized training and exercise programs inhibits the professionalization of the
disaster management field in El Salvador.
Eighty-two percent (82%) of survey respondents indicated that their organizations exhibit strong disaster
management leadership. Sixty percent (60%) felt their organization’s disaster management programs
were effective. Archival research and interviews revealed the absence of disaster management training
and exercise programs throughout the country. The lack of a well-trained cadre of disaster management
professionals can be an indicator of a young or under-developed program leading to limitations in
effectiveness. Exercises are occasionally conducted but a formalized program does not exist. Exercises
that are undertaken do not include all administrative levels of disaster management. Other major
challenges include a lack of clearly defined educational requirements for disaster management
professionals and limited funding for training. Specific findings regarding training and exercise programs
are below.
Findings: Training Programs Training programs designed to build the capacity of disaster management professionals encourage the
professionalization of the disaster management field and increase the availability of qualified disaster
managers. In El Salvador, disaster management training programs are not standardized. When available,
training is mainly provided by NGOs. Without a national disaster management training program, courses
offered by NGOs are not always consistent with national DRR objectives. Disaster management
professionals are not required to hold a certification or update their training credentials on a regular basis.
The United Nations Disaster Assessment and Coordination (UNDAC) study conducted in April of 2010
recommended that Protección Civil create a yearly training program. Based on this recommendation a
plan has been created to develop nationalized training programs, standards, and credentialing. Included
in this plan will be the verification of training offered by NGOs within the country to ensure national DRR
objectives are being met. No timeframe for the implementation of this program has been established.
Even with funding from NGOs, a centralized and standardized approach to disaster management training
is still in the early stages of development in El Salvador. It is important to note that while training programs
are not formalized, 68% of survey respondents felt their organizations have training programs designed

National Disaster Preparedness Baseline Assessment: El Salvador 112 © Pacific Disaster Center 2015
to build capacity in disaster management staff. Although survey respondents did indicate that training
gaps exist at the community level.
Findings: Training Frequency Frequent training allows personnel in the disaster management field to pursue training and increase their
capacity in the field, thereby increasing the availability of qualified staff. Currently training courses are
offered as they become available or as needed, a standardized training schedule has not been established.
National guidelines for the evaluation of training and the credentialing of trained professionals do not
currently exist. Training is conducted by different departments and in-country NGOs and is not consistent
across the country.
The lack of standardized training, verification and credentialing across all levels of disaster management
within El Salvador inhibits the professionalization of the disaster management field and limits the
availability of officials with standard qualifications. Therefore, there is no systematic way for disaster
management practitioners to progress in their professional development, reducing the availability of
qualified staff.
Findings: Exercise Frequency Regular exercises allow the entire disaster management system to evaluate their capacity for managing
disaster and to identify areas for improving capabilities. In El Salvador, Protección Civil is responsible for
the verification, exercise, and practice of disaster management plans at the national level. By law, one
exercise per year is required but there are no plans or guidelines provided to agencies active in disaster
management on exercise planning or execution. An annual exercise is conducted for one hazard type at
the national level, this exercise is not inclusive of all agencies involved in disaster management and is
typically managed by Protección Civil.
Exercises are not conducted at each administrative level simultaneously, rather, exercises are conducted
at the community, municipal, departmental, and national levels individually. Guidelines or means of
evaluation, verification, or enforcement of exercises do not currently exist. Stakeholders indicated that
exercises may be limited or ineffective due to budget constraints, lack of oversight, tracking, after-action
reviews, and follow-up.
Gaps The following gaps were identified:
1. A standardized training program for disaster managers at the national and departmental level has
not been implemented. Training programs for disaster management professionals at the
community level do not exist.
2. A centralized repository for disaster management training achievements does not exist,
preventing the validation of credentials to ensure adequately trained staff.
3. Lack of a formalized exercise program including planning and execution guidelines at the national
and subnational level. Standardized procedures, exercise evaluation, and after-action reporting
does not occur.
a. Budget constraints inhibit the formalization of an exercise program.
4. Exercises are not coordinated among the different administrative levels, limiting effectiveness.

National Disaster Preparedness Baseline Assessment: El Salvador 113 © Pacific Disaster Center 2015
Recommendations It is recommended that El Salvador:
1. Finalize and implement existing plans for a formalized disaster management training structure to
promote the continual building of capacity and skills for disaster management professionals at all
levels. This can be done through training programs and courses that are trackable, standardized,
and consistent with national disaster risk reduction goals and objectives.
2. Establish national guidelines for the credentialing of trained professionals to promote the
professionalization of the disaster management field.
3. Institutionalize an exercise program that provides planning guidelines for all administrative levels
by promoting the use of standardized procedures, exercise evaluation, and after-action reporting.
a. Explore alternative funding sources to increase budget allocations for exercise activities
at all administrative levels.
4. Develop exercise scenarios that are inclusive of disaster management professionals at all
administrative levels.

National Disaster Preparedness Baseline Assessment: El Salvador 114 © Pacific Disaster Center 2015
Foundation of Supportive Values for Government Action
More than good leadership by well-trained professionals is required for effective and efficient disaster
management. A foundation of supportive values for government action is an essential component, which
enables concepts to be developed into policies and provides government leaders the backing to spend
money in an effort to build resources. This is critical for communities and countries with a limited economic
base. Disaster preparedness is only one of many issues a government may face. Government support must
be encouraged to ensure that the proper importance is placed on disaster management mitigation and
preparedness in an effort to build disaster resilient communities with a focus on saving lives and reducing
losses.
In El Salvador, disaster management leadership consists primarily of appointed political positions (e.g.
president, vice-president, ministers, governors, and mayors). Within the disaster management structure,
established in 2005 by Law 777, subject matter experts (specialists) support political leaders to guide
disaster management decision making. El Salvador has a young disaster management structure that
continues to evolve. Established in 2005, the institutional framework conveys the importance placed on
CDM by the government. Survey respondents felt resource shortfalls (e.g., budget, equipment, and staff)
and a lack of government leadership are challenges to effective disaster response.
Findings: Annual Budget El Salvador has a limited annual budget for disaster management, with most funds allotted for fire
prevention, response, and mitigation. For 2014, the Ministerio de Gobernacion y Desarrollo Territorial
(MIGOBDT)’s institutional budget was $20,370,350, $6,481,890 of which was allocated for disaster
management activities through Protección Civil, divided as follows:
• Fire prevention, response, and mitigation: $3,338,750
• Protección Civil: $3,143,140
Protección Civil’s budget is designated for personnel salaries and wages, utilities, and basic supplies. In
2014, personnel salaries accounted for $2,427,430, with the remainder of the budget assigned to
acquisitions of goods and services ($715,710).
Table 58. Annual Budget for Protección Civil
Budget Year
Protección Civil, Prevención y Mitigación de Desastres
Salaries and Wages
Acquisition of Goods and
Services
Financial and Other
Expenses
Investments in Fixed Assets
Total
2015 $2,523,080 $206,120 0 0 $2,729,200
2014 $2,427,430 $715,710 0 0 $3,143,140
In 2015, the overall budget of MIGOBDT increased ($21,927,505), allocations for disaster management
were slightly lower than the previous year ($6,281,850), with Protección Civil receiving an operational
budget of $2,279,200. With personnel expenses about the same as the previous year, 92% of Protección
Civil’s 2015 budget was used solely for salaries and wages ($2,523,080).

National Disaster Preparedness Baseline Assessment: El Salvador 115 © Pacific Disaster Center 2015
Disaster management activities in El Salvador are largely funded through donations from development
organizations and NGOs. The limited annual budget for disaster management indicates that there are
insufficient resources available for CDM in El Salvador.
Findings: National Disaster Reserve Fund To support disaster management activities in El Salvador, Law 778 established the Fondo de Protección
Civil, Prevención y Mitigación de Desastres (FOPROMID), with an initial contribution from the general
budget in 2005 of US$4 million. Under Law 778, the Ministry of the Interior is authorized to request
additional disaster funds from the Minister of Finance as needed to cope with the effects of disasters. The
disaster reserve fund can also be supplemented by donations from any entity, national or foreign.
Annual contributions to FOPROMID occurs through El Salvador’s general state budget (Obligaciones
Generales del Estado), which receives funds transferred from various management areas of El Salvador’s
overall budget, including Administrative Management, Administration of Justice and Public Safety, Social
Development, and Economic Development Support. The general state budget for 2014 was $670 million.
Of this, FOPROMID received $4 million, or 0.6% of the general state budget. This amount was maintained
in 2015 even though the general state budget was reduced ($646.6 million).
Although FOPROMID was established to support both disaster preparedness and response activities in El
Salvador, the funds have largely been used for response, neglecting preparedness. This indicates that
resources are not being used to address all phases of disaster management, thereby hindering the
advancement of CDM within the country. The fund cannot provide sufficient support for mitigation
measures and long-term recovery following a disaster.
Findings: Appointed/Cabinet-Level Position There is no direct cabinet-level position for disaster management in El Salvador. Protección Civil is under
the authority of the MIGOBDT. Although the Director General of Protección Civil may serve as the
Secretary of Vulnerability, a cabinet-level position established in 2011 with the creation of the Secretariat
of Vulnerability Affairs, this is not an institutionalized arrangement and the same person is not required
to occupy both positions.
The creation of the Secretariat of Vulnerability Affairs is a positive step in further institutionalizing DRR
and CDM within El Salvador.
Gaps The following gaps were identified:
1. El Salvador has a limited annual budget for disaster management activities.
2. National disaster reserve fund allocations focus primarily on response, and are not being used in
a way that allows for comprehensive disaster management.
3. There is no direct cabinet-level position for disaster management in El Salvador.

National Disaster Preparedness Baseline Assessment: El Salvador 116 © Pacific Disaster Center 2015
Recommendations It is recommended that El Salvador:
1. Explore alternative funding sources to increase the availability of dedicated disaster management
funds within the national budget (public/private partnership).
2. Work with national and international partners to identify alternative ways to increase
appropriations to the Fondo de Protección Civil, Prevención y Mitigación de Desastres to the point
that it can cover all disaster expenses incurred each year based on a 20-year disaster loss average.
3. Establish an appointed cabinet-level position solely for overseeing the disaster management
structure in El Salvador.

National Disaster Preparedness Baseline Assessment: El Salvador 117 © Pacific Disaster Center 2015
Legal Authority to Act
Legal Authority to Act provides the necessary foundation for implementation of CDM. The legal framework
within which disaster operations occur can have a significant impact on preparedness, response, recovery,
and mitigation. Without the authority to act and the support of government officials, CDM activities can
be halted, leaving residents vulnerable to disasters.
El Salvador has developed a progression of key disaster management legislation designed to provide a
solid foundation for CDM in the country. The full implementation of relevant legislation has yet to be
realized. At the national level, disaster management has a strong, well-organized structure. However,
dissemination of policies and pertinent disaster risk reduction information to the subnational level is
hindered by insufficient communication and the wider political environment. Survey respondents
referenced a lack of coordination among institutions and ineffective dissemination and sharing of
information in the country as the biggest challenge for disaster response. Increased transparency and
inter-agency cooperation would serve to enhance CDM in El Salvador.
Findings: Disaster Management Legislation Legislative Decree No. 498, Ley De Defensa Civil, was passed in 1976 as the initial implementation of
disaster risk management in El Salvador. The purpose of the legislation was to create a national system of
civil defense for the protection of the El Salvadorian population from natural disasters, as well as to assist
in the recovery process in the event of a disaster. In 1988, Legislative Decree No. 44 established a
mechanism for declaring a State of Emergency. Under Decree No. 44, the Comisión Nacional de Protección
Civil (CNPC) was given the authority to request the declaration of a State of Emergency from the President.
Over the past two decades, several major disaster events significantly altered El Salvador’s disaster
management system. The devastation caused by 1998’s Hurricane Mitch was taken as an indication of an
inadequate structure for disaster management under the existing system of civil defense. The disaster
management system was largely reactive, overlooking the essential aspects of preparedness and
mitigation for effective disaster management. In 2005, impacts from Hurricane Adrian prompted further
action to improve disaster management in the country.
In August of 2005, Legislative Decree No. 777 brought into effect Ley De Protección Civil, Prevención y
Mitigación de Desastres en El Salvador. This law authorized the establishment of the
Sistema Nacional de Protección Civil, Prevención y Mitigación de Desastres as a decentralized system
composed of both public and private agencies responsible for civil protection and DRR in El Salvador.
Implemented in 2006, the passage of this law repealed Legislative Decrees No. 498 and No. 44, providing
the necessary updates to the national disaster management system. Vertical lines of decision making were
strengthened, and roles and responsibilities for effective disaster management were more clearly defined
at all levels of government.
The Protección Civil Nacional, Prevención y Mitigación Plan de Desastre is detailed in Article 20 of Decree
No. 777. Within this Article, a plan is defined for state and civil action in regards to the management of
risk, vulnerability, and mitigation, as well as for disaster preparedness and recovery. As illustrated in Figure
66, additional legislation was passed to supplement and strengthen Decree No. 777, including:

National Disaster Preparedness Baseline Assessment: El Salvador 118 © Pacific Disaster Center 2015
• Legislative Decrees No. 55 and 56, passed on the 26th of May, 2005: o Decree No. 55 provides the regulations for the development and implementation of
provisions for Ley de Protección Civil, Prevención y Mitigación de Desastres en El Salvador. o Decree No. 56 establishes the organizational structure and functions of Protección Civil,
allowing the organization to carry out its duties as the lead disaster management organization for the country.
• Legislative Decree No. 778, passed on the 31st of August, 2005: o Decree No. 778 mandates the creation of El Fondo de Protección Civil Prevención y
Mitigación de Desastres.
• Legislative Decree No. 11, passed on the 22nd of February, 2006. o Decree No. 11 ensures the implementation of El Fondo de Protección Civil Prevención y
Mitigación de Desastres.
Figure 66. The progression of disaster management legislation from 2005 onwards.
Integration of DRR into all phases of disaster management and development planning at the community
level ensures the implementation of disaster management legislation.
Findings: Designated Authorities With the passage of Legislative Decree No. 777, the authority for disaster management decision making
was transferred to the Sistema Nacional de Protección Civil, presided over by the Minister of the Interior
and composed of the following authoritative bodies:
• Comisión Nacional de Protección Civil (CNPC);
• Comisiónes Departamentales de Protección Civil (CDPC);
• Comisiónes Municipales de Protección Civil (CMPC); and
• Comisiónes Comunidades de Protección Civil (CCPC).

National Disaster Preparedness Baseline Assessment: El Salvador 119 © Pacific Disaster Center 2015
Protección Civil, the operational organization for the CNPC, is housed within the Ministerio de
Gobernación y Desarrollo Territorial (MIGOBDT). Protección Civil’s internal is detailed below in Figure 67.
Figure 67. Organizational structure of Protección Civil.
Protección Civil is responsible for the development and maintenance of the national response plan and
guidelines based on laws established by the El Salvadorian government. Protección Civil is legally
authorized to enforce the national response plan and train the relevant agencies, units, and individuals
responsible for disaster response in the country. Protección Civil is also charged with control of the
national emergency resource inventory and budget.
Protección Civil consists of four hierarchical levels, with Dirección General de Protección Civil (DGPC)
serving as the head of the Protección Civil system (see Figure 68). At the national level, the CNPC consists
of the various agency Ministers and Directors involved in disaster management and risk reduction in the
country. The CDPC represents the second organizational tier of Protección Civil and is composed of the
country’s departmental leaders, referred to as Governors. The third tier falls under the CMPC and consists
of the country’s municipal leaders, or Mayors. The CCPC makes up the final tier with influential leaders
from neighborhoods, villages, and other relevant local level institutions.

National Disaster Preparedness Baseline Assessment: El Salvador 120 © Pacific Disaster Center 2015
Figure 68. The response levels of the Protección Civil System.
When a disaster occurs at the local level, an emergency is declared and the Manejo De Centros De
Operaciones De Emergencias (MACOE) becomes activated. The Protección Civil and the COEs respond
from the local level up to the national level. When an administrative level can no longer support disaster
response on its own, the next level up is activated for response support. Once an event reaches the
national level, the DGPC assumes control and has the support of the Area Politico-Estrategica component
which is composed of various Ministers. If a disaster overwhelms the national level, the President of El
Salvador can declare a national disaster. The DGPC is in control of the COE-N from local-level response
efforts to national-level response efforts. If a national disaster is declared, the President of El Salvador
becomes the Director General (DG) of the COE-N.
Once Protección Civil is activated for disaster response, a traditional command and control structure is
followed. Critical decisions are made from the top down, starting with the CNPC and passing to the next
tier as applicable. With the exception of the community level, each administrative level has a
corresponding Emergency Operations Center (EOC/COE):
• The National EOC (COE-N);
• The Departmental EOCs (COE-D);
• The Municipal EOCs (COE-M); and
• The Protección Civil Incident Command Post (PC).
COE structure follows the same guidelines at all levels with relatively minor differences. The DG serves as
the floor lead of the EOC and makes decisions supported by a team of experts. The CMPC/CDPC and the
Area Politico-Estrategica exist above the DG to validate decisions made by the DG. The legal authority to
act in the event of a disaster has been established to operate in this manner. Stakeholder interviews
indicated that as the operationalization of the law has yet to be fully realized, political leadership is often
allowed the opportunity to influence the decision-making process and supersede decisions made by the
DG.

National Disaster Preparedness Baseline Assessment: El Salvador 121 © Pacific Disaster Center 2015
Adjacent to the DG are the Consejo Asessor position and a floating position which serves as a place-holder
for a subject-matter expert depending on the type of disaster. This position is given to one of the seven
Support Functions that fall under the Operations Section and, when one is chosen to sit at the floating
position, it maintains direct access to the DG for decision-making purposes. Each Support Function is
headed by a specific ministry and supported by multiple agencies related to the Support Function. For
example, the Security Support Function is headed by the National Civil Police and supported by the Armed
Forces and the National Academy of Public Security.
The floating Support Function utilizes a Crisis Room – an extension of the EOC which is located at a
designated location in accordance with the floating position, typically at the headquarters of the Ministry
which heads the Support Function.
Alongside the role and responsibilities of Protección Civil, an additional authority has been designated to
complement disaster management activities in the country. The legal authority for risk and vulnerability
is the Ministerio de Medio Ambiente y Recursos Naturales (MARN). Established by the 1998 Ley De Medio
Ambiente (LMA 1998), MARN is the agency responsible for environmental management in El Salvador. As
part of its mission, MARN is responsible for national prevention, emergency planning, and environmental
risk. The Ministry also monitors natural phenomena, provides technical information for critical decision-
making, maintains the National Hazards Monitoring Center, and provides early warning for hazards.
While legislation outlines the legal authority to act in the event of a disaster, including designated
authorities and their legal responsibilities, the clarity of legislation can significantly impact the overall
effectiveness of the disaster management system. Fifty-eight percent (58%) of survey respondents felt
that disaster response tasks are clearly defined and 52% felt that there is overlap and conflict between
organizations active in disaster response in the country.
Findings: Disaster Management Documentation Availability Disaster management documentation helps guide inter-agency cooperation and coordination throughout
all phases of the disaster management process. The availability of and access to disaster management
documentation is a key indicator for how effectively preparedness and response operations will function
in the event of a disaster. According to survey results, 75% of survey participants reported the presence
of comprehensive disaster management plans for their organizations. Seventy percent (70%) reported the
presence of disaster preparedness plans, 45% the presence of disaster mitigation plans, and 45% the
presence of recovery plans. Fifty-seven percent (57%) of survey participants have access to copies of their
organization’s disaster management plans, and 52% reported that their disaster plans have been shared
with other agencies or organizations active in disaster management. These results indicate the potential
for both the duplication of efforts as well as the misuse of disaster management resources due to the
inadequate availability of and access to disaster management documentation in the country.
Seventy-seven percent (77%) of survey participants reported the presence of disaster response plans for
their organizations. Response plans were available online at the Protección Civil website for each of the
nine hazards identified by Protección Civil as major risks for the country. Department-level response plans
were available online at the Protección Civil website for the year 2013 only. Although El Salvador’s
municipalities are legally mandated to submit draft response plans to Protección Civil for review, two
municipalities declined to submit their plans due to political differences with Protección Civil. Recent
departmental and municipal disaster management plans were not available for review.

National Disaster Preparedness Baseline Assessment: El Salvador 122 © Pacific Disaster Center 2015
An unofficial, one-page description of EOC Duties was developed for the San Vincente EOC, which also
provided a copy of its 2015 Departmental Winter Plans for review. Formal SOPs for EOC operation were
not available for review.
Findings: Documentation/SOP Update Frequency Sixty-four percent (64%) of survey respondents indicated that their organizations disaster plans are
updated regularly and 61% of disaster plans were tested or drilled regularly. Survey respondents indicated
that improvements can be made in the regular updating of disaster management plans and SOPs.
Stakeholder interviews supported a review of disaster plans on a two-year basis.
Gaps The following gaps were identified:
1. Implementation of the legal framework for disaster management has not been fully realized at
the subnational level due to a lack of clear guidelines.
2. Limited availability and integration of response plans and SOPs across all administrative levels.
Recommendations It is recommended that El Salvador:
1. Develop guidelines to facilitate subnational implementation of Legislative Decree No. 777 to meet
the changing disaster risk reduction requirements of El Salvador.
2. Increase availability of plans and SOPs among partner agencies across administrative levels.

National Disaster Preparedness Baseline Assessment: El Salvador 123 © Pacific Disaster Center 2015
Advocacy Supporting Action
Advocacy supporting action is necessary to ensure that disaster management policies are implemented
throughout a country. The backing of political leaders is not always enough to ensure that hazard policies
are implemented. Successful disaster management requires strong stakeholder support across all levels.
Following a disaster, stakeholder support for action is generally high and may play a key role in hazard
policy implementation. Stakeholders include traditional and non-traditional partners involving the general
public, non-governmental organizations, academic institutions, the private sector, and those providing
assistance before, during and after a disaster.
Over the last five years, significant disaster events have impacted El Salvador, including tropical storms,
flooding, and volcanic eruptions. Response efforts to these major events were perceived as ineffective
with survey respondents indicated that response support functions were inadequate. Multiple agencies
with a disaster management focus conduct projects within El Salvador, although a complete catalog of all
active agencies was unavailable.
Generally, political approval ratings and the total number of disaster declarations would be included in
this section, however, they were unavailable. Political approval ratings can indicate public support for
government initiatives including DRR. Disaster declarations can provide historical information on disaster
event impacts to assist with planning and preparation activities.
Findings: Recent Disaster Events Communities recently impacted by major disaster events are generally
more supportive of DRR initiatives. Recent disaster impacts in El Salvador
indicates high public and political support for disaster management related
legislation.
In El Salvador, over 1.1 million people have been affected by disasters since
20101. In October 2011, Tropical Depression 12-E impacted El Salvador,
causing widespread damage, see Figure 69. Moreover, in 2011, river
flooding impacted 300,000 people and caused $1,000,000 in damage. More
recently, on December 29, 2013, San Miguel (Chaparrastique) Volcano
erupted, affecting 60,000 people and displacing 2,300.
1 EM-DAT: The International Disaster Database, Centre for Research on the Epidemiology of Disasters (CRED). http://www.emdat.be/database.
Figure 69. 12-E Impacts (Protección Civil)

National Disaster Preparedness Baseline Assessment: El Salvador 124 © Pacific Disaster Center 2015
Figure 70. Pyroclastic Flow Scenarios - San Miguel, El Salvador
Stakeholder perception on the effectiveness of response to recent disaster events was captured through
survey results. Seventy-one percent (71%) of respondents felt the response to the last major disaster (San
Miguel Volcano Eruption – 2013) was effective and 77% felt their organization responded to the last major
disaster as outlined in policy/governing documents. Thirty percent (30%) of survey respondents felt their
disaster response tasks were not clearly defined. The perceptions of survey respondents to disaster
response support functions are shown in Figure 71:
Figure 71. Effectiveness of Response Support Functions
Eighty-seven percent (87%) of survey respondents identified post-disaster damage and needs
assessments (DANA) to be helpful in response decision-making. Eighty percent (80%) of survey
respondents reported that post-disaster damage and needs assessments were conducted following the
last major disaster, however, only 48% indicated that these assessments were done accurately.
EvacuationExecution
Sheltering Mobilization ofResources and
Personnel
EmergencyMedical Response
Efforts
Search andRescue Agencies
Effectiveness of Response Support Functions
55% 58%58%
45%
65%

National Disaster Preparedness Baseline Assessment: El Salvador 125 © Pacific Disaster Center 2015
Findings: Recent Disaster Legislation Recent disaster management legislation can provide an indication on whether lawmakers are actively
supporting disaster management and DRR. In El Salvador, no disaster management-specific legislation has
been enacted since 2006. In 2010, El Salvador signed the Central American Policy for Comprehensive
Disaster Risk Management which provides a guiding framework to support DRR objectives.
Findings: Agencies with a Disaster Focus Active in the Country Effective disaster response requires multiple agencies and organizations. All partners active in disaster
management, including non-traditional partners, need to be considered to fully assess the level of
stakeholder support. In El Salvador, there is a high level of international advocacy and investment
supporting DRR initiatives. Survey responses illustrate a clear awareness of the role each
agency/organization plays in the disaster management process, indicating a functioning disaster
management system. Sixty-five percent (65%) of survey respondents indicated their organization engages
with the private sector to support disaster response, while 48% reported their organization engages with
the military.
Over 2,000 NGOs are registered in El Salvador and there have been 35 key donor engagements from the
period 1970 to 2010. From 2012 to 2015, USSOUTHCOM sponsored 78 projects in El Salvador. Inter-
American Development Bank sponsored five projects related to environment and natural disasters and
USAID/OFDA sponsored two disaster preparedness projects. The Disaster Preparedness European
Community Humanitarian Office (DIPECHO) program that is funded by the European Commission
Humanitarian Office (ECHO) has been active in El Salvador since 1996 and continues to finance projects
to build disaster management capacity. El Salvador is also a member of the Central American Coordination
Center for the Prevention of Natural Disasters (CEPREDENAC) and the United Nations International
Strategy for Disaster Reduction (UN ISDR).
Traditionally, El Salvador is open to receiving funding and projects from international donors with the goal
of enhancing disaster management capacities. No formal comprehensive list of all agencies active within
the country exists, which presents a challenge for disaster management practitioners in understanding all
available resources and ensuring that all projects align with national DRR objectives. Survey respondents
also noted overlap or duplication of efforts between agencies and activities with 52% reporting this as a
concern.
Gaps The following gaps were identified:
1. A lack of historical information on disaster declarations inhibits planning efforts.
2. Damage and needs assessments lack accuracy and standardization, inhibiting the ability of
emergency responders and disaster managers to effectively respond to the needs of the
community post-event.
3. A centralized repository of NGOs and partner nations that have active disaster management or
DRR projects in El Salvador does not exist, increasing potential overlap or duplication of efforts.
National Disaster Preparedness Baseline Assessment: El Salvador 126 © Pacific Disaster Center 2015
Recommendations It is recommended that El Salvador:
1. Develop a method to store data and information on disaster impacts to assist with planning and
policy.
2. Review post-disaster damage and needs assessments to identify areas of improvement to ensure
accuracy and increase response effectiveness.
3. Develop a centralized repository of in-country programs and to ensure alignment with national
DRR goals and objectives and reduce duplication of efforts.
National Disaster Preparedness Baseline Assessment: El Salvador 127 © Pacific Disaster Center 2015
Necessary Institutional Resources
It is critical that every jurisdiction has an accurate assessment of available resources (human and material),
and is familiar with their availability during disaster. Although many areas have a limited economic base
and few immediate resources, through mutual-aid agreements with neighboring jurisdictions, resources
can be easily mobilized to respond. Being able to quickly assess the community needs and having the
knowledge of resource availability, aid can be requested in a timely manner to ensure immediate
emergency needs are met.
Despite the limited availability of necessary resources, El Salvador maintains a strong national capacity for
disaster management activities. Through its legislation and designated resources for disaster
management, Protección Civil has a basis from which to respond to disasters. Disaster management
practitioners were found to be effective at leveraging partnerships with donor agencies for basic
equipment needs as Protección Civil’s budget only includes salary and basic utilities, it relies largely on
donations to be able to accomplish its mission. Mutual-aid agreements were unavailable for assessment,
indicating that resources may not be effectively shared or mobilized during a disaster.
Survey respondents reported that the necessary institutional resources including adequate staffing for
disaster response, plans for logistics management, and mutual aid agreements are available. However,
69% of respondents reported that their organization’s EOC does not have the necessary resources
required to communicate disaster impacts to key decision makers.
Findings: Resources Designated for Disaster Management Resources designated for disaster management provides an indication that a country has invested in and
supports disaster management activities. This can include legislations, Emergency Operations Centers
(EOCs), and shelters.
As previously noted, El Salvador has a robust legal framework for national disaster management, but lacks
the dissemination of policies to the subnational level. This signals that government support at the national
level is high, while the local level lacks authority and capacity to direct disaster management resources
and activities.
El Salvador has a designated National EOC (COE-N) in San Salvador Department plus 13 Departmental
EOCs located at each department’s Protección Civil office. Three of the 13 Departmental EOCs also serve
as regional offices (not regional EOCs) in Paracentral, East, and West regions. An EOC identical to the COE-
N (Central Region) was built in each of these regions to support regional administrative functions. At the
municipal level, town halls frequently serve dual-purpose as the municipal EOC during disasters. The fact
that El Salvador has designated National and Department EOCs shows the country’s commitment to
disaster management, but still leaves gaps at the local level.
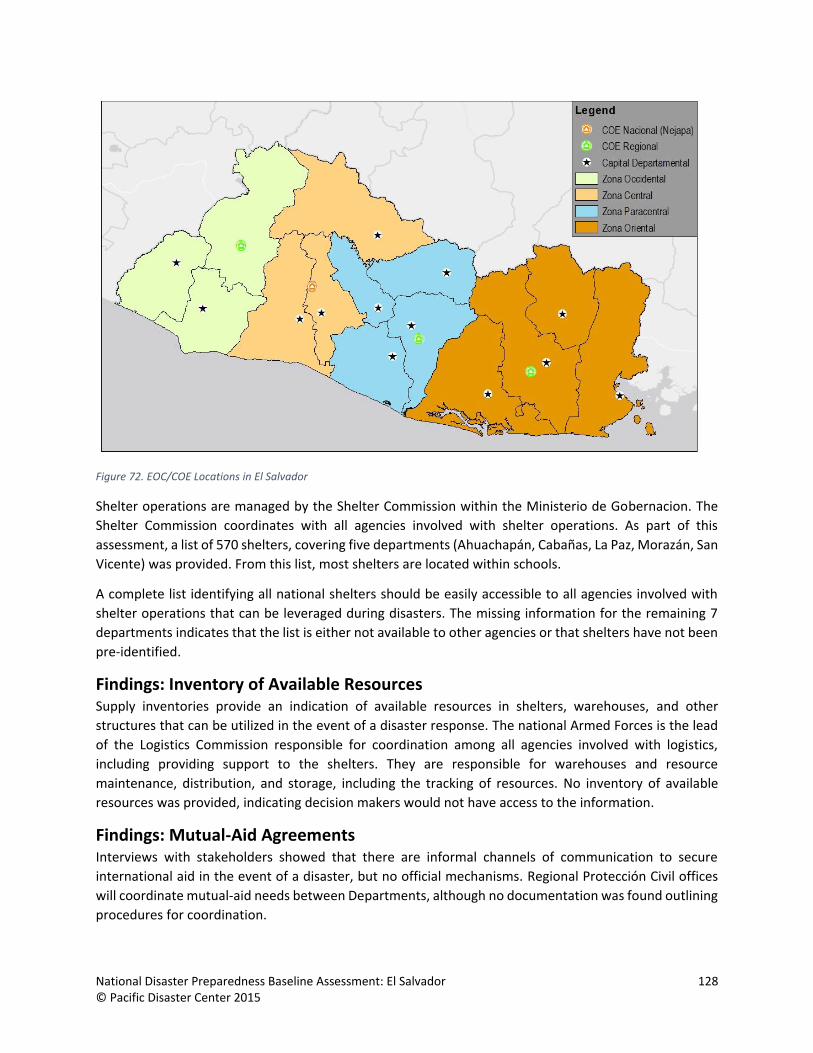
National Disaster Preparedness Baseline Assessment: El Salvador 128 © Pacific Disaster Center 2015
Figure 72. EOC/COE Locations in El Salvador
Shelter operations are managed by the Shelter Commission within the Ministerio de Gobernacion. The
Shelter Commission coordinates with all agencies involved with shelter operations. As part of this
assessment, a list of 570 shelters, covering five departments (Ahuachapán, Cabañas, La Paz, Morazán, San
Vicente) was provided. From this list, most shelters are located within schools.
A complete list identifying all national shelters should be easily accessible to all agencies involved with
shelter operations that can be leveraged during disasters. The missing information for the remaining 7
departments indicates that the list is either not available to other agencies or that shelters have not been
pre-identified.
Findings: Inventory of Available Resources Supply inventories provide an indication of available resources in shelters, warehouses, and other
structures that can be utilized in the event of a disaster response. The national Armed Forces is the lead
of the Logistics Commission responsible for coordination among all agencies involved with logistics,
including providing support to the shelters. They are responsible for warehouses and resource
maintenance, distribution, and storage, including the tracking of resources. No inventory of available
resources was provided, indicating decision makers would not have access to the information.
Findings: Mutual-Aid Agreements Interviews with stakeholders showed that there are informal channels of communication to secure
international aid in the event of a disaster, but no official mechanisms. Regional Protección Civil offices
will coordinate mutual-aid needs between Departments, although no documentation was found outlining
procedures for coordination.

National Disaster Preparedness Baseline Assessment: El Salvador 129 © Pacific Disaster Center 2015
Findings: EOC Equipment and Facilities List During EOC site visits conducted in June 2015, the layout of each of the four EOCs in each region was
noted, and an inventory of communication and logistic equipment recorded. The national EOC is the only
EOC location that conducts 24-hour operations year-round. The other three regional EOCs have facilities
that allow for 24-hour shifts during response events, but are only manned during regular business hours
while on steady state.
Details on each EOC layout, training, logistics, communications, shortfalls are in Appendix E: EOC
Information.
Gaps The following gaps were identified:
1. Shelter location information for nine departments does not exist or is not available.
2. No inventory of available resources for response was provided, indicating decision makers would
not have access to the information.
3. Formalized mutual-aid agreements do not exist or are not available.
4. Regional EOCs lack adequate space, equipment, and supplies for sustainment during a major
disaster.
a. Regional EOCs lack robust communication requirements.
b. Some regional EOCs do not have city water, support from fire department to fill 5000L
water tanks periodically is required. Often the fire department is unable to support and
the EOCs have no water.
5. EOCs do not have internal SOPs and staff have not received proper EOC training.
Recommendations It is recommended that El Salvador:
1. Identify designated shelters nationwide and create a national shelter list to assist with planning
and response.
2. Develop and maintain an inventory of available resources nationwide to support disaster
management and inform disaster managers.
3. Develop and formalize the use of mutual-aid agreements to address budgetary and resource
shortfalls to supplement preparedness measures throughout the country.
4. Plan and construct regional EOCs that can sustain 24-hour EOC operations during a response
event. EOCs should include food, water, generator, rest area, and enough work space to support
operations.
a. Construct and maintain an emergency communications system for each regional
Emergency Operations Center (EOC) to strengthen internal communications between
regional EOCs, the national EOC, and the public. This includes the incorporation of disaster
alerts and early warning.
b. Connect EOCs to city water or develop a partnership or mutual-aid agreement with a NGO
or public/private entity to supply the EOC with water, especially a during major disaster.
5. Develop SOPs and training programs focused on internal EOC activities and procedures.

National Disaster Preparedness Baseline Assessment: El Salvador 130 © Pacific Disaster Center 2015
Recommended Projects to Enhance CDM The following recommended projects have been developed based on the findings, gaps, and
recommendations identified above. The recommended projects are grouped according to the five CDM
components. Refer to Table 59 and Table 60 for additional information on the evaluation.
Table 59. Definitions
Definitions
Level of Effort
Estimated length of time it will take to complete the project once it is started
Difficulty Overall complexity based on the estimated amount of staff time, resources, and collaboration required to complete the project
Cost Estimated annual cost of the project, not including salaries, based on a percentage of the current NDMO annual budget
Impact The amount the project will increase the comprehensive disaster management capability of the nation
Table 60. Ratings
Ratings
Level of Effort
12 months or less
13 – 60 months
>61 months
Difficulty
Simple Few resources, time or collaboration required to implement
Medium Some resources, time or collaboration required
Complex A great deal of resources, time, or collaboration required
Cost
$ <1% of NDMO operational budget on an annual basis
$$ 1% to 10% of NDMO operational budget on an annual basis
$$$ >10% of NDMO operational budget on an annual basis
Impact
Minor Some impact on increasing the CDM capability of the nation
Moderate Moderate impact on increasing the CDM capability of the nation
Significant Significant impact on increasing the CDM capability of the nation

National Disaster Preparedness Baseline Assessment: El Salvador 131 © Pacific Disaster Center 2015
Table 61. Recommended Projects for CDM Theme: Good Leadership by Professionally Trained Officials
CDM Theme: Good Leadership by Professionally Trained Officials Recommendations: To further strengthen the professionalization of disaster management in El Salvador.
Level of Effort
Difficulty Cost Impact
Finalize and implement existing plans for a formalized disaster management training structure to promote the continual building of capacity and skills for disaster management professionals at all levels. This can be done through training programs and courses that are trackable, standardized, and consistent with national disaster risk reduction goals and objectives. Elements of the training structure should include:
• A training schedule for programs and courses at all levels;
• Implementation of annual training; and
• Establishment of minimum disaster management training requirements for all government employees who maintain disaster management roles.
24 Medium $$ Significant
Establish national guidelines for the credentialing of trained professionals to promote the professionalization of the disaster management field.
12 Medium $ Moderate
Institutionalize an exercise program that provides planning guidelines by promoting the use of standardized procedures, exercise evaluation, after-action reporting, and verification.
48 Complex $$ Significant
Explore alternative funding sources to increase budget allocations for exercise activities at all administrative levels.
12 Medium $$ Significant
Develop exercise scenarios that are inclusive of disaster management professionals at all administrative levels.
24 Medium $ Moderate

National Disaster Preparedness Baseline Assessment: El Salvador 132 © Pacific Disaster Center 2015
Table 62. Recommended Projects for CDM Theme: Foundation of Supportive Values for Government Action
CDM Theme: Foundation of Supportive Values for Government Action Recommendations: To enhance government support for disaster management efforts at all administrative levels.
Level of Effort
Difficulty Cost Impact
Explore alternative funding sources to increase the availability of dedicated disaster management funds within the national budget (public/private partnership).
36 Complex $$ Significant
Work with national and international partners to identify alternative ways to increase appropriations to the Fondo de Protección Civil, Prevención y Mitigación de Desastres to the point that it can cover all disaster expenses incurred each year based on a 20-year disaster loss average.
24 Complex $ Moderate
Establish an appointed cabinet-level position solely for overseeing the disaster management structure in El Salvador.
24 Medium $$ Moderate
Table 63. Recommended Projects for CDM Theme: Legal Authority to Act
CDM Theme: Legal Authority to Act Recommendations: To ensure the development and implementation of relevant disaster management legislation throughout El Salvador.
Level of Effort
Difficulty Cost Impact
Develop guidelines to facilitate subnational implementation of Legislative Decree No. 777 to meet the changing disaster risk reduction requirements of El Salvador.
36 Complex $$ Significant
Increase availability of plans and SOPs among partner agencies across administrative levels.
12 Medium $ Moderate

National Disaster Preparedness Baseline Assessment: El Salvador 133 © Pacific Disaster Center 2015
Table 64. Recommended Projects for CDM Theme: Advocacy Supporting Action
CDM Theme: Advocacy Supporting Action Recommendations: To further strengthen non-governmental stakeholder engagement and support for disaster management activities in El Salvador.
Level of Effort
Difficulty Cost Impact
Develop a method to store historical disaster information to assist with planning and policy. 12 Simple $ Significant
Review post-disaster damage and needs assessments to identify areas of improvement to ensure accuracy and increase response effectiveness.
18 Simple $$ Moderate
Develop a centralized repository of in-country programs and investments to ensure alignment with national DRR goals and objectives and reduce duplication of effort.
24 Medium $ Moderate
Table 65. Recommended Projects for CDM Theme: Necessary Institutional Resources
CDM Theme: Necessary Institutional Resources Recommendations: To increase the availability of and access to the necessary resources for effective disaster management in El Salvador.
Level of Effort
Difficulty Cost Impact
Identify designated shelters nationwide and create a national shelter list to assist with planning and response.
12 Simple $ Minor
Develop and maintain an inventory of available resources nationwide to support disaster response and inform disaster managers.
24 Complex $$ Moderate
Develop and formalize the use of mutual-aid agreements to address budgetary and resource shortfalls to supplement preparedness measures throughout the country.
12 Simple $ Moderate

National Disaster Preparedness Baseline Assessment: El Salvador 134 © Pacific Disaster Center 2015
Plan and construct regional EOCs that can sustain 24-hour EOC operations during a response event. EOCs should include food, water, generator, rest area, and enough work space to support operations.
• Construct and maintain an emergency communications system for each regional Emergency Operations Center (EOC) to strengthen internal communications, as well as communications between regional EOCs, the national EOC, and the public. This includes the incorporation of disaster alerts and early warnings.
• Connect EOCs to city water or develop a partnership or mutual-aid agreement with a NGO or public/private entity to supply the EOC with water, especially a during major disaster.
60+ Complex $$$ Significant
Develop SOPs and training programs focused on internal EOC activities and procedures. 12 Simple $ Moderate

National Disaster Preparedness Baseline Assessment: El Salvador 135 © Pacific Disaster Center 2015
CDM Recommendations for El Salvador by Cost

National Disaster Preparedness Baseline Assessment: El Salvador 136 © Pacific Disaster Center 2015
Conclusion The El Salvador NDPBA results provide a comprehensive understanding of the strengths and challenges
facing the country. The RVA and CDM components of the NDPBA are complementary, providing valuable
context on how to reduce vulnerability and increase coping capacity. These results provide actionable
recommendations to increase disaster management capabilities and guide investments.
The results of the RVA highlighted areas of the country that may require support in preparing for,
responding to, and recovering from disasters. By identifying specific factors that influence risk in each
department, the RVA supports evidence-based decision making through focused interventions that
increase coping capacity, reduce vulnerability, and acknowledge hazard exposure at the sub-national
level.
The results of the CDM illustrated a structured disaster management system with a comprehensive and
concise legal framework, however resource and budget limitations prevent the implementation at all
administrative levels. By addressing gaps, El Salvador can significantly increase its CDM capacity.
The recommendations provided in this assessment are designed to be implemented over the next five
years, after which time a follow-up assessment is recommended to evaluate progress from the baseline.
As a measurable and repeatable approach, the NDPBA provides a methodology to support national and
regional efforts to save lives and reduce losses by continuing to build a more disaster-resilient nation.
Key drivers of risk in El Salvador include:
• Economic Constraints
• Access to Information
• Gender Inequality
• Hazard Exposure to Multiple Hazards
Key disaster management capacity gaps:
• Absence of a standardized training and exercise program
• Lack of standardized subnational disaster management plans
• Resource and budgetary constraints

National Disaster Preparedness Baseline Assessment: El Salvador 137 © Pacific Disaster Center 2015
RVA and CDM Integration
Risk and Vulnerability Recommendations

National Disaster Preparedness Baseline Assessment: El Salvador 138 © Pacific Disaster Center 2015
Comphrensive Disaster Management Recommendations

National Disaster Preparedness Baseline Assessment: El Salvador 139 © Pacific Disaster Center 2015

National Disaster Preparedness Baseline Assessment: El Salvador 140 © Pacific Disaster Center 2015

National Disaster Preparedness Baseline Assessment: El Salvador 141 © Pacific Disaster Center 2015
Appendix A: RVA Component Index Hierarchies & Thematic Rationale
Multi-Hazard Exposure
Figure 73. RVA - Multi-Hazard Exposure Index Construction
Table 66. RVA - MHE Scores and Ranks for all Indices and Subcomponents
Department MHE Index Raw MHE Relative MHE
Score Rank Score Rank Score Rank
Ahuachapán 0.424 8 0.326 8 0.522 8
Cabañas 0.177 13 0.015 13 0.339 12
Chalatenango 0.188 12 0.074 11 0.301 13
Cuscatlán 0.379 10 0.187 10 0.570 6
La Libertad 0.846 1 1.000 2 0.692 3
La Paz 0.489 6 0.339 7 0.639 4
La Unión 0.399 9 0.204 9 0.594 5
Morazán 0.000 14 0.000 14 0.000 14
San Miguel 0.649 4 0.591 3 0.708 2
San Salvador 0.761 2 1.000 1 0.522 9
San Vicente 0.266 11 0.053 12 0.478 10
Santa Ana 0.469 7 0.590 4 0.349 11
Sonsonate 0.556 5 0.545 5 0.567 7
Usulután 0.757 3 0.514 6 1.000 1

National Disaster Preparedness Baseline Assessment: El Salvador 142 © Pacific Disaster Center 2015
Table 67. RVA - Multi-Hazard Exposure Metadata
Multi-Hazard Exposure
Subcomponent Indicator Source(s) Year Description Notes
Raw Exposure
Raw
Population
Exposure
MARN (Flood
Susceptibility, Historical
Earthquake Intensity,
Landslide Susceptibility,
Volcanic Ash, Tsunami
Inundation); USGS HAZPAC
(Tropical Cyclone Intensity
Zones); MINEC (Segment
Population)
2007
(population)
Raw count of person units exposed to
multiple hazards, including flood
inundation, landslide, volcanic ash,
earthquakes, tsunami inundation, and
tropical cyclone wind
Hazard Zone Definitions:
Flood: Moderate, High, and Very High Susceptibility
Volcanic Ash: Scenario 1 (high probability, lower
intensity, based on historical obs.)
Hurricane Wind: Cat1+
Landslide: High and Very High Susceptibility
Tsunami: Inundation area based on "worst case
scenario modeling"
Earthquake: Combined areas of MMI VII+ from
historical earthquake events (including May '65, June
'82, Oct '86, Jan '01, Feb '01 and earlier events)
Relative
Exposure
Relative
Population
Exposure
MARN (Flood
Susceptibility, Historical
Earthquake Intensity,
Landslide Susceptibility,
Volcanic Ash, Tsunami
Inundation); USGS HAZPAC
(Tropical Cyclone Intensity
Zones); MINEC (Segment
Population)
2007
(population)
Total count of person units exposed to
multiple hazards by department
population

National Disaster Preparedness Baseline Assessment: El Salvador 143 © Pacific Disaster Center 2015
Vulnerability
Figure 74. RVA - Vulnerability Indictors

National Disaster Preparedness Baseline Assessment: El Salvador 144 © Pacific Disaster Center 2015
Table 68. RVA - Vulnerability Subcomponent Theme Rationale
Subcomponent Theme Rationale for Inclusion
Economic Constraints Represent limitations on resources available to take hazard mitigation and preparedness measures
Access to Information
Represents the ability to access and comprehend hazard- and disaster-related information before, during and after an event. If
mediums of information exchange are limited, or if people lack familiarity with somewhat technical information, critical
information on impending hazard events, preparedness measures, available resources, and mitigation options may not be
received.
Access to Clean Water
Represents the general state of water-related infrastructure. Poor distribution and containment systems contribute to reduced
water quality and increase the potential for spread of disease.
Vulnerable Health Status
Reflects the population’s general health as an outcome of multiple factors (e.g., health care processes and practices, biophysical
and socio-economic environment). Poor health contributes to increased susceptibility to injury, disease, and stress associated
with disasters and may necessitate special accommodations for activities such as evacuation.
Population Pressures
Rapid changes in the size and distribution of a population are more difficult to plan for and can destabilize social, economic, and
environmental systems and alter patterns of exposure.
Environmental Stress
Environmental stressors such as substantial water withdrawals and land degradation can damage habitat and reduce quantity
and quality of resources required to maintain human health and livelihoods. Additionally, these stressors increase the likelihood
and magnitude of hazards such as flooding, landslides, and subsidence and can exacerbate impacts.
Gender Inequality
Represents gender-based differences in access to resources, services, opportunities and formal economic and political
structures. Marginalized populations are less likely to have their needs met under “normal” conditions, and therefore become
more susceptible to harm during times of disaster. They may be overlooked in mitigation and preparedness planning and
subsequent response and recovery activities.

National Disaster Preparedness Baseline Assessment: El Salvador 145 © Pacific Disaster Center 2015
Table 69. RVA - Vulnerability Scores and Ranks for all Indices and Subcomponents
Department
Vulnerability
Index
Economic
Constraints
Info Access
Vuln.
Clean Water
Vuln.
Vuln. Health
Status
Gender
Inequality
Population
Pressures Environ. Stress
Score Rank Score Rank Score Rank Score Rank Score Rank Score Rank Score Rank Score Rank
Ahuachapán 0.592 3 0.57 5 0.725 3 0.511 6 0.506 7 0.593 5 0.69 4 0.545 4
Cabañas 0.616 1 0.815 1 0.627 5 0.636 3 0.278 13 0.742 3 0.462 9 0.754 1
Chalatenango 0.458 9 0.566 6 0.471 11 0.212 12 0.609 3 0.806 1 0 14 0.544 5
Cuscatlán 0.455 11 0.385 13 0.543 9 0.257 11 0.233 14 0.199 14 0.907 2 0.661 2
La Libertad 0.450 12 0.474 10 0.371 13 0.184 13 0.318 12 0.45 8 1 1 0.357 12
La Paz 0.556 5 0.46 11 0.658 4 0.638 2 0.457 10 0.32 11 0.855 3 0.5 7
La Unión 0.582 4 0.634 3 0.820 1 0.98 1 0.494 8 0.748 2 0.205 11 0.196 14
Morazán 0.594 2 0.558 8 0.751 2 0.579 4 0.571 5 0.654 4 0.654 5 0.474 8
San Miguel 0.527 6 0.643 2 0.555 8 0.529 5 0.479 9 0.559 6 0.484 8 0.438 11
San Salvador 0.237 14 0.295 14 0.076 14 0 14 0.395 11 0.305 13 0.129 13 0.458 10
San Vicente 0.486 8 0.507 9 0.457 12 0.366 10 0.605 4 0.411 10 0.531 6 0.523 6
Santa Ana 0.435 13 0.566 7 0.483 10 0.473 8 0.61 2 0.315 12 0.132 12 0.465 9
Sonsonate 0.526 7 0.453 12 0.556 7 0.471 9 0.643 1 0.474 7 0.502 7 0.582 3
Usulután 0.458 10 0.602 4 0.559 6 0.484 7 0.536 6 0.415 9 0.312 10 0.298 13

National Disaster Preparedness Baseline Assessment: El Salvador 146 © Pacific Disaster Center 2015
Table 70. RVA - Vulnerability Indicator Metadata
Vulnerability
Subcomponent Indicator Source(s) Year Description Notes
Economic
Constraints
Economic
Dependency
Ratio
DIGESTYC -
EHPM 2013
Ratio of dependents - people younger than 15 and older
than 64 - to the working-age population - those ages 15-64
Expense to
Income Ratio
DIGESTYC -
EHPM 2013
Ratio of monthly household expenses to monthly household
income - including monthly household remittances
Household
Poverty
DIGESTYC -
EHPM 2013
Percentage of households in poverty, including both
extreme and relative poverty cases
Access to
Information
Vulnerability
Illiteracy DIGESTYC -
EHPM 2013
Percentage of the population aged 10 and older that are
illiterate
Average Years
of Schooling
DIGESTYC -
EHPM 2013
Average years of schooling of the population aged 6 and
over
School
Enrollment
MINED
(enrollment
data);
DIGESTYC
(population
projection)
2014 Percentage of the population aged 4 to 19 years (inclusive)
that are enrolled in school
1. We are using a wide age range for a more conservative
enrollment estimate
2. Total enrollment figure likely includes adult education
enrollment for people aged 18+, however, in checking
the 2011 enrollment census, these students represented
only 0.32% of all enrollees attending school in the
country that year
Radio Access DIGESTYC -
EHPM 2013 Percentage of total households that have a radio
TV Access DIGESTYC -
EHPM 2013 Percentage of total households that have a television
Internet Access DIGESTYC -
EHPM 2013 Percentage of total households that access internet
Access to Clean
Water
Vulnerability
Access to Piped
Water
DIGESTYC -
EHPM 2013 Percentage of households with piped water access
Access to
Sanitation
Services
DIGESTYC -
EHPM 2013
Percentage of households that have sanitation service
access
Vulnerable Health
Status
Life Expectancy DIGESTYC
(projection) 2014 Life Expectancy at birth
Infant
Mortality Rate
MINSAL -
SIMMOW 2014 Single-year infant mortality rate per 1,000 live births

National Disaster Preparedness Baseline Assessment: El Salvador 147 © Pacific Disaster Center 2015
Maternal
Mortality Ratio
MINSAL -
SIMMOW 2014 Single-year maternal mortality ratio per 10,000 live births
Disability DIGESTYC 2007 Percentage of the population that is disabled
Includes the following types of disability: walking, self
care, mental, talking, hearing, arms, sight, other. 'Any
disability' is the total number of people with any (or
multiple) disability.
Prevalence
Malnourished
MINSAL -
SIMMOW 2014 Percentage of children under 5 that are malnourished
There are some slight variations in how the universe for
each age group was defined, noted in the derivation
description
Environmental
Stress
% Erosion
Susceptibility
Area
MARN Received
2015
Percentage of total Department land area with significant,
high or very high erosion susceptibility
Average Water
Stress MARN
Received
2015
Estimated Ratio of demand to available resources (as a
percentage)
Note: Department values approximated from hydrologic
region (a larger unit) using an areal weighted average
Population
Pressures
Population
Change
DIGESTYC
(projection) 2010 -2015
Average annual percentage population change for the
period 2010 - 2015
Gender Inequality
Proportion of
Female Seats in
Government
COMURES
(Female
seats);
DIGESTYC
(population
projection)
2012-2015 Proportion of Female Seats in Government by Proportion of
Females in Total Population
Ratio of Female
to Male Labor
Participation
DIGESTYC -
EHPM 2013
Ratio of female labor participation rate to male labor
participation rate
Labor participation expressed at the ratio of active working-
age population to total working - age population - by gender
Ratio of Female
to Male
Secondary
Education
Enrollment
MINED
(enrollment
data);
DIGESTYC
(population
projection)
2011
Ratio of female secondary school enrollment to male
secondary school enrollment
Secondary school enrollment expressed as the proportion of
students enrolled in general or technical/vocational high
school (referred to as Bachelor's degree) to the population
aged 15-19 (inclusive) - by gender
We are using a wide age range for a more conservative
enrollment estimate. Secondary School is typically
attended from age 16 - 18 in El Salvador.

National Disaster Preparedness Baseline Assessment: El Salvador 148 © Pacific Disaster Center 2015
Coping Capacity
Figure 75. RVA - Coping Capacity Indicators
Table 71. RVA - Coping Capacity Subcomponent Theme Rationale
Subcomponent Theme Rationale for Inclusion
Governance Reflects the stability and effectiveness of institutional structures to provide equitable public services, freedom in selecting government, and enforcement of laws
to prevent and control crime and violence.
Economic Capacity Represents a region’s ability to absorb immediate economic losses and quickly mobilize financial assets to provide needed assistance.
Environmental Capacity Represents the ability of the environment to recover from a shock and maintain species health, biodiversity, and critical ecosystem services after impact.
Infrastructure Represents the ability to learn about needs and exchange information (Communications), and physically distribute goods and services to those affected
(Transportation and Health Care).

National Disaster Preparedness Baseline Assessment: El Salvador 149 © Pacific Disaster Center 2015
Table 72. RVA - Coping Capacity Scores and Ranks for all Indices and Subcomponents
Department
Coping Capacity
Index Governance Econ. Capacity
Environ.
Capacity
Infrastructure
Index
Healthcare
(Infra.)
Transport
(Infra) Comms (Infra.)
Score Rank Score Rank Score Rank Score Rank Score Rank Score Rank Score Rank Score Rank
Ahuachapán 0.352 12 0.608 3 0.161 14 0.604 4 0.204 13 0.142 9 0.357 11 0.115 14
Cabañas 0.200 14 0.294 11 0.187 13 0.048 13 0.171 14 0.194 8 0.034 13 0.284 11
Chalatenango 0.395 8 0.561 4 0.377 9 0.107 11 0.344 9 0.581 5 0.000 14 0.451 8
Cuscatlán 0.217 13 0.168 14 0.223 12 0.234 10 0.255 11 0.082 11 0.312 12 0.370 9
La Libertad 0.603 2 0.536 7 0.645 2 0.441 7 0.682 2 0.089 10 0.957 1 1.000 1
La Paz 0.366 9 0.284 13 0.378 8 0.779 2 0.299 10 0.072 13 0.711 4 0.115 13
La Unión 0.478 7 0.489 9 0.552 3 0.547 5 0.371 8 0.079 12 0.538 7 0.496 6
Morazán 0.355 11 0.527 8 0.403 6 0.000 14 0.252 12 0.038 14 0.580 6 0.139 12
San Miguel 0.566 3 0.545 6 0.502 4 0.622 3 0.632 3 0.887 2 0.528 8 0.481 7
San Salvador 0.681 1 0.660 2 0.667 1 0.072 12 0.917 1 0.999 1 0.791 3 0.962 2
San Vicente 0.363 10 0.288 12 0.328 11 0.260 9 0.508 6 0.719 3 0.472 9 0.332 10
Santa Ana 0.511 4 0.558 5 0.471 5 0.415 8 0.535 5 0.602 4 0.36 10 0.643 3
Sonsonate 0.491 6 0.692 1 0.335 10 0.488 6 0.445 7 0.215 7 0.599 5 0.520 5
Usulután 0.495 5 0.352 10 0.385 7 1 1 0.581 4 0.270 6 0.903 2 0.57 4

National Disaster Preparedness Baseline Assessment: El Salvador 150 © Pacific Disaster Center 2015
Table 73. RVA - Coping Capacity Indicator Metadata
Coping Capacity
Subcomponent Indicator Source(s) Year Description Notes
Environmental
Capacity
% Protected
Area MARN 2012
Percentage of total Department land area that is
protected
Some protected area polygon slivers may have been excluded
if they fell outside the geometric extent of the country
boundary.
Infrastructure -
Healthcare
Physicians per
10k Persons
MINSAL - HR;
DIGESTYC
(population
projection)
2014 Physicians per 10,000 population
Includes all physicians employed by Ministry of Health,
Solidarity Fund for Health, Salvadoran Social Security
Institute, Army Medical Command, Salvadoran Institute for
Comprehensive Rehabilitation, and Salvadoran Institute for
Teachers' Welfare. Does not include private physicians -
MINSAL did not provide.
Nurses and
Midwives per
10k Persons
MINSAL - HR;
DIGESTYC
(population
projection)
2014 Nurses and Midwives per 10,000 population
Note: Data on Midwives reported as LICENCIADAS MATERNO
INFANTIL - MINSAL advised using this as an acceptable proxy
Includes all nurses employed by Ministry of Health, Solidarity
Fund for Health, Salvadoran Social Security Institute, Army
Medical Command, Salvadoran Institute for Comprehensive
Rehabilitation, and Salvadoran Institute for Teachers'
Welfare. Does not include private nurses and non-
professional nurses (those not trained at university) - MINSAL
did not provide.
Hospital beds
per 10k
Persons
MINSAL - SEPS;
DIGESTYC
(population
projection)
2015 Hospital beds per 10,000 population
Includes hospital bed details by specialization (i.e. General
Medicine, Surgery, Obstetrics) for all MINSAL and ISSS
Hospitals. Like the other data, it appears that this does not
include privately licensed beds. MINSAL did not provide.
Infrastructure -
Transportation
Road and Rail
Density
Protección Civil
(roads), NREL
(rails), MARN
(water bodies)
Roads
Received
2014;
Rails
2004
Length of road and rail lines by total land area Some road segments may have been excluded if they were
outside the geometric extent of the country boundary.
Port and
Airport
density
NGA (airports),
MINEC (ports),
MARN (water
bodies)
Airports
2007;
Ports
2015
Count of ports and airports per 10,000 sq km land area
We did not have a layer that included all ports, however since
this indicator does not require a precise location, I simply
noted the departments in which each port is located using the
MINEC map viewer base data
Airports include military airstrips and runways.
Infrastructure -
Communications
Fixed Phone
Access
DIGESTYC -
EHPM 2013 Percentage of households with fixed phone line
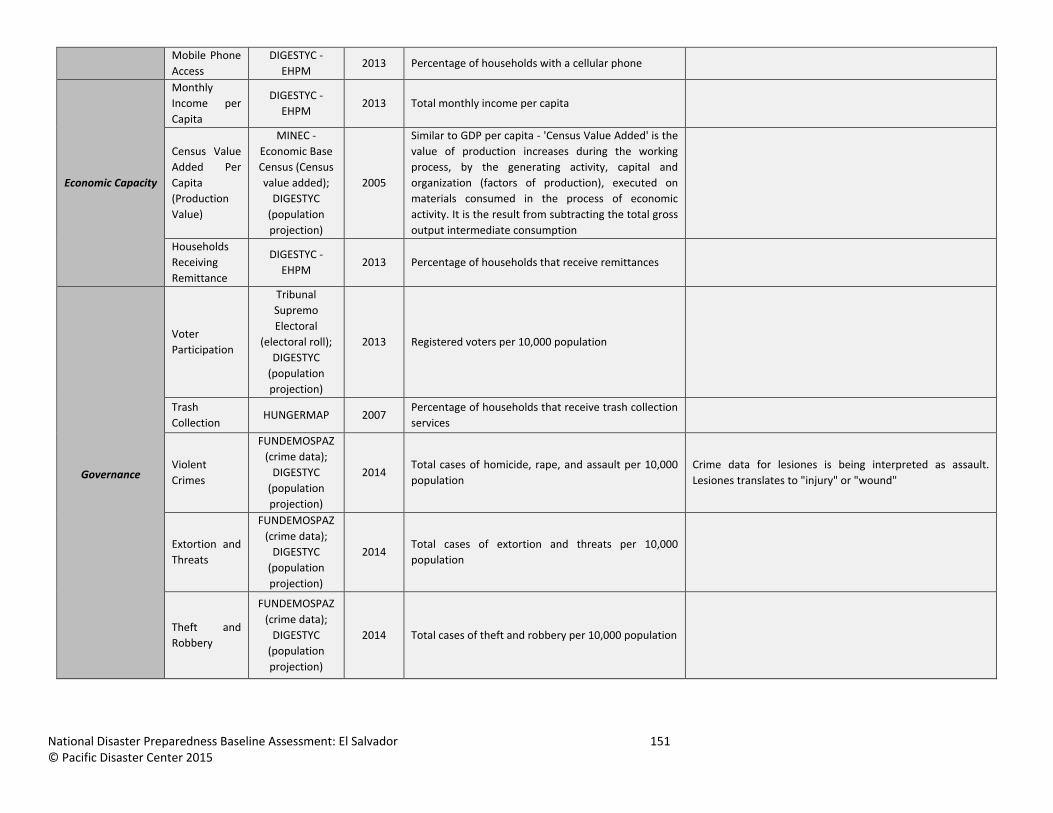
National Disaster Preparedness Baseline Assessment: El Salvador 151 © Pacific Disaster Center 2015
Mobile Phone
Access
DIGESTYC -
EHPM 2013 Percentage of households with a cellular phone
Economic Capacity
Monthly
Income per
Capita
DIGESTYC -
EHPM 2013 Total monthly income per capita
Census Value
Added Per
Capita
(Production
Value)
MINEC -
Economic Base
Census (Census
value added);
DIGESTYC
(population
projection)
2005
Similar to GDP per capita - 'Census Value Added' is the
value of production increases during the working
process, by the generating activity, capital and
organization (factors of production), executed on
materials consumed in the process of economic
activity. It is the result from subtracting the total gross
output intermediate consumption
Households
Receiving
Remittance
DIGESTYC -
EHPM 2013 Percentage of households that receive remittances
Governance
Voter
Participation
Tribunal
Supremo
Electoral
(electoral roll);
DIGESTYC
(population
projection)
2013 Registered voters per 10,000 population
Trash
Collection HUNGERMAP 2007
Percentage of households that receive trash collection
services
Violent
Crimes
FUNDEMOSPAZ
(crime data);
DIGESTYC
(population
projection)
2014 Total cases of homicide, rape, and assault per 10,000
population
Crime data for lesiones is being interpreted as assault.
Lesiones translates to "injury" or "wound"
Extortion and
Threats
FUNDEMOSPAZ
(crime data);
DIGESTYC
(population
projection)
2014 Total cases of extortion and threats per 10,000
population
Theft and
Robbery
FUNDEMOSPAZ
(crime data);
DIGESTYC
(population
projection)
2014 Total cases of theft and robbery per 10,000 population

National Disaster Preparedness Baseline Assessment: El Salvador 152 © Pacific Disaster Center 2015
Appendix B: RVA Index Construction This appendix details additional information on RVA index construction.
After finalizing the datasets to be used in the analysis, indicators were created. Indicators are simply
standardized datasets representing one aspect of multi-hazard risk that can be combined together in a
meaningful way. The indicators used to create subcomponent indices represent a wide range of concepts
and are often measured using inconsistent units, ranges, and scales. In order to make meaningful
comparisons between concepts, and to combine them and perform the mathematical operations required
to create a single composite index score, indicator values were normalized. Normalization produces a
consistent value range and direction across all indicators.
However, as data skewness and outliers may heavily influence the distribution of observations along a
normalized scale, some transformations were made prior to rescaling. Minimums, maximums, standard
deviations, means, and skew were calculated for each dataset. Datasets showing substantial skewness
(beyond +/-1) were evaluated on a case by case basis and transformed using common statistical methods
(e.g., natural log, square root, or cube root). In addition to controlling for skewness, indicators were
evaluated to ensure consistent conceptual direction between the data and the overall concept modeled
in the subcomponent and component index. For example, an indicator of households’ access to internet
is included within the Information Access Vulnerability subcomponent in the Vulnerability Index.
However, increases in household internet access conceptually decrease vulnerability. To match the
direction of the indicator with its effect on overall vulnerability, the data is transformed using the
reflection equation:
(Indicator maximum value + 1) – Observed indicator value
Following these transformations, indicators were normalized to create scaled scores ranging from 0 to 1,
with the following equation:
(Observed indicator value – Indicator minimum value) /
(Indicator maximum value – Indicator minimum value)
In cases where an indicator observed value was outside +/- 3 standard deviations from the mean, these
were excluded from the scaling equation (e.g., ‘indicator minimum value’ and ‘indicator maximum value’
in the above equation). Instead the value closest to 3 standard deviations of the mean (without exceeding)
was substituted, replacing the minimum or maximum value.
This approach to establishing minimum and maximum values conceptually anchors the range, indicating
relative position between the “worst realistic case” and the “best realistic case” for each indicator in the
country. Subcomponent scores represent the unweighted average of indicators. Likewise, component
Indices (MHE, V, and C) represent the average of their respective subcomponent scores. This method
maintains a consistent scale and range through the index construction hierarchy, with a minimum value
of 0 and a maximum value of 1.
It is important to note that “0” does not represent “No Risk,” (or Hazard Exposure or Coping Capacity or
Vulnerability), but instead indicates the minimum realistic case relative to the data analyzed for the

National Disaster Preparedness Baseline Assessment: El Salvador 153 © Pacific Disaster Center 2015
country. The resulting indices are mapped using a quantile classification to illustrate the relative
distribution of each overall concept throughout El Salvador.


National Disaster Preparedness Baseline Assessment: El Salvador 155 © Pacific Disaster Center 2015
Appendix C: El Salvador – CDM Preparedness Survey (February 2015)
Introduction As part of Comprehensive Disaster Management (CDM) data gathering efforts, stakeholder participants
completed a preparedness survey during the Midterm Knowledge Exchange in San Salvador, El Salvador,
on 10 February 2015. The survey was designed to assess the presence of comprehensive disaster
management plans, specific components of disaster management plans, and the drilling and exercising of
plans within organizations at both national and subnational levels. The survey was organized into two
sections – a quantitative portion
(questions 1-28) and a qualitative
portion (questions 29-33).
Frequency tables for responses to
survey questions 1-28 are included
for reference in Table 75 through
Table 102 Annex A: Frequency
Tables for CDM Preparedness Survey
(Questions 1-28) of this document.
A total of 44 stakeholders
participated in the survey, with 58%
of the respondents representing
central government agencies and
20% representing United Nations
organizations. An additional 8% represented national universities, 8% were from international non-
governmental organizations (INGOs), 4% from international organizations, and 2% from national NGOs
(Figure 76). Respondents were 65% male and 31% female with 4% not reporting their gender.
Approximately 30% of respondents were between the ages of 41-50, 30% were 51-60, 23% were 31-40,
and the remaining 17% were distributed across other age ranges (18-25; 26-30; 61-65; and over 65).
Survey responses were validated through stakeholder interviews conducted by PDC staff over the course
of the project. Interview participants represented national and sub-national government organizations
and NGOs, and included leaders and specialists.
Responses to Quantitative Survey Questions (1-28)
Availability and Accessibility of Disaster Plans Of the participants in the Midterm Knowledge Exchange, three-quarters (75%; 33/44) reported that their
organizations have comprehensive disaster management plans. Seventy-seven percent (34/44) reported
the presence of disaster response plans, and 70% (31/44) reported having disaster preparedness plans.
Fewer organizations reported the existence of disaster mitigation plans (45%; 20/44) and recovery plans
58%20%
4%8%
8%
2%
Survey Respondents' Organizational Affiliation
Central Government United NationsInternational Organizations UniversitiesInternational NGOs National NGOs
Figure 76. Organizational Affiliation of Survey Respondents.

National Disaster Preparedness Baseline Assessment: El Salvador 156 © Pacific Disaster Center 2015
(45%; 20/44) (Figure 77). Sixty-four percent (28/44) of organizations’ disaster plans are updated regularly,
and 61% (27/44) of disaster plans are tested, drilled, or exercised regularly.
Planning Collaboration Forty-eight percent (21/44) of survey participants reported their involvement in the drafting of one or
more of their organization’s disaster plans. Fifty-seven percent (25/44) have access to copies of their
organization’s disaster management plans, and 52% (23/44) reported that their disaster plans have been
shared with other agencies or organizations active in disaster management.
Composition of Disaster Plans Fifty-two percent (23/44) of survey participants reported that their organization’s disaster management
plans include information on all hazard types. Fifty-nine percent (26/44) have disaster plans that address
public outreach, 66% (29/44) have disaster plans that address early warning, but only 36% (16/44) have
disaster plans that address evacuation. Fifty-two percent (23/44) of participants reported that their
disaster plans address logistics management, 45% (20/44) have disaster plans that address transportation,
however, just 27% (12/44) have disaster plans that address shelter operations. Only 14% (6/44) stated
that their organizations have plans that address public safety and security. Less than half of respondents
(41%; 18/44) reported that their organizations have disaster plans that address long-term community
recovery.
Forty-one percent (18/44) of participants have organizational disaster plans that address when and how
to activate their Emergency Operations Centers (EOC). Fifty-nine percent (26/44) have disaster plans that
address emergency communications during times of disaster. Fourteen percent (6/44) of participants
reported that their organizations have disaster plans that address public works and engineering, and 25%
(11/44) stated that their plans address public health and medical services. Eighteen percent (8/44) have
0 10 20 30 40 50
A Recovery Plan?
A Disaster Mitigation Plan?
A Disaster Preparedness Plan?
A Disaster Response Plan?
A Comprehensive Disaster Management Plan?
20
20
31
34
33
14
13
7
6
7
5
4
4
3
3
5
7
2
1
1
Yes
No
I Don't Know
Does Not Apply /Missing
Does Your Organization Have:
Figure 77. Availability and accessibility of disaster plans according to survey results.

National Disaster Preparedness Baseline Assessment: El Salvador 157 © Pacific Disaster Center 2015
disaster plans that address search and rescue, 25% (11/44) have disaster plans that address oil and
hazardous materials response, and 23% (10/44) have disaster plans that address agriculture and natural
resources. Refer to Table 74 for a summary of stakeholder responses to questions regarding specific
components of disaster plans in El Salvador.
Table 74. Frequency of responses to questions regarding specific components of disaster management plans in El Salvador.
Does plan include information on:
Yes No Don’t Know
Does Not Apply
Missing
N % N (%) N % N % N %
All Hazard Types 23 (52) 15 (34) 2 (5) 3 (7) 1 (2) Public Outreach 26 (59) 10 (23) 3 (7) 4 (9) 1 (2)
Early Warning 29 (66) 8 (18) 2 (5) 4 (9) 1 (2) Evacuation 16 (36) 14 (32) 3 (7) 10 (23) 1 (2)
Logistics 23 (52) 9 (21) 3 (7) 8 (18) 1 (2) Shelter Operations 12 (27) 20 (46) 2 (5) 9 (20) 1 (2)
EOC Activation 18 (41) 12 (27) 4 (9) 8 (18) 2 (5) Transportation 20 (45) 14 (32) 2 (5) 6 (13) 2 (5)
Communications 26 (59) 9 (20) 2 (5) 6 (14) 1 (2) Public Works & Engineering 6 (14) 26 (59) 2 (5) 9 (20) 1 (2)
Public Health & Medical Services 11 (25) 20 (46) 1 (2) 11 (25) 1 (2) Search & Rescue 8 (18) 22 (50) 1 (2) 12 (28) 1 (2)
Hazardous Materials 11 (25) 19 (43) 3 (7) 10 (23) 1 (2) Agricultural & Natural Resources 10 (23) 20 (45) 2 (5) 11 (25) 1 (2)
Public Safety 6 (14) 27 (61) 0 (0) 9 (20) 2 (5) Long-term Community Recovery 18 (41) 18 (41) 1 (2) 6 (14) 1 (2)
Perceptions of Disaster Management Leadership Programs Eighty-two percent (36/44) of survey participants felt that their disaster management organizations
exhibit strong leadership, while 61% (27/44) believed that their organizations have effective disaster
management programs.
Responses to Qualitative Survey Questions (29-33) Questions 29-33 required open-ended responses from survey participants. Respondents generally
provided brief answers to these questions which centered around the role of their organizations in
providing effective disaster management within El Salvador.
Forty-two (95%) survey participants provided an answer to Question 29 (“How do you define “effective
disaster management”?”). Responses heavily favored the concepts of planning and preparedness, with
twenty-two participants using the words ‘planning’ and/or ‘preparation’ in their answers (Figure 78). Five
responses highlighted ‘all phases’ of disaster management, including the planning/preparedness phase.
Nine participants included some reference to ‘coordination’ or ‘cooperation’. Additional concepts of note
included ‘response’ (seven responses), ‘prevention/mitigation’ (six responses), and the ‘capacity to act’
which was referenced by five survey participants. Complete answers to this question can be seen in Table
103.

National Disaster Preparedness Baseline Assessment: El Salvador 158 © Pacific Disaster Center 2015
Figure 78. Word Cloud for Question 29: “How do you define “effective disaster management”?”
One hundred percent (44/44) of participants provided an answer to Question 30 (“What is the function
of your organization in disaster management?”). The most prevalent functions included ‘capacity building’
in relation to risk management, ‘preparation and support’ of communities throughout all phases of
disaster management, and ‘humanitarian assistance’ for disaster response. Additional organizational
functions included ‘saving lives’, ‘coordination’, providing qualified ‘human resources’, and ‘recovery’
activities.
Question 31 (“What are the three most effective preparation activities that your organization has carried
out?”) was answered by 95% (42/44) of survey participants. The most common emergent themes included
‘training’, ‘drills/exercises/simulations’, ‘planning’, and ‘vulnerability/risk assessments’. ‘Organization’,
‘coordination’, ‘preparation’, ‘monitoring of threats’, and ‘capacity building’ were also recurring answers
to this question. Emphasis was placed on preparedness activities taking place at municipal and community
levels.
Forty (91%) survey participants responded to Question 32 (“How can your organization improve disaster
management?”). The two most common themes pertained to increasing capacity (25%; 11/44 (Figure 79).
Additional participant suggestions included increasing information and knowledge exchanges, support,
equipment, and the training and education of practitioners.

National Disaster Preparedness Baseline Assessment: El Salvador 159 © Pacific Disaster Center 2015
Figure 79. Word Cloud for Question 32: “How can your organization improve disaster management?”
Question 33 (“What is the area of responsibility of your organization? (local, provincial, national, all, etc.)”)
was answered by 93% of survey participants (41/44). Nearly half of those surveyed were responsible for
disaster management activities at the national level. Three participants dealt with disaster management
specifically at the local level of the country while 17 work at all levels of the government. One participant
focused solely on international disaster management efforts, with 3 highlighting a capacity to work at the
regional level.

National Disaster Preparedness Baseline Assessment: El Salvador 160 © Pacific Disaster Center 2015
Annex A: Frequency Tables for CDM Preparedness Survey (Questions 1-28) Table 75. Preparedness Survey – Question 1
Does your organization have a comprehensive disaster
management plan? Frequency Percent
No 7 15.91
Yes 33 75.00
I don’t know 3 6.82
Does not apply 1 2.27
Missing 0 0
Total 44 100
Table 76. Preparedness Survey – Question 2
Does your organization have a disaster response plan?
Frequency Percent
No 6 13.64
Yes 34 77.27
I don’t know 3 6.82
Does not apply 1 2.27
Missing 0 0
Total 44 100
Table 77. Preparedness Survey – Question 3
Does your organization have a disaster preparedness plan?
Frequency Percent
No 7 15.91
Yes 31 70.45
I don’t know 4 9.09
Does not apply 1 2.27
Missing 1 2.27
Total 44 100

National Disaster Preparedness Baseline Assessment: El Salvador 161 © Pacific Disaster Center 2015
Table 78. Preparedness Survey – Question 4
Does your organization have a disaster mitigation plan?
Frequency Percent
No 13 29.55
Yes 20 45.45
I don’t know 4 9.09
Does not apply 5 11.36
Missing 2 4.55
Total 44 100
Table 79. Preparedness Survey – Question 5
Does your organization have a disaster recovery plan?
Frequency Percent
No 14 31.82
Yes 20 45.45
I don’t know 5 11.36
Does not apply 4 9.09
Missing 1 2.27
Total 44 100
Table 80. Preparedness Survey – Question 6
Did you participate in the drafting of any of the disaster plans?
Frequency Percent
No 21 47.73
Yes 21 47.73
I don’t know 1 2.27
Does not apply 1 2.27
Missing 0 0
Total 44 100

National Disaster Preparedness Baseline Assessment: El Salvador 162 © Pacific Disaster Center 2015
Table 81. Preparedness Survey – Question 7
Do you have a copy of the disaster management plan(s)?
Frequency Percent
No 16 36.36
Yes 25 56.82
I don’t know 0 0
Does not apply 1 2.27
Missing 2 4.55
Total 44 100
Table 82. Preparedness Survey – Question 8
Does your disaster management plan include information on all
hazard types? Frequency Percent
No 15 34.09
Yes 23 52.27
I don’t know 2 4.55
Does not apply 3 6.82
Missing 1 2.27
Total 44 100
Table 83. Preparedness Survey – Question 9
Has your plan been shared with other agencies or organizations active in disaster management?
Frequency Percent
No 14 31.82
Yes 23 52.27
I don’t know 5 11.36
Does not apply 2 4.55
Missing 0 0
Total 44 100

National Disaster Preparedness Baseline Assessment: El Salvador 163 © Pacific Disaster Center 2015
Table 84. Preparedness Survey – Question 10
Are your organizations disaster plans updated regularly?
Frequency Percent
No 8 18.18
Yes 28 63.64
I don’t know 6 13.64
Does not apply 2 4.55
Missing 0 0
Total 44 100
Table 85. Preparedness Survey – Question 11
Are your organizations disaster plans tested, drilled or
exercised regularly? Frequency Percent
No 10 22.73
Yes 27 61.36
I don’t know 1 2.27
Does not apply 5 11.36
Missing 1 2.27
Total 44 100
Table 86. Preparedness Survey – Question 12
Do your disaster plans address public outreach?
Frequency Percent
No 10 22.73
Yes 26 59.09
I don’t know 3 6.82
Does not apply 4 9.09
Missing 1 2.27
Total 44 100

National Disaster Preparedness Baseline Assessment: El Salvador 164 © Pacific Disaster Center 2015
Table 87. Preparedness Survey – Question 13
Do your disaster plans address early warning?
Frequency Percent
No 8 18.18
Yes 29 65.91
I don’t know 2 4.55
Does not apply 4 9.09
Missing 1 2.27
Total 44 100
Table 88. Preparedness Survey – Question 14
Do your disaster plans address evacuation?
Frequency Percent
No 14 31.82
Yes 16 36.36
I don’t know 3 6.82
Does not apply 10 22.73
Missing 1 2.27
Total 48 100
Table 89. Preparedness Survey - Question 15
Do your disaster plans address logistics management? (the movement of personnel and
resources during times of disasters)
Frequency Percent
No 9 20.45
Yes 23 52.27
I don’t know 3 6.82
Does not apply 8 18.18
Missing 1 2.27
Total 44 100

National Disaster Preparedness Baseline Assessment: El Salvador 165 © Pacific Disaster Center 2015
Table 90. Preparedness Survey – Question 16
Do your disaster plans address shelter operations?
Frequency Percent
No 20 45.45
Yes 12 27.27
I don’t know 2 4.55
Does not apply 9 20.45
Missing 1 2.27
Total 44 100
Table 91. Preparedness Survey – Question 17
Do your disaster plans address when and how to activate the Emergency Operation Center?
Frequency Percent
No 12 27.27
Yes 18 40.91
I don’t know 4 9.09
Does not apply 8 18.18
Missing 2 4.55
Total 48 100
Table 92. Preparedness Survey – Question 18
Do your disaster plans address transportation during
times of disasters? Frequency Percent
No 14 31.82
Yes 20 45.45
I don’t know 2 4.55
Does not apply 6 13.64
Missing 2 4.55
Total 44 100

National Disaster Preparedness Baseline Assessment: El Salvador 166 © Pacific Disaster Center 2015
Table 93. Preparedness Survey - Question 19
Do your disaster management plans address emergency
communications during times of disaster?
Frequency Percent
No 9 20.45
Yes 26 59.09
I don’t know 2 4.55
Does not apply 6 13.64
Missing 1 2.27
Total 44 100
Table 94. Preparedness Survey – Question 20
Do your disaster plans address public works and engineering?
Frequency Percent
No 26 59.09
Yes 6 13.64
I don’t know 2 4.55
Does not apply 9 20.45
Missing 1 2.27
Total 44 100
Table 95. Preparedness Survey – Question 21
Do your disaster plans address public health and medical services?
Frequency Percent
No 20 45.45
Yes 11 25.00
I don’t know 1 2.27
Does not apply 11 25.00
Missing 1 2.27
Total 44 100

National Disaster Preparedness Baseline Assessment: El Salvador 167 © Pacific Disaster Center 2015
Table 96. Preparedness Survey – Question 22
Do your plans address search and rescue?
Frequency Percent
No 22 50.00
Yes 8 18.18
I don’t know 1 2.27
Does not apply 12 27.27
Missing 1 2.27
Total 44 100
Table 97. Preparedness Survey – Question 23
Do your plans address oil and hazardous materials response
(chemical, biological, radiological, etc.)?
Frequency Percent
No 19 43.18
Yes 11 25.00
I don’t know 3 6.82
Does not apply 10 22.73
Missing 1 2.27
Total 44 100
Table 98. Preparedness Survey – Question 24
Do your plans address agriculture and natural resources?
Frequency Percent
No 20 45.45
Yes 10 22.73
I don’t know 2 4.55
Does not apply 11 25.00
Missing 1 2.27
Total 44 100

National Disaster Preparedness Baseline Assessment: El Salvador 168 © Pacific Disaster Center 2015
Table 99. Preparedness Survey – Question 25
Do your plans address public safety and security?
Frequency Percent
No 27 61.36
Yes 6 13.64
I don’t know 0 0
Does not apply 9 20.45
Missing 2 4.55
Total 44 100
Table 100. Preparedness Survey – Question 26
Do your plans address long-term community recovery?
Frequency Percent
No 18 40.91
Yes 18 40.91
I don’t know 1 2.27
Does not apply 6 13.64
Missing 1 2.27
Total 48 100
Table 101. Preparedness Survey – Question 27
Does your organization have strong
disaster management leadership? Frequency Percent
No 4 9.09
Yes 36 81.82
I don’t know 1 2.27
Does not apply 1 2.27
Missing 2 4.55
Total 44 100

National Disaster Preparedness Baseline Assessment: El Salvador 169 © Pacific Disaster Center 2015
Table 102. Preparedness Survey – Question 28
Do you think your organization has an effective disaster management
program? Frequency Percent
No 6 13.64
Yes 27 61.36
I don’t know 6 13.64
Does not apply 2 4.55
Missing 3 6.82
Total 44 100

National Disaster Preparedness Baseline Assessment: El Salvador 170 © Pacific Disaster Center 2015
Annex B: Definitions of Disaster Management Participant responses to Preparedness Survey Question 29: “How do you define ‘effective disaster
management’?” are included in Table 30.
Table 103. CDM Preparedness Survey – Participant Written Responses
To achieve what is planned
Actions that allow the preparation and mitigation of threats, monitoring of threats and which establish disaster response mechanisms
A better preparation, organization, and an effective response and a reduced impact together with an active resilience for an immediate, medium and long term development
It is every timely action which may guarantee activity. To safeguard life and its means in a disaster situation
To have true and updated information from the start of the event (if sudden) and with a good monitoring (if forecasted).
It makes reference to the capacity of achieving goals in terms of emergency management attention improvement and disaster prevention.
A management with a prospective approach which allows citizen participation
That by which, in the event of a natural threat, there are the lesser number of deaths and various losses in the economy.
That in the event of a disaster the response to it is precise and at the time needed.
To have all resources for compliance
With preparatory actions and previous coordination, as well as with prospective scenarios
To comply with the mandate required by law of the organization in the topics that will be addressed to the target audience.
It refers to the effective preparation for or in the event of disasters, attention/response, recovery, and assessment.
To meet or deal with all needs.
Effectiveness refers to the optimization of resources and non-duplicity, and to the generation of resilience
Integral with Acgoras. Scientific technicians + Government + prepared and educated community
Timely generation of notices and warning, with the pertinent information, so aid and assistance entities give aid to the population affected.
Effective would be a good coordination at the national, department, and municipal level, for the good attention to the disaster and allocation of resources.
Disaster management involves national and international efforts to have capacity to serve communities under low risk.
That is has a well-defined plan, taking into account and consolidating information by having immediate responses and especially by working to minimize risks
To take into account the before, during and after actions.
(None)
In case of a disaster, the people affected are assisted in a timely and appropriate manner
It is the condition that develops inter-institutional and community conditions to avoid disasters or at least to avoid them.
Where there are clear and precise protocols on how to act during and after an event in order to minimize the impact of a disaster.
To guarantee through coordination and participation of everyone for a greater resilience.

National Disaster Preparedness Baseline Assessment: El Salvador 171 © Pacific Disaster Center 2015
Processes to reduce the impact of phenomena, to reduce losses and damages, taking into account social, physical, economic factors
It must include all phases, from preparation to the recovery itself.
To take charge of the preparation and response according to the different events and ensure a soon recovery and rehabilitation.
(None)
True information. Good organization and logistics. Immediate response.
The set of timely and functional actions at the time required for handling the event.
Effective Risk Management or Disaster Management means: efficient, quick but also appropriate. It improves the systems. It improves equity. It reduces vulnerability with in the response, mitigation, recovery, and preparation
It is when there are plans to balance the available resources with the reaction or prevention of the disaster at an appropriate time.
To anticipate on a timely basis. To strengthen areas susceptible to different threats. To strengthen communities, mitigation and adaptation works.
Very higher management level.
There is preparation. It is delivered as soon as the disaster occurs. Based on actual needs.
It is that in which all stakeholders and resources provide the necessary and appropriate services to minimize its impact on people.
To have the capacity to act before, during, and after the emergency.
Preparation, organization, identification of vulnerabilities
The context depends a lot to ensure that my management plan is effective. However, all those preparation actions, diagnoses and planning are to react and avoid loss of life.
That there is planning and organization before any emergency event. For this purpose, there is a previous preparation to have the humanitarian assistance available in case a disaster occurs.

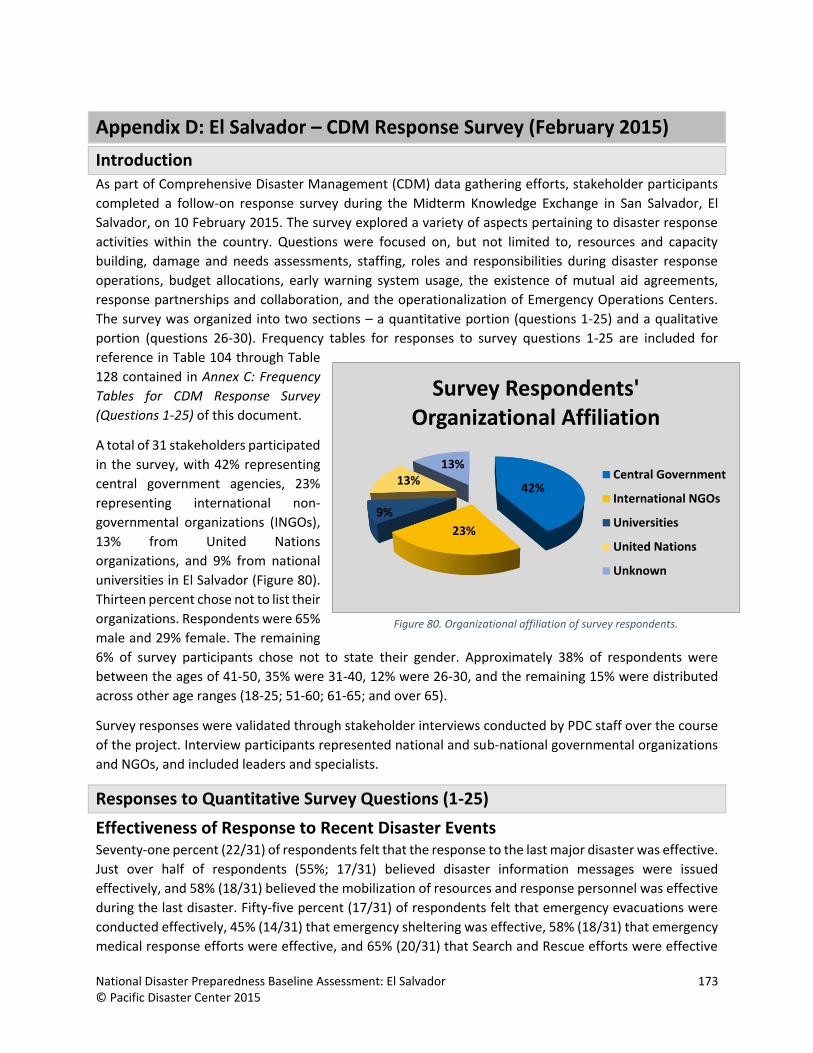
National Disaster Preparedness Baseline Assessment: El Salvador 173 © Pacific Disaster Center 2015
Appendix D: El Salvador – CDM Response Survey (February 2015)
Introduction As part of Comprehensive Disaster Management (CDM) data gathering efforts, stakeholder participants
completed a follow-on response survey during the Midterm Knowledge Exchange in San Salvador, El
Salvador, on 10 February 2015. The survey explored a variety of aspects pertaining to disaster response
activities within the country. Questions were focused on, but not limited to, resources and capacity
building, damage and needs assessments, staffing, roles and responsibilities during disaster response
operations, budget allocations, early warning system usage, the existence of mutual aid agreements,
response partnerships and collaboration, and the operationalization of Emergency Operations Centers.
The survey was organized into two sections – a quantitative portion (questions 1-25) and a qualitative
portion (questions 26-30). Frequency tables for responses to survey questions 1-25 are included for
reference in Table 104 through Table
128 contained in Annex C: Frequency
Tables for CDM Response Survey
(Questions 1-25) of this document.
A total of 31 stakeholders participated
in the survey, with 42% representing
central government agencies, 23%
representing international non-
governmental organizations (INGOs),
13% from United Nations
organizations, and 9% from national
universities in El Salvador (Figure 80).
Thirteen percent chose not to list their
organizations. Respondents were 65%
male and 29% female. The remaining
6% of survey participants chose not to state their gender. Approximately 38% of respondents were
between the ages of 41-50, 35% were 31-40, 12% were 26-30, and the remaining 15% were distributed
across other age ranges (18-25; 51-60; 61-65; and over 65).
Survey responses were validated through stakeholder interviews conducted by PDC staff over the course
of the project. Interview participants represented national and sub-national governmental organizations
and NGOs, and included leaders and specialists.
Responses to Quantitative Survey Questions (1-25)
Effectiveness of Response to Recent Disaster Events Seventy-one percent (22/31) of respondents felt that the response to the last major disaster was effective.
Just over half of respondents (55%; 17/31) believed disaster information messages were issued
effectively, and 58% (18/31) believed the mobilization of resources and response personnel was effective
during the last disaster. Fifty-five percent (17/31) of respondents felt that emergency evacuations were
conducted effectively, 45% (14/31) that emergency sheltering was effective, 58% (18/31) that emergency
medical response efforts were effective, and 65% (20/31) that Search and Rescue efforts were effective
42%
23%
9%
13%13%
Survey Respondents' Organizational Affiliation
Central Government
International NGOs
Universities
United Nations
Unknown
Figure 80. Organizational affiliation of survey respondents.

National Disaster Preparedness Baseline Assessment: El Salvador 174 © Pacific Disaster Center 2015
during the last disaster. More than three-quarters of respondents (77%; 24/31) felt that their
organizations responded to the last major disaster as outlined in policy/governing documents.
Disaster Early Warning A little over half of organizations (52%; 16/31) surveyed provide disaster warning to their communities,
and 74% (23/31) receive hazard-warning messages directly from the lead agency.
Organizational Resources and Capacity Building for Disaster Response Nearly three-quarters of respondents (74%; 23/31) identified their organizations as being active in disaster
response. Seventy-seven percent (24/31) stated that their organizations have pre-established agreements
for support, such as mutual aid agreements, during times of disaster. Forty-eight percent (15/31) of
respondents indicated that their organizations engage with the military during disaster response, while
just under two-thirds (65%; 20/31) reported that their organizations engage with the private sector in
support of disaster response activities. Seventy-one percent (22/31) of respondents felt that their
organizations have adequate staffing to conduct disaster response. Sixty-eight percent (21/31) stated that
their organizations have training programs to help develop and build capacity in disaster management
staff members.
Post-Disaster Damage and Needs Assessments Sixty-five percent (20/31) of respondents stated that their organizations are responsible for post-disaster
damage and needs assessments. Eighty percent (25/31) reported that post-disaster damage and needs
assessments were conducted following the last major disaster, however, fewer than half (48%; 15/31) of
those surveyed considered the assessments to be accurate. Eighty-seven percent (27/31) of respondents
find the results of post-disaster damage and needs assessments to be helpful in response decision-making.
Emergency Operations Center Just over half of survey respondents (55%; 17/31) indicated that their organizations maintain Emergency
Operations Centers. Only 39% (12/31), however, felt that their Emergency Operations Centers have the
necessary resources required to communicate the impacts of a disaster to decision makers. Fifty-two
percent (16/31) have representatives from other agencies and organizations in their Emergency
Operations Centers.
Roles and Responsibilities in Disaster Response Fifty-eight percent (18/31) of respondents felt that disaster response tasks are clearly defined in El
Salvador. More than half of respondents (52%; 16/31) felt that there is overlap and/or conflict between
organizations active in disaster response in the country.
Responses to Qualitative Survey Questions (26-30) Questions 26-30 required open-ended responses from survey participants. Respondents provided brief
answers to questions pertaining to organizational capacities and challenges to disaster response in El
Salvador.
Thirty (97%) respondents provided an answer to Question 26 (“How do you receive the alert or warning
messages of a disaster?”). The most common methods mentioned for receiving disaster alerts and
warning messages was by text messages and cellphone. Email and other unspecified media are additional

National Disaster Preparedness Baseline Assessment: El Salvador 175 © Pacific Disaster Center 2015
ways of receiving early warning notifications. The Internet, radio, social networks, and mobile apps were
also cited by participants.
Question 27 (“Which was the last disaster that required a response from your organization?”) was
answered by 100% (31/31) of survey respondents. The most common response was Tropical Depression
12E, followed by the eruption of San Miguel volcano. Other disasters of note included drought, blight, the
2001 earthquake, the Chikungunya epidemic, and the migration of unaccompanied children.
Eighty-four percent (26/31) of respondents answered Question 28 (“In your opinion, in what disaster did
your organization respond more effectively?”). Many respondents identified their organizational response
to Tropical Depression 12E as being effective, with several respondents indicating that their organization
responds effectively to all disasters. Response to tropical storms, earthquakes, volcanoes, and the
migration of unaccompanied children were also regarded as effective.
Twenty-one (68%) respondents provided an answer to Question 29 (“In your opinion, in what disaster did
your organization respond less effectively?”). The most common response was ‘I don’t know’, giving no
indication as to what previous disaster response was ineffective. A number of those surveyed drew
attention to the 2001 earthquake, Tropical Depression Ida, the 2012 tsunami, and Hurricane Mitch
disasters as examples of less than effective response.
Question 30 (“In your opinion, what is the biggest challenge to respond more effectively to disasters?”)
was answered by 97% (30/31) of survey respondents. Responses referenced ineffective dissemination and
sharing of data and information as well as a lack of training and government leadership (Figure 81).
Additional challenges included resource shortfalls (budget, equipment, and staff) and a lack of updated
plans.
Figure 81. Word Cloud for Question 30: “In your opinion, what is the biggest challenge to respond more effectively to disasters?”

National Disaster Preparedness Baseline Assessment: El Salvador 176 © Pacific Disaster Center 2015
Annex C: Frequency Tables for CDM Response Survey (Questions 1-25)
Table 104. Response Survey - Question 1
Is your organization active in disaster response?
Frequency Percent
No 3 9.7
Yes 23 74.2
I do not know 3 9.7
Does not apply 1 3.2
Missing 1 3.2
Total 31 100
Table 105. Response Survey – Question 2
Does your organization provide disaster warning to the
community? Frequency Percent
No 12 38.7
Yes 16 51.6
I do not know 1 3.2
Does not apply 1 3.2
Missing 1 3.2
Total 31 100
Table 106. Response Survey – Question 3
Do you receive hazard-warning messages directly from
the lead agency? Frequency Percent
No 5 16.1
Yes 23 74.2
I do not know 1 3.2
Does not apply 1 3.2
Missing 1 3.2
Total 31 100

National Disaster Preparedness Baseline Assessment: El Salvador 177 © Pacific Disaster Center 2015
Table 107. Response Survey – Question 4
In your opinion, was the response to the last major disaster effective?
Frequency Percent
No 5 16.1
Yes 22 71.0
I do not know 4 12.9
Does not apply 0 0
Missing 0 0
Total 31 100
Table 108. Response Survey – Question 5
In your opinion, were disaster information messages issued
effectively during the last disaster? Frequency Percent
No 12 38.7
Yes 17 54.8
I do not know 1 3.2
Does not apply 1 3.2
Missing 0 0
Total 31 100
Table 109. Response Survey – Question 6
In your opinion, were emergency evacuations executed effectively
during the last disaster? Frequency Percent
No 8 25.8
Yes 17 54.8
I do not know 4 12.9
Does not apply 2 6.5
Missing 0 0
Total 31 100

National Disaster Preparedness Baseline Assessment: El Salvador 178 © Pacific Disaster Center 2015
Table 110. Response Survey – Question 7
In your opinion, was emergency sheltering effective during
the last disaster? Frequency Percent
No 6 19.4
Yes 14 45.2
I do not know 8 25.8
Does not apply 3 9.7
Missing 0 0
Total 31 100
Table 111. Response Survey – Question 8
In your opinion, were the emergency medical response
efforts effective during the last disaster?
Frequency Percent
No 3 9.7
Yes 18 58.1
I do not know 6 19.4
Does not apply 4 12.9
Missing 0 0
Total 31 100
Table 112. Response Survey – Question 9
In your opinion, were the Search and Rescue agencies response
efforts effective during the last disaster?
Frequency Percent
No 2 6.5
Yes 20 64.5
I do not know 5 16.1
Does not apply 4 12.9
Missing 0 0
Total 31 100

National Disaster Preparedness Baseline Assessment: El Salvador 179 © Pacific Disaster Center 2015
Table 113. Response Survey – Question 10
In your opinion, was the mobilization of resources and response personnel effective
during the last disaster?
Frequency Percent
No 6 19.4
Yes 18 58.1
I do not know 4 12.9
Does not apply 3 9.7
Missing 0 0
Total 31 100
Table 114. Response Survey – Question 11
Does your organization have pre-established agreements for support during times of disaster
(i.e., Mutual Aid)?
Frequency Percent
No 1 3.2
Yes 24 77.4
I do not know 4 12.9
Does not apply 2 6.5
Missing 0 0
Total 31 100
Table 115. Response Survey – Question 12
Is your agency responsible for post-disaster damage and
needs assessments? Frequency Percent
No 5 16.1
Yes 20 64.5
I do not know 1 3.2
Does not apply 5 16.1
Missing 0 0
Total 31 100

National Disaster Preparedness Baseline Assessment: El Salvador 180 © Pacific Disaster Center 2015
Table 116. Response Survey – Question 13
Is your agency responsible for post-disaster damage and
needs assessments? Frequency Percent
Yes 25 80.6
I do not know 4 12.9
Does not apply 2 6.5
Missing 0 0
Total 31 100
Table 117. Response Survey – Question 14
In your opinion, were the post-disaster damage and needs assessments conducted after the
last major disaster accurate?
Frequency Percent
No 7 22.6
Yes 15 48.4
I do not know 6 19.4
Does not apply 3 9.7
Missing 0 0
Total 31 100
Table 118. Response Survey – Question 15
Do you find the results of post-disaster damage and needs assessments helpful in response
decision making?
Frequency Percent
No 2 6.5
Yes 27 87.1
I do not know 1 3.2
Does not apply 1 3.2
Missing 0 0
Total 31 100

National Disaster Preparedness Baseline Assessment: El Salvador 181 © Pacific Disaster Center 2015
Table 119. Response Survey – Question 16
Does your organization maintain an Emergency Operations Center?
Frequency Percent
No 8 25.8
Yes 17 54.8
I do not know 1 3.2
Does not apply 4 12.9
Missing 1 3.2
Total 31 100
Table 120. Response Survey – Question 17
Do you have representatives from other agencies and organizations in your Emergency Operations Center?
Frequency Percent
No 5 16.1
Yes 16 51.6
I do not know 3 9.7
Does not apply 7 22.6
Missing 0 0
Total 31 100
Table 121. Response Survey – Question 18
In your opinion, does your Emergency Operations Center have the necessary resources required to
communicate the impacts of a disaster to decision makers?
(examples: maps, status boards, decision support software, etc.)
Frequency Percent
No 9 29.0
Yes 12 38.7
I do not know 0 0
Does not apply 8 25.8
Missing 2 6.5
Total 31 100
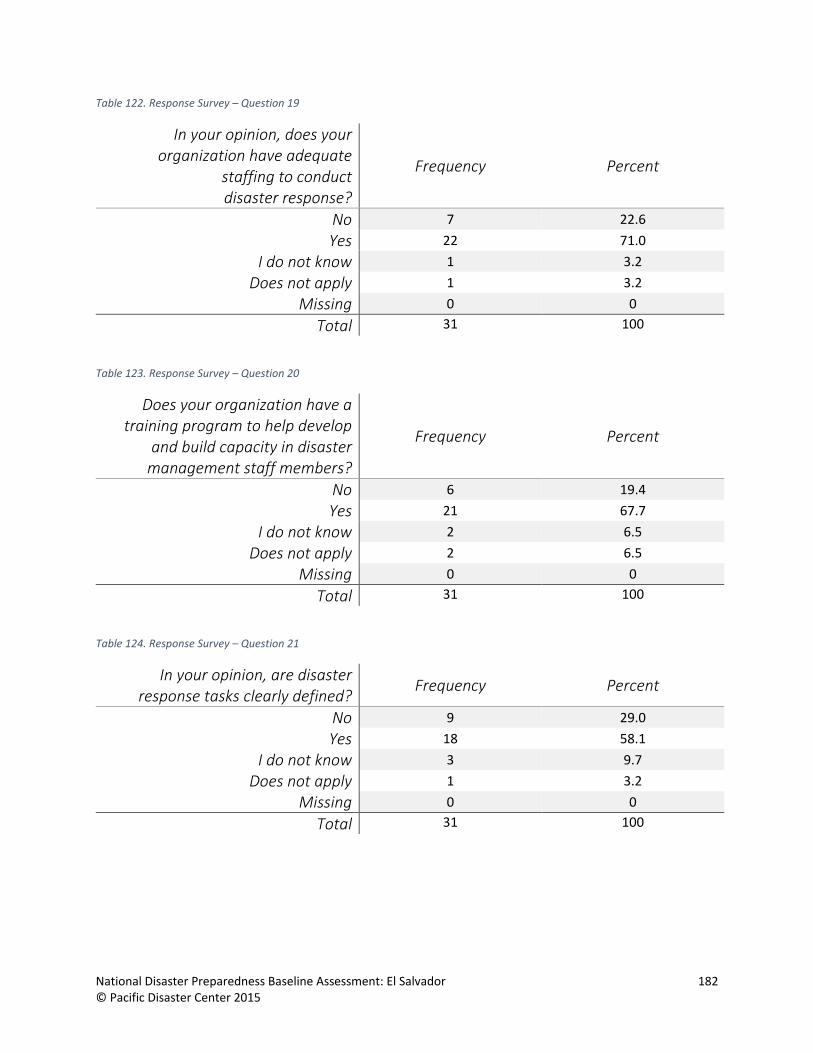
National Disaster Preparedness Baseline Assessment: El Salvador 182 © Pacific Disaster Center 2015
Table 122. Response Survey – Question 19
In your opinion, does your organization have adequate
staffing to conduct disaster response?
Frequency Percent
No 7 22.6
Yes 22 71.0
I do not know 1 3.2
Does not apply 1 3.2
Missing 0 0
Total 31 100
Table 123. Response Survey – Question 20
Does your organization have a training program to help develop
and build capacity in disaster management staff members?
Frequency Percent
No 6 19.4
Yes 21 67.7
I do not know 2 6.5
Does not apply 2 6.5
Missing 0 0
Total 31 100
Table 124. Response Survey – Question 21
In your opinion, are disaster response tasks clearly defined?
Frequency Percent
No 9 29.0
Yes 18 58.1
I do not know 3 9.7
Does not apply 1 3.2
Missing 0 0
Total 31 100
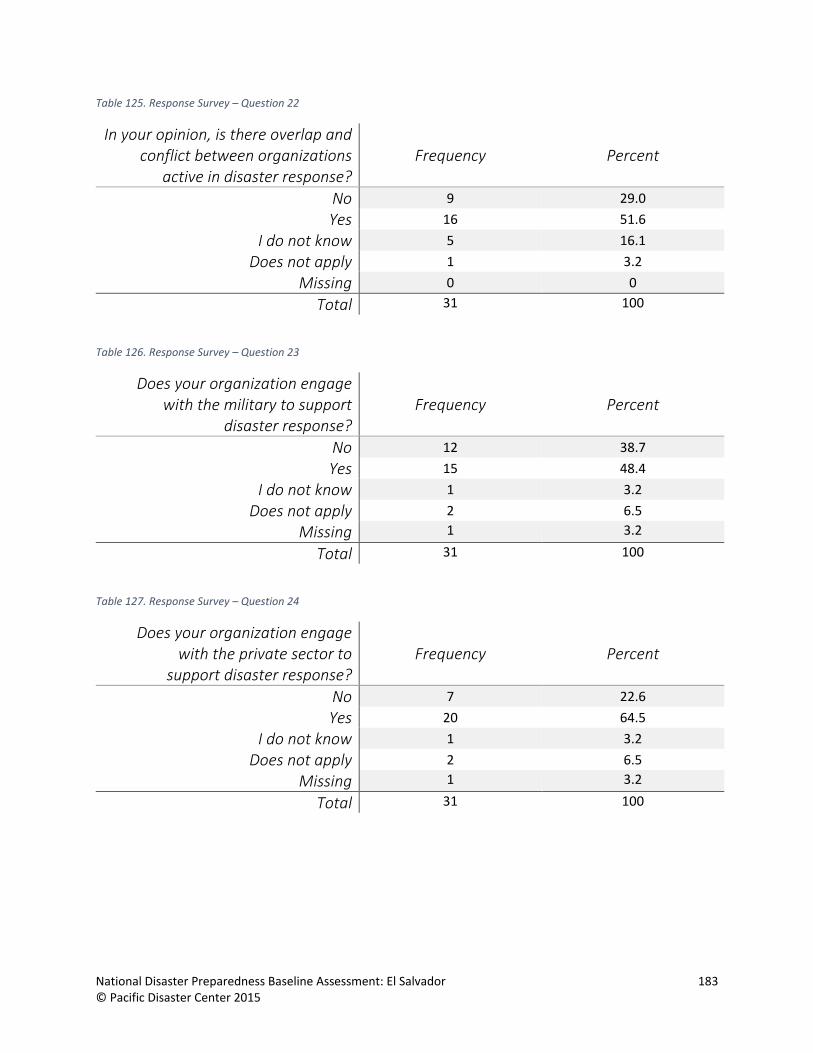
National Disaster Preparedness Baseline Assessment: El Salvador 183 © Pacific Disaster Center 2015
Table 125. Response Survey – Question 22
In your opinion, is there overlap and conflict between organizations
active in disaster response? Frequency Percent
No 9 29.0
Yes 16 51.6
I do not know 5 16.1
Does not apply 1 3.2
Missing 0 0
Total 31 100
Table 126. Response Survey – Question 23
Does your organization engage with the military to support
disaster response? Frequency Percent
No 12 38.7
Yes 15 48.4
I do not know 1 3.2
Does not apply 2 6.5
Missing 1 3.2
Total 31 100
Table 127. Response Survey – Question 24
Does your organization engage with the private sector to
support disaster response? Frequency Percent
No 7 22.6
Yes 20 64.5
I do not know 1 3.2
Does not apply 2 6.5
Missing 1 3.2
Total 31 100

National Disaster Preparedness Baseline Assessment: El Salvador 184 © Pacific Disaster Center 2015
Table 128. Response Survey – Question 25
In your opinion, did your organization respond to the last
major disaster as outlined in policy/governing documents?
Frequency Percent
No 2 6.5
Yes 24 77.4
I do not know 4 12.9
Does not apply 1 3.2
Missing 0 0
Total 31 100

National Disaster Preparedness Baseline Assessment: El Salvador 185 © Pacific Disaster Center 2015
Appendix E: EOC Information
National EOC The national EOC was visited by PDC on 08 June 2015. The facility is in Nejapa, just north of the capital San Salvador and also
serves as the Central Region’s Protección Civil office. Its location was strategically chosen to be adjacent to two major highways
with easy access to and from the capital by staff members during a disaster. The facility was placed out of the flood zone and
away from most hazards within the region. The floor plan and capacity of the building is not sufficient to accommodate the
number of people identified as required staff members for response operations. This operations center conducts 24-hour
monitoring operations. The kitchen is operational but there is no food stored. The warehouse within the compound is
operational and can store disaster response supplies or food. Warehouse is equipped with generator but EOC is not. No
Standard Operation Procedures (SOPs) exists or were not available to PDC staff.
Capabilities The national EOC contains the following:
• Seven Stations, one for each technical commission. Each station has one computer and one landline telephone.
• Two monitor staff stations with computer and landline telephone.
• Four large-screen televisions displaying weather information, volcanic activity, tsunami alerts, and maps via a platform
provided by MARN.
• One UHF radio provides communication capabilities with departmental and municipal EOCs.
• One fax machine provides communication capabilities with regional offices.
Equipment • All Protección Civil employees that work at the EOC have been issued laptops and a cellphone push-to-talk radio.
• The national EOC houses four busses donated by the Japan International Cooperation Agency (JICA). The busses are fully
equipped mobile incident command posts with communications systems, sleeping quarters, and food and water storage. At
the time of PDC’s site visit, the busses had been parked for over a year waiting on license plates and registrations before being
distributed to the other Regional Offices.
• Warehouse contains a forklift and logistics management equipment donated by USSOUTHCOM to manage disaster response
supplies.
Training • National EOC staff have received MACOE (EOC Management) Training which is provided by Protección Civil.
• EOC and Warehouse training provided by USSOUTHCOM.

National Disaster Preparedness Baseline Assessment: El Salvador 186 © Pacific Disaster Center 2015
Santa Ana EOC The Santa Ana EOC was visited by PDC on 08 June 2015. The facility is located in the capital city, Santa Ana, in the department
of Santa Ana. It is approximately 40 miles northwest of the country’s capital San Salvador. It serves as the department and city’s
EOC as well and the Western Region Protección Civil administrative office. The facility does not have a properly functioning
kitchen with no food storage or generator. The warehouse will be equipped with a generator and upon completion the
generator will be moved to the EOC. No Standard Operation Procedures (SOPs) existed or were not available.
Capabilities The Santa Ana EOC contains the following:
• Working stations for technical commissions, however, the stations are not equipped with computers or telephones.
• No display televisions.
• One UHF radio provides communication capabilities with national, departmental and municipal EOCs.
• One fax machine provides communication capabilities with national and regional offices.
Equipment • All Protección Civil employees that work at the EOC have been issued laptops and a cellphone push-to-talk radio.
• One Truck.
• USACE is constructing a warehouse that was donated by the USSOUTHCOM to store disaster response supplies.
Training • National EOC staff have received MACOE (EOC Management) Training, provided by Protección Civil.

National Disaster Preparedness Baseline Assessment: El Salvador 187 © Pacific Disaster Center 2015
San Miguel EOC The San Miguel EOC was visited by PDC on 09 June 2015. The facility is located in the capital city, San Miguel, in the department
of San Miguel. It is approximately 86 miles east of the country’s capital San Salvador. It also serves as the department and city
and the Eastern Region Protección Civil administrative office. The facility is not connected to city water, it has a 5000L water
tank that needs to be filled periodically. A full 5000L tank lasts about five days during normal operations (approximatelly four
people working), in an activated EOC it would probably last about two to three days. Facility does not have a properly functioning
kitchen, there is no food storage or generator. The warehouse will be equipped with a generator and upon completion the
generator will be moved to the EOC. No Standard Operation Procedures (SOPs) existed or were not available.
Capabilities The Santa Ana EOC contains the following:
• Working stations for technical commissions, however, the stations are not equipped with computers or telephones.
• No display televisions.
• One UHF radio provides communication capabilities with national, departmental and municipal EOCs.
• One fax machine provides communication capabilities with national and regional offices.
Equipment • All Protección Civil employees that work at the EOC have been issued laptops and a cellphone push-to-talk radio.
• Three Trucks.
• USACE is constructing a warehouse that was donated by the USSOUTHCOM to store disaster response supplies.
Training
• National EOC staff have received MACOE (EOC Management) Training, provided by Protección Civil.

National Disaster Preparedness Baseline Assessment: El Salvador 188 © Pacific Disaster Center 2015
San Vicente EOC The San Vicente EOC was visited by PDC on 09 June 2015. The facility is located in the capital city, San Vicente, in the
department of San Vicente. It is approximately 39 miles east of the country’s capital San Salvador. It serves as the department
and city EOC and the Paracentral Region Protección Civil administrative office. During the visit it was determined that San
Vicente does not have city water. It uses water from a tank which needs to be filled. During the site visit, there was no water
in the sinks or bathroom, which happens often. The tank is refilled by the Fire Department truck, or one of the employee’s
personal pick-up trucks. A full 5000L tank lasts about five days during normal operations (approximatelly four people working),
in an activated EOC would probably last about two to three days. Facility does not have a properly functioning kitchen, there
is no food storage or generator. The warehouse will be equipped with a generator and upon completion the generator will be moved to the EOC. No Standard
Operation Procedures (SOPs) existed or were not available.
Capabilities The Santa Ana EOC contains the following:
• Working stations for technical commissions, however, the stations are not equipped with computers or telephones.
• No display televisions.
• One UHF radio provides communication capabilities with national, departmental and municipal EOCs.
• One fax machine provides communication capabilities with national and regional offices.
Equipment • All Protección Civil employees that work at the EOC have been issued laptops and a cellphone push-to-talk radio.
• Three Trucks.
• USACE is constructing a warehouse that was donated by the USSOUTHCOM to store disaster response supplies.
Training • National EOC staff have received MACOE (EOC Management) Training, provided by Protección Civil.