national diabetes registry report 2013 - 2019
TRANSCRIPT

National Diabetes Registry Report, 2013-2019Ministry of Health, Malaysia
ii
National DiabetesRegistry Report2013 - 2019
Publ ished by :
9 7 7 2 7 3 5 0 4 8 0 0 8
I SSN 2735- 0487
Disease Control DivisionMinistry of Health Malaysia
Disease Control DivisionMinistry of Health Malaysia
Copyright Ministry of Health MalaysiaAll rights reserved.
First Edition 2020Suggested CitationMinistry of Health Malaysia 2020. National Diabetes Registry Report 2013-2019
Authors:
Dr Arunah Chandran, Public Health Physician, Disease Control DivisionEn Mohd Nazri Abdullah, Assistant Medical Officer, Disease Control DivisionPn Fathilah Abdul, Public Health Matron, Disease Control Division
Published ByNon Communicable Disease SectionDisease Control DivisionMinistry of HealthLevel 2, Block E3, Complex E62590 Putrajaya
Tel: 03-88924413Website: www.moh.gov.my
National Diabetes Registry Report, 2013-2019Ministry of Health, Malaysia
iiiiii
Contents1 Executive Summary 1
2 Abbreviations 2
3 Definitions 2
4 Reviewers 3
5 Acknowledgements 3
6 Introduction 5
Burden of Diabetes 5
About this Report 5
About the National Diabetes Registry 6
National Diabetes Registry Components 6
7 Methodology 7
Site selection criteria 7
Patient selection criteria 7
Data collection 7
Statistical Methods 7
Clinical Setting 8
8 Findings 9
Patient Population 9
Comorbidities and Complications 13
Clinical Investigations 16
Clinical Target Achievement 19
Drug Treatment 24
9 Coverage of and Quality of Registration in NDR 27
10 Conclusions 28
National Diabetes Registry Report, 2013-2019Ministry of Health, Malaysia
iv
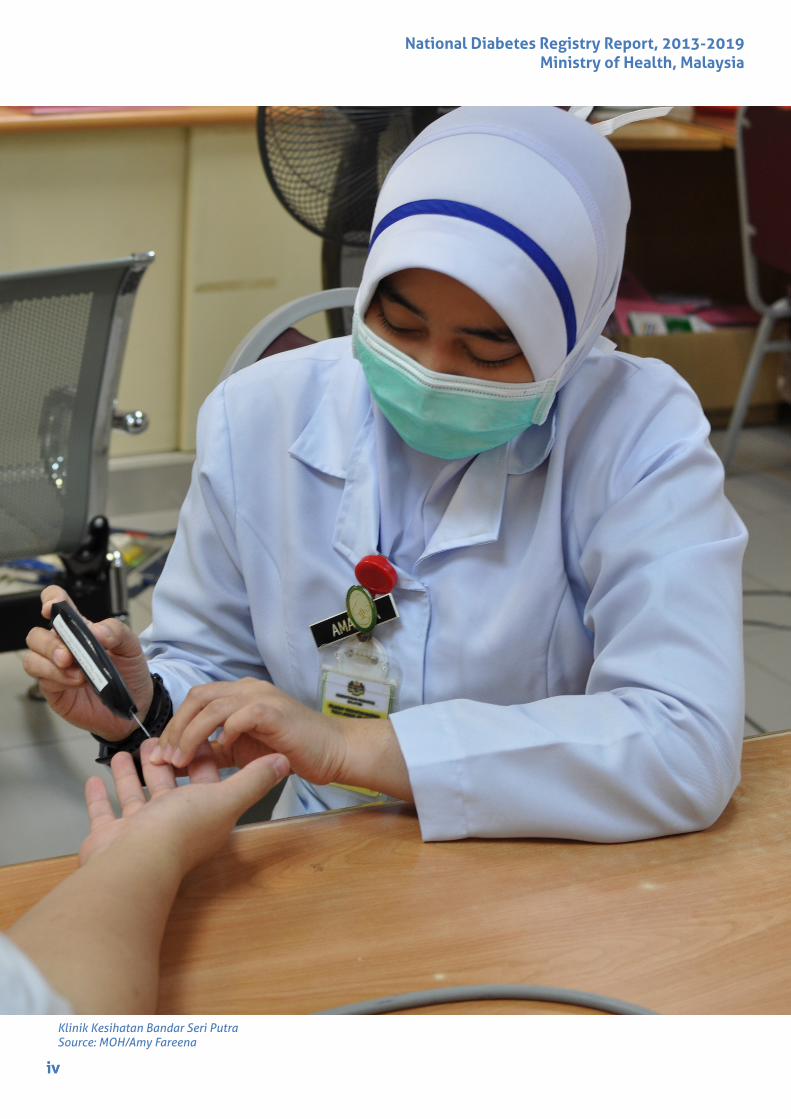
Klinik Kesihatan Bandar Seri PutraSource: MOH/Amy Fareena
iv

National Diabetes Registry Report, 2013-2019Ministry of Health, Malaysia
1
Executive SummaryGlobally, around 463 million people live with diabetes, while in Malaysia, it is estimated that
3.9 million (18.3%) of the adult population had raised blood sugar in 2019. These numbers are expected to grow. The National Diabetes Registry (NDR) was established to monitor clinical outcomes of diabetes patients managed at the Ministry of Health (MOH) primary health clinics. The NDR began in 2009 and is monitored via a web-based data collection system since 2011. All patients receiving diabetes care at participating KKs are required to be registered into the NDR, and the patient’s status is regularly updated. A proportion of patient records are audited annually, and the clinical and treatment information is captured in NDR. This report analyzes and evaluates the clinical outcome, treatment, and complications among audited diabetes patient records for 2013 – 2019.
According to the registry dataset, there were 1,614,363 patients registered in the NDR, of which 99.3% were diagnosed with T2DM. The mean age of T2DM patients in the NDR was 63 years old, and the mean age at diagnosis for T2DM patients was 53 years old. The majority of patients were female (57.1%) and Malay (59.2%). As of 2019, there were 897,421 active diabetes patients in the NDR.
From the findings of the clinical audit, the mean HbA1c for 2013-2019 ranged from 7.9% to 8.1%. The overall trend of patients achieving the Malaysian glycaemic target of HbA1c ≤6.5% gradually increased over the years. In 2019, 32.41% patients achieved the target, an increase from 31.42% in 2018. Variation could be observed between states for the target achievements.
This report also found that the overall trend for comorbidities, including hypertension and dyslipidemia, increased from 2013 to 2019. Based on audited patients for 2019, 80.4% had hypertension, and 74.3% had dyslipidaemia. As for total complications reported in 2019, 14.6% of patients had diagnosed nephropathy, 10.6% had presence of retinopathy and 5.9% were reported to have Ischaemic Heart Disease.
Metformin was the most common OAD used among T2DM patients, followed by sulphonylureas. Insulin use has increased consistently, with 23.1% of patients treated with insulin in 2013 compared to 30.3% in 2019. Calcium Channel blockers (57.7%) and ACE-inhibitors (51.8%) were the most commonly used anti-hypertensive in 2019 whereas acetyl salicylic acid (19.2%) and statins (79.7%) were the most commonly used anti-platelet and anti-lipid drugs.
From 2013 to 2019, there are progresses made in terms of treatment target achievement and insulinisation among MOH patients with T2DM. There are several limitations to the NDR data. The NDR relies on the quality of documentation at the primary health clinics. KKs. In order to limit the burden of data collection, NDR audit is conducted via random sampling via a web-based data entry system. Automatized random sampling has also enabled useful data collection and tracking with relatively minimal effort.
1
1
National Diabetes Registry Report, 2013-2019Ministry of Health, Malaysia
2
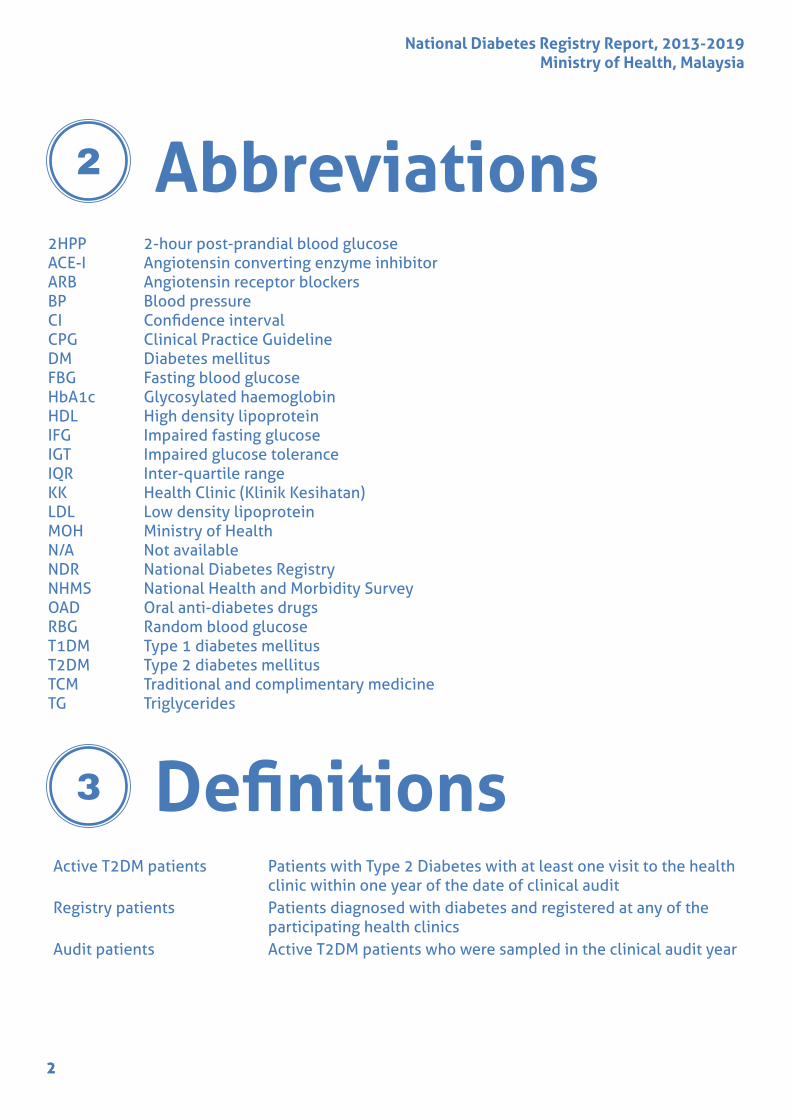
Abbreviations2HPP 2-hour post-prandial blood glucose ACE-I Angiotensin converting enzyme inhibitorARB Angiotensin receptor blockers BP Blood pressureCI Confidence intervalCPG Clinical Practice GuidelineDM Diabetes mellitusFBG Fasting blood glucoseHbA1c Glycosylated haemoglobinHDL High density lipoproteinIFG Impaired fasting glucoseIGT Impaired glucose toleranceIQR Inter-quartile rangeKK Health Clinic (Klinik Kesihatan)LDL Low density lipoproteinMOH Ministry of HealthN/A Not availableNDR National Diabetes RegistryNHMS National Health and Morbidity SurveyOAD Oral anti-diabetes drugsRBG Random blood glucoseT1DM Type 1 diabetes mellitusT2DM Type 2 diabetes mellitusTCM Traditional and complimentary medicine TG Triglycerides
DefinitionsActive T2DM patients Patients with Type 2 Diabetes with at least one visit to the health
clinic within one year of the date of clinical auditRegistry patients Patients diagnosed with diabetes and registered at any of the
participating health clinicsAudit patients Active T2DM patients who were sampled in the clinical audit year
2
3
2

National Diabetes Registry Report, 2013-2019Ministry of Health, Malaysia
3
ReviewersDr Feisul Idzwan Mustapha, Deputy Director, Disease Control DivisionDr Rosnah Ramly, Head of Sector, CVD-DM-Cancer, Disease Control DivisionDr Noor Hashimah Abdullah, Public Health Physician, Kelantan State Health DepartmentDr Norma Sabtu, Public Health Phyisician, Melaka State Health DepartmentDr Nik Harlina Roza Nik Kazim, Family Medicine Specialist, Clinic Wakaf Bharu, KelantanDr Norzaihan Hassan, Family Medicine Specialist, Clinic Bandar Kota Bharu, KelantanDr Nurhaliza Zakariah, Public Health Physician, Disease Control Division
Acknowledgements
A special thanks to the staff of all the participating KKs for their dedication and support in the implementation of the registry. The NDR database and this report would not have been possible without their significant contribution. It is hoped that the clinic teams have found the data useful enabling them to observe improvements as well as monitor performance at the clinic level.
We would also like to extend our gratitude to all State NCD Epidemiology Officers who have contributed their time and thoughts to making the annual clinical audit a successful one over the years.
4
5
Klinik Kesihatan Bandar Seri PutraSource: MOH/Amy Fareena
33
National Diabetes Registry Report, 2013-2019Ministry of Health, Malaysia
4
Klinik Kesihatan Bandar Seri PutraSource: MOH/Amy Fareena
44

National Diabetes Registry Report, 2013-2019Ministry of Health, Malaysia
5
IntroductionBurden of Diabetes
20
18
16
14
12
10
8
6
4
2
02011 2015 2019
Figure 1 Prevalence of Overall Diabetes (≥7 mmol/L) in adults aged 18 years and above
Data from NHMS 2019 also shows that about 74.3% of patients diagnosed with diabetes seek treatment primarily at public primary care facilities, while the remaining seek treatment in public hospitals, private general practitioners, take complementary and alternative medicines as the primary mode of treatment, and self-medicate.
About this Report
This publication is the second National Diabetes Registry (NDR) report since the establishment of the registry. It is intended to share the data contained within the NDR for clinicians, public health specialists and researchers and all those who are interested in the clinical management of diabetes.
6
5

National Diabetes Registry Report, 2013-2019Ministry of Health, Malaysia
6
About the National Diabetes Registry
The objectives of the NDR are:
• To enable tracking of glycaemic control and clinical outcomes of patients with diabetes managed at MOH health clinics
• To enable comparisons over time and across geographical locations• Enable research to improve the quality of care provided to patients
The Diabetes Clinical Audit is conducted on randomly sampled active Type 2 Diabetes Mellitus (T2DM) patients on follow-up at MOH health clinics. Universal data entry for clinical variables is not currently feasible as the medical records in the majority of MOH health clinics are still paper-based.
The NDR has allowed greater efficiency to conduct the annual Clinical Audit of diabetes. The NDR has been a collaborative effort among MOH health clinics and hospitals that leverages upon existing data collection reqirements and processes. The registry is a useful tool to better understand patterns of disease and clinical management of patients managed within the MOH in order to reduce complications and improve patient management and future outcomes.
National Diabetes Registry Components
The NDR contains information on patients with diabetes managed at participating MOH health clinics (klinik kesihatan or KKs) and consists of two related components: (i) patient registry and (ii) clinical audit datasets.
As baseline information, the NDR collects basic socio-demographic information, clinical and outcome data of all patients with DM managed in MOH health clinics and selected hospitals in the patient registry. At the end of December 2019, the patient registry contained 1.61 million patient records.
The audit dataset is a subset of the patient registry. On an annual basis, T2DM patients from the registry are randomly selected for auditing for clinical variables. The clinical audit dataset has more complete information as it captures clinical variables, drug use and outcomes of care data for audited patients. The clinical audit is performed on active patients in the NDR since 2009.
6
National Diabetes Registry Report, 2013-2019Ministry of Health, Malaysia
7
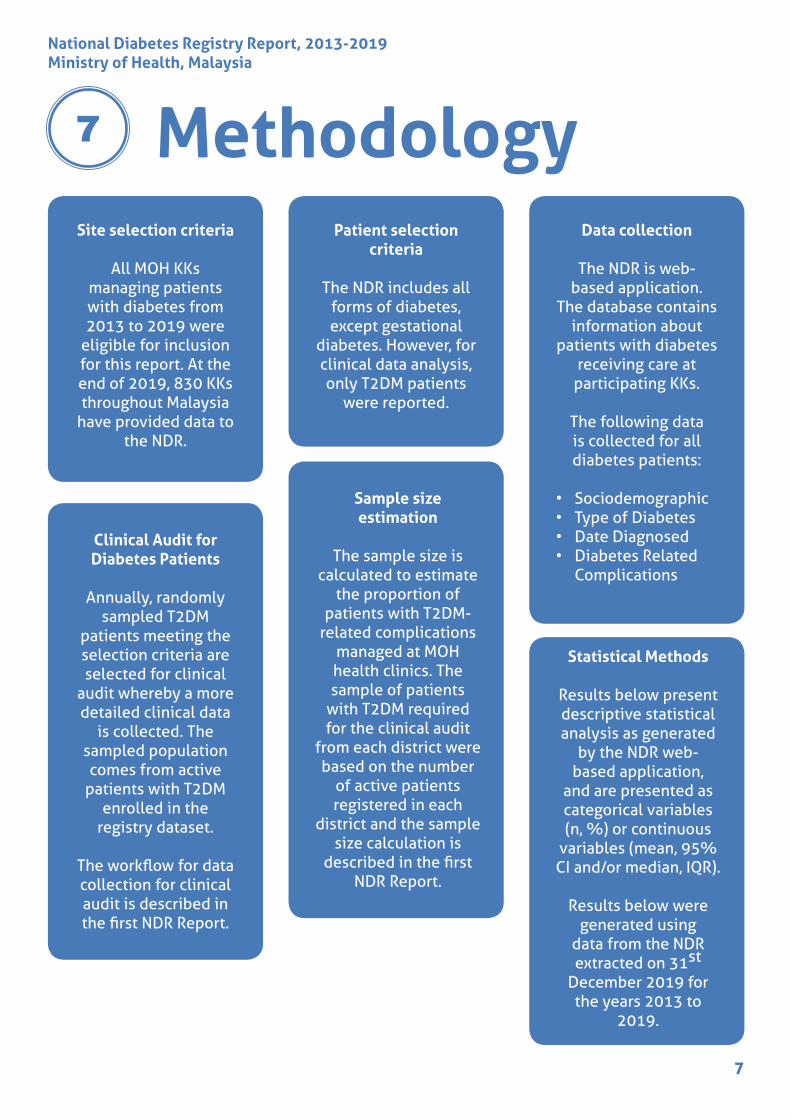
MethodologySite selection criteria
All MOH KKs managing patients with diabetes from 2013 to 2019 were
eligible for inclusion for this report. At the end of 2019, 830 KKs throughout Malaysia
have provided data to the NDR.
Clinical Audit for Diabetes Patients
Annually, randomly sampled T2DM
patients meeting the selection criteria are selected for clinical
audit whereby a more detailed clinical data
is collected. The sampled population comes from active
patients with T2DM enrolled in the
registry dataset.
The workflow for data collection for clinical audit is described in the first NDR Report.
Patient selection criteria
The NDR includes all forms of diabetes, except gestational
diabetes. However, for clinical data analysis, only T2DM patients
were reported.
Sample size estimation
The sample size is calculated to estimate
the proportion of patients with T2DM-
related complications managed at MOH health clinics. The sample of patients
with T2DM required for the clinical audit
from each district were based on the number
of active patients registered in each
district and the sample size calculation is
described in the first NDR Report.
Data collection
The NDR is web-based application.
The database contains information about
patients with diabetes receiving care at
participating KKs.
The following data is collected for all diabetes patients:
• Sociodemographic• Type of Diabetes• Date Diagnosed• Diabetes Related
Complications
Statistical Methods
Results below present descriptive statistical analysis as generated
by the NDR web-based application,
and are presented as categorical variables (n, %) or continuous
variables (mean, 95% CI and/or median, IQR).
Results below were generated using
data from the NDR extracted on 31st
December 2019 for the years 2013 to
2019.
7
7

National Diabetes Registry Report, 2013-2019Ministry of Health, Malaysia
8
Clinical Setting
In the reporting period ending 2019, a total of 830 government health clinics (KKs) from all states in Malaysia submitted data to the NDR. The distribution of KKs providing data to the NDR by state is shown in Table 1 below.
Table 1Distribution of KKs enrolled in the NDR registry by state, 2019
State Number of KKs
Johor 94
Kedah 56
Kelantan 64
Melaka 29
Negeri Sembilan 49
Pahang 79
Perak 76
Perlis 10
Pulau Pinang 28
Sabah 69
Sarawak 141
Selangor 70
Terengganu 47
Wilayah Persekutuan Kuala Lumpur 13
Wilayah Persekutuan Labuan 1
Wilayah Persekutuan Putrajaya 4
Malaysia 830
8

National Diabetes Registry Report, 2013-2019Ministry of Health, Malaysia
9
Findings
1,614,363patients enrolled in the registry
897,421active diabetes patients in the NDR
0.62%Type 1 Diabetes Mellitus (T1DM)
patients
99.29%Type 2 Diabetes Mellitus (T2DM)
patients
59.15%Malay
19.62%Chinese
13.17%Indian
8.05%Others
Ethnicity
Sex
0.09%Other forms of DM
patients
42.9%Male
57.1%Female
Patient PopulationAt the end of the reporting year for 2019, there were a total of 1,614,363 patients enrolled in the registry and there were 897,421 active diabetes patients in the NDR. Nearly all the patients enrolled in the NDR were diagnosed with T2DM. At of end of 2019, patients diagnosed with Type 1 Diabetes Mellitus (T1DM) or other forms of DM comprised only 0.62% and 0.09% repectively.
The characteristics of patients are shown in Table 2. There were 42.9% men and 57.1% women respectively. The ethnic distribution was as follows: Malay 59.15%, Chinese 19.62%, Indians 13.17%, and others at 8.05%.
8
9

National Diabetes Registry Report, 2013-2019Ministry of Health, Malaysia
10
Table 2Characteristics of Patients enrolled in National Diabetes Registry, 2019 [Registry Dataset]
Variable n %
Sex
Male 692,595 42.90
Female 921,768 57.10
Total 1,614,363 100.00
Ethnicity
Malay 954,938 59.15
Chinese 316,758 19.62
Indian 212,681 13.17
Others 129,986 8.05
Total 1,614,363 100.00
Age Group (at Enrollment, years)
<18 5,030 0.31
18-19 2,524 0.16
20-24 10,402 0.64
25-29 26,923 1.67
30-34 56,439 3.50
35-39 99,400 6.16
40-44 162,277 10.05
45-49 227,109 14.07
50-54 277,844 17.21
55-59 267,850 16.59
60-64 205,301 12.72
65-69 137,012 8.49
70-74 79,966 4.96
75-79 38,448 2.38
>80 17,838 1.11
Total 1,614,363 100.00
Type of Diabetes
Type 2 1,602,882 99.29
Type 1 10,086 0.62
Others/Unknown 1,395 0.09
Total 1,614,363 100.00
10

National Diabetes Registry Report, 2013-2019Ministry of Health, Malaysia
11
The age at diagnosis of patients with diabetes is reported below (Table 3). The mean age of diagnosis of T2DM patients registered in the NDR was 53 years.
Table 3 Age at Diagnosis of Type 2 Diabetes Patients (in years) [Registry Dataset]
Age at Diagnosis
Mean age (95%CI) 53 (53.2-53.3)
Median 53
Inter-Quartile range 15.0
As shown in Figure 2 below, most of the patients in the NDR were diagnosed between the age of 50-54 (17.2%) years old, followed by the 55-59 (16.6%) years and the 45-49 (14.1%) years age group.
300000
250000
200000
150000
100000
50000
0
< 18
18-1
9
20-2
4
25-2
9
30-3
4
35-3
9
40-4
4
45-4
9
50-5
4
55-5
9
60-6
4
65-6
9
70-7
4
75-7
9
> 80
Figure 2Distribution of T2DM patients according to age at diagnosis [Registry Dataset]
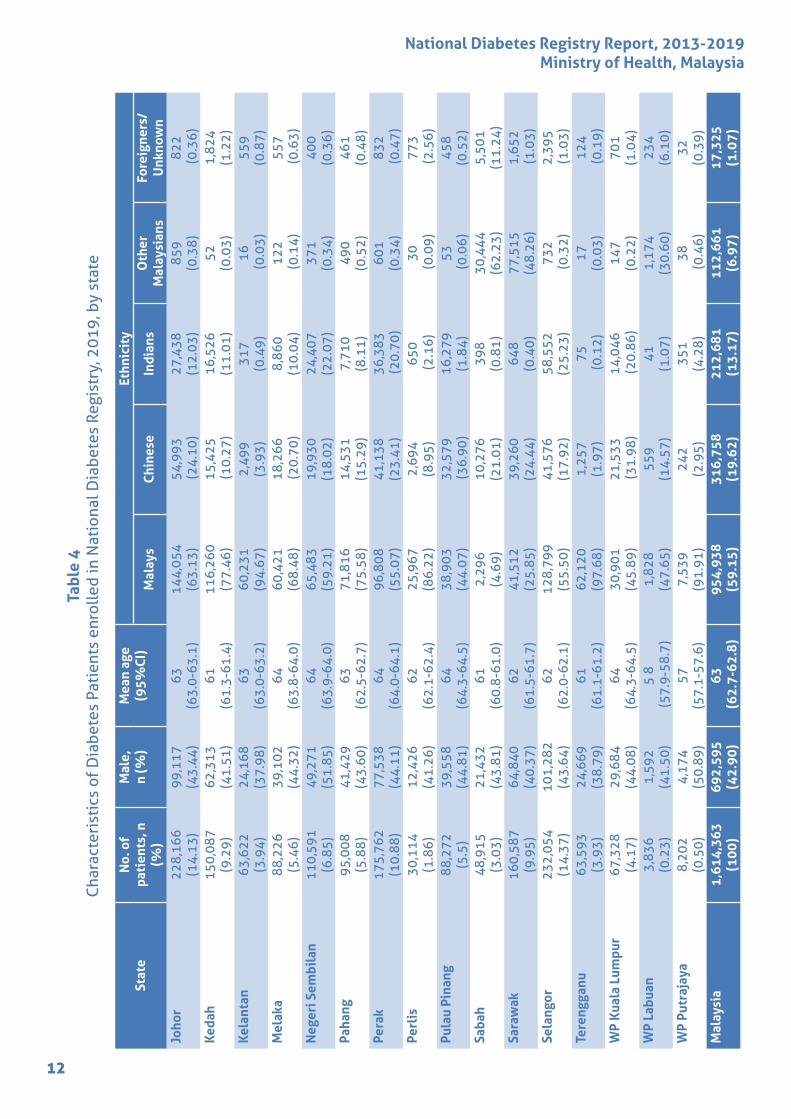
The characteristics of patients according to states are shown in Table 4. In all states except WP Putrajaya and Negeri Sembilan, there were more females than males with diabetes who were registered in the NDR. The mean age ranged between 57 to 64 years.
11
National Diabetes Registry Report, 2013-2019Ministry of Health, Malaysia
12
Tabl
e 4
Cha
ract
eris
tics
of
Dia
bete
s Pa
tien
ts e
nrol
led
in N
atio
nal D
iabe
tes
Regi
stry
, 201
9, b
y st
ate
Stat
eN
o. o
f pa
tien
ts, n
(%
)
Mal
e,
n (%
)M
ean
age
(95%
CI)
Ethn
icit
y
Mal
ays
Chin
ese
Indi
ans
Oth
er
Mal
aysi
ans
Fore
igne
rs/
Unk
now
nJo
hor
228,
166
(14.
13)
99,1
17
(43.
44)
63
(63.
0-63
.1)
144,
054
(63.
13)
54,9
93 (2
4.10
)27
,438
(1
2.03
)85
9 (0
.38)
822
(0.3
6)Ke
dah
150,
087
(9.2
9)62
,313
(4
1.51
)61
(6
1.3-
61.4
)11
6,26
0(7
7.46
)15
,425
(10.
27)
16,5
26
(11.
01)
52
(0.0
3)1,
824
(1.2
2)Ke
lant
an63
,622
(3
.94)
24,1
68
(37.
98)
63
(63.
0-63
.2)
60,2
31(9
4.67
)2,
499
(3.9
3)31
7 (0
.49)
16 (0
.03)
559
(0.8
7)M
elak
a88
,226
(5
.46)
39,1
02
(44.
32)
64
(63.
8-64
.0)
60,4
21(6
8.48
)18
,266
(20.
70)
8,86
0 (1
0.04
)12
2 (0
.14)
557
(0.6
3)N
eger
i Sem
bila
n11
0,59
1 (6
.85)
49,2
71
(51.
85)
64
(63.
9-64
.0)
65,4
83(5
9.21
)19
,930
(1
8.02
)24
,407
(2
2.07
)37
1 (0
.34)
400
(0.3
6)Pa
hang
95,0
08
(5.8
8)41
,429
(4
3.60
)63
(6
2.5-
62.7
)71
,816
(75.
58)
14,5
31
(15.
29)
7,71
0 (8
.11)
490
(0.5
2)46
1 (0
.48)
Pera
k17
5,76
2 (1
0.88
)77
,538
(4
4.11
)64
(6
4.0-
64.1
)96
,808
(55.
07)
41,1
38
(23.
41)
36,3
83 (2
0.70
)60
1 (0
.34)
832
(0.4
7)Pe
rlis
30,1
14
(1.8
6)12
,426
(4
1.26
)62
(6
2.1-
62.4
)25
,967
(86.
22)
2,69
4 (8
.95)
650
(2.1
6)30
(0.0
9)77
3 (2
.56)
Pula
u Pi
nang
88,2
72
(5.5
)39
,558
(4
4.81
)64
(6
4.3-
64.5
)38
,903
(44.
07)
32,5
79 (3
6.90
)16
,279
(1
.84)
53 (0
.06)
458
(0.5
2)Sa
bah
48,9
15
(3.0
3)21
,432
(4
3.81
)61
(6
0.8-
61.0
)2,
296
(4.6
9)10
,276
(2
1.01
)39
8 (0
.81)
30,4
44
(62.
23)
5,50
1 (1
1.24
)Sa
raw
ak16
0,58
7 (9
.95)
64,8
40
(40.
37)
62
(61.
5-61
.7)
41,5
12(2
5.85
)39
,260
(2
4.44
)64
8 (0
.40)
77,5
15
(48.
26)
1,65
2 (1
.03)
Sela
ngor
232,
054
(14.
37)
101,
282
(43.
64)
62
(62.
0-62
.1)
128,
799
(55.
50)
41,5
76
(17.
92)
58,5
52
(25.
23)
732
(0.3
2)2,
395
(1.0
3)Te
reng
ganu
63,5
93
(3.9
3)24
,669
(3
8.79
)61
(6
1.1-
61.2
)62
,120
(97.
68)
1,25
7 (1
.97)
75 (0
.12)
17
(0.0
3)12
4 (0
.19)
WP
Kua
la L
umpu
r67
,328
(4
.17)
29,6
84
(44.
08)
64
(64.
3-64
.5)
30,9
01(4
5.89
)21
,533
(31.
98)
14,0
46 (2
0.86
)14
7 (0
.22)
701
(1.0
4)W
P La
buan
3,83
6 (0
.23)
1,59
2 (4
1.50
)5
8 (5
7.9-
58.7
)1,
828
(47.
65)
559
(14.
57)
41
(1.0
7)1,
174
(30.
60)
234
(6.1
0)W
P Pu
traj
aya
8,20
2 (0
.50)
4,17
4 (5
0.89
)57
(5
7.1-
57.6
)7,
539
(91.
91)
242
(2.9
5)35
1 (4
.28)
38 (0
.46)
32
(0.3
9)M
alay
sia
1,61
4,36
3 (1
00)
692,
595
(42.
90)
63 (6
2.7-
62.8
)95
4,93
8 (5
9.15
)31
6,75
8 (1
9.62
)21
2,68
1 (1
3.17
)11
2,66
1 (6
.97)
17,3
25
(1.0
7)
12

National Diabetes Registry Report, 2013-2019Ministry of Health, Malaysia
13
Comorbidities and ComplicationsTable 5 below shows the presence of co-morbidities and complications among diabetes patients in the clinical audit dataset.
The prevalence of hypertension among T2DM patients has steadily increased from 72.9% in 2013 to 80.4% in 2019. Similarly, the prevalence of dyslipidaemia has also increased from 59.8% in 2013 to 74.3% in 2019.
Retinopathy among diabetes patients has increased from 7.2% in 2013 to 10.6% in 2019. Similarly, nephropathy has increased from 8.8% in 2013 to 14.6% in 2019. The prevalence of erectile dyfunction among the men screened increased steadily from 8.3% in 2013 to 14.5% in 2019. The proportion of patients with diabetic foot ulcers remained static at 1.2 to 1.3% over the six years, similarly for the proportion of patients with amputations (0.6 to 0.7%). The proportion of patients with IHD had increased slightly from 5.4% in 2013 to 5.9% in 2019. The prevalence of cerebrovascular disease similarly increased slightly from 1.3% in 2013 to 1.8% in 2019.
The accuracy of data on diabetes-related complications in the NDR has improved from the previous report, whereby the proportion of ‘unknown’ complications have reduced over the years. In 2019, the proportion of unknown for each of the conditions only ranged between 1.6 to 2.3%.
The accuracy of data on diabetes-related complications in the NDR still needs further work. In particular, the prevalence of diabetic foot ulcer is unexpectedly low in the dataset. Considering that this is a microvascular complication, it should at least match or exceed the prevalence of retinopathy and nephropathy. This could be explained by the high proportion of patients with “unknown” complications status in Table 4, i.e. the rates of unknown complications in 2012 were 12.3% for nephropathy, 15.2% for retinopathy, 12.8% for IHD, 12.5% for cerebrovascular disease, 11.1% for diabetic foot ulcer and 11.0% for amputation.
Klinik Kesihatan GemenchehSource: MOH/IhsanTahir
1313

National Diabetes Registry Report, 2013-2019Ministry of Health, Malaysia
14
Table 5 Complications and co-morbidities in 2013 to 2019 [Audit Dataset]
Co-morbidities2013 2014 2015 2016 2017 2018 2019
n (%)
No. of patients audited 120,518 113,071 152,528 161,778 167,313 157,787 181,634
Hypertension
Yes 87,944 (72.9)
83,535 (73.9)
113 121 (74.2)
122 769 (75.9)
129 948 (77.7)
123 904 (78.5)
146,032 (80.4)
No 26,656 (22.1)
25,353 (22.4)
35 142 (23.0)
36 252 (22.4)
35 534 (21.2)
32 576 (20.6)
34,721 (19.1)
Unknown 5,918 (4.9)
4,183 (3.7)
4 265 (2.8)
2 757 (1.7)
1 831 (1.1)
1 307 (0.8)
881 (0.5)
Dyslipidaemia
Yes 72,031 (59.8)
70,468 (62.3)
97,954 (64.2)
109,357 (67.6)
118,115 (70.6)
112,348 (71.2)
135,015 (74.3)
No 39,966 (33.2)
36,371 (32.2)
48,504 (31.8)
48,756 (30.1)
46,611 (27.9)
43,580 (27.6)
45,308 (24.9)
Unknown 8,521 (7.1)
6,232 (5.5)
6,070 (3.9)
3,665 (2.3)
2,587 (1.5)
1,859 (1.2)
1,311 (0.7)
Complications2013 2014 2015 2016 2017 2018 2019
n (%)
Present 10,658 (8.8)
10,278 (9.1)
14,875 (9.7)
16,898 (10.4)
18,862 (11.3)
18,846 (11.9)
26,434 (14.6)
Absent 94,761 (78.6)
91,662 (81.1)
127,487 (83.6)
138,112 (85.4)
143,398 (85.7)
135,111 (85.6)
152,245 (83.8)
Unknown 15,099 (12.5)
11,131 (9.8)
10,166 (6.7)
6,768 (4.2)
5,053 (3.0)
3,830 (2.4)
2,955 (1.6)
Retinopathy
Present 8,687 (7.2)
8,743 (7.7)
12,837 (8.4)
14,836 (9.2)
16,046 (9.6)
15,397 (9.8)
19,246 (10.6)
Absent 93,122 (77.3)
89,752 (79.4)
125,598 (82.3)
137,294 (84.8)
144,104 (86.1)
137,285 (87.0)
158,200 (87.0)
Unknown 18,709 (15.5)
14,576 (12.9)
14,093 (9.2)
9,648 (6.0)
7,163 (4.3)
5,105 (3.2)
4,188 (2.3)
14

National Diabetes Registry Report, 2013-2019Ministry of Health, Malaysia
15
Ischaemic Heart Disease
Present 6,463 (5.4)
5,480 (4.8)
7,926 (5.2)
8,387 (5.2)
8,782 (5.2)
8,235 (5.2)
10,660 (5.9)
Absent 98,353 (81.6)
95,851 (84.8)
133,502 (87.5)
145,995 (90.2)
153,163 (91.5)
145,606 (92.3)
167,790 (92.3)
Unknown 15,702 (13.0)
11,740 (10.4)
11,100(7.3)
7,396 (4.6)
5,368 (3.2)
3,946 (2.5)
3,184 (1.8)
Cerebrovascular Disease
Present 1,614 (1.3)
1,506 (1.3)
2,096 (1.4)
2,346 (1.5)
2,690 (1.6)
2,596(1.6)
3,248 (1.8)
Absent 103,683 (86.0)
100,043 (88.5)
139,699 (91.6)
152,447 (94.2)
159,457 (95.3)
151,285 (95.9)
175,207 (96.5)
Unknown 15,221 (12.6)
11,522 (10.2)
10,733 (7.0)
6,985 (4.3)
5,166 (3.1)
3,906 (2.5)
3,179 (1.8)
Diabetic Foot Ulcer
Present 1,520 (1.3)
1,400 (1.2)
2,052 (1.3)
2,154 (1.3)
2,181 (1.3)
2,010 (1.3)
2,230 (1.2)
Absent 105,440 (87.4)
101,701 (89.9)
141,465 (92.7)
153,769 (95.0)
160,665 (96.0)
152,313 (96.5)
176,578 (97.2)
Unknown 13,558 (11.3)
9,970 (8.8)
9,011 (5.9)
5,855 (3.6)
4,467 (2.7)
3,464 (2.2)
2,826 (1.6)
Amputation
Present 752 (0.6)
738 (0.7)
947 (0.6)
1,081 (0.7)
1,158 (0.7)
1,104 (0.7)
1,230 (0.7)
Absent 106,303 (88.2)
102,520 (90.6)
142,601 (93.5)
154,888 (95.7)
161,850 (96.7)
153,208 (97.1)
177,554 (97.7)
Unknown 13,463 (11.2)
9,813 (8.7)
8,980 (5.9)
5,809 (3.6)
4,305 (2.6)
3,475 (2.2)
2,850 (1.6)
Erectile Dysfunction
Abnormal 1,348 (8.3)
1,470 (8.4)
1,375 (7.1)
2,066 (9.7)
2,132 (9.8)
2,369(10.9)
3,651 (14.5)
Normal 14,949 (91.7)
16,014 (91.6)
18,079 (92.9)
19,127 (90.3)
19,536 (90.2)
19,300 (89.1)
21,457 (85.5)
Total male tested / Total male audited
16,297/47,251
17,484/44,033
19,454/59,003
21,193/62,391
21,668/63,954
21,669/60,160
25,108/69,586
15

National Diabetes Registry Report, 2013-2019Ministry of Health, Malaysia
16
Clinical Investigations Table 6 shows the proportion of patients who had routine clinical tests performed. Overall, the proportions of patients receiving clinical investigations have improved from 2013 to 2019.
Annually, the proportion of patients whose blood pressure (BP) was recorded increased from 92.7% in 2013 to 95.9% in 2019. The proportion of patients who had at least one HbA1c test done annually also increased from 77.4% in 2013 to 91.4% in 2019. Other parameters related to blood glucose are as shown in Table 6.
Blood creatinine examination for diabetes patients increased from 78.1% in 2013 to 86.9% in 2019. Patients tested for Total cholesterol has also increased from 78.6% in 2013 to 86.9% in 2019. Similarly, for other blood cholesterols, the proportion has steadily increased.
The proportion of patients tested for urine protein has increased from 67.5% in 2013 to 73.2% in 2019. In 2013, 73.8% of patients had a foot examination and this proportion increased to 78.5% in 2019. In 2013, only 48.4% of patients had fundus examination and this proportion increased to 58.7% in 2019. In 2012, 56.5% of patients had an ECG performed as compared to 61.2% in 2019.
Despite urine dipstick being easily available, inexpensive and yields quick results, the testing rates remains sub-optimal. Similarly, for foot examination, defined in the NDR as visual inspection of the feet, the screening rates remain sub-optimal. The increase in fundus examination is however, reassuring.
Blood Pressure Foot examBlood creatinine Fundus examCholesterol ECGUrine protein
92.7%2013
73.8%2013
78.1%2013
48.4%2013
78.6%2013
56.5%2013
67.5%2013
95.9%2019
78.5%2019
86.9%2019
58.7%2019
86.9%2019
61.2%2019
73.2%2019
16

National Diabetes Registry Report, 2013-2019Ministry of Health, Malaysia
17
Tabl
e 6
Prop
orti
on o
f pa
tien
ts re
ceiv
ing
clin
ical
inve
stig
atio
ns in
201
3 to
201
9
Inve
stig
atio
n n
(%)
2013
2014
2015
2016
2017
2018
2019
BP11
1,67
9 (9
2.7)
105,
446
(93.
3)13
6,99
7 (8
9.8)
148,
098
(91.
5)15
6,62
4 (9
3.6)
149,
924
(95.
0)17
4,34
0 (9
5.9)
HbA
1c93
,257
(7
7.4)
89,7
73(7
9.4)
118,
488
(77.
7)13
4,26
7 (8
2.9)
142,
644
(85.
3)14
1,00
7 (8
9.4)
165,
962
(91.
4)
FBG
74,7
23
(62.
0)72
,628
(6
4.2)
88,2
48
(57.
9)93
,887
(5
8.0)
96,5
01
(57.
7)94
,059
(5
9.6)
109,
887
(60.
5)
RBG
69,5
00
(57.
7)63
,178
(55.
9)86
,388
(5
6.6)
95,6
79
(59.
1)10
0,06
9 (5
9.8)
95,1
34
(60.
3)10
9,68
9 (6
0.3)
2HPP
5,02
9 (4
.2)
4,99
6 (4
.4)
6,88
0 (4
.5)
5,68
0 (3
.5)
4,92
1 (2
.9)
3,58
8 (2
.3)
3,76
3 (2
.1)
Cre
atin
ine
94,0
72
(78.
1)90
,405
(7
9.9)
116,
945
(76.
7)12
9,24
1 (7
9.9)
136,
670
(81.
7)13
2,96
1 (8
4.3)
157,
925
(86.
9)
Tota
l Cho
lest
erol
94,7
34
(78.
6)91
,026
(8
0.5)
117,
690
(77.
2)12
9,62
8 (8
0.1)
136,
656
(81.
7)13
1,60
1 (8
3.4)
157,
807
(86.
9)
LDL
68,6
21
(56.
9)68
,920
(6
0.9)
95,6
06
(62.
7)10
5,88
3 (6
5.4)
109,
823
(65.
6)98
,897
(6
2.7)
121,
867
(67.
1)
HD
L69
,243
(5
7.5)
69,2
97
(61.
3)96
,350
(6
3.2)
106,
864
(66.
1)11
0,69
0 (6
6.2)
100,
448
(63.
7)12
2,68
6 (6
7.5)
TG94
,284
(7
8.2)
90,5
00
(80.
0)11
6,68
2 (7
6.5)
129,
080
(79.
8)13
4,66
7 (8
0.5)
128,
777
(81.
6)15
5,22
0 (8
5.5)
Uri
ne p
rote
in81
,352
(6
7.5)
79,6
00
(70.
4)10
0,82
6 (6
6.1)
109,
611
(67.
8)11
2,45
0 (6
7.2)
109,
282
(69.
3)13
3,01
0 (7
3.2)
Uri
ne M
icro
albu
min
70,1
87
(58.
2)67
,183
(5
9.4)
80,7
15
(52.
9)83
,513
(5
1.6)
85,5
73
(51.
1)80
,111
(5
0.8)
95,0
64 (5
2.3)
Foot
exa
min
atio
n88
,899
(73.
8)87
,128
(7
7.1)
110,
442
(72.
4)12
1,91
9 (7
5.4)
126,
673
(75.
7)12
3,17
3 (7
8.1)
142,
648
(78.
5)
Fund
us e
xam
inat
ion
58,3
05
(48.
4)59
,858
(5
2.9)
70,5
82
(46.
3)80
,208
(49.
6)85
,222
(5
0.9)
86,5
40
(54.
8)10
6,71
2 (5
8.7)
ECG
68,0
43
(56.
5)69
,522
(6
1.5)
86,4
68
(56.
7)95
,463
(5
9.0)
98,5
45 (5
8.9)
93,3
40
(59.
2)11
1,11
3 (6
1.2)
No.
of p
atie
nts
audi
ted
120,
518
113,
071
152,
528
161,
778
167,
313
157,
787
181,
634
17
National Diabetes Registry Report, 2013-2019Ministry of Health, Malaysia
18
Klinik Kesihatan Gemencheh
Source: MOH/IhsanTahir
Klinik Kesihatan MiriSource: MOH/Punitha Arinima
1818
National Diabetes Registry Report, 2013-2019Ministry of Health, Malaysia
19
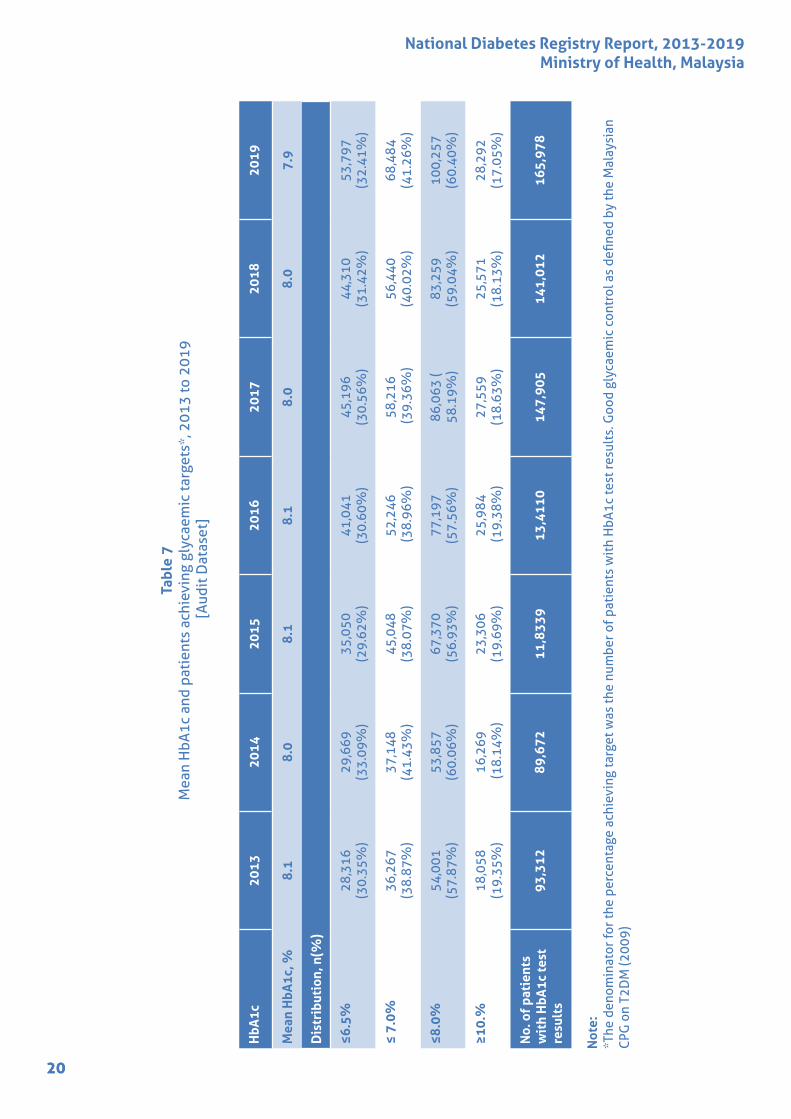
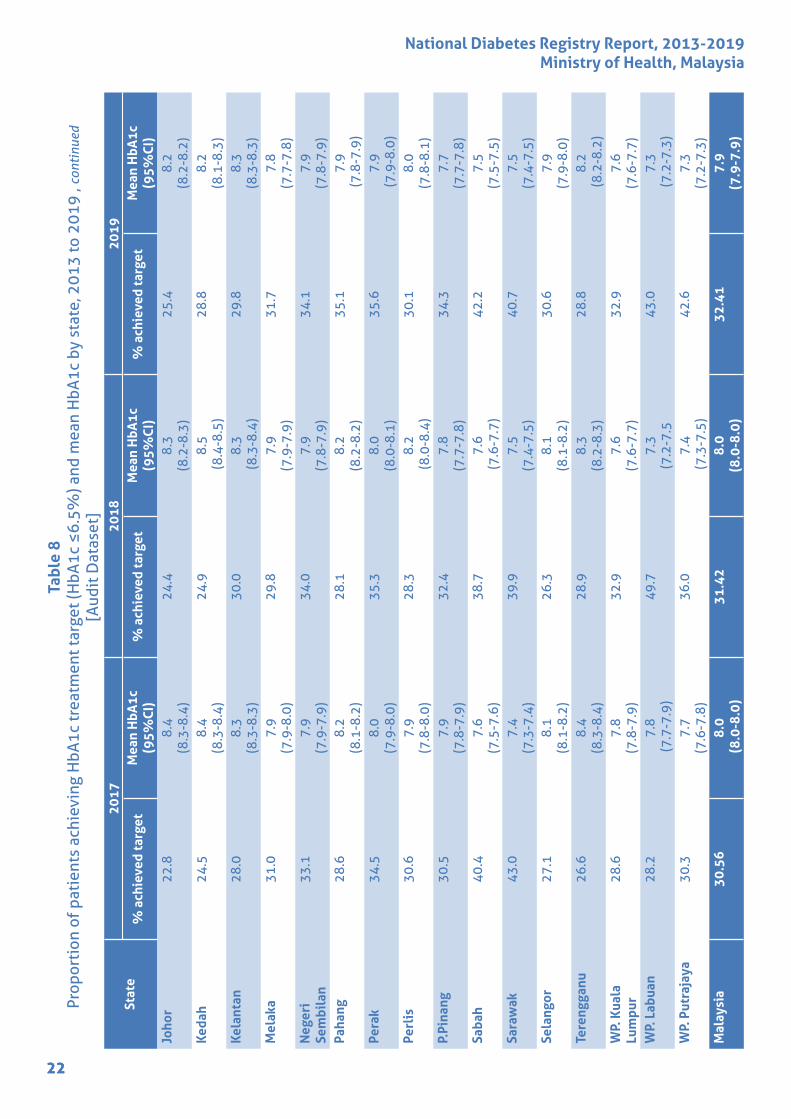
Clinical Target AchievementTable 7 shows the mean HbA1c and the percentage of patients reaching clinical targets for HbA1c. Mean HbA1c showed improvement by which it has decreased slightly over the years, from 8.1% in 2013 to 7.9% in 2019. The proportion of patients achieving glycaemic control with HbA1c ≤6.5% ranged between 29.62% to 32.41% over the 6 years. Whereas, the proportion of HbA1c ≥10.0% has been on a decreasing trend ranging from 19.69 to 17.05%. Table 8 shows that the achievement of HbA1c treatment target (≤6.5%) varied across the states.
However, we should take note that the analysis of target achievement excludes patients who did not undergo HbA1c testing, or have no HbA1c results documented in their case notes. If we were to assume that patients who were not tested are more likely among those with poor glycaemic control, then the percentage achieving glycaemic target would be much lower. The variation between states over the years in terms of HbA1c achievement must be interpreted with caution since the coverage of HbA1c testing also greatly differs between states (data not shown in this report). However, since the allocation of resources to each individual state is proportion to its disease burden, we would need to explore why such discrepancies are occurring. Despite this caveat, the dataset is still useful for each individual state to monitor the changing trends of HbA1c achievements over time.
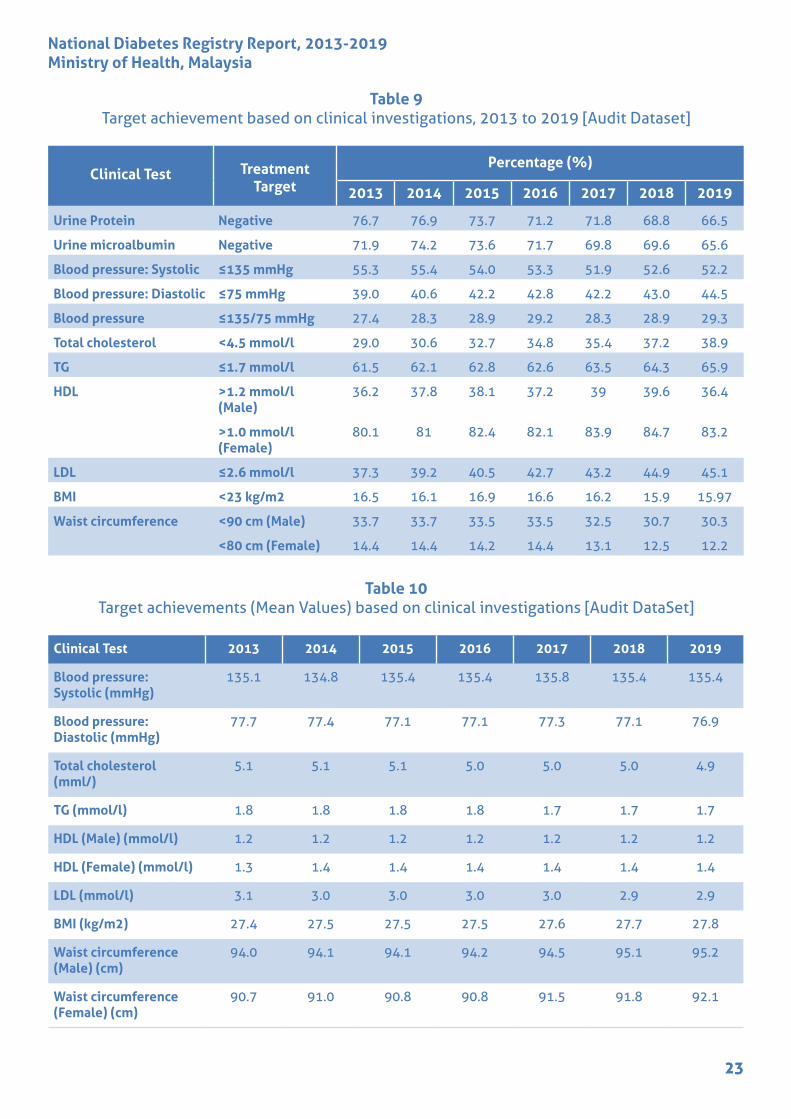
Table 9 and Table 10 reports the mean clinical test values and proportions of audited patients achieving treatment targets. Among audited patients, the proportion of those who tested negative for urine protein and urine microalbumin declined from 2013 to 2019.
For blood pressure parameters, the proportion of the audited patients achieving treatment target for systolic and diastolic blood pressure were mixed. The proportions of patients achieving treatment targets for TG and LDL Cholesterol also improved. For BMI and Waist Circumference, the proportions of those who achieved treatment target unfortunately declined over the years.
19
National Diabetes Registry Report, 2013-2019Ministry of Health, Malaysia
20
HbA
1c20
1320
1420
1520
1620
1720
1820
19
Mea
n H
bA1c
, %8.
18.
08.
18.
18.
08.
07.
9
Dis
trib
utio
n, n
(%)
≤6.5
%28
,316
(3
0.35
%)
29,6
69
(33.
09%
)35
,050
(2
9.62
%)
41,0
41
(30.
60%
)45
,196
(3
0.56
%)
44,3
10
(31.
42%
)53
,797
(3
2.41
%)
≤ 7.
0%36
,267
(3
8.87
%)
37,1
48
(41.
43%
)45
,048
(3
8.07
%)
52,2
46 (3
8.96
%)
58,2
16 (3
9.36
%)
56,4
40
(40.
02%
)68
,484
(4
1.26
%)
≤8.0
%54
,001
(5
7.87
%)
53,8
57
(60.
06%
)67
,370
(5
6.93
%)
77,1
97
(57.
56%
)86
,063
(58
.19%
)83
,259
(5
9.04
%)
100,
257
(60.
40%
)
≥10.
%18
,058
(1
9.35
%)
16,2
69 (1
8.14
%)
23,3
06
(19.
69%
)25
,984
(19.
38%
)27
,559
(1
8.63
%)
25,5
71
(18.
13%
)28
,292
(1
7.05
%)
No.
of p
atie
nts
wit
h H
bA1c
test
re
sult
s93
,312
89,6
7211
,833
913
,411
014
7,90
514
1,01
216
5,97
8
Not
e:
*The
den
omin
ator
for t
he p
erce
ntag
e ac
hiev
ing
targ
et w
as th
e nu
mbe
r of p
atie
nts
wit
h H
bA1c
test
resu
lts.
Goo
d gl
ycae
mic
con
trol
as
defin
ed b
y th
e M
alay
sian
CP
G o
n T2
DM
(200
9)
Tabl
e 7
Mea
n H
bA1c
and
pat
ient
s ac
hiev
ing
glyc
aem
ic ta
rget
s*, 2
013
to 2
019
[Aud
it D
atas
et]
20

National Diabetes Registry Report, 2013-2019Ministry of Health, Malaysia
21
Tabl
e 8
Prop
orti
on o
f pa
tien
ts a
chie
ving
HbA
1c tr
eatm
ent t
arge
t (H
bA1c
≤6.
5%) a
nd m
ean
HbA
1c b
y st
ate,
201
3 to
201
9 [A
udit
Dat
aset
]
Stat
e2
01
32
01
42
01
52
01
6%
ach
ieve
d ta
rget
Mea
n H
bA1
c (9
5%
CI)
% a
chie
ved
targ
etM
ean
HbA
1c
(95
%C
I)%
ach
ieve
d ta
rget
Mea
n H
bA1
c (9
5%
CI)
% a
chie
ved
targ
etM
ean
HbA
1c
(95
%C
I)Jo
hor
24
.68
.3
(8.2
-8.3
)2
6.0
8.2
(8
.1-8
.2)
23
.48
.3
(8.3
-8.4
)2
5.2
8.2
(8.2
-8.3
)K
edah
26
.58
.3
(8.3
-8.4
)3
3.9
8.1
(8
.0-8
.1)
29
.98
.2
(8.2
-8.2
)2
4.4
8.4
(8
.4-8
.5)
Kel
anta
n2
2.4
8.7
(8.6
-8.7
)2
2.8
8.7
(8
.6-8
.7)
23
.28
.5
(8.5
-8.5
)2
6.2
8.4
(8.4
-8.4
)M
elak
a3
4.3
7.8
(7.7
-7.8
)4
0.5
7.6
(7
.5-7
.6)
29
.98
.0 (7
.9-8
.0)
29
.78
.0
(7.9
-8.0
)N
eger
i Se
mbi
lan
30
.78
.0 (8
.0-8
.0)
33
.07
.9
(7.9
-7.9
)3
2.6
7.9
(7.9
-7.9
)3
5.8
7.8
(7
.8-7
.9)
Paha
ng2
4.6
8.4
(8
.3-8
.4)
26
.58
.3
(8.3
-8.4
)2
3.0
8.4
(8
.4-8
.4)
27
.38
.2
(8.2
-8.3
)Pe
rak
35
.08
.0 (7
.9-8
.0)
36
.98
.0
(7.9
-8.0
)3
2.1
8.2
(8
.1-8
.2)
35
.18
.0
(8.0
-8.1
)Pe
rlis
34
.37
.9
(7.7
-8.0
)3
8.8
7.7
(7
.6-7
.8)
36
.57
.9
(7.8
-7.9
)3
9.2
7.8
(7.7
-7.9
)P.
Pina
ng2
5.1
8.1
(8.0
-8.1
)3
1.7
7.9
(7
.8-8
.0)
24
.88
.2 (8
.1-8
.3)
28
.68
.0 (8
.0-8
.1)
Saba
h4
8.0
7.3
(7.2
-7.3
)4
8.8
7.2
(7
.2-7
.3)
44
.77
.3
(7.3
-7.4
)4
3.0
7.4
(7
.4-7
.5)
Sara
wak
37
.57
.5
(7.4
-7.6
)4
2.4
7.3
(7.2
-7.4
)4
5.7
7.3
(7
.2-7
.3)
42
.37
.4
(7.3
-7.4
)Se
lang
or2
8.5
8.2
(8
.2-8
.3)
28
.88
.2 (8
.1-8
.2)
29
.48
.2
(8.1
-8.2
)3
0.8
8.1
(8.1
-8.2
)Te
reng
ganu
25
.58
.6
(8.6
-8.7
)2
9.1
8.4
(8
.4-8
.5)
24
.88
.6
(8.5
-8.6
)2
5.7
8.6
(8
.5-8
.6)
WP.
Kua
la
Lum
pur
38
.17
.7
(7.7
-7.7
)3
8.4
7.6
(7
.6-7
.7)
29
.07
.9 (7
.9-8
.0)
29
.07
.8 (7
.8-7
.9)
WP.
Lab
uan
44
.27
.4
(7.2
-7.5
)5
1.6
7.2
(7
.0-7
.3)
40
.97
.4
(7.2
-7.6
)3
7.3
7.6
(7
.4-7
.8)
WP.
Put
raja
ya4
2.9
7.7
(7
.5-7
.8)
36
.27
.7
(7.6
-7.9
)2
9.7
7.9
(7
.7-8
.0)
20
.85
8.2
(8
.1-8
.4)
Mal
aysi
a3
0.3
58
.1
(8.1
-8.1
)3
3.0
98
.0
(8.0
-8.0
)2
9.6
28
.1 (8
.1-8
.1)
30
.60
8.1
(8.1
-8.1
)
21
National Diabetes Registry Report, 2013-2019Ministry of Health, Malaysia
22
Stat
e20
1720
1820
19
% a
chie
ved
targ
etM
ean
HbA
1c
(95%
CI)
% a
chie
ved
targ
etM
ean
HbA
1c
(95%
CI)
% a
chie
ved
targ
etM
ean
HbA
1c
(95%
CI)
Joho
r22
.88.
4 (8
.3-8
.4)
24.4
8.3
(8.2
-8.3
)25
.48.
2 (8
.2-8
.2)
Keda
h24
.58.
4 (8
.3-8
.4)
24.9
8.5
(8.4
-8.5
)28
.88.
2 (8
.1-8
.3)
Kela
ntan
28.0
8.3
(8.3
-8.3
)30
.08.
3 (8
.3-8
.4)
29.8
8.3
(8.3
-8.3
)M
elak
a31
.07.
9 (7
.9-8
.0)
29.8
7.9
(7.9
-7.9
)31
.77.
8 (7
.7-7
.8)
Neg
eri
Sem
bila
n33
.17.
9 (7
.9-7
.9)
34.0
7.9
(7.8
-7.9
)34
.17.
9 (7
.8-7
.9)
Paha
ng28
.68.
2 (8
.1-8
.2)
28.1
8.2
(8.2
-8.2
)35
.17.
9 (7
.8-7
.9)
Pera
k34
.58.
0 (7
.9-8
.0)
35.3
8.0
(8.0
-8.1
)35
.67.
9 (7
.9-8
.0)
Perl
is30
.67.
9 (7
.8-8
.0)
28.3
8.2
(8.0
-8.4
)30
.18.
0 (7
.8-8
.1)
P.Pi
nang
30.5
7.9
(7.8
-7.9
)32
.47.
8 (7
.7-7
.8)
34.3
7.7
(7.7
-7.8
)Sa
bah
40.4
7.6
(7.5
-7.6
)38
.77.
6 (7
.6-7
.7)
42.2
7.5
(7.5
-7.5
)Sa
raw
ak43
.07.
4 (7
.3-7
.4)
39.9
7.5
(7.4
-7.5
)40
.77.
5 (7
.4-7
.5)
Sela
ngor
27.1
8.1
(8.1
-8.2
)26
.38.
1 (8
.1-8
.2)
30.6
7.9
(7.9
-8.0
)Te
reng
ganu
26.6
8.4
(8.3
-8.4
)28
.98.
3 (8
.2-8
.3)
28.8
8.2
(8.2
-8.2
)W
P. K
uala
Lu
mpu
r28
.67.
8 (7
.8-7
.9)
32.9
7.6
(7.6
-7.7
)32
.97.
6 (7
.6-7
.7)
WP.
Lab
uan
28.2
7.8
(7.7
-7.9
)49
.77.
3 (7
.2-7
.543
.07.
3 (7
.2-7
.3)
WP.
Put
raja
ya30
.37.
7 (7
.6-7
.8)
36.0
7.4
(7.3
-7.5
)42
.67.
3 (7
.2-7
.3)
Mal
aysi
a30
.56
8.0
(8.0
-8.0
)31
.42
8.0
(8.0
-8.0
)32
.41
7.9
(7.9
-7.9
)
Tabl
e 8
Prop
orti
on o
f pa
tien
ts a
chie
ving
HbA
1c tr
eatm
ent t
arge
t (H
bA1c
≤6.
5%) a
nd m
ean
HbA
1c b
y st
ate,
201
3 to
201
9 , c
onti
nued
[A
udit
Dat
aset
]
22
National Diabetes Registry Report, 2013-2019Ministry of Health, Malaysia
23
Table 9 Target achievement based on clinical investigations, 2013 to 2019 [Audit Dataset]
Clinical Test Treatment Target
Percentage (%)
2013 2014 2015 2016 2017 2018 2019
Urine Protein Negative 76.7 76.9 73.7 71.2 71.8 68.8 66.5
Urine microalbumin Negative 71.9 74.2 73.6 71.7 69.8 69.6 65.6
Blood pressure: Systolic ≤135 mmHg 55.3 55.4 54.0 53.3 51.9 52.6 52.2
Blood pressure: Diastolic ≤75 mmHg 39.0 40.6 42.2 42.8 42.2 43.0 44.5
Blood pressure ≤135/75 mmHg 27.4 28.3 28.9 29.2 28.3 28.9 29.3
Total cholesterol <4.5 mmol/l 29.0 30.6 32.7 34.8 35.4 37.2 38.9
TG ≤1.7 mmol/l 61.5 62.1 62.8 62.6 63.5 64.3 65.9
HDL >1.2 mmol/l (Male)
36.2 37.8 38.1 37.2 39 39.6 36.4
>1.0 mmol/l (Female)
80.1 81 82.4 82.1 83.9 84.7 83.2
LDL ≤2.6 mmol/l 37.3 39.2 40.5 42.7 43.2 44.9 45.1
BMI <23 kg/m2 16.5 16.1 16.9 16.6 16.2 15.9 15.97
Waist circumference <90 cm (Male) 33.7 33.7 33.5 33.5 32.5 30.7 30.3
<80 cm (Female) 14.4 14.4 14.2 14.4 13.1 12.5 12.2
Table 10 Target achievements (Mean Values) based on clinical investigations [Audit DataSet]
Clinical Test 2013 2014 2015 2016 2017 2018 2019
Blood pressure: Systolic (mmHg)
135.1 134.8 135.4 135.4 135.8 135.4 135.4
Blood pressure: Diastolic (mmHg)
77.7 77.4 77.1 77.1 77.3 77.1 76.9
Total cholesterol (mml/)
5.1 5.1 5.1 5.0 5.0 5.0 4.9
TG (mmol/l) 1.8 1.8 1.8 1.8 1.7 1.7 1.7
HDL (Male) (mmol/l) 1.2 1.2 1.2 1.2 1.2 1.2 1.2
HDL (Female) (mmol/l) 1.3 1.4 1.4 1.4 1.4 1.4 1.4
LDL (mmol/l) 3.1 3.0 3.0 3.0 3.0 2.9 2.9
BMI (kg/m2) 27.4 27.5 27.5 27.5 27.6 27.7 27.8
Waist circumference (Male) (cm)
94.0 94.1 94.1 94.2 94.5 95.1 95.2
Waist circumference (Female) (cm)
90.7 91.0 90.8 90.8 91.5 91.8 92.1
23

National Diabetes Registry Report, 2013-2019Ministry of Health, Malaysia
24
Drug TreatmentThe use of anti-diabetic drugs (OADs) is shown in Table 11 below. In 2019, 28.9% of patients were on monotherapy compared to 27.7% in 2013, while those on 2 or more OADs were 35.1% compared to 42.1% in 2013. The changes are reflected in patients who were on insulin-OAD combination treatment which increased from 17.5% in 2013 to 23.7% in 2019. The proportion of patients on diet management only also ranged from 5.6% to 9.6%, and this is still high.
Among the OADs, metformin was the most commonly prescribed followed by are the sulpholyureas. These are followed alpha-glucosidase and glitazones. On the other hand, the use of insulin has increased over the last 7 years, from 23.11% of patients in 2013, increasing to 30.3% in 2019.
Table 11 Anti-diabetic drugs used (%), 2013 to 2019 [Audit Dataset]
Therapy 2013 2014 2015 2016 2017 2018 2019
Monotherapy (OAD) 27.7 28.1 28.1 29.1 29.1 28.9 28.9
≥2 OAD 42.1 40.1 35.9 34.6 34.7 34.6 35.1
OAD + Insulin 17.5 19.3 19.7 20.9 21.8 23.2 23.7
Diet only 7.1 6.3 9.6 8.6 7.5 6.5 5.6
Type of anti-diabetic drug
Metformin 80.6 80.8 76.6 77.4 79.7 81.5 83.0
Sulphonylureas 52.5 49.9 45.7 44.2 44.4 44.4 44.3
a-Glucosidase Inhibitors
4.4 3.5 3.5 3.1 2.4 2.2 1.4
Meglitinides 0.1 0.1 0.1 0.2 0.1 0.1 0.1
Glitazones 1.0 1.1 1.0 0.8 1.1 0.6 0.8
Other OADs 1.1 1.6 1.9 2.4 2.1 1.6 1.7
Insulin 23.1 25.4 26.3 27.6 28.6 29.9 30.3
Total patients audited 120,518 112,873 152,260 161,7552 173,566 157,84 181,638
24

National Diabetes Registry Report, 2013-2019Ministry of Health, Malaysia
25
The use of insulin as a mode of treatment from 2013 to 2019 by state is shown in Table 12. Generally, there was a steady growth in percentage of patient receiving insulin treatment in all states over the years. The highest percentage of T2DM patients receiving insulin in 2019 is from Kelantan.
Table 12 Use of insulin by state (%), 2013 to 2019 [Audit Dataset]
State 2013 2014 2015 2016 2017 2018 2019
Johor 19.7 23.7 25.4 27.1 29.9 30.2 31.7
Kedah 17.7 18.4 21.1 22.4 26.5 29.1 31.6
Kelantan 24.3 30.7 31.9 36.2 37.7 38.6 39.5
Melaka 22.7 23.8 26.7 26.9 29.7 27.8 27.3
Negeri Sembilan 28.7 29.9 30.0 29.8 29.6 30.9 31.6
Pahang 22.5 26.0 27.1 28.2 28.5 31.3 31.5
Perak 17.7 20.6 20.6 21.7 22.9 24.9 25.2
Perlis 22.3 27.5 30.1 32.4 32.3 29.9 30.8
P.Pinang 21.4 22.7 24.3 23.8 24.7 24.4 24.5
Sabah 19.3 21.7 20.9 22.1 22.8 22.2 22.6
Sarawak 17.9 17.8 18.3 18.6 18.7 19.7 21.3
Selangor 26.3 30.3 31.2 31.9 33.7 34.1 33.2
Terengganu 25.9 29.8 29.9 33.2 34.8 37.3 37.0
WP. Kuala Lumpur 28.5 30.8 33.7 36.1 35.2 32.1 32.3
WP. Labuan 3.6 10.3 18.7 17.3 17.9 16.8 17.6
WP. Putrajaya 24.4 26.3 28.1 29.5 26.6 25.5 26.6
Malaysia 23.1 25.4 26.3 27.7 28.7 29.9 30.4
25

National Diabetes Registry Report, 2013-2019Ministry of Health, Malaysia
26
The use of other concomitant drugs is shown in Table 13. From 2013 to 2019, among the anti-hypertensives, ACE inibitors and calcium channel blockers were the commonly used medication, followed by beta blockers. Of note, the use of calcium channel blockers have been increasing steadily. Aspirin was the most commonly used anti-platelet and statins were the most commonly used anti-lipids.
Table 13 Use of concomitant drugs (%), 2013 to 2019 [Audit Dataset]
Drug 2013 2014 2015 2016 2017 2018 2019
Anti-Hypertensives
ACE inhibitors 49.3 49.8 48.6 49.2 49.5 51.7 51.8
Angiotensin receptor blockers
4.8 5.3 5.5 5.9 6.6 7.3 7.8
Beta blockers 23.9 23.8 22.1 22.7 23.3 24.3 25.0
Calcium channel blockers
41.6 45.4 45.0 48.2 51.6 54.9 57.7
Diuretics 20.1 20.3 19.5 19.3 20.1 20.4 20.3
Alpha blockers 3.6 3.4 3.2 3.1 3.3 3.6 4.1
Central-acting agents 0.2 0.3 0.3 0.3 0.1 0.2 0.1
Others 0.4 0.4 0.6 0.7 0.7 0.6 0.5
Anti-Platelet
Acetyl Salicylic Acid 25.1 24.3 21.1 20.4 19.6 19.1 19.2
Ticlopidine 1.1 1.0 1.0 0.9 0.7 0.6 0.6
Others 0.8 1.0 0.9 1.2 1.4 1.6 1.8
Anti-Lipid
Statins 64.8 68.4 68.8 71.5 74.1 76.9 79.7
Fibrates 3.4 3.4 2.7 2.5 2.6 2.2 1.8
Others 0.1 0.1 0.2 0.4 0.3 0.2 0.2
26

National Diabetes Registry Report, 2013-2019Ministry of Health, Malaysia
27
9
There are several key features that we wish to highlight in this report. We discussed findings from the NDR data, and additionally, some comparisons are made against results of the NHMS since the survey reports prevalence of Malaysians with diabetes. Statistical testing of differences was not performed.
Based on the NHMS 2019 results, it was estimated that approximately 1,999,450 are known diabetes and 74.3% of patients with known diabetes are on follow-up at MOH KKs. Therefore, approximately 1,485,591 patients seek care at MOH KKs. In the NDR, there are 849,691 active diabetes patients, which means only 57% of diagnosed patients who claim to seek treatment at MOH primary care facililties are registered.
Since the methodology of the Diabetes Clinical Audit is heavily dependent on the quality of documentation of the patients’ case notes, more emphasis should be placed on continually improving documentation by all healthcare providers providing care to patients with diabetes, regardless of level of care.The dataset also does not contain information about hospital admissions.
Coverage and Quality of Registration in NDR
Klinik Kesihatan GemenchehSource: MOH/IhsanTahir
2727

National Diabetes Registry Report, 2013-2019Ministry of Health, Malaysia
28
10 ConclusionsDespite some limitations in the dataset, the NDR dataset is a useful tool for monitoring quality of care for people living with Diabetes in MOH health clinics. Quality of reporting for the NDR has improved over the years with relatively lower with ‘unknown’ variables. The rate of screening for complications has also improved over the years. However, the data shows the outcomes of care, such as glycaemic control and proportions of patients with complications has not improved much. It is hoped that with the publication of this information, further exploration into these questions can be pursued.
Blood Sugar TestingSource: World Health Organization (WHO)
28

National Diabetes Registry Report, 2013-2019Ministry of Health, Malaysia
2929

National Diabetes Registry Report, 2013-2019Ministry of Health, Malaysia
3030
National DiabetesRegistry Report2013 - 2019
Publ ished by :
9 7 7 2 7 3 5 0 4 8 0 0 8
I SSN 2735- 0487
Disease Control DivisionMinistry of Health Malaysia
Disease Control DivisionMinistry of Health Malaysia