national department of health - compcom sa · national department of health ... • the nha...
TRANSCRIPT

National Department of Health
Competition Commission Inquiry into
Private Healthcare Market
Minister of Health
Dr PA Motsoaledi, MP
11 March 2016

Overview
1. Guiding Principles & Vision
2. Evolution of Private Health Sector
3. History of Regulation
4. History of Tariff Setting
5. Market Response to the Absence Tariff
6. Effect of Private Market on Public Sector
7. Overview & Solutions
2

1. Guiding Principles & Vision
3

World Health Organisation
The preamble to the Constitution of the World Health
Organisation reads :
• Health is a state of complete physical, mental and social
well-being and not merely the absence of disease or
infirmity. The enjoyment of the highest attainable standard of
health is one of the fundamental rights of every human
being without distinction of race, religion, political belief,
economic or social condition. The health of all peoples is
fundamental to the attainment of peace and security and is
dependent upon the fullest co-operation of individuals and
States.
Adopted 19-22 July 1946 New York
4
Declaration of Alma-Ata
International Conference on Primary Health Care, Alma-
Ata, USSR, 6-12 September 1978
Declaration II
The existing gross inequality in the health status of the
people particularly between developed and developing
countries as well as within countries is politically, socially
and economically unacceptable and is, therefore, of
common concern to all countries.
5
Universal Health Coverage
• These responsibilities find expression in the goal of
universal health coverage.
• The goal of universal health is to ensure that
All people obtain the health services they
need without suffering financial hardship
when paying for them.
(WHO Definition of universal health coverage)
6

The Republic of South Africa Constitution
The South African Constitution and Bill of Rights enshrines the
right to healthcare. Section 27 of the Constitution provides
that:
(1) Everyone has a right to have access to -
(a) healthcare services, including reproductive health
care…
(2) The state must take reasonable legislative and other
measures, within its available resources, to achieve the
progressive realisation of each of these rights.
(3) No one may be refused emergency medical treatment.
(Act 108 of 1996)
The State has a clear obligation to
ensure access to healthcare for all. 7
National Health Act
• The National Health Act gives effect to the constitutional
right to access health care services, as well as
government’s responsibilities in realising this right.
• The NHA provides for a single national health system,
in order to provide the population of the Republic with
the best possible health services with available
resources.
• Additionally, it explicitly encompasses both public and
private providers of health
(Act 61 of 2003)
8

National Development Plan
The NDP provides a clear roadmap to guide health
system restructuring towards the goal of better health
for all and that in 2030:
“…There has been a significant shift in equity,
efficiency, effectiveness and quality of healthcare
provision. Universal coverage is available....”
9
Sustainable Development Goals
Target 3.8
Achieve Universal Health Coverage including financial risk
protection, access to quality essential health care services
and access to safe, effective, quality and affordable essential
medicines and vaccines for all.
(Adopted at the United Nations General Assembly 25 September 2015)
10

Current Context Inequitable • Prior to 1994 the South African health system was fragmented and
designed along racially discriminatory policies. There were 14 health
departments (servicing 4 race groups, including the 10 Bantustans),
fragmentation between levels of care, and a systematically unequal
financing and delivery of services.
• Within this inefficient, divided context, one system was highly
resourced and designed to serve the white minority, while the other,
for the black majority, was systematically under resourced.
• The Constitution abolished this fragmented health care system with the
vision to establish a single seamless healthcare system.
Inadvertently a two tier healthcare system developed- public and private
sector. The private sector developed in the absence of a clearly
designed policy.
11
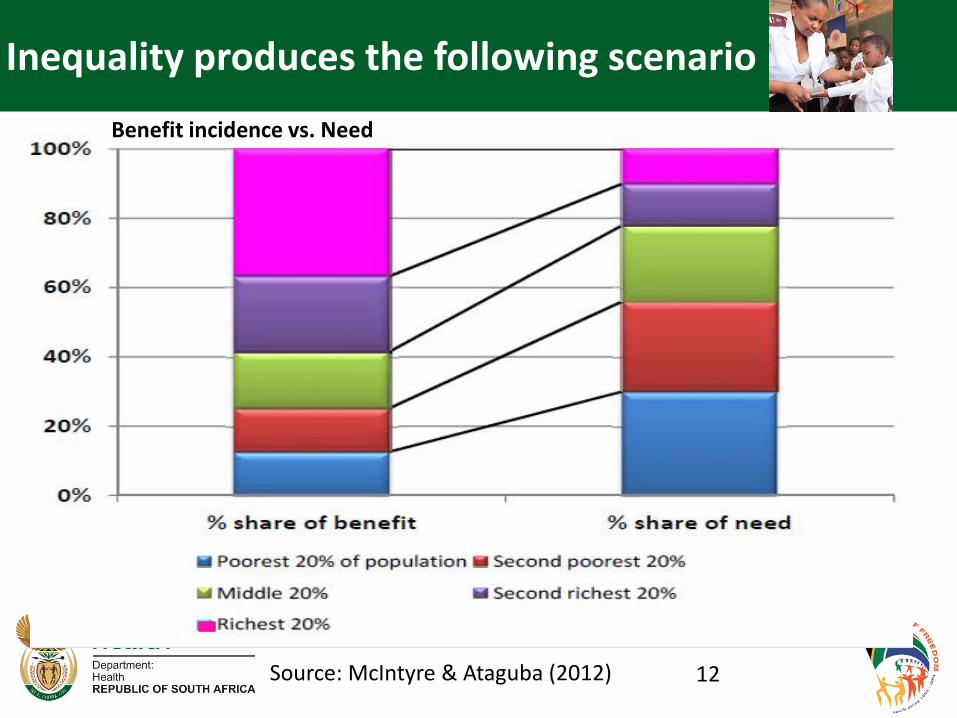
Inequality produces the following scenario
Source: McIntyre & Ataguba (2012) 12
Benefit incidence vs. Need
Health Expenditure • The World Health Organisation recommends that countries
should spend at least 5% of GDP on health.
• South Africa currently spends 8.5% of GDP on health.
• The private sector spends 4.4% of GDP on health but only
provides care to 16% of the population.
• The public sector spends 4.1% of GDP on health but provides
care to the entire remaining 84% of the population.
13
At the 65th World Health Assembly, May 2012 Dr Margaret Chan, the Director General of the WHO, outlined seven structural problems faced by global health systems 1. Rising health care costs yet poor access to essential
medicines, especially affordable generic products; 2. Emphasis on cure that leaves prevention by the wayside; 3. Costly private care for the privileged few, but second-rate
care for everybody else; 4. Grossly inadequate numbers of staff, or the wrong mix of
staff; 5. Weak or inappropriate information systems; 6. Weak regulatory control; and 7. Schemes for financing care that punish the poor.
Challenges Faced by Health Systems Globally
14
Universal Coverage as a Solution
Dr Chan (2013) further indicated that universal coverage was the most appropriate means to address these problems:
“Universal health coverage is the single most powerful concept that public health has to offer.”
“ It is a powerful social equalizer and the ultimate expression of fairness.”
15
• Each country will be able to identify which of the seven challenges are found within their system.
• Unfortunately, South Africa is faced with all seven of them.
Challenges Facing South Africa
16

• The South African National Development Plan
identifies two objectives that must be realised
to overcome our challenges:
1. The quality of services in the public health
system must be improved
2. The relative cost of private healthcare must
be reduced
Challenges Facing South Africa
17

2. Evolution of Private Health Sector
18

Private hospitals were not always the
highest expenditure items for medical
schemes
19
Private Hospitals

Inflation-adj. ZAR PBPM 1974 -1998
20 Centre for Actuarial Research. P Rama & H McLeod July 2001

Individual Practitioners
21 Centre for Actuarial Research. P Rama & H McLeod July 2001

22
Benefit expenditure: ZAR PBPM (1997-2007)

23
IS THIS EVOLUTION A
COINCIDENCE?
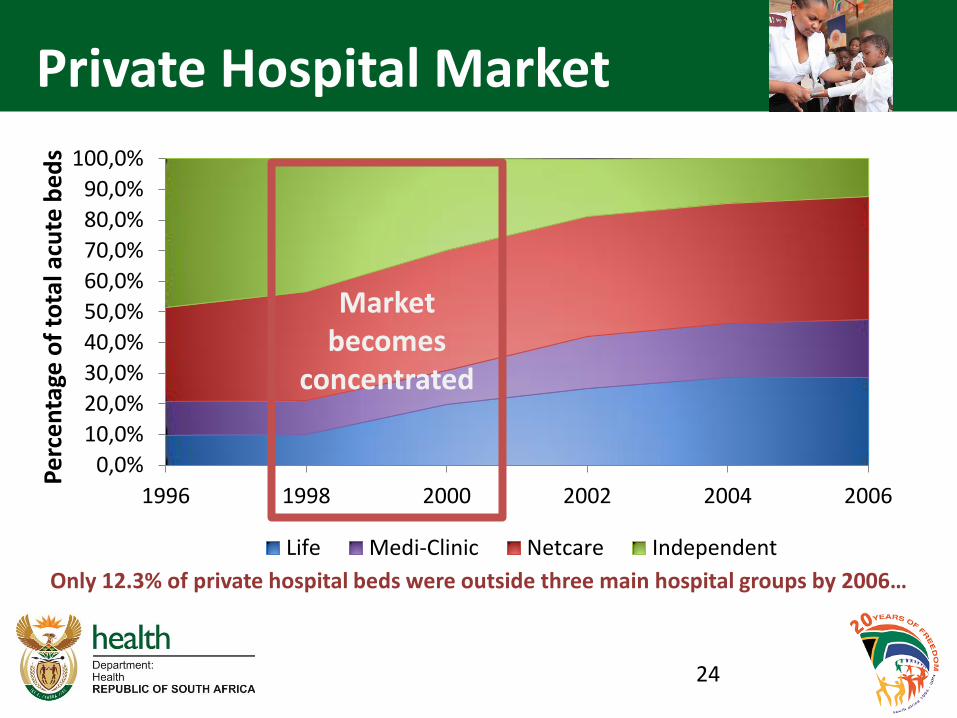
Private Hospital Market
0,0%
10,0%
20,0%
30,0%
40,0%
50,0%
60,0%
70,0%
80,0%
90,0%
100,0%
1996 1998 2000 2002 2004 2006
Pe
rce
nta
ge o
f to
tal a
cute
be
ds
Life Medi-Clinic Netcare Independent
Market becomes
concentrated
Only 12.3% of private hospital beds were outside three main hospital groups by 2006…
24
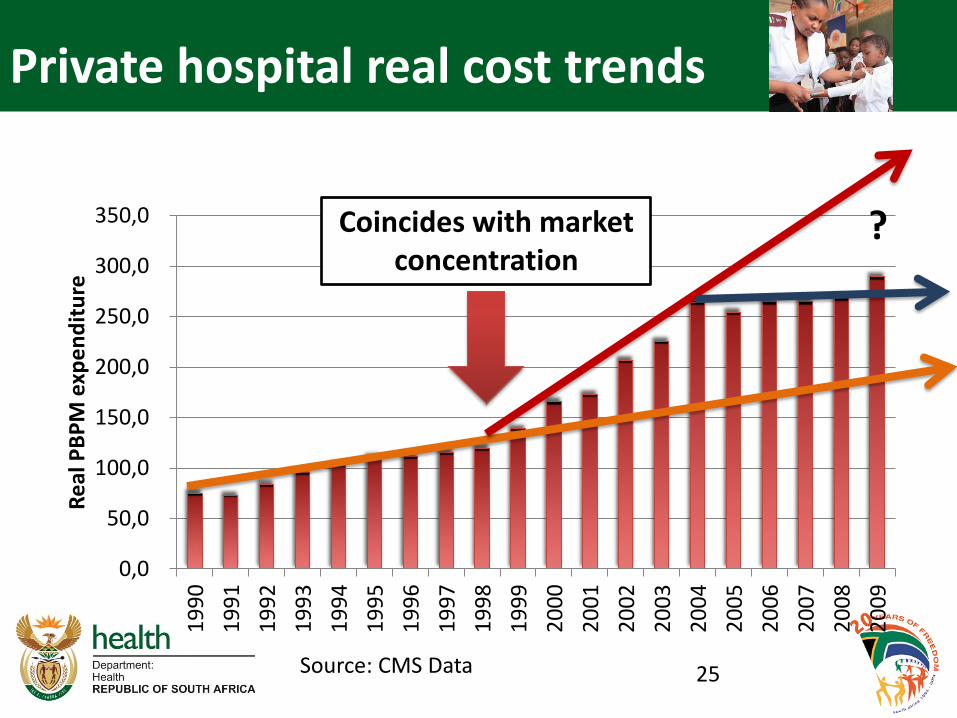
Private hospital real cost trends
0,0
50,0
100,0
150,0
200,0
250,0
300,0
350,01
99
0
19
91
19
92
19
93
19
94
19
95
19
96
19
97
19
98
19
99
20
00
20
01
20
02
20
03
20
04
20
05
20
06
20
07
20
08
20
09
Re
al P
BP
M e
xpe
nd
itu
re
Coincides with market concentration
?
25 Source: CMS Data

Cost of debt
Return on Investment
Growth in Return on Investment
26
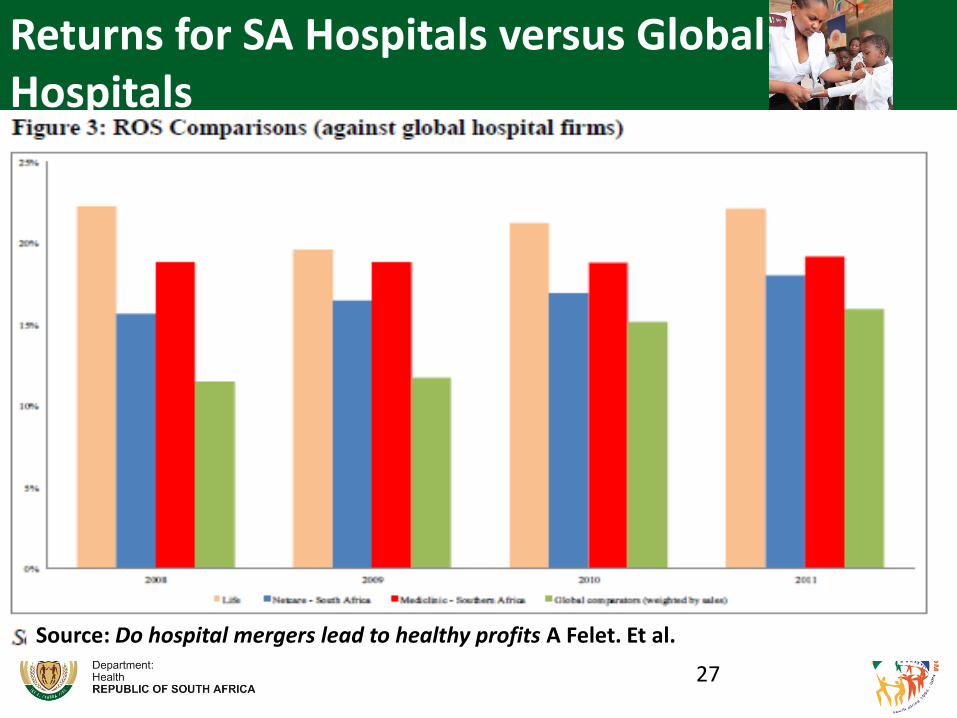
Returns for SA Hospitals versus Global Hospitals
Source: Do hospital mergers lead to healthy profits A Felet. Et al.
27
Listing on the Stock Exchange
• Three of the largest hospital groups in SA are listed on
the stock exchange.
• Companies on the stock must consistently maximise
profits in line with investor expectation.
• These principles are often in conflict with the ethical
responsibility of service delivery in healthcare where the
health of patients is primary irrespective of their ability to
pay.
28

2012 Total Hospital and Physician Cost
$73 420
$61 462
$2
7 1
09
$2
1 8
13
$2
0 9
56
$1
9 6
21
$1
7 3
74
$1
3 2
01
$1
2 8
43
$1
2 1
89
$-
$10 000
$20 000
$30 000
$40 000
$50 000
$60 000
$70 000
$80 000
Bypass Surgery, 2012 in GDP PPP US$
29

2012 Total Hospital and Physician Cost
$28 182
$22 357
$13 070 $10 629
$6 939 $5 945 $5 785 $5 588 $3 640
$-
$5 000
$10 000
$15 000
$20 000
$25 000
$30 000
Angioplasty, 2012 in GDP PPP US$
30
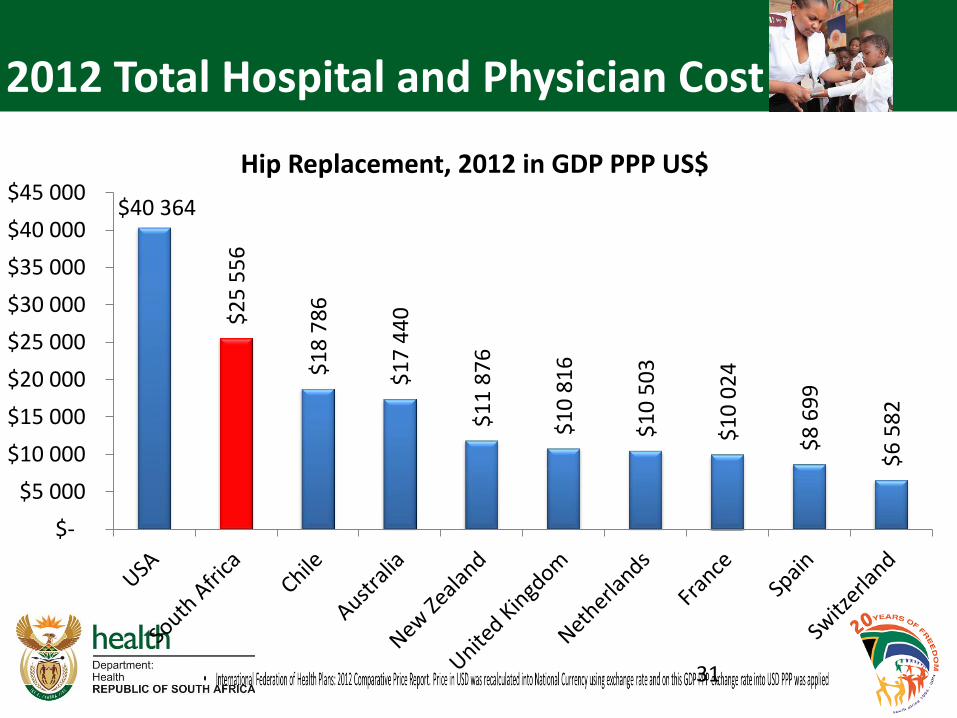
2012 Total Hospital and Physician Cost
$40 364 $
25
55
6
$1
8 7
86
$1
7 4
40
$1
1 8
76
$1
0 8
16
$1
0 5
03
$1
0 0
24
$8
69
9
$6
58
2
$-
$5 000
$10 000
$15 000
$20 000
$25 000
$30 000
$35 000
$40 000
$45 000Hip Replacement, 2012 in GDP PPP US$
31
• Are the procedures so complex as to be
this costly?
• What about the simplest procedures?
32

Medical Male Circumcision – A simple Procedure
• CMS 2013 average claims show that Medical Male Circumcision (MCC) can be conducted by:
– GPs for R 1 121
– but hospitals charge R 7 130
• There is no clinical reason why MCC inputs should differ across the two settings.
33

Hospitals & Specialists
• Hospitals compete to attract specialists’ patronage
• The interaction between hospitals and specialists results in
– Increased market power for specialists
– Supply induced demand, including the Medical Arms Race
34
Medical Arms Race
35
The Medical Arms Race hypothesis describes the scenario
where hospitals spend unnecessarily on cost-enhancing
technologies in order to attract patients via specialist
referrals.
E.g. South African private sector has high availability of
CT scanners per population relative to even highly
developed countries.

0
5
10
15
20
25
South Africa private OECD Average South Africa-average
South Africa public
Computerised Tomography (CT), per million population
CT Scanner Availability
36
Source: Analysis of licensed South African diagnostic imaging equipment J. Kabongo et al. 2015

Does this high availability matter?
37
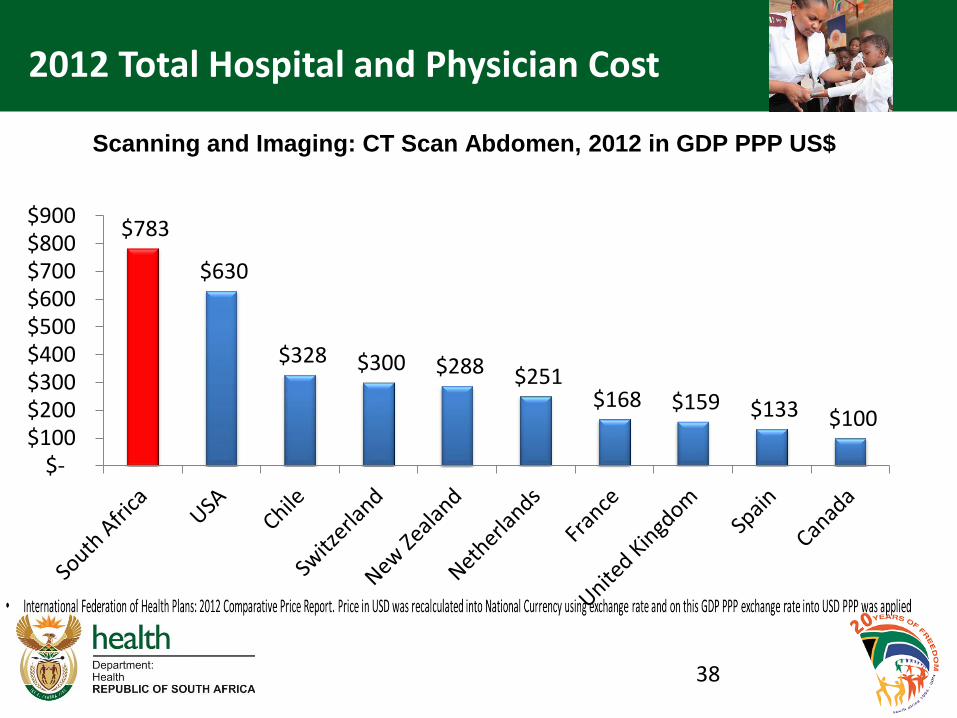
2012 Total Hospital and Physician Cost
$783
$630
$328 $300 $288 $251 $168 $159 $133 $100
$- $100 $200 $300 $400 $500 $600 $700 $800 $900
Scanning and Imaging: CT Scan Abdomen, 2012 in GDP PPP US$
38

2012 Total Hospital and Physician Cost
$566
$498
$269 $256 $237 $225
$168 $159 $134
$100
$-
$100
$200
$300
$400
$500
$600
Scanning and Imaging: CT Scan Head
2012, in GDP PPP US$
39
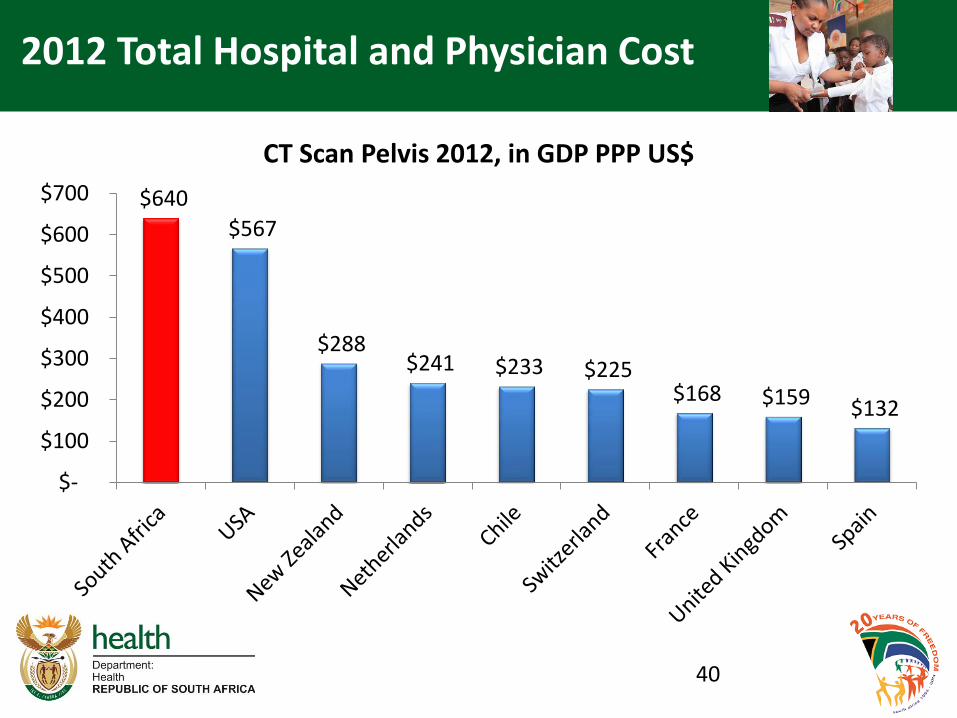
2012 Total Hospital and Physician Cost
40
$640
$567
$288 $241 $233 $225
$168 $159 $132
$-
$100
$200
$300
$400
$500
$600
$700
CT Scan Pelvis 2012, in GDP PPP US$

2012 Total Hospital and Physician Cost
41
$-
$200
$400
$600
$800
$1 000
$1 200
$1 400
$1 600
$1 800
$2 000MRI, 2012, in GDP PPP US$

Cost of CT Scan, Abdomen: Ratio of GHI (2012)
42
0%
1%
1%
2%
2%
3%

Cost of CT Scan Head: Ratio of GHI (2012)
43
0,0%
0,2%
0,4%
0,6%
0,8%
1,0%
1,2%
1,4%
1,6%

Cost of CT Scan, Pelvis: Ratio of GHI (2012)
44
0,0%0,2%0,4%0,6%0,8%1,0%1,2%1,4%1,6%1,8%2,0%
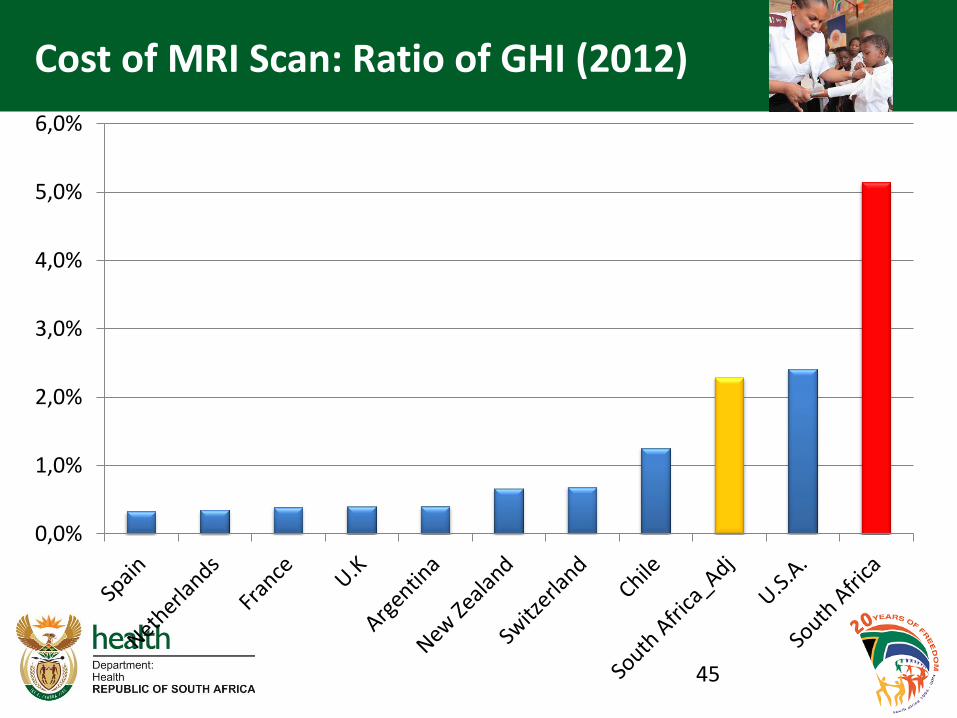
Cost of MRI Scan: Ratio of GHI (2012)
0,0%
1,0%
2,0%
3,0%
4,0%
5,0%
6,0%
45
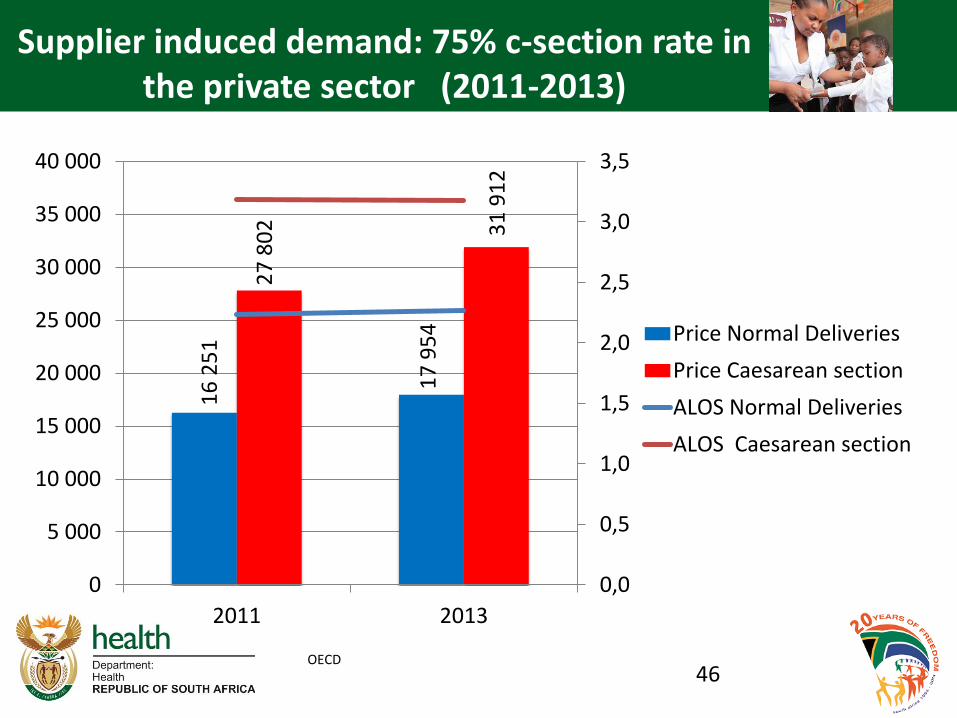
Supplier induced demand: 75% c-section rate in the private sector (2011-2013)
16
25
1
17
95
4
27
80
2
31
91
2
0,0
0,5
1,0
1,5
2,0
2,5
3,0
3,5
0
5 000
10 000
15 000
20 000
25 000
30 000
35 000
40 000
2011 2013
Price Normal Deliveries
Price Caesarean section
ALOS Normal Deliveries
ALOS Caesarean section
46 OECD
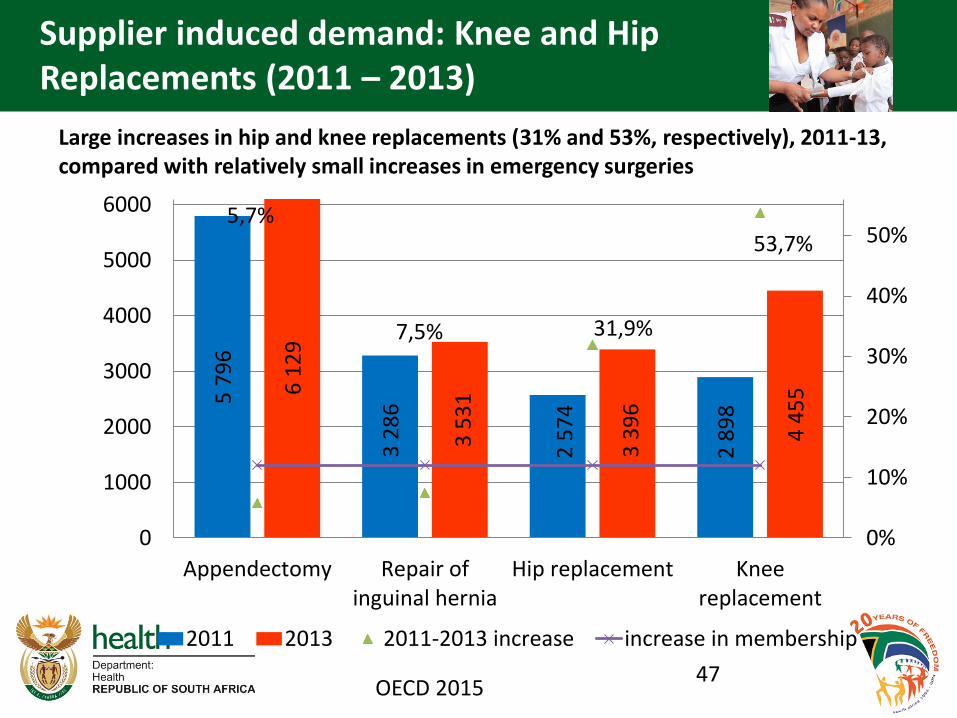
Supplier induced demand: Knee and Hip Replacements (2011 – 2013)
47
5 7
96
3 2
86
2 5
74
2 8
98
6 1
29
3 5
31
3 3
96
4 4
55
5,7%
7,5% 31,9%
53,7%
0%
10%
20%
30%
40%
50%
0
1000
2000
3000
4000
5000
6000
Appendectomy Repair ofinguinal hernia
Hip replacement Kneereplacement
2011 2013 2011-2013 increase increase in membership
Large increases in hip and knee replacements (31% and 53%, respectively), 2011-13, compared with relatively small increases in emergency surgeries
OECD 2015

Medical Aid Schemes
• With this onslaught of prices medical schemes
responded, but only to protect themselves.
• Instead of tackling the source of the high prices,
they moved to the weakest link in the chain. The
victims are:
– GENERAL PRACTITIONERS (Providing
Primary Health Care)
– PATIENTS (Because of information
asymmetry)
48

GPs’ share reduces • Medical Scheme Expenditure in 2010
• Total medical scheme spend on health – R84.7bn
• Hospitals – R31.1bn, private R30.8bn (10%),
public R281 (2.6%).
• Specialists - R19bn
• Medicines - R14bn (5.6%)
• GPs - R6.2bn (9%)
• Dentist - R2.5bn (13.2%)
• Allied - R6.7bn (11.5%)
• Total non healthcare- R11.6bn (6.9%)
49
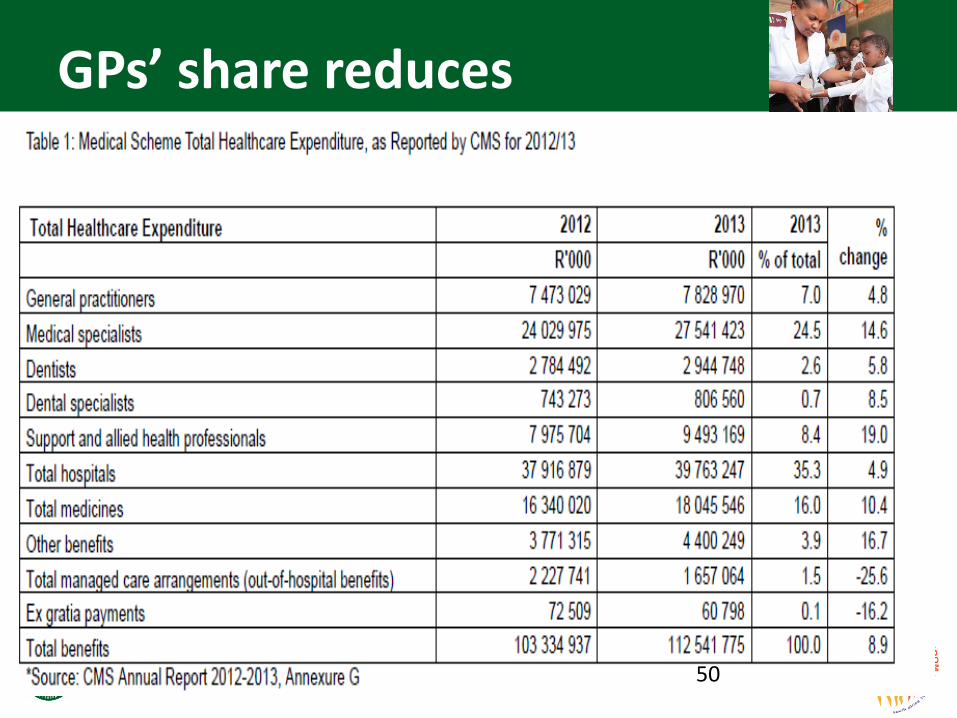
GPs’ share reduces
50

Patients hit with co-payments
51
Medical schemes’ desperate attempt to survive
52

• Schemes must manage expenditure and claims risk in the face
of unregulated prices
– Restricting benefits to the PMBs & often biased towards
hospital costs
– Establishing designated service provider arrangements
– Complex scheme rules that limit the ability of members to
easily register claims
– Administrative barriers to limit the ability of members to
query non-payment
• Each medical scheme compiles its own list of scheme tariffs
• Confusing for patients, with wide variation in charges across
providers.
53
Demand-Side Response
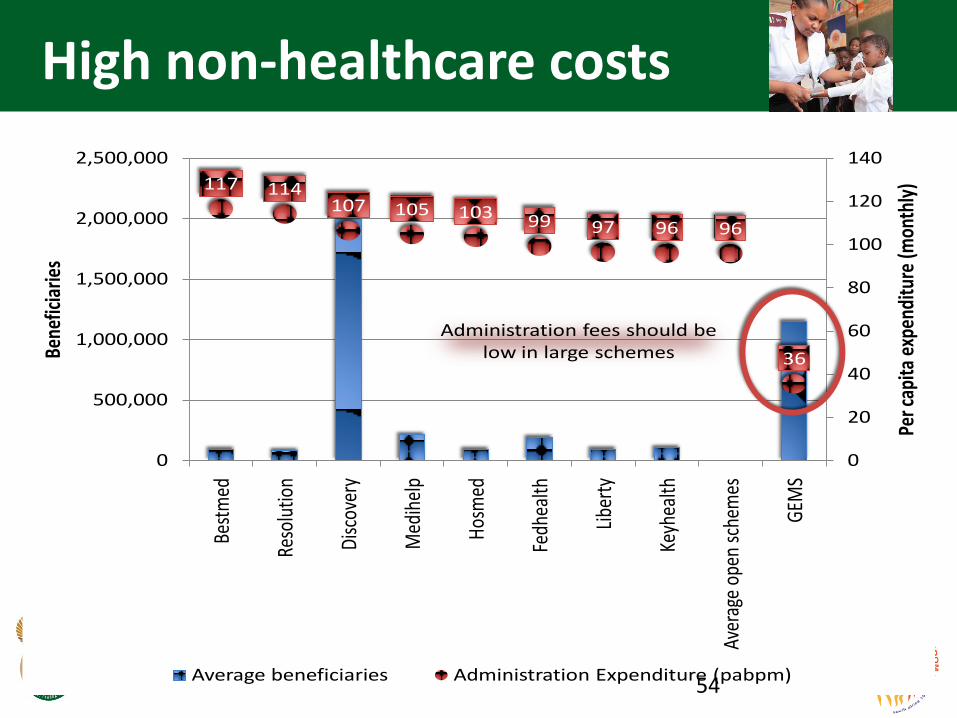
High non-healthcare costs
117 114107 105 103 99 97 96 96
36
0
20
40
60
80
100
120
140
0
500,000
1,000,000
1,500,000
2,000,000
2,500,000
Best
med
Reso
lutio
n
Disc
over
y
Med
ihel
p
Hos
med
Fedh
ealth
Libe
rty
Keyh
ealth
Aver
age
open
sch
emes
GEM
S
Per c
apita
exp
endi
ture
(mon
thly
)
Bene
ficia
ries
Average beneficiaries Administration Expenditure (pabpm)
Administration fees should be low in large schemes
54
55
Other undesirable practices

Broker fees increase
-
20
40
60
80
100
120
140
160
180
200
1998 1999 2000 2001 2002 2003 2004 2005 2006 2007 2008 2009 2010
pab
pa
(R)
CMS Annual Report 2010 - 2011
800% increase in five years
56
…broker fees increased sharply up to 2005 but has declined slightly since then…
What regulatory mechanisms have been instituted in light of this context?
57

3. History of Regulation
58
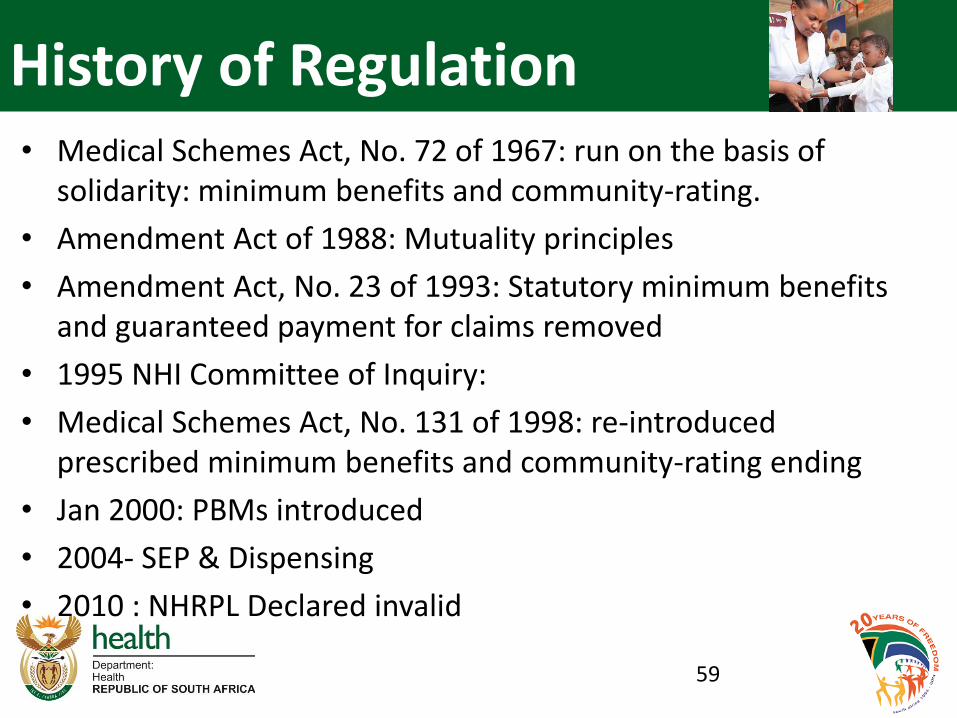
History of Regulation • Medical Schemes Act, No. 72 of 1967: run on the basis of
solidarity: minimum benefits and community-rating.
• Amendment Act of 1988: Mutuality principles
• Amendment Act, No. 23 of 1993: Statutory minimum benefits and guaranteed payment for claims removed
• 1995 NHI Committee of Inquiry:
• Medical Schemes Act, No. 131 of 1998: re-introduced prescribed minimum benefits and community-rating ending
• Jan 2000: PBMs introduced
• 2004- SEP & Dispensing
• 2010 : NHRPL Declared invalid
59

What are PMBs?
• In trying to protect the patients the Minister and CMS
established PMBs.
• Definition: Prescribed Minimum Benefits (PMBs) is a set of
defined benefits to ensure that all medical scheme members
have access to certain minimum health services, regardless of
the benefit option they have selected. The aim is to provide
people with continuous care to improve their health and well-
being and to make healthcare more affordable.
• However, this did not have the desired effect and instead there
were serious unintended consequences of bringing in
opportunism from providers.
• This opportunism subsequently raised medical inflation instead
of affordability.
60

History of PMBs 1996-1998 • History of PMBs 1996-1998
• The Medical Schemes Task Team (est. in 1997) responsible for defining and costing
minimum package of essential hospital care. Recommended that:
– Primary care, chronic, psychiatric, infectious disease should be provided by State,
from tax revenue.
– 598 diagnosis-treatment pairs were allocated to discretion (or urgency).
effectiveness, and cost categories in order to facilitate the prioritization process.
Interventions were then ranked according to various mixes.
– The final “core-package” excluded interventions that were ineffective, non-urgent,
non-life-threatening conditions.
• PMBs are not envisaged as hospital based services only.
– They can also be provided in an ambulatory setting, and schemes are obliged to pay
in full for these services.
– The Medical Schemes Act does not restrict the setting in which relevant care should
be provided and therefore should not be construed as preventing the delivery of
PMBs in outpatient settings where this is clinically appropriate.
61

What impact has regulation had on expenditure distribution?
62
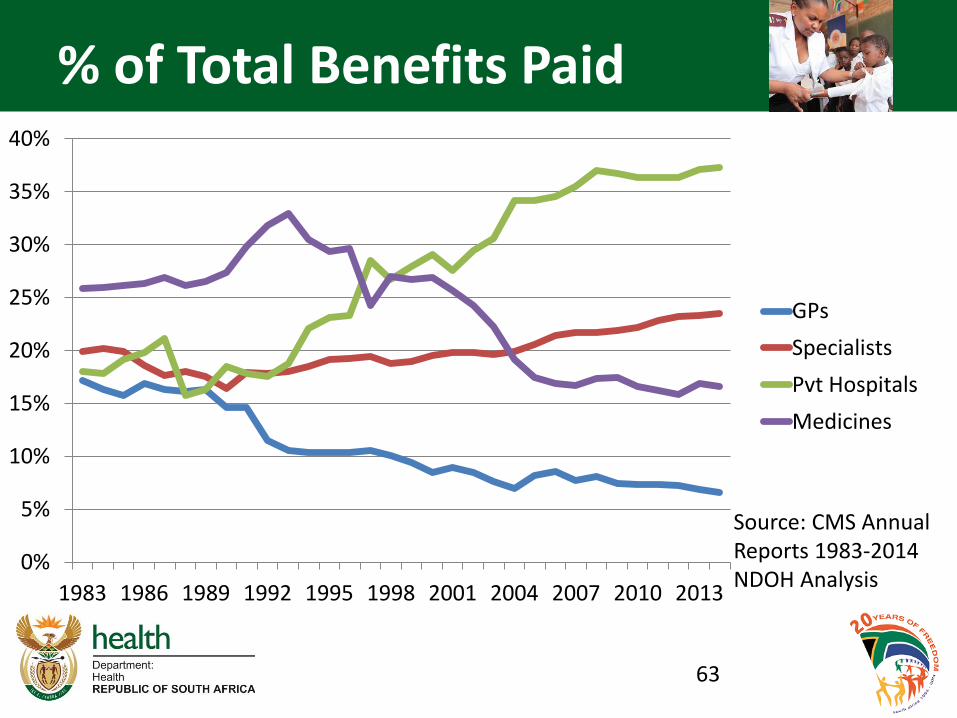
% of Total Benefits Paid
63
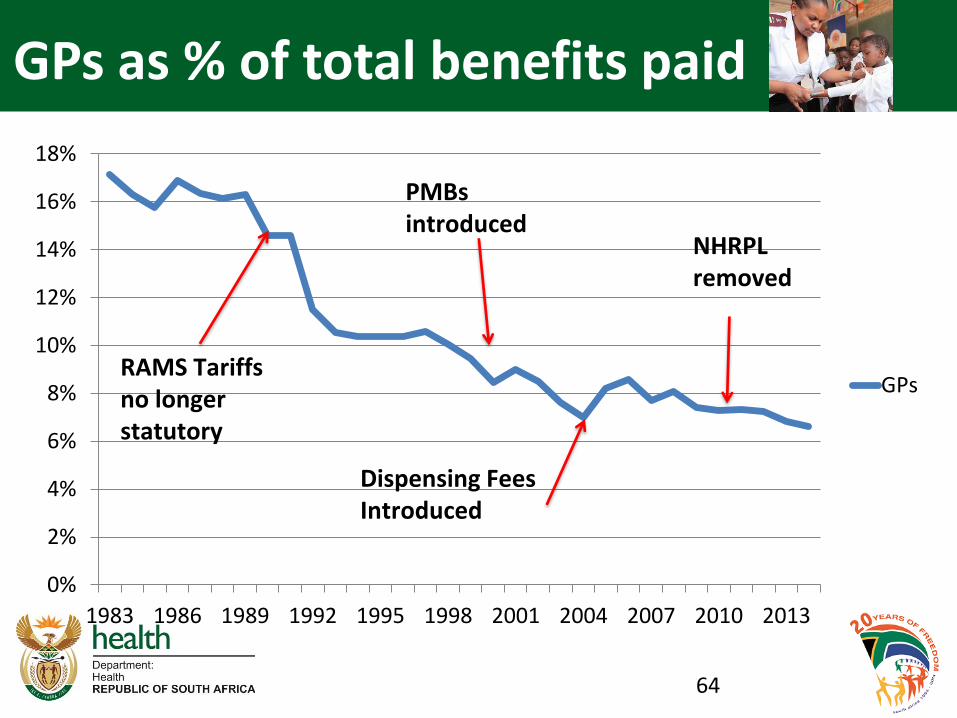
Source: CMS Annual Reports 1983-2014 NDOH Analysis
0%
5%
10%
15%
20%
25%
30%
35%
40%
1983 1986 1989 1992 1995 1998 2001 2004 2007 2010 2013
GPs
Specialists
Pvt Hospitals
Medicines
0%
2%
4%
6%
8%
10%
12%
14%
16%
18%
1983 1986 1989 1992 1995 1998 2001 2004 2007 2010 2013
GPsRAMS Tariffs no longer statutory
PMBs introduced
Dispensing Fees Introduced
NHRPL removed
GPs as % of total benefits paid
64
0%
5%
10%
15%
20%
25%
1983 1986 1989 1992 1995 1998 2001 2004 2007 2010 2013
Specialists
65
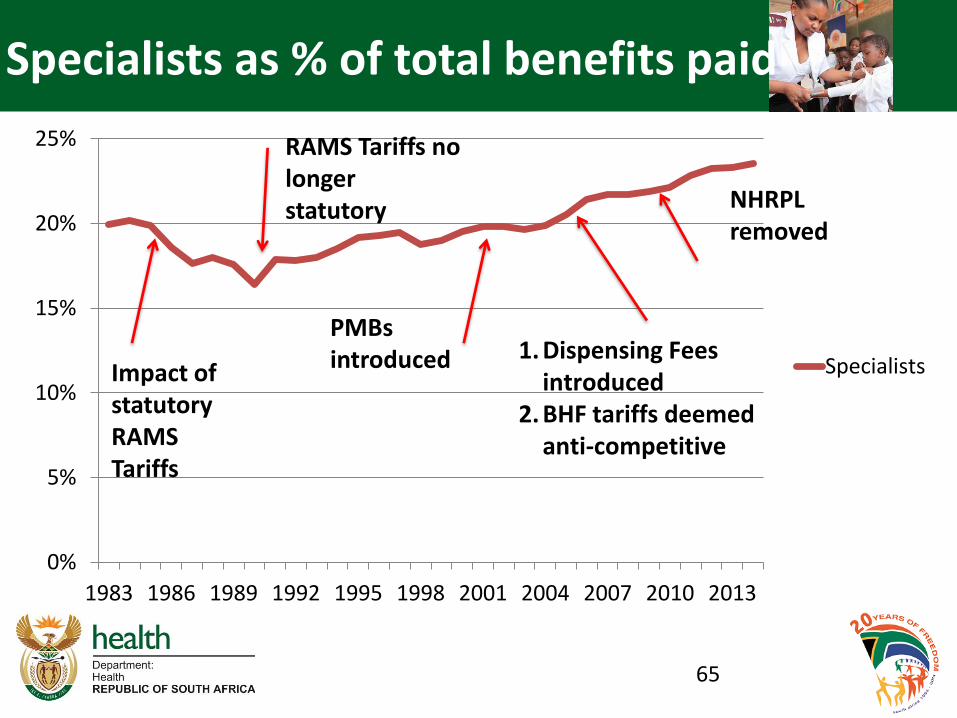
Specialists as % of total benefits paid
1. Dispensing Fees introduced
2. BHF tariffs deemed anti-competitive
Impact of statutory RAMS Tariffs
RAMS Tariffs no longer statutory
PMBs introduced
NHRPL removed
0%
5%
10%
15%
20%
25%
30%
35%
40%
1983 1986 1989 1992 1995 1998 2001 2004 2007 2010 2013
Pvt Hospitals
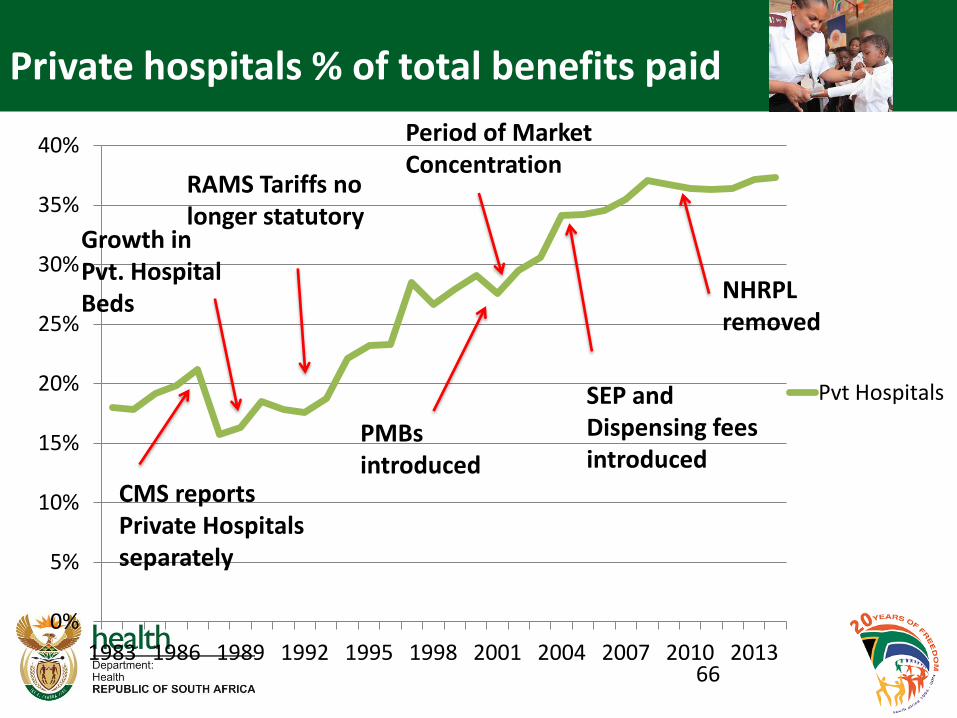
Private hospitals % of total benefits paid
66
NHRPL removed
Growth in Pvt. Hospital Beds
CMS reports Private Hospitals separately
RAMS Tariffs no longer statutory
PMBs introduced
SEP and Dispensing fees introduced
Period of Market Concentration

4. History of Tariff Setting
67
Reference Price List (RPL) • RAMS: (Board of Healthcare Funders, BHF): legislative responsibility of negotiating
service tariffs: Regulated maximum prices that providers could bill and were equivalent to
the reimbursement levels (last published in 2003).
• 1994: process was abolished through amendments to Medical Schemes Act (1967).
RAMS negotiated 'guideline prices', with provider organisations. The ‘Recommended Scale
of Benefits for Medical Practitioners’ aimed to assist medical schemes with embarking on
their own price negotiations with providers.
• SAMA: ‘Doctors’ Billing Manual’ competed with the RAMS reference prices, with fees
that exceeded the RAMS guideline prices. Patients paid the difference between the
reimbursed amount and the price charged. (last published in 2003)
• At the same time HASA received permission from the competition authorities publish a
‘Benchmark Guide to Fees for Medical Services’. SAMA published its last Benchmark
Guide to Fees for Medical Services in 2003.
68
2004 Comp. Comm. Ruling • 2004 Competition Commission ruling prohibited any collective
negotiation of prices: Ruled that the centralised tariff schedules were
set in a collusive manner, with anti-competitive outcomes.
• This ruling did not take into consideration the effect of the
practice, but only the form, relying on a per se prohibition provision,
which doesn’t require any justification or the weighing of effects of the
conduct in the market.
• The consequence of the ruling required medical schemes/patients
have to negotiate tariffs with individual healthcare providers.
69

National Health Reference Price List
• 2004-2006: Council for Medical Schemes established the National Health Reference
Price List (NHRPL) based on an agreed list of services and standardised coding
environment.
– Based on BHF tariff guide adjusted for CPI and some cost-based methodology
improvements
– Medical schemes could use the NHRPL to calculate their own reimbursement
levels based on membership and affordability, usually a percentage of the
NHRPL tariff.
– Set reimbursement level with no connection to the billed price charged by
providers.
– This resulted in members being billed for the 'balance' between the
NHRPL/reimbursement level and the billed prices.
– In the absence of penalties for exceeding the NHRPL provider groups in
positions of market power face no incentives to curb their fees.
70

NDOH assumes responsibility for the Reference Price List (RPL)
• December 2006 NDoH published regulations relating to the process of determining
RPL for comments, in terms of section 90(1)(u) and (v) of the National Health Act,
including labour costs
• July 2007 the Minister promulgated Regulations Pertaining to the Obtainment of
Information and the Processes of Determination and Publication of Reference Price
List ,GG 30110 under GNR681.
• February 2008 the Director General Health published Notice 190 of 2008, calling
for submissions from all stakeholders contemplated in Section 90(1)(v).
– This regulation served to invite private hospitals, medical practitioners and
medical schemes to submit information regarding the cost of running health
services.
71

RPL: Methodological Disagreements
• Non-representative sample size in the cost survey
• Incorrect cost data submitted by practitioners – identified
during verification exercise.
• Disagreement regarding acceptable occupancy rates.
• Disagreement regarding property valuation – replacement
value
• Providers unwilling to consent to verification process
• Private hospitals unwilling to share detailed information
regarding cost information
72
RPL: Legal Challenges
• 2009: HASA, SAMA, and others lodged legal action against
the Minister and the NDoH RPL.
• North Gauteng Division of the High Court: 28 July 2010:
Ruled that the underlying regulations for determining the RPL
were found to be invalid, due to the absence of consultations
between the Minister of Health and the National Health
Council.
73
Developments since 2010 • The HPCSA is empowered in terms of section 53 (3)(d) of the Health
Professions Act to determine and publish normative fees
• 2012: HPCSA attempted to issue ‘Guideline Tariffs’’ for the determination
of fee norms by the medical and dental professional board using the
CMS's NHRPL 2006 rates inflated by 46.66%.
• Various stakeholders objected to the proposal alleging that they had not
been consulted and that the basis on which the prices were decided was
arbitrary, flawed and possibly anticompetitive.
• The South African Private Practitioners Forum, which represents
specialists, threatened to take the Health Professions Council of South
Africa to court.
• A discussion document published inviting interested parties to participate
in voluntary price negotiation.
• Reluctance to participate in the voluntary price negotiation proposal –
specialists and private hospitals
74
5. Market Response to Absence of Tariff
75

• PMB regulations require that the medical scheme pays
the provider in full for PMB conditions.
• In the absence of tariff providers have used this
provision to:
– Price their services for PMBs higher than non-PMBs
– Classify conditions as a PMBs when they are not
76
Supply-Side Response (Perverse incentives)

Specialist billed rates for PMBs
“At cost” ruling
(November 2011)
Court application
filed
(September 2011)
77
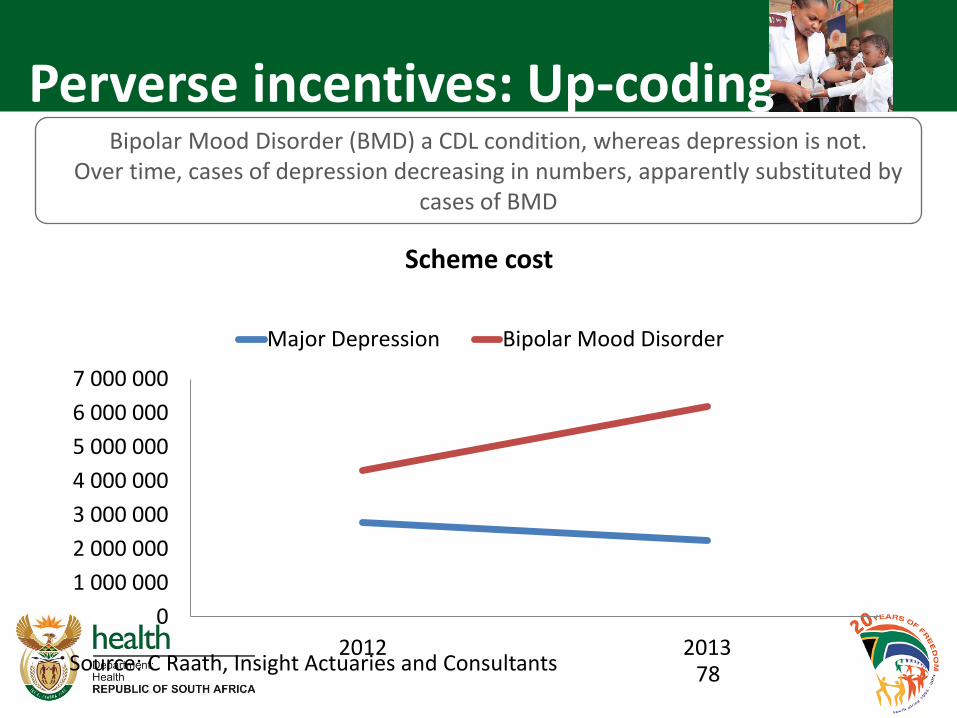
Perverse incentives: Up-coding
Source: C Raath, Insight Actuaries and Consultants
0
1 000 000
2 000 000
3 000 000
4 000 000
5 000 000
6 000 000
7 000 000
2012 2013
Scheme cost
Major Depression Bipolar Mood Disorder
Bipolar Mood Disorder (BMD) a CDL condition, whereas depression is not. Over time, cases of depression decreasing in numbers, apparently substituted by
cases of BMD
78

40
50
60
70
80
90
100
110
120
130
1402
00
7…
20
07
…
20
08
…
20
08
…
20
09
…
20
09
…
20
10
…
20
10
…
20
11
…
20
11
…
20
12
…
20
12
…
20
13
…
20
13
…
20
14
…
20
14
…
Non-PMB PMB Linear (Non-PMB) Linear (PMB)
Substitution effect between PMB and nonPMB coding for anaesthetist services
Source: C Raath, Insight Actuaries and Consultants 79

6. Effect of Private Market on Public Sector
80

Cream Skimming & Dumping
Private sector skims the healthy and
wealthy and dumps the sick and poor.
Examples of the following:
– Patients are transferred to the public sector
when their medical scheme benefits are
exhausted.
– Patients with suspected infectious diseases
are diverted to public sector.
– E.g. Ebola and TB
81
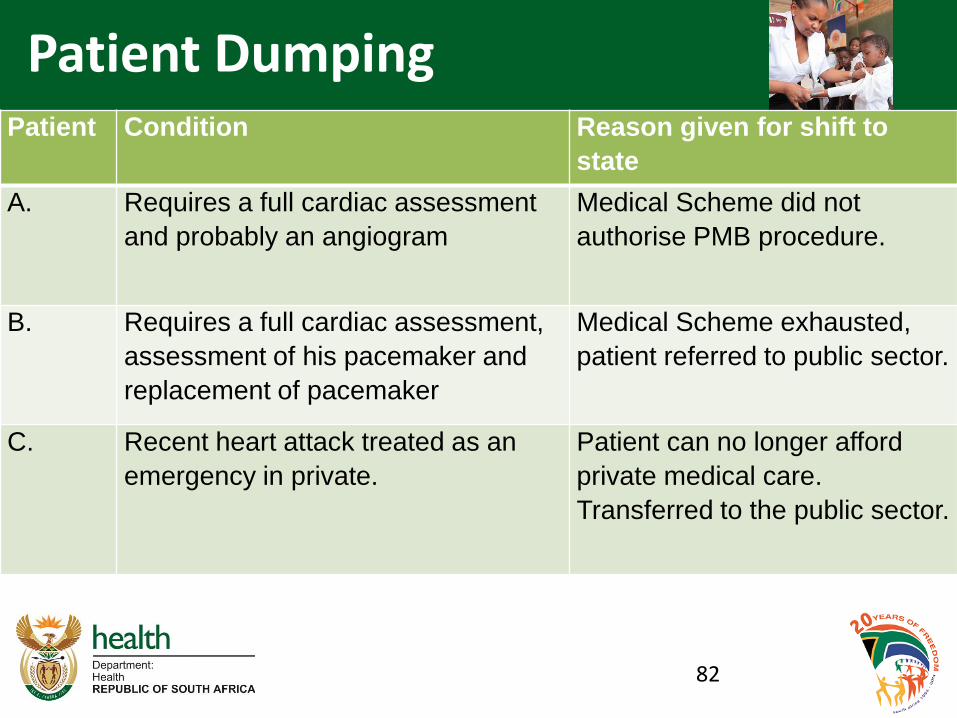
Patient Dumping Patient Condition Reason given for shift to
state
A. Requires a full cardiac assessment
and probably an angiogram
Medical Scheme did not
authorise PMB procedure.
B. Requires a full cardiac assessment,
assessment of his pacemaker and
replacement of pacemaker
Medical Scheme exhausted,
patient referred to public sector.
C. Recent heart attack treated as an
emergency in private.
Patient can no longer afford
private medical care.
Transferred to the public sector.
82

83
Private sector always to the rescue?

Example
84
• The impression is often that the private sector comes to the rescue of the public sector, but this is not necessarily so.
• The structure in the private sector does not encourage peer review or team-work because referral always comes with financial implications from one speciality to another. This opens room for many misdiagnoses. These misdiagnoses end up being picked up in the public sector. But this will never be reported anywhere.
Examples
85
• Quite often, patients are caught between the funder and providers and public facilities always come to their rescue. – E.g. Patient on health plan needing neurosurgery. Health plan, having
promised to give unending cash (as long as you’re admitted) insisted they would only give 50k but the private hospital insisted they wanted 250k. Despite being on this hospital plan, the public sector had to come to the rescue.
• Even patients in emergency situations are turned away from private hospitals if they can’t produce cash, in direct contravention of Section 27, subsection 3 of the Bill of Rights. – E.g. Patient with head injury had to be rescued. Scan done in private sector,
blood clot found but no treatment without 100k. Patient transferred to state.
The Workforce Auction
• The private sector currently has 80% of the specialists in the
country treating 16% of the population. Denying the poor who
have the GREATEST need access to care.
• The private sector competes with the public sector for limited
human resources
• It is able to offer higher salaries which draws health
professionals away from the public sector.
• The public sector is forced to offer high salaries (which it can
ill afford) to retain staff. (e.g. OSD), thereby reducing the
resources available to deliver services.
86

RWOPS
• When bed occupancy increases private hospitals access
additional nursing staff through nursing agencies.
• These agencies employ nurses who work full-time in the public
sector.
• This results in nurses working double shifts and putting patients
at risk.
• Academics leave teaching/training in pursuit of treating patients
in private hospitals.
87

• The general narrative is that the public sector is collapsing but the previous examples show otherwise.
• Part of this narrative stems from a completely wrong definition of what health is.
• The people who propagate this narrative see health as limited to what happens inside a hospital. They see health as only clinical medicine with particular emphasis on hotel services.
• To put health in perspective you need to look at it holistically. That is, both population health, commonly referred to as public health and clinical medicine (which is what happens in hospitals).
88
Public Sector
• In South Africa the people who are propagating this narrative of collapse are deliberately and sometimes conveniently ignoring the huge strides made in population health.
• Let us examine the facts…
89
Public Sector

Achievements of the Country: Population Health
SelectedOutcomes 2009 2014Lifeexpectancy(years) 57.1 62.9<5mortality/1000livebirths 56.0 39.0Infantmortality/1000livebirths 39.0 28.0Neo-natalmortality/1000livebirths 14.0 11.0Maternalmortalityratio/100000livebirths 281.0 155.0
90

Achievements of the Country: Population Health
In recent times the public health sector has achieved a number of milestones for which South Africa has been lauded by the international community. These include:
– 10 Years ago, only 400 000 people were on treatment for HIV. Now we have the largest HIV treatment programme in the world with 3.4 million people on treatment and 10 million people tested for HIV annually
– The programme to prevent mother to child transmission of HIV has reduced the HIV transmission rate from 8% in 2008 to 1.5% in 2015. This is done by providing mothers with ARVs at 14weeks of pregnancy in our health facilities:
• Reduced HIV infections from 70,000 babies in 2004 to less than 7,000 babies today.
91

Achievements of the Country: Population Health • Progress has been made in the control of TB where our treatment
success for drug sensitive TB has reached 82% (Was 67% in 2009).
• 60% of all people on isoniazid preventive therapy (IPT) in the world are in South Africa at 552 000 patients (WHO Global TB Report 2015).
• First country to introduce GENEXPERT and in 2015 50% of the global volume of all tests are done in South Africa.
• The rollout of new multi-drug resistant TB medicines (Bedaqualine): 63% of global patients on treatment are in South Africa.
• This achievement is internationally recognised, hence I’m travelling to New York to receive an honour together with the Minister of Health from Pakistan and Prof. Paul Farmer (Prof Infectious Diseases at Harvard) at USAID 2016 World TB Day celebration 17 March 2016.
92

Achievements of the Country: Population Health
• First African country to introduce vaccines for pneumonia and diarrhea
(rotavirus & pneumococcal) in 2009 which has had a significant impact on
these childhood diseases;
– 2008 – 2012: 56% decrease in the child deaths due to diarrhea and
70% reduction in hospital admissions due to pneumonia with and a 53%
decline in deaths from pneumonia. (National Institute for Communicable
Diseases)
• In 2014 the human papiloma virus (HPV) vaccine was introduced to
prevent cervical cancer;
– Each year since 2014 more than 360 000 9yr old girls are given two
doses of the vaccine as part of the integrated school health programme.
– We are the first country in Africa to have a national programme (which
is fully funded by the national fiscus).
93

Achievements of the Country: Population Health
We are steadily decreasing maternal mortality, largely through our HIV
programme
– In order to empower pregnant women with knowledge about
pregnancy and how to raise infants we launched Momconnect.
– More than 807 000 pregnant women have received weekly
messages from the Department;
– The system allows unsolicited reporting of complaints and
complements – cumulatively we have received 744 complaints and
4639 compliments;
– Momconnect was awarded a prize for innovation from the African
Association of Public Administration and Management
94
These can’t be examples of a collapsing system.
95
Sometimes the manner in which information is brought
to the public creates a feeling of doom and gloom or
the general narrative of collapse…
96
Public Communication

97

98
• What detractors are actually referring to are problems in individual
health facilities that impact clinical medicine.
• We ourselves have picked this up as far back as 2010 when we
commissioned four companies to audit all of our health facilities – all
3 500 of them.
– HEALTH SYSTEMS TRUST (HST): management, coordination
with provinces, data quality control.
– ARUP ENGINEERING: Provided project managers
– EXPONANT: Built environment specifications.
– HEALTH INFORMATION SYSTEMS PROGRAMME (HISP):
Field workers, data capturing, database administration.
• This process led to the concept of the IDEAL CLINIC.
99
Public Sector

An Ideal clinic is a health facility that possesses the following characteristics:
“It is a clinic that opens on time in the morning according to its set operating hours and
does not close until the last patient has been assisted, even if it is beyond the normal
closing hours. It is staffed by health care providers who treat people with dignity, and
observe the Batho Pele principles of Access, Consultation, Courtesy, Information,
Service Standards, Openness and Transparency, Redress and Value for Money.......It is
very clean, promotes hygiene, and takes all precautionary measures to prevent the
spread of disease. It has reasonable waiting times and community members do not
have to sacrifice their entire working day to seek health care. It provides a
comprehensive package of good quality health services every day and community
members do not have to return on different days for different services. It has the basic
necessities available such as essential medicines. It refers people to higher levels of
care timeously when this is required. It works together with the community it serves with
diverse stakeholders, in promoting health and socio‐economic development. Finally,
community members would say an ideal clinic is one that we can be proud of, and call it
‘our own clinic’ rather than ‘a government clinic’ or a ‘state health facility’.”
Address by President Zuma at launch of Operation Phakisa 2: Ideal Clinic and
Maintenance. Pretoria, 18 November 2014
100
Public Sector Ideal Clinic
In the final analysis the problems in the public sector can be traced
to four main illnesses. We are focussing on these four to change the
whole narrative.
1. Human resources
– Appointments
– Planning, development and management
2. Financial management
3. Procurement & Supply Chain function
– Problems pertaining to stock management (pharmaceuticals,
consumables, equipment, devices)
– Delayed payment of suppliers with consequent delayed
delivery.
4. Infrastructure and maintenance/repairs of infrastructure
101
The Big Four

These Big Four are in line with the findings of the
Harvard Global Health Systems Unit which was
assessing problems of health care in Africa, South-
East Asia and Latin America.
• This review found problems stem from:
– HR
– Procurement
– Supply chain
102
The Big Four

7. Overview & Solutions
103
Global Challenges
The World Health Report of 2008 by WHO identifies
three factors, which prevent progress and good
outcomes within health systems globally:
• Hospicentricism (Largely curative)
• Fragmentation
• Uncontrolled commercialism
Again, just like the seven structural problems
mentioned by Dr Margaret Chan, South Africa faces
all three of these factors.
104

Is the Constitutional right to health care services as a basic right in conflict with the rights of
business to provide shareholder values?
105

If current trends in Private Healthcare Expenditure continue, total expenditure by medical schemes will grow from R124b in 2014 to R514b by 2026
106
-
100
200
300
400
500
600
2014 2015 2016 2017 2018 2019 2020 2021 2022 2023 2024 2025 2026
PRIVATE HEALTH SPENDING BY MEDICAL SCHEMES BY 2026 (in 2014 RANDS)
GPs
Specialists
Pvt Hospitals
Medicines
Total

Projected Total Private Health Expenditure
107
Rand
Million 11/12 12/13 13/14 14/15 15/16 16/17 17/18
Annual
Nominal
Change
Total
private
sector
health 130,196 141,835 155,689 166,735 177,873 189,082 200,210 7.40%
Projected to be R 200 Billion by 2017/18

• Based on these observations, some so-
called analysts/experts are preaching that
NHI will be an unaffordable system.
• It is because they are basing their
calculations on this model of uncontrolled
commercialism as illustrated in the
previous two slides.
108
Uncontrolled commercialism
Solutions for South Africa
The solution is the pooling of funds into a
single fund to enable access to good
quality, affordable health for the entire
population, not for a select group of
people; such a system must be dictated to
by the health needs of the population and
not by uncontrolled commercialism as it is
at the moment.
109

Solutions for South Africa Within such a system there needs to be a massive
reorganisation of the health care system, as
mentioned in paragraph 2 and chapter 6 of the White
Paper on NHI.
The heartbeat of such a system will be Primary Health
Care. That means a system based on promotion of
health, prevention of diseases and the entry to the
health system at the PHC level with upward referral
with GPs, PHC practitioners and PHC facilities being
gatekeepers.
110
Supply-Side Regulation
• Intervention in a market through regulation is justified
when the absence of regulation would result in the
market failing to achieve an efficient allocation of
commodities.
• Additionally, where market fails to achieve outcomes in
line with social justice, interventions may be justified.
• Section 27 of the Constitution places an obligation on
the Minister to implement measures that would achieve
the progressive realisation in accessing healthcare
• Supply-side regulation would include regulation of price
and reimbursement mechanisms, including alternative
reimbursement mechanisms.
111
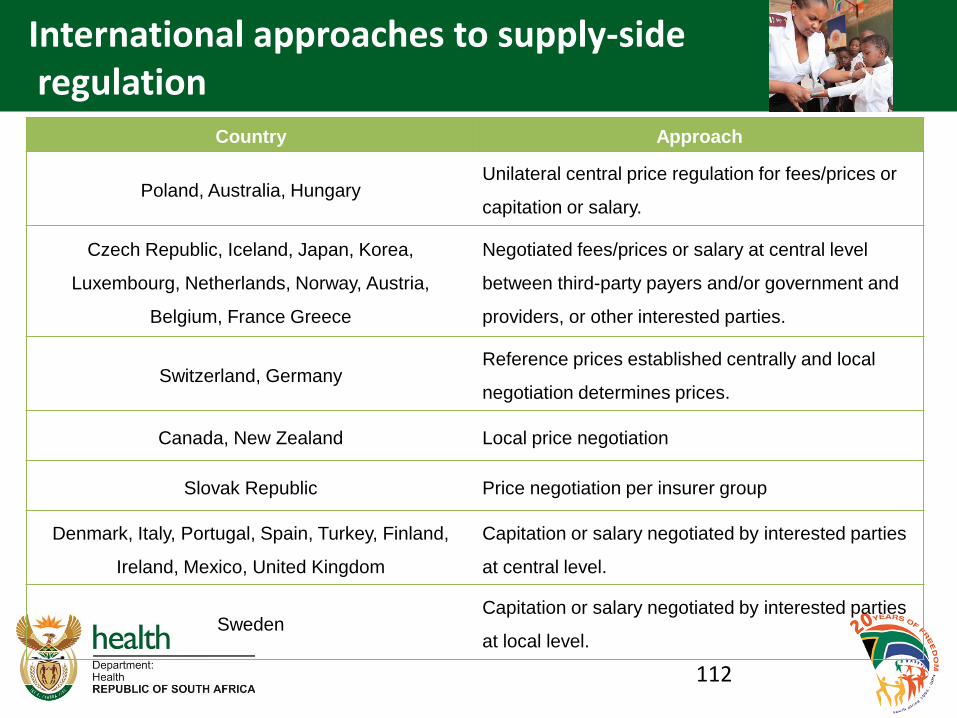
International approaches to supply-side regulation
Country Approach
Poland, Australia, Hungary Unilateral central price regulation for fees/prices or
capitation or salary.
Czech Republic, Iceland, Japan, Korea,
Luxembourg, Netherlands, Norway, Austria,
Belgium, France Greece
Negotiated fees/prices or salary at central level
between third-party payers and/or government and
providers, or other interested parties.
Switzerland, Germany Reference prices established centrally and local
negotiation determines prices.
Canada, New Zealand Local price negotiation
Slovak Republic Price negotiation per insurer group
Denmark, Italy, Portugal, Spain, Turkey, Finland,
Ireland, Mexico, United Kingdom
Capitation or salary negotiated by interested parties
at central level.
Sweden Capitation or salary negotiated by interested parties
at local level.
112

0%
5%
10%
15%
20%
25%
30%
35%
1983 1986 1989 1992 1995 1998 2001 2004 2007 2010 2013
Introduction of SEP and Dispensing Fees
Impact of Regulation on Medicine Costs
113

Move towards a fairer, more efficient
health system for all South Africans;
one based on the values of justice,
fairness and social solidarity.
114