national crop loss assessment network: quality assurance program
TRANSCRIPT
Environmental Pollution 53 (1988) 89-98
National Crop Loss Assessment Network: Quality Assurance Program
Deborah S. Coffey, Jeffrey C. Sprenger,
Northrop Services, Inc., Corvallis, Oregon, USA
David T. Tingey, Grady E. Neely* and James C. McCarty
US Environmental Protection Agency, Corvallis, Oregon, USA
ABSTRA CT
A quality assurance program was incorporated into the National Crop Loss Assessment Network ( NCLAN ) program, designed to assess the economic impacts of gaseous air pollutants on major agricultural crops in the United States. To satisfy US EPA requirements that all environmental data collected be of known and documented quality, adequate for the intended use, the quality assurance program developed standardized research and monitoring protocols among sites, and included a range of audit and review procedures. The goal of the quality assurance program was to quantitatively describe the overall quality of data collected in terms of precision, accuracy, completeness, representativeness, and comparability. From this program, it can be concluded that (1) project data quality objectives were valuable for determining the acceptability of data from diverse sites, (2) standardized protocols ensured data comparability among research sites, (3) independent on-site audits served to evaluate protocol adherence, and (4) precision and accuracy measurements provided a way to assess data quality, determine data acceptability, and indicate the need for instrument adjustment or repair.
I N T R O D U C T I O N
The National Crop Loss Assessment Network (NCLAN) was designed to assess the economic impacts o f gaseous air pollutants on major agricultural crops in the United States. The 7-year N C L A N program, conducted at five
* To whom correspondence should be addressed. 89
Environ. Pollut. 0269-7491/88/$03"50 © 1988 Elsevier Science Publishers Ltd, England. Printed in Great Britain
90 Deborah S. Coffey et al.
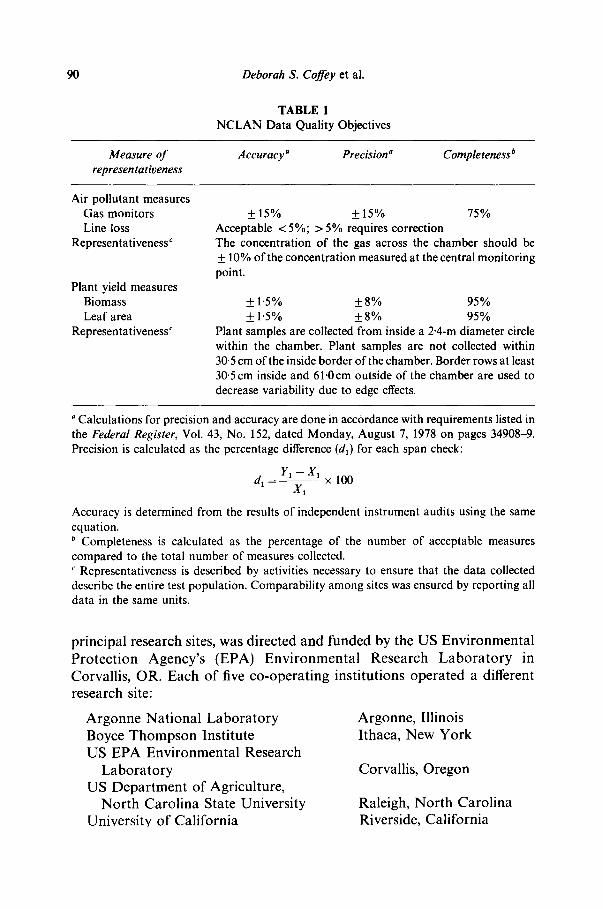
TABLE 1 NCLAN Data Quality Objectives
Measure of Accuracy a Precision a Completeness b representativeness
Air pollutant measures Gas monitors Line loss
Representativeness c
Plant yield measures Biomass Leaf area
Representativeness c
_+ 15% _+ 15% 75% Acceptable <5%; > 5% requires correction The concentration of the gas across the chamber should be _+ 10% of the concentration measured at the central monitoring point.
_+ 1-5% + 8% 95% + 1'5% _+8% 95%
Plant samples are collected from inside a 2'4-m diameter circle within the chamber. Plant samples are not collected within 30'5 cm of the inside border of the chamber. Border rows at least 30.5 cm inside and 61.0cm outside of the chamber are used to decrease variability due to edge effects.
Calculations for precision and accuracy are done in accOrdance with requirements listed in the Federal Register, Vol. 43, No. 152, dated Monday, August 7, 1978 on pages 34908-9. Precision is calculated as the percentage difference (dl) for each span check:
Yt - Xl d 1 - - x 100
XI
Accuracy is determined from the results of independent instrument audits using the same equation.
Completeness is calculated as the percentage of the number of acceptable measures compared to the total number of measures collected. c Representativeness is described by activities necessary to ensure that the data collected describe the entire test population. Comparability among sites was ensured by reporting all data in the same units.
principal research sites, was directed and funded by the US Environmental Protection Agency's (EPA) Environmental Research Laboratory in Corvallis, OR. Each of five co-operating institutions operated a different research site:
Argonne National Laboratory Boyce Thompson Institute US EPA Environmental Research
Laboratory US Department of Agriculture,
North Carolina State University University of California
Argonne, Illinois Ithaca, New York
Corvallis, Oregon
Raleigh, North Carolina Riverside, California
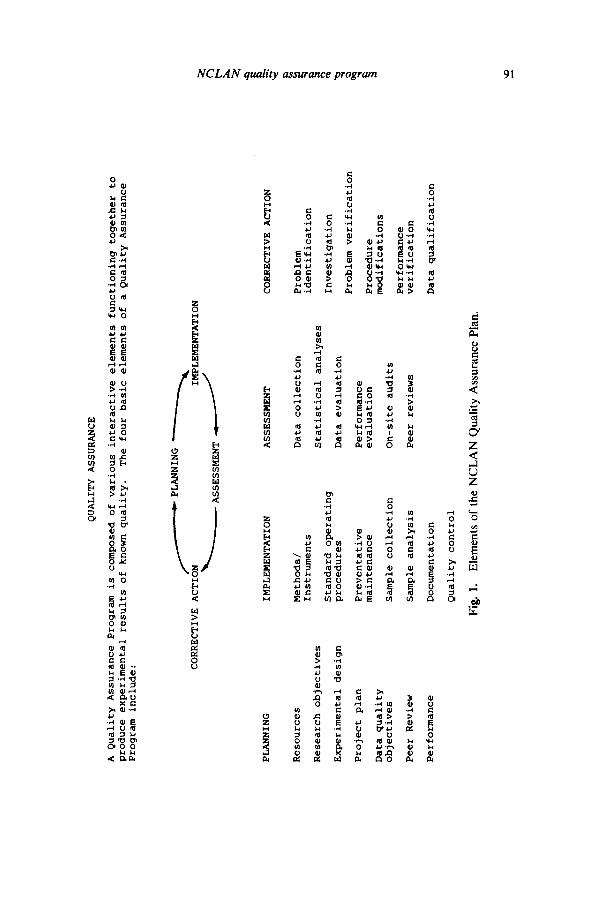
QUALITY ASSURANCE
A Quality Assurance Program is composed of various interactive elements functioning together to
produce experimental results of known quality.
The four basic elements of a Quality Assurance
Program include:
/...------~PLANNING
~~
CORRECTIVE ACTION
IMPLEMENTATION
ASSESSMENT
~
J
PLANNING
Resources
Research objectives
Experimental design
Project plan
Data quality
objectives
Peer Review
Performance
IMPLEMENTATION
ASSESSMENT
Methods/
Instruments
Standard operating
procedures
Preventative
maintenance
Sample collection
Sample analysis
Documentation
Quality control
Fig.
1.
Data collection
Statistical analyses
Data evaluation
Performance
evaluation
On-site audits
Peer reviews
Ele
men
ts o
f th
e N
CL
AN
Qua
lity
Ass
uran
ce P
lan.
CORRECTIVE ACTION
Problem
identification
Investigation
Problem verification
Procedure
modifications
Performance
verification
Data qualification
q ~D
92 Deborah S. Coffey et al.
Sites were chosen to represent distinctly different climatological conditions in regions growing different crop species. Site choice focused on established research institutions with experience in evaluating air pollutant effects on vegetation. Open-topped exposure chambers were used to subject agricultural crops to various exposure regimes of ozone (03) and sulfur dioxide (SO2) over a 7-year period from 1980 to 1986 (Heck et al., 1982; 1983; 1984a; 1984b). Concentrations of pollutants and plant yield were measured to determine dose-response correlations.
To satisfy EPA requirements that all environmental data collected be of known and documented quality, adequate for the intended use, NCLAN established a quality assurance (QA) program, the goal of which was to quantitatively describe overall data quality in terms of precision, accuracy, completeness, representativeness, and comparability (Table 1). Through the QA program, research and monitoring protocols were standardized among sites, and a range of audit and review procedures was developed.
A QA program is composed of four interactive elements: planning, implementation, assessment, and corrective action, which function together to ensure experimental results of known quality (Fig. 1). NCLAN was one of the first EPA funded biological research projects to develop a QA program in order to evaluate data quality.
METHODS
The NCLAN QA project plan defined methods to be used by all project participants. Calibration procedures, preventative maintenance, and corrective actions were specified. Each site prepared standard operating procedures (SOPs) adapting NCLAN methods to their specific instruments and developed an addendum to the QA project plan detailing daily protocols and quality control (QC) checks to be observed. On-site audits were conducted annually at each site by QA auditors in order to (1) evaluate instrument performance, (2) review site operations, (3) ensure adherence to protocols, (4) assess comparability among sites in the implementation of the QA program, and (5) review data management practices. This discussion focuses on the program's data quality objectives (DQOs), on-site audits, and performance evaluations, all of which were used to assess the quality of NCLAN data collection activities.
Data quality objectives are qualitative and quantitative statements of the minimum quality required for data supporting a specific research objective or policy decision. For cost effective experimental design, it is necessary to anticipate the level of resolution and the quality of data needed and to document this in terms of DQOs. DQOs are based on the best information
N C L A N quality assurance program 93
available before data Collection and may be modified after evaluation of the initial data collected. Early in the planning stages of NCLAN, participating scientists and ultimate users of the data defined DQOs in order to establish limits of acceptability for each measured parameter. Research objectives and available resources were carefully considered in the development of the NCLAN experimental design. The final project design was determined after extensive EPA internal review and external peer review of the NCLAN experimental design and the DQOs. The NCLAN DQOs (Table 1) in- corporate modifications made during the evaluation of initial precision and accuracy data.
Technical systems audits were conducted annually at each site to evaluate the implementation of the QA program. Recommendations were made to ensure that all sites were collecting data in the same manner. Innovative modifications that improved the efficiency or accuracy of the protocols were shared among sites.
Performance evaluations were used to quantify the efficiency of pollutant sample lines and monitors in terms of precision and accuracy. First, certified reference gases of known composition and concentration were measured. Then, accuracy for pollutant monitors was determined by calculating the difference between the observed and expected value of the reference gas. Calculations for precision and accuracy for pollutant monitoring equipment were performed in accordance with requirements listed in the Federal Register, Vol. 43, No. 152, dated Monday, August 7, 1978 on pages 34908-9. Air monitoring equipment was audited yearly by an independent reviewer using certified standard gases. The auditor performed a five-point calibration for each monitor and determined the slope and intercept of the regression line relating instrument response to certified concentrations. The performance of each instrument tested was rated as excellent, satisfactory, or unsatisfactory, based on the difference between slope and intercept for the observed value regressed against the concentration of the reference gas.
At least twice a year, per cent loss ofO 3 in the Teflon sample line between each chamber and the monitor was determined by injecting a known concentration ofO 3 into the sample line and measuring the concentration at the analyzer. Weekly calibration checks of monitoring equipment (zero and span checks) were conducted.
Analytical balances and leaf area meter calibration were evaluated with every use. Analytical balances were checked against National Bureau of Standards (NBS), or NBS-traceable, class 'S' standard weights. Leaf area meters were evaluated using an object of known area verified by planimetric or graphical methods. The resulting data were statistically evaluated to determine the quality of the NCLAN data collected and to compare the data generated at each site.
94 Deborah S. Coffey et al.
When calibration checks, performance evaluations, audits, or a review of QC data revealed that DQOs had been exceeded, corrective actions were initiated. Reviews of QC and monitoring data included statistical evaluations of results that made it possible to identify outlier values and perform checks for range and reasonableness. If instrument performance was at fault, acceptable instrument performance had to be demonstrated before data collection could resume. When audits or zero-span checks revealed unacceptable data, the instrument was removed from service and the data rejected. Following adjustment or repair, the instrument was subjected to a five-point calibration before being returned to service.
RESULTS
Air pollutant measurements
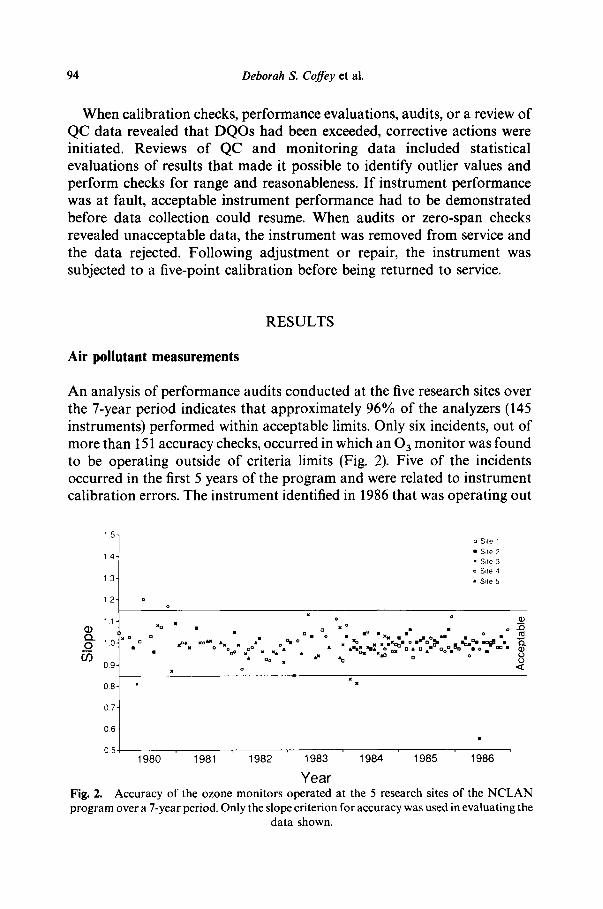
An analysis of performance audits conducted at the five research sites over the 7-year period indicates that approximately 96% of the analyzers (145 instruments) performed within acceptable limits. Only six incidents, out of more than 151 accuracy checks, occurred in which an 0 3 monitor was found to be operating outside of criteria limits (Fig. 2). Five of the incidents occurred in the first 5 years of the program and were related to instrument calibration errors. The instrument identified in 1986 that was operating out
1.5-
1 4 -
1.3-
1,2-
1.1-
o.. _o 10- 03
0.9-
0 8 -
0 .7 '
o Sbte 1
• S~te 2
• Site 3
o Stte 4
• Srte 5
• o o O )
x o x~ • a o • • o
° 2 . . . " ° ' ° " " " ' " . . . .
0 6
0 5 1980 1981 1982 1983 1984 1985 1986
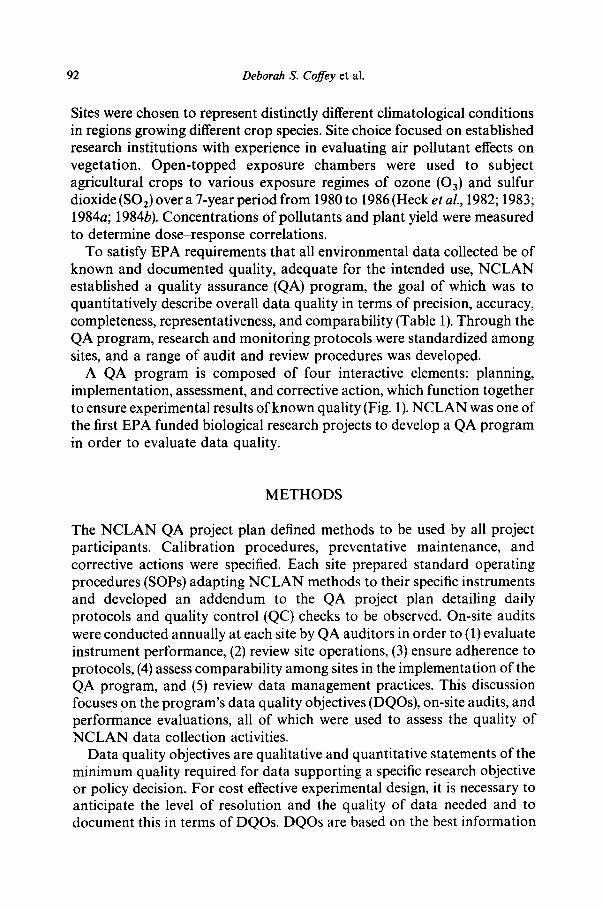
Y e a r Fig. 2. Accuracy of the ozone monitors operated at the 5 research sites of the N C L A N program over a 7-year period. Only the slope criterion for accuracy was used in evaluating the
data shown.
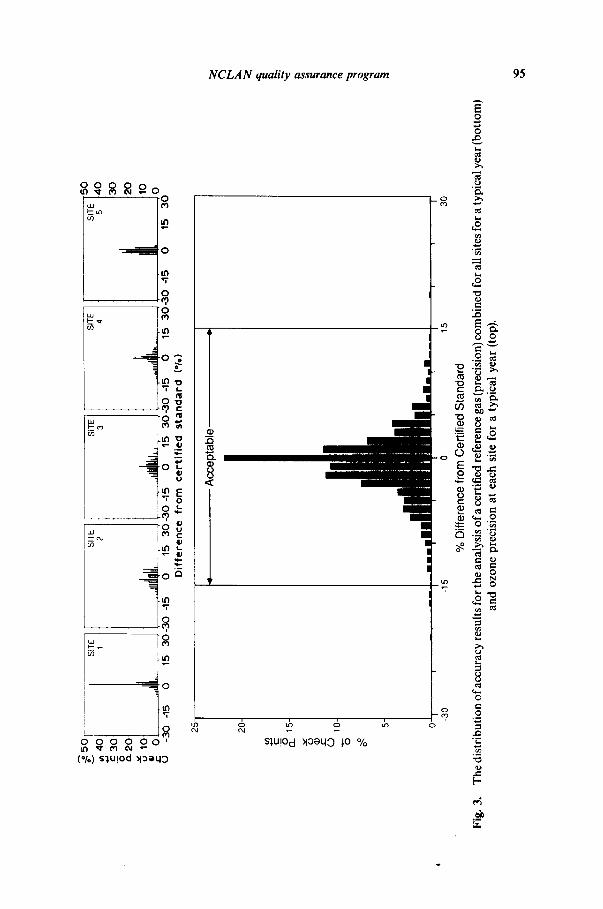
Fig.
3.
5°I
T S,
TE
= 4°
1 I
' o
3°1
I o
. 2
0 lol
dl -3
o-~5
o
is
3o-3
o-15
o
25
20- 0
30
¢-
~1
5-
O)
t-
O
10-
SITE
2 SI
TE
SITE
4
.......,,l
ll~lll.I
..
..
..
..
..
..
dill,
, .......
15
30-3
045
6 15
36
-30'
-1~,
0
15'
30-3
0 -1
5 D
iffe
ren
ce
fr
om
c
ert
ifie
d
sta
nd
ard
(*
1.)
Acc
epta
ble
..
..
.
5 4
0
30
,o
0 15
30
-15
0 15
30
% D
iffer
ence
fro
m C
ertif
ied
Stan
dard
T
he d
istr
ibut
ion
of a
ccur
acy
resu
lts
for
the
anal
ysis
of
a ce
rtif
ied
refe
renc
e ga
s (p
reci
sion
) com
bine
d fo
r al
l sit
es fo
r a
typi
cal y
ear
(bot
tom
) an
d oz
one
prec
isio
n at
eac
h si
te f
or a
typ
ical
yea
r (t
op).
96 Deborah S. Coffey et al.
o f criteria limits required repair. These results suggest that routine calibration checks eliminated calibration inaccuracy in the program, and that routine procedures became more effective over time in eliminating calibration error. Accuracy checks were critical for identifying instrument failure.
Air monitor ing equipment was evaluated weekly using a single-point calibration check with certified standard gases. Precision was determined f rom comparison over time of the difference between instrument response and certified standard gases. As shown in Fig. 3 (top), precision differed among sites. One source of this variability was undoubtedly the use of different monitors among the sites. Both chemiluminescent and ultraviolet photometr ic monitors were used. Repeated measures of accuracy (precision) are expected to be normally distributed about the true concentrat ion of the certified standard (Fig. 3--bottom). Over 90% of zero-span checks were within the specified precision of _ 15%, and all data met completeness requirements.
Ozone sample line loss
The Oa loss in sample lines averaged 7.8 ± 4.8% (1 sd averaged over all lines/site/year). The lines ranged in length from 15 to 65 m. Typically, when line loss was > 5%, the measured 0 3 concentrat ion in each chamber was adjusted to account for loss in each sample line.
Plant yield measurements
Before and after each weighing session, a certified mass was placed on the analytical balance to determine if the instrument was functioning within acceptable limits. I f an error was detected at the start of a weighing session,
TABLE 2 Summary of Quality Control Weight Measurements to Evalu-
ate Analytical Balance Performance
Site Number of Mean % % Meeting weighings accuracy DQOs ~
1 361 99"95 100.0 2 41 99"97 100.0 3 962 99.89 99'9 4 96 99-98 100.0 5 138 99"98 100.0
DQOs Data Quality Objectives.

NCLAN quality assurance program 97
TABLE 3 Summary of Quality Control Leaf Area Measurements to
Evaluate Meter Performance
Site Number of Mean % % Meeting areas measured accuracy DQOs °
1 52 98.27 90.4 2 50 99"16 100-0 3 273 99.69 100.0 4 13 99.47 100.0 5 29 99.63 100.0
a DQOs Data Quality Objectives.
no data were collected until the balance was adjusted. If an error was detected at the end of the session, the data were flagged and the certified mass reweighed after the balance was adjusted. As shown in Table 2, essentially all data met the DQO at first weighing.
Before and after each set of leaf area measurements, a known area was used to determine if the leaf area meter was functioning within acceptable limits. As with the analytical balance, if acceptable limits are not met, no data were collected until the meter was repaired. Suspect data were flagged, and performance of the repaired meter was verified prior to collection of subsequent measures. Leaf area meters usually operate reliably. However, as can be seen from the data presented in Table 3, Site 1 had recurrent problems with a meter that finally required repair.
DISCUSSION
The objective of the N CLAN QA program was to ensure that collected data were scientifically sound and of known quality. From the NCLAN experience, we can draw several conclusions: (1) project DQOs were valuable in determining the acceptability of data generated at diverse sites, (2) standardized protocols ensured data comparability among research sites, (3) independent on-site audits served to evaluate protocol adherence, and (4) precision and accuracy measurements provided a way to assess data quality in quantitative terms, determine data acceptability, along with the need to qualify some values, and indicate the need for instrument adjustment or repair. Site participants initially viewed project QA requirements as extra effort. As the program progressed, slow acceptance of QA/QC activities was transformed into commitment and support. The identification of situations in which instrument performance did not meet specifications convinced
98 Deborah S. Coffey et al.
participants of the need to routinely monitor instrument calibration and efficiency. The QA program required documentat ion of QA/QC activities. Project participants thus acquired confidence in the quality of data collected, based on the availability of data quality documentat ion over the 7-year durat ion of the project.
A C K N O W L E D G E M E N T S
We wish to express our thanks to each of the five sites mentioned in the introduction for collection of the QC data and to the auditors from Research Triangle Institute. This manuscript was prepared by Nor throp Services, Inc. pursuant to contract No. 68-03-3246 with the US Environ- mental Protection Agency.
R E F E R E N C E S
Heck, W. W., O. C. Taylor, R. Adams, G. Bingham, J. Miller, E. Preston & L. Weinstein (1982). Assessment of crop loss from ozone. J. Air Pollut. Control Assoc., 32, 353-61.
Heck, W. W., R. M. Adams, W. W. Cure, A. S. Heagle, H. E. Heggestad, R. J. Kohut, L. W. Kress, J. O. Rawlings & O. C. Taylor (1983). A reassessment of crop loss from ozone. Environ. Sci. Technol., 17, 573A-81A.
Heck, W. W., W. W. Cure, J. O. Rawlings, L. J. Zaragoza, A. S. Heagle, H. E. Heggestad, R. J. Kohut, L. W. Kress & P. J. Temple (1984a). Assessing impacts of ozone on agricultural crops: I. Overview. J. Air Pollut. Control Assoc., 34, 729 35.
Heck, W. W., W. W. Cure, J. O. Rawlings, L. J. Zaragoza, A. S. Heagle, H. E. Heggestad, R. J. Kohut, L. W. Kress & P. J. Temple (1984h). Assessing impacts of ozone on agricultural crops: II. Crop yield functions and alternative exposure statistics. J. Air Pollut. Control Assoc'., 34, 810 17.