national conference of state legislatures energy
TRANSCRIPT

National Conference of State Legislatures
Energy Efficiency Institute Smart Grid and Demand Side
Management
Fred StoffelJune 24, 2008
Denver, Colorado

2
Xcel EnergyXcel Energy
Northern States Power Northern States Power CompanyCompany-- MinnesotaMinnesota Northern States Power Northern States Power
CompanyCompany-- WisconsinWisconsin

3
Today’s Electricity GridToday’s Electricity Grid

4
““Smart” Electricity GridSmart” Electricity Grid
Source: “How Brand Attributes Drive Financial Performance”, Marketing Science Institute, Natalie Mizik and Robert Jacobson
Digital intelligence infused throughout the grid
Energy storage devices
Local power generation, distributed generation
Digital sensors and controls
Self-balancing and self-monitoring system
Real-time data, analytics and price signals
Two-way communication
More green energy
Smart homes and buildings
Optimization of the entire grid and energy pathway

5
Xcel Energy’s Smart Grid Xcel Energy’s Smart Grid VisionVision
Use technology to fundamentally change the way we create, deliver and use energy. Must be fully-integrated, and allow customers to make informed choices about energy use. Increase use of clean generating resources.
End result? An improved system with environmental, financial and operational benefits.

6
Vision is BroadVision is Broad
Not just a smart meter
Horizontal integration: Generation, transmission, distribution, customer
Leverages partner co-investment, collaborative model
Boulder: An evolving project
Not all components will be successful, testing many hypotheses
Customer choice is key, providing more information

7
Benefits ofBenefits of Smart GridSmart Grid
EnvironmentalLowered carbon footprintIncreased use of renewable energy Increased energy efficiency/conservation
Financial Increased dispatch, mobile efficienciesReduced billing and customer service costsCustomers can manage their energy dollars
OperationalOngoing grid reliability and stabilityOutage management, improved
maintenance

8
SmartGridCity™ SmartGridCity™ -- Boulder, Colo.Boulder, Colo.
“An international showcase of smart grid possibilities… a comprehensive demonstration
of an intelligent grid community”
Test technology
Integrate smart grid portfolio of projects
Prove benefits
9
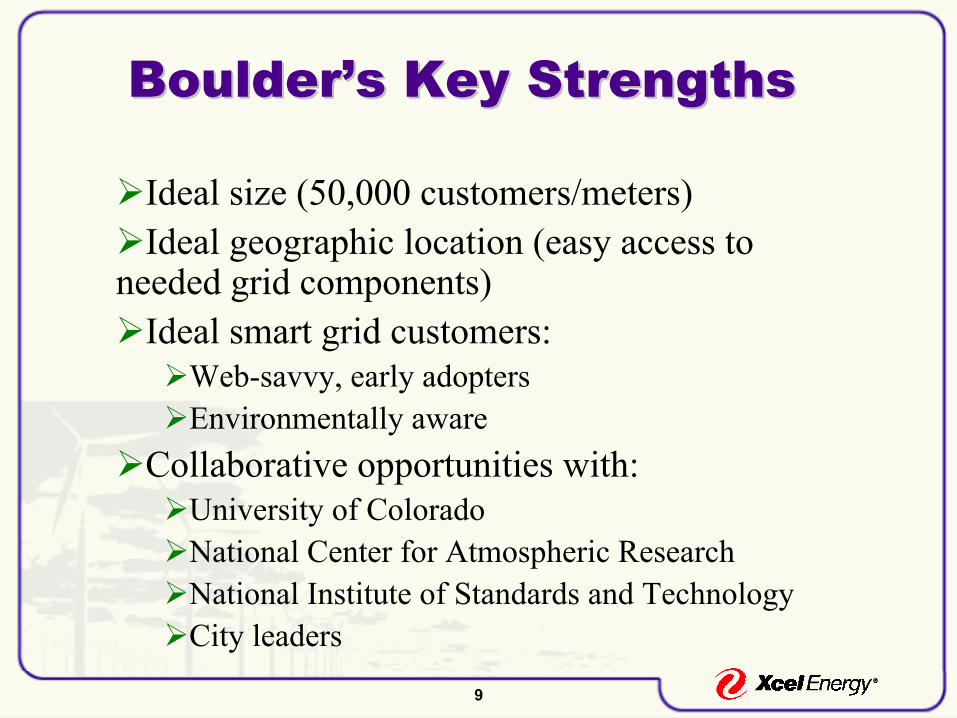
Boulder’s Key StrengthsBoulder’s Key Strengths
Ideal size (50,000 customers/meters)Ideal geographic location (easy access to
needed grid components)Ideal smart grid customers:
Web-savvy, early adoptersEnvironmentally aware
Collaborative opportunities with:University of ColoradoNational Center for Atmospheric ResearchNational Institute of Standards and TechnologyCity leaders

10
SmartGridCitySmartGridCity™™ Project Project TimelineTimeline
Partner alignment, ongoing
City selection, announced March 2008
Scope and design plan, announced May 2008
Build out, begin April 2008
Benefit assessment, Q4 2008 – Q4 2009

11
Phase IPhase I
Full-system automation, monitoring and smart meters for first group of customers, upgrades to two substations, five feeders and 15,000 meters.
Web portal for customers. Dedicated customer service phone number and
e-mail address for SmartGridCity customers.Some customers can choose to have in-home
automation tools.By mid-August 2008, initial capabilities
demonstrated.

12
Phase IIPhase II
Complete installation of a distribution and communication network for remaining areas (an additional two substations, 20 feeders and smart meters).
Expanded in-home automation installations.Enable Web portal access to all customers. Initial integration of plug-in hybrid electric
vehicles, solar and wind co-generation sources.

13
Grid Components & Grid Components & TechnologyTechnology
Metering and communicationsBegin installation of 15,000 Landis+Gyr smart meters in June Primary communications via broadband over power lines – 90 percent of city connected
Smart substations and feedersSmart substations – upgraded to allow for increased reliability (NCAR included)Smart feeders – communications enabled for more information and automated functionsSmart distribution system – real-time data on power consumption, outages, restorations and fault locations

14
Demand-Side Management
(DSM)
Energy Efficiency/Energy Conservation
Demand Response
Installation of measures or changes in behavior that decrease consumption of energy.
Examples:•Efficient Lighting•Efficient HVAC•Lowering/Raising Thermostat•Turn off Lights
Voluntary reduction in demand by customers in response to economic or control signals.
Examples:•Interruptible Rates•Air Conditioning Cycling•Time-based & Critical Peak Pricing

15
Energy Efficiency and Demand Response Energy Efficiency and Demand Response Programs Effects by Day Type Programs Effects by Day Type -- ResidentialResidential
Residential LightingTypical Day
1:00
3:00
5:00
7:00
9:00
11:00
13:00
15:00
17:00
19:00
21:00
23:00
Hour End
Before DSM
After DSM
Residential Saver's SwitchPeak Day
1:00
3:00
5:00
7:00
9:00
11:00
13:00
15:00
17:00
19:00
21:00
23:00
Hour End
Before DSMAfter DSM

16
Energy Efficiency and Demand Response Programs Energy Efficiency and Demand Response Programs Effects by Day Type Effects by Day Type –– Commercial and IndustrialCommercial and Industrial
Commercial LightingTypical Day
1:00
2:00
3:00
4:00
5:00
6:00
7:00
8:00
9:00
10:00
11:00
12:00
13:00
14:00
15:00
16:00
17:00
18:00
19:00
20:00
21:00
22:00
23:00 0:0
0
Hour End
Before DSMAfter DSM
Industrial ProcessTypical Day
1:00
3:00
5:00
7:00
9:00
11:00
13:00
15:00
17:00
19:00
21:00
23:00
Hour End
Before DSMAfter DSM
Commercial CoolingPeak Day
1:00
3:00
5:00
7:00
9:00
11:00
13:00
15:00
17:00
19:00
21:00
23:00
Hour End
Before DSMAfter DSM

17
DSM Objectives Are ChangingDSM Objectives Are Changing
Historical Objectives:Defer Building Power Plants
Economics of DSM based on avoiding peaking generation plants.Focus on Demand Reduction vs. Energy Reduction
Environmental groups have always focused on emission reduction, Commissions tended to focus on demand and cost reduction.MN shifted primary focus to energy reduction and secondary focus to demand reduction in 1995. CO added energy reduction focus to demand reduction focus in 2006.TX added energy reduction as a secondary focus in 2007 legislation.NM legislation is focused on energy reduction, but allows for demand response to be included as part of DSM portfolio.
Emerging Objectives:Focus on Carbon Reduction
18
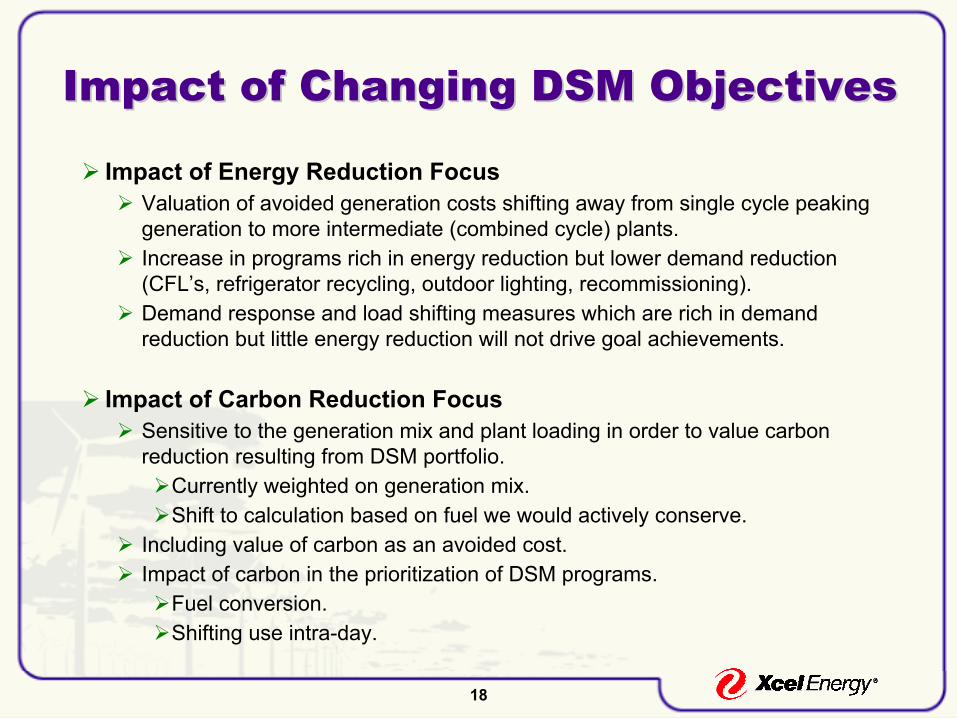
Impact of Changing DSM ObjectivesImpact of Changing DSM Objectives
Impact of Energy Reduction FocusValuation of avoided generation costs shifting away from single cycle peaking generation to more intermediate (combined cycle) plants. Increase in programs rich in energy reduction but lower demand reduction (CFL’s, refrigerator recycling, outdoor lighting, recommissioning).Demand response and load shifting measures which are rich in demand reduction but little energy reduction will not drive goal achievements.
Impact of Carbon Reduction FocusSensitive to the generation mix and plant loading in order to value carbon reduction resulting from DSM portfolio.
Currently weighted on generation mix.Shift to calculation based on fuel we would actively conserve.
Including value of carbon as an avoided cost.Impact of carbon in the prioritization of DSM programs.
Fuel conversion.Shifting use intra-day.

19
Customer Barriers to be Overcome Customer Barriers to be Overcome For Growth in DSMFor Growth in DSM
Primary Barriers to ParticipationAwareness of energy efficiency optionsAwareness of Xcel Energy programsEquipment not at end of useful lifeFinancial investment and access to capitalLow energy costs / energy costs low percent of total costsQuality of energy efficiency equipmentTime, knowledge or labor resourcesDon’t want to disrupt business or production lineMismatch between owner of building/equipment and responsibility for energy bills
20
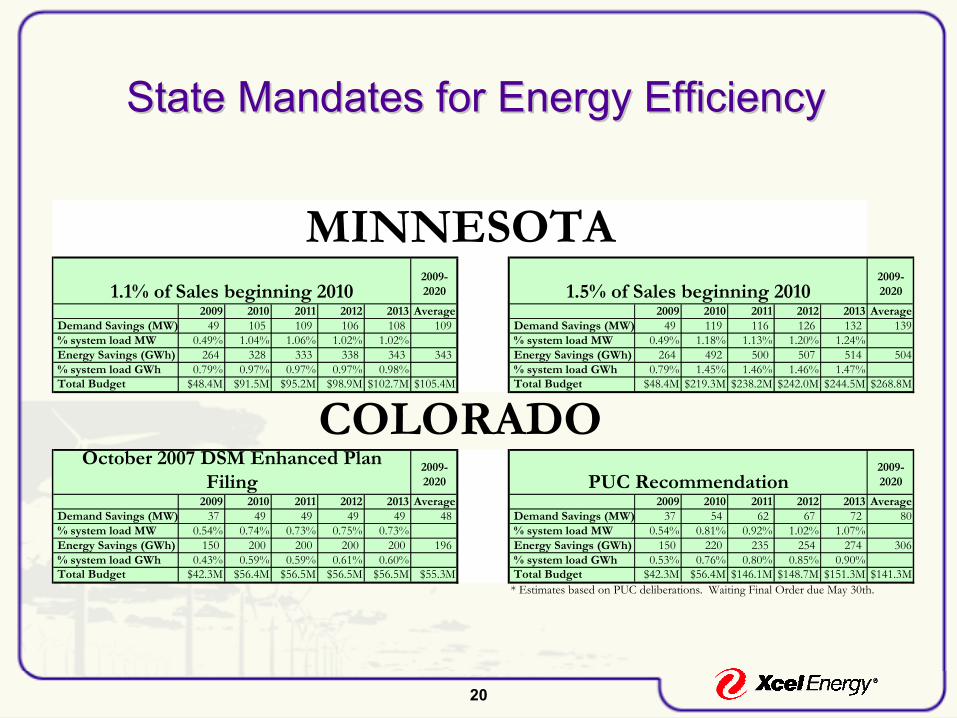
State Mandates for Energy EfficiencyState Mandates for Energy Efficiency
2009-2020
2009-2020
2009 2010 2011 2012 2013 Average 2009 2010 2011 2012 2013 Average Demand Savings (MW) 49 105 109 106 108 109 Demand Savings (MW) 49 119 116 126 132 139 % system load MW 0.49% 1.04% 1.06% 1.02% 1.02% % system load MW 0.49% 1.18% 1.13% 1.20% 1.24% Energy Savings (GWh) 264 328 333 338 343 343 Energy Savings (GWh) 264 492 500 507 514 504 % system load GWh 0.79% 0.97% 0.97% 0.97% 0.98% % system load GWh 0.79% 1.45% 1.46% 1.46% 1.47% Total Budget $48.4M $91.5M $95.2M $98.9M $102.7M $105.4M Total Budget $48.4M $219.3M $238.2M $242.0M $244.5M $268.8M
2009-2020
2009-2020
2009 2010 2011 2012 2013 Average 2009 2010 2011 2012 2013 Average Demand Savings (MW) 37 49 49 49 49 48 Demand Savings (MW) 37 54 62 67 72 80 % system load MW 0.54% 0.74% 0.73% 0.75% 0.73% % system load MW 0.54% 0.81% 0.92% 1.02% 1.07% Energy Savings (GWh) 150 200 200 200 200 196 Energy Savings (GWh) 150 220 235 254 274 306 % system load GWh 0.43% 0.59% 0.59% 0.61% 0.60% % system load GWh 0.53% 0.76% 0.80% 0.85% 0.90% Total Budget $42.3M $56.4M $56.5M $56.5M $56.5M $55.3M Total Budget $42.3M $56.4M $146.1M $148.7M $151.3M $141.3M
* Estimates based on PUC deliberations. Waiting Final Order due May 30th.
MINNESOTA1.5% of Sales beginning 2010
October 2007 DSM Enhanced Plan Filing PUC Recommendation
COLORADO
1.1% of Sales beginning 2010

21
State Mandates for Energy State Mandates for Energy Efficiency (cont.)Efficiency (cont.)
New MexicoAchieve 5% of 2005 total retail sales in calendar year 2014 and 10% of 2005 total retail sales in calendar year 2020 as a result of energy efficiency and load management programs.
TexasAchieve 15% of 5 year average demand growth in 2008 and 20% in 2009 and beyond. Converts demand savings into a minimum energy savings goal by applying a 20% capacity factor.

22
DSM Goal Setting in MN & CO DSM Goal Setting in MN & CO Resource PlansResource Plans
Market Potential Assessment StudiesTechnical, economic and achievable potential estimates.
MN and national goals historically based on achievable potential.
MN and CO resource plan goals based on 50% of economic potential.
Limitations of Market Potential AssessmentsFactor in only known changes in codes and standards.
Include only current technologies in the market.
50% of Economic Potential Reasonable Yet StretchingIt is not a reasonable assumption that Xcel Energy can drive 50% of all economic potential
identified in the studies with known measures.
The expectation is that emerging technology opportunities will be larger than reductions based on changes in codes and standards.
Currently market transformation including customer behavior modifications are not included in the estimates.

23
Resource Requirements for DSM Resource Requirements for DSM Growth: ExternalGrowth: External
SalesEquipment vendors & distributorsInstallation contractorsEngineering consultants, ESCO’sNew construction: architects, designers, engineers, home builders
Program ImplementationHome auditors, business energy assessment auditors and engineering study
providers Other study vendors including recommissioning and compressed airThird party program implementation contractors (i.e. One-Stop-Shop, Energy
Design Assistance, Commercial Real-Estate, Industrial Process Efficiency)Other Infrastructure Support
Market research/program evaluation contractorsMeasurement and verification contractorsProduct development and technical support contractorsAdvertising, promotion firms and community based marketers

24
Making Customer Efficiency a Making Customer Efficiency a Profitable Business for Xcel EnergyProfitable Business for Xcel Energy
Timely Cost Recovery (eliminate disincentive)Recognition of Lost Margins (eliminate disincentive)Progressive positive incentives for utility programsIdentification of EE and DR opportunitiesCustomer segmentation and target marketingSocial and affinity marketing (new channels)Streamlined and on-line application and rebate processingLinkage to new and emerging intelligence and technologiesSmart Grid applications – real time consumption, customer usage
feedback mechanisms and controlsLinkage to progressive rate designs (TOU, CCP, block rates)Integral to Xcel Energy’s brand
25
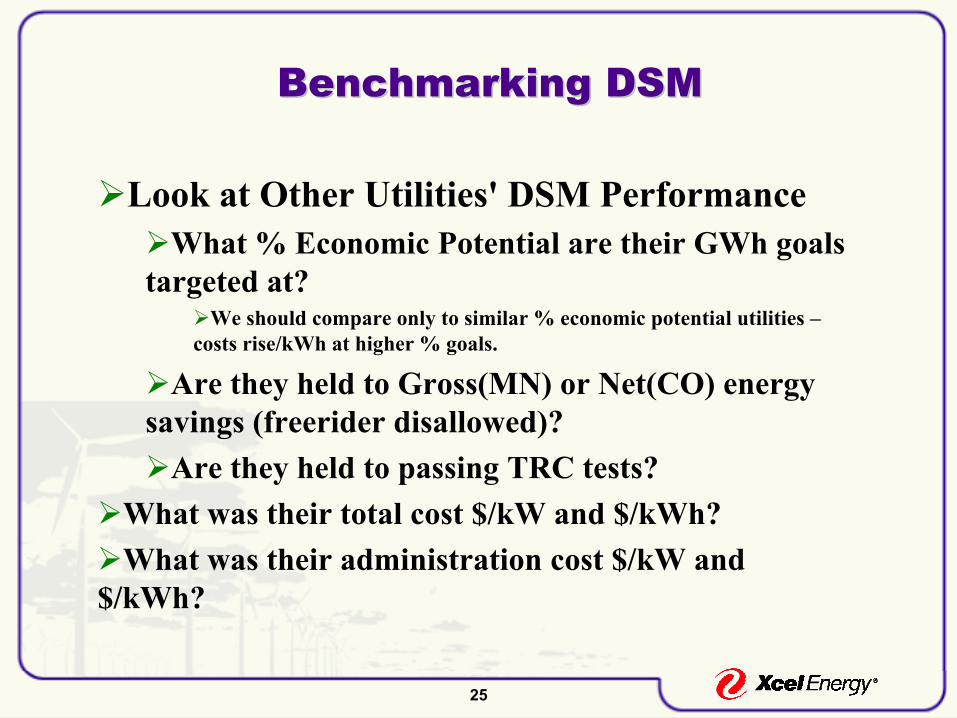
Benchmarking DSMBenchmarking DSM
Look at Other Utilities' DSM Performance What % Economic Potential are their GWh goals
targeted at?We should compare only to similar % economic potential utilities –
costs rise/kWh at higher % goals.
Are they held to Gross(MN) or Net(CO) energy savings (freerider disallowed)?
Are they held to passing TRC tests?What was their total cost $/kW and $/kWh?What was their administration cost $/kW and
$/kWh?
