national climate report - dwd
TRANSCRIPT
National Climate ReportClimate ‒ Yesterday, today and in future


1
Table of Contents
Foreword ..................................................................................................... 2
Conference of the Parties (COP23) .............................................................. 3
Constantly changing – Weather and climate in Germany ........................... 4
Climate, climate variability and climate extremes ...................................... 6
Climate models ........................................................................................... 8
Climate change and climate projections ................................................... 10
Regional diversity – The climate in Germany ............................................ 12
Climate variables and their changes
Temperature ....................................................................................... 14
Precipitation ........................................................................................ 20
Sunshine ............................................................................................. 26
Sea Level ............................................................................................ 28
Phenology ........................................................................................... 30
Extreme events ......................................................................................... 32
Current climate system research .............................................................. 38
A climate lexicon .......................................................................................40
Publishing details ...................................................................................... 42

2
Dear readers,
Earth’s 2016 surface temperatures were the warmest since modern
recordkeeping. 2016 is remarkably the third record year in a row in
this series. In Germany mean temperatures in 2016 were 9.5 °C which
is 1.3 °C warmer than the reference period 1961–1990. At 10.5 °C,
2014 was the warmest year on record in Germany. These temperatures
very probably only represent peaks in an ongoing process. The Fifth
Assessment Report by the Intergovernmental Panel on Climate Change
(IPCC) predicts further signifi cant climate warming throughout the
following years of this century.
Climate change represents a huge challenge for almost all of us. Its
impact may, for example, be felt in far more days of high heat stress
or many more extreme weather events. The international framework
for responding to climate change was adopted at the World Climate
Conference COP21 in Paris and the COP 22 in Marrakech. These
conferences defi ned the goals which must now be met. These can only be
achieved with a detailed understanding of the current state of aff airs.
The National Climate Report presents in brief and concise form the
knowledge available about yesterday‘s, today‘s and tomorrow‘s climate.
This report off ers its readers an in-depth introduction to climate change.
In this respect, the National Climate Report delivers the knowledge base
for successful adaptation to climate change.
Dr Paul Becker
Vice president of Deutscher Wetterdienst
Foreword

3
In November 2017, the 23rd Conference of the Parties (COP23) to the United Nations Framework
Convention on Climate Change (UNFCCC) will be held in Bonn, Germany, under the presidency of
Fiji. Like the preceding COP session, the Climate Change Conference in Marrakech in 2016, this
year‘s conference will again be focused on the implementation of the efforts for climate protection
agreed during the Paris Climate Change Conference (COP21) in December 2015. COP21 brought
a decisive breakthrough when 195 countries came, for the first time ever, to a general and legally
binding global agreement on climate change. The agreement includes a global plan for action
aimed at keeping the global temperature rise well below 2 °C, if possible even below 1.5 °C in
order to reduce the impacts of climate change. Now that the USA have announced their intention
to withdraw from the agreement, COP23 and its outcomes are awaited eagerly.
The scientific basis for the Paris Agreement was the Fifth Assessment Report (AR5) of the
Intergovernmental Panel on Climate Change (IPCC) published in 2013/2014. The IPCC was
founded by the United Nations Environment Programme (UNEP) and the World Meteorological
Organization (WMO) and acts as both an international coordination body and a scientific
organisation. The IPCC itself does not conduct any research, but accumulates the scientific
publications of many experts. The IPCC‘s report describes the possible development of the earth‘s
climate and the resulting impacts up to the end of the 21st century, revealing evidence that,
without any reduction in greenhouse gas emissions, it is very probable that the earth‘s climate and
its manifestations will have changed considerably compared to today.
Climate research plays an important role for the society all over the world, in Europe and in
Germany. It is not only focused on exploring the natural scientific foundations of climate change
or on developing climate models and running global, regional and localised climate simulations,
it also examines the expected impacts and helps to identify possible measures for reducing the
global warming and adapting to the climate change.
The preparations for the IPCC‘s Sixth Assessment Report have started; its publication is planned
before 2022. In it, account will be taken of the latest scientific findings that result from climate
simulations.
International co-operation to protect and explore the climate
4
From short-term variation to long-term change: weather and climate in GermanyGermany is in the warm-temperate mid-latitude climate zone at the point of transition between the maritime climate of western Europe and the continental climate of eastern Europe. The central European climate shows the influence of moist, mild Atlantic air masses and dry continental air, which is hot in the summer and cold in the winter. The prevailing air mass depends on the large-scale circulation pattern. This means that the seasons can vary quite considerably from year to year and the climate in Germany is marked by a high level of variability as a result.
The topography of Germany, its low mountain ranges and the different types of landscape they encompass,
has a strong influence on the highly varied structure of the climate. Altitude of the terrain and distance from the coast are the dominant influences on temperature. The oceanic influence, which diminishes from the north-west to the south-east, is responsible for Germany‘s relatively mild winters and moderately hot summers.
The Deutscher Wetterdienst monitors the weather in Germany from numerous locations and has been doing so in some places for more than 100 years. A multitude of parameters are registered, including temperature, precipitation and sunshine. The observed values vary from day to day and from year to year. Alongside this variability, the records made by the measurement systems of the Deutscher Wetterdienst also help to detect long-term changes.
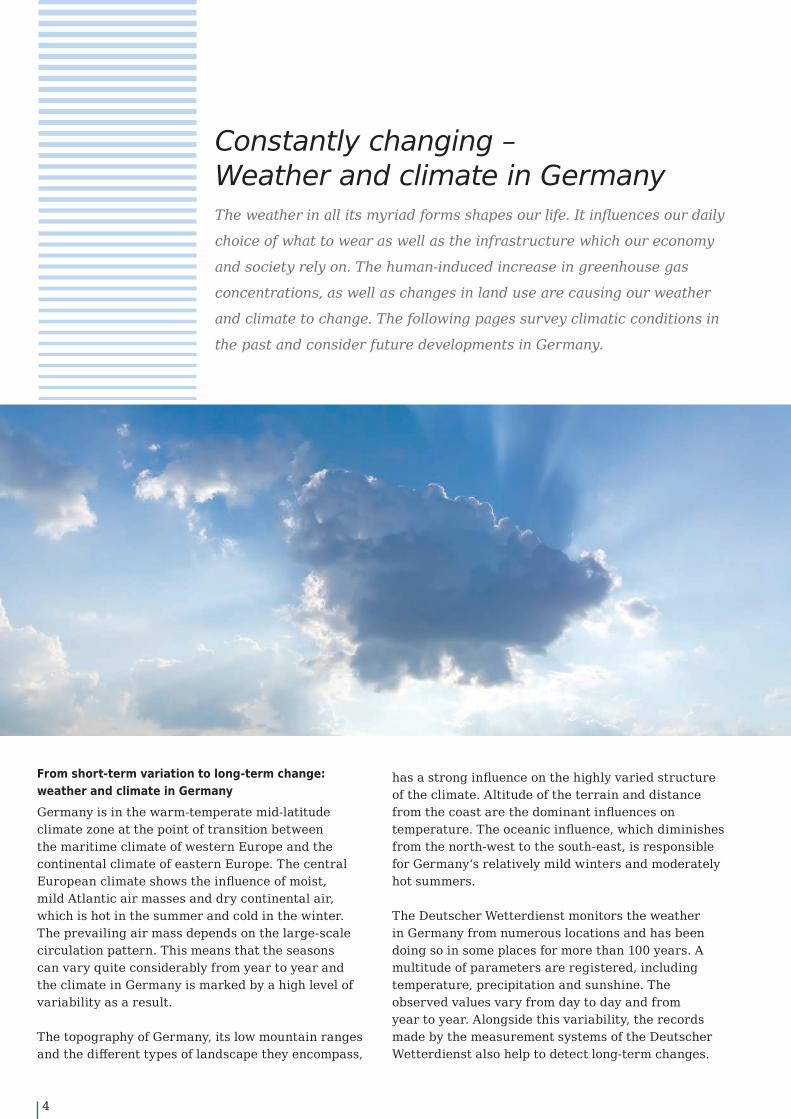
The weather in all its myriad forms shapes our life. It influences our daily
choice of what to wear as well as the infrastructure which our economy
and society rely on. The human-induced increase in greenhouse gas
concentrations, as well as changes in land use are causing our weather
and climate to change. The following pages survey climatic conditions in
the past and consider future developments in Germany.
Constantly changing – Weather and climate in Germany

5
For instance, the measurements show that it has become around 1.4 degrees warmer in Germany over the last 136 years. This change has gone hand in hand with a fall in the number of cold and very cold days and a rise in the number of warm and very warm days.
The amount of precipitation has increased over the last 136 years. This is especially the case in winter and spring. Mean annual precipitation has risen by 9 per cent. There has been little noticeable change in the number of days on which there is at least 10 litres per square metre (l/m2) of precipitation.
Sea level is also measured. This has also been observed to change: over the last 100 years, the sea level has risen by around 20 cm in the German Bight and by around 14 cm on the Baltic coast of Germany.
Do human activities influence the climate?Emissions of greenhouse gases and large-scale changes in land use are two ways in which human activities interfere with the Earth‘s natural climate system. One focus of research worldwide is therefore on analysing the consequences of this interference.
Based on climate models, scientists have computed the impacts of the global and regional climate. Depending on the scenario, these calculations show that the mean annual temperature in Germany will rise by between a minimum of 1 °C and over 4 °C in the next 100 years. According to the climate models, it will only be possible to limit the rise in temperature to just 1 °C if emissions of greenhouse gases are
reduced substantially. Further economic growth and continuing high levels of greenhouse gas emissions are likely to result in a change of between 3 °C and 4 °C as well as a further fall in the number of cold and very cold days and a substantial rise in the number of warm and very warm days.
The increase in temperature will very probably be accompanied by a further increase in annual precipitation and thus the number of days on which at least 10 litres of precipitation per square metre (l/m2) will increase.
A rise in air temperature will be accompanied by an increase in sea temperature. This will cause sea water to expand as it heats up and the level of the sea will rise. New studies of ocean warming and of the Antarctic and Greenland ice sheets suggest that the rate at which the sea level is rising will probably accelerate.
◂ Mean concentrations of atmospheric CO2, measured at the Mauna Loa observatory in Hawaii. The data form the longest series of direct carbon dioxide measurements worldwide. The figures shown are the monthly values (red curve) and annual mean (black curve). The variations within an individual year are the result of different periods of vegetative growth. (Source: NOAA)

6
What is climate?The World Meteorological Organization (WMO) offers a scientifically precise definition of climate as „the synthesis of weather over the whole of a period, essentially long enough to establish its statistical ensemble properties“. Etymologically, „climate“ comes from the Ancient Greek klĩma, or „I incline“, and alludes to the constellation of the Earth in the solar system, to the Earth‘s axial tilt, the varying distance of our planet to the sun and the related marked
variations in meteorological conditions. The Earth‘s climate has always varied over time, with ice ages alternating with warm periods.
Climate is always a local phenomenon. The climate of Helgoland, for example, is not the same as the climate of Munich. In line with the WMO definition, climates are described by analysing conditions over a period of at least 30 years.
Weather, weather conditions and climate: in meteorology and climatology, these three concepts stand
for processes which unfold over varying periods of time, with ‘weather’ describing the condition of
the atmosphere over a short period of time, ‘weather conditions’ a phase of weeks or several months
and ‘climate’ longer periods of time ranging from decades through to geological ages.
Climate, climate variability and climate extremes
7
Climate variability Climate is the sum of weather and weather conditions and thus varies. Describing the climate solely based on average values is not enough in itself. There is a high level of variability even at the level of daily weather observations. This variability is also apparent in weather conditions. The same applies on longer timescales. Mean temperatures, for instance, are lower in the winter than in the summer. The seasons themselves also diff er from year to year. Winters can be milder or colder, summers drier or wetter.
This variability not only shows up in temperatures. It is an aspect of all meteorological elements (e.g. precipitation and sunshine duration). Even climate change-induced warming features variability in that not every year is invariably hotter than the year before. Some years may be hotter while others may be colder than the mean.
Climate trendsWe refer to a climate trend whenever, within a few decades, a change is observed to happen such that, for example, positive deviations in temperature occur. The change may well be interrupted or attenuated for short periods; the decisive factor, however, is that the observed direction of change remains consistent over a long period of time. Long-term changes of this kind can, of course, be the result of natural processes, such as variations in Earth‘s orbit or solar activity. But human activities also impact the climate system.
Extreme eventsExtreme events are very rare occurrences which deviate substantially from mean conditions. There are many diff erent reasons why an event may become an extreme event. An extreme event may just occur on a single day, such as a hurricane-force gust, or may be
a long-term event, such as a prolonged drought period, or an event which is highly unusual for the time of year. A temperature of 25 °C would not be unusual in July, for example. On the other hand, 25 °C on New Year‘s Day would be unusual and would qualify as an extreme event.
Extremes are part and parcel of weather and climate, they were part of the climate in the past and will remain part of the climate in the future. Analysis of the intensity and the frequency with which such events occur is a key aspect of current climate research.
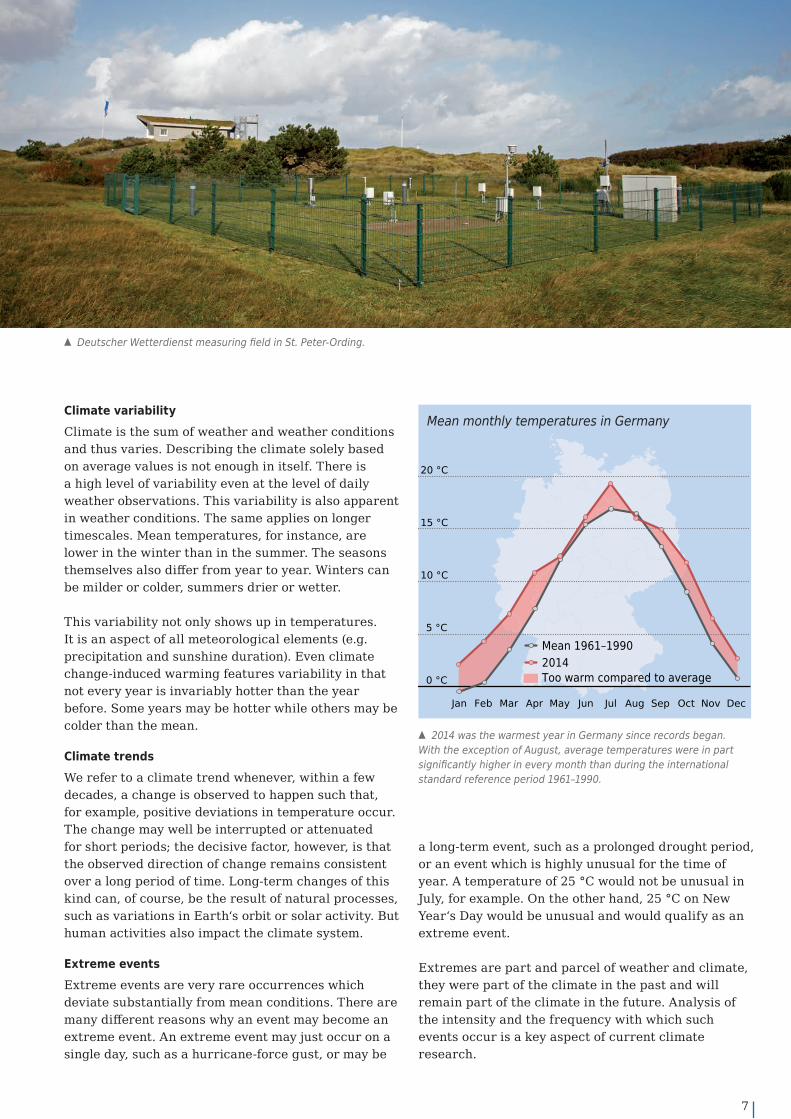
0 °C
5 °C
10 °C
15 °C
20 °C
Jan Feb Mar Apr May Jun Jul Aug Sep Oct Nov Dec
Mean 1961–19902014Too warm compared to average
▴ 2014 was the warmest year in Germany since records began. With the exception of August, average temperatures were in part signifi cantly higher in every month than during the international standard reference period 1961–1990.
Mean monthly temperatures in Germany
▴ Deutscher Wetterdienst measuring fi eld in St. Peter-Ording.

8
The climate is modelled by superimposing a three-dimensional grid on the Earth‘s atmosphere and oceans. The resolution (grid-point spacing) of global climate models has to be very coarse to enable models to be calculated over many years within an acceptable computing time. Although these models provide adequate descriptions of large-scale climate variability their resolution is too low to provide detailed information about the regional characteristics of climate change in a specifi c area of the Earth (e.g. Germany). Regional climate models, which have a much closer grid spacing than global climate models, are used for this purpose. They are based on the results of global model runs.
The world in gridsClimate models consolidate a number of different (sub)models into one supermodel. Submodels are capable of describing all the main processes in the planet Earth‘s atmosphere, hydrosphere, cryosphere and biosphere. However, representations in climate models cannot be made to correspond one-to-one to the entire range of real processes. Firstly, not all natural processes are sufficiently well understood. Secondly, this would require an extremely high level of computing time.
Climate modelsWith climate change happening it is not reasonable to extrapolate the
climate variations and trends observed in the past one-to-one into the
future. Climate models, i.e. computer-aided tools for producing simplifi ed
descriptions of natural phenomena, are therefore used to evaluate the
future development of the climate.
▴ Climate models use approximation formulas to describe fundamental natural processes and interactions. Some of these are shown here. (Source: Max Planck Institute for Meteorology)
9
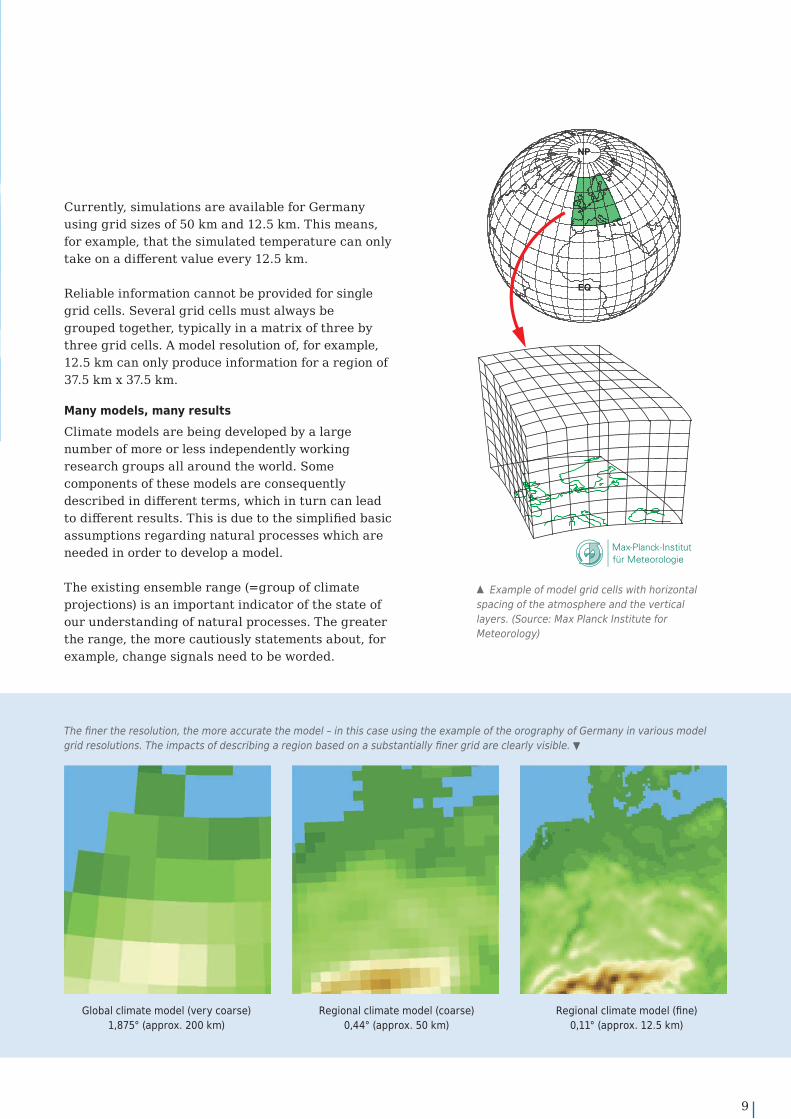
Currently, simulations are available for Germany using grid sizes of 50 km and 12.5 km. This means, for example, that the simulated temperature can only take on a diff erent value every 12.5 km.
Reliable information cannot be provided for single grid cells. Several grid cells must always be grouped together, typically in a matrix of three by three grid cells. A model resolution of, for example, 12.5 km can only produce information for a region of 37.5 km x 37.5 km.
Many models, many resultsClimate models are being developed by a large number of more or less independently working research groups all around the world. Some components of these models are consequently described in diff erent terms, which in turn can lead to diff erent results. This is due to the simplifi ed basic assumptions regarding natural processes which are needed in order to develop a model.
The existing ensemble range (=group of climate projections) is an important indicator of the state of our understanding of natural processes. The greater the range, the more cautiously statements about, for example, change signals need to be worded.
Global climate model (very coarse) Regional climate model (coarse) Regional climate model (fi ne) 1,875° (approx. 200 km) 0,44° (approx. 50 km) 0,11° (approx. 12.5 km)
The fi ner the resolution, the more accurate the model – in this case using the example of the orography of Germany in various model grid resolutions. The impacts of describing a region based on a substantially fi ner grid are clearly visible. ▾
▴ Example of model grid cells with horizontal spacing of the atmosphere and the vertical layers. (Source: Max Planck Institute for Meteorology)
10
Climate change – the human factorHuman activities impact climate in many different ways. In particular: 1. The combustion of fossil fuels releases large
amounts of carbon dioxide and other pollutants into the atmosphere.
2. Deforestation, afforestation and surface sealing changes the way land is used on a regional and global scale.
The changes observed in the global climate can only be explained by taking account of both natural influences and the impact of human activity.
It is not possible to describe precisely how humans will affect the climate in the years and decades to come. However, it is possible to make assumptions about the probable impact of human activity over time. In the scientific community, these assumptions are referred to as scenarios. In recent years, a number of conceivable scenarios have been developed which describe the more or less strong influence of human activity on the climate. Four representative scenarios or so-called representative concentration pathways, RCPs, were selected in the run-up to the Fifth Assessment Report by the Intergovernmental Panel on Climate Change (IPCC). These scenarios describe the radiative forcing arising from changes in concentrations of greenhouse gases and the influence of aerosols (small particles, such as soot, in the atmosphere). Put simply, the concept of radiative forcing refers to the “additional/higher” amount of energy radiating down on the planet.
The scenarios are referred to as RCP2.6, RCP4.5, RCP6.0 and RCP8.5. The numbers in each case (e.g. 8.5) stand for the “positive” global energy imbalance of 8.5 W/m2 in the year 2100 compared to irradiance in the years 1861–1880. This period represents the state of the climate before humans began to have a substantial influence on the concentration of greenhouse gases in the atmosphere (pre-industrial level). The scenarios do not model the development of socio-economic factors, e.g. population, energy use or emissions of greenhouse gases. However, these can be assigned to the RCPs indirectly.
What will our emissions future look like?This report presents the results of simulations based on a climate mitigation scenario (RCP2.6) and the business-as-usual scenario (RCP8.5).
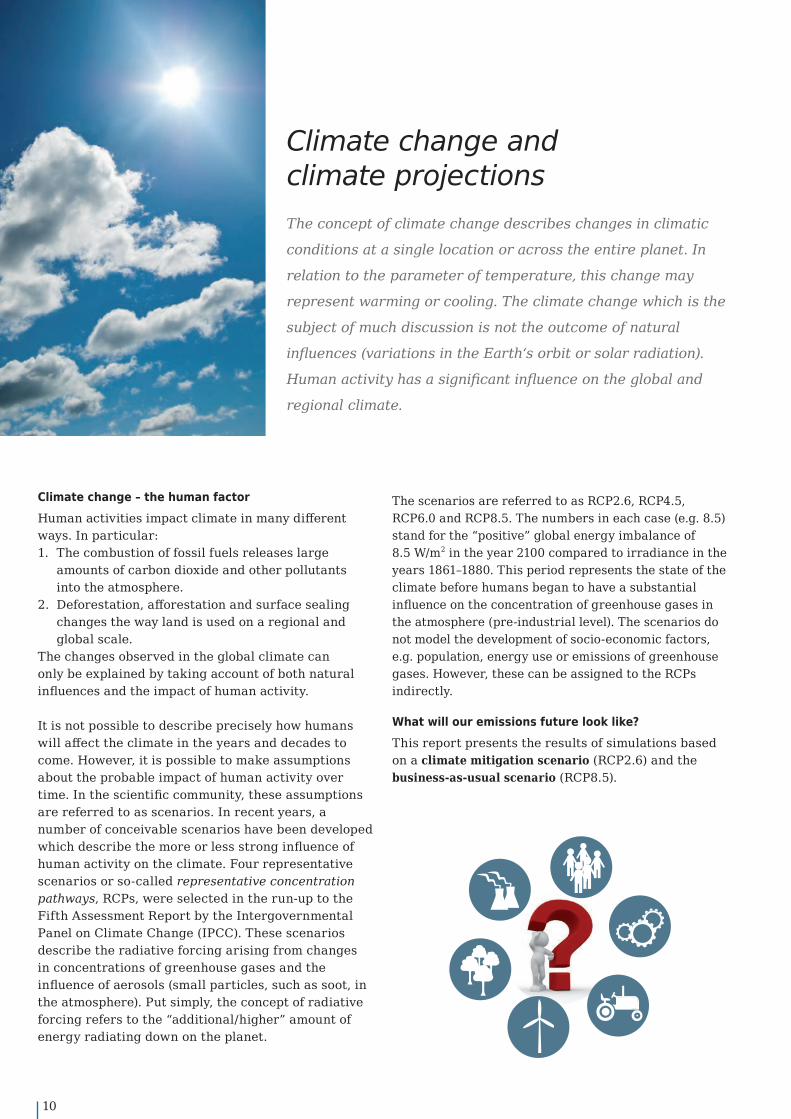
The concept of climate change describes changes in climatic
conditions at a single location or across the entire planet. In
relation to the parameter of temperature, this change may
represent warming or cooling. The climate change which is the
subject of much discussion is not the outcome of natural
influences (variations in the Earth‘s orbit or solar radiation).
Human activity has a significant influence on the global and
regional climate.
Climate change and climate projections
11
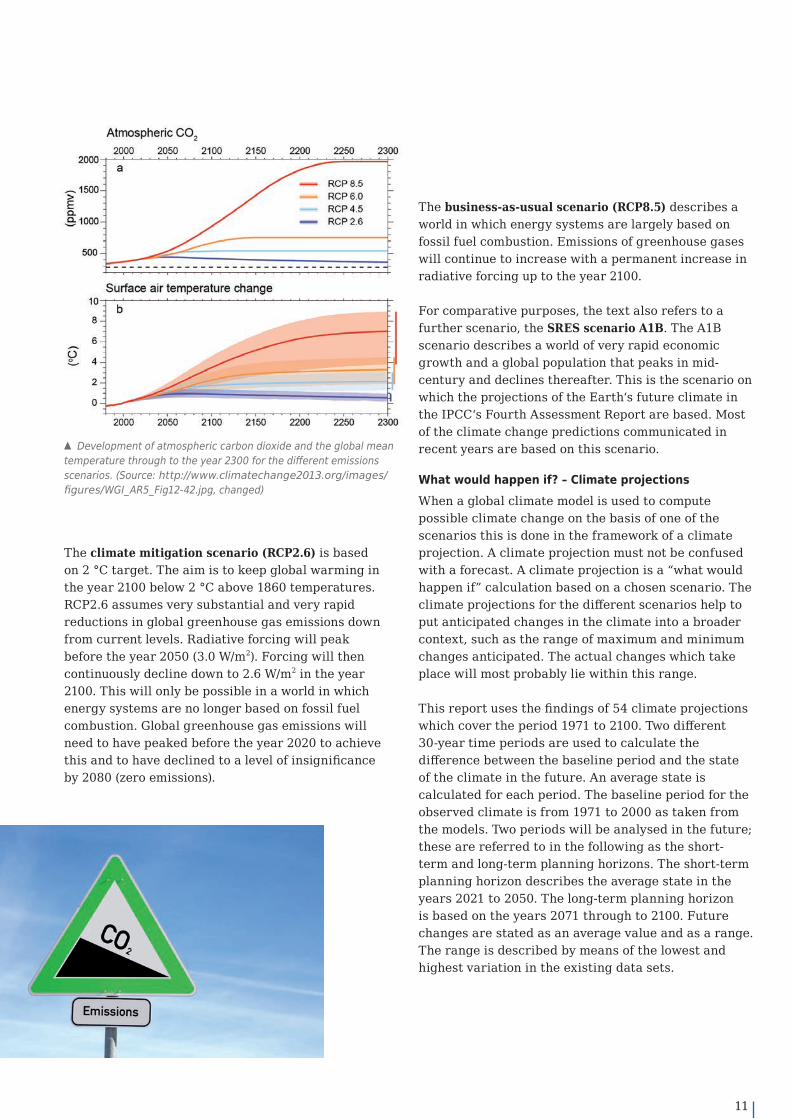
The climate mitigation scenario (RCP2.6) is based on 2 °C target. The aim is to keep global warming in the year 2100 below 2 °C above 1860 temperatures. RCP2.6 assumes very substantial and very rapid reductions in global greenhouse gas emissions down from current levels. Radiative forcing will peak before the year 2050 (3.0 W/m2). Forcing will then continuously decline down to 2.6 W/m2 in the year 2100. This will only be possible in a world in which energy systems are no longer based on fossil fuel combustion. Global greenhouse gas emissions will need to have peaked before the year 2020 to achieve this and to have declined to a level of insignifi cance by 2080 (zero emissions).
The business-as-usual scenario (RCP8.5) describes a world in which energy systems are largely based on fossil fuel combustion. Emissions of greenhouse gases will continue to increase with a permanent increase in radiative forcing up to the year 2100.
For comparative purposes, the text also refers to a further scenario, the SRES scenario A1B. The A1B scenario describes a world of very rapid economic growth and a global population that peaks in mid-century and declines thereafter. This is the scenario on which the projections of the Earth‘s future climate in the IPCC‘s Fourth Assessment Report are based. Most of the climate change predictions communicated in recent years are based on this scenario.
What would happen if? – Climate projectionsWhen a global climate model is used to compute possible climate change on the basis of one of the scenarios this is done in the framework of a climate projection. A climate projection must not be confused with a forecast. A climate projection is a “what would happen if” calculation based on a chosen scenario. The climate projections for the diff erent scenarios help to put anticipated changes in the climate into a broader context, such as the range of maximum and minimum changes anticipated. The actual changes which take place will most probably lie within this range.
This report uses the fi ndings of 54 climate projections which cover the period 1971 to 2100. Two diff erent 30-year time periods are used to calculate the diff erence between the baseline period and the state of the climate in the future. An average state is calculated for each period. The baseline period for the observed climate is from 1971 to 2000 as taken from the models. Two periods will be analysed in the future; these are referred to in the following as the short-term and long-term planning horizons. The short-term planning horizon describes the average state in the years 2021 to 2050. The long-term planning horizon is based on the years 2071 through to 2100. Future changes are stated as an average value and as a range. The range is described by means of the lowest and highest variation in the existing data sets.
▴ Development of atmospheric carbon dioxide and the global mean temperature through to the year 2300 for the diff erent emissions scenarios. (Source: http://www.climatechange2013.org/images/fi gures/WGI_AR5_Fig12-42.jpg, changed)
12
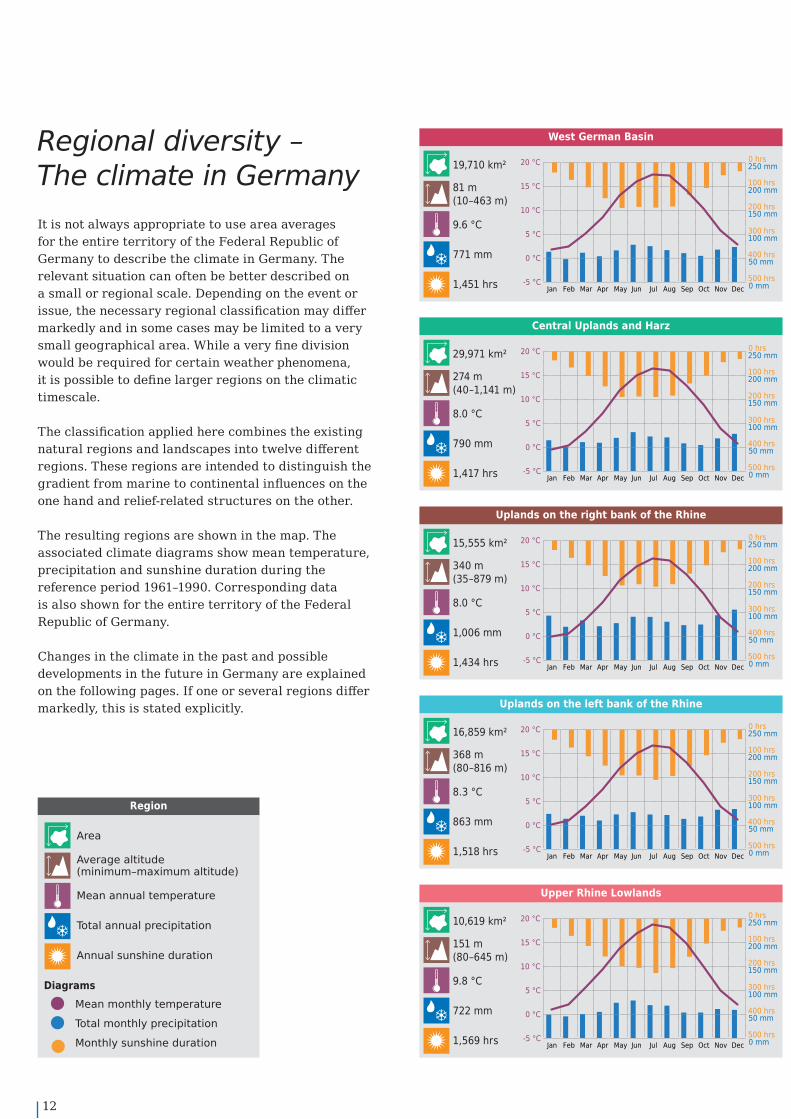
It is not always appropriate to use area averages for the entire territory of the Federal Republic of Germany to describe the climate in Germany. The relevant situation can often be better described on a small or regional scale. Depending on the event or issue, the necessary regional classifi cation may diff er markedly and in some cases may be limited to a very small geographical area. While a very fi ne division would be required for certain weather phenomena, it is possible to defi ne larger regions on the climatic timescale.
The classifi cation applied here combines the existing natural regions and landscapes into twelve diff erent regions. These regions are intended to distinguish the gradient from marine to continental infl uences on the one hand and relief-related structures on the other.
The resulting regions are shown in the map. The associated climate diagrams show mean temperature, precipitation and sunshine duration during the reference period 1961–1990. Corresponding data is also shown for the entire territory of the Federal Republic of Germany.
Changes in the climate in the past and possible developments in the future in Germany are explained on the following pages. If one or several regions diff er markedly, this is stated explicitly.
Regional diversity –The climate in Germany
0 hrs
100 hrs
200 hrs
300 hrs
400 hrs
500 hrs0 mm
50 mm
100 mm
150 mm
200 mm
250 mm
-5 °C
0 °C
5 °C
10 °C
15 °C
20 °C
Jan Feb Mar Apr May Jun Jul Aug Sep Oct Nov Dec
Westdeutsche Tieflandsbucht
19,710 km²
81 m(10–463 m)
9.6 °C
771 mm
1,451 hrs
West German Basin
0 hrs
100 hrs
200 hrs
300 hrs
400 hrs
500 hrs0 mm
50 mm
100 mm
150 mm
200 mm
250 mm
-5 °C
0 °C
5 °C
10 °C
15 °C
20 °C
Jan Feb Mar Apr May Jun Jul Aug Sep Oct Nov Dec
Zentrale Mittelgebirge und Harz
29,971 km²
274 m(40–1,141 m)
8.0 °C
790 mm
1,417 hrs
Central Uplands and Harz
0 hrs
100 hrs
200 hrs
300 hrs
400 hrs
500 hrs0 mm
50 mm
100 mm
150 mm
200 mm
250 mm
-5 °C
0 °C
5 °C
10 °C
15 °C
20 °C
Jan Feb Mar Apr May Jun Jul Aug Sep Oct Nov Dec
Rechtsrheinische Mittelgebirge
15,555 km²
340 m(35–879 m)
8.0 °C
1,006 mm
1,434 hrs
Uplands on the right bank of the Rhine
0 hrs
100 hrs
200 hrs
300 hrs
400 hrs
500 hrs0 mm
50 mm
100 mm
150 mm
200 mm
250 mm
-5 °C
0 °C
5 °C
10 °C
15 °C
20 °C
Jan Feb Mar Apr May Jun Jul Aug Sep Oct Nov Dec
Linksrheinische Mittelgebirge
16,859 km²
368 m(80–816 m)
8.3 °C
863 mm
1,518 hrs
Uplands on the left bank of the Rhine
0 hrs
100 hrs
200 hrs
300 hrs
400 hrs
500 hrs0 mm
50 mm
100 mm
150 mm
200 mm
250 mm
-5 °C
0 °C
5 °C
10 °C
15 °C
20 °C
Jan Feb Mar Apr May Jun Jul Aug Sep Oct Nov Dec
Oberrheinisches Tiefland
10,619 km²
151 m(80–645 m)
9.8 °C
722 mm
1,569 hrs
Upper Rhine Lowlands
Region
Area
Average altitude(minimum–maximum altitude)
Mean annual temperature
Total annual precipitation
Annual sunshine duration
Mean monthly temperature
Total monthly precipitation
Monthly sunshine duration
Diagrams

13
Alps
0 hrs
100 hrs
200 hrs
300 hrs
400 hrs
500 hrs0 mm
50 mm
100 mm
150 mm
200 mm
250 mm
-5 °C
0 °C
5 °C
10 °C
15 °C
20 °C
Jan Feb Mar Apr May Jun Jul Aug Sep Oct Nov Dec
Alpen
4,170 km²
1,117 m(420–2,962 m)
5.1 °C
1,935 mm
1,621 hrs
0 hrs
100 hrs
200 hrs
300 hrs
400 hrs
500 hrs0 mm
50 mm
100 mm
150 mm
200 mm
250 mm
-5 °C
0 °C
5 °C
10 °C
15 °C
20 °C
Jan Feb Mar Apr May Jun Jul Aug Sep Oct Nov Dec
Deutschland
35,7375 km²
250 m(−4–2,962 m)
8.2 °C
789 mm
1,544 hrs
Germany0 hrs
100 hrs
200 hrs
300 hrs
400 hrs
500 hrs0 mm
50 mm
100 mm
150 mm
200 mm
250 mm
-5 °C
0 °C
5 °C
10 °C
15 °C
20 °C
Jan Feb Mar Apr May Jun Jul Aug Sep Oct Nov Dec
Alpenvorland
33,244 km²
530 m(305–1,516 m)
7.8 °C
979 mm
1,637 hrs
Alpine foothills
0 hrs
100 hrs
200 hrs
300 hrs
400 hrs
500 hrs0 mm
50 mm
100 mm
150 mm
200 mm
250 mm
-5 °C
0 °C
5 °C
10 °C
15 °C
20 °C
Jan Feb Mar Apr May Jun Jul Aug Sep Oct Nov Dec
Südwestdt. Mittelgebirge
56,827 km²
446 m(110–1,493 m)
7.9 °C
879 mm
1,577 hrs
South West German Uplands
0 hrs
100 hrs
200 hrs
300 hrs
400 hrs
500 hrs0 mm
50 mm
100 mm
150 mm
200 mm
250 mm
-5 °C
0 °C
5 °C
10 °C
15 °C
20 °C
Jan Feb Mar Apr May Jun Jul Aug Sep Oct Nov Dec
Oestliche Mittelgebirge
22,811 km²
515 m(115–1,465 m)
6.9 °C
873 mm
1,553 hrs
Eastern Uplands
0 hrs
100 hrs
200 hrs
300 hrs
400 hrs
500 hrs0 mm
50 mm
100 mm
150 mm
200 mm
250 mm
-5 °C
0 °C
5 °C
10 °C
15 °C
20 °C
Jan Feb Mar Apr May Jun Jul Aug Sep Oct Nov Dec
Südostdt. Becken+Hügel
46,831 km²
149 m(20–604 m)
8.7 °C
577 mm
1,564 hrs
East German Basins and Hills
0 hrs
100 hrs
200 hrs
300 hrs
400 hrs
500 hrs0 mm
50 mm
100 mm
150 mm
200 mm
250 mm
-5 °C
0 °C
5 °C
10 °C
15 °C
20 °C
Jan Feb Mar Apr May Jun Jul Aug Sep Oct Nov Dec
Nordostdeutsches Tiefland
46,496 km²
43 m(0–179 m)
8.4 °C
577 mm
1,627 hrs
North East German Lowlands
0 hrs
100 hrs
200 hrs
300 hrs
400 hrs
500 hrs0 mm
50 mm
100 mm
150 mm
200 mm
250 mm
-5 °C
0 °C
5 °C
10 °C
15 °C
20 °C
Jan Feb Mar Apr May Jun Jul Aug Sep Oct Nov Dec
Nordwestdeutsches Tiefland
60,298 km²
32 m(−4–210 m)
8.6 °C
745 mm
1,495 hrs
North West German Lowlands
Alpen
Alpenvorland
Linksrheinische Mittelgebirge
Nordostdeutsches Tiefland
Nordwestdeutsches Tiefland
Oberrheinisches Tiefland
Rechtsrheinische Mittelgebirge
Südostdeutsche Becken und Hügel
Südwestdeutsche Mittelgebirge
Westdeutsche Tieflandsbucht
Zentrale Mittelgebirge und Harz
Östliche Mittelgebirge

14
Temperature
The mean annual temperature in Germany in the reference period 1961–1990
was 8.2 °C. While mean temperatures are somewhat lower in Germany‘s
low mountain ranges and along the foothills of the Alps (between 6.9 °C and
8.0 °C), and are just 5.1 °C in the Alps themselves, mean temperatures are
significantly higher in the Upper Rhine Lowlands (9.8 °C) and the West German
Basin (9.6 °C) in particular.
Changes in air temperature since 1881The mean annual air temperature for Germany rose by 1.4 °C between 1881 and 2016. The long-term mean for the standard reference period 1961–1990 of 8.2 °C rose to 8.9 °C in the current 30-year period 1981–2010.
The observable trend of global atmospheric warming is overlaid by the natural variability of the climate system in which there are recurrent periods during which the increase in temperatures stagnates or by phases in which the temperature even falls temporarily. Falls in temperature are usually the result of periodic variations which are closely coupled with ocean circulation. These periodic variations overlap the influence of external climate forcing mechanisms which, in addition to naturally occurring phenomena such as insolation and volcanic activity, include human-induced changes in the concentration of greenhouse gases in the atmosphere as a result, for example, of air pollution and changes in land use.
The period from 1910–1950 and the time following 1980s in particular were marked by rising temperatures, while temperatures during the periods in between remained largely at the same level. Temperatures remained relatively constant at the end of the 19th century as well.
▴ Map of grid values (1 km x 1 km) showing mean annual temperatures in Germany in the standard reference period 1961–1990.

15
The biggest changes (1.5 °C) since 1881 have occurred in the West German Basin, the Uplands on the left bank of the Rhine and in the Upper Rhine Lowlands; temperatures have risen least (1.0 °C) in the North East German Lowlands.
2014 was the warmest year in Germany since 1881. Ten of the seventeen warmest years have been in the 21st century.
Seasonal variationsThe long-term mean air temperature for the winter months (December, January, February) is 0.3 °C for Germany as a whole, in other words just above freezing point. Air temperatures are marked by high spatial differentiation with negative temperatures or
6.0
6.5
7.0
7.5
8.0
8.5
9.0
9.5
10.0
10.5
1880 1890 1900 1910 1920 1930 1940 1950 1960 1970 1980 1990 2000 2010
19406.6 °C
201410.3 °C
Annual averagesMean for the 1961–1990 reference periodLinear trend
°C
▴ It has become warmer in Germany: mean annual temperature (area average from station measurements taken at 2 m) from 1881–2016.
temperatures just below freezing in the Alps, the Alpine foothills and in the low mountain range areas. The highest mean temperatures of approximately 1.7 °C to 2.4 °C are measured in the Upper Rhine Lowlands and the West German Basin. It is also relatively mild in the North West German Lowlands at 1.2 °C.
In the summer months, in contrast, the regional differences in mean temperatures are, with the exception of the Alps, less pronounced: at a mean temperature of 16.3 °C for Germany as a whole the highest mean temperatures for the months of June, July and August are 18.0 °C in the Upper Rhine Valley and 17.1 °C in the East German Basin; in contrast, temperature in the low mountain ranges reach 16 °C.
16
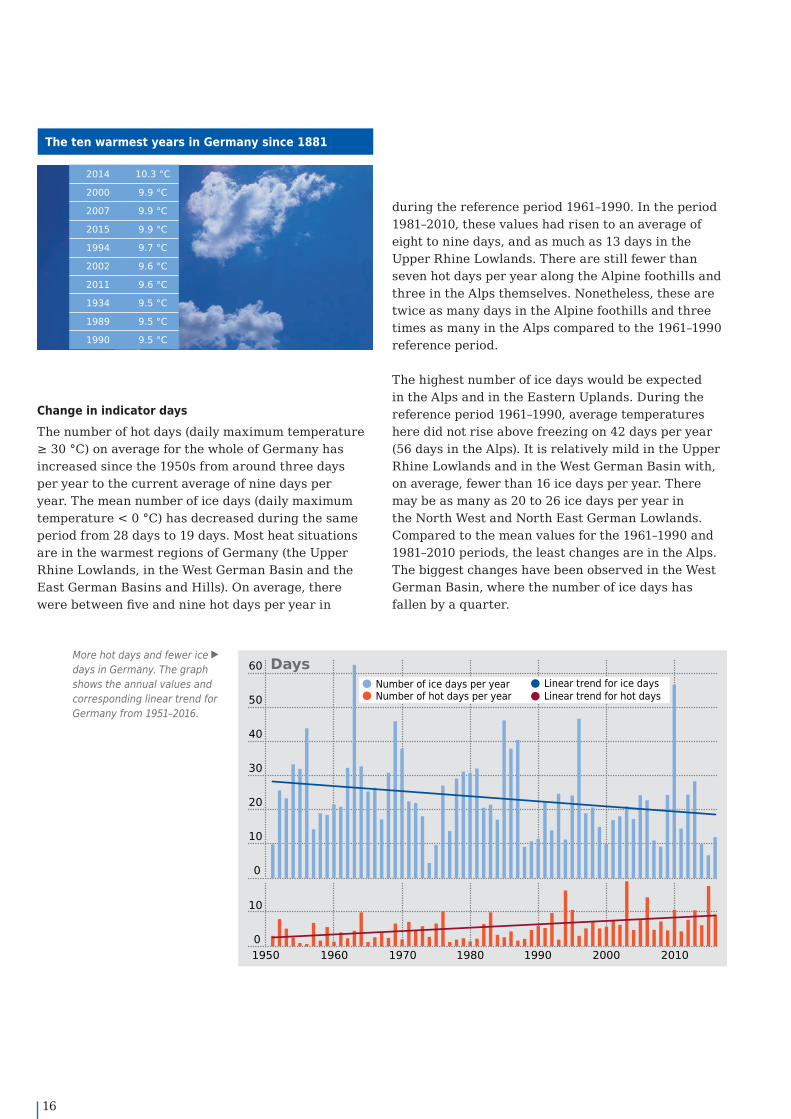
Change in indicator daysThe number of hot days (daily maximum temperature ≥ 30 °C) on average for the whole of Germany has increased since the 1950s from around three days per year to the current average of nine days per year. The mean number of ice days (daily maximum temperature < 0 °C) has decreased during the same period from 28 days to 19 days. Most heat situations are in the warmest regions of Germany (the Upper Rhine Lowlands, in the West German Basin and the East German Basins and Hills). On average, there were between five and nine hot days per year in
during the reference period 1961–1990. In the period 1981–2010, these values had risen to an average of eight to nine days, and as much as 13 days in the Upper Rhine Lowlands. There are still fewer than seven hot days per year along the Alpine foothills and three in the Alps themselves. Nonetheless, these are twice as many days in the Alpine foothills and three times as many in the Alps compared to the 1961–1990 reference period.
The highest number of ice days would be expected in the Alps and in the Eastern Uplands. During the reference period 1961–1990, average temperatures here did not rise above freezing on 42 days per year (56 days in the Alps). It is relatively mild in the Upper Rhine Lowlands and in the West German Basin with, on average, fewer than 16 ice days per year. There may be as many as 20 to 26 ice days per year in the North West and North East German Lowlands. Compared to the mean values for the 1961–1990 and 1981–2010 periods, the least changes are in the Alps. The biggest changes have been observed in the West German Basin, where the number of ice days has fallen by a quarter.
More hot days and fewer ice ▸ days in Germany. The graph shows the annual values and corresponding linear trend for Germany from 1951–2016.
0
10
1950 1960 1970 1980 1990 2000 2010
0
10
20
30
40
50
60Number of ice days per yearNumber of hot days per year
Linear trend for ice daysLinear trend for hot days
Days
The ten warmest years in Germany since 1881
2014 10.3 °C
2000 9.9 °C
2007 9.9 °C
2015 9.9 °C
1994 9.7 °C
2002 9.6 °C
2011 9.6 °C
1934 9.5 °C
1989 9.5 °C
1990 9.5 °C
17
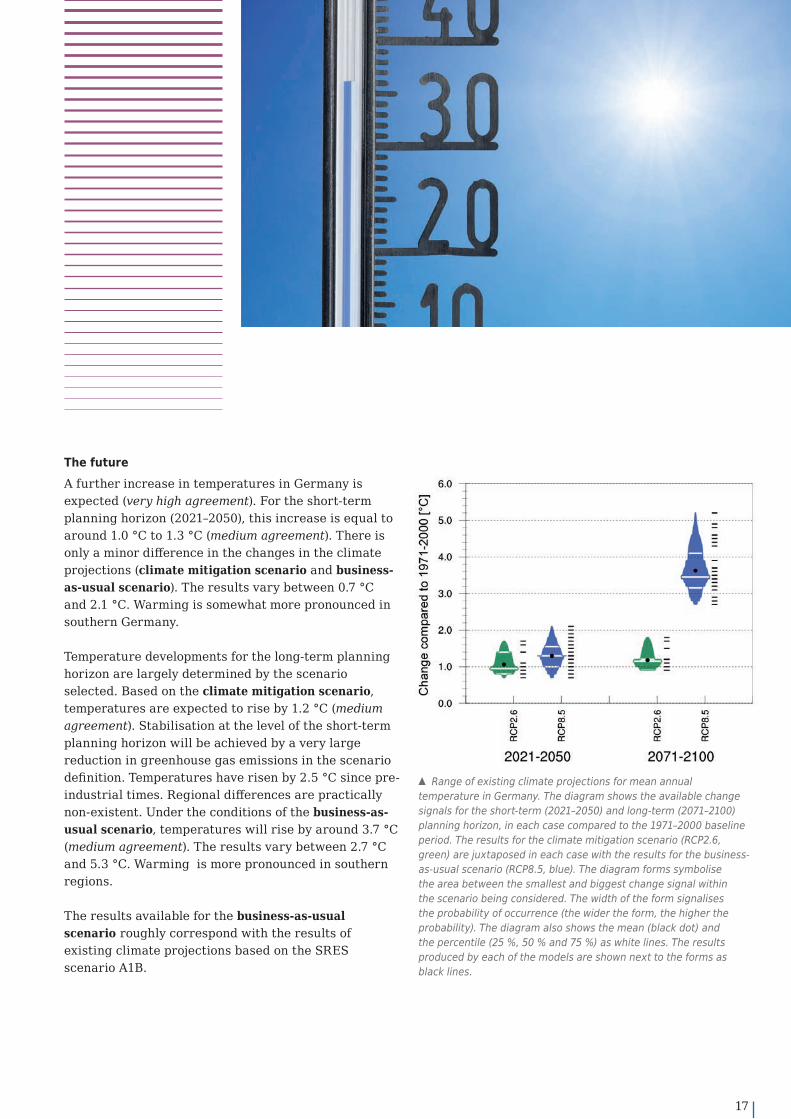
The futureA further increase in temperatures in Germany is expected (very high agreement). For the short-term planning horizon (2021–2050), this increase is equal to around 1.0 °C to 1.3 °C (medium agreement). There is only a minor diff erence in the changes in the climate projections (climate mitigation scenario and business-as-usual scenario). The results vary between 0.7 °C and 2.1 °C. Warming is somewhat more pronounced in southern Germany.
Temperature developments for the long-term planning horizon are largely determined by the scenario selected. Based on the climate mitigation scenario, temperatures are expected to rise by 1.2 °C (medium agreement). Stabilisation at the level of the short-term planning horizon will be achieved by a very large reduction in greenhouse gas emissions in the scenario defi nition. Temperatures have risen by 2.5 °C since pre-industrial times. Regional diff erences are practically non-existent. Under the conditions of the business-as-usual scenario, temperatures will rise by around 3.7 °C (medium agreement). The results vary between 2.7 °C and 5.3 °C. Warming is more pronounced in southern regions.
The results available for the business-as-usual scenario roughly correspond with the results of existing climate projections based on the SRES scenario A1B.
▴ Range of existing climate projections for mean annual temperature in Germany. The diagram shows the available change signals for the short-term (2021–2050) and long-term (2071–2100) planning horizon, in each case compared to the 1971–2000 baseline period. The results for the climate mitigation scenario (RCP2.6, green) are juxtaposed in each case with the results for the business-as-usual scenario (RCP8.5, blue). The diagram forms symbolise the area between the smallest and biggest change signal within the scenario being considered. The width of the form signalises the probability of occurrence (the wider the form, the higher the probability). The diagram also shows the mean (black dot) and the percentile (25 %, 50 % and 75 %) as white lines. The results produced by each of the models are shown next to the forms as black lines.
18
Regional diff erencesIn the Alps in particular, the projected rates of warming, both for the climate mitigation scenario and for the business-as-usual scenario, are still higher than the changes projected for Germany as a whole. Here the change for the short-term planning horizon is between +1.3 °C (climate mitigation scenario) and +1.5 °C (business-as-usual scenario) compared to the 1971–2000 baseline period. Mean rates of warming of between 1.3 °C (climate mitigation scenario) and 4.4 °C (business-as-usual scenario, medium agreement) are projected for the long-term planning horizon.
In the coastal region of Germany‘s North West and North East Lowlands, the projected changes for the long-term planning horizon are slightly below the mean values. Rates of warming of between 1.2 °C (climate mitigation scenario, medium agreement) and 3.4 °C (business-as-usual scenario, medium agreement) are projected here.
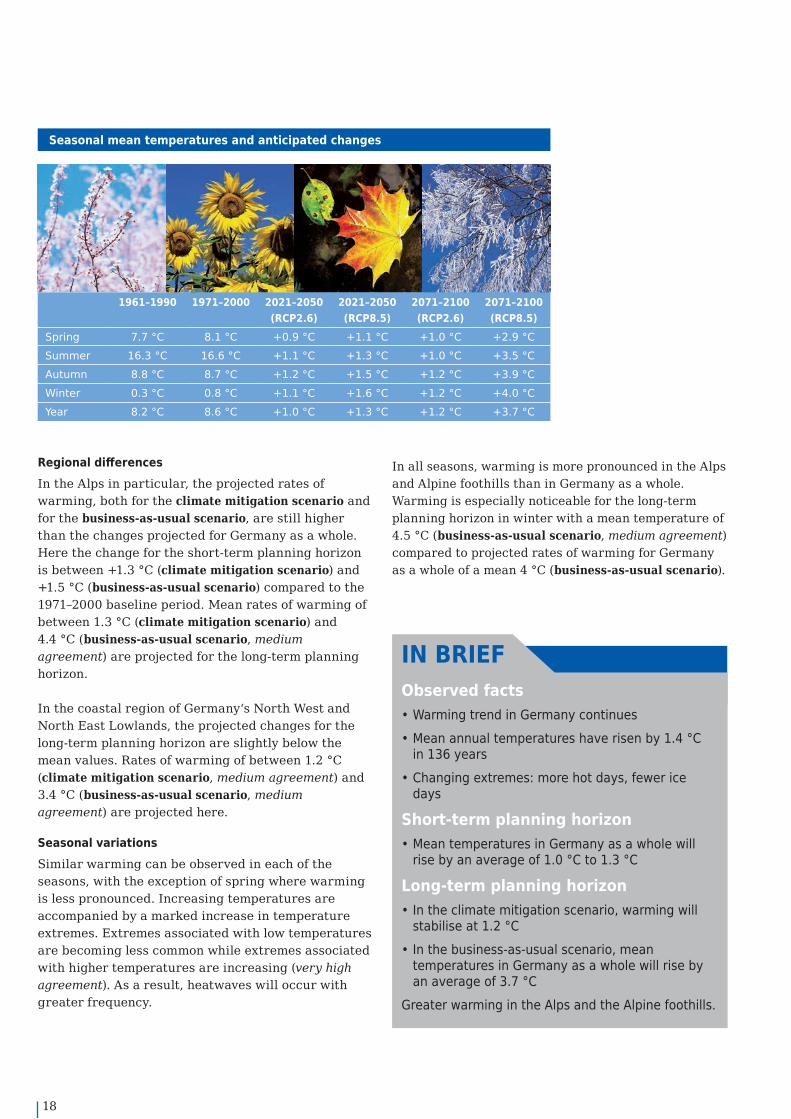
Seasonal variationsSimilar warming can be observed in each of the seasons, with the exception of spring where warming is less pronounced. Increasing temperatures are accompanied by a marked increase in temperature extremes. Extremes associated with low temperatures are becoming less common while extremes associated with higher temperatures are increasing (very high agreement). As a result, heatwaves will occur with greater frequency.
Seasonal mean temperatures and anticipated changes
1961–1990 1971–2000 2021–2050 (RCP2.6)
2021–2050 (RCP8.5)
2071–2100 (RCP2.6)
2071–2100 (RCP8.5)
Spring 7.7 °C 8.1 °C +0.9 °C +1.1 °C +1.0 °C +2.9 °CSummer 16.3 °C 16.6 °C +1.1 °C +1.3 °C +1.0 °C +3.5 °CAutumn 8.8 °C 8.7 °C +1.2 °C +1.5 °C +1.2 °C +3.9 °CWinter 0.3 °C 0.8 °C +1.1 °C +1.6 °C +1.2 °C +4.0 °CYear 8.2 °C 8.6 °C +1.0 °C +1.3 °C +1.2 °C +3.7 °C
In all seasons, warming is more pronounced in the Alps and Alpine foothills than in Germany as a whole. Warming is especially noticeable for the long-term planning horizon in winter with a mean temperature of 4.5 °C (business-as-usual scenario, medium agreement) compared to projected rates of warming for Germany as a whole of a mean 4 °C (business-as-usual scenario).
Observed facts• Warming trend in Germany continues• Mean annual temperatures have risen by 1.4 °C
in 136 years• Changing extremes: more hot days, fewer ice
days
Short-term planning horizon• Mean temperatures in Germany as a whole will
rise by an average of 1.0 °C to 1.3 °C
Long-term planning horizon• In the climate mitigation scenario, warming will
stabilise at 1.2 °C• In the business-as-usual scenario, mean
temperatures in Germany as a whole will rise by an average of 3.7 °C
Greater warming in the Alps and the Alpine foothills.
IN BRIEF
19
The COP21 goals (see page 3) can only be seen in context by aggregating previous observations of global warming with the warming projected on the basis of the climate scenarios. The fi rst term is the warming (0.6 °C) between the periods 1850–1900 and 1986–2005. Warming in line with the climate mitigation scenario (0.6 °C + 1.0 °C, total 1.6 °C) would enable compliance with the COP21 2 °C target. If temperatures rise as outlined in the business-as-usual scenario (0.6 °C + 3.7 °C, total 4.3 °C), the COP21 targets would be missed by a wide margin.
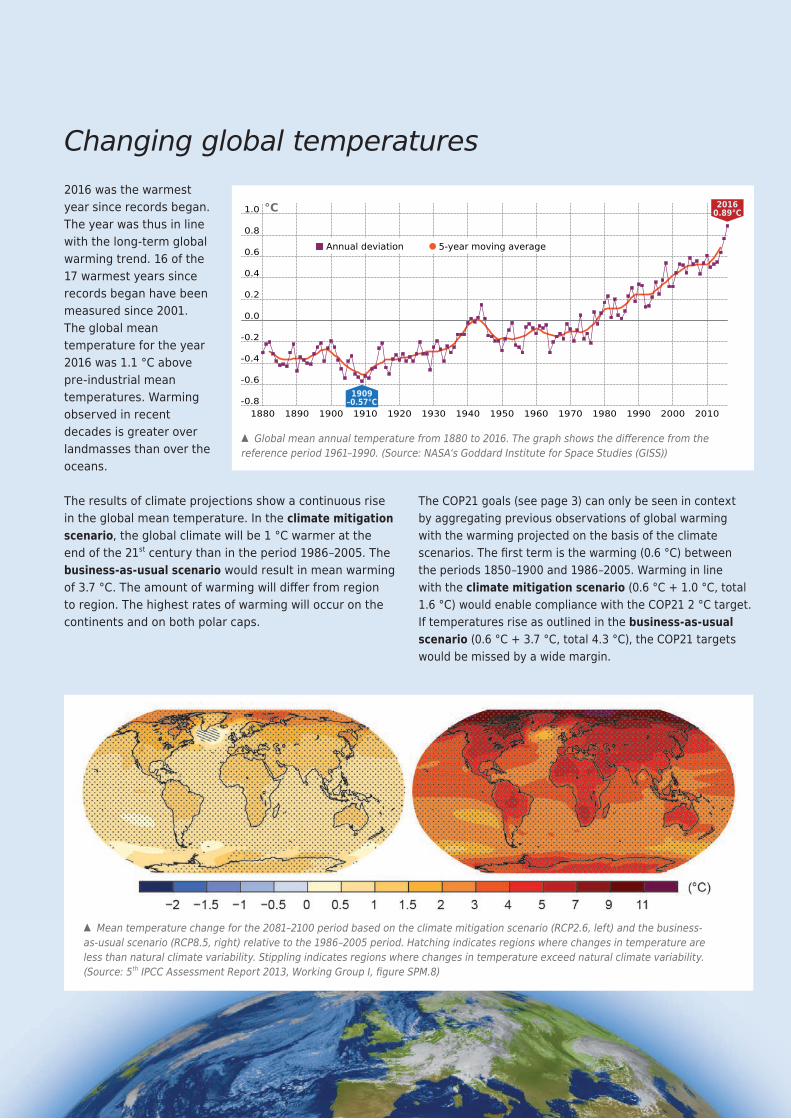
2016 was the warmest year since records began. The year was thus in line with the long-term global warming trend. 16 of the 17 warmest years since records began have been measured since 2001. The global mean temperature for the year 2016 was 1.1 °C above pre-industrial mean temperatures. Warming observed in recent decades is greater over landmasses than over the oceans.
The results of climate projections show a continuous rise in the global mean temperature. In the climate mitigation scenario, the global climate will be 1 °C warmer at the end of the 21st century than in the period 1986–2005. The business-as-usual scenario would result in mean warming of 3.7 °C. The amount of warming will diff er from region to region. The highest rates of warming will occur on the continents and on both polar caps.
Changing global temperatures
-0.8
-0.6
-0.4
-0.2
0.0
0.2
0.4
0.6
0.8
1.0
1880 1890 1900 1910 1920 1930 1940 1950 1960 1970 1980 1990 2000 2010
1909–0.57°C
20160.89°C°C
Annual deviation 5-year moving average
▴ Global mean annual temperature from 1880 to 2016. The graph shows the diff erence from the reference period 1961–1990. (Source: NASA‘s Goddard Institute for Space Studies (GISS))
▴ Mean temperature change for the 2081–2100 period based on the climate mitigation scenario (RCP2.6, left) and the business-as-usual scenario (RCP8.5, right) relative to the 1986–2005 period. Hatching indicates regions where changes in temperature are less than natural climate variability. Stippling indicates regions where changes in temperature exceed natural climate variability. (Source: 5th IPCC Assessment Report 2013, Working Group I, fi gure SPM.8)
20
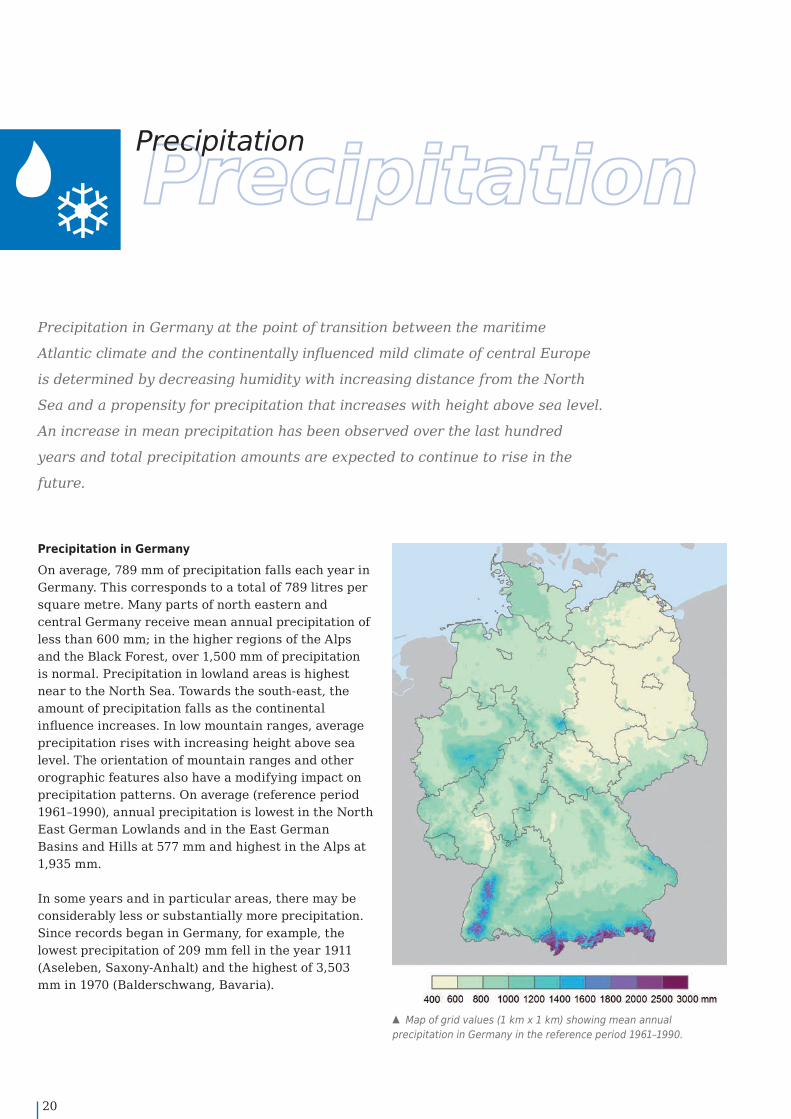
Precipitation in GermanyOn average, 789 mm of precipitation falls each year in Germany. This corresponds to a total of 789 litres per square metre. Many parts of north eastern and central Germany receive mean annual precipitation of less than 600 mm; in the higher regions of the Alps and the Black Forest, over 1,500 mm of precipitation is normal. Precipitation in lowland areas is highest near to the North Sea. Towards the south-east, the amount of precipitation falls as the continental influence increases. In low mountain ranges, average precipitation rises with increasing height above sea level. The orientation of mountain ranges and other orographic features also have a modifying impact on precipitation patterns. On average (reference period 1961–1990), annual precipitation is lowest in the North East German Lowlands and in the East German Basins and Hills at 577 mm and highest in the Alps at 1,935 mm.
In some years and in particular areas, there may be considerably less or substantially more precipitation. Since records began in Germany, for example, the lowest precipitation of 209 mm fell in the year 1911 (Aseleben, Saxony-Anhalt) and the highest of 3,503 mm in 1970 (Balderschwang, Bavaria).
Precipitation
▴ Map of grid values (1 km x 1 km) showing mean annual precipitation in Germany in the reference period 1961–1990.
Precipitation in Germany at the point of transition between the maritime
Atlantic climate and the continentally influenced mild climate of central Europe
is determined by decreasing humidity with increasing distance from the North
Sea and a propensity for precipitation that increases with height above sea level.
An increase in mean precipitation has been observed over the last hundred
years and total precipitation amounts are expected to continue to rise in the
future.

21
Changes in annual precipitation since 1881The magnitude of precipitation varies greatly in time and space. Since 1881 the wettest year on average in the whole of Germany was the year 2002, in which 1,018 mm of precipitation were measured; the driest year was the year 1959 (551 mm). With at times very strong variations from year to year or from decade to decade, annual precipitation in Germany as a whole increased in the 136 years from 1881 by 74 mm or 9 % (relative to the 1961–1990 reference period). This increase was uneven: from the 1880s through to the 1920s, there was initially a strong increase in precipitation; subsequently up to the present, precipitation has increased at a slower rate. This latter increase was accompanied by short term variations, such that it was somewhat drier in the 1940s and the 1970s, while the 1960s, 1980s and the phase around the millennium were comparatively wet.
▴ It has become wetter in Germany: annual precipitation (area average from station measurements) from 1881 to 2016.
1880 1890 1900 1910 1920 1930 1940 1950 1960 1970 1980 1990 2000 20100
200
400
600
800
1,000
1,200
1959551 mm
20021,018 mm
Annual totalsMean for the 1961–1990 reference periodlinear trend
mm
Seasonal variationsOn average in Germany, precipitation was somewhat higher in the hydrological summer half years (May to October) in all the years of observation. Around 57 % of the annual precipitation falls in the summer half year, and around 43 % in the winter half year. In some regions the precipitation in the summer half-year is even greater, for example in the Alpine Foothills (63 %). In other regions the dominance of the summer half-year is much less pronounced, for example in the Uplands on the right bank of the Rhine (51 %). Looking at just the three summer months of June, July and August, the driest summer was in the year 1911 (124 mm), and the wettest summer in the year 1882 (358 mm). The normal total is 239 mm (average 1961–1990). From 1881 up to the present, summer precipitation has hardly changed at all. During the same period, precipitation has increased in the transitional seasons of spring and autumn, with this trend being significantly more pronounced in spring than in autumn.
The most striking development has been in the three winter months (December, January, February), however. Winter precipitation has increased since the winter of 1881/82 up to the present by 48 mm or 26 % relative to the reference period 1961–1990. This means that the increase in average annual precipitation can largely be explained by the increase in precipitation during the winter. Despite this overall trend for the winter, there are nonetheless significant differences in this season from year to year. The winter with the least
22
precipitation (69 mm) in the year 1890/91 contrasts with the winter with the most precipitation (304 mm) in the year 1947/48. The normal total is 181 mm (average 1961–1990).
The Alps are the wettest region in every season. In the driest regions, in contrast, there are differences between the seasons: precipitation is lowest in the North East German Lowlands in spring and summer, with 132 mm and 182 mm respectively (average 1961–1990), while the East German Basins and Hills region is drier, with 128 mm in autumn and 123 mm in winter. There were no significant changes in the amount of precipitation in either region between 1881 and 2016. The strongest annual trend relative to 1961–1990 is in the North West German Lowlands at +14 %, where the greatest increase, as is the case for Germany as a whole, is for the winter at +33 %.
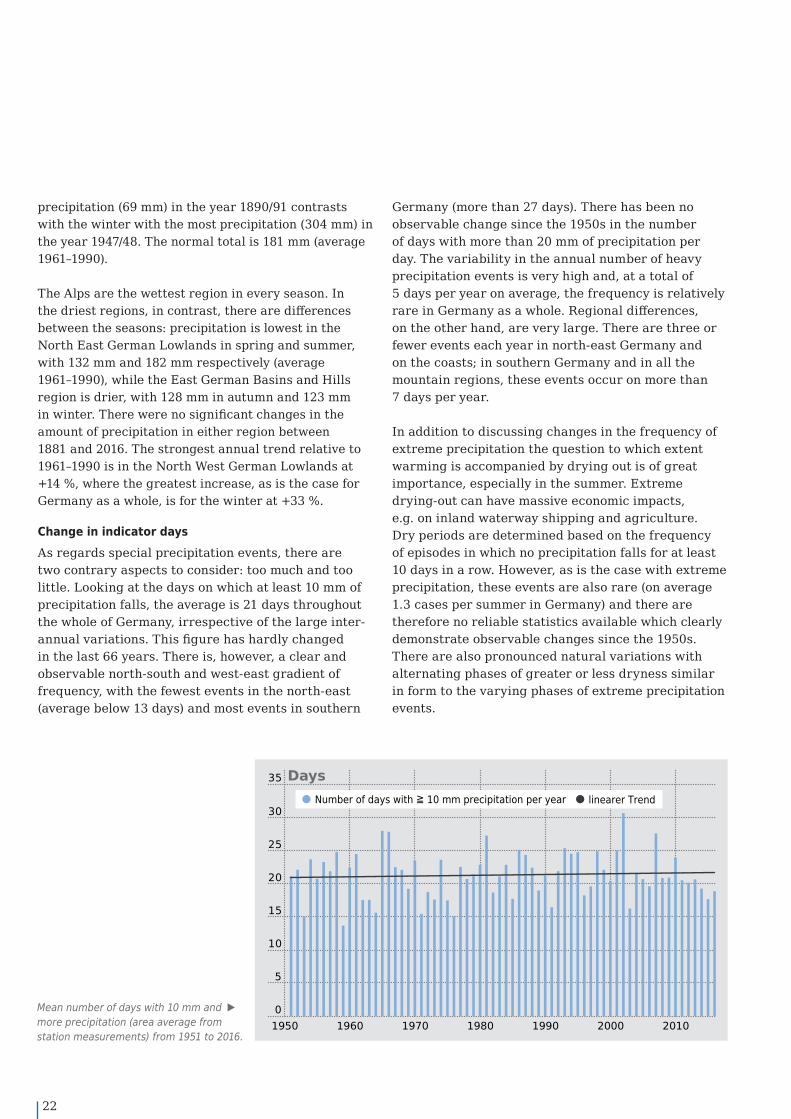
Change in indicator daysAs regards special precipitation events, there are two contrary aspects to consider: too much and too little. Looking at the days on which at least 10 mm of precipitation falls, the average is 21 days throughout the whole of Germany, irrespective of the large inter-annual variations. This figure has hardly changed in the last 66 years. There is, however, a clear and observable north-south and west-east gradient of frequency, with the fewest events in the north-east (average below 13 days) and most events in southern
Germany (more than 27 days). There has been no observable change since the 1950s in the number of days with more than 20 mm of precipitation per day. The variability in the annual number of heavy precipitation events is very high and, at a total of 5 days per year on average, the frequency is relatively rare in Germany as a whole. Regional differences, on the other hand, are very large. There are three or fewer events each year in north-east Germany and on the coasts; in southern Germany and in all the mountain regions, these events occur on more than 7 days per year.
In addition to discussing changes in the frequency of extreme precipitation the question to which extent warming is accompanied by drying out is of great importance, especially in the summer. Extreme drying-out can have massive economic impacts, e.g. on inland waterway shipping and agriculture. Dry periods are determined based on the frequency of episodes in which no precipitation falls for at least 10 days in a row. However, as is the case with extreme precipitation, these events are also rare (on average 1.3 cases per summer in Germany) and there are therefore no reliable statistics available which clearly demonstrate observable changes since the 1950s. There are also pronounced natural variations with alternating phases of greater or less dryness similar in form to the varying phases of extreme precipitation events.
0
5
10
15
20
25
30
35
1950 1960 1970 1980 1990 2000 2010
Number of days with ≧ 10 mm precipitation per year linearer Trend
Days
Mean number of days with 10 mm and ▶ more precipitation (area average from station measurements) from 1951 to 2016.

23
▴ Range of existing climate projections for total annual precipitation in Germany. The diagram shows the available change signals for the short-term (2021–2050) and long-term (2071–2100) planning horizon, in each case compared to the 1971–2000 reference period. The results for the climate mitigation scenario (RCP2.6, green) are juxtaposed in each case with the results for the business-as-usual scenario (RCP8.5, blue). The diagram forms symbolise the area between the smallest and biggest change signal within the scenario being considered. The width of the form signalises the probability of occurrence (the wider the form, the higher the probability). The diagram also shows the mean (black dot) and the percentile (25 %, 50 % and 75 %) as white lines. The results produced by each of the models are shown next to the forms as black lines.
The futureA marked change in the mean annual precipitation totals over the short-term planning horizon (2021–2050) is not expected in Germany (very high agreement). An increase in mean annual precipitation of 5 % is calculated (medium agreement). There is little difference between the scenarios. The results vary between −2 % and +14 % and are almost identical throughout all the territory of the Federal Republic of Germany. One fundamental issue of note is that a modelled change of less than 10 % cannot be distinguished from natural climate variability. This threshold applies to all following values. The attributes medium to very high agreement above and in the text below relate to the scientific plausibility and uniform tendency of the model results.
Regional differencesIn the long-term planning horizon (2071–2100) annual precipitation in Germany is projected to increase by +9 % (medium agreement). The degree of change will be almost identical throughout all the territory of the Federal Republic of Germany.
The number of days with precipitation of at least 10 mm per day is expected to increase in all regions, over both the short-term and long-term planning horizons. Only in the Alpine region do some models project fewer such days. A less pronounced increase is projected for days with precipitation of 20 mm and more. However, the range for heavy and extreme precipitation within the ensemble is very large in parts and the results are therefore not particularly robust. The regional differences in changes in mean annual precipitation totals are not very pronounced.
24
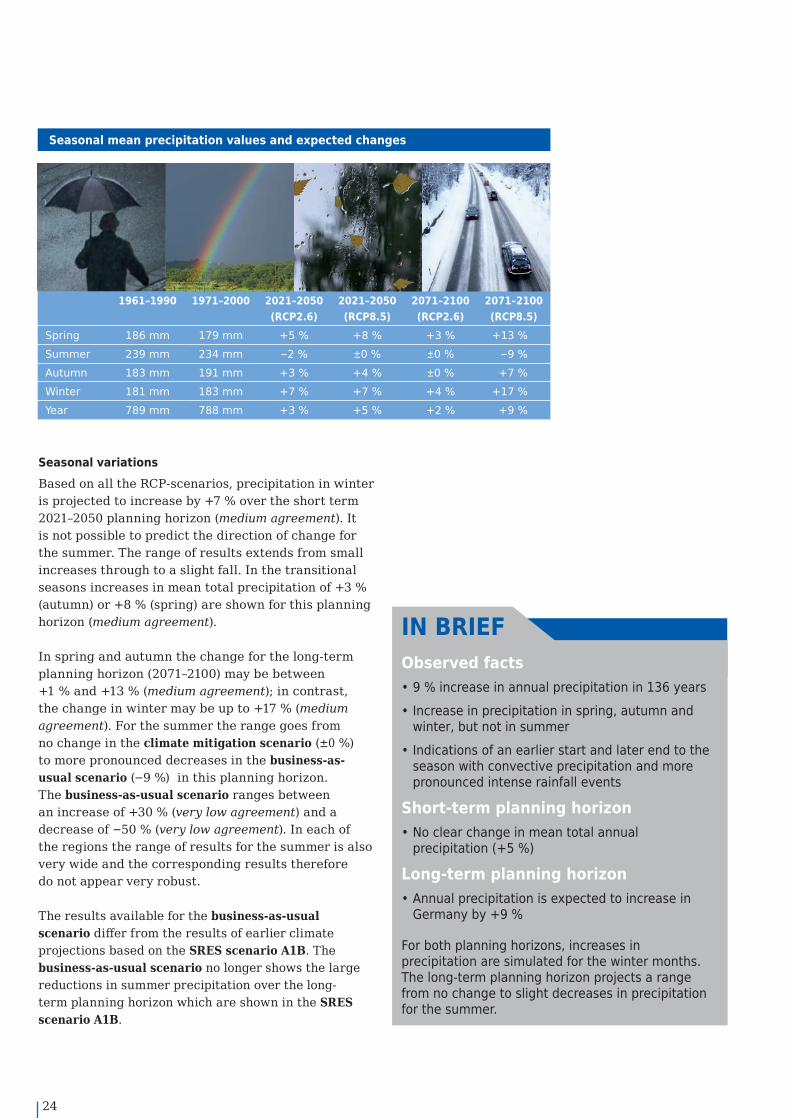
Seasonal variationsBased on all the RCP-scenarios, precipitation in winter is projected to increase by +7 % over the short term 2021–2050 planning horizon (medium agreement). It is not possible to predict the direction of change for the summer. The range of results extends from small increases through to a slight fall. In the transitional seasons increases in mean total precipitation of +3 % (autumn) or +8 % (spring) are shown for this planning horizon (medium agreement).
In spring and autumn the change for the long-term planning horizon (2071–2100) may be between +1 % and +13 % (medium agreement); in contrast, the change in winter may be up to +17 % (medium agreement). For the summer the range goes from no change in the climate mitigation scenario (±0 %) to more pronounced decreases in the business-as-usual scenario (−9 %) in this planning horizon. The business-as-usual scenario ranges between an increase of +30 % (very low agreement) and a decrease of −50 % (very low agreement). In each of the regions the range of results for the summer is also very wide and the corresponding results therefore do not appear very robust.
The results available for the business-as-usual scenario diff er from the results of earlier climate projections based on the SRES scenario A1B. The business-as-usual scenario no longer shows the large reductions in summer precipitation over the long-term planning horizon which are shown in the SRES scenario A1B.
Seasonal mean precipitation values and expected changes
1961–1990 1971–2000 2021–2050 (RCP2.6)
2021–2050 (RCP8.5)
2071–2100 (RCP2.6)
2071–2100 (RCP8.5)
Spring 186 mm 179 mm +5 % +8 % +3 % +13 %Summer 239 mm 234 mm −2 % ±0 % ±0 % −9 %Autumn 183 mm 191 mm +3 % +4 % ±0 % +7 %Winter 181 mm 183 mm +7 % +7 % +4 % +17 %Year 789 mm 788 mm +3 % +5 % +2 % +9 %
Observed facts• 9 % increase in annual precipitation in 136 years• Increase in precipitation in spring, autumn and
winter, but not in summer• Indications of an earlier start and later end to the
season with convective precipitation and more pronounced intense rainfall events
Short-term planning horizon• No clear change in mean total annual
precipitation (+5 %)
Long-term planning horizon• Annual precipitation is expected to increase in
Germany by +9 %
For both planning horizons, increases in precipitation are simulated for the winter months. The long-term planning horizon projects a range from no change to slight decreases in precipitation for the summer.
IN BRIEF

25
Global precipitation varies greatly, both spatially and temporally, due to the many relevant natural variations resulting, for example, from typical circulation patterns, such as the El Niño Southern Oscillation (ENSO) and the North Atlantic Oscillation (NAO).
Precipitation over Europe has increased by 6–8 % over the last century. This increase manifests itself in quite diff erent ways in northern and southern Europe: in northern Europe precipitation has increased by 10–40 %; precipitation in the Mediterranean area and in parts of south-east Europe, in contrast, has decreased by up to 20 %. As in Germany, regional trends are also apparent. Precipitation totals have increased in northern and western Europe in particular and most strikingly in the winter months (20–40 %). In contrast, there has been a decrease in precipitation in southern Europe in all seasons. Signifi cant reductions in precipitation are also apparent in central Europe in summer.
The results of the climate projections show that, for the most part, changes in precipitation follow a pattern whereby drier regions are becoming even drier and wetter regions even wetter. The changes which are expected in connection with the climate mitigation scenario (RCP2.6) will, however, be very moderate towards the end of the 21st century compared to the period 1986–2005, particularly over Europe. The signals in the business-as-usual-scenario (RCP8.5) are becoming much clearer, although here too there is a clear dichotomy in Europe: precipitation is projected to decrease
Changes in global precipitation
between south-west Europe through the Balkans to central Asia by an annual average of 20–40 % and by as much as 50–75 % in the summer. Annual average increases of 10–30 % are limited to Scandinavia. In the summer, in contrast, Europe as a whole will probably receive less precipitation.
▴ Mean change in precipitation for the 2081–2100 period based on the climate mitigation scenario (RCP 2.6, left) and the business-as-usual scenario (RCP 8.5, right) relative to the 1986–2005 period. Hatching indicates regions where changes in precipitation are smaller than natural climate variability. Stippling indicates regions where changes in precipitation exceed natural climate variability. (Source: 5th IPCC Assessment Report 2013, Working Group I, fi gure SPM.8)
▴ Change in annual precipitation between two 30-year periods 1981–2010 and 1951–1980. (Data source: Global Precipitation Climatology Centre (GPCC) operated by DWD under the auspices of the World Meteorological Organization (WMO))

26
Development of sunshine since 1951In the period 1951–2016, mean daily sunshine duration increased by nine minutes. This is largely due to more sunshine during the spring and summer months (in each case +16 minutes per day). There has been a slight decrease in observed sunshine duration in the autumn months (6 minutes per day). The highest rate of increase at +23 minutes has been observed in the West German Basin, while there was no change in the Eastern Uplands in the period 1951–2016.
Past and presentThe presentation of annual totals up to 2016 shows three rough periods of different sunshine durations: a phase of higher annual values from 1951 to 1976, followed by an accumulation of lower annual totals through to roughly the end of the 1980s with values rising again after this date. Between around 1950 and 1980, there was a worldwide phase of decreasing solar radiation which was in part ascribed to increasing air pollution. Successful air pollution control measures subsequently resulted in an increase in surface solar radiation.
Sunshine
Annual sunshine duration ▸ (area average from station measurements) in Germany from 1951–2016.
0
400
800
1,200
1,600
2,000
2,400
1950 1960 1970 1980 1990 2000 2010
Annual values
Linear trend Mean for the 1961–1990 reference period
19771,362 Std.
20032,014 Std.
Hrs
On average, the sun shines in Germany 254 minutes per day or 1,554 hours a
year. The sun shines most in southern Germany and in north-east Germany for
up to 280 minutes per day; the sun may even shine for over 300 minutes per day
on the Baltic coast. Daily sunshine duration is lowest in the Central Uplands and
Harz region, where the measured long-term mean is just 230 minutes per day.

27
The futureSunshine duration is not calculated directly in the climate models, but is indirectly derived from short-wave radiation. Radiation is associated with cloud cover conditions, one of the major challenges facing climate modelling. The range of modelled values therefore varies greatly between the models. The results are consequently much less informative than, for example, the results for temperature changes.
Over the short-term planning horizon 2021–2050 daily sunshine duration is projected to fall by 6 minutes (medium agreement). This fall is particularly noticeable in the business-as-usual scenario in the winter and spring (high agreement), with no changes expected to occur in the summer and autumn (high agreement). These changes are projected uniformly throughout Germany.
The changes are expected to increase over the long-term 2071–2100 planning horizon. Mean daily sunshine duration is expected to drop by between 6 minutes and 12 minutes (medium agreement). This fall will be particularly noticeable in spring and winter with up to 24 minutes less sunshine per day (very low agreement). There will probably be no changes in sunshine duration in autumn. In the business-as-usual scenario some projections forecast increases in mean daily sunshine duration of up to one hour in summer (very low agreement).
Seasonal mean daily sunshine duration and anticipated changes
1961–1990 1971–2000 2021–2050 (RCP2.6)
2021–2050 (RCP8.5)
2071–2100 (RCP2.6)
2071–2100 (RCP8.5)
Spring 304 min. 312 min. +12 min. −12 min. −12 min. −24 min.Summer 400 min. 403 min. −6 min. ±0 min. −12 min. 6 min.Autumn 205 min. 199 min. ±0 min. ±0 min. ±0 min. ±0 min.Winter 102 min. 105 min. −12 min. −12 min. −12 min. −24 min.Year 254 min. 256 min. −6 min. −6 min. −6 min. −12 min.
Observed facts• Average of 254 minutes sunshine per day• Small increase in sunshine duration in Germany
since 1951• A lot of sun in the south and extreme north-east,
more frequently overcast in the centre
Short-term planning horizon• Minimum reduction in sunshine duration
throughout Germany
Long-term planning horizon• Strengthening of these tendenciesPronounced reduction over both planning horizons in winter and spring (only RCP8.5).
IN BRIEF

28
Sea Level
Written by the Federal Maritime and Hydrographic Agency
account vertical land movements and are referred to as relative changes in sea level. Neither global nor regional climate models are currently capable of adequately simulating freshwater fluxes from glacier and ice sheet meltwater and corresponding values must currently be estimated and added to steric and dynamic values.
Observed changes in sea levelNorth Sea: Sea level records for the German Bight go back to 1843 (Cuxhaven), although most date from the 1930s. There are large differences in the rate of relative sea level rise of between 1.7 mm/year and 4.1 mm/year depending on geographical location. All sea level records contain a large amount of decadal variability. In some decades, the sea level has risen by over 4 mm/year while in others it has fallen slightly. Around 0.5–1.5 mm/year of this rise must be deducted again, however, to account for subsidence on the
Sea level ‒ a volatile measureMean sea level and its future changes are of great importance for the long-term planning of coastal defence works. Several components contribute to changes in sea level:a) steric changes relating to changing temperature
and salinityb) dynamic changes based on changing ocean
currentsc) enhanced freshwater fluxes to global oceans
resulting from increased glacial meltingd) enhanced freshwater fluxes due to increased
melting of the Greenland and/or Antarctic ice sheets
e) vertical land movements
The contributions made by components a) to d) produce absolute changes in sea level while actual changes measured at tide gauges also take into
In the period since records began, the mean sea level has risen by around 2 to 4 mm per year along
the entire North Sea coast. Climate models predict a further rise in the future. New studies of ocean
warming and of the Antarctic and Greenland ice sheets suggest that the rate at which temperatures
are rising will probably accelerate.
460
470
480
490
500
510
520
530
1840 1860 1880 1900 1920 1940 1960 1980 2000
Jahresmittelwertelinearer Trend
cm
Mittlerer Meeresspiegel am ▸ Pegel Cuxhaven 1843–2015. (Quelle: Universität Siegen, Bundesamt für Seeschifffahrt und Hydrographie)

29
German North Sea coast. Similar absolute sea level rises have been observed on the English and Scottish east coasts, on the Dutch coast and along the north-eastern Atlantic in general (by 1.7 mm/year). Tide-driven changes in sea level in the North Sea do not change in parallel to the mean rise in sea level. Mean high water levels measured at the Cuxhaven tide gauge since 1950 have been rising more strongly and mean low water levels more weakly than the mean water level. This may be due to waterway construction measures along the Elbe and altered morphological conditions around the Elbe-Weser triangle.
Baltic Sea: The absolute sea level on the Baltic Sea coast has risen by around 1.4–2.0 mm/year. Apart from the south-west Baltic Sea, relative sea level is falling in all other coastal regions as a result of the ongoing post-glacial rebound.
Future changes in sea levelThe Fifth Assessment Report by the Intergovernmental Panel on Climate Change (IPCC) in 2013 outlined sea level rises in relation to different greenhouse gas scenarios through to the end of the 21st century. In the climate mitigation scenario sea levels would rise by between 26 cm and 55 cm and in the business-as-usual scenario by between 52 cm
and 98 cm. However, the report also pointed out that insufficient attention had been given to the potential contribution from the Antarctic and Greenland ice sheets as their physical processes are unknown or have not yet been described mathematically.
Much more is now known about these factors. Oceanographic observations and bathymetric measurements at the edges of the ice sheets are also increasingly showing that warmer ocean water is destroying the ice shelves and that more and more melting is taking place at the point of contact between glaciers and the underlying bedrock. As a result, glaciers are draining into the sea much faster. The consequence of this is that sea level will rise at a much faster rate than the values for 2013. This faster rise can already be observed. At present, the figures for the continued rise in sea level on the German coasts in the business-as-usual scenario are estimated to rise by well over one metre by the end of the 21st century. However, this does not take account of the emerging possibility that both ice sheets could collapse.
Given the high capacity of the oceans to store heat sea level will continue to rise well after the end of the 21st century regardless of the continuing pace of global warming.

30
Phenology
Phenological development in GermanyThe phenological year begins in pre-spring. In the reference period 1961–1990, this phenological season began on average in Germany on 3 March. The season begins with the fl owering of the common hazel (corylus avellana). Early spring begins on average 33 days later on 5 April with the fl owering of forsythia (forsythia × intermedia); full spring begins another 32 days later on 7 May, when apple trees (malus) come into blossom, and lasts on average for 31 days. Comparison of the international standard reference period 1961–1990 with the following 1991–2016 period shows that pre-spring now begins on 16 February and lasts six days longer than in the reference period. Early spring (27 March) and full spring (27 April) also begin earlier.
Weather conditions and climate both have an infl uence on plant growth and development.
The science which studies these phenomena is known as phenology (Greek: “the study of
appearances”). Data on phenological observations are among the most valuable indicators of
changes in environmental conditions and have been collected around the world for centuries.
The early summer begins with the fl owering of black elder (sambucus nigra). In relation to the reference period, this occurs on 7 June and lasts three weeks. In the last 26 years, the actual duration of fl owering has hardly changed; however, the umbels of the elderberry fl ower as early as 27 May. The fi rst blossoming large-leaved lime trees (tilia platyphyllos) signal the transition to high summer. On average over the 30-year period from 1961 to 1990, high summer began on 28 June. In recent years, the onset of high summer has moved forward by 10 days. High summer is the longest of the phenological seasons in the vegetation period and has risen over Germany as a whole from 42 days to 45 days. Late summer has arrived when the fi rst early ripening apples can be picked from the trees. In the reference period
Duration in days: 121
Duration in days: 104
1961–1990
1991–2016
39
31
30
224523
26
27
18 33
32
31
2142
26
22
19
18Jan
FebMarApr
MayJunJul
AugSepOct
NovDec PRE-SPRING
Hazel (flowering)
EARLY SPRINGForsythia (flowering)
FULL SPRINGApple (flowering)
EARLY SUMMERBlack elder (flowering)
HIGH SUMMERLarge-leaved lime (flowering)
EARLY AUTUMN Black elder
(fruits)
HIGH AUTUMN English oak (fruits)
LATE AUTUMN English oak
(leaf discolouration)
WINTER English oak (leaf fall)
Apple, early ripening(fruits)
LATE SUMMER
The various plant development ▸ phases are assigned to phenological seasons. The “phenological clock” shows the seasons and their phenological indicator phases (mean for Germany). Comparison of the periods 1961–1990 and 1991–2016 reveals the shift in phenological seasons.

31
1961–1990, this was on 9 August. More recently, the “Yellow Transparent”, “James Grieve” or “Retina” varieties of apple are ripe and can be enjoyed a week earlier. Over the last 26 years, the late summer has become about 3 days shorter.
While during the reference period early autumn began with the fi rst ripe fruits of the black elder on 4 September, its onset is also now much earlier, being observed around 25 August. Recently, the duration of early autumn has increased by 4 days. In the reference period, high autumn followed with the fi rst ripe fruits from the English oak (quercus robur) on 26 September. It now occurs around six days earlier and, on average, lasts eight days longer. This means that there is only a shift of two days in the date at which the leaves of the English oak begin to discolour, which is the fi rst sign of the beginning of late autumn. In the period 1961–1990, this took place on average on 15 October. Now it occurs on 17 October. The duration hasn’t changed.
The phenological winter begins when the English oak begins dropping its leaves. During the reference period, this occurred on 2 November. There has been no striking change since. Between 1991 and 2016, on average, the winter only began one day later. While it took around 121 days for winter to pass and the new phenological year to begin in the reference period 1961–1990, the period between the leaf fall from the English oak and the renewed fl owering of the hazel has been 17 days shorter on average during the last 26 years.
Regional diff erencesThe dates and fi gures in the previous section are mean values for Germany as a whole. As phenological phases depend directly on the temperature, however, there are some signifi cant regional diff erences. Onset times are strongly infl uenced by geographical latitude
and longitude as well as height above sea level. The earliest phenological dates are usually recorded in the Upper Rhine Lowlands and the latest either in the upland regions or far up in the north on the coast of the Baltic Sea. On average, spring moves from south to north and from west to east. Spring‘s progress slows if it has to cross a mountain range. The growth period begins coming to an end soonest in those places where vegetation started latest.
These changes are most strongly aff ected by changes in air temperature, which are most pronounced in winter and spring. Changes in solar radiation have most eff ect in spring.
The futurePhenological models can be used in conjunction with climate projections to produce predictions of further changes in phenological development. Studies show, for example, that phenological events may be expected to occur ever earlier towards the end of the present century especially in spring. In full spring, apple is projected to fl ower around another 15 days earlier.
▴ Apple, indicator plant of full spring: beginning of fl owering in 2016.

32
Extreme eventsEveryone remembers one extreme event – a disastrous storm, extreme heat or
catastrophic flooding. Extreme events frequently cause human suffering and great
destruction. How has the frequency of extreme events changed in the past and what
changes are to be expected in the future?
Extreme = rareExtreme events are by their nature rare events. They are characterised by highly unusual weather conditions. Extreme events occurred in the past, and they will occur again in the future. Well-known examples in the distant past include St. Mary Magdalene‘s flood in the year 1342, which affected numerous rivers in central Europe, or the “Year Without a Summer” following the eruption of Mount Tambora in 1816.
We have also observed extreme events in the recent past. Examples include the floods of 2002 and 2013, both caused by very heavy rains, the heatwave of August 2003 or the Lothar (1999) and Kyrill (2007) storms.
It is therefore perfectly reasonable to ask what else will climate change bring with it? As extremes are by definition very rare events, statistical analyses are less robust. The recurrence interval is often once every hundred years (once-in-a-century event). The available time series are not much longer than this. It is thus no easy matter to capture an event on this scale statistically.
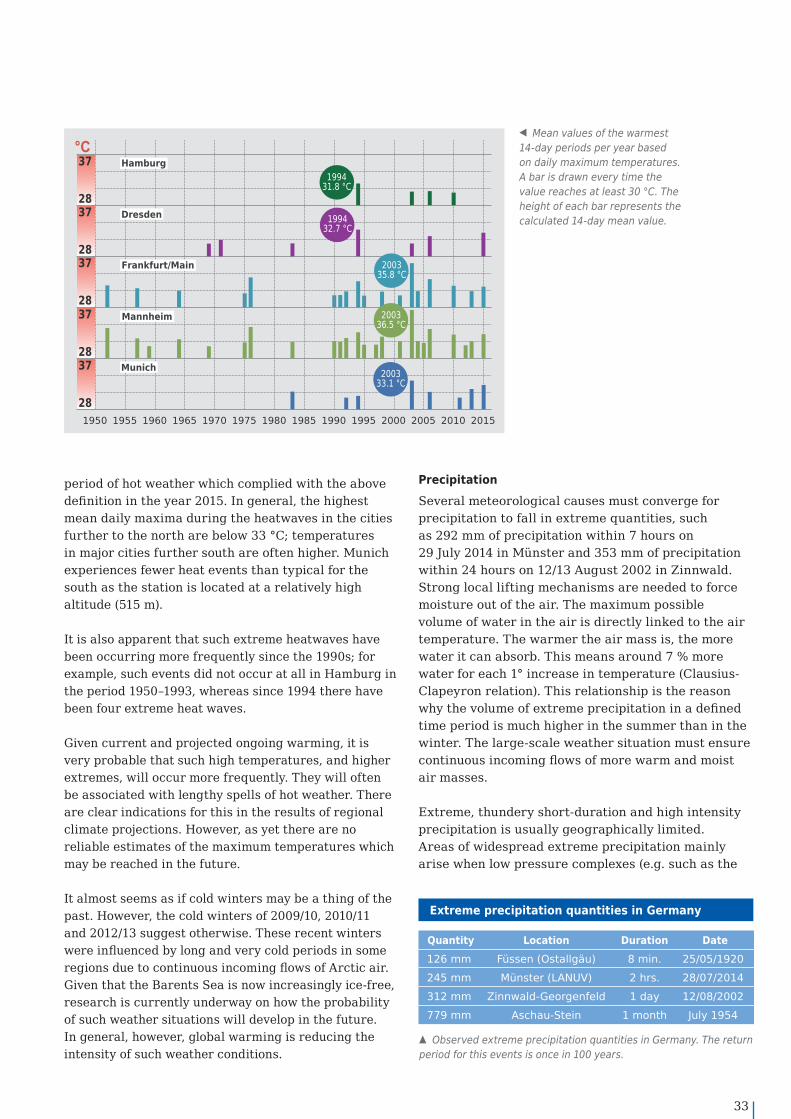
TemperatureThe mean temperature has risen substantially in recent decades. This means that there have been more days and periods of very high temperatures. A good example is the summer of 2015 during which temperature records for Germany were broken twice: 40.3 °C in Kitzingen.
In order to explain extreme events such as the hot summer of 2015 correctly from a climatological perspective it is helpful if the time series used to capture them statistically are as long as possible. For this purpose, climatological parameters are used which are capable of describing the duration, intensity and frequency of extreme events. An analysis has been performed for five German cities, which shows a frequency of at least one 14-day period of hot weather (heatwave) per year with a mean daily maximum air temperature of 30 °C or above for the period 1950–2016. The mean maximum temperature over such a period is used as a measure of the heatwave‘s intensity.
The analysis reveals a north-south gradient in the frequency and intensity of heatwaves; in northern Germany (Hamburg), there was no single longer
33
PrecipitationSeveral meteorological causes must converge for precipitation to fall in extreme quantities, such as 292 mm of precipitation within 7 hours on 29 July 2014 in Münster and 353 mm of precipitation within 24 hours on 12/13 August 2002 in Zinnwald. Strong local lifting mechanisms are needed to force moisture out of the air. The maximum possible volume of water in the air is directly linked to the air temperature. The warmer the air mass is, the more water it can absorb. This means around 7 % more water for each 1° increase in temperature (Clausius-Clapeyron relation). This relationship is the reason why the volume of extreme precipitation in a defined time period is much higher in the summer than in the winter. The large-scale weather situation must ensure continuous incoming flows of more warm and moist air masses.
Extreme, thundery short-duration and high intensity precipitation is usually geographically limited. Areas of widespread extreme precipitation mainly arise when low pressure complexes (e.g. such as the
period of hot weather which complied with the above definition in the year 2015. In general, the highest mean daily maxima during the heatwaves in the cities further to the north are below 33 °C; temperatures in major cities further south are often higher. Munich experiences fewer heat events than typical for the south as the station is located at a relatively high altitude (515 m).
It is also apparent that such extreme heatwaves have been occurring more frequently since the 1990s; for example, such events did not occur at all in Hamburg in the period 1950–1993, whereas since 1994 there have been four extreme heat waves.
Given current and projected ongoing warming, it is very probable that such high temperatures, and higher extremes, will occur more frequently. They will often be associated with lengthy spells of hot weather. There are clear indications for this in the results of regional climate projections. However, as yet there are no reliable estimates of the maximum temperatures which may be reached in the future.
It almost seems as if cold winters may be a thing of the past. However, the cold winters of 2009/10, 2010/11 and 2012/13 suggest otherwise. These recent winters were influenced by long and very cold periods in some regions due to continuous incoming flows of Arctic air. Given that the Barents Sea is now increasingly ice-free, research is currently underway on how the probability of such weather situations will develop in the future. In general, however, global warming is reducing the intensity of such weather conditions.
1950 1955 1960 1965 1970 1975 1980 1985 1990 1995 2000 2005 2010 2015
199431.8 °C
199432.7 °C
200335.8 °C
200336.5 °C
200333.1 °C
°C
37
28
37
28
37
28
37
28
28
37 Munich
Mannheim
Frankfurt/Main
Dresden
Hamburg
◂ Mean values of the warmest 14-day periods per year based on daily maximum temperatures. A bar is drawn every time the value reaches at least 30 °C. The height of each bar represents the calculated 14-day mean value.
▴ Observed extreme precipitation quantities in Germany. The return period for this events is once in 100 years.
Quantity Location Duration Date126 mm Füssen (Ostallgäu) 8 min. 25/05/1920245 mm Münster (LANUV) 2 hrs. 28/07/2014312 mm Zinnwald-Georgenfeld 1 day 12/08/2002779 mm Aschau-Stein 1 month July 1954
Extreme precipitation quantities in Germany
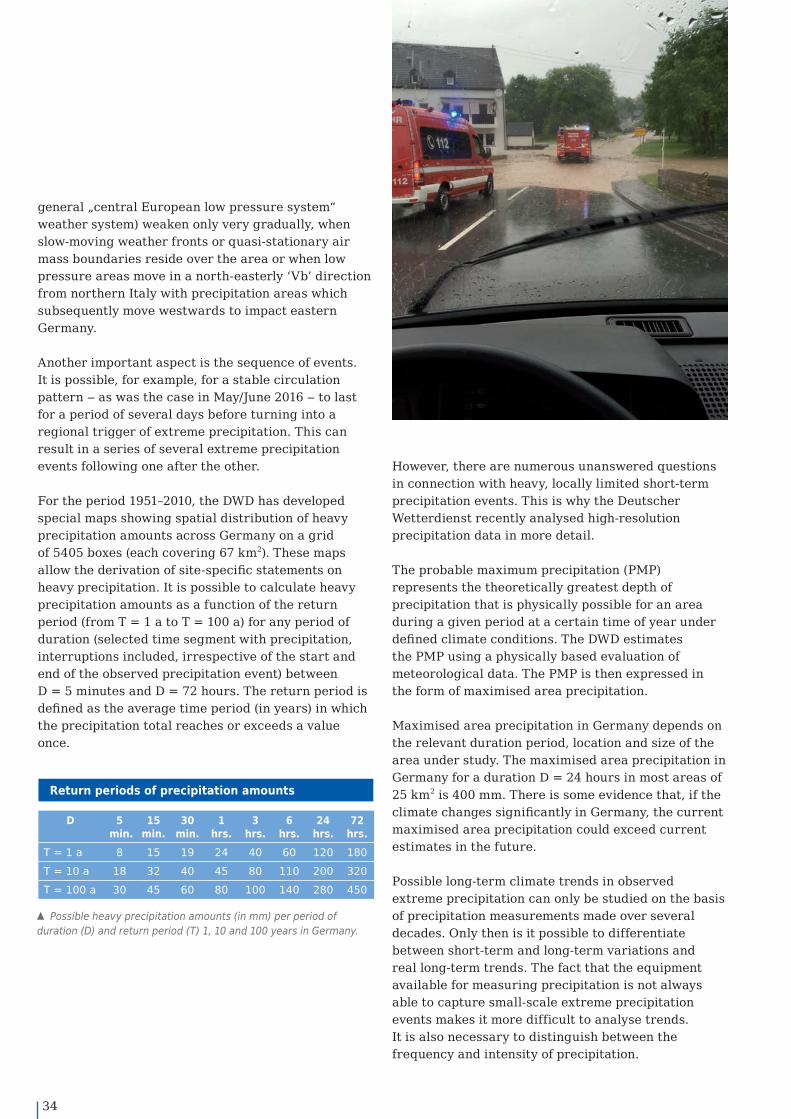
34
general „central European low pressure system“ weather system) weaken only very gradually, when slow-moving weather fronts or quasi-stationary air mass boundaries reside over the area or when low pressure areas move in a north-easterly ‘Vb’ direction from northern Italy with precipitation areas which subsequently move westwards to impact eastern Germany.
Another important aspect is the sequence of events. It is possible, for example, for a stable circulation pattern ‒ as was the case in May/June 2016 ‒ to last for a period of several days before turning into a regional trigger of extreme precipitation. This can result in a series of several extreme precipitation events following one after the other.
For the period 1951–2010, the DWD has developed special maps showing spatial distribution of heavy precipitation amounts across Germany on a grid of 5405 boxes (each covering 67 km2). These maps allow the derivation of site-specific statements on heavy precipitation. It is possible to calculate heavy precipitation amounts as a function of the return period (from T = 1 a to T = 100 a) for any period of duration (selected time segment with precipitation, interruptions included, irrespective of the start and end of the observed precipitation event) between D = 5 minutes and D = 72 hours. The return period is defined as the average time period (in years) in which the precipitation total reaches or exceeds a value once.
However, there are numerous unanswered questions in connection with heavy, locally limited short-term precipitation events. This is why the Deutscher Wetterdienst recently analysed high-resolution precipitation data in more detail.
The probable maximum precipitation (PMP) represents the theoretically greatest depth of precipitation that is physically possible for an area during a given period at a certain time of year under defined climate conditions. The DWD estimates the PMP using a physically based evaluation of meteorological data. The PMP is then expressed in the form of maximised area precipitation.
Maximised area precipitation in Germany depends on the relevant duration period, location and size of the area under study. The maximised area precipitation in Germany for a duration D = 24 hours in most areas of 25 km2 is 400 mm. There is some evidence that, if the climate changes significantly in Germany, the current maximised area precipitation could exceed current estimates in the future.
Possible long-term climate trends in observed extreme precipitation can only be studied on the basis of precipitation measurements made over several decades. Only then is it possible to differentiate between short-term and long-term variations and real long-term trends. The fact that the equipment available for measuring precipitation is not always able to capture small-scale extreme precipitation events makes it more difficult to analyse trends. It is also necessary to distinguish between the frequency and intensity of precipitation.
▴ Possible heavy precipitation amounts (in mm) per period of duration (D) and return period (T) 1, 10 and 100 years in Germany.
D 5 min.
15 min.
30 min.
1 hrs.
3 hrs.
6 hrs.
24 hrs.
72 hrs.
T = 1 a 8 15 19 24 40 60 120 180T = 10 a 18 32 40 45 80 110 200 320T = 100 a 30 45 60 80 100 140 280 450
Return periods of precipitation amounts

35
Analyses of daily precipitation in the winter show that the number of days with large amounts of precipitation increased by around 25% in the period 1951‒2006. A large amount of rainfall is defined as an event which occurs once every 100 days during a reference period . These increases occur in all the regions of Germany. This trend has increased slightly in the spring and autumn seasons.
With the available observational data and known methods it is not possible at present to identify trends in the number of days with large amounts of precipitation in the summer. Short and long-term cyclical variability is dominant. Fundamentally, however, the amount of extreme precipitation is significantly lower in the winter than in the summer.
The data used to analyse precipitation over periods of less than 24 hours is much poorer. Analyses of the large-area radar data available for the last 15 years point to a regional increase in short-lived bursts of extreme precipitation. Owing to the short length of the time series used, these findings are not significant from a climatological perspective and may be the result of short- and medium-range variations. The station data obtained from a time series of over 50 years produce specific trend patterns which vary geographically and for different durations. The relative changes for most regions in Germany do not, however, exceed 5 %.
Water management users are currently enhancing their recommendations in order to deal with urban torrential flooding. Nonetheless, more work must be done to close the diagnosed research and development gap between short-timescale risk management solutions, such as urban drainage systems (15 minutes as the most relevant period of duration), and procedures for river flooding that are based on longer timescales (12 hours and longer).
With rising air temperatures climate change is increasing the potential for extreme precipitation events. This process is strengthened even more by the exponential, rather than linear, relationship between temperature and water content. The current generation of regional climate models shows that there is a trend towards more precipitation extremes. At the same time, the resolution of these models is not fine enough to provide detailed local data for these processes.
As described above, there is a direct connection between air temperature and probable maximum precipitation. The warming observed to date, as well as the further warming projected for the future on the basis of climate modelling, hold the potential for higher volumes of precipitation.
Climate change can also affect the precipitation volumes in Germany in other ways. These could be changes in the large-scale circulation patterns and the tendency for the resulting weather conditions to remain unchanged. Evaluations of observations and climate model simulations show an increase in global precipitation amounts of ~2 % per 1 degree of increase in temperature. This value is lower than the ~7 % increase described for water volumes. A comparable increase in precipitation amounts would be based on consistent relative air humidity. However, observations and model calculations for the past show that there has been a slight fall in relative humidity in Germany. Other factors influencing precipitation are the changed concentrations of greenhouse gases and aerosols. These are currently the object of research.

36
Analyses of maximum daily precipitation totals per year show minimum increases in extreme precipitation totals at many stations. These trends are only significant at a few stations (< 10 %). The finest regional resolution (grid box size) is currently 150 to 200 km for global climate models and 12 to 25 km for regional climate models. This means that both model systems are not capable of directly simulating processes which can trigger thunderstorms. Processes such as the formation of thunderstorms can be described by simplified parameterisations.
The regional climate models of the current generation simulate a tendency for an increase in rainfall extremes, but, due to resolution which is too coarse for these processes, the models are not able to provide detailed local-scale data. Convection-allowing regional models are currently the subject of research.
HailHail events are local and rare events which can cause great damage to infrastructure and losses in agriculture. As hail usually falls in small geographical areas, it has not been possible to record all such events in the past. This gap is being closed by radar data collected since 2011. The results from their analysis show that there are more hail events (i.e. a higher number of days with hail) per year in the south than in the north. However, it is not possible, on the basis of the available observational data, to identify any trends in the changing number of hail events. Alternatively, data can be used which indirectly provide information about hail events, namely those convection parameters which describe the potential for storm and hail formation. Statistical analyses of hail-related convection parameters show a slight increase in this potential over the last 20–30 years.
The spatial resolution of the regional climate models which are currently being used is not sufficient to model hail directly. Hail can only be roughly estimated by means of parameterisations. This means that it is not possible to make statements about future trends. Analyses of the convection potential do not show any uniform trends over the short-term planning horizon.
WindSignificant storm events, such as “Christian” or “Xaver” in 2013, regularly enliven discussion around possible changes in the frequency with which storms occur or about general long-term trends in wind speeds. The answers are elusive. This is partly due to the non-trivial nature of wind speed measurement. In order to reduce the influence of the land surface as far as possible, wind – in contrast to all other meteorological parameters – is ideally measured at a height of 10 m above ground level. Nonetheless, measured wind speeds are sensitive to changes in the vicinity of stations (e.g. tree growth) or changes of the measurement location. For this reason, almost all wind time series show inhomogeneities. What is more, the available time series is usually only a few decades long, which is too short a period to determine long-term trends over a period of 100 years, for example. Particularly interesting storms or hurricanes are rare events and their statistical evaluation is therefore dependent on the longest possible time series.
One way of nonetheless obtaining data on the development of wind speed and the occurrence of storms over the last 100 years or so is to refer to geostrophic wind. This is based on differences in air pressure and is closely related to the „true“ wind. It has been possible to make high-quality measurements of air pressure since the end of the 18th century. Periods of between 10 years to a few decades of higher or lower wind speed (so-called multi-decadal

37
variations) can be identified for geostrophic wind for the German Bight using air pressure data from Hamburg, Emden and List on Sylt. Only a weak falling trend is apparent over the entire time series which is, however, much smaller than the year-to-year variation and as such is not statistically significant.
The results of climate model projections reveal a similar pattern also showing multi-decadal variations in the past and in the future but no long-term trend. This is also the case for storms for which there is no discernible significant change for the future.
TornadoesTornadoes are short-lived and localised violently rotating columns of air at the bottom of a convective cloud and in contact with the ground. Depending on their severity they can cause severe damage. More tornadoes are being detected at present than in the past. Weaker tornadoes, which cause much less damage, still often remain undetected. Since the year 2000 between 20 and 60 cases have been recorded per year. There are probably far more tornadoes than the number actually detected would suggest. More violent and destructive tornadoes seldom occur in Germany. On average, meteorologists expect between five and ten of those tornadoes a year. Because of the lack of reliable observations/counts in the past it is not possible to stata whether there has been an increase in the number of tornadoes in Germany or not.
The available regional climate projections do not allow for the conclusion that tornadoes will occur more frequently in Germany in the future. The projected higher energy potential of the atmosphere in the future could result in a higher frequency of violent tornados and thus a higher risk of potentially very destructive tornadoes.
9
10
11
12
13
14
1880 1890 1900 1910 1920 1930 1940 1950 1960 1970 1980 1990 2000 2010
Annual averages
m/s
▴ Annual average geostrophic wind, calculated from ground level air pressure data at the Hamburg, Emden and List stations. The diagram shows the period 1880 to 2016.
▾ Damage caused by a tornado in Affing (Bavaria) on 13 May 2015.
38
The foundations of modern climate research were laid with the recognition that increasing combustion of fossil carbon stores will alter the composition of the Earth‘s atmosphere. The link between observed warming of the Earth‘s atmosphere and human activities has been clearly demonstrated in recent years. This reinforces the necessity for further study of the climate system. In this respect, the research community has formulated three key objectives for the years ahead:1. Deeper understanding of the complex interactions
within the climate system2. Assessment of and response to the risks and
opportunities arising from climate change3. The role of climate research in society
Deeper understanding of the climate systemThe fundamental interactions of Earth‘s climate system are understood. However, the system is so complex that an enormous amount of research still needs to be done to improve our understanding of certain detailed aspects of the climate. This includes gaps in the understanding of specific processes as well as of the interactions between climate system components.
Many topics have been systematically analysed and existing gaps identifi ed by climate scientists collaborating at the national and international level.
On the basis of these analyses, six topics of particular interest have been determined: 1. Determining and reducing uncertainties in climate
forecasts and climate projections2. Extending the weather forecast and linking it to
the sub-seasonal climate forecasts3. Abrupt climate changes4. Water cycle in a warmer world5. Air quality and climate change6. Greenhouse gas cycles in the climate system
These issues call for ongoing work and research initiatives. This means, for example, that the basis for long-term strategies for the further development and refi nement of regional and global observation systems needs to be laid in research initiatives and models can be used to test many diff erent hypotheses. Work must also be done to ensure that the relevant processes are systematically recorded over the long term. This requires reliable monitoring of anthropogenic changes and natural variability.
Evaluating and dealing with risks and opportunitiesOne special challenge for all stakeholders is the time lag and distributional discrepancies between the causes and eff ects of climate change. Questions concerning the costs and benefi ts of climate change cannot be answered by climate scientists alone. This issue and the options for action which it engenders
Changes in the climate are based on complex
interdependencies. These extend over long
periods of time and may take different
regional forms. This is why it is so difficult
for people to perceive climate change with
the ordinary senses. The national and
international research community regards
study of the climate system and its impacts
on society as a key topic.
Current climate system research

39
must be tackled at the regional and global level and be understood as a common task requiring co-operation between many diff erent scientifi c disciplines.
The regional impacts of climate change are felt in societies with very diff erent social and economic structures and cultural characteristics. In many cases there exist substantial diff erences in the cultural perception of and approach to risks. These diff erent approaches call for analytical research and the development of options for action tailored to specifi c regions.
Research on the interactions between society and climate changeAn important issue for the future is the role of scientists and research institutions in society and,
in particular, their tasks and the boundaries of their work. What role should climate researchers play? Should they confi ne themselves to an inward scientifi c view or should they pursue a political agenda? A good example is the IPCC mandate, which is meant to be policy relevant but not policy prescriptive.
The regular analysis of knowledge generation poses a formidable and enduring challenge for every scientifi c discipline. What are the assumptions upon which our present knowledge is based? Where has consensus been established, and where is there dissent? It is also important to ask whether the existing institutional structures for climate research are fi t for purpose. Are the various topics dealt with appropriately in relation to each other?
CLIMATE FORECASTS FOR THE NEXT MONTHS TO YEARS
Climate forecasts are predictions of the probability of months or years in the future being warmer/colder or drier/wetter than the long-term average. They are based on forecasts for future months (key word: seasonal forecasts) and years (key word: decadal forecasts). Combination with forecasts made in the past enables a comprehensive statistical evaluation of predictions to be made and trends to be identifi ed on the basis of climatology. In this respect, climate forecasts are completely diff erent from weather forecasts, which provide information about detailed weather events over the next hours to days.
Forecasts extending over a period of several months up to ten years must also take into account all the components of the climate system – not merely the lower layer of the atmosphere (the troposphere, up to approximately 9–16 km) but also higher atmosphere layers, the soil, ocean and sea ice. A climate forecast is produced using a climate model coupled with all these components.
In order to generate a robust statistical assessment of forecast quality and reliability both historical and current forecasts are computed as an ensemble. This means, that each forecasts is performed several times under slightly varying states thus forming a range of possible solutions. This range of solutions produced is also used to evaluate the uncertainties which arise from the nonlinearity of the climate system.
Seasonal forecasts are provided each month by using a supercomputing system, e.g. the European Centre for Medium-Range Weather Forecasts in Reading (United Kingdom). At DWD, those forecasts are analysed and processed, enabling for instance El Niño forecasts. Research on decadal forecasts is currently ongoing. Operational use is planned for the next few years.
What will weather conditions be like over the next weeks, months and years? Climate
forecasts are already able to deliver the basis for decision-
making in many regions of the world.

40
Baseline periodInformation about changes in the future mean climate conditions is always provided in relation to a baseline period. The statements made in this report regarding possible future changes are made with reference to the period 1971–2000. Statements always describe the mean conditions pertaining over a period of 30 years.
Indicator daysAn indicator day is a day on which a defined threshold of a climatological parameter is reached, not reached or exceeded (e.g. a summer day is defined as a day with a maximum temperature of ≥ 25 °C) or a certain weather phenomenon occurs (e.g. a thunderstorm day is a day on which a thunderstorm occurs).
Climate projectionA climate projection is the description of a possible and plausible future state of the climate system and the chronological development leading up to it. Climate projections are usually produced using a scenario-based climate model.
Climate forecastClimate forecasts make statements about the future state of the climate system based on its past and present state. Traditionally, weather forecasts look at the ways in which the weather will develop over the next one to ten days. Climate forecast research is currently being undertaken on the assessment of developments over much larger timescales extending from several months to a decade.
PercentilePercentiles and quantiles are percentage values. They group the number of studied model results into measurement classes which can include a certain percentage of the results. The range between the 15th and 85th percentile, for example, covers 70 % of model results. The value which a percentile takes, e.g. 85th percentile = 9.4 °C, means that 85 % of the results are lower than this value and only 15 % are higher.
Planning horizon This report distinguishes between a short-term and long-term planning horizon. The short-term planning horizon describes the time window for the years 2021 to 2050, the long-term horizon the time window for the years 2071 to 2100. Statements relating to these periods are always made in relation to the 1971–2000 baseline period.
Reference periodInformation about changes in observed mean climate conditions is always provided in relation to a benchmark. In this climate report, information about the past is provided in relation to the reference period 1961–1990 which corresponds with the WMO’s internationally agreed standard reference period for long-term climate observation. Statements always describe the mean conditions pertaining over a period of 30 years.
SpreadFuture climate developments are analysed by means of a group of climate projections (ensemble). The spread describes the range between model outputs which produce the greatest and smallest changes.
ScenariosA scenario draws on assumptions to describe a possible future. One option is to build a plausible chain of assumptions concerning political, economic and ecological conditions in the future and to derive changes in greenhouse gas emissions on this basis.
A climate lexicon
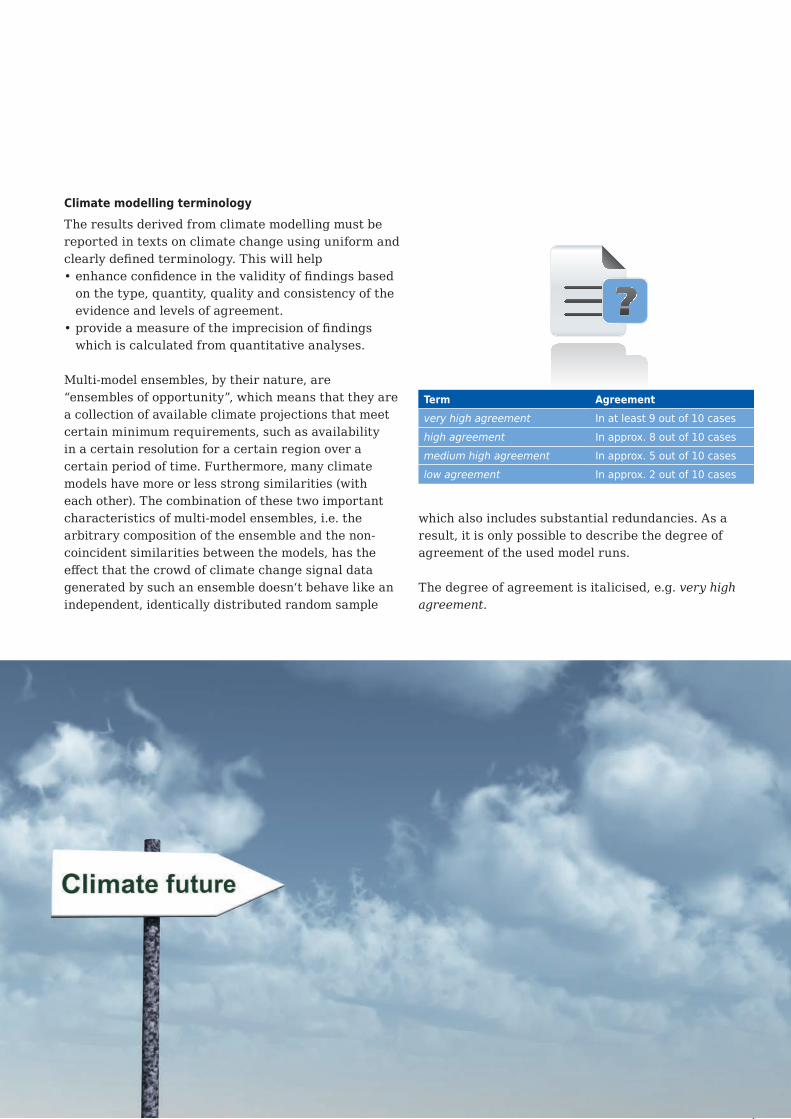
41
which also includes substantial redundancies. As a result, it is only possible to describe the degree of agreement of the used model runs.
The degree of agreement is italicised, e.g. very high agreement.
Climate modelling terminologyThe results derived from climate modelling must be reported in texts on climate change using uniform and clearly defined terminology. This will help• enhance confidence in the validity of findings based
on the type, quantity, quality and consistency of the evidence and levels of agreement.
• provide a measure of the imprecision of findings which is calculated from quantitative analyses.
Multi-model ensembles, by their nature, are “ensembles of opportunity”, which means that they are a collection of available climate projections that meet certain minimum requirements, such as availability in a certain resolution for a certain region over a certain period of time. Furthermore, many climate models have more or less strong similarities (with each other). The combination of these two important characteristics of multi-model ensembles, i.e. the arbitrary composition of the ensemble and the non-coincident similarities between the models, has the effect that the crowd of climate change signal data generated by such an ensemble doesn‘t behave like an independent, identically distributed random sample
Term Agreementvery high agreement In at least 9 out of 10 caseshigh agreement In approx. 8 out of 10 casesmedium high agreement In approx. 5 out of 10 caseslow agreement In approx. 2 out of 10 cases
42
The National Climate Report has been written at the instigation and in close co-operation with the Federation-Länder expert discussion group “Interpretation of regional climate model data”.
AuthorsFalk Böttcher, Dr Thomas Deutschländer, Andreas Friedrich, Karsten Friedrich, Dr Kristina Fröhlich, Dr Barbara Früh, Dr Anette Ganske*, Dr Hartmut Heinrich*, Dr Frank Kreienkamp, Dr Gabriele Malitz, Jens Möller*, Dr Monika Rauthe, Wolfgang Riecke, Thomas Schmidt, Dr Birger Tinz, Dr Andreas Walter* Federal Maritime and Hydrographic Agency
Editorial teamDr Frank Kreienkamp
Steering committee PD Dr Achim Daschkeit (Federal Environment Agency), Dr Kai-Achim Höpker (State Institute for the Environment, Measurements and Nature Conservation Baden-Württemberg), Carsten Linke (Brandenburg State Office for the Environment), Dr Frank Kreienkamp (Deutscher Wetterdienst)
Online editionThis publication is available in electronic form on our website at www.dwd.de/nationalclimatereport. The website also provides links to background material and similar Deutscher Wetterdienst products.
The online issue is subject to license: http://creativecommons.org/ licenses/by-nc-nd/4.0/deed.de
References in textDWD (2017): National Climate Report. 3. revised edition, Deutscher Wetterdienst, Offenbach am Main, Deutschland, 46 pages.
ISSN 2568-2261 (Online)
Layout and typesettingElke Roßkamp (Deutscher Wetterdienst)
AcknowledgementDWD: Cr (Reno Schafranek), 2, 7, 36/37 (Johann Siemens)Fire brigade Gerolstein: 34Creative Collection: Cc, 1t, 6c, 16, 18, 24l, 27cl, 27cr, 27r, 31Panthermedia.net: Cl (Dominik Zwingmann), Cc (Robert Biedermann), 1c (Hans Eder), 4 (Dario Sabljak), 6l (Clemens Humeniuk), 6r (Wolfgang Filser), 10b (Orlando Rosu), 11 (Hendrik Fuchs), 15r (Daniel Loretto), 21 (pekada), 23 (bestshot70), 24cl (Oliver C. Bellido), 24cr (Gabi Faltenbacher), 24r, (Tyler Olson), 27l (Ingram Vitantonio Cicorella), 29t (Roland Schmock), 29b (Ines Weiland-Weiser), 32 (Bernd Leitner), 35 (Ingo Gronostay), 38 (James Steidl), 40 (Rilo Naumann), 41 (drizzd)MEV-Verlag: 1b, 15lFotolia.com: 5 (Gina Sanders), 8 (AndreasG), 10t (Paul Paladin), 17 (gradt), 27t (Mykola Velychko)
(l: left; c: centre; t: top; r: right, b: bottom; C: Cover)
Publishing details


DW
D 3
rd r
evis
ed e
ditio
n 10
.17Deutscher Wetterdienst
Climate and Environment ConsultancyCentral Climate Offi ceFrankfurter Straße 13563067 Off enbachTel: +49 (0) 69 / 8062 - 2912Fax: +49 (0) 69 / 8062 - 2993Email: klima.off [email protected]
Through our website at www.dwd.de you have also access to our pages on: