national bank, 1155 metcalfe, montréal economic and ... · credit suisse 2011 global wealth...
TRANSCRIPT

National Bank, 1155 Metcalfe, Montréal
Economic and Financial Outlook Presentation for the Régie des rentes du Québec Hotel Plaza Québec November 29, 2012 Stéfane Marion Chief Economist and Strategist

World
-35
-30
-25
-20
-15
-10
-5
0
5
10
15
20
25
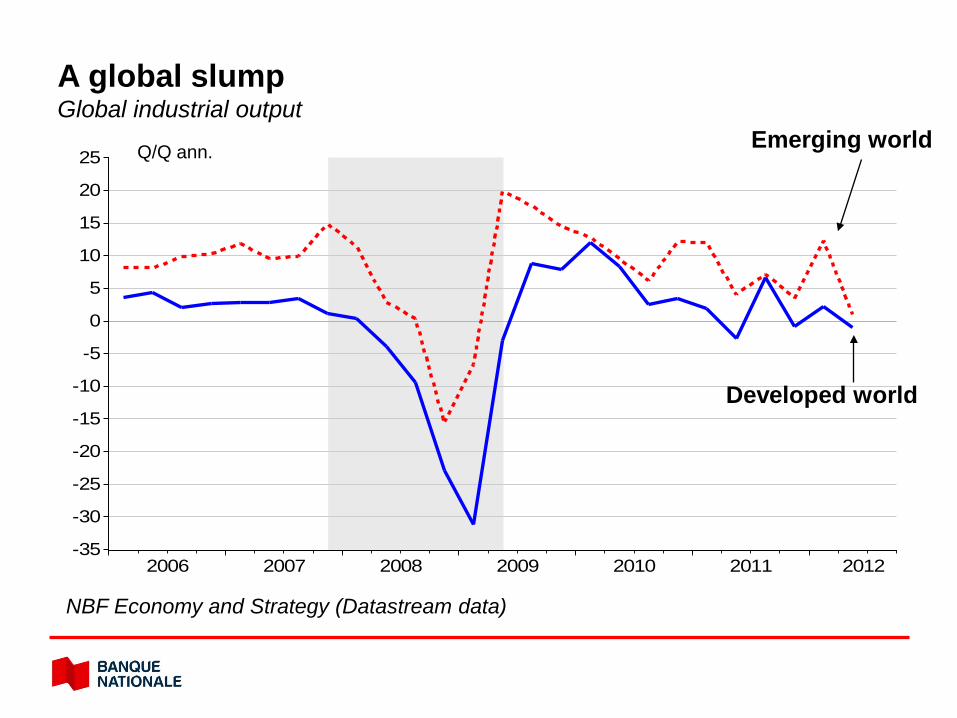
2006 2007 2008 2009 2010 2011 2012
Developed world
A global slump Global industrial output
NBF Economy and Strategy (Datastream data)
Q/Q ann. Emerging world
96979899
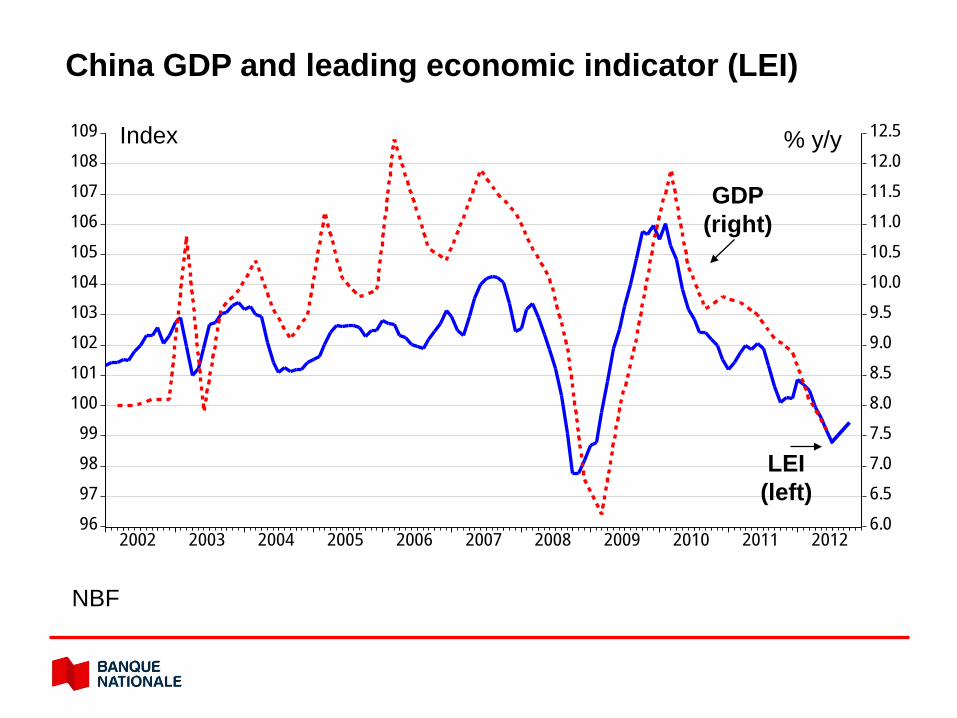
100101102103104105106107108109
6.06.57.07.58.08.59.09.510.010.511.011.512.012.5
2002 2003 2004 2005 2006 2007 2008 2009 2010 2011 2012
LEI (left)
GDP (right)
Index % y/y
NBF
China GDP and leading economic indicator (LEI)
82
84
86
88
90
92
94
96
98
100
102
104
106
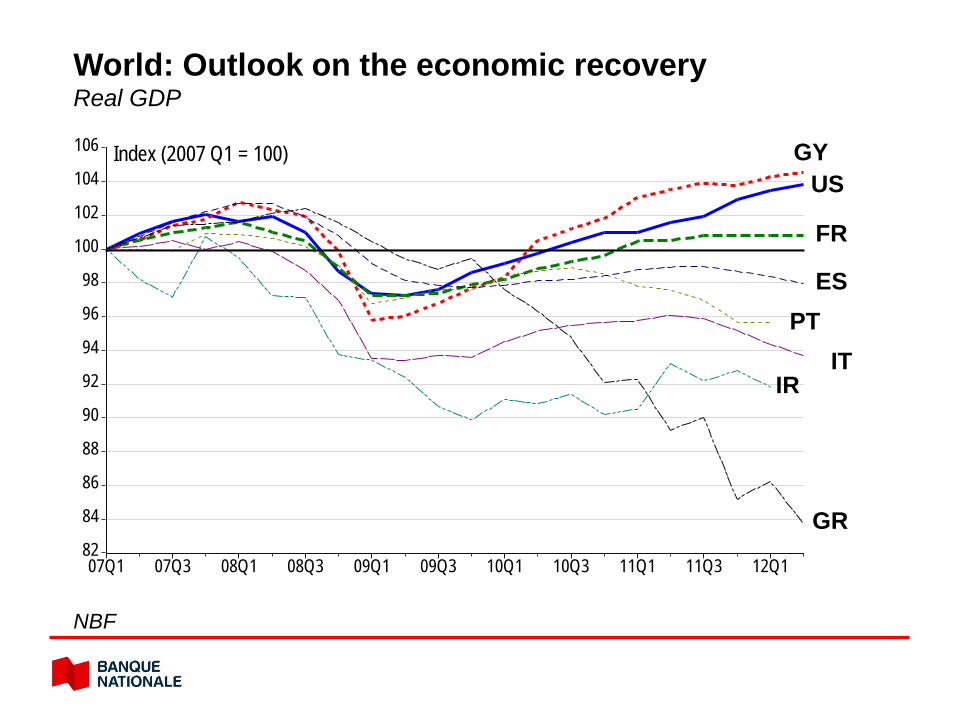
07Q1 07Q3 08Q1 08Q3 09Q1 09Q3 10Q1 10Q3 11Q1 11Q3 12Q1
GY US
FR
ES PT
IT
GR
IR
World: Outlook on the economic recovery Real GDP
NBF
Index (2007 Q1 = 100)
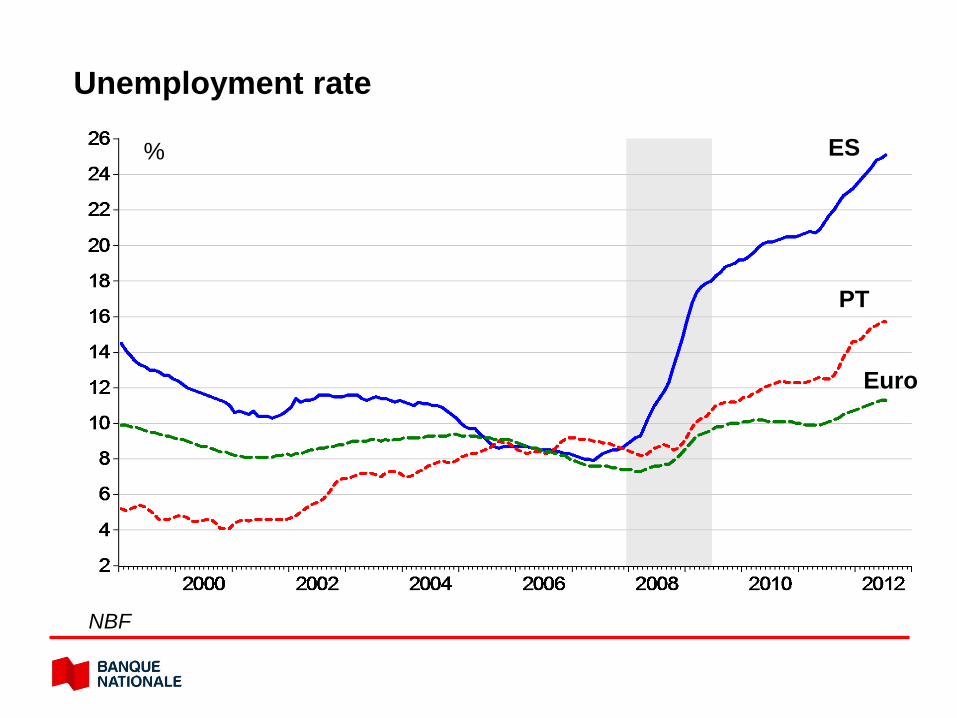
Unemployment rate
NBF
% ES
PT
Euro

.00
.05
.10
.15
.20
.25
.30
.35
.40
.45
.50
.55
.60
.65
.70
2003 2004 2005 2006 2007 2008 2009 2010 2011 2012
Vulnerability to deflation Vulnerability index
NBF Economy and Strategy (data via WMF, WEO Oct 2012, fig. 1.12)
Index
Low
Moderate
High Greece
Spain
World
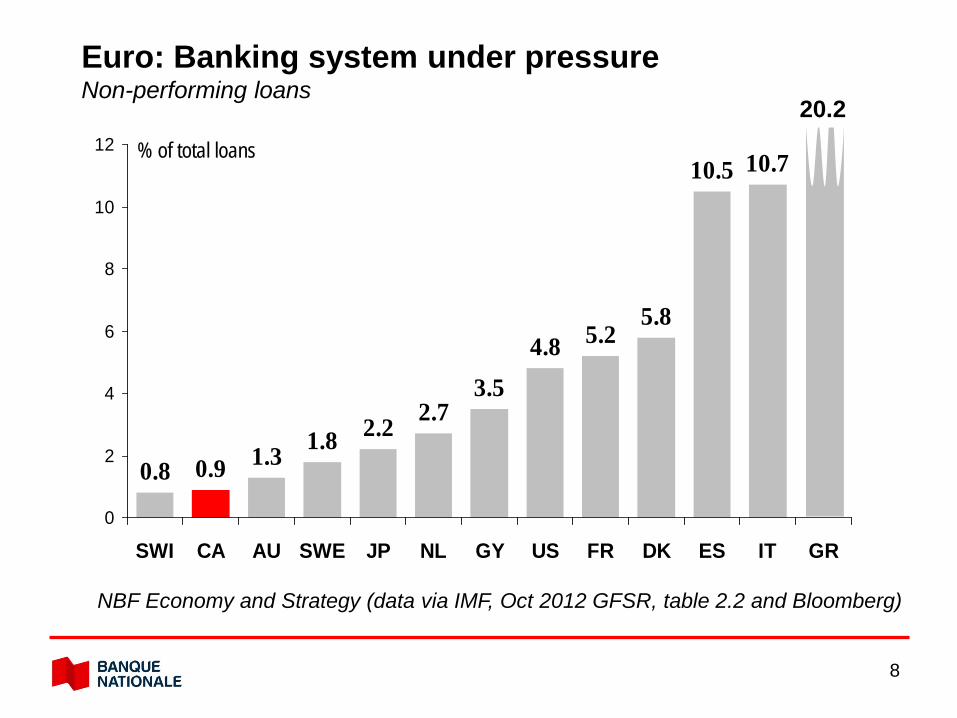
8
0.8 0.9 1.3 1.8 2.2 2.73.5
4.8 5.25.8
10.5 10.7
0
2
4
6
8
10
12
SWI CA AU SWE JP NL GY US FR DK ES IT GR
% of total loans
NBF Economy and Strategy (data via IMF, Oct 2012 GFSR, table 2.2 and Bloomberg)
Euro: Banking system under pressure Non-performing loans
20.2

1,200
1,250
1,300
1,350
1,400
1,450
1,500
1,550
1,600
1,650
1,700
1,750
150
160
170
180
190
200
210
220
230
240
250
260
2007 2008 2009 2010 2011 2012
Bank deposits are disappearing
Billions of euros
GY (right)
ES (left)
PT (right)
ECB
Billions of euros
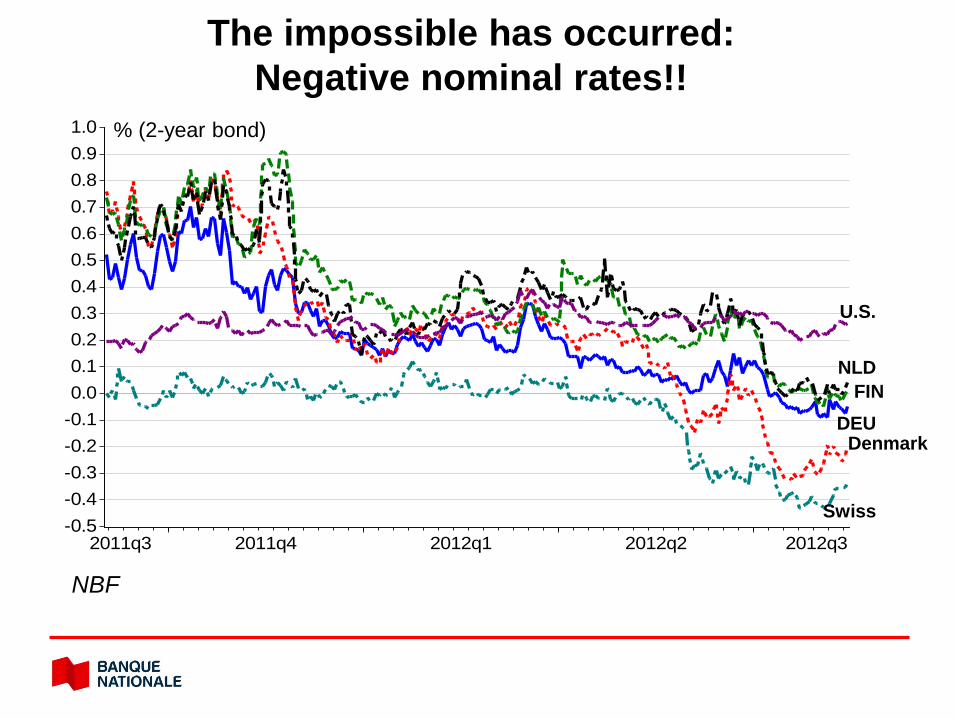
-0.5-0.4-0.3-0.2-0.10.00.10.20.30.40.50.60.70.80.91.0
2011q3 2011q4 2012q1 2012q2 2012q3
DEU
U.S.
Swiss
Denmark
NLD FIN
The impossible has occurred: Negative nominal rates!!
% (2-year bond)
NBF
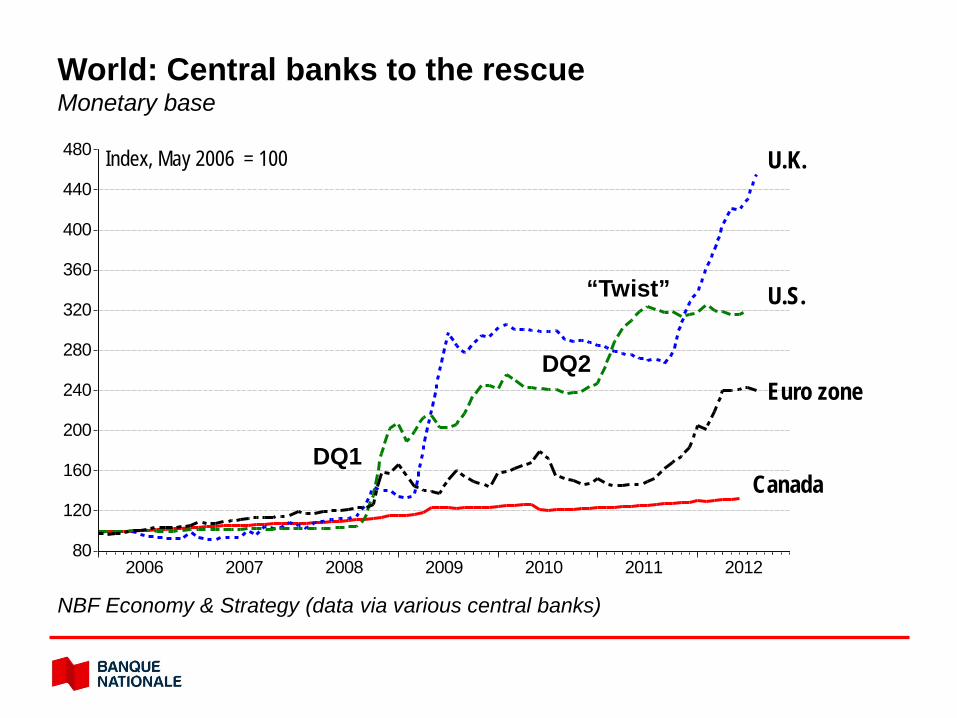
80
120
160
200
240
280
320
360
400
440
480
2006 2007 2008 2009 2010 2011 2012
U.K.
Canada
Index, May 2006 = 100
World: Central banks to the rescue Monetary base
NBF Economy & Strategy (data via various central banks)
U.S.
Euro zone
DQ1
DQ2
“Twist”

12
1.16
1.20
1.24
1.28
1.32
1.36
1.40
1.44
1.48
1.52
1.56
1.60
1.64
2007 2008 2009 2010 2011 2012
Euro/USD
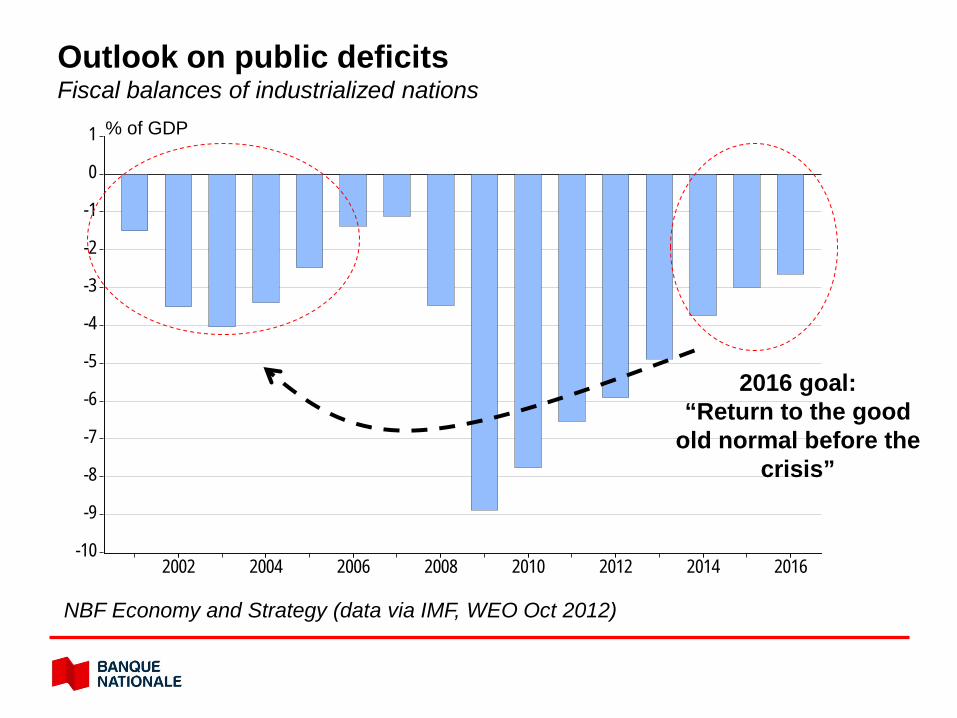
-10
-9
-8
-7
-6
-5
-4
-3
-2
-1
0
1
2002 2004 2006 2008 2010 2012 2014 2016
Outlook on public deficits Fiscal balances of industrialized nations
NBF Economy and Strategy (data via IMF, WEO Oct 2012)
% of GDP
2016 goal: “Return to the good
old normal before the crisis”
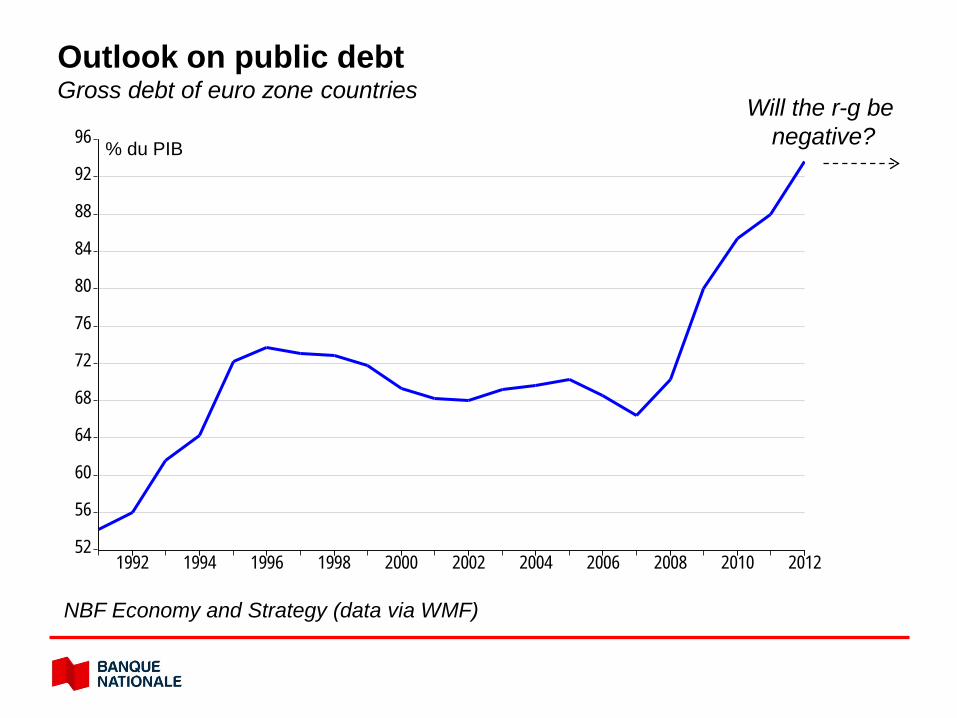
52
56
60
64
68
72
76
80
84
88
92
96
1992 1994 1996 1998 2000 2002 2004 2006 2008 2010 2012
Outlook on public debt Gross debt of euro zone countries
NBF Economy and Strategy (data via WMF)
% du PIB
Will the r-g be negative?
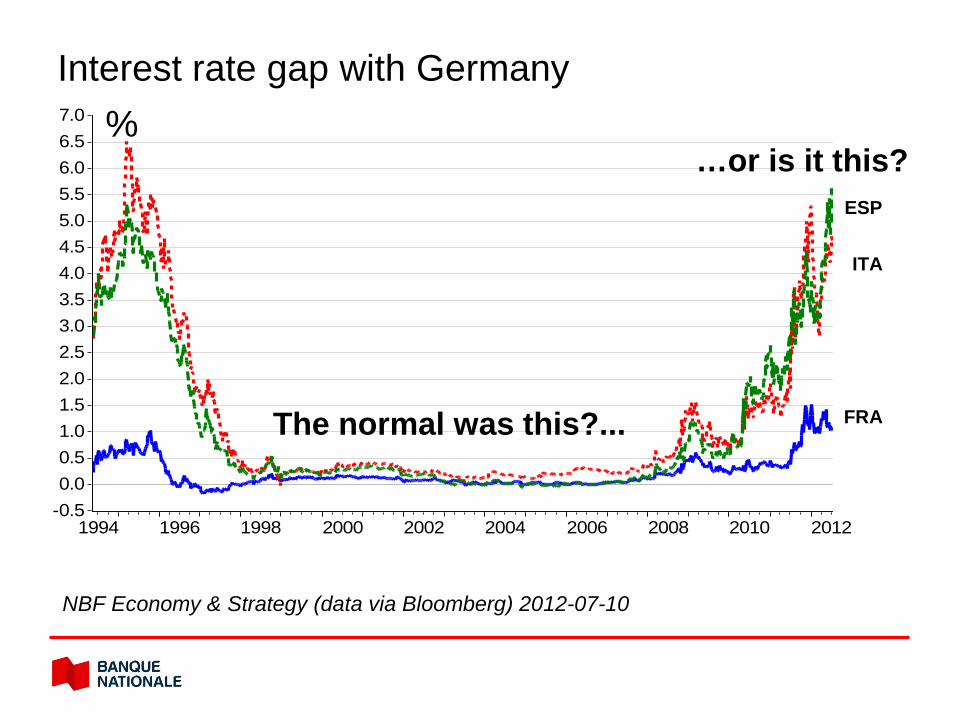
Europe: 10-year spreads to Germany
NBF Economy & Strategy (data via Bloomberg) 2012-07-10
FRA
ESP
ITA
-0.50.00.51.01.52.02.53.03.54.04.55.05.56.06.57.0
1994 1996 1998 2000 2002 2004 2006 2008 2010 2012
The normal was this?...
…or is it this?
Interest rate gap with Germany %
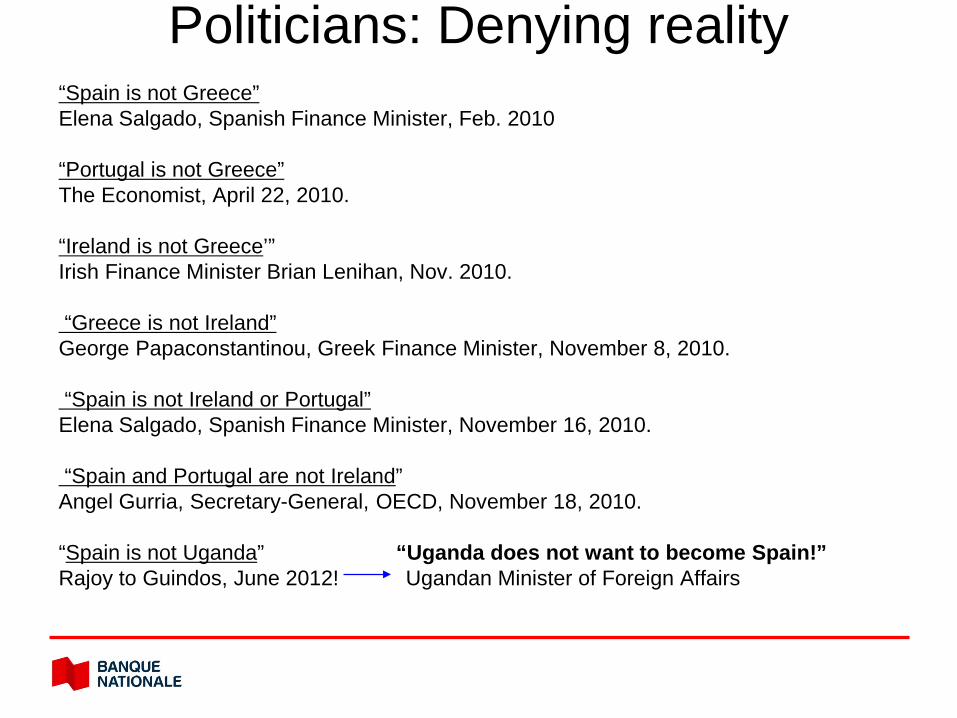
Politicians: Denying reality “Spain is not Greece” Elena Salgado, Spanish Finance Minister, Feb. 2010 “Portugal is not Greece” The Economist, April 22, 2010. “Ireland is not Greece’” Irish Finance Minister Brian Lenihan, Nov. 2010. “Greece is not Ireland” George Papaconstantinou, Greek Finance Minister, November 8, 2010. “Spain is not Ireland or Portugal” Elena Salgado, Spanish Finance Minister, November 16, 2010. “Spain and Portugal are not Ireland” Angel Gurria, Secretary-General, OECD, November 18, 2010. “Spain is not Uganda” “Uganda does not want to become Spain!” Rajoy to Guindos, June 2012! Ugandan Minister of Foreign Affairs
17
Is debt mutualization possible in the euro zone?
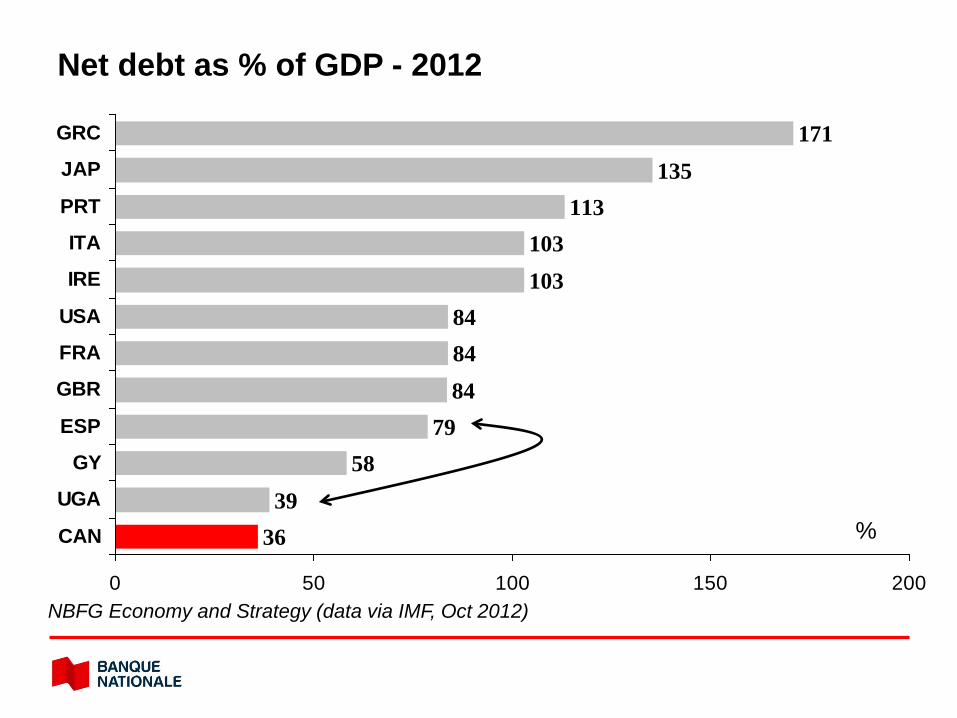
3639
5879
848484
103103
113135
171
0 50 100 150 200
CAN
UGA
GY
ESP
GBR
FRA
USA
IRE
ITA
PRT
JAP
GRC
Net debt as % of GDP - 2012
NBFG Economy and Strategy (data via IMF, Oct 2012)
%
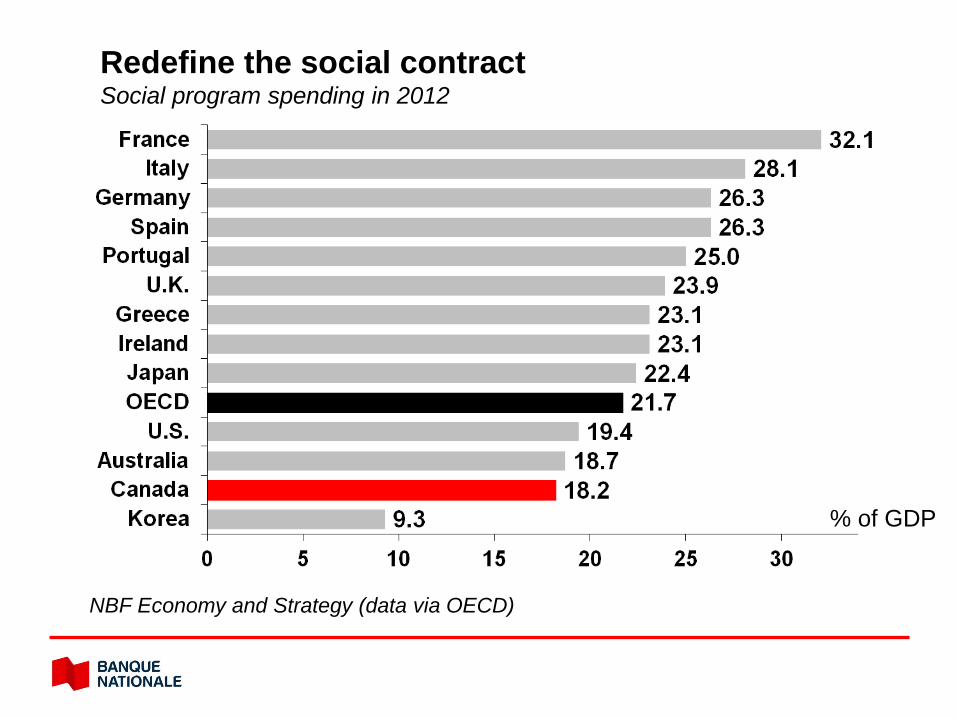
Redefine the social contract Social program spending in 2012
% of GDP
NBF Economy and Strategy (data via OECD)

1.5
2.0
2.5
3.0
3.5
4.0
4.5
5.0
5.5
6.0
6.5
7.0
7.5
1950 1960 1970 1980 1990 2000 2010 2020 2030 2040 2050
Individuals of working age per person aged 65 +
* Average for Germany, France, Italy NBF Economy and Strategy (OECD)
OECD
Euro zone*
Ratio
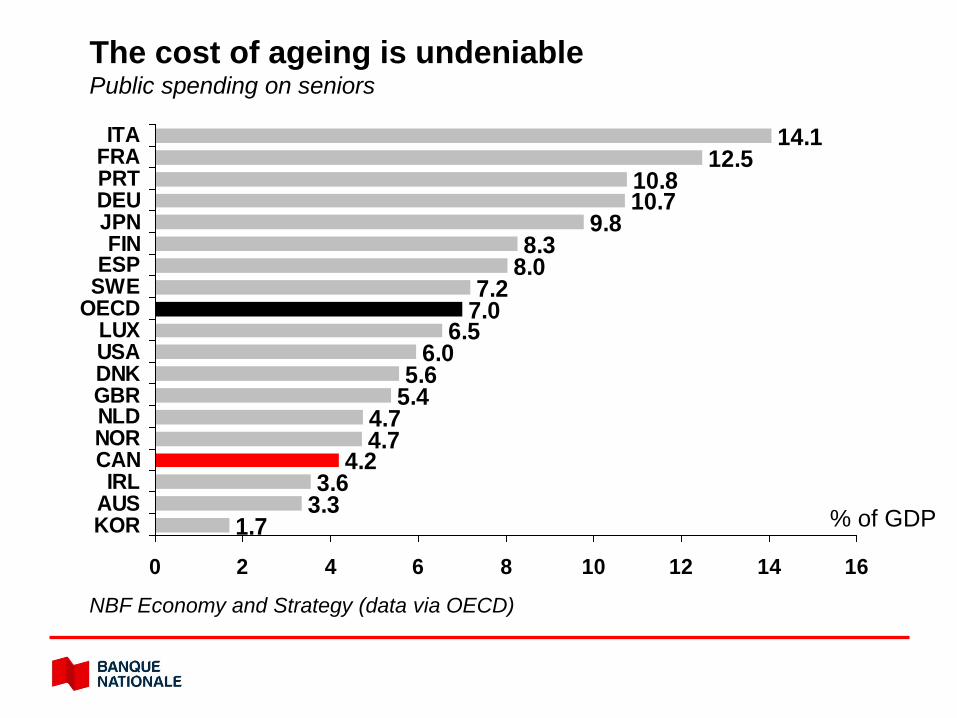
1.73.33.6
4.24.74.7
5.45.6
6.06.5
7.07.2
8.08.3
9.810.710.8
12.514.1
0 2 4 6 8 10 12 14 16
KORAUSIRL
CANNORNLDGBRDNKUSALUX
OECDSWEESPFIN
JPNDEUPRTFRAITA
The cost of ageing is undeniable Public spending on seniors
% of GDP
NBF Economy and Strategy (data via OECD)
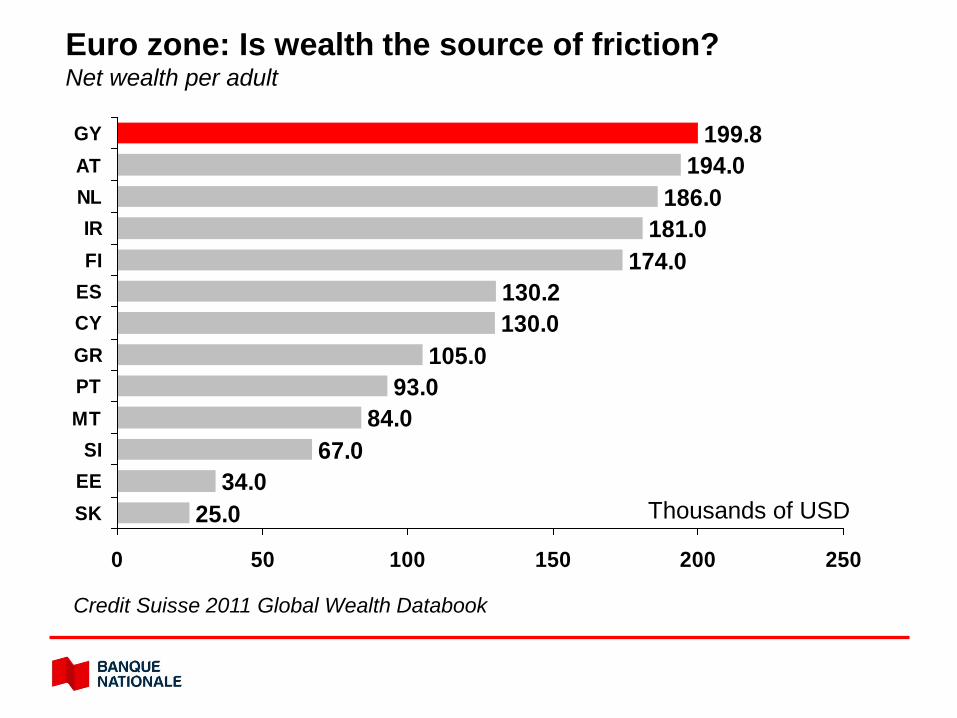
25.034.0
67.084.0
93.0105.0
130.0130.2
174.0181.0
186.0194.0
199.8
0 50 100 150 200 250
SKEESI
MTPTGRCYESFIIR
NLATGY
Euro zone: Is wealth the source of friction? Net wealth per adult
Thousands of USD
Credit Suisse 2011 Global Wealth Databook

3 4 5 6
Greece (133)Italy (127)
Portugal (123)Spain (108)
India (82)Thailand (76)
Korea (73)France (66)
Germany (53)Australia (42)
China (41)Austria (32)
Sweden (25)Malaysia (24)
Uganda (23)Japan (20)
Kazakhstan (19)Norway (18)
U.S. (6)UK (5)
Canada (4)HK (3)
Singapore (2)Switzerland (1)
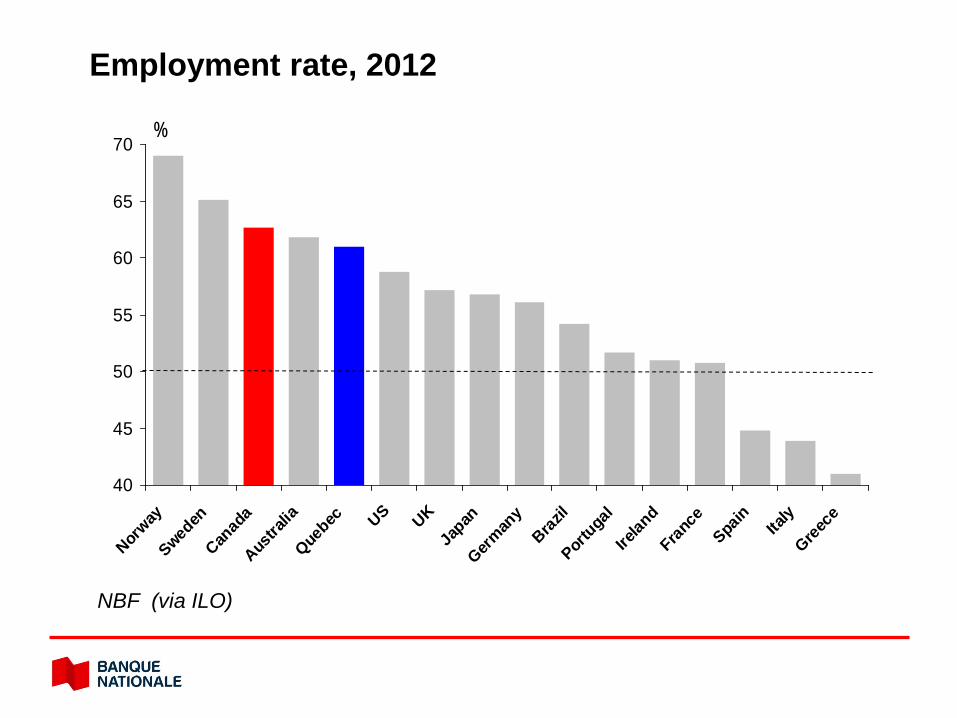
World Competitiveness Report 2011-2012
Labour market efficiency Of 144 countries
40
45
50
55
60
65
70
Norway
Sweden
Canad
a
Austra
lia
Quebec US UK
Japan
German
yBraz
il
Portuga
l
Irelan
d
France
Spain
Italy
Greece
%
NBF (via ILO)
Employment rate, 2012

25.034.0
67.084.0
93.0105.0
130.0130.2
174.0181.0186.0
194.0199.8
259.0275.0
294.0313.0
0 50 100 150 200 250 300 350
SKEESIM
PTGRCYESFIIR
NLATGYIT
BEFRLX
Credit Suisse 2011 Global Wealth Databook
Euro zone: Is wealth the source of friction? Net wealth per adult
Thousands of USD
+30% ! +50% !
0
1
2
3
4
5
6
7
8
9SU
I
USA
LUX
AUT
NLD
FRA
DEU
CAN
SVK
IRE
FIN
BEL
QUE PR
T
EST
ESP
SVN
GRC CY
P
ITA
MLT
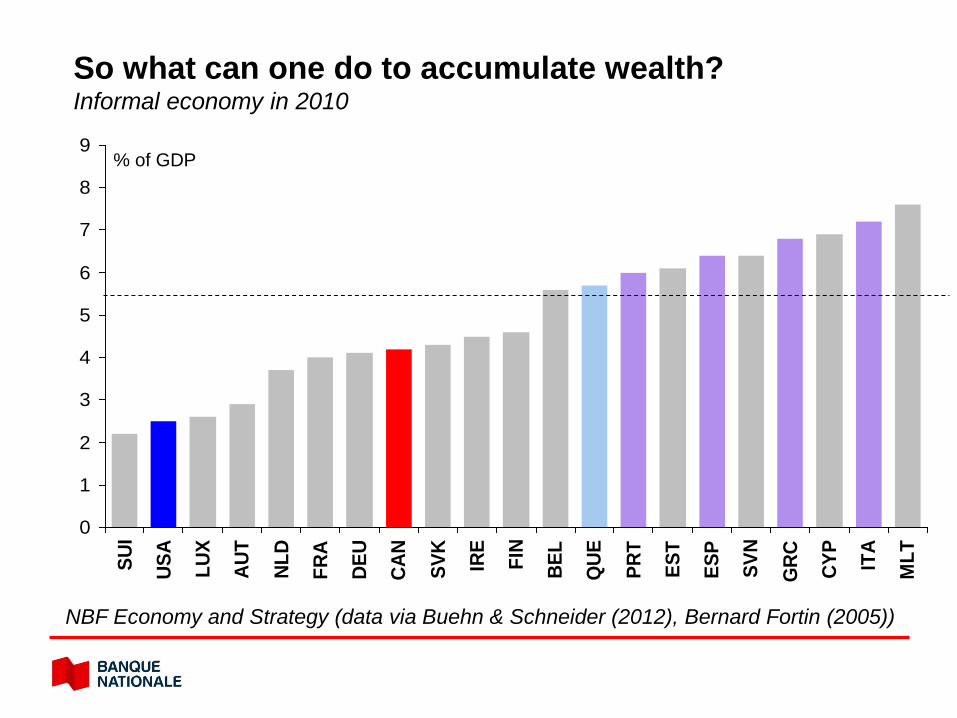
So what can one do to accumulate wealth? Informal economy in 2010
NBF Economy and Strategy (data via Buehn & Schneider (2012), Bernard Fortin (2005))
% of GDP
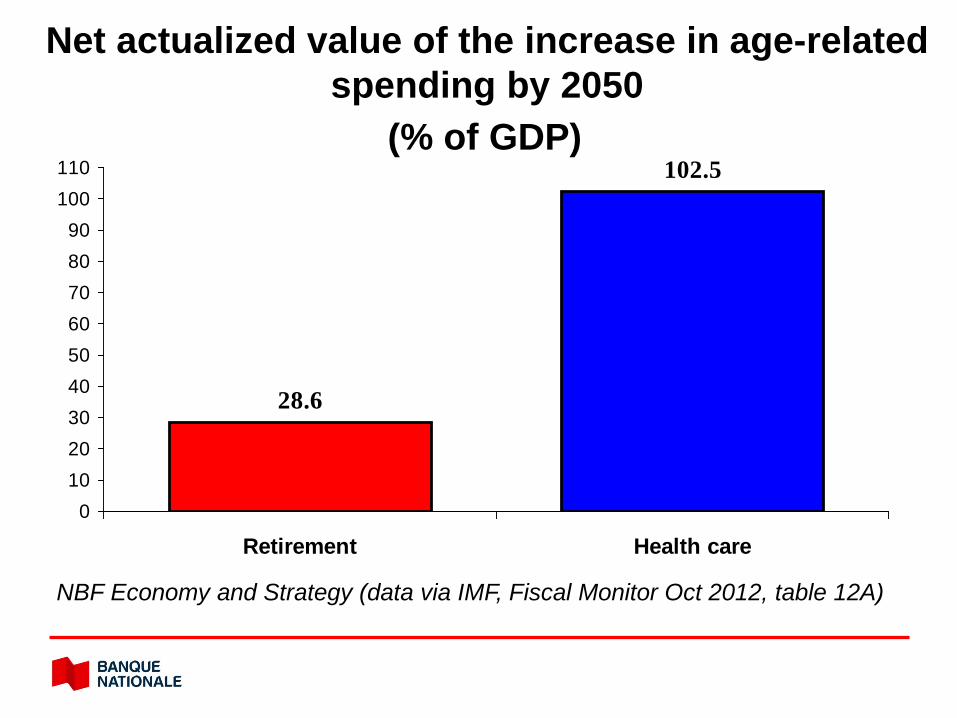
28.6
102.5
0102030405060708090
100110
Retirement Health care
Net actualized value of the increase in age-related spending by 2050
(% of GDP)
NBF Economy and Strategy (data via IMF, Fiscal Monitor Oct 2012, table 12A)
28
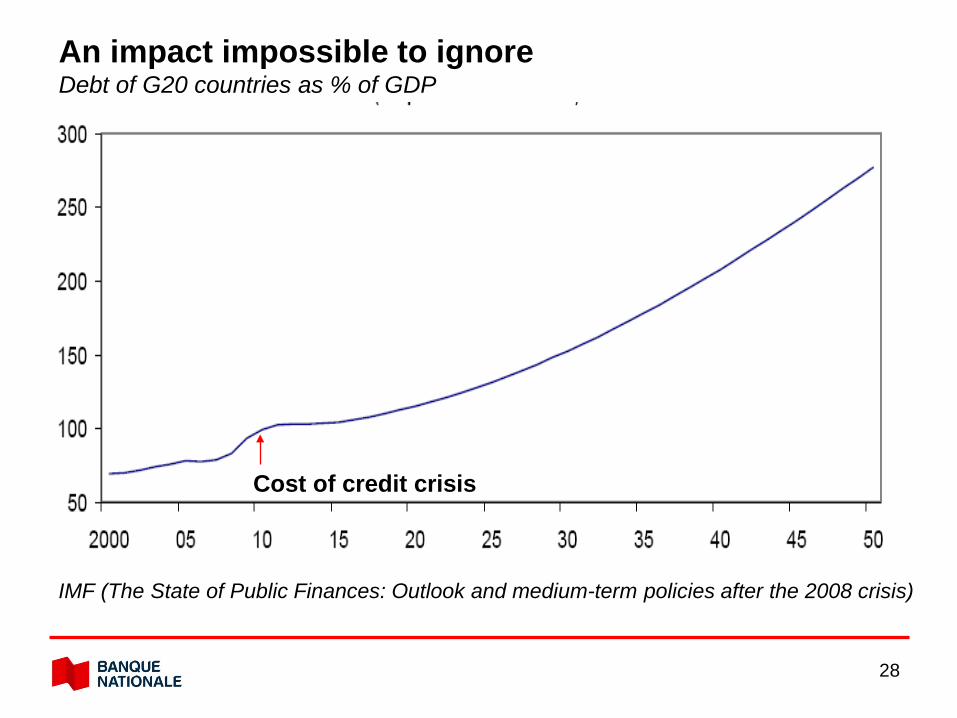
An impact impossible to ignore Debt of G20 countries as % of GDP
IMF (The State of Public Finances: Outlook and medium-term policies after the 2008 crisis)
Cost of credit crisis

United States

104
108
112
116
120
124
128
132
136
140
144
148
2005 2006 2007 2008 2009 2010 2011 2012 2013
Leading economic indicator – United States
ECRI

-1.5-1.0-0.50.00.51.01.52.02.53.03.54.04.55.05.56.0
1994 1996 1998 2000 2002 2004 2006 2008 2010 2012
U.S.: Financial stress index
32
15.2
15.6
16.0
16.4
16.8
17.2
17.6
18.0
18.4
18.8
19.2
80 82 84 86 88 90 92 94 96 98 00 02 04 06 08 10 12
32
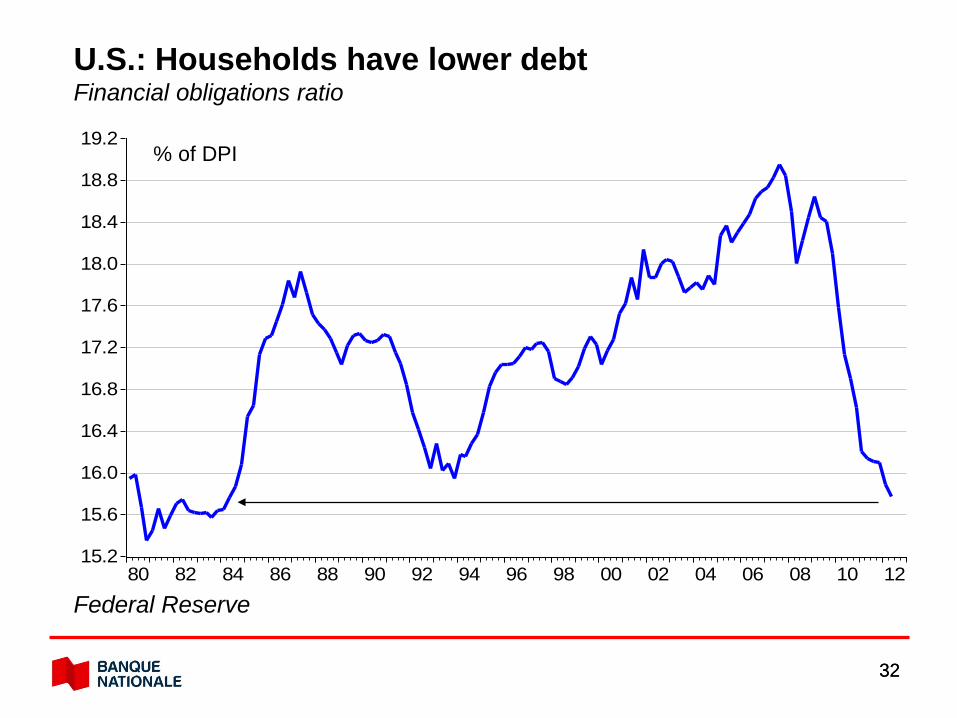
U.S.: Households have lower debt Financial obligations ratio
% of DPI
Federal Reserve
136
137
138
139
140
141
142
143
144
145
146
147
148
149
4.0
4.5
5.0
5.5
6.0
6.5
7.0
7.5
8.0
8.5
9.0
9.5
10.0
10.5
2006 2007 2008 2009 2010 2011 2012
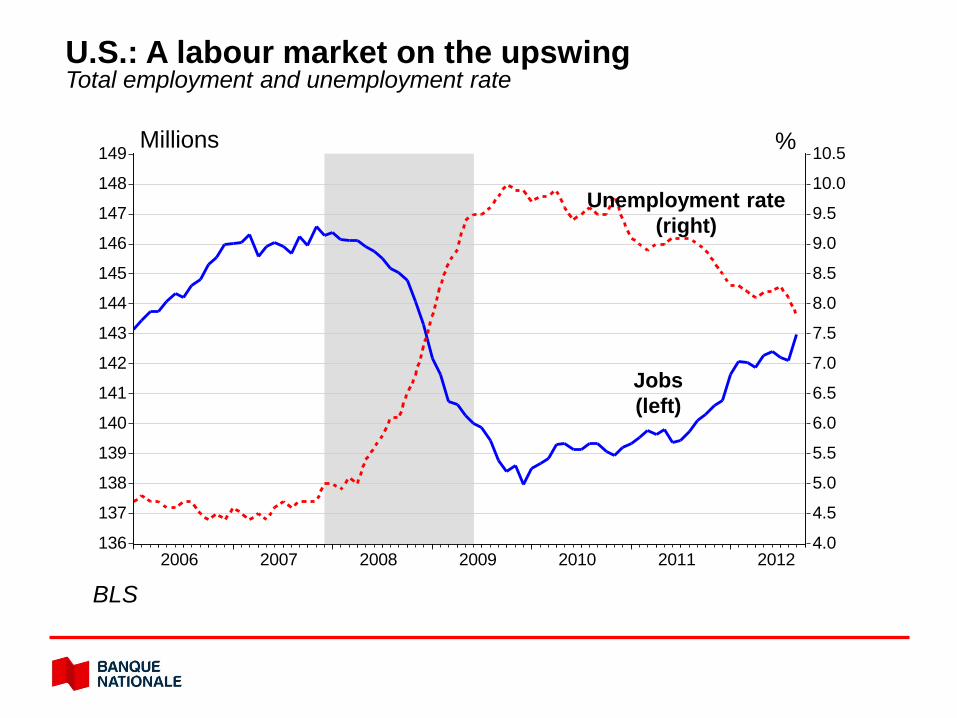
U.S.: A labour market on the upswing Total employment and unemployment rate
Millions %
BLS
Jobs (left)
Unemployment rate (right)
6.06.57.07.58.08.59.09.5
10.010.511.011.512.012.513.013.5
50 55 60 65 70 75 80 85 90 95 00 05 10
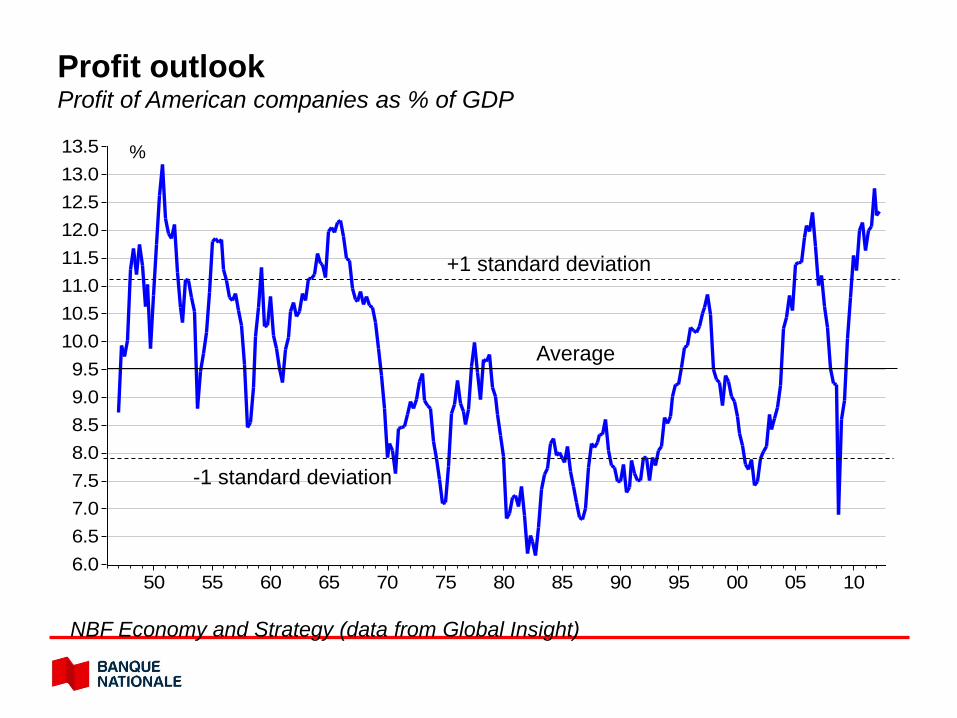
Profit outlook Profit of American companies as % of GDP
NBF Economy and Strategy (data from Global Insight)
%
+1 standard deviation
-1 standard deviation
Average

0123456789
1011121314
1965 1970 1975 1980 1985 1990 1995 2000 2005 2010
Earnings outlook Hourly earnings of private sector employees (production and no supervisory tasks)
NBF Economy and Strategy (data from Global Insight)
% Q/Q ann.
To the present in Q4
90
92
94
96
98
100
102
104
106
108
110
112
114
2007 2008 2009 2010 2011 2012
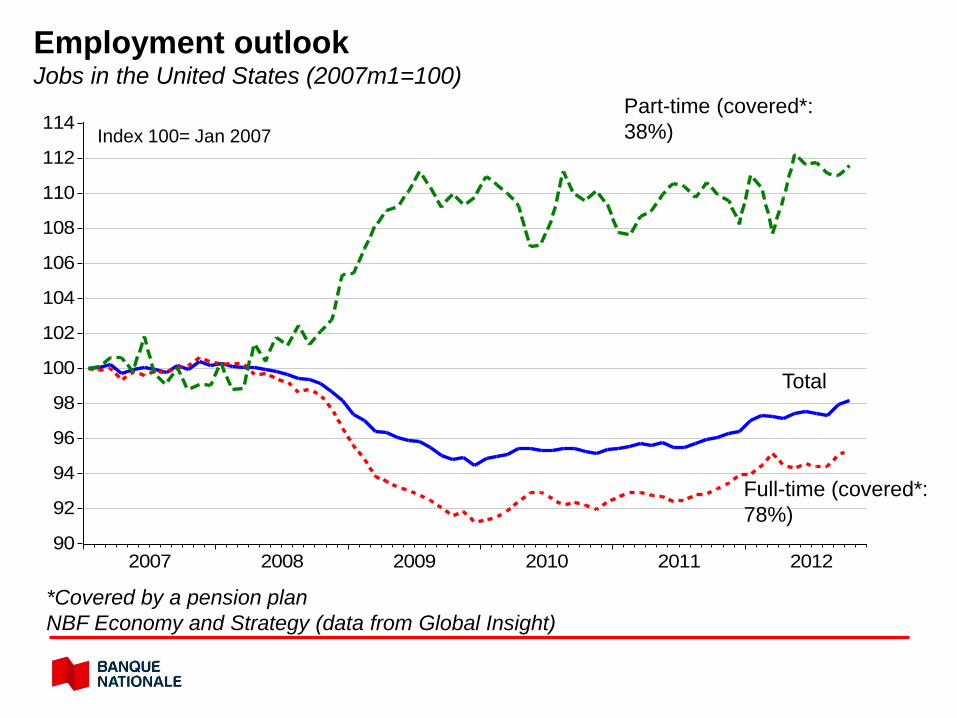
Employment outlook Jobs in the United States (2007m1=100)
*Covered by a pension plan NBF Economy and Strategy (data from Global Insight)
Index 100= Jan 2007 Part-time (covered*: 38%)
Full-time (covered*: 78%)
Total
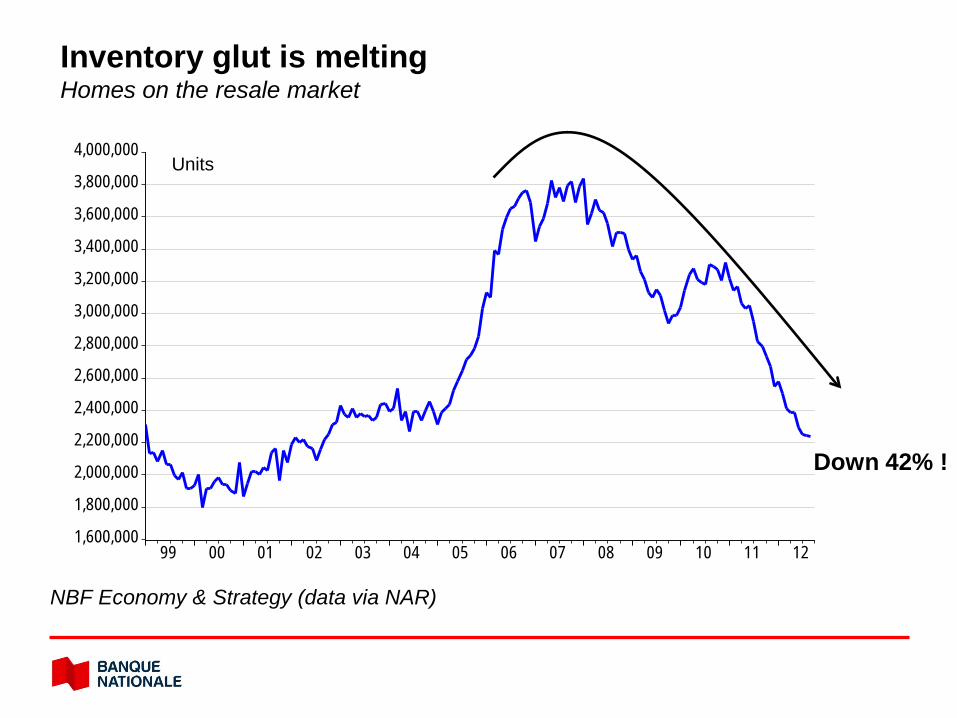
1,600,000
1,800,000
2,000,000
2,200,000
2,400,000
2,600,000
2,800,000
3,000,000
3,200,000
3,400,000
3,600,000
3,800,000
4,000,000
99 00 01 02 03 04 05 06 07 08 09 10 11 12
EHINVTNS_SAUnits
NBF Economy & Strategy (data via NAR)
Inventory glut is meltingHomes on the resale market
Down 42% !
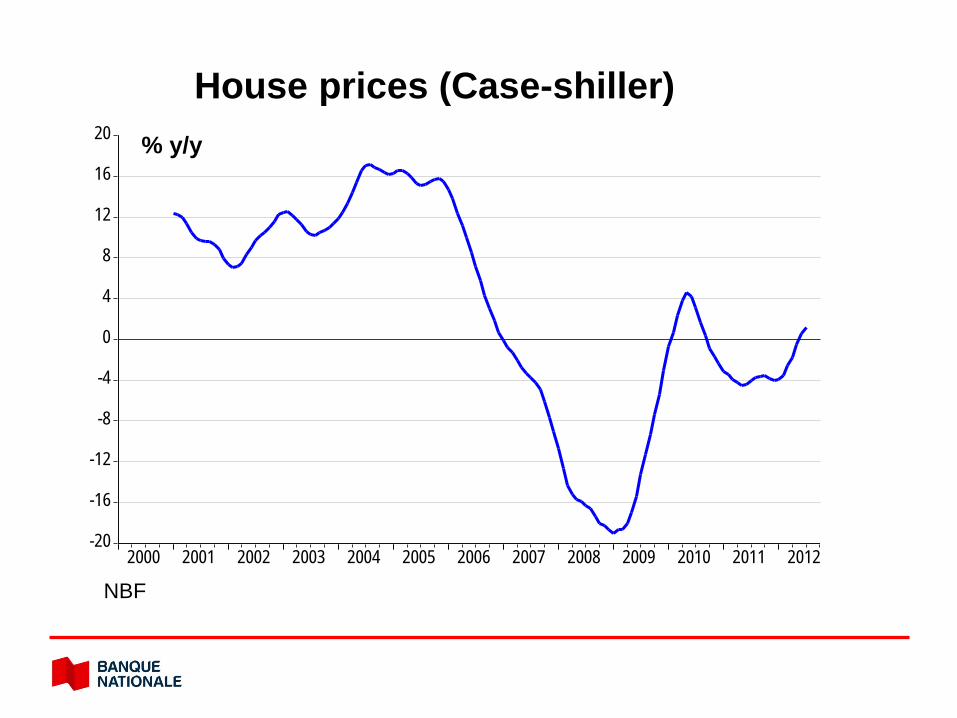
-20
-16
-12
-8
-4
0
4
8
12
16
20
2000 2001 2002 2003 2004 2005 2006 2007 2008 2009 2010 2011 2012
House prices (Case-shiller) % y/y
NBF
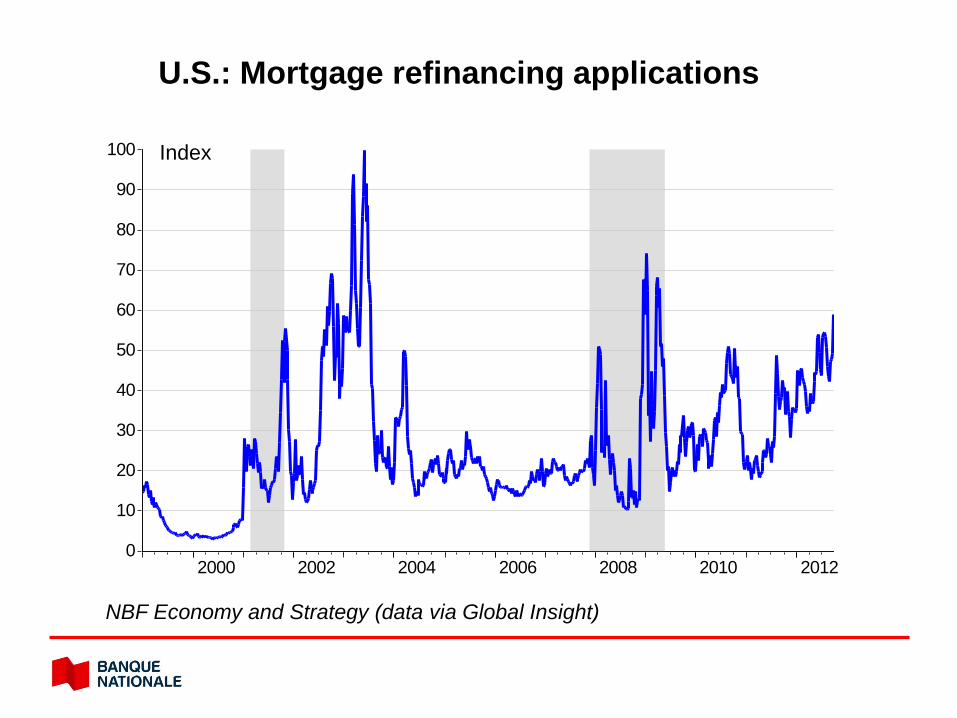
0
10
20
30
40
50
60
70
80
90
100
2000 2002 2004 2006 2008 2010 2012
U.S.: Mortgage refinancing applications
Index
NBF Economy and Strategy (data via Global Insight)
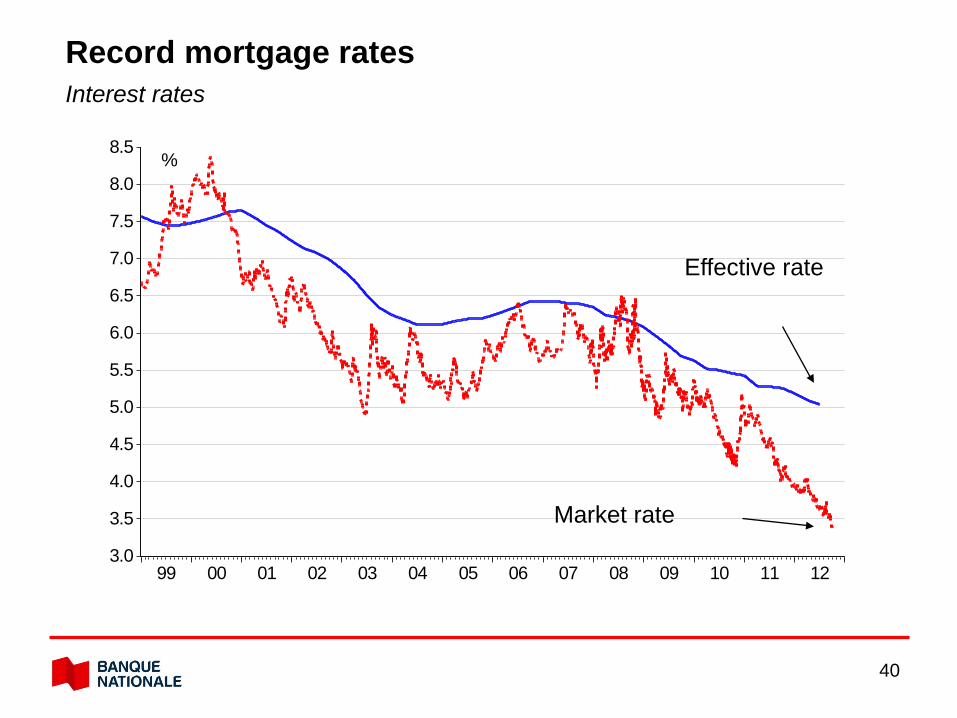
40
3.0
3.5
4.0
4.5
5.0
5.5
6.0
6.5
7.0
7.5
8.0
8.5
99 00 01 02 03 04 05 06 07 08 09 10 11 12
Market rate
Record mortgage rates Interest rates
%
Effective rate

123456789
10111213141516
1920 1930 1940 1950 1960 1970 1980 1990 2000 2010
%
NBF
U.S.: Historical outlook on bonds Rates on 10 year treasuries
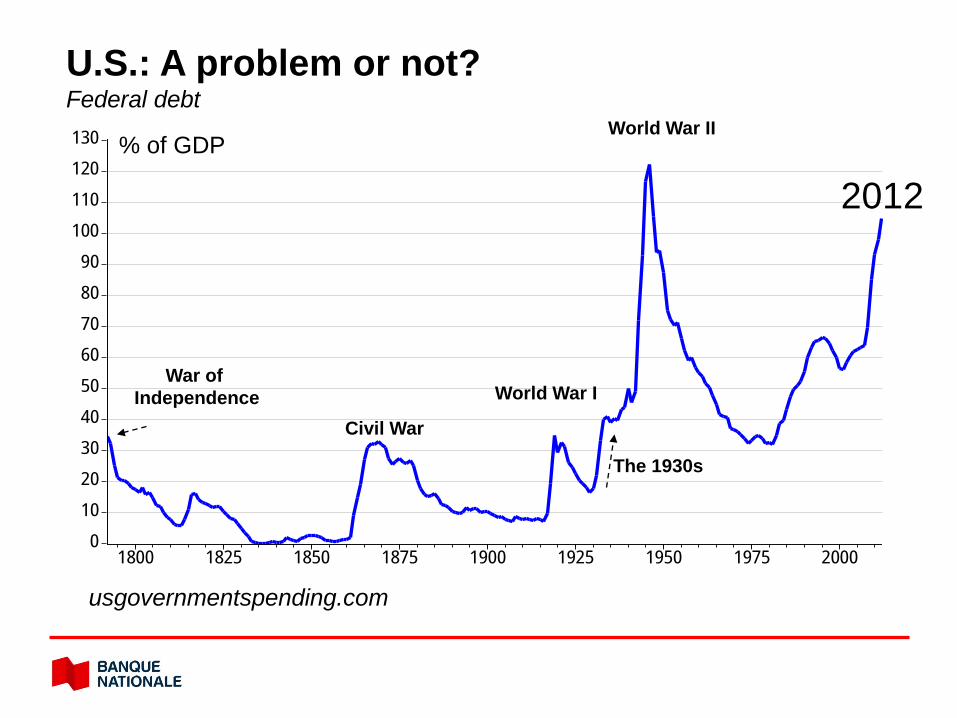
0102030405060708090
100110120130
1800 1825 1850 1875 1900 1925 1950 1975 2000
U.S.: A problem or not? Federal debt
% of GDP
The 1930s
World War I
World War II
Civil War
War of Independence
usgovernmentspending.com
2012

048
1216202428323640444852
1950 1955 1960 1965 1970 1975 1980 1985 1990 1995 2000 2005 2010
Foreigners
Fed
U.S.: Foreigners and the Fed still buying Share of federal debt held by the public
%
Federal Reserve

Canada
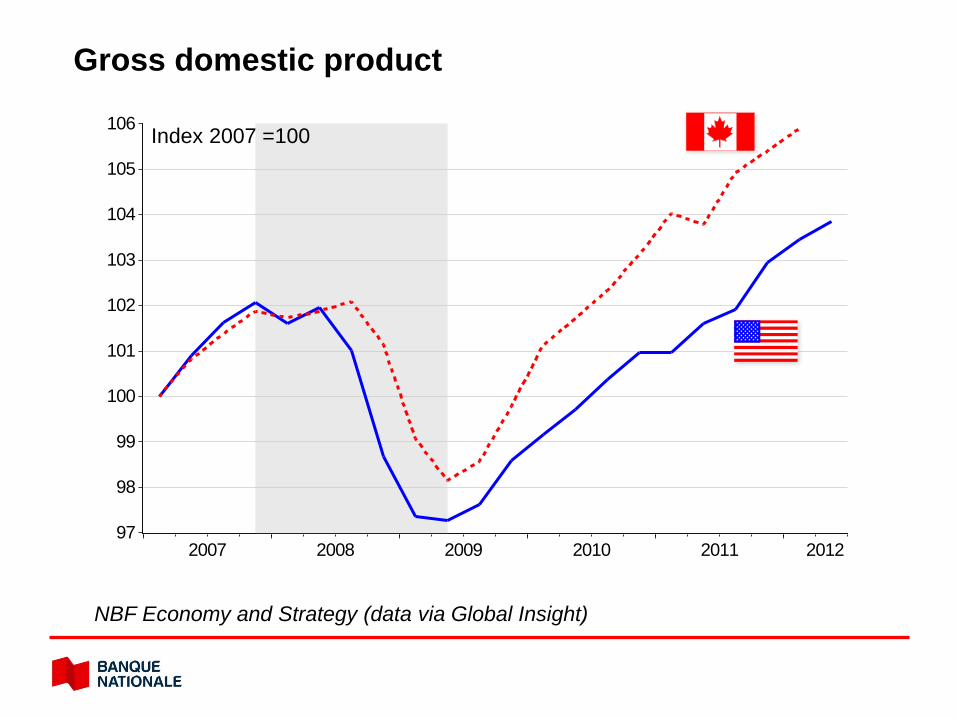
97
98
99
100
101
102
103
104
105
106
2007 2008 2009 2010 2011 2012
Index 2007 =100
Gross domestic product
NBF Economy and Strategy (data via Global Insight)
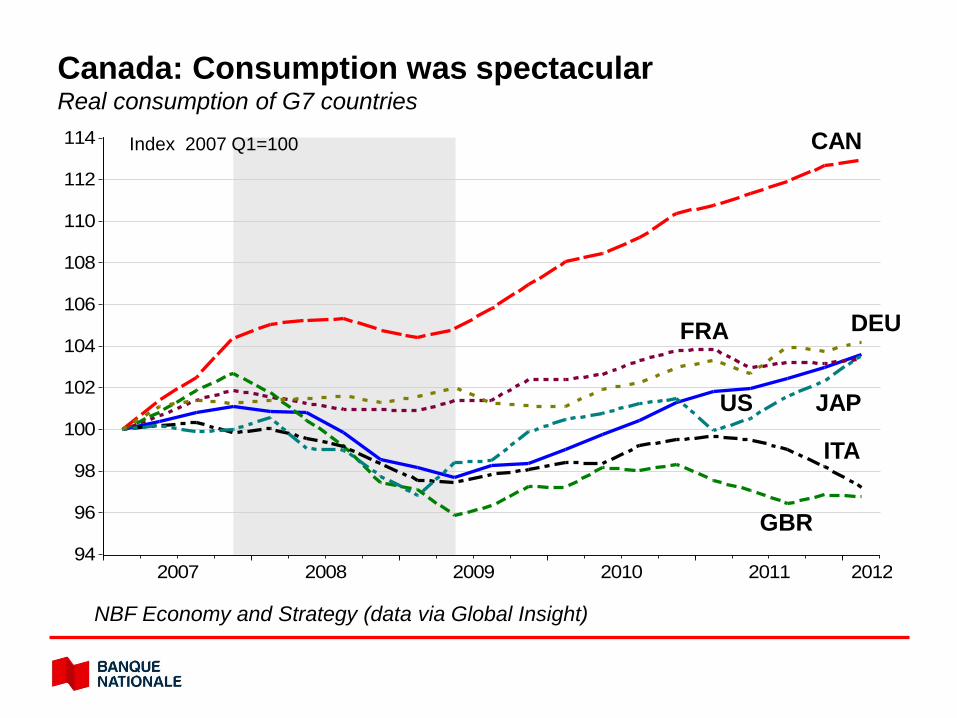
94
96
98
100
102
104
106
108
110
112
114
2007 2008 2009 2010 2011 2012
US
FRA
GBR
ITA
CAN
DEU
JAP
Canada: Consumption was spectacular Real consumption of G7 countries
Index 2007 Q1=100
NBF Economy and Strategy (data via Global Insight)
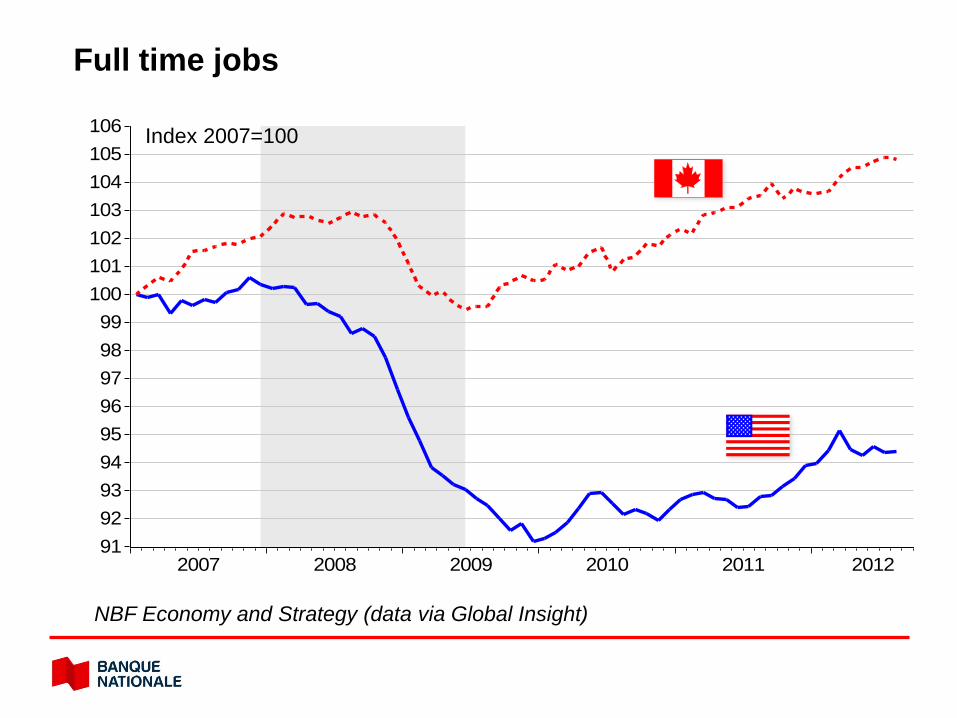
919293949596979899
100101102103104105106
2007 2008 2009 2010 2011 2012
Index 2007=100
Full time jobs
NBF Economy and Strategy (data via Global Insight)
90100110120130140150160170180190200210220230
00 01 02 03 04 05 06 07 08 09 10 11 12
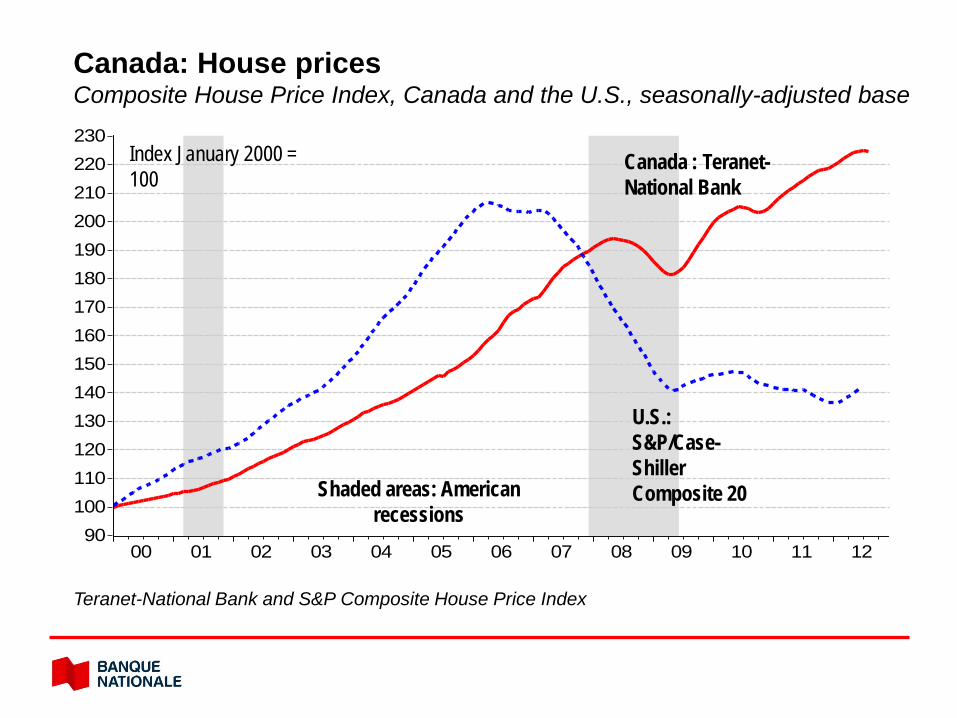
Canada: House prices Composite House Price Index, Canada and the U.S., seasonally-adjusted base
Canada : Teranet-National Bank
U.S.: S&P/Case-Shiller Composite 20
Index January 2000 = 100
Teranet-National Bank and S&P Composite House Price Index
Shaded areas: American recessions
80
100
120
140
160
180
200
220
240
260
280
2000 2002 2004 2006 2008 2010 2012
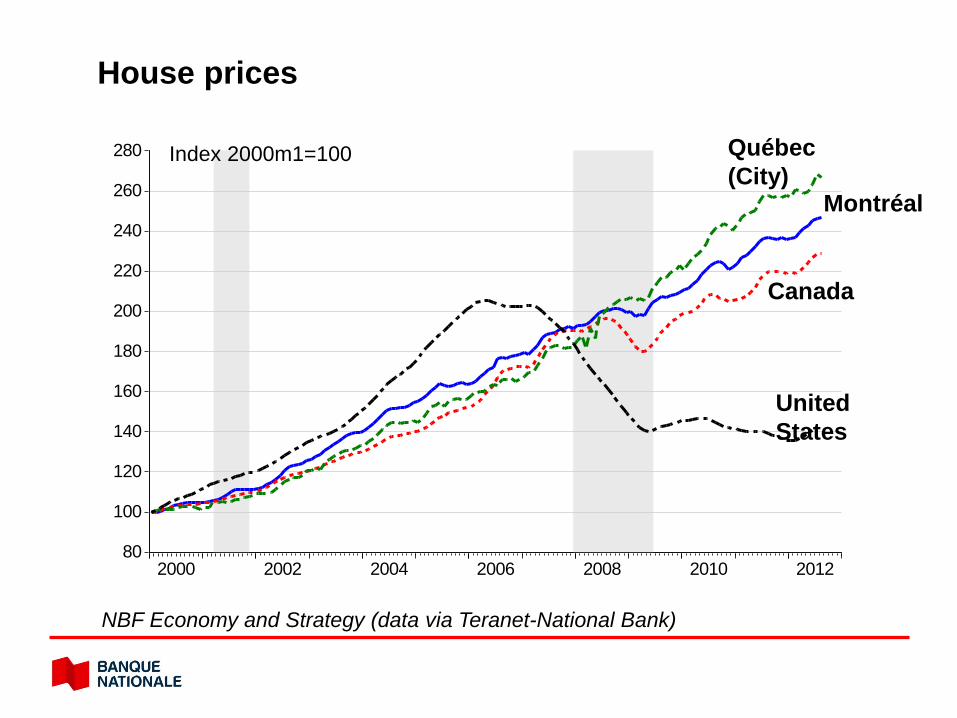
House prices
NBF Economy and Strategy (data via Teranet-National Bank)
Québec (City)
Canada
Index 2000m1=100
Montréal
United States

61
62
63
64
65
66
67
68
69
70
71
1980 1985 1990 1995 2000 2005 2010
NBF Economy and Strategy (data via US Census, Statistics Canada and CAAMP)
Ownership rate
%

-40
-30
-20
-10
0
10
20
30
40
50
60
70
2008 2009 2010 2011 2012
Number of existing home sales Canada and Quebec, growth slowing annually
Economy and Strategy Group, data from ACI.
% a/a
QC
CA
0
1
2
3
4
5
6
7
8
9
10
11
12
02 03 04 05 06 07 08 09 10 11 12 0
1
2
3
4
5
6
7
8
9
10
11
12
02 03 04 05 06 07 08 09 10 11 12
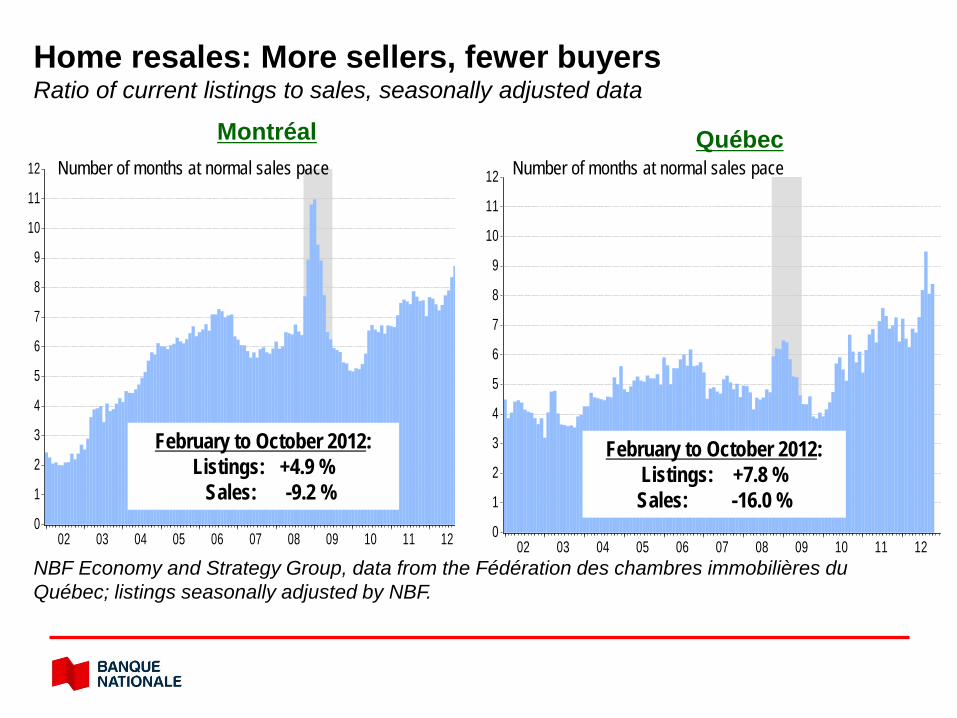
Home resales: More sellers, fewer buyers Ratio of current listings to sales, seasonally adjusted data Montréal Québec
Number of months at normal sales pace Number of months at normal sales pace
NBF Economy and Strategy Group, data from the Fédération des chambres immobilières du Québec; listings seasonally adjusted by NBF.
February to October 2012: Listings: +4.9 % Sales: -9.2 %
February to October 2012: Listings: +7.8 % Sales: -16.0 %
-15
-10
-5
0
5
10
15
20
25
30
35
40
1970 1975 1980 1985 1990 1995 2000 2005 2010
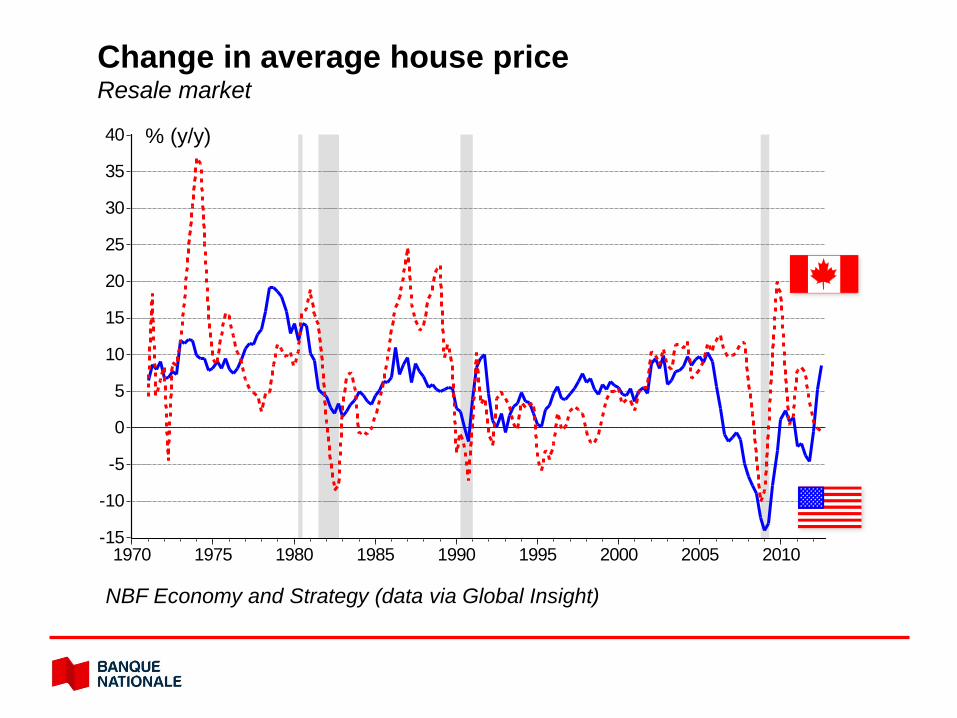
% (y/y)
Change in average house price Resale market
NBF Economy and Strategy (data via Global Insight)
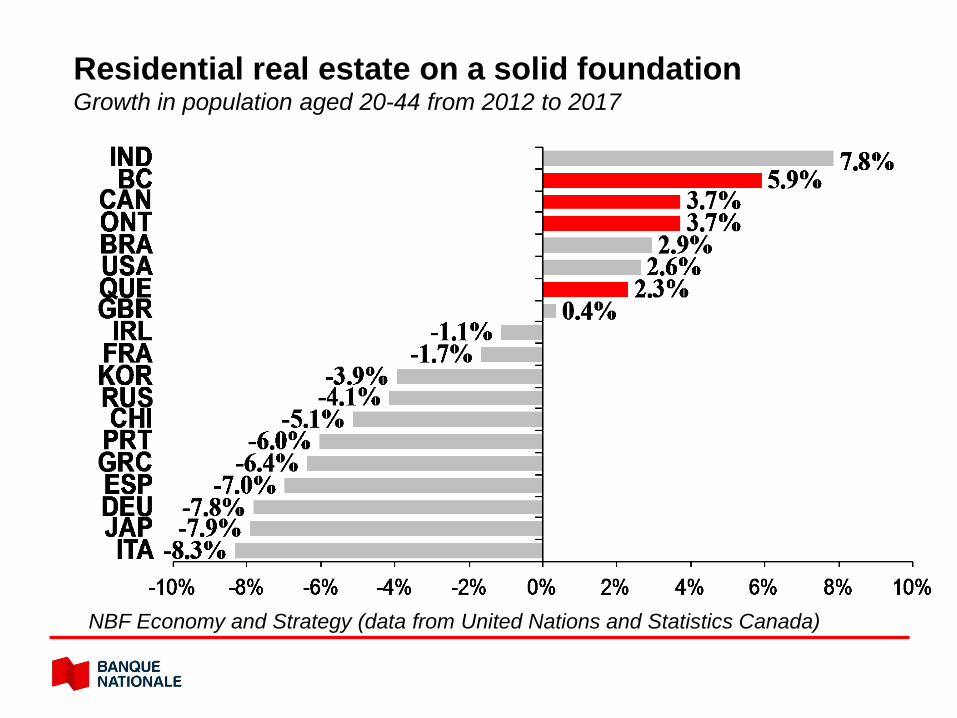
Residential real estate on a solid foundation Growth in population aged 20-44 from 2012 to 2017
NBF Economy and Strategy (data from United Nations and Statistics Canada)

55
0.0
0.4
0.8
1.2
1.6
2.0
2.4
2.8
3.2
3.6
4.0
4.4
4.8
5.2
90 92 94 96 98 00 02 04 06 08 10 12
Defaulted mortgage loans, Canada vs. United States Payments overdue more than 90 days
NBF Economy and Strategy, data via Federal Reserve and ABC
Default rate (%)
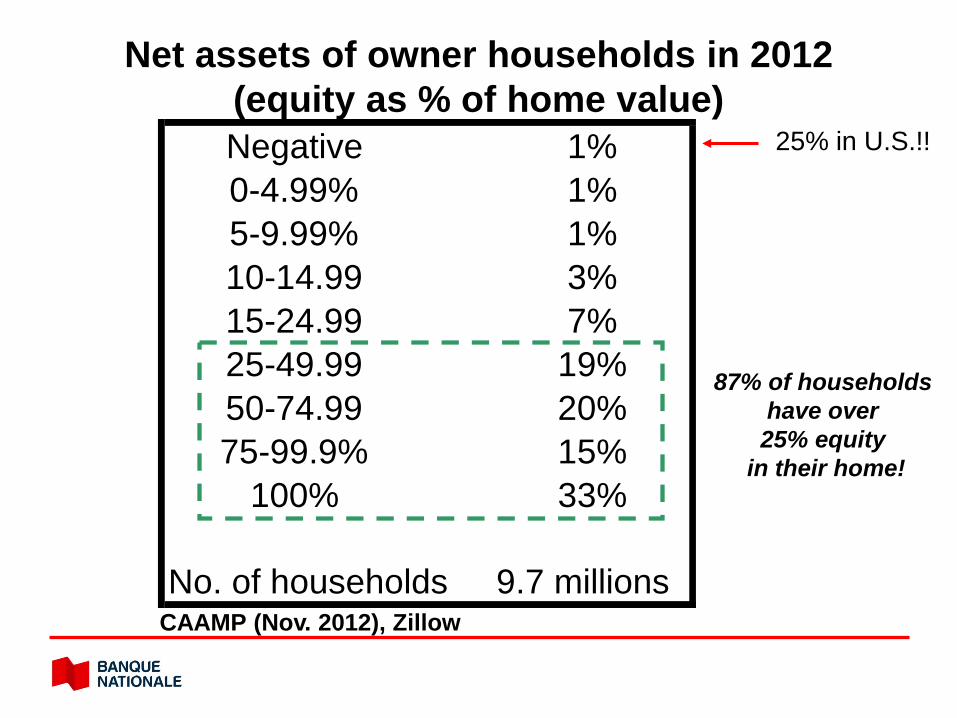
Net assets of owner households in 2012 (equity as % of home value)
87% of households have over 25% equity
in their home!
CAAMP (Nov. 2012), Zillow
25% in U.S.!! Negative 1% 0-4.99% 1% 5-9.99% 1% 10-14.99 3% 15-24.99 7% 25-49.99 19% 50-74.99 20% 75-99.9% 15%
100% 33%
No. of households 9.7 millions

“Most fundamentally, higher commodity prices are unambiguously good for Canada”
“The strength of Canada’s resource sector is a reflection of success, not a harbinger of failure.”
Bank of Canada - Mark Carney
September 7, 2012
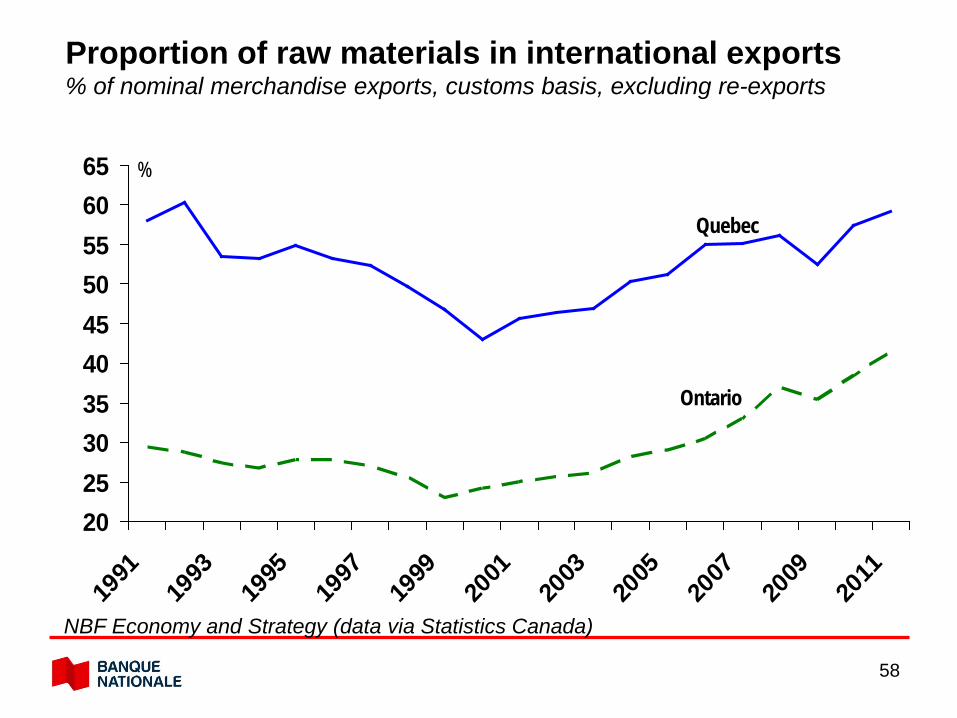
58
Proportion of raw materials in international exports % of nominal merchandise exports, customs basis, excluding re-exports
20253035404550556065
1991
1993
1995
1997
1999
2001
2003
2005
2007
2009
2011
Quebec
Ontario
%
NBF Economy and Strategy (data via Statistics Canada)
76
80
84
88
92
96
100
104
108
112
116
1970 1975 1980 1985 1990 1995 2000 2005 2010
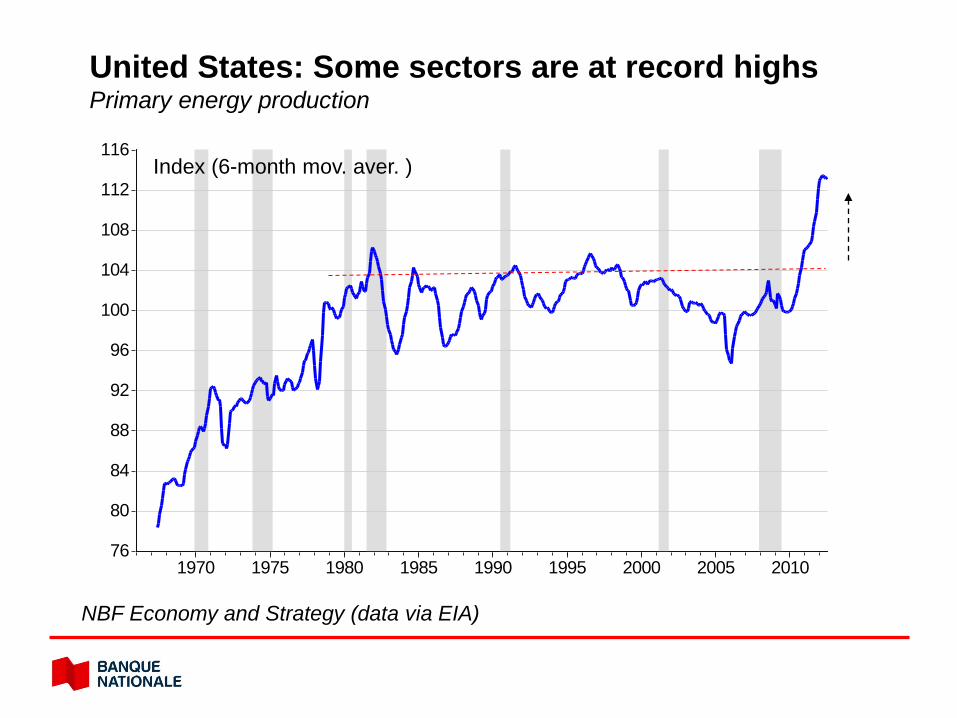
United States: Some sectors are at record highs Primary energy production
Index (6-month mov. aver. )
NBF Economy and Strategy (data via EIA)
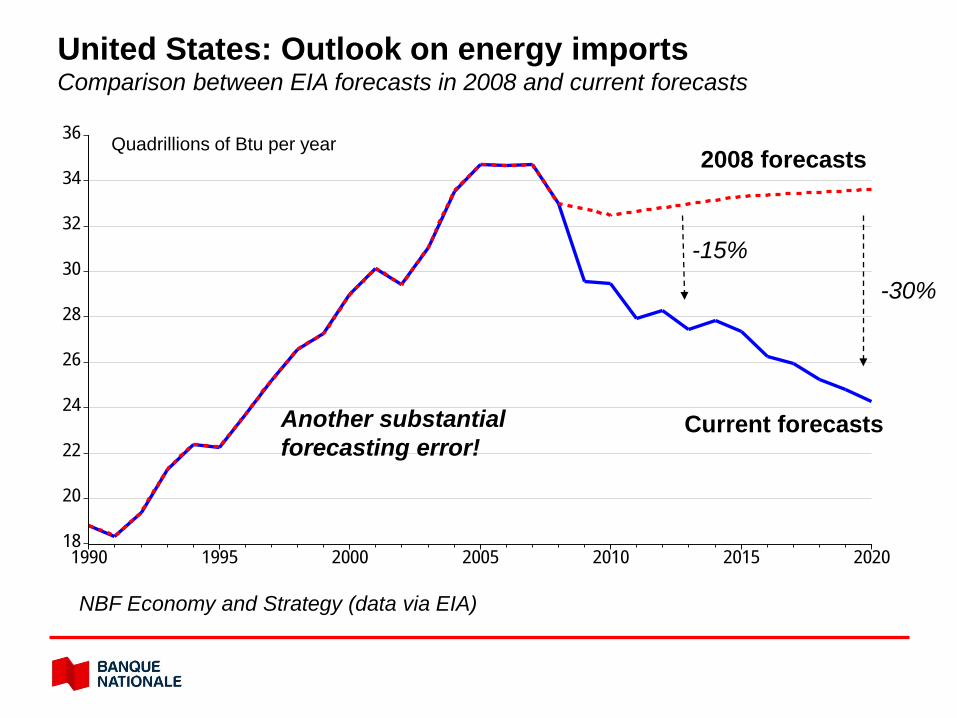
18
20
22
24
26
28
30
32
34
36
1990 1995 2000 2005 2010 2015 2020
-30%
-15%
Quadrillions of Btu per year
United States: Outlook on energy imports Comparison between EIA forecasts in 2008 and current forecasts
2008 forecasts
Current forecasts Another substantial forecasting error!
NBF Economy and Strategy (data via EIA)
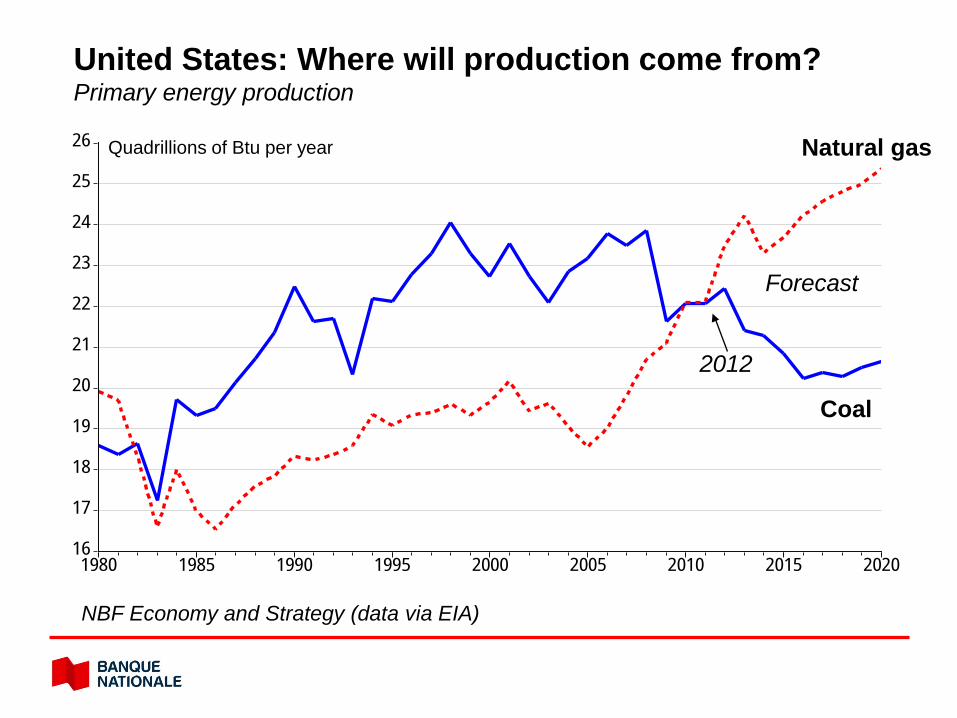
16
17
18
19
20
21
22
23
24
25
26
1980 1985 1990 1995 2000 2005 2010 2015 2020
United States: Where will production come from? Primary energy production
Natural gas
Coal
Quadrillions of Btu per year
2012
Forecast
NBF Economy and Strategy (data via EIA)

0.8
1.0
1.2
1.4
1.6
1.8
2.0
2.2
2.4
2.6
2.8
3.0
3.2
1992 1994 1996 1998 2000 2002 2004 2006 2008 2010
Exports of Quebec electricity by volume
Index, 1992=1
ISQ
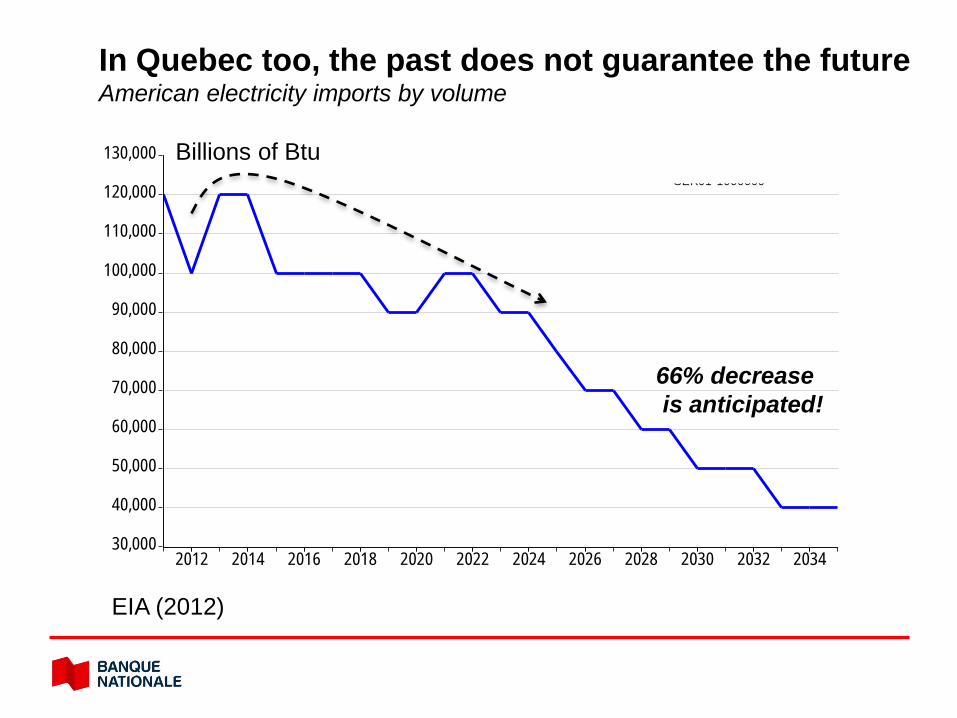
30,000
40,000
50,000
60,000
70,000
80,000
90,000
100,000
110,000
120,000
130,000
2012 2014 2016 2018 2020 2022 2024 2026 2028 2030 2032 2034
SER01*1000000
In Quebec too, the past does not guarantee the future American electricity imports by volume
Billions of Btu
EIA (2012)
66% decrease is anticipated!

Quebec
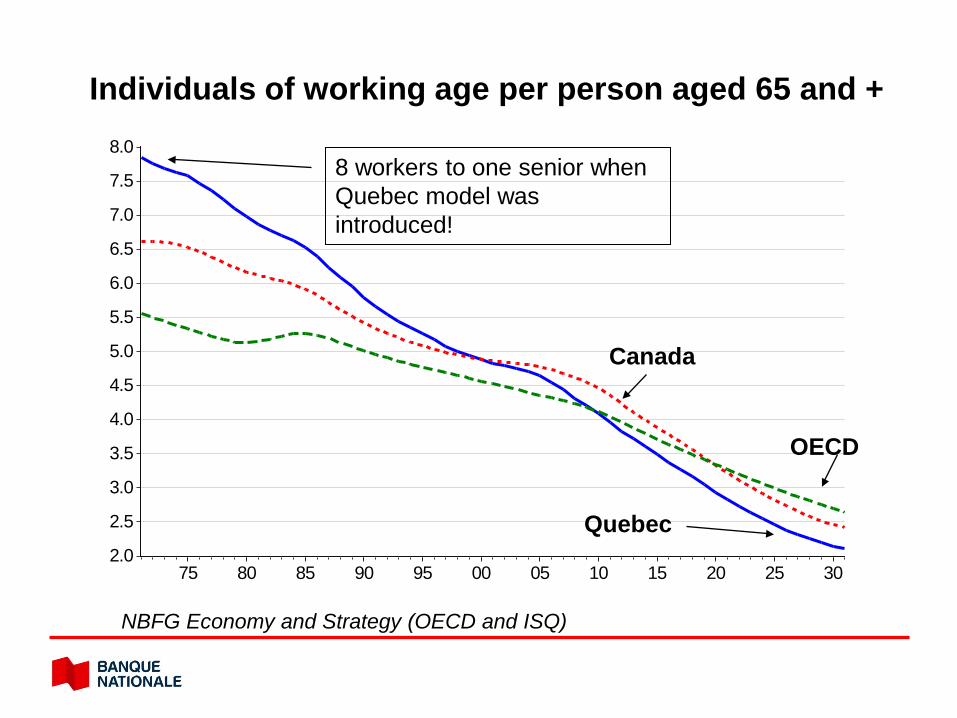
2.0
2.5
3.0
3.5
4.0
4.5
5.0
5.5
6.0
6.5
7.0
7.5
8.0
75 80 85 90 95 00 05 10 15 20 25 30
Individuals of working age per person aged 65 and +
NBFG Economy and Strategy (OECD and ISQ)
OECD
Canada
Quebec
8 workers to one senior when Quebec model was introduced!
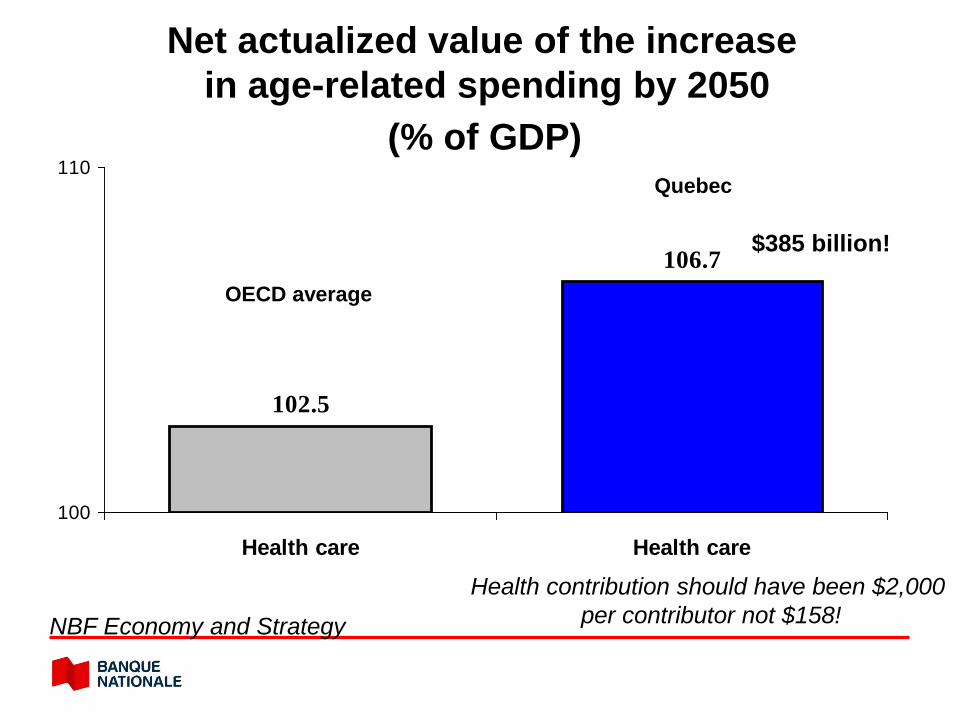
102.5
106.7
100
110
Health care Health care
Net actualized value of the increase in age-related spending by 2050
(% of GDP)
NBF Economy and Strategy
OECD average
Quebec
$385 billion!
Health contribution should have been $2,000 per contributor not $158!
-5.0
-4.5
-4.0
-3.5
-3.0
-2.5
-2.0
-1.5
-1.0
-0.5
0.0
0.5
1980 1985 1990 1995 2000 2005 2010 2015 2020 2025 2030
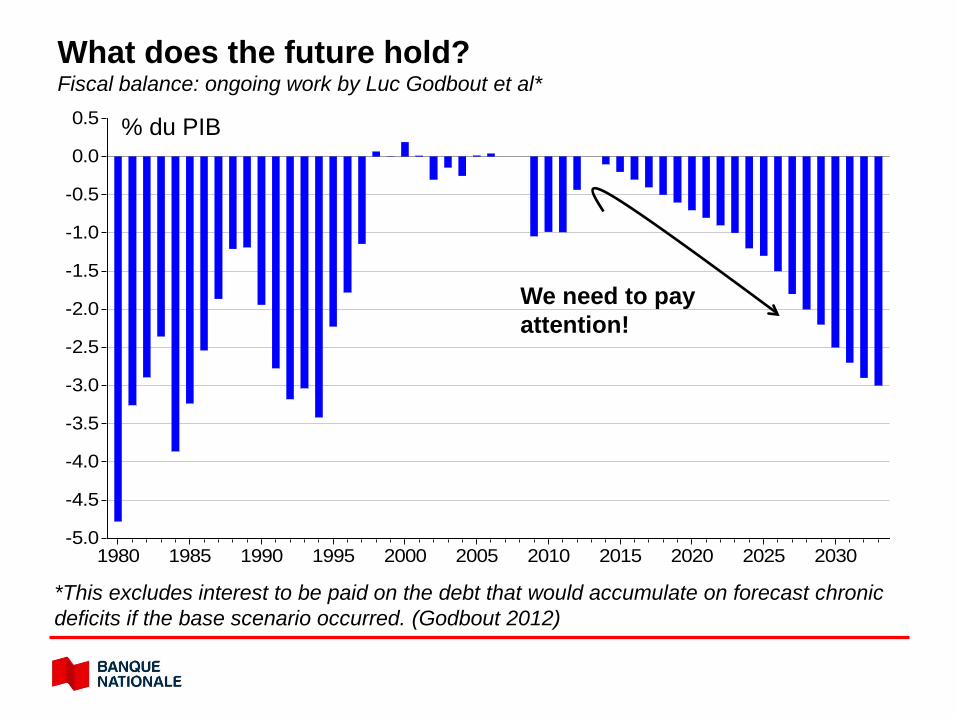
*This excludes interest to be paid on the debt that would accumulate on forecast chronic deficits if the base scenario occurred. (Godbout 2012)
What does the future hold? Fiscal balance: ongoing work by Luc Godbout et al*
% du PIB
We need to pay attention!
20
22
24
26
28
30
32
34
36
38
40
42
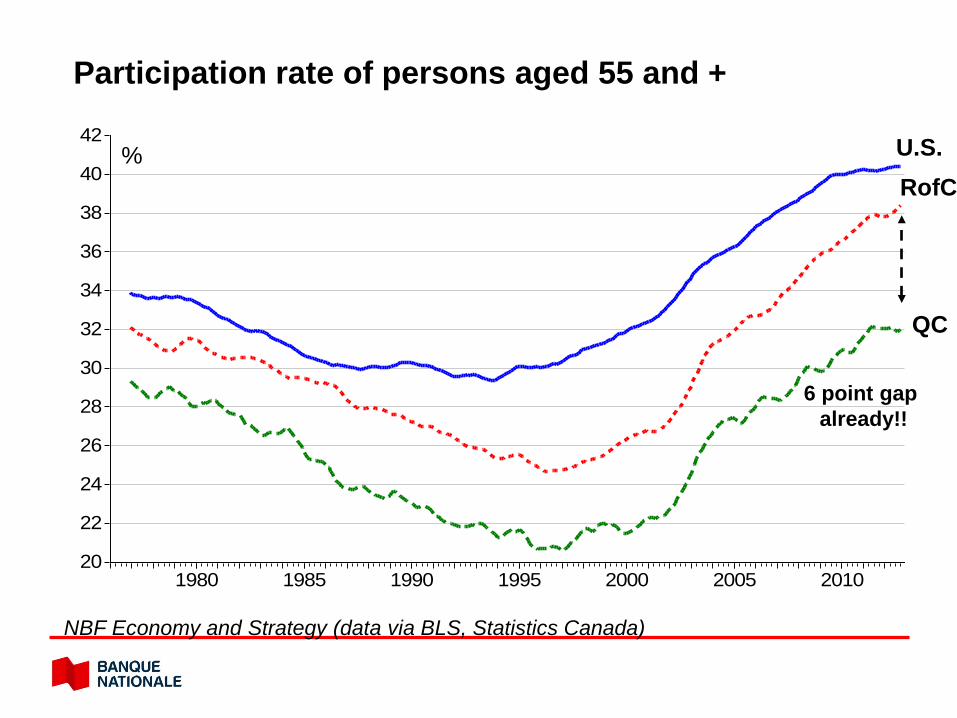
1980 1985 1990 1995 2000 2005 2010
NBF Economy and Strategy (data via BLS, Statistics Canada)
Participation rate of persons aged 55 and +
% RofC
QC
U.S.
6 point gap already!!

10
20
30
40
50
60
70
80
90
100
1950 1955 1960 1965 1970 1975 1980 1985 1990 1995 2000 2005 2010
55-64
65+
U.S.: Historic labour market outlook Male participation rate in labour market
NBF Economy and Strategy (data via BLS)
%
70
Capital Markets
6
8
10
12
14
16
18
20
22
24
26
1990 1995 2000 2005 2010
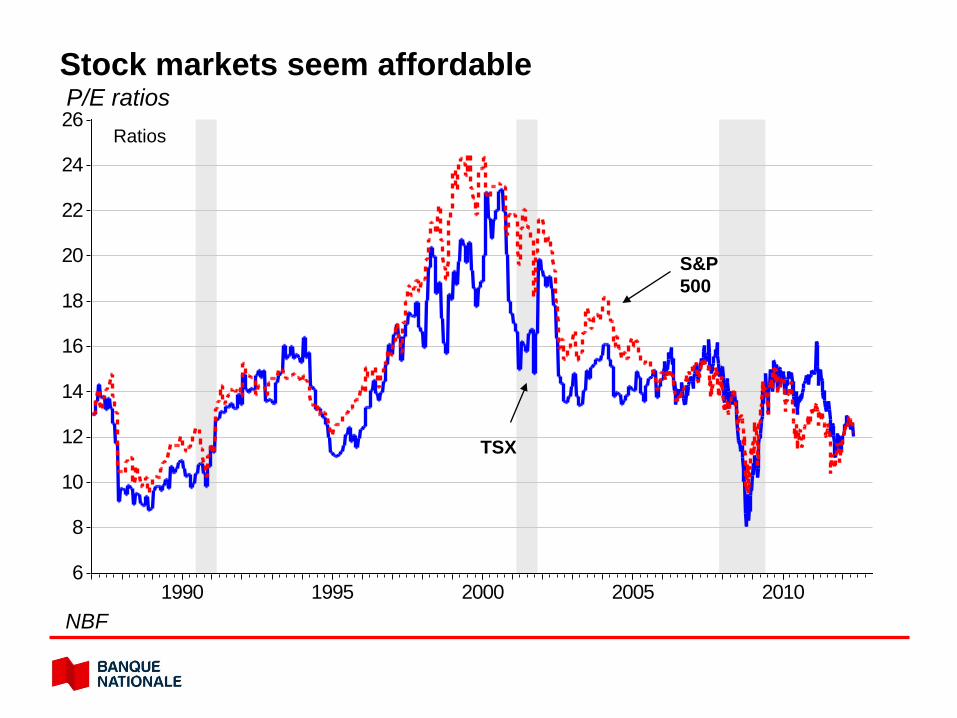
Stock markets seem affordable P/E ratios
Ratios
NBF
S&P 500
TSX
-5
-4
-3
-2
-1
0
1
2
3
4
5
6
7
8
12Q1 12Q2 12Q3 12Q4
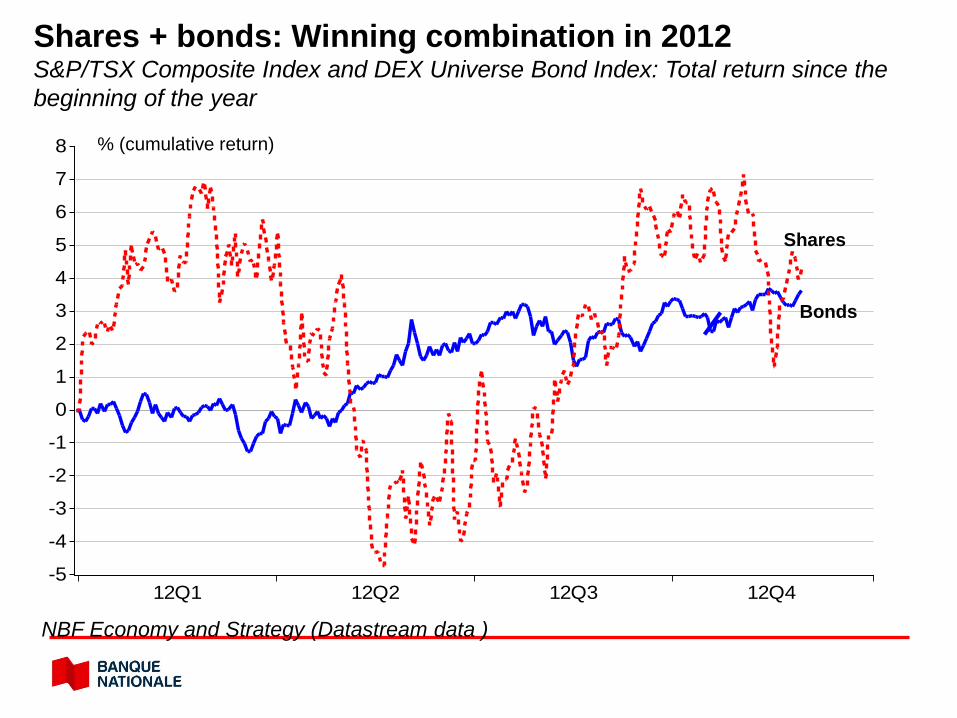
Shares + bonds: Winning combination in 2012 S&P/TSX Composite Index and DEX Universe Bond Index: Total return since the beginning of the year
NBF Economy and Strategy (Datastream data )
% (cumulative return)
Bonds
Shares

11
12
13
14
15
16
17
18
19
20
21
22
1945 1950 1955 1960 1965 1970 1975 1980 1985 1990 1995 2000 2005 2010
The workers’ profile is changing Workers aged 55 and + as percentage of total employment
NBF Economy and Strategy (Datastream data)
%
20
30
40
50
60
70
80
90
100
110
120
130
1975 1980 1985 1990 1995 2000 2005 2010
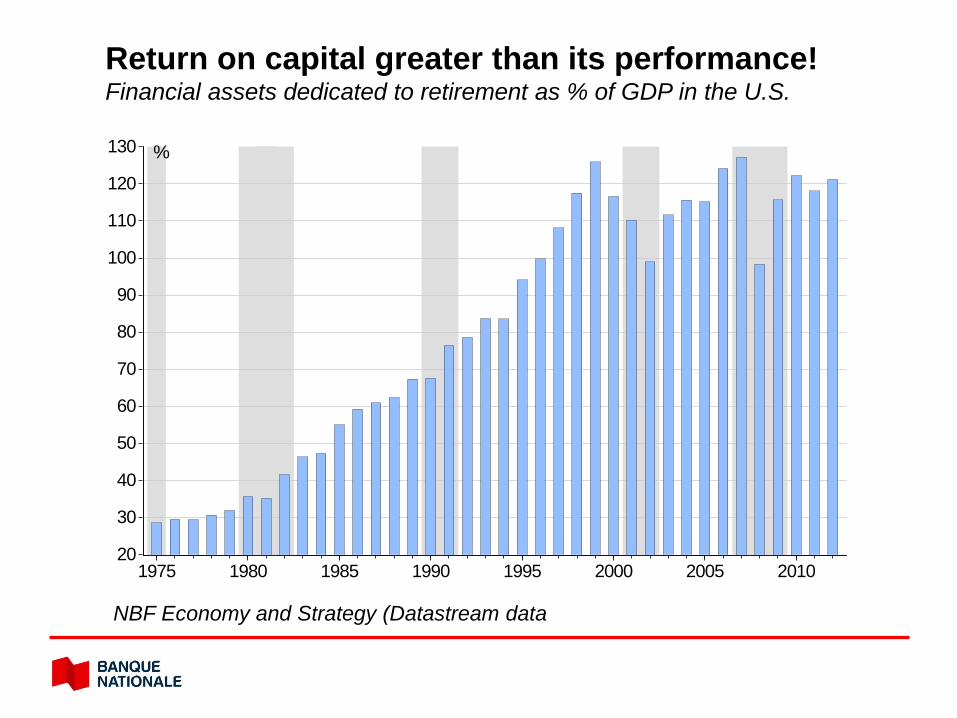
Return on capital greater than its performance! Financial assets dedicated to retirement as % of GDP in the U.S.
NBF Economy and Strategy (Datastream data
%

12
16
20
24
28
32
36
40
44
48
52
1950 1960 1970 1980 1990 2000 2010
Tolerance to change risk % of financial assets held in shares
NBF Economy and Strategy (data via Federal Reserve)
%

0
400
800
1,200
1,600
2,000
2,400
2,800
3,200
3,600
4,000
4,400
4,800
76 78 80 82 84 86 88 90 92 94 96 98 00 02 04 06 08 10 12
Outlook on pension plans, private sector Assets in pension plans in the U.S.
NBF Economy and Strategy (data via Federal Reserve)
$ billions Fixed contribution
Fixed benefits
Effects of Extending Tax Provisions Scheduled to Expire Before 2021(Billions of dollars) Total,
Expiration 2012-Tax Provision Date 2012 2013 2014 2015 2016 2017 2018 2019 2020 2021 2021
Generalized System of Preferences 2010/12/31 -1.0 -0.6 -0.7 -0.7 -0.8 -0.9 -0.9 -1.0 -1.1 -1.2 -8.8Andean Trade Preference Initiative 2011/02/12 -0.1 -0.1 -0.1 -0.1 -0.1 -0.1 -0.1 -0.1 -0.1 -0.2 -1.2Enhance Health Insurance Credit for Certain Individuals 2011/02/13 -0.2 -0.2 -0.1 -0.1 -0.1 -0.1 -0.1 -0.1 -0.1 -0.1 -1.1FUTA Surtax of 0.2 Percentage Points 2011/06/30 1.0 1.4 1.4 1.5 1.5 1.5 1.5 1.5 1.5 1.6 14.5
Adoption Credit 2011/12/31 * -0.9 -1.1 -1.1 -1.1 -1.2 -1.2 -1.2 -1.2 -1.2 -10.2Alcohol Fuel Tax Credit 2011/12/31 -4.0 -5.5 -5.6 -5.7 -5.8 -5.8 -5.8 -5.8 -5.9 -5.9 -55.8Alternative Fuel Vehicle Refuelng Property 2011/12/31 * * * * * * * * * * -0.3American Samoa Economic Development Credit 2011/12/31 * * * * * * * * * * -0.2Basis Adjustment of S Corporate Stock for Donations 2011/12/31 * -0.1 -0.1 -0.1 -0.1 -0.1 -0.1 -0.1 -0.1 -0.1 -0.9
Biodiesel and Renewable Diesel Credits 2011/12/31 -0.8 -1.1 -1.2 -1.1 -1.1 -1.1 -1.1 -1.1 -1.1 -1.1 -11.0Brownfields Remediation Expensing 2011/12/31 -0.2 -0.4 -0.4 -0.3 -0.3 -0.3 -0.3 -0.3 -0.2 -0.2 -2.9Contributions of Book Inventory 2011/12/31 * -0.1 -0.1 -0.1 -0.1 -0.1 -0.1 -0.1 -0.1 -0.1 -0.7Contributions of Food Inventory 2011/12/31 -0.1 -0.1 -0.1 -0.2 -0.2 -0.2 -0.2 -0.2 -0.2 -0.2 -1.6Corporate Contributions of Computers to Schools 2011/12/31 -0.2 -0.2 -0.3 -0.3 -0.3 -0.3 -0.3 -0.3 -0.3 -0.3 -2.7
Credit for Certain Energy-Efficient Appliances 2011/12/31 -0.1 -0.1 -0.1 -0.2 -0.2 -0.2 -0.2 -0.3 -0.3 -0.3 -1.9Credit for Certain Nonbusiness Energy Property 2011/12/31 -0.1 -0.6 -0.6 -0.7 -0.7 -0.7 -0.8 -0.8 -0.8 -0.8 -6.6Credit for Energy-Efficient Homes 2011/12/31 * * -0.1 -0.1 -0.1 -0.1 -0.1 -0.1 -0.1 -0.1 -0.8Credit for Maintaining Railroad Tracks 2011/12/31 -0.1 -0.2 -0.2 -0.2 -0.2 -0.2 -0.2 -0.2 -0.2 -0.2 -1.6Credit for Plug-In Vehicles and Small Electric Vehicles 2011/12/31 * * * * * * * * * * -0.1
Credit for Research and Experimentation 2011/12/31 -2.6 -3.8 -4.2 -4.9 -5.7 -6.4 -7.1 -7.7 -8.5 -9.2 -60.0Deductible Premiums for Mortgage Insurance 2011/12/31 -0.2 -0.9 -1.0 -1.1 -1.3 -1.5 -1.6 -1.8 -2.0 -2.1 -13.5Deduction for Domestic Production in Puerto Rico 2011/12/31 -0.1 -0.2 -0.2 -0.2 -0.3 -0.3 -0.3 -0.3 -0.3 -0.4 -2.6Deduction for Qualified Education Expenses 2011/12/31 -0.4 -1.8 -1.8 -1.8 -1.8 -1.8 -1.8 -1.8 -1.8 -1.8 -16.6Deduction for Teachers' Classroom Expenses 2011/12/31 * -0.2 -0.2 -0.3 -0.3 -0.3 -0.3 -0.3 -0.3 -0.3 -2.5
Deduction of State and Local Sales Taxes 2011/12/31 -0.2 -1.4 -1.7 -1.8 -1.8 -1.8 -1.8 -1.8 -1.9 -2.0 -16.2Depreciation for Business Property on Indian Reservations 2011/12/31 -0.1 -0.4 -0.5 -0.4 -0.4 -0.3 -0.3 -0.2 -0.2 -0.2 -3.1Depreciation of Leasehold and Restaurant Equipment 2011/12/31 -0.1 -0.4 -0.8 -1.3 -1.8 -2.4 -2.9 -3.4 -3.9 -4.5 -21.4Depreciation Period for Motor Tracks 2011/12/31 * * * -0.1 -0.1 -0.1 -0.1 -0.1 -0.1 -0.1 -0.6Disclose Prisoner Return Information to Prison Officials 2011/12/31 0 ** ** ** ** ** ** ** ** ** **
Dispositions of Electric Transmission Property 2011/12/31 -0.2 -0.3 -0.3 -0.3 -0.2 -0.2 -0.1 -0.1 -0.1 -0.1 -2.0Dividends of Mutual Funds 2011/12/31 * -0.1 -0.1 -0.1 -0.1 -0.1 -0.1 -0.1 -0.1 -0.1 -1.0Employer Wage Credit for Activated Military Reservists 2011/12/31 * * * * * * * * * * -0.1Empowerment Zone Incentives 2011/12/31 -0.2 -0.1 -0.1 -0.1 -0.1 -0.1 -0.2 -0.2 -0.2 -0.2 -1.6Estate Tax Lookthrough on RICs Held by Nonresidents 2011/12/31 * * * * * * * * * * -0.2
Expensing of Advanced Mine Safety Equipment 2011/12/31 * * * * * * * * * * -0.1Expensing of Film and TV Productions 2011/12/31 -0.1 -0.2 -0.2 -0.1 -0.1 -0.1 -0.1 -0.1 -0.1 -0.1 -1.1Increased and Indexed AMT Exemption Amountb 2011/12/31 -9.0 -92.5 -39.5 -45.5 -53.4 -62.5 -74.0 -88.1 -103.8 -121.3 -689.6Indian Employment Tax Credit 2011/12/31 * * -0.1 -0.1 -0.1 -0.1 -0.1 -0.1 -0.1 -0.1 -0.6Mine Rescue Team Training Credit 2011/12/31 * * * * * * * * * * *
Net Income Limitation for Marginal Oil and Gas Wells 2011/12/31 -0.1 -0.1 -0.1 -0.1 -0.1 -0.1 -0.1 -0.2 -0.2 -0.2 -1.4New Markets Tax Credit 2011/12/31 0 * * -0.1 -0.2 -0.3 -0.5 -0.6 -0.7 -0.7 -3.2Parity for Exclusion for Employer Transit Benefits 2011/12/31 -0.1 -0.2 -0.2 -0.2 -0.2 -0.2 -0.2 -0.2 -0.2 -0.3 -2.0Payments Between Related Controlled Foreign Corporations 2011/12/31 -0.3 -1.0 -1.1 -1.3 -1.4 -1.5 -1.7 -1.8 -1.9 -2.1 -14.0Payments to Controlling Exempt Organizations 2011/12/31 * * * * * * * * * * -0.2
Qualified Zone Academy Bonds 2011/12/31 0 * * * * -0.1 -0.1 -0.1 -0.1 -0.1 -0.5Reduce S Corporation Gains Holding Period to 7 Years 2011/12/31 * -0.1 * * -0.1 -0.1 -0.1 -0.1 -0.1 -0.1 -0.8Special Rule for Qualified Conservation Contributions 2011/12/31 * -0.1 -0.1 -0.1 -0.1 -0.1 -0.1 -0.1 -0.1 -0.1 -0.9Special Rules for Small Business Stock 2011/12/31 ** ** ** ** ** -0.1 -0.9 -1.3 -1.5 -1.7 -5.4Subpart F for Active Financing Income 2011/12/31 -1.1 -5.6 -6.1 -6.8 -7.2 -7.7 -8.3 -8.9 -9.5 -10.1 -71.5
Tax Incentives for Alternative Fuels 2011/12/31 -0.1 -0.2 -0.2 -0.2 -0.2 -0.2 -0.2 -0.2 -0.2 -0.2 -1.8Tax Incentives for Investment in the District of Columbia 2011/12/31 * * * * * * * * * * -0.2Tax-Free Distributions from Retirement Plans for Donations 2011/12/31 -0.2 -0.4 -0.4 -0.5 -0.5 -0.5 -0.6 -0.6 -0.6 -0.7 -4.9Treat RICs as Qualified Investment Entities Under Section 897 2011/12/31 * * * * -0.1 -0.1 -0.1 -0.1 -0.1 -0.1 -0.5Treatment of Basic Housing Allowances for Income Eligibility 2011/12/31 * * * * * * * * * * -0.1Work Opportunity Tax Credit 2011/12/31 -0.3 -0.7 -0.8 -0.8 -0.9 -1.0 -1.0 -1.1 -1.1 -1.1 -8.7
African Growth and Opportunity Act (Less Developed Countries) 2012/09/30 n.a. -0.1 -0.1 -0.1 -0.1 -0.2 -0.2 -0.2 -0.2 -0.2 -1.3Qualified Green Building Bonds 2012/09/30 n.a. * * * * * * * * * *2010 Tax Act—American Opportunity Tax Credit 2012/12/31 n.a. -2.5 -12.4 -12.5 -12.6 -13.1 -13.4 -14.0 -14.3 -14.8 -109.62010 Tax Act—Child Credit at $1,000 2012/12/31 n.a. -7.0 -35.3 -35.8 -36.7 -37.4 -38.0 -38.6 -38.8 -38.9 -306.52010 Tax Act—Child Credit Refundable Threshold to $3,000 2012/12/31 n.a. 0 -10.3 -10.4 -10.2 -9.8 -9.7 -9.4 -9.4 -9.5 -78.72010 Tax Act—Earned Income Tax Credit Modifications 2012/12/31 n.a. -0.1 -10.0 -10.2 -10.3 -10.5 -10.7 -10.8 -11.0 -11.1 -84.52010 Tax Act—Education Provisions 2012/12/31 n.a. -0.8 -1.8 -1.9 -2.0 -2.1 -2.2 -2.2 -2.4 -2.5 -18.02010 Tax Act—Estate and Gift Tax Changes 2012/12/31 -0.7 -4.8 -30.8 -36.9 -41.3 -45.1 -48.2 -51.3 -54.5 -57.9 -371.42010 Tax Act—Expanded 10 Percent Bracket 2012/12/31 n.a. -31.9 -45.8 -46.0 -46.2 -46.1 -45.9 -45.8 -45.6 -45.4 -398.82010 Tax Act—Income Tax Rates of 25, 28, 33, and 35 Percent 2012/12/31 n.a. -37.1 -56.9 -62.1 -67.3 -71.9 -76.6 -80.8 -85.2 -89.9 -628.12010 Tax Act—Itemized Deduction and Personal Exemption Phaseout 2012/12/31 n.a. -5.5 -12.0 -13.6 -15.0 -16.4 -17.6 -18.9 -20.2 -21.5 -140.72010 Tax Act—Joint Filers' 15 Percent Bracket and Standard Deduction 2012/12/31 n.a. -4.7 -6.7 -6.4 -6.2 -6.0 -5.7 -5.4 -5.2 -5.0 -51.12010 Tax Act—Lower Tax Rates on Capital Gains and Dividends 2012/12/31 -1.6 -13.0 -11.9 -30.3 -31.9 -33.7 -35.3 -35.8 -38.2 -39.9 -271.42010 Tax Act—Other Provisionsc 2012/12/31 * -0.1 -0.3 -0.3 -0.3 -0.3 -0.3 -0.2 -0.2 -0.2 -2.1
Cellulosic Biofuel Credit 2012/12/31 n.a. -0.1 -0.2 -0.2 -0.3 -0.3 -0.3 -0.3 -0.3 -0.3 -2.1Credit for Past Minimum Tax Liability 2012/12/31 n.a. -0.1 -0.1 -0.1 -0.1 -0.1 -0.1 -0.1 -0.1 -0.1 -0.8Depreciation of Certain Ethanol Plant Property 2012/12/31 n.a. * * 0 0 0 0 0 0 0 *Election to Accelerate AMT Credit in Lieu of Bonus Depreciation 2012/12/31 n.a. * -0.3 -0.2 -0.2 -0.2 -0.2 -0.1 -0.1 -0.1 -1.4Electricity Production Credit for Wind Facilities 2012/12/31 n.a. -0.1 -0.4 -0.8 -1.2 -1.6 -2.0 -2.3 -2.6 -2.9 -14.0
Energy Credit for Wind Facilities 2012/12/31 n.a. * * * * * * * * * -0.3Exclusion of Mortgage Debt Forgiveness 2012/12/31 n.a. -0.1 -0.9 -0.8 -0.7 -0.5 -0.4 -0.3 -0.1 -0.2 -4.0Indian Coal Production Credit 2012/12/31 n.a. * * * * * * * * * *Partial Expensing of Investment Property 2012/12/31 n.a. -45.4 -73.9 -59.0 -44.3 -34.1 -25.7 -19.3 -15.6 -13.8 -331.1Section 179 Expensing 2012/12/31 n.a. -4.1 -7.1 -5.5 -4.6 -3.8 -3.2 -2.8 -2.7 -2.8 -36.5
Deduction for Energy-Efficient Commercial Buildings 2013/12/31 n.a. n.a. -0.1 -0.2 -0.2 -0.2 -0.2 -0.2 -0.2 -0.2 -1.6Depreciation Classification for Certain Race Horses 2013/12/31 n.a. ** * -0.1 -0.1 -0.1 -0.1 -0.1 * * -0.5Determination of Low-Income Housing Credit Rate 2013/12/31 n.a. n.a. * * * * * * * * *Electricity Production Credit for Nonnwind Facilities 2013/12/31 n.a. n.a. * -0.1 -0.2 -0.3 -0.4 -0.6 -0.7 -0.9 -3.3Partial Expensing of Certain Refinery Property 2013/12/31 n.a. n.a. -0.6 -0.8 -0.7 -0.6 -0.6 -0.5 -0.5 -0.5 -4.8
Transfer of Excess Assets in Defined-Benefit Plans 2013/12/31 n.a. n.a. ** ** ** ** ** ** ** ** 0.3Liquefied Hydrogen Fuel Incentives 2014/09/30 n.a. n.a. n.a. * * * * * * * -0.2Credit for Motor Vehicles with Fuel Cell 2014/12/31 n.a. n.a. n.a. * * * * * * * *Hydrogen Refueling Property 2014/12/31 n.a. n.a. n.a. * * * * * * * *African Growth and Opportunity Act 2015/09/30 n.a. n.a. n.a. n.a. -0.1 -0.1 -0.1 -0.1 -0.1 -0.1 -0.7
AGI Floor for Individuals 65 and Older Remains at 7.5 Percent 2016/12/31 n.a. n.a. n.a. n.a. n.a. -0.3 -0.9 -0.9 -1.0 -1.0 -4.2Credit for Business Solar Energy Property 2016/12/31 n.a. n.a. n.a. n.a. n.a. -0.2 -0.3 -0.3 -0.4 -0.4 -1.5Credit for Residential Energy-Efficient Property 2016/12/31 n.a. n.a. n.a. n.a. n.a. * -0.2 -0.2 -0.2 -0.2 -0.9Earned Import Allowance Program for Dominican Republic 2018/08/15 n.a. n.a. n.a. n.a. n.a. n.a. * * * * *Haitian Value-Added Rule for Apparel 2018/12/19 n.a. n.a. n.a. n.a. n.a. n.a. n.a. * * * *
Increase Excise Tax on Coal 2018/12/31 n.a. n.a. n.a. n.a. n.a. n.a. n.a. 0.2 0.2 0.2 0.5Caribbean Basin Trade Partnership Act 2020/09/30 n.a. n.a. n.a. n.a. n.a. n.a. n.a. n.a. n.a. -0.1 -0.1Haiti Trade Preferences 2020/09/30 n.a. n.a. n.a. n.a. n.a. n.a. n.a. n.a. n.a. -0.1 -0.1
Combined Interaction from Extending the 2010 Tax Act and AMT Provisions 0 -37.4 -66.4 -73.4 -81.0 -88.8 -98.1 -108.0 -117.7 -127.6 -798.5
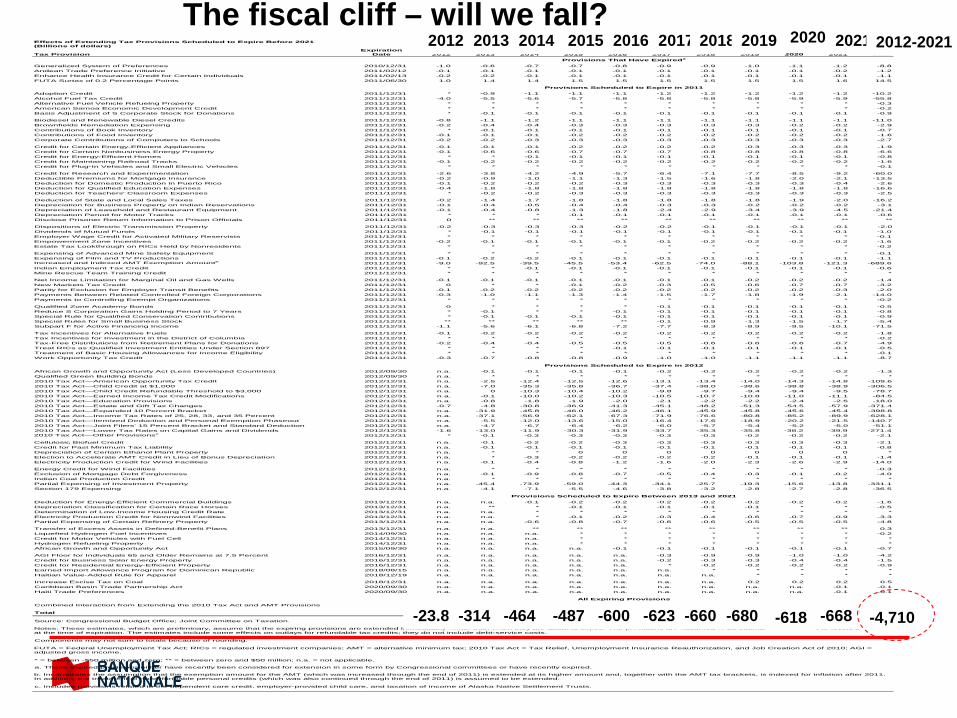
Total -23.8 -314.4 -453.3 -485.5 -501.8 -523.5 -550.8 -581.0 -617.7 -658.7 -4 710.6
Source: Congressional Budget Office; Joint Committee on Taxation.
Components may not sum to totals because of rounding.
* = between -$50 million and zero; ** = between zero and $50 million; n.a. = not applicable.
a. These expired provisions either have recently been considered for extension in some form by Congressional committees or have recently expired.
c. Includes provisions related to the dependent care credit, employer-provided child care, and taxation of income of Alaska Native Settlement Trusts.
b. Incorporates the assumption that the exemption amount for the AMT (which was increased through the end of 2011) is extended at its higher amount and, together with the AMT tax brackets, is indexed for inflation after 2011. In addition, the treatment of nonrefundable personal credits (which was also continued through the end of 2011) is assumed to be extended.
Provisions That Have Expireda
Provisions Scheduled to Expire in 2011
Provisions Scheduled to Expire in 2012
Provisions Scheduled to Expire Between 2013 and 2021
All Expiring Provisions
Notes: These estimates, which are preliminary, assume that the expiring provisions are extended immediately rather than when they are about to expire. The provisions are assumed to be extended at the rates or levels existing at the time of expiration. The estimates include some effects on outlays for refundable tax credits; they do not include debt-service costs.
FUTA = Federal Unemployment Tax Act; RICs = regulated investment companies; AMT = alternative minimum tax; 2010 Tax Act = Tax Relief, Unemployment Insurance Reauthorization, and Job Creation Act of 2010; AGI = adjusted gross income.
-23.8 -314 -464 -487 -600 -623 -660 -680 -618 -668 -4,710
2012 2013 2014 2015 2016 2017 2018 2019 2020 2021 2012-2021 The fiscal cliff – will we fall?
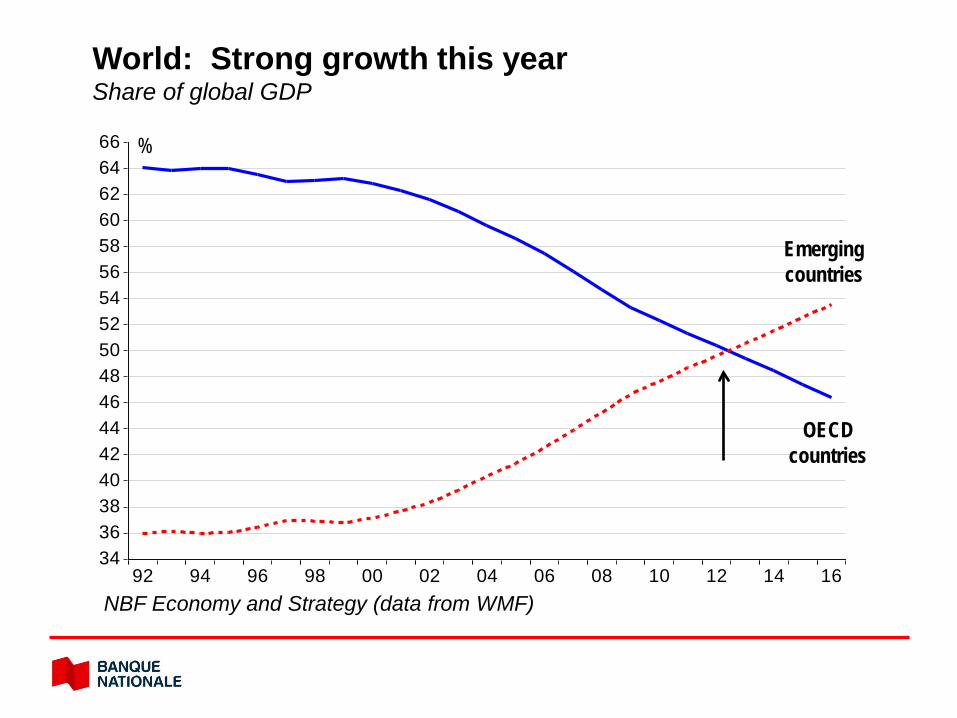
3436384042444648505254565860626466
92 94 96 98 00 02 04 06 08 10 12 14 16
World: Strong growth this year Share of global GDP
NBF Economy and Strategy (data from WMF)
%
Emerging countries
OECD countries
79
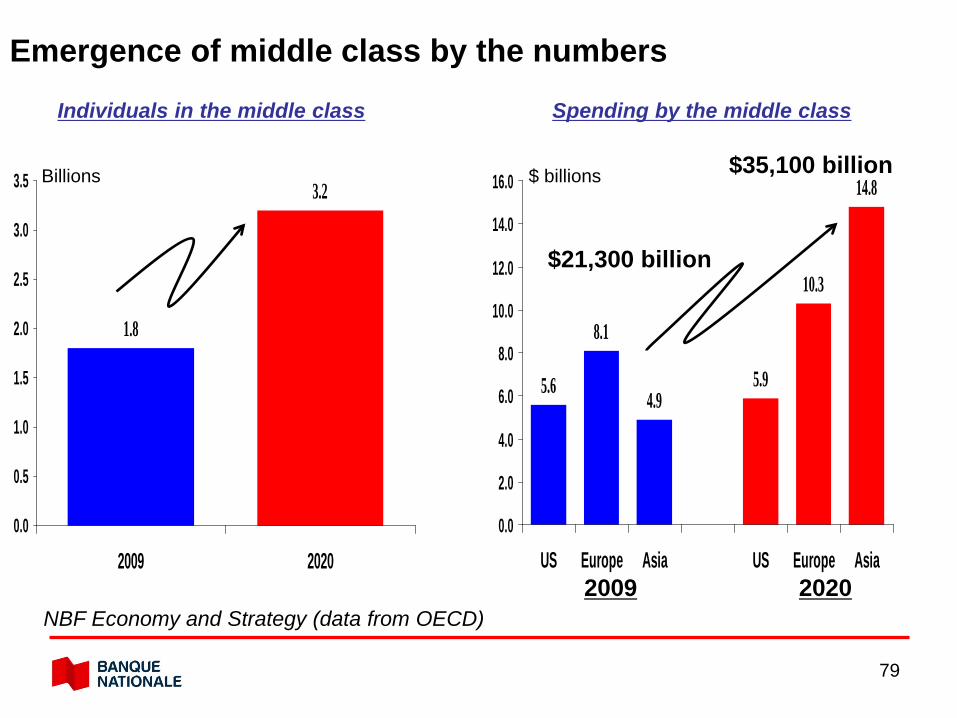
1.8
3.2
0.0
0.5
1.0
1.5
2.0
2.5
3.0
3.5
2009 2020
5.6
8.1
4.95.9
10.3
14.8
0.0
2.0
4.0
6.0
8.0
10.0
12.0
14.0
16.0
US Europe Asia US Europe Asia
NBF Economy and Strategy (data from OECD)
Emergence of middle class by the numbers
Billions $ billions
$21,300 billion
$35,100 billion
2009 2020
Individuals in the middle class Spending by the middle class
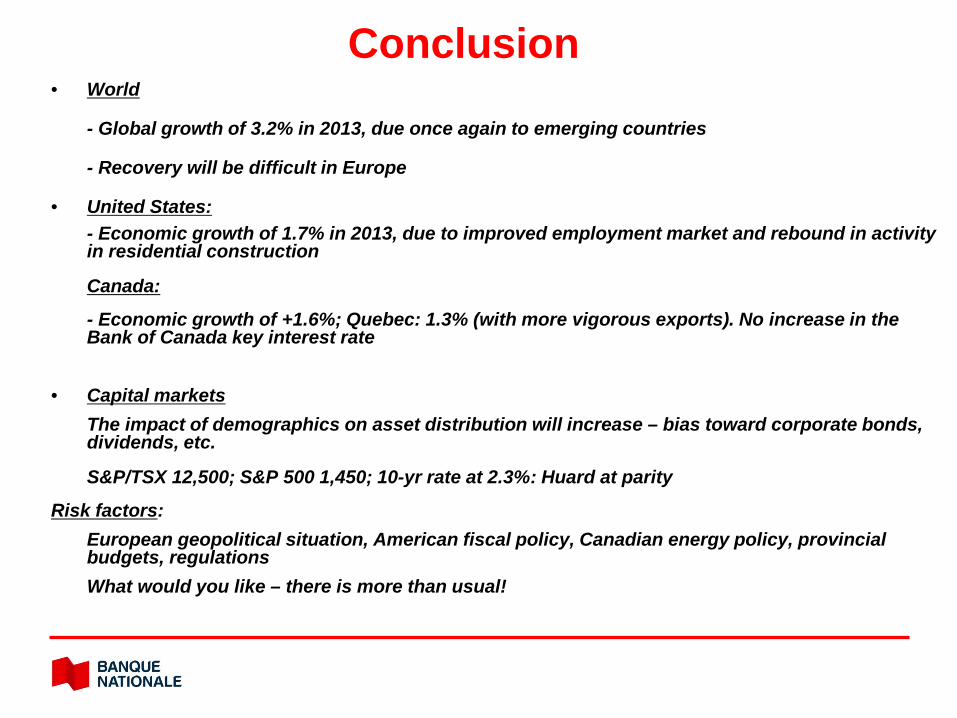
• World
- Global growth of 3.2% in 2013, due once again to emerging countries
- Recovery will be difficult in Europe
• United States: - Economic growth of 1.7% in 2013, due to improved employment market and rebound in activity
in residential construction
Canada:
- Economic growth of +1.6%; Quebec: 1.3% (with more vigorous exports). No increase in the Bank of Canada key interest rate
• Capital markets The impact of demographics on asset distribution will increase – bias toward corporate bonds,
dividends, etc.
S&P/TSX 12,500; S&P 500 1,450; 10-yr rate at 2.3%: Huard at parity
Risk factors: European geopolitical situation, American fiscal policy, Canadian energy policy, provincial
budgets, regulations What would you like – there is more than usual!
Conclusion

Thank you for your attention!