national association of independent and non … · national association of independent and non ......
TRANSCRIPT

| 0
4 October 2012
STRICTLY PRIVATE AND CONFIDENTIAL
National Association of Independent and Non-Maintained
Special Schools
Social Impact Evaluation of Non-Maintained and Independent Special schools using Social Return
on Investment

| 1
Research Publication Notices
Charity and Education Group
Baker Tilly produces a range of research and other material on Social Impact and related topics. Further
information can be found at the following website:
http://www.bakertilly.co.uk/socialimpact
Citation notice
Citation should confirm to normal academic standards. Please use the reference provided or where a paper has
entered into print elsewhere, use normal journal / book citation conventions.
Clifford, J. and Theobald, C. (2012) ‘National Association of Independent and Non-Maintained Special Schools:
Social Impact evaluation of Non-Maintained and Independent Special Schools using Social Return on Investment
Copyright
The copyright of all publications of work commissioned from Baker Tilly remains with the relevant Baker Tilly
Company or LLP, from whom permission should be sought before any materials are reproduced. Short sections of
text, not to exceed two paragraphs, may be quoted without explicit permission, provided that full acknowledgement
is given.
Disclaimer
This project has been commissioned by, but does not necessarily reflect the views of NASS or participating schools.
Baker Tilly Corporate Finance LLP has co-ordinated its preparation, and has selectively challenged and checked
the data gathered and applied in this report, and the calculations and logic derived but this should not be taken to
imply that figures produced by participating schools have been audited or are the subject of formal or informal
verification. Consequently Baker Tilly Corporate Finance LLP and all and any other Baker Tilly entities, principals
and staff accept no liability to any party relying on the figures so included. Members of the NASS working group
have reviewed this report and have confirmed that the assumptions and data used are, to the best of their
knowledge, reasonable.
Contact details Baker Tilly Corporate Finance LLP NASS 46 Clarendon Road PO Box 705 Watford York Hertfordshire WD17 1JJ YO30 622 T: 01923 816 400 T: 01904 621243 E: [email protected] E: [email protected]

| 2
Chief Executive’s Foreword
At a time of unprecedented economic constraint, efficient use of public funds rightly becomes a key concern. Local
Authorities purchasing services need to be assured that those services represent good value for money. Whilst this
clearly means that cost at the point of purchase is an important consideration, it is arguably more important to look
at the longer-term impact of that service.
For schools in the Non-maintained and Independent Special School (NMISS) sectors, demonstrating value has
been a long-term challenge. All schools have stories of young people’s lives transformed through their input but
many struggle to evidence this beyond narrative approaches. Whilst schools can evidence tangible academic
achievements, such as qualifications, they have instinctively felt that this does not capture the full value of the
experience.
Social Return on Investment methodology is a valuable tool for those providing services for children and young
people with Special Educational Needs (SEN) and Disabilities. In this study, Baker Tilly enabled a group of NASS
member schools to move beyond stories to consider the longer-term economic value to society that their
placements provide. For the first time, we were able to move beyond the consideration of outputs for the child and
explore the wider impact of a child or young person being in the right placement to meet their needs. All children
and young people with SEN and disabilities belong to social groups and systems – as family members, potential
employees and potential users of adult services. Using Social Return on Investment methodology we have been
able to explore the impact a placement in a NMISS has on these systems, rather than just the young person in
isolation. We believe that this enables the true value of the right placement to be seen and understood.
Taking a very prudent approach to considering the returns on investment, this study reveals some highly
impressive figures. We have been able to validate the participating schools’ views that they do more than simply
teach young people – they make a major impact on the young person, their family and the wider society both
during the time spent at the school and across the next twenty years.
NASS is delighted to contribute this report to the wider debate on outcomes for children and young people with
SEN and disabilities. We suspect that these findings are not unique to our sector and we hope that other SEN
providers will undertake similar studies. We do, however, believe that the highest returns are made when children
and young people achieve early access to a placement that meets their needs. Whilst we recognise that finding an
appropriate placement is often expensive, we note from our study on cost comparison that the NMISS sector
represents a cost effective option. Now, with this report, we can claim to be more that simply cost-effective at the
point of purchase -we are services which return significant value to young people, their families and the wider
public purse. This is a message to celebrate.
Claire Dorer
Chief Executive, NASS
October 2012

| 3
NASS Introductory Comments from Jim Clifford
This study uses the now well-developed approach of Social Return on Investment to evaluate the outcomes
achieved for students, their families, communities and the State by the work of NMIS schools. It uses the Action
Research methodology that has been found by us to work so well with many social care and educational
organisations, and which allows the robust evaluations to be built out of the stories of the students and teachers
themselves.
The results, which are conservative evaluations, give a value generated for one year’s new intake across the eight
named schools from their five year stay of £24.5m. Given the steady state operation of the participants, this answer
of one year’s intake over a five year stay could reasonably measure the five year groups at the school for a single
year’s activity.
This report needs to be read in conjunction with our 2011 and 2012 reviews of the cost comparison of NMIS
provision and the equivalent in the LA-Maintained sector. This shows the majority of NMIS provision being less
expensive than its LA-Maintained equivalent, so all of the evaluated outcomes are effectively cost-free. Since the
majority of the cohort are students with a statutory obligation to attend education, the cost of no provision is not the
relevant comparator.
It appears that, where the cost of provision is higher in NMIS schools, it is that group of students for whom
equivalent provision may not be available in the LA-Maintained sector. Some further review of this, and the
complexities of requirements in high need (e.g. SEBD and ASD) may shed further light on this issue.
This study is an important piece of research which I hope will give rise to much thought, debate and challenge in
the search for constant improvement for these young people.
Jim Clifford
Baker Tilly Corporate Finance LLP Telephone: +44 (0)7860 386081 E-mail: [email protected] Jim Clifford is Head of Non Profit Advisory Services, and Chairs the Public Sector Group at Baker Tilly. He was the lead
author of the Social Impact protocol for Sector Skills Councils, published in 2010, as well as the study of Domestic Adoption and Fostering at PACT that has been so widely referenced in the developing policy debate in that field. He has authored a range of other cost, finance and valuation review for not-for-profit entities over a thirty-year career advising in the sector. He is undertaking research into evaluative protocols for transactional decision making (linking Social Impact with conventional valuation and brand valuation) with Professors Palmer and Harrow at Cass Business School’s Centre for Charity Effectiveness, where he is a Visiting Fellow. He is also an independent director of the Centre for Public Scrutiny.

| 4
Contents
Definitions of Terms.................................................................................................................................. 5
1. Executive Summary and Key Findings ............................................................................................ 6
2. Introduction ................................................................................................................................... 15
3. Concepts and methodologies used ................................................................................................ 21
4. Overview of evaluated activities..................................................................................................... 24
5. Summary of evaluation approaches .............................................................................................. 34
6. Conclusion .................................................................................................................................... 45
APPENDICES
A. Notes on Action Research ............................................................................................................. 49
B. Student Life Course profiles .......................................................................................................... 53
C. Adjusted life course profiles ........................................................................................................... 70
D. Sensitivity Analysis ........................................................................................................................ 81
E. Case Studies ................................................................................................................................. 82
F. Outcomes map .............................................................................................................................. 88
G. Discounted Cash Flow methodology ............................................................................................. 89

| 5
Definitions of Terms
The following definitions apply throughout this document, unless the context requires, otherwise:
Term Definition
ASD Autistic Spectrum Disorder
NASS National Association of Independent Schools and Non-Maintained Special
Schools
SEND Special Educational Needs and Disability
SROI Social Return on Investment
LA Local Authority
NMIS Schools Non-Maintained and Independent Special Schools
DWP Department for Work and Pensions
CSJ Centre for Social Justice
GVA Gross Value Added
BESD Behavioural, Emotional and Social Difficulties
NEET Not in Education, Employment or Training
GP General Practitioner
NHS The National Health Service

| 6
“Since leaving, [my son] has gone from strength to strength! [You] totally transformed him and enabled him to cope with life…he enrolled at [College] to do his A levels and has coped incredibly well finding his way around and interacting with the other students. He is also working on Sundays at [a restaurant]…You are all very special people and we will be eternally grateful to you all.” Source: Letter from a parent to one of the schools participating in this study
1. Executive Summary and Key Findings
Background to this report
Background
1.1 During the pilot cost comparison study in 2011A,
several areas were identified in which there was
a potential incremental gain to society as a result
of work done by NMIS schools in excess of that
expected from Local Authority provision. NASS
has commissioned this study to:
Examine those areas in more detail and validate the connection between work done by NMIS schools and the achievement of changes;
Understand whether any other areas should be examined that were not considered in the original study; and
Develop financial evaluations of these gains, using Social Return on Investment (“SROI”) methodology.
1.2 This study has been run alongside an extension of the Cost Comparison pilot study that was published in
October 2011. It is to be read in conjunction with the Cost Comparison Extension reportB, which impacts
upon on the final conclusions of this study.
Non-Maintained and Independent Special Schools
1.3 Non-Maintained and Independent Special (“NMIS”) schools are independent of Local Authorities but over
90% of placements are paid for by Local Authorities, who have been unable to meet the needs of the
child from within their own provision. There are over 215 NMIS schools which are members of NASS (see
paragraph 2.1). Although each of these schools is unique, they are consistent in the quality of delivery of
care and education to children with disabilities and special needs. This consistency in quality is
highlighted within the eight schools included in the sample used for this study, all of which were found to
be either ‘good’ or ‘outstanding’ by Ofsted.
1.4 These schools cover a range of age groups, from pre-school children to those up to the age of 19. Some
providers have now extended their facilities to include transitional facilities up to age 25 to provide support
to adults with special needs as they transition from school into adult life. This development is consistent
with one of the aims of Support and Aspiration, the 2011 SEND Green Paper.
1.5 The needs addressed by the schools cover a range of physical, emotional and learning needs, including
young people with sensory impairments, autistic spectrum conditions, cerebral palsy, challenging
behaviours and combinations of these. Although intake can occur at any age, most commonly pupils are
referred from local authority schools after the age of 11 when mainstream, Local Authority funded schools
and special schools have ceased to be able to meet the pupil’s needs within their facilities.
A Clifford, J., Hamblin, J. and Theobald, C. (2011) National Association for Independent and Non-Maintained Special Schools: Comparative Cost
Review of Non-Maintained and Independent Special Schools with Local Authority Maintained special schools, NASS/Baker Tilly, Watford/York B Clifford, J. and Theobald, C. (2012) National Association for Independent and Non-Maintained Special Schools: Summary of findings:
Extension of the 2011 cost comparison methodology to a wider sample, NASS/Baker Tilly, Watford/York

| 7
“This school has really helped me to realise my maximum potential. I believe this is down to not only the amazing teachers and teaching, but because I don’t have nearly as much stress or worry about my life beyond the education side. I can relax and truly concentrate with my work when I need to…Had I not come here, it is unlikely that any of this would have happened, this school enables my dreams and aspirations..it has prepared me for the world beyond.” Source: case study written by a former Student
1.6 NMIS schools particularly focus on addressing the educational needs of students in terms of supporting
them to:
Access the education, both getting to the classroom, and being able to take in the lesson;
Understand the lesson;
Retain that learning;
Apply it outside the classroom, and reinforce it;
Apply the learning in different contexts; and
Change behaviours that have been a barrier to learning in the past.
1.7 Many students at NMIS schools have been
placed due to health and social care needs that
are likely to impact on their ability to access
education and then understand, retain and apply
their learning. NMIS schools seek to meet the
students’ health and social care needs in order to facilitate and support delivery against their educational
needs.
1.8 The majority of NASS member schools offer the opportunity for residential provision with the majority
offering residential provision for either 38 weeks or 52 weeks of the year, making use of the additional
time available to them to provide a fully tailored approach to education and care. These schools offer the
services, not just of teachers, but also physiotherapists, occupational therapists, speech and language
therapists and other specialists to provide the best possible care to each individual child. The residential
option also allows some short breaks for the child’s carer.
1.9 This approach allows greater choice, allowing not only the educational but also the social, emotional and
behavioural development of the students. The curriculum is designed to aid students in interaction with
others, including their families and communities, to allow them to gain as much independence as possible
and minimise their ongoing support needs on leaving statutory education.
1.10 NMIS schools have a high benchmark for ‘successful’ outcomes for their students:
Full achievement of individual education plan objectives;
Ability to make a meaningful contribution to society;
Ability to live independently (to the greatest extent possible); and
Ability to work (to the greatest extent possible).
Issues faced by Children with Special Educational Needs and Disability and their families
1.11 Young people with Special Educational Needs and Disability (“SEND”) are at risk of a number of poor life
outcomes compared to the wider population. A summary of some key findings from other research
studies is set out below
1.12 The Department of Health commissioned a national survey of people with learning disabilities in 2003/4.
The results of which were detailed in “People with Learning Disabilities in England” Emerson & HattonC
C Emerson, E. & Hatton, C. (2008), ‘People with learning disabilities in England’, Lancaster University, Centre for Disability Research
| 8
“Over the three years he was with us ‘J’ went from being a confused teenager on the brink of a prison sentence to a young man with a sound understanding of his diagnosis and how it impacted on him, his family and others around him. He has matured into a respectful, clam individual with a brighter future…with support, he found a part time job, has passed his driving test and is considering his next moves in life.” Source: case study prepared by a participating school
and provide “the most robust information available on ‘typical’ life experiences of people with learning
difficulties in England”. These results have been summarised below.
Over four in five (83%) of people with learning
disabilities of working age were unemployed.
People with learning disabilities living in
private households are much more likely to
live in areas characterised by high levels of
social deprivation. People living in private
households were also much more likely to
experience material and social hardship than
people in supported accommodation
services.
People with profound and multiple learning
disabilities were notably less likely to participate
in a range of leisure and community-based activities than people with mild/moderate or severe
learning disabilities.
Just one in five (20%) reported that they exercised three or more times a week.
1.13 Research published by New Philanthropy Capital in 2007D highlights a number of issues faced by family
members of disabled children:
84% of mothers of disabled children do not work, with 10% in part-time employment and only 3% in
full-time employment. This may be compared to part-time employment among the wider population of
mothers of 39% and 22% in full-time employment.
Families with disabled children are around four times more likely to live in poverty than the wider
population, and forty per cent of families reported problems with cold, damp and poor repair in their
house.
Mental health issues including anxiety and depression are common among carers. 32% of parents of
disabled children reported a significant level of neurotic symptoms compared to 15% of the wider
population.
Siblings of disabled children are at least two times more likely to exhibit behavioural and emotional
problems than the wider population.
1.14 The issues highlighted above that are faced by young people with SEND and their families are likely to
have significant long-term economic implications, including:
Reduced economic productivity for children and parents who are unable to work, and a related
increase in welfare benefit costs to support those families;
Poor living conditions and exercise rates may result in poor health, and, therefore, an increase in
costs of healthcare; and
D Copps, J. and Heady, L. (2007), ‘What price an ordinary life? The financial costs and benefits of supporting disabled children and their
families’, London, New Philanthropy Capital

| 9
“[Your school] made [my son] into a young man able to fit in with everybody else. He has not looked back since. If we never achieve anything else in our lives, getting him into [your school] made our lives worth while.” Source: letter from a parent
Increased risk of mental ill-health among young people with SEND and their families might be
exacerbated by a low level of social interaction and may lead to increased costs of health and social
care services.
1.15 During the course of this study, it has been
recognised that the umbrella term “SEND”
covers a wide range of conditions and needs.
Young people who fall into this broad category
have wide variations in physical, communication
and cognitive ability, and require tailored
educational provision to unlock their potential. In
some cases this may be focused upon improving
their ability to manage their own condition and to communicate their needs more effectively. For others,
this will involve supporting young people with high cognitive ability to manage a condition such that they
are able to live and work self-sufficiently and delivering education that allows them to reach their full
academic potential.
1.16 By delivering such tailored support to the group of students that they serve, NMIS schools are able to
achieve significant improvements in the quality of life for students and their families, which results in
better ability to cope with conditions and, for some, increased ability to access paid employment.
How NMIS schools achieve change
1.17 NMIS schools differentiate themselves from other provision for young people with SEND by focusing on
long term outcomes, including the ability to live independently and access education that gives them a
chance to contribute to society. They work in an holistic way, combining education with therapeutic
provision that supports each student to access the curriculum.
1.18 This approach addresses several of Ofsted’s criticisms of SEND provision which were published in 2010.
The issues raised are discussed in further detail in section 4. It is notable that the key differentiating
features of the approach taken by the NMIS schools involved in this study either address a weakness in
alternative provision or deliver on an aim that Ofsted indicated should be focused upon to deliver positive
outcomes.
1.19 NMIS schools have a high benchmark for ‘successful’ outcomes for their students:
Full achievement of personal development plan objectives;
Ability to make a meaningful contribution to society;
Ability to live independently (to the greatest extent possible); and
Ability to work (to the greatest extent possible).
1.20 The key thematic areas of change achieved by NMIS schools that emerge from this study are:
Unlocking the academic potential of students: case study evidence (a sample of which is shown as Appendix E to this report) highlights that the focus of NMIS Schools on tailoring education, therapeutic and care packages to support students to access and understand the school curriculum has supported many students to gain qualifications and progress to Further Education and Higher Education and/or access paid employment. Without this support, and, therefore, without qualifications, many students would be unable to find work. Some of the case studies included in this report highlight that students with high academic potential can be viewed as disruptive in Mainstream schools if conditions that prevent them from accessing the curriculum are ineffectively handled (often resulting in behavioural issues as students disengage).
| 10
“…[my son] gradually gained confidence to cope in social situations and began to communicate with people other than immediate family. The small classes enabled him to fulfil his academic potential.” Source: letter from a parent
Giving confidence and independence: the case studies used in this study typically highlight the impact of teaching students to be as independent as possible. Confidence and independence are vital in the development of social skills and ability to self-manage that are critical to the students’ ability to access employment and to live as independently as possible in the long term. Improving confidence is essential to overcoming mental health issues that students may be at risk of due to their other conditions, such as depression.
Understanding and ability to manage conditions: case studies used in this report highlight the work done by NMIS schools to increase the awareness of students’ of their particular conditions such that they can become better able to manage those conditions. This, too, is essential if students are to become able to live more independently. Being able to manage their condition through strategies developed with their school will help them to access employment and manage social situations, but also reduces the risk that a medical issue goes un-addressed due to a lack of awareness, allowing earlier (and cheaper) intervention. The Action Research group’s view was that ability to manage a condition would be a key factor in deciding the type of accommodation and care required by students post-education: this theme, therefore, has a potentially significant impact on the long term costs of LA care and support packages required by students.
Indirect impact on parents: parents, who often fill the role of carers for students are shown by the case study evidence obtained for this study to be at risk of various negative outcomes:
Inability to access paid employment if a student cannot be left unsupervised: by increasing the confidence, independence and ability of students to self-manage, NMIS Schools lay the foundations for parents to be able to access employment. At least one case study (see Appendix E) highlights a parent using the time while their child was at an NMIS school to gain additional qualifications in order to return to work;
Risk of health issues due to the physical strains of caring: Research has found that many carers report musculo-skeletal conditions due to their role as carer. Carers may also become focused upon the needs of the person they are caring for to the extent that they lose sight of their own needs. By increasing the students’ knowledge of and ability to manage their own condition(s), NMIS Schools release parents from some of the risks of adverse health impacts and allow a more balanced focus on their own needs.
Risk of mental health issues: research has found that carers report a high risk of mental ill-health including anxiety and depression. Parents of children with SEND are particularly likely to report neurotic symptoms. The Action Research group in this study believes that much of this risk is due to the underlying anxiety and concern for the welfare of a child and the strain of seeking to ensure that they receive appropriate provision. Feedback from parents included in Appendix E shows the relief of finding a place where their child is safe and will be given the opportunity to develop and become independent to the greatest extent possible: the alternative would be constant concern for the future of their child, leading to a high risk of mental illness.
Indirect impact on siblings: research studies have highlighted several issues faced by siblings of young people with SEND:
Risk of disengagement: whether due to parental focus upon meeting the needs of a child with SEND or disruption to family life, for example, due to violent outbursts by children with behavioural difficulties, siblings of young people with SEND have been found to be a substantially greater risk of disengaging from society. This may manifest itself in harmful (potentially criminal) behaviour and/or simply disengaging from education and going on to be long-term unemployed. NMIS schools (the majority of which offer boarding placements) relieve some of the pressures faced by the family and work with them to liaise with other agencies to ensure that adequate provision is in place for the student. One of the case studies shown in Appendix E demonstrates the impact of an NMIS school helping a student’s sibling to gain training and employment opportunities.
Risk of physical and mental health issues or injury: siblings of young people with SEND may be involved in caring, which may expose them to risks similar to those for parents. Some students with SEBD issues might be expected to have a risk of violence towards family members, including

| 11
their siblings. The Action Research group highlighted case studies of families for whom it was normal for siblings to be injured during these outbursts. NMIS Schools help students to manage their conditions, including their behaviour. Many NMIS Schools offer boarding facilities such that the risk of violence towards siblings by this group can be fully mitigated.
Approach to evaluations
1.21 This study breaks a group of students across eight participating schools into four profile categories that
reflect the expected life course outcomes for students with varying levels of cognitive ability and physical
disability. A ‘base’ life course evaluation has been created for each profile, based on research into the
expected outcomes for the group, adjusted, as necessary, to reflect the particular features of students
within that group.
1.22 It is assumed that, on average, focused intervention by an informed multi-professional team will improve
outcomes. Three alternative life course models have then been created to reflect:
The change in outcomes expected where a ‘substantial’ change is achieved;
The change in outcomes expected where a moderate change is achieved; and
The change in outcomes expected where the change achieved meets the minimum standard that a
school would expect.
1.23 The models consider the value of impacts achieved over a 20 year period post-education, which is
consistent with other similar studies.
1.24 Students at each school (new joiners in the previous twelve months) were split into profile groups by the
Action Research representative for each school. The group discussed collectively the proportions of
students for whom significant, moderate or minimum changes would be achieved. The mapping of these
models and the results derived are shown below.
Results of the evaluations
1.25 In this exercise, rather than risk an overly complicated ‘spuriously accurate’ analysis, a smaller number of
key assumptions have been identified based on research and interview evidence. We have worked with
representatives of the eight participating schools to develop a prudent result at a high level. It has been
considered important to present a more defensible, prudent analysis than one which is overly complicated
and risks overstatement.
1.26 Detailed models and commentary thereon are included as Appendices B and C to this report.
1.27 The evaluated annual benefits attributed to the cohort of 91 new joiners for the academic year ending in
August 2012, across eight participating NMIS schools may be summarised:

| 12
Profile
‘Base’ life
course
(cost)/gain
(£’000)
NMIS life
course
(cost)/gain
(£’000)
Total saving achieved
by NMIS
provision
(£’000)
Saving attributed to
NMIS schools (£’000)
Profile A (23,002) (16,469) 6,533 5,716
Profile B (25,789) (15,534) 10,255 8,204
Profile C (30,823) (19,864) 10,959 7,946
Profile D (4,097) 277 4,374 2,624
Total (83,711) (51,590) 32,121 24,490
1.28 The table above shows total benefits attributable to the participating schools from the evaluated gains in
life course outcomes for students who joined during the academic year ending August 2012 of at least
£24.5m per annum.
1.29 This study focuses solely on the life course outcomes improvement for 91 new joiners at eight schools.
The gain associated with the work done by these schools in relation to other students would, using this
approach, have been recognised in previous years. Were the total life course gain to be apportioned
across the students’ time at the school (rather than recognised at the point of entry to the school), the
annual total would be equal to that shown above (assuming that each year group contains an equal
number of students and that their tenure with the school is consistent with the five years assumed in this
study)E.
1.30 This study does not claim that NMIS schools achieve a full turnaround in the lives of the students it
serves: it recognises, prudently, that there will be, in many cases, an on-going cost of provision for LAs
associated with the long-term care of some students. It measures only the incremental impact of NMIS
provision compared to LA-Maintained provision based on outcomes that would be expected for this group
of students in the absence of NMIS schools. This study highlights that by delivering a relevant curriculum
in a way that targets the specific needs of the individual student, NMIS schools are able to achieve
substantial long-term savings to LAs relating to the long-term care of students.
1.31 The findings summarised above also highlight that students with lower complexity of need and high
cognitive ability (represented by profile D) have significant potential that, if untapped, may result in
substantial costs to the state in relation to their long-term care. Through specialist provision that helps this
group to access the curriculum effectively, this potential can be effectively released, resulting in a very
significant shift in their life course, reflected in the gain shown above. This study, therefore, highlights the
importance of delivering the right education in a timely manner, rather than assessing the need for
specialist provision based on the ability of alternative provision to ‘cope’: simply ‘coping’ with this group
may not be enough to unlock the full potential that they have.
1.32 The above gain may be set in the context of the findings of the extended cost comparison study published
by NASS and Baker Tilly in October 2012. That study found that the costs of delivery by NMIS schools
are lower than the equivalent LA-Maintained provision (i.e. for most students there is no incremental cost
of delivery in an NMIS school compared to LA provision). Given that this study seeks to evaluate the
incremental gain achieved by NMIS schools compared to LA provision, and on the basis that there is a
statutory duty to provide education for young people at age 10 to 19 (the age range of students covered
E If the £24.5m gain is apportioned equally over the assumed average tenure of five years (i.e. £4.9m per annum for each year at the school),
and then multiplied by the number of intake years present in the school (i.e. five years of intake, consistent with the tenure assumption), the
annual gain across all students in the school would be £24.5m.

| 13
by this study), there does not appear to be an incremental cost against which this gain can be set. In fact,
in many cases, there is typically a saving compared to LA provision due to the efficiencies achieved from
holistic delivery of services by a single organisation.
1.33 The benefits shown above take reasonable account of the key areas of deduction required in SROI
evaluations (three standard areas plus risk, which is also needed). The three standard ones are:
Deadweight - gains that would have happened anyway;
Alternative attribution - where part of the gain is more reasonably attributable to a partner or third party; and
Displacement - where the gain is tempered by a lesser dis-benefit.
1.34 It should be noted that this report only includes the benefits evaluated from the NMIS schools described
in this study, and therefore if all the areas of gain were evaluated the total impact would be likely to
increase.
Other outcomes not evaluated
1.35 During the course of our meetings with participating NASS schools, it has become clear that certain key
outcomes of NMIS schools could not be reliably evaluated in financial terms. The key areas of benefit that
have not been included are as follows:
Positive impacts upon parenting skills of students, which may have value for their children (particularly where their children have SEND themselves);
Positive impact upon students more than twenty years after they leave the school. Whilst the Action Research group agreed that their work may have long-lasting effects, they believe that other factors and agencies may take effect in the longer term that could influence (whether for good or bad) the longevity of changes achieved. The group felt it to be prudent to avoid over-claiming by using a life course period of twenty years post-education;
Effects on wider involvement in the workplace including improved diversity and the effects on other employees; and
Effects on grandparents and the wider family of students.
1.36 Where specific evidence exists, it has been sought to evaluate these benefits as noted in the report (e.g.
the premium assumed to the gain associated with increasing employment rates among groups at risk of
unemployment). However, it is difficult to evaluate reliably in financial terms the value of increased well-
being of certain beneficiary groups.
1.37 As this evaluation does not seek to measure the value of the further benefits listed at §6.7, the value of
these outcomes would be incremental to the value shown above. Hence the evaluations shown above are
expected to be lower than the full value of the outcomes potentially generated by the NMIS schools
included in this study.
Sensitivity Analysis
1.38 Various assumptions have been made in the course of preparing this analysis and the detailed tables of
calculations in Appendix B. To the greatest extent possible, assumptions have been validated through
interviews carried out with employees specifically intended to understand whether and to what extent a
change in certain outcomes has been achieved by the participating NMIS schools. However, some
assumptions relate to estimates made by the Action Research group in coming to the views of outcomes,
and some relate to the interpretation of information arising from other research work and statistical
analysis referenced in this work.
| 14
“I have always believed that he will get on in life, but have met with the opinion that maybe I am just another over optimistic mother. Now I have met others who believe the same as me, that he can do it.” Source: letter from a parent
1.39 In order to assess the extent to which these assumptions are material, potentially key assumptions have
been identified. Each has been subject to variation within what appears to be a reasonable range, and
the effect on the total valued outcomes under the study has been recast. The resulting analysis is shown
at Appendix D.
1.40 The sensitivities include adjustments to the success rate for interventions. Rather than adjusting
numerous individual assumptions within the profiles, the sensitivity analysis considers the impact of
moving students from higher outcome value models to lower outcome value models. It therefore captures
the impact of reducing the success of NMIS School interventions across multiple outcome measures
(notably employment rates and accommodation destinations for students).
1.41 It is notable that, due to the effects of discounting future cash flows (see Appendix G), the sensitised
variations in the length of post-education life course do not have a material effect on the conclusions from
this study. Some life course studies use a 40 year period for evaluations involving young people. As is
discussed in this report (see 4.45), the Action Research group felt that there was sufficient uncertainty
over the likelihood that other factors would influence the life course of students beyond 20 years post-
education to present a risk of over-claiming gains achieved. The sensitivity analysis shown in Appendix D
demonstrates that a change in this assumption to 40 years adds c£2.9m to the evaluated gain shown at
6.1 (i.e. an increase of 11.8%), but does not materially alter the conclusion of this study.
1.42 The conclusion from this analysis is that even if certain key assumptions are subjected to a material
change, the overall conclusion from this study (i.e. that the social return generated by NMIS schools is
significantly greater than their cost) would not be subject to change.
Conclusions from the evaluations
1.43 This study highlights not only the valuable work that NMIS schools do in achieving valuable changes in
outcomes for vulnerable people and those at high risk of unemployment and other associated issues, but
also highlights the value that is lost when people
in these groups are not effectively supported. In
particular, this study has shown that:
supporting young people to manage their own condition and express their needs more effectively may increase their independence, thereby reducing the health risks to their parents and, potentially, allowing their parents to access paid employment;
the average long-term gain per student equates to c£100k to c£600k. This reflects the positive effect of work done by NMIS schools, but also highlights the economic impact of failing to place a student in the most appropriate provision for their particular needs, which would result in economic damage of a corresponding value;
basing placement decisions on the ability of alternative provision to ‘cope’ with a student (principally in relation to behaviour) risks leaving significant potential untapped. Effective provision that encourages full access to the curriculum has very significant value that may be lost due to decisions based on narrowly applied criteria.
1.44 The totals from the evaluations shown above of at least £24.5m, highlight the importance of re-examining
the level of support that is provided to young people with SEND.
This study has been developed with real thought, care and prudence, and are soundly based on validated
underlying data, with conservative assumptions where such are necessary. It fairly represents the very
valuable contribution of the participating schools to their students, families, and, indeed, to the wider
economy.

| 15
2. Introduction
Background to NASS
2.1 NASS is a membership organisation, working for and with NMIS schools in the voluntary and private
sector, and is the only such organisation within the UK. There are now 215 schools and maintaining
organisations within the membership of NASS, representing over 6,000 children with Special Educational
Needs (“SEN”).
2.2 NASS works with these NMIS schools to provide information, support and training to its members, and in
doing so aims to improve the education of young people with special education needs or disabilities.
2.3 The aims of NASS members are to promote the high quality specialist provision of education to those with
SEN or disabilities. This means tailoring the care and education of each child such that the education
which is received is more appropriate to their needs. This can mean the use of specialist equipment,
which would not otherwise be available to them, or the provision of therapies specific to their condition. As
a result, it is believed the experience which each child is offered is more valuable, and allows them to
participate more fully in educational, community, social and daily living activities.
2.4 NASS works with a number of partnership organisation and acts as a voice for NMIS schools. It has been
involved in lobbying the government and thereby improving standards for NMIS schools. For example,
NASS was instrumental in lobbying the government to include Non-Maintained Special schools in
centrally funded initiatives, resulting in such schools now receiving over £7m per year from the
Government.
2.5 NASS also works to encourage appropriate practice and collaboration amongst its member schools
through the development of sector led good practice advice and guidance.
2.6 NASS has been a regular commentator on the implications of the 2011 SEND Green Paper “Support and
Aspiration” issued for consultation on SEN provisionF.
Background to NMIS schools
2.7 Non-Maintained and Independent Special (“NMIS”) schools are independent of Local Authority control but
over 90% of placements are paid for by Local Authorities, who have been unable to meet the needs of the
child from within their own provision. There are over 215 NMIS schools which are members of NASS (see
paragraph 2.1). Although each of these schools is unique, they are consistent in the quality of delivery of
care and education to children with disabilities and special needs. This consistency in quality is
highlighted within the eight schools included in the sample used for this study, all of which were found to
be either ‘good’ or ‘outstanding’ by Ofsted.
2.8 These schools cover a range of age groups, from pre-school children to those up to the age of 19. Some
providers have now extended their facilities to include transitional facilities up to age 25 to provide support
to adults with special needs as they transition from school into adult life. This development is consistent
with one of the aims of Support and Aspiration, the 2011 SEND Green Paper.
2.9 The needs addressed by the schools cover a range of physical, emotional and learning needs, including
young people with sensory impairments, autistic spectrum conditions, cerebral palsy, challenging
behaviours and combinations of these. Although intake can occur at any age, generally pupils are
F Department for Education (2011), ‘Support and Aspiration: A new approach to special educational needs and disability’, London, Department
for Education
| 16
referred from local authority schools after the age of 11 when mainstream, Local Authority funded schools
and special schools have ceased to be able to cope with the pupil’s needs within their facilities.
2.10 NMIS schools particularly focus on addressing the educational needs of students in terms of supporting
them to:
Access the education, both getting to the classroom, and being able to take in the lesson;
Understand the lesson;
Retain that learning;
Apply it outside the classroom, and reinforce it;
Apply the learning in different contexts; and
Change behaviours that have been a barrier to learning in the past.
2.11 Many students at NMIS schools have been placed due to health and social care needs that are likely to
impact on their ability to access education and then understand, retain and apply their learning. NMIS
schools seek to meet the students’ health and social care needs in order to facilitate and support delivery
against their educational needs.
2.12 The majority of NASS member schools offer the opportunity for residential provision with the majority
offering residential provision for either 38 weeks or 52 weeks of the year, making use of the additional
time available to them to provide a fully tailored approach to education and care. These schools offer the
services, not just of teachers, but also physiotherapists, occupational therapists, speech and language
therapists and other specialists to provide the best possible care to each individual child. The residential
option also allows some short breaks for the child’s carer.
2.13 This approach allows greater choice, allowing not only the educational but also the social, emotional and
behavioural development of the students. The curriculum is designed to aid students in interaction with
others, including their families and communities, to allow them to gain as much independence as possible
and minimise their ongoing support needs on leaving statutory education. .
2.14 NMIS schools have a high benchmark for ‘successful’ outcomes for their students:
Full achievement of personal development plan objectives;
Ability to make a meaningful contribution to society;
Ability to live independently (to the greatest extent possible); and
Ability to work (to the greatest extent possible).
Overview of Issues faced by people with Special Educational Needs and Disability
2.15 Young people with Special Educational Needs and Disability (“SEND”) are at risk of a number of poor life
outcomes compared to the wider population. A summary of some key findings from other research
studies is set out below
2.16 The Department of Health commissioned a national survey of people with learning disabilities in 2003/4.
The results of which were detailed in “People with Learning Disabilities in England” Emerson & HattonG
and provide “the most robust information available on ‘typical’ life experiences of people with learning
difficulties in England”. These results have been summarised below.
G Emerson, E. & Hatton, C. (2008), ‘People with learning disabilities in England’, Lancaster University, Centre for Disability Research

| 17
Over four in five (83%) of people with learning disabilities of working age were unemployed.
People with learning disabilities living in private households are much more likely to live in areas
characterised by high levels of social deprivation. People living in private households were also much
more likely to experience material and social hardship than people in supported accommodation
services.
People with profound and multiple learning disabilities were notably less likely to participate in a range
of leisure and community-based activities than people with mild/moderate or severe learning
disabilities.
Just one in five (20%) reported that they exercised three or more times a week.
2.17 Research published by New Philanthropy Capital in 2007H highlights a number of issues faced by family
members of disabled children:
84% of mothers of disabled children do not work, with 10% in part-time employment and only 3% in
full-time employment. This may be compared to part-time employment among the wider population of
mothers of 39% and 22% in full-time employment.
Families with disabled children are around four times more likely to live in poverty than the wider
population, and forty per cent of families reported problems with cold, damp and poor repair in their
house.
Mental health issues including anxiety and depression are common among carers. 32% of parents of
disabled children reported a significant level of neurotic symptoms compared to 15% of the wider
population.
Siblings of disabled children are at least two times more likely to exhibit behavioural and emotional
problems than the wider population.
2.18 The issues highlighted above that are faced by young people with SEND and their families are likely to
have significant long-term economic implications, including:
Reduced economic productivity for children and parents who are unable to work, and a related
increase in welfare benefit costs to support those families;
Poor living conditions and exercise rates may result in poor health, and, therefore, an increase in
costs of healthcare; and
Increased risk of mental ill-health among young people with SEND and their families might be
exacerbated by a low level of social interaction and may lead to increased costs of health and social
care services.
2.19 During the course of this study, it has been noted that the umbrella term “SEND” covers a wide range of
conditions and needs. Young people who fall into this broad category have wide variations in physical,
communication and cognitive ability, and require tailored educational provision to unlock their potential. In
some cases this may be focused upon improving their ability to manage their own condition and to
communicate their needs more effectively. For others, this will involve supporting young people with high
H Copps, J. and Heady, L. (2007), ‘What price an ordinary life? The financial costs and benefits of supporting disabled children and their famil ies,
London, New Philanthropy Capital

| 18
cognitive ability to manage a condition such that they are able to live and work self-sufficiently and
delivering education that allows them to reach their full academic potential.
2.20 By delivering such tailored support to the group of students that they serve, NMIS schools are able to
achieve significant improvements in the quality of life for students and their families, which results in
better ability to cope with conditions and, for some, increased ability to access paid employment.
Positive effects of employment on health and wellbeing
2.21 Research by McDaid, Knapp and Medeiros (2008)I highlights that employment can have a positive effect
on mental and physical health in terms of mitigating existing conditions or as a preventative. Equally,
being unemployed was found to be a potential trigger factor for mental health conditions. Poor working
environments in which employees are subject to excessive stress or other trigger factors can also have
adverse effects on the mental health of employees.
2.22 A further study for DWP in 2008J found that people who are in employment tend to be healthier and
recover more quickly from illness than those who are not. This highlights the indirect preventative value
attributable to increasing employment among a group that is at high risk of mental ill-health.
The value of NMIS schools
2.23 NMIS schools target improvements in outcomes for students that match several of the key thematic areas
that emerge from other studies, as summarised above, notably:
Full achievement of personal development plan objectives: each student at an NMIS school is set relevant targets that are related to ensuring that they achieve the best possible outcomes post-education, taking into account their level of cognitive, communication and physical ability.
Ability to make a meaningful contribution to society: NMIS schools target improving outcomes for their students such that they are able either to enter paid employment or otherwise make a positive contribution to society.
Ability to live independently (to the greatest extent possible): NMIS schools work with students to deliver an education plan that supports them to manage their own condition and communicate their needs effectively. For some, this will result in a reduced level of carer input, but for others it may result in an ability to live in an independent setting.
Ability to work (to the greatest extent possible): NMIS schools’ focus on education packages that are tailored to the needs of individual students is intended to maximise the number of their students that are able to enter paid employment (if possible). As is noted above, employment has been shown to have a strong connection to other positive outcomes including physical and mental health.
Scope and Purpose of this report
2.24 Baker Tilly has been engaged by NASS to support it in investigating the social impact of eight NMIS
schools. These are:
Inscape
Mary Hare School
Percy Hedley School
Sheiling School
Southlands College
I McDaid, D., Knapp, M., Medeiros, H. (2008), ‘Employment and mental health: assessing the economic impact and the case for intervention’,
London, Personal Social Services Research Unit J Department of Work and Pensions (2008), ‘Improving Health and Work: changing lives’, London, DWP
| 19
St Joseph’s Specialist School and College
The Wing Centre
William Henry Smith School
2.25 NASS established an Action Research group to oversee the work of the SROI evaluation, including
representatives of each school and NASS. The group was supported by Baker Tilly who applied an Action
Research methodology for gathering information on the projects in scope of this evaluation and for testing
the data assumptions. Action Research has been used as it:
a. Enables the research to stay close to the data;
b. Enables the theory – that is the answer to the research – to emerge from the data as it is gathered;
c. Promotes a cyclical revisiting of the data through the research process which promotes internal
validity and triangulation of the results: that is the data gathered and the conclusions drawn are
better tested;
d. Through encouraging the organisation itself to learn from the process of the research, its staff are
better able to embed the results and benefit from them in developing future strategy: the work can
be more useful.
2.26 Through the process of Action Research, the NASS working group and Baker Tilly produced:
An overview of social impact and other methodologies used in this work;
An analysis of the activities and outcomes of the participating schools;
An overview of how those outcomes may be measured using financial proxies;
An overview of the results of the evaluation; and
A detailed presentation of the models and assumptions used in the evaluation.
Reliance on work by participating schools
2.27 During the course of the work we have relied on information and explanations from NASS and
participating schools, including:
The nature, outcomes and beneficiaries of their activities; and
The assumptions used in evaluating the impact of their services.
2.28 Where possible, assumptions from participating schools have been validated based on independent data,
data extracted from participating schools’ management information systems or case study evidence. The
participating schools and NASS are responsible for making the assumptions used in this report, and have
confirmed that they are, to the best of their knowledge and belief, accurate and reasonable.
Aim of this report
2.29 The aim of this report is to evaluate the economic benefits generated by NMIS schools, and, where possible, to provide guidance on the use of these models and results to measure the social impact of NMIS educational provision.
| 20
2.30 The following sections of this report cover:
Section 3: An overview of the methodologies used in this study;
Section 4: an overview of the areas of the participating schools’ work covered and their associated outcomes and beneficiaries;
Section 5: an overview of the modelling approach used to evaluate the economic impact of the areas of work included in this study; and
Section 6: summary of findings and conclusions.
2.31 A detailed analysis of the evaluation models used and the assumptions and inputs to them is included as Appendix B to this report, with a sensitivity analysis included at Appendix D.
2.32 During the course of this study, it was noted that the National Audit Office has published a study entitled “Oversight of special education for learners aged 16 to 25” (November 2011), in which the NAO considered the provision given by specialist providers to learners with learning disabilities through their adult lives. It was noted that, whilst seeking to evaluate similar outcomes, this study differs from that published by NAO in two key respects:
It covers an age range that is substantially different from that considered by this study, which focuses principally on students aged 10 to 16; and
NASS believes that the types, multiplicity and complexity of student needs covered by the NAO study are likely to be of a lower order than those typically found in NMIS schools.
2.33 Hence, it is unlikely to be meaningful to compare or contrast the findings of this study with those published by the NAO.

| 21
3. Concepts and methodologies used
Social Return on Investment (“SROI”)
3.1 The SROI methodology has been developed in order to help organisations to “.[measure and quantify] the
benefits they are generating” (per Lawlor, Neizert & Nicholls writing in the SROI guide, 2008K). This
approach was piloted in the UK through the Measuring What Matters programme during 2002 and has
evolved since then as further work has been done to develop the framework around it.
3.2 It is increasingly being seen as an “incredibly useful tool”L by a number of organisations and key
commentators within the Third and Public sectors in the push to measure and evaluate social impact.
3.3 There are three ‘bottom line’ aspects of social return:
Economic: the financial and other effects on the economy, either macro or micro;
Social: the effects in individuals’ or communities’ lives that affect their relationships with each other; and
Environmental: the effects on the physical environment, both short and long term.
3.4 For this study the primary focus has been on economic and social benefits, rather than environmental
benefits, as any environmental benefits generated would appear, for NMIS schools, to be too far removed
from the intended purpose of the original services provided and appear to be too difficult to measure
reliably. Where environmental benefits arise from the work of the participating schools, the nature of the
benefit has been noted, and recorded as an unmeasured additional benefit.
3.5 The benefits of using SROI include:
Accountability: organisations are able to give both the numbers and the story that supports them;
Planning: SROI provides a change management tool to assist in the direction of resources towards the most effective services and to assess the viability of potential additional services;
Cost and time effectiveness: the measures produce an analysis of the most cost and time effective activities; and
Simplicity: impacts can be reduced to a simple comparison of the cost of funding NMIS schools and the benefits that flow from its core activities to facilitate analysis and give a clear indicator of types and ranges of success.
3.6 SROI takes total measurable outcomes, discounted to present value where the benefits occur in the
future or are recurring over a period of time, and deducts:
Deadweight: Outcomes that would have occurred regardless of the intervention;
Alternative attribution: Outcomes that arise as a result of intervention by others; and
Displacement: Outcomes that are negated or compromised by disadvantages arising elsewhere either in terms of social, economic or environmental damage.
K Lawlor, E., Neitzer, E. & Nicholls, J.. 2008. Measuring Value: a guide to social return on investment. London. New Economics Foundation L Copps, J. and Heady, L. 2010. Social Return on Investment: Position Paper, April 2010. London. NPC. From www.philanthropycapital.org
| 22
3.7 A review of academic work and practical examples of SROI in use by the public/private funded sector
suggests that the measures fall into three patterns, which have been used in this work:
a. Economic benefit created: where there is an impact on earning capacity or productivity;
b. Costs saved or not wasted: where the intervention results in a saving, either in the cost of another
intervention or in a consequential cost (e.g. introducing prevention to save on the cost of a cure).
This may be seen in either removing the need for or increasing the effectiveness of an alternative
intervention; and
c. Alternative or cheaper sourcing: where one intervention directly replaces another more expensive
one.
3.8 In identifying these benefits, a key underlying requirement is to consider not only the positive contribution
that NMIS schools make, but also the economic damage that is avoided by having them in place. Much of
our report involves the quantification of the damage to stakeholders that would result based on these
implications. By avoiding this damage, NMIS schools contribute to the economy just as meaningfully as
where the effect is an incremental benefit.
The case for political support for SROI
3.9 Further support for SROI’s adoption by the third sector has been seen in the recent report ‘Outcome-
Based Government’, published by the Centre for Social Justice (“CSJ”)M. This report considers the need
to link funding of interventions with the expected outcomes (and their associated value). It suggests that
funding should be focused on those interventions that are likely to achieve the highest value outcome:
“Improving life outcomes should be the ultimate goal of a government’s social policy: if policy makers can
better identify failing initiatives, and shift spending toward programmes that effectively deliver sustainable,
long-term outcomes, the social and financial returns to society and the public sector will be very great
indeed.”
3.10 CSJ strongly advocates a shift towards evidence-based government, in which funding decisions are
based on clear, high quality evidence of impact value, with SROI cited as a “more rigorous approach to
performance management while attempting to capture the social and environmental impacts of public
spending.”
3.11 The rationale for adopting SROI may be applied equally strongly to employers, who may rightly expect
organisations such as NASS to demonstrate that their support is delivering real value to their industry and
society as a whole.
Addressing issues concerning the use of SROI
3.12 Overall, it is felt that SROI is a vital tool to provide the public/private sector funded bodies such as Erskine
with a means to evaluate its wider contribution to Society. However, there are several issues to consider
when applying this, that are worthy of mention:
a. SROI, as it is typically presented, tends to ignore the risks associated with the benefits generated.
In the course of our work with NASS, the project representatives were encouraged to consider the
achievable benefit created, and to build in reductions to assumptions to account for risks, where
necessary;
b. A robust SROI analysis must consider the proximity of the benefit created to the actions of the
organisation that is seeking to claim ownership of that benefit. The project representatives were M Brien, S., 2011, Outcome-Based Government, London, Centre for Social Justice
| 23
encouraged to focus only on outcomes that are directly attributable to their activities and, where
necessary, obtained evidence of the link between the outcomes claimed and their activities;
c. SROI is typically presented as a ratio of the value of the benefits achieved per pound spent to
achieve those benefits. This may be useful internally to each organisation as a measure of
performance relative to prior periods. However, the use of this ratio to compare organisations is
inherently flawed due to sector and organisation-specific factors that reduce the level of
comparability between organisations. Hence, the results of this report are not presented in the form
of a ratio;
d. There is a danger that organisations seeking to evaluate their impact using SROI may create
calculations that are extremely granular to the extent that they become open to accusations of
‘spurious accuracy’. In this exercise, a smaller number of key assumptions have been identified by
the project representatives during discussions facilitated by Baker Tilly to develop a prudent result
at a high level. It is considered important to present a more defensible, prudent analysis than one
which is overly complicated and risks overstatement; and
e. SROI does not take account of the interrelationship of social impact and brand value. By creating
greater social impact, the recognition and perceived quality of an organisation’s brand is likely to
improve, thus increasing the value of that brand. In turn an entity with a stronger brand may use
that to enhance the social impact of its project work.
Research methodologies
3.13 We have worked with an SROI Project team from NASS and eight NMIS schools to carry out an Action
Research process (see Appendix A). In this a meeting with the SROI Project team was held to determine
the key activities that NMIS schools undertake, the outcomes of these activities and the beneficiaries.
Two further meetings were held, interspersed with the members of the Action Research group working in
small groups to test out the conclusions by practical application in their work, then reporting the results
back to the next meeting.
3.14 Based on this research, the SROI Project team was consulted on potential means of evaluating the
impact of these services by substituting financial measures (proxies) for the outcomes described. Data
and assumptions provided by staff at participating schools have been relied upon in our analysis; Baker
Tilly have acted to facilitate participants’ understanding of the methodologies used to evaluate the impact
but Baker Tilly are not responsible for the assumptions used in the evaluations shown in this report.

| 24
4. Overview of evaluated activities
Understanding activities of NMIS schools
4.1 The focus of this report has been on the benefits created by NMIS schools for:
Their students;
Their students’ immediate families;
Local health and social care services; and
4.2 This section presents the outcomes that participating schools believe to arise from their work. It highlights
the outcomes that would be expected for several groups of stakeholders based on findings of other
studies and the results of evidence gathers in the course of this work. It then considers the distinguishing
features of the manner in which NMIS schools operate and the difference this is thought to make to the
outcomes for each of these groups.
Differentiating factors for NMIS schools
4.3 In 2010, Ofsted conducted a reviewN of SEND provision, with the aim of understanding the issues around
quality of provision in a range of settings. Many of the reports criticisms of provision were directed
towards mainstream schools. However, the highlights a number of areas that are relevant to the approach
of NMIS schools:
N Ofsted (2010) ‘The special educational needs and disability review’, London, Ofsted

| 25
Issue How NMIS schools address this
“The keys to good outcomes were good teaching and
learning, close tracking, rigorous monitoring with
intervention quickly put in place and a thorough
evaluation of the impact of additional provision.”
NMIS schools have a strong focus on outcomes they are
seeking to deliver, with individual plans in place to support
the learning of individual students. Regular reviews are
undertaken to measure performance against these targets
and further interventions are quickly put in place, if
necessary. Teaching approaches are tailored to meet the
needs of students to ensure that quality is of the highest
possible standard.
“Across education, health and social care services, the
approaches to identification and the thresholds for
intervention were very different. This made joint working
across services difficult and led to confusion and a sense
of unfairness among parents. It multiplied the number of
assessments that some young people had to undergo, and
created different and sometimes inconsistent plans for
supporting them…The review team saw just five local areas
where a holistic view of children’s needs was taken across
children’s services and access to out-of-school provision was
part of carefully planned provision.”
NMIS schools take an holistic approach to education,
therapy and care services (particularly where placements
are residential). Departments regularly interact in order to put
educational plans in place that meet the specific needs of
each student. Assessments are carried out in-house by
specialists: upon identification of a need, delivery is put in
place as quickly as possible. This approach ensures that
interventions are complementary, well planned and
delivered in a timely manner to maximise their effectiveness.
Provision out-of-school time is co-ordinated to support the
education plan for each student, building on, amongst others,
independence skills and with therapies provided to assist
students to access the curriculum effectively.
“The best learning occurred in all types of provision when
teachers or other lead adults had a thorough and detailed
knowledge of the children and young people, a thorough
knowledge and understanding of teaching and learning
strategies and techniques as well as the subject or areas
of learning being taught; and a sounds understanding of
child development and how different learning difficulties
and disabilities influence this.”
NMIS schools employ teachers who are well-trained to plan
and deliver education to children with SEND. They are
supported by other specialists in the development of an
holistic learning and development plan that meets the
particular needs of each child. Education is therefore
founded upon a detailed understanding of the child and
their needs. NMIS schools often specialise in particular
fields (e.g. sensory impairment, BESD, Autism, Aspergers
etc.), which means that they have in-depth knowledge of
the particular issues faced by their students that their
effects on child development.
“Too often, the agencies focused simply on whether a
service was or was not being provided rather than whether it
was effective. In particular, it was not enough for pupils to
have a statement of special educational needs. The
statement itself did not mean that their current needs were
being met, but merely that they were likely to receive the
service prescribed by their original statement.”
NMIS schools target delivery to meet the needs of the
individual child based on their assessment of those needs,
rather than delivering a set of requirements prescribed by a
SEN statement. This means that NMIS schools deliver a
package that meets current needs, rather than needs that
may be out-of-date. The view of the Action Research group
was that many NMIS schools deliver interventions that
exceed the requirements of the SEN statement in order to
ensure that positive outcomes for students are
maximised.
4.4 Whilst the 2010 Ofsted review has a broad focus on SEND, the issues it raises are relevant to an
understanding of how NMIS provision addresses some of the key issues raised, and indicates some of
the drivers behind its success in achieving change for students. As is shown above, many of the success
factors identified by Ofsted are present and well developed among NMIS schools and those factors likely
to result in poor outcomes have been overcome through an informed, co-ordinated approach to education.
| 26
Outcomes achieved
Employment – parents
4.5 Employment rates among mothers of young people with SEND (assumed for this purpose to be
equivalent to employment rates among primary care givers) highlight that 84% are not in paid
employment. NPC (Copps and Heady, 2007) attribute this low employment rate principally to the need to
care for their child.
4.6 NMIS schools co-ordinate both education and other care provision including therapeutic interventions.
The education package delivered to each student is targeted at helping them to manage their condition(s)
more effectively themselves, thereby reducing the care burden placed upon primary care givers outside
school hours.
4.7 Where a student is placed in a residential NMIS school, the vast majority of the day-to-day care burden is
lifted from the primary care giver, creating the potential for them to access full-time employment.
4.8 In the longer term, the approach of NMIS schools towards teaching independence and life skills as part of
their curriculum may result in a situation that allows a parent to continue working when their child leaves
school. This may arise for a number of reasons, principally:
The independence skills taught by the NMIS school may allow a student to move into an independent or semi-independent accommodation setting; or
The student may be better able to self-care such that they can safely be left during the day (albeit with appropriate care visits).
4.9 The impact of the holistic approach taken by NMIS schools is that a primary care giver may be released
from this role during the school day to a sufficient extent that they are able to access paid employment
while their child is at school. The combination of education and therapeutic interventions targeted to
improve the independence of students may reduce their long term care requirements such that their
primary care giver is able to return to paid employment.
4.10 Clearly, some primary care givers will not be able to return to work, particularly where the nature of the
care and support needs of their child is such that, despite some improvement, constant supervision is
required.
Students - employment
4.11 NMIS schools have a focus on teaching those students that have the potential to access paid
employment the practical workplace skills that they will need. This includes coping strategies to manage
their condition(s), particularly where factors such as stress may be a trigger for behavioural or other
difficulties.
4.12 The approach of combining education with therapeutic interventions for students, particularly where a
student has a residential placement, immerses the student in an environment that encourages
independence and other vital skills. A key factor in the success of NMIS schools in supporting their
students to become employable is the teaching of coping strategies that provide an effective mechanism
for managing their condition(s) in the home and workplace.
4.13 NMIS schools deliver education packages that target allowing a student to reach their academic potential.
For some, this will include progression to Further Education and Higher Education. Others may learn
vocational skills or general workplace skills.
| 27
4.14 LA-Maintained schools may lack the specialist capabilities or staffing capacity to deliver the bespoke
education packages that students placed with NMIS schools require in order to reach their full potential.
The LA-Maintained system also lacks the holistic approach to delivering education and therapeutic
interventions in a co-ordinated way such that each supports and ties-in with the work of the other.
4.15 Where a student is placed in a residential NMIS school, the day is structured such that learning occurs
from the moment a student wakes up until their bed time. For example, meal times are typically used to
teach feeding and independence skills that are essential in later life. Specialist staff are on hand at all
times to ensure that the teaching programme is constantly reinforced for each student.
4.16 In the absence of tailored education, supported by co-ordinated therapeutic interventions, many of the
students in this group would fail to unlock their potential, or, at worst, would be left at home without a
placement in school due to a lack of capacity to meet their needs. Case study evidence gathered during
this study highlights that some students have been placed in NMIS schools having experienced disruption
from placement breakdowns in other schools or where a student has been left at home due to a lack of
specialist capabilities in the LA-Maintained sector. Following placement at an NMIS school, improvements
have been observed in communication and other skills that are vital to a successful entry to the workplace.
4.17 Other case study evidence, gathered during the 2011 Cost Comparison pilot study, highlighted examples
of students who had been prematurely or inappropriately withdrawn from NMIS provision and returned to
Mainstream or LA-Maintained special school provision. It was noted that these students experienced
deteriorations in communication and physical abilities that are so vital to increasing independence and,
therefore, ability to enter the workplace.
4.18 Some students remain in placements with NMIS schools for a shorter period before a return to LA-
Maintained or Mainstream education is possible. Several of the schools represented in this study actively
work with LAs to plan an education package that delivers coping strategies and education such that the
student is able to complete their education in an LA-funded placement, and may ultimately progress to
Further Education and Higher Education from there. The work done by the NMIS school in these cases is
to equip their students with the independence skills they need in order to access the curriculum effectively
upon their return to the LA-Maintained sector. In most cases this involves a level of intervention that the
LA-Maintained sector lacks capacity to deliver.
4.19 Some students may have high cognitive ability, but require support to manage a particular condition, such
as a sensory impairment, that inhibits their ability to access education. Some NMIS schools specialise in
delivering education to this group in a way that helps them to access the material, but also learn
approaches that help them to reach their full potential in paid employment and to overcome their
impairment. In the absence of specialist support, it is possible that the potential in this group would be
unfulfilled.
Students – accommodation and care input
4.20 The focus on developing independence has an impact upon the ongoing level of support required when a
student leaves school. Students who have been taught skills needed for self-caring are more likely to be
able to manage their conditions with a reduced level of carer input. The holistic approach to education
and therapeutic intervention ensures that students are given physical exercises and other coping
strategies that are targeted at supporting independence.
4.21 The cost comparison studies published in 2011 and 2012 by NASS highlight that NMIS schools deliver a
significant number of therapy hours to students. This is aimed at ensuring that all students are able to
access the educational material in class but also to develop communication and independence skills that
will enable them to manage themselves more effectively after they have left school.
| 28
4.22 The impact of the approach taken towards encouraging students to become as independent as possible
(see above), is expected to result in either a reduction in the level of care input required or giving the
student the ability to live independently. NMIS schools provide a unique service in this regard, in that the
alternative provision available is heavily focused on a standardised curriculum due to capacity constraints,
is not necessarily effectively connected to therapeutic interventions and relies on over-stretched health
and social care services to deliver therapies.
4.23 In the absence of appropriately tailored provision, there is a risk that education might be less relevant (or
with less provision to facilitate access to the curriculum) with a less intensive set of therapeutic
interventions. This leads to a risk that students might achieve lower quality outcomes, resulting in a failure
to achieve the potential of a student, for example, to live as independently as they could have done.
Health – parents
4.24 A previous study published by the Princess Royal Trust for Carers and Baker Tilly in 2011O highlighted
the negative effects on physical and mental health for carers if they do not receive the support they need
to continue in that role. This finding applies to parents of young people with SEND, who are at risk of
physical injury during the delivery of care to their child, but also due to a tendency of carers to focus on
the needs of the person they are caring for, allowing their own health to deteriorate.
4.25 A report published by Carers Scotland in January 2011P highlighted that 70% of carers reported back or
shoulder pain, 42% reported the development or worsening of a pre-existing medical condition after they
started caring and 82% reported feeling depression or anxiety. The findings published by NPC (Copps
and Heady, 2007) noted earlier highlight that the reported rate of neurotic symptoms among parents of
disabled children is more than double that for the wider population. Both studies demonstrate an
increased risk of physical and mental ill-health associated with caring.
4.26 NMIS schools have both short and long-term impacts on the health of parents:
Whilst the student is at school (particularly where a placement is residential), much of the caring burden is taken on by qualified staff, thereby reducing the level of physical intervention required of parents;
The Action Research group believes that a key source of anxiety for parents is that they may be aware that a placement outside the NMIS sector is unsuitable and that they feel unable to change this situation;
A placement at an NMIS school takes some of the worry away from parents, as they can be reassured that their child is receiving the best education, therapy and care possible whilst they are away from home;
In the longer term, the independence skills and coping strategies that students at NMIS schools are taught would be expected to relieve some of the pressure on carers and therefore reduce the long-term risk of anxiety and depression.
4.27 In the absence of NMIS schools, alternatives would cover education, but would not necessarily include an
holistic approach to therapeutic intervention or teaching of coping strategies and independence skills.
Such additional intervention is essential to the achievement of change for this group.
Health – students
4.28 NMIS schools aim to teach students how to manage their physical and mental health as effectively as
possible. This includes helping students to become more independent and to identify times when medical
intervention is required: on occasion helping a student to identify a need for medical help at an early
stage may prevent an escalation of the issue to require a more intensive (and costly) intervention.
OClifford, J., Mason, S. and Theobald, C. (2011) Princess Royal Trust for Carers: Social Impact Evaluation using Social Return on Invwstment,
PRTC/Baker Tilly, London/Watford P Carers Scotland (2011) ‘Sick, tired and caring: the impact of unpaid caring on health and long term conditions’, Carers Scotland, Glasgow

| 29
4.29 Some NMIS schools play a part in identifying the need for surgery or other medical treatments at a young
age as a preventative measure against higher intensity (and higher cost) interventions in later life.
4.30 The approach of NMIS schools builds a positive environment of encouraging students to reach their
potential, building their confidence and teaching them the skills they need in order to become
independent. Such confidence is essential in two respects: it builds their own self-image and enables
them, where possible, to access paid employment. Both of these factors are known to be key to
improving and upholding mental wellbeing.
4.31 The alternatives to NMIS provision do not necessarily direct time towards developing these skills, and
therefore may not achieve positive outcomes in this area.
Health – siblings
4.32 Many siblings of young people with SEND are at risk of physical and mental ill-health due to the
circumstances in which they live. Siblings may be involved in a caring role and, therefore, be exposed to
similar risk of physical injury to that noted above for parents.
4.33 In terms of their mental health, siblings of young people with SEND have at least a two-fold increased
rate of social, emotional and behavioural issues compared to the wider population (Copps and Heady,
2007). This indicates a heightened risk of mental ill-health among this group.
4.34 The Action Research group believe that a key factor behind the issues faced by siblings of young people
with SEND is the (understandable) diversion of parental attention towards the sibling with SEND and
away from others.
4.35 Another factor, particularly for students with Autism Spectrum Disorder (“ASD”) and/or Behavioural,
Emotional and Social Difficulties (“BESD”) is that violent outbursts at home risk physical injury to siblings
but may also create a traumatic home environment for siblings that results in mental health issues that
may have long-term effects.
4.36 NMIS schools provide a co-ordinated and high quality of education, therapy and care that offers peace of
mind to parents. This allows parents to balance their time between siblings, rather than being
predominantly required to focus on the child with SEND.
4.37 Residential provision at NMIS schools, when appropriate to the needs of the student, may offer further
benefits to siblings, particularly where there has been a history of violent behaviour by the sibling with
SEND. A residential placement in these circumstances may significantly reduce the risk of physical and
mental harm to siblings. Alternative provision to NMIS schools lacks capacity for residential placement
and does not necessarily teach the student coping strategies that would minimise the risk that their
condition(s) have an adverse effect upon their siblings.
Siblings – employment
4.38 Copps and Heady (2007) note that the incidence of behavioural issues among siblings of young people
with SEND is at least two times that of the wider population. The Action Research group believes that this
is due to the disruption experienced by siblings, which may include the effect of violent outbursts by their
sibling with SEND as well as the diversion of parental attention towards that child in particular.
4.39 This, in turn, creates a greater risk that the siblings of young people will feel excluded and may therefore
disengage from school and society more generally. Current unemployment rates for people aged 16 to 24
are c39%, with c17% being NEET (Not in Education, Employment or Training) in this age group.

| 30
4.40 As is noted above, provision by NMIS schools may allow a more even balance of parental attention and
has the potential to reduce disruption in the family home that the Action Research group feels is a key
cause of disengagement by siblings. Preventing disengagement is likely to reduce the risk that siblings
disengage from their education and therefore reduces the risk that they will become long-term
unemployed.
Siblings – behavioural impact
4.41 A further secondary effect of improving stability in the family home, leading to a reduction in the incidence
of behavioural issues among siblings, may be a reduction in the rate of criminal behaviour among this
group. The experience of the Action Research group suggests that behavioural issues among siblings are
likely to include some low-level criminal activity such as Anti-Social Behaviour and vandalism, amongst
others, committed principally in order to attract attention.
4.42 NMIS schools provide a service that enables parents to create a more stable family environment in which
siblings do not feel excluded, and, therefore, have less need to draw attention to themselves in this way.
Students – behavioural impact
4.43 Young people with some forms of SEND are at greater risk of being led into criminal activity by others
seeking to exploit them. Certain conditions, notably BESD, may create a higher risk of inappropriate
behaviours. The Action Research group particularly noted case study evidence of more extreme cases of
BESD leading sufferers to commit or attempt sexual offences.
4.44 NMIS schools that specialise in BESD have facilities and educational provision supported by therapeutic
intervention that is directed at supporting each student to manage and control their behaviour more
effectively. They go beyond alternative provision, which would be expected to focus on securely
containing the individual rather than encouraging them to manage and, where possible, overcome these
issues.
Outcomes excluded from this study
4.45 This study excludes the following areas for which empirical evidence of outcomes was limited or which
were felt to be too remote to be measured reliably:
Positive impacts upon children of students, who might have SEND and may benefit from some of the skills that students are taught at NMIS schools;
Positive impact upon students more than twenty years after they leave the school. Whilst the Action Research group agreed that their work may have long-lasting effects, they believe that other factors and agencies may take effect in the longer term that could influence (whether for good or bad) the longevity of changes achieved. The group felt it to be prudent to avoid over-claiming by using a life course period of twenty years post-education;
[Others]
Outcomes mapping
4.46 For the purposes of mapping outcomes in this study, we have defined ‘primary’ and ‘secondary’ outcomes.
These represent:
Primary outcomes: the outcomes that are directly attributable to the work of NMIS schools. For
example providing therapies to students that lead to an improvement in educational engagement; and
Secondary outcomes: the long term benefits from improved educational engagement include
increased employability, better communication skills and, potentially, increased ability to self-care.

| 31
4.47 This study does not include outcomes further removed from the activity than ‘secondary’ outcomes, as to
do so would be to lose proximity to the intervention that is being measured. Taking the example above,
increased productivity is likely to flow to the State either by way of taxes on personal and/or corporate
income. That increased tax revenue may then be put to use to increase other State interventions, which
in turn would create value to society. Whilst undoubtedly valuable, such outcomes are not sufficiently
proximate to the original intervention for a meaningful evaluation to be carried out. This is consistent with
the seven principles of SROI evaluation “do not over-claim”Q.
4.48 The diagram below shows a map of activities carried out by NMIS schools that differentiate them from
alternative provision, leading to primary and secondary outcomes. It also summarises the beneficiaries of
these outcomes and the broad approach to evaluation of gains achieved:
Q Cabinet Office, Office of the Third Sector. April 2009. A guide to Social Return on Investment. London. Society Media

| 32
Acti
vit
ies
Ou
tpu
tsP
rim
ary
Ou
tco
mes
Seco
nd
ary
Ou
tco
mes
Ev
alu
ati
on
of
Ou
tco
mes:
Ben
efi
cia
ries
Stu
dents
’ educational
attain
ment m
ay
impro
ve
Pro
vis
ion o
f hig
h
qualit
y e
ducation
tailo
red t
o the
needs o
f
indiv
idual
stu
dents
Pro
vis
ion o
f
board
ing f
acili
ties
for
stu
dents
Stu
dents
part
icip
ate
in
education tailo
red
to their n
eeds a
nd
abili
ties
Pare
nts
may
be a
ble
to
retu
rn to w
ork
, part
icula
rly
where
the s
tudent
accesses b
oard
ing
pro
vis
ion.
Incre
menta
l
em
plo
yment in
com
e
(pare
nts
and
stu
dents
)
Welfare
benefits
costs
avoid
ed d
ue to
incre
ased
em
plo
yment
Stu
dents
•Im
pro
ved p
hysic
al and
menta
l health
•In
cre
ased e
mplo
yment
rate
s
•In
cre
ased in
dependence
Em
plo
yment ra
tes m
ay
incre
ase for
som
e
stu
dents
.
Ou
tco
me
s M
ap
fo
r N
MIS
sch
oo
ls
Pro
vis
ion o
f
thera
peutic
inte
rventions
Stu
dents
are
taught copin
g
str
ate
gie
s to
manage their
conditio
n(s
)
Stu
dents
receiv
e a
pro
gra
mm
e o
f
thera
pie
s
specific
ally
targ
ete
d to their
indiv
idual needs
Deliv
ery
of an
holis
tic s
erv
ice t
o
meet stu
dent
needs in
-house
in a
tim
ely
manner
Stu
dents
may
be
able
to b
oard
at
the s
chool, there
by
incre
asin
g the
level of
inte
rvention
possib
le b
y t
he
school
Sib
lings e
xperience less
dis
ruption in t
he fam
ily
hom
e a
nd a
re b
etter
able
to e
ngage w
ith t
heir o
wn
education a
nd r
educin
g
the r
isk that th
ey a
lso
exhib
it d
estr
uctive
behavio
urs
in t
he s
hort
term
.
Pare
nts
’ physic
al and
menta
l health m
ay
impro
ve d
ue to the r
elie
f
of anxie
ty a
nd r
educed
need for
physic
al caring
activity w
hile
the s
tudent
is a
t school
Long term
costs
of health
and s
ocia
l care
serv
ices f
or
stu
dents
may
be r
educed
Stu
dent’s m
enta
l w
ellb
ein
g
may
be im
pro
ved e
ither
as
a r
esult o
f em
plo
yment or
as a
result o
f better
abili
ty
to s
elf-c
are
and incre
ased
confidence
Sib
lings m
ay
be less lik
ely
to d
isengage, and
there
fore
are
more
lik
ely
to
gain
em
plo
yment and less
likely
to e
xhib
it d
estr
uctive
behavio
urs
in t
he longer
term
.
Pare
nts
may
be a
ble
to
main
tain
part
or
full
tim
e
em
plo
yment in
the longer
term
once the s
tudent
leaves s
chool
Reduced h
ealth a
nd
socia
l care
costs
Reduced r
isk o
f
sib
lings b
ein
g N
EE
T
at age 1
6 to 2
4
Local N
HS
:
•R
educed c
osts
of m
edic
al
inte
rvention f
or
stu
dents
and p
are
nts
Reduced r
isk o
f
crim
inal behavio
ur
am
ong s
iblin
gs
The S
tate
:
•T
ax o
n c
orp
ora
te p
rofits
and e
mplo
yment in
com
e
arisin
g f
rom
incre
ased
econom
ic a
ctivity
of
stu
dents
, pare
nts
and
sib
lings
•R
educed w
elfare
benefits
costs
arisin
g f
rom
incre
ased e
mplo
yment
Local A
uth
orities:
•R
educed c
osts
of health
and s
ocia
l care
inclu
din
g
accom
modation
Pare
nts
of stu
dents
that
have b
ecom
e b
etter
able
to
manage their o
wn n
eeds
may
experience r
educed
risks o
f m
enta
l and
physic
al ill
-health
Reduced long
-term
accom
modation c
osts
born
e b
y LA
s for
stu
dents

| 33
4.49 A detailed review of the life course evaluation model used is included in Appendix B.
4.50 A larger version of the outcomes map diagram is included at Appendix E.
4.51 Detailed descriptions of the approaches used to evaluate the above outcomes are discussed in detail in
section 5.
Overview of evaluated outcomes
4.52 As discussed above the social impact has been determined by evaluating gains for the following key
stakeholders:
a. Students;
b. Students’ parents
c. Students’ siblings
Determining the outcomes achieved by NMIS schools
4.53 Based on discussions with the NASS Action Research group we have identified the following key areas
for financial evaluation:
Economic gains due to increased employment among the three beneficiary groups listed at 4.52;
Welfare benefits (principally unemployment and housing benefits) saved due to increased employment among the three beneficiary groups;
Reduced health and social care costs including costs of physical and mental ill-health and social care costs;
Reduced risk of students’ siblings disengaging and becoming NEET at age 16 to 24; and
Reduced costs of accommodation for students who are able to live more independently or remain at home.
4.54 As empirical evidence to support the connection between the activities of NMIS schools and the
outcomes achieved we have drawn on publicly available research (summarised in section 2) to highlight
the outcomes that might typically be expected for the beneficiary groups included in this study.
4.55 Case study evidence has been obtained to determine whether external research studies are applicable to
this group. This matter has also been discussed by the Action Research group.

| 34
5. Summary of evaluation approaches
5.1 This section provides an overview of the outcomes achieved by the NMIS schools included in this
evaluation. In conjunction with the Action Research group, it was considered how these outcomes may be
measured using the three key evaluation approaches:
Economic benefit created: for example, where there is an impact on earning capacity or productivity;
Costs saved or not wasted: where the intervention results in a saving, either in the cost of another intervention or in a consequential cost (e.g. introducing prevention to save on the cost of a cure). This may be seen in either removing the need for or increasing the effectiveness of an alternative intervention; and
Alternative or cheaper sourcing: where one intervention directly replaces another more expensive one.
5.2 As is noted in section 4, it is clear that the outcomes generated fall into five broad categories, subject to
minor variations in the nature of project-specific assumptions. These categories are:
Economic gains due to increased employment among the three beneficiary groups listed at 4.52;
Welfare benefits (principally unemployment and housing benefits) saved due to increased employment among the three beneficiary groups;
Reduced health and social care costs including costs of physical and mental ill-health and social care costs;
Reduced risk of students’ siblings disengaging and becoming NEET at age 16 to 24; and
Reduced costs of accommodation for students who are able to live more independently or remain at home.
Use of life course analysis
Introduction to life course analysis
5.3 Life course analysis seeks to compare the outcomes actually achieved against those that would have
been achieved in the absence of an intervention, measured over the life of beneficiary and stakeholder
groups.
5.4 To reflect the complexity of the group of students included in this study due to the diversity of type and
level of need, the evaluation models used consider life courses for four ‘typical’ student profiles. These
profiles are based on the outcomes that might be expected, in the absence of appropriately tailored
provision, for students at four points on the range of cognitiye and physical capacity. Students from the
latest year’s intake at each participating school have been apportioned into these profiles based on the
professional judgement of staff at the school.
5.5 It is assumed that, on average, focused intervention by an informed, multi-professional team will improve
outcomes for students who attend NMIS schools. The evaluations use case study evidence, combined
with the professional knowledge of staff at the eight schools included in the study, to allocate students to
three alternative life courses to reflect the change in outcomes achieved by appropriately tailored
provision.
5.6 The profiles and adjusted life course descriptions are set out below. Detail on the inputs to and results of
the models can be found in appendices B and C.
5.7 In this evaluation, we have used a life course analysis model, in which:
The Action Research group has identified, based on a review of issues experienced by students and their families, discussed in section 4, a number of variables that may be affected through intervention by NMIS schools.

| 35
A financial proxy has been identified for each of these outcomes based on researched data, modified, where appropriate for relevance. For example, the cost of residential care is based on the latest available unit cost data per week of Local Authority residential care. The rationale for the proxies used is discussed in detail at Appendix B.
For each of the financial proxies a probability is applied (as a percentage) to reflect the likelihood that a student or family member will be affected by each outcome (i.e. that a cost will be avoided or that a gain will be achieved). In order to reflect the differing life courses that a student may follow, four ‘base’ profiles have been used to reflect the differing needs and conditions across the population of students:
A ‘typical’ Profile A student would have the following characteristics:
– Lower cognitive ability
– Little or no expectation of the student being able to gain paid employment
– Very high probability of progression to a residential care provision
– Severe and multiple health issues result in very high expected healthcare costs (including mental health costs)
– Siblings may have a high risk of disengaging and experiencing mental health issues
– Parents may be at risk of a very high likelihood of experiencing mental and physical health issues
A typical Profile B student would have the following characteristics:
– Moderate cognitive ability (albeit, below average for the wider population)
– A small number of students will be able to access paid employment
– More will be able to progress to a semi-independent environment or remain in the family home (with appropriate care packages in place), although some will require residential care
– Medical issues result in high healthcare and mental health costs, albeit less than profile A
– Siblings may be at a higher risk of disengagement and mental health problems
– Parents may have a higher likelihood of experiencing mental and physical health issues
A typical Profile C student would have the following characteristics;
– Moderate cognitive ability (albeit, below average for the wider population)
– More of this group will be able to access paid employment, albeit still a minority
– Most will be able to remain in the family home or progress to a semi-independent setting
– Healthcare and mental health costs will be average for the wider learning disabled population (or only modestly higher)
– Outcomes for siblings are broadly in line with the average expected for the population (of siblings of children with learning disabilities)
– Parents will have a broadly average likelihood of experiencing mental and physical health problems.
A typical Profile D student would have the following characteristics;
– High cognitive ability consistent with or greater than the average for the wider population
– The majority of this group will be able to access paid employment
– The vast majority will be able to live independently or live in the family home post-education
– Healthcare and mental health costs will be below the average for the wider learning disabled population (or only modestly higher)
– Outcomes for siblings are broadly in line with the average expected for the population (of siblings of children with learning disabilities)
– Parents will have a broadly average likelihood of experiencing mental and physical health problems.
The ‘base’ models are based on research that highlights the expected outcomes for young people with SEND in the absence of intervention by an NMIS school. These are used as a starting point for comparison against life courses adjusted for the impact of intervention by NMIS schools. Three alternative life courses have been modelled to reflect the impact of NMIS school interventions:
Substantially exceeds expectations: the student exceeds many of the objectives set in their personal development plan and experiences a significant improvement in most of the outcomes used for comparison;

| 36
Moderately above expectations: the student meets the majority of the objectives set in their personal development plan, and may exceed objectives in some areas.
Meets expectations: the student meets key objectives set out in their personal development plan, but may fail to meet some objectives.
Students have been categorised based on the knowledge of representatives of the participating schools into the four profiles. Schools have then divided students into the three outcomes categories within each profile. The life courses adjusted for intervention by an NMIS school can then be compared to the ‘base’ model for each profile to derive a gain/saving due to intervention by NMIS schools compared to alternative provision.
Outcomes included in student profiles
5.8 The Action Research group has selected the following key common outcomes for measurement in each
profile;
Increased employment of parents during and after their child’s education
Improved physical and mental health of parents
Reduced risk of siblings being NEET aged 16 to 24
Improved mental and physical health of siblings
Reduced risk of harmful/criminal behaviour among siblings
Increased independence for students leading to lower levels of social care intervention
Reduced mental and physical healthcare costs due to better management of conditions
Increased employment for students
Reduced risk of harmful/criminal behaviours among students
5.9 These outcomes are applied, with adjustments for relevance, to each of the ‘base’ profiles and associated
outcomes profiles. A detailed analysis of the workings of each of the outcomes models is included at
Appendix B.
Use of student profiles
5.10 A detailed overview of the life course evaluation models used in this study is included at Appendix B. A
common life course model has been used for each of the ‘base’ profiles and the adjusted models that
reflect the impact of intervention by NMIS schools.
5.11 The Action Research group chose to use of a range of profiles to reflect the diversity of needs, conditions
and potential life courses that are represented in the population of students they serve. Research
reviewed during the course of this study tends to consider the wider population of young people with
SEND. Such studies are useful as a basis from which life course analyses may be developed, but may
not be wholly relevant to the students at NMIS schools due to reasons including:
Students at NMIS schools tend to have higher complexity or multiplicity of needs than would be expected for the broader SEND population;
NMIS schools serve students with significant variations in probable outcomes, for example a student with sensory impairment but high cognitive ability is likely to have a greater probability of being able to access Further Education and Higher Education and employment than a student with severe BESD and low cognitive ability;
NMIS schools tend to focus on specialist areas. One of the intentions of this study is to create a series of models with broad application to the wider membership of NASS. The Action Research group felt that creating a single model would be too broad for use by any one school: the use of profiles allowed each school to reflect the particular features of its own students within the results of this study by creating a different division of students between the four profiles. NASS believes that this approach gives the overall result of the study greater relevance to its wider membership than would have been achieved by a single outcomes profile.

| 37
Adjustment of student profiles for life course changes
5.12 The Action Research group reviewed each of the variables set out above for the ‘base’ profiles (i.e. the
outcomes that would be expected from alternative provision) to create a modified life course model that
reflects the outcomes that would be expected from education in an NMIS school.
5.13 Detailed analysis of the adjustments made to each profile is included at Appendix C. The Action
Research group believes that the adjustments made are reasonable and, indeed, prudent reflections of
the improvements to outcomes for students that their schools achieve.
Overview of key assumptions used
5.14 The table overleaf shows the interaction of key assumptions in the ‘base’ profile models with the adjusted
evaluation models (for students only):

| 38
Model Profile A Profile B Profile C Profile D
Base (i.e. expected
outcomes in the
absence of
intervention by NMIS
schools)
Students are unable to access employment
75% of students move on to residential care (15% semi-independent, 10% return home)
Students require three times the average physical health care interventions
60% of students require mental health interventions
Some students will have above average risk of criminal behaviour
5% of students access employment
50% of students move on to semi-independent accommodation (25% residential, 25% return home)
Students require two times the average physical health care interventions
50% of students require mental health interventions
Some students will have above average risk of criminal behaviour
10% of students access employment
50% of students move on to semi-independent accommodation (50% return home)
Students require average physical health care interventions
40% of students require mental health interventions
Some students will have above average risk of criminal behaviour
34% of students access employment
50% of students move on to semi-independent accommodation (50% live fully independently)
Students require average physical health care interventions
30% of students require mental health interventions
Students have average risk of criminal behaviour
Meets minimum
expected progress Students are unable
to access employment
75% of students move on to residential care (25% semi-independent)
Students require three times the average physical health care interventions
50% of students require mental health interventions
Some students will have above average risk of criminal behaviour
5% of students access employment
50% of students move on to semi-independent accommodation (25% residential, 25% return home)
Students require 1.5 times the average physical health care interventions
40% of students require mental health interventions
Some students will have above average risk of criminal behaviour
10% of students access employment
50% of students move on to semi-independent accommodation (50% return home)
Students require average physical health care interventions
30% of students require mental health interventions
Some students will have above average risk of criminal behaviour
34% of students access employment
50% of students move on to semi-independent accommodation (50% live fully independently)
Students require average physical health care interventions
25% of students require mental health interventions
Students have average risk of criminal behaviour

| 39
Moderate impact on
life course outcomes 5% of students
access employment
40% of students move on to residential care (45% semi-independent, 15% return home)
Students require three times the average physical health care interventions
50% of students require mental health interventions
Some students will have above average risk of criminal behaviour
15% of students access employment
50% of students move on to semi-independent accommodation (20% residential, 30% return home)
Students require 1.5 times the average physical health care interventions
40% of students require mental health interventions
Some students will have above average risk of criminal behaviour
15% of students access employment
40% of students move on to semi-independent accommodation (60% return home)
Students require average physical health care interventions
30% of students require mental health interventions
Some students will have above average risk of criminal behaviour
45% of students access employment
50% of students move back to the family home (50% live fully independently)
Students require average physical health care interventions
25% of students require mental health interventions
Students have average risk of criminal behaviour
Substantial impact on
life course outcomes 10% of students
access employment
30% of students move on to residential care (50% semi-independent, 20% return home)
Students require three times the average physical health care interventions
50% of students require mental health interventions
Some students will have above average risk of criminal behaviour
15% of students access employment
50% of students move on to semi-independent accommodation (10% residential, 40% return home)
Students require average physical health care interventions
40% of students require mental health interventions
Some students will have above average risk of criminal behaviour
17% of students access employment
30% of students move on to semi-independent accommodation (70% return home)
Students require average physical health care interventions
30% of students require mental health interventions
Some students will have above average risk of criminal behaviour
60% of students access employment
50% of students move back to the family home (50% live fully independently)
Students require average physical health care interventions
25% of students require mental health interventions
Students have average risk of criminal behaviour
5.15 The table overleaf shows the interaction of key assumptions in the ‘base’ profile models with the adjusted
evaluation models (for parents and siblings of students only, assumptions for students are shown above):

| 40
Model Profile A Profile B Profile C Profile D
Base (i.e. expected
outcomes in the
absence of
intervention by NMIS
schools)
Parental employment 13% during school, 7% thereafter
60% of parents require mental and physical health interventions
Sibling unemployment rates 2 times national average
50% of siblings have high risk of physical injury
60% of siblings are at risk of mental health issues (50% at risk of physical health issues)
Parental employment 16% during school, 16% thereafter
50% of parents require mental and physical health interventions
Sibling unemployment rates 2 times national average
40% of siblings have high risk of physical injury
50% of siblings are at risk of mental health issues (50% at risk of physical health issues)
Parental employment 16% during school, 16% thereafter
50% of parents require mental and 40% require physical health interventions
Sibling unemployment rates 2 times national average
20% of siblings have high risk of physical injury
40% of siblings are at risk of mental health issues (50% at risk of physical health issues)
Parental employment 16% during school, 16% thereafter
25% of parents require mental and 25% require physical health interventions
Sibling unemployment rates at national average
No risk to siblings of physical injury
25% of siblings are at risk of mental health issues (no risk of physical health issues)
Meets minimum
expected progress Parental
employment 35% during school, 16% thereafter
40% of parents require mental health and 30% require physical health interventions
Sibling unemployment rates 1.5 times national average
50% of siblings have high risk of physical injury
50% of siblings are at risk of mental health issues (50% at risk of physical health issues)
Parental employment 60% during school, 16% thereafter
40% of parents require mental health and 30% require physical health interventions
Sibling unemployment rates 1.5 times national average
40% of siblings have high risk of physical injury
45% of siblings are at risk of mental health issues (50% at risk of physical health issues)
Parental employment 70% during school, 16% thereafter
40% of parents require mental and 30% require physical health interventions
Sibling unemployment rates 1.5 times national average
20% of siblings have high risk of physical injury
40% of siblings are at risk of mental health issues (50% at risk of physical health issues)
Parental employment 70% during school, 70% thereafter
25% of parents require mental and 0% require physical health interventions
Sibling unemployment rates at national average
No risk to siblings of physical injury
25% of siblings are at risk of mental health issues (no risk of physical health issues)

| 41
Moderate impact on
life course outcomes Parental
employment 50% during school, 50% thereafter
40% of parents require mental health and 30% physical health interventions
Sibling unemployment rates at national average
50% of siblings have high risk of physical injury
50% of siblings are at risk of mental health issues (50% at risk of physical health issues)
Parental employment 60% during school, 60% thereafter
40% of parents require mental health and 30% require physical health interventions
Sibling unemployment rates at national average
40% of siblings have high risk of physical injury
45% of siblings are at risk of mental health issues (50% at risk of physical health issues)
Parental employment 70% during school, 30% thereafter
40% of parents require mental and 30% require physical health interventions
Sibling unemployment rates at national average
20% of siblings have high risk of physical injury
35% of siblings are at risk of mental health issues (50% at risk of physical health issues)
Parental employment 70% during school, 70% thereafter
25% of parents require mental and 0% require physical health interventions
Sibling unemployment rates at national average
No risk to siblings of physical injury
25% of siblings are at risk of mental health issues (no risk of physical health issues)
Substantial impact on
life course outcomes Parental
employment 60% during school, 60% thereafter
30% of parents require mental health and 20% physical health interventions
Sibling unemployment rates at national average
50% of siblings have high risk of physical injury
40% of siblings are at risk of mental health issues (50% at risk of physical health issues)
Parental employment 75% during school, 60% thereafter
30% of parents require mental health and 20% require physical health interventions
Sibling unemployment rates at national average
40% of siblings have high risk of physical injury
35% of siblings are at risk of mental health issues (50% at risk of physical health issues)
Parental employment 70% during school, 30% thereafter
30% of parents require mental and 20% require physical health interventions
Sibling unemployment rates at national average
20% of siblings have high risk of physical injury
30% of siblings are at risk of mental health issues (50% at risk of physical health issues)
Parental employment 70% during school, 70% thereafter
25% of parents require mental and 0% require physical health interventions
Sibling unemployment rates at national average
No risk to siblings of physical injury
25% of siblings are at risk of mental health issues (no risk of physical health issues)
5.16 Each of the 16 models reflected in the tables above use a common evaluation model. Detailed analysis of
this framework and key assumptions for the ‘base’ models is included as Appendix B to this report.
Detailed analysis of the changes made to key assumptions for the adjusted models is included as
Appendix C to this report. By comparing the sum of the outcomes achieved for the four base profiles
against the sum of the outcomes achieved under 12 adjusted evaluation models a saving/gain is derived
that arises from provision at an NMIS school compared to alternative provision.
Overview of the model results
5.17 The diagram below shows the financial evaluations for each of the four ‘base’ profiles and the adjusted
models for each profile, together with the gain/saving derived from NMIS provision:
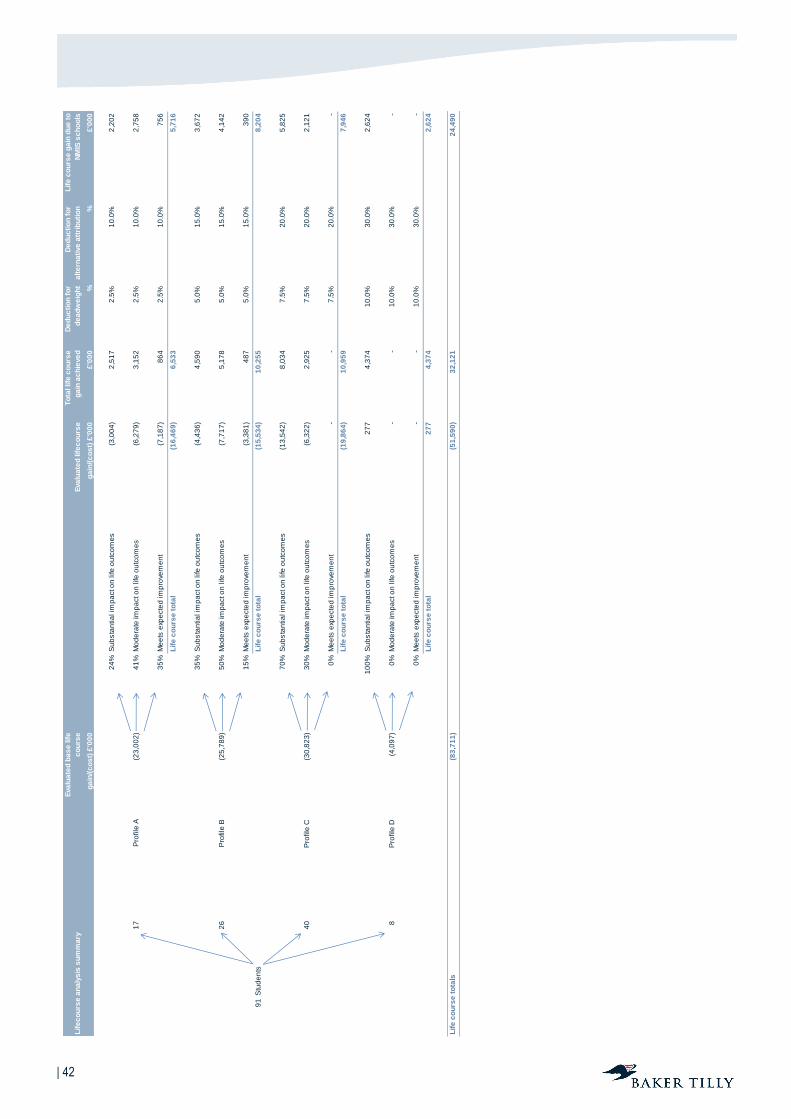
| 42
Eva
lua
ted
ba
se
lif
e
co
urs
eE
va
lua
ted
lif
ec
ou
rse
To
tal life
co
urs
e
ga
in a
ch
ieve
d
De
du
cti
on
fo
r
de
ad
we
igh
t
De
du
cti
on
fo
r
alt
ern
ati
ve
att
rib
uti
on
Lif
e c
ou
rse
ga
in d
ue
to
NM
IS s
ch
oo
ls
ga
in/(
co
st)
£'0
00
ga
in/(
co
st)
£'0
00
£'0
00
%%
£'0
00
24
%S
ub
sta
ntia
l im
pa
ct o
n life
ou
tco
me
s(3
,00
4)
2,5
17
2
.5%
10
.0%
2,2
02
17
P
rofile
A(2
3,0
02
)4
1%
Mo
de
rate
im
pa
ct o
n life
ou
tco
me
s(6
,27
9)
3,1
52
2
.5%
10
.0%
2,7
58
35
%M
ee
ts e
xpe
cte
d im
pro
vem
en
t(7
,18
7)
86
4
2.5
%1
0.0
%7
56
Lif
e c
ou
rse
to
tal
(16
,46
9)
6,5
33
5
,71
6
35
%S
ub
sta
ntia
l im
pa
ct o
n life
ou
tco
me
s(4
,43
6)
4,5
90
5
.0%
15
.0%
3,6
72
26
P
rofile
B(2
5,7
89
)5
0%
Mo
de
rate
im
pa
ct o
n life
ou
tco
me
s(7
,71
7)
5,1
78
5
.0%
15
.0%
4,1
42
15
%M
ee
ts e
xpe
cte
d im
pro
vem
en
t(3
,38
1)
48
7
5.0
%1
5.0
%3
90
91
Stu
de
nts
Lif
e c
ou
rse
to
tal
(15
,53
4)
10
,25
5
8,2
04
70
%S
ub
sta
ntia
l im
pa
ct o
n life
ou
tco
me
s(1
3,5
42
)8
,03
4
7.5
%2
0.0
%5
,82
5
40
P
rofile
C(3
0,8
23
)3
0%
Mo
de
rate
im
pa
ct o
n life
ou
tco
me
s(6
,32
2)
2,9
25
7
.5%
20
.0%
2,1
21
0%
Me
ets
exp
ecte
d im
pro
vem
en
t-
- 7
.5%
20
.0%
-
Lif
e c
ou
rse
to
tal
(19
,86
4)
10
,95
9
7,9
46
10
0%
Su
bs
tan
tia
l im
pa
ct o
n life
ou
tco
me
s2
77
4
,37
4
10
.0%
30
.0%
2,6
24
8
Pro
file
D(4
,09
7)
0%
Mo
de
rate
im
pa
ct o
n life
ou
tco
me
s-
- 1
0.0
%3
0.0
%-
0%
Me
ets
exp
ecte
d im
pro
vem
en
t-
- 1
0.0
%3
0.0
%-
Lif
e c
ou
rse
to
tal
27
7
4,3
74
2
,62
4
Lif
e c
ou
rse
to
tals
(83
,71
1)
(51
,59
0)
32
,12
1
24
,49
0
Lif
ec
ou
rse
an
aly
sis
su
mm
ary

| 43
5.18 The evaluations of the four ‘base’ profiles, which reflect the expected outcomes for students in the
absence of provision by an NMIS school, are discussed in detail in Appendix B.
5.19 The adjustments made to the ‘base’ profiles to reflect the impact of provision by NMIS schools are
discussed in detail in Appendix C.
5.20 The table above highlights a total gain before alternative attribution of £32.1m for the latest year’s intake
of students across the eight participating schools. This study considers the life course gain for new joiners
in the academic year ending August 2012. It therefore excludes gains attributable to the work of NMIS
schools for students who joined prior to 2011/12, which would be attributed to the year in which they
joined.
Adjustments for deadweight and alternative attribution
5.21 The Action Research group believes that it has adequately factored much of the deadweight element of
the evaluation into the structure of the model by deducting the ‘base’ profile life course evaluation from
the life course evaluations for NMIS school provision. However, the group recognises the ‘risk’ that some
students might exceed the expected outcomes for them due to factors including:
Cognitive capacity;
Parental commitment (including financial commitment); and
Personal determination to overcome difficulties they face.
5.22 Cognitive ability is a key factor in the achievement of a gain, being a key factor in determining the profile
into which the student will best fit. Students with higher cognitive capacity and determination to overcome
may be able, in some cases to do so. This is likely to rely heavily on the ability of their parents to provide
support. The statistics on poverty among families that have children with SEND highlighted in section 2
indicate that the financial element of this support may be beyond the reach of many families. In addition to
financial support, parents would need to help their child to access the school curriculum. The Action
Research group highlighted the likelihood that many parents may have similar SEND issues to their
children that would hinder the provision of such support.
5.23 In arriving at the deadweight assumptions, the Action Research group noted that alternative provision for
some types of SEND would be unable to cope with some students due to their educational needs or
behavioural issues. This has been accounted for in assumptions used to derive the ‘base’ profiles.
5.24 It was noted by the Action Research group that in the case of profile A and B students the majority of LA-
Maintained provision would be unable to cope with the needs of these groups, and so it is likely that they
might be excluded. For profile C and D students, it was felt to be unlikely that LA-Maintained provision
would be equipped to provide the specialist support needed to help students to access the curriculum
effectively. This is consistent with the Ofsted findings summarised earlier (see 4.3). The group has
therefore assumed that deadweight is likely to be relatively low.
5.25 The group therefore believes that deadweight is relatively low for profile A students (who would tend to
have lower cognitive ability) and higher for profile D students (who would tend to have higher cognitive
ability). Deductions have been assumed ranging from 2.5% for profile A students to 10% for profile D
students, which the Action Research group believes to be reasonable to take account of the ‘risk’ that the
evaluated gains modelled in this study might be achieved in any case.
5.26 Alternative attribution is believed by the Action Research group to be linked to the level of provision that is
offered (which determines the extent of external influence on outcomes). The participating schools do not

| 44
work in collaboration with other agencies to deliver education to their students. LAs maintain a role in
monitoring provision, principally through visits by assigned social workers. These visits were felt to be
insufficiently frequent to have a material influence on outcomes. The key deduction for alternative
attribution is, therefore, in respect of the contribution families make to outcomes. This has been
accounted for by:
Reviewing the expected nature of provision for each profile: profile A students are more likely to be in 52 week or term-time boarding provision, with profile D students more likely to be in weekly boarding or day-only provision. This is due to the nature of their needs; and
An adjustment for alternative attribution is based on the level of contact with the family that a student may have. This assumes that families will seek to reinforce the skills that have been taught in school. The Action research group believes that this may be prudent as some families may lack the skills to reinforce the curriculum at home.
5.27 Hence, deductions for alternative attribution ranging from 10% (profile A where students would tend to be
residential) to 30% (profile D where students would tend to be day-only or short-term boarding) are
believed by the Action Research group to be reasonable.
Gain attributed to NMIS schools
5.28 The evaluation models summarised above demonstrate a gain, after deducting deadweight and
alternative attribution, of £24.5m per annum due to the work of the eight participating NMIS schools.
5.29 This equates to a gain of c£100k to c£600k per student over a 25 year period (based on five years at
school with a 20 year life course analysis thereafter), depending on the profile and level of outcome
achieved. Gains are measured (where applicable) for parents and siblings during and after the student’s
school attendance. Gains for students are measured over a twenty year period after school attendance
(assuming an average time at school of 5 years).

| 45
6. Conclusion
Results of this evaluation
6.1 Based on the results of our discussions with NASS and participating NMIS schools, as summarised in
section 5 and the results of the evaluation models (Appendix B), the evaluated benefits of the
participating NMIS schools may be summarised:
Profile
‘Base’ life
course
(cost)/gain
(£’000)
NMIS life
course
(cost)/gain
(£’000)
Total saving achieved
by NMIS
provision
(£’000)
Saving attributed to
NMIS schools (£’000)
Profile A (23,002) (16,469) 6,533 5,716
Profile B (25,789) (15,534) 10,255 8,204
Profile C (30,823) (19,864) 10,959 7,946
Profile D (4,097) 277 4,374 2,624
Total (83,711) (51,590) 32,121 24,490
6.2 The table above shows total benefits from the evaluated gains attributed to the eight participating NMIS
schools to be at least £24.5m per annum.
6.3 This study does not claim that NMIS schools achieve a full turnaround in the lives of the students it
serves: it recognises, prudently, that there will be, in many cases, an on-going cost of provision for LAs
associated with the long-term care of some students. However, this study does highlight that by delivering
a relevant curriculum in a way that targets the specific needs of the individual student, NMIS schools are
able to achieve substantial long-term savings to LAs relating to the long-term care of students.
6.4 The findings summarised above also highlight that students with lower complexity of need and high
cognitive ability (represented by profile D) represent significant potential that, if untapped, results in
substantial costs to the state in relation to their long-term care. Through specialist provision that helps this
group to access the curriculum effectively, this potential can be effectively tapped, resulting in a very
significant shift in their life course, reflected in the gain shown above. This study, therefore, highlights the
importance of delivering the right education in a timely manner, rather than assessing the need for
specialist provision based on the ability of alternative provision to ‘cope’: simply ‘coping’ with this group is
not enough to unlock the potential that they have.
6.5 The above gain may be set in the context of the findings of the extended cost comparison study published
by NASS and Baker Tilly in October 2012. That study found that the costs of delivery by NMIS schools
compare favourably with LA-Maintained provision (i.e. for most students there is no incremental cost of
delivery in an NMIS school compared to LA provision). Given that this study seeks to evaluate the
incremental gain achieved by NMIS schools compared to LA provision, there does not appear to be an
incremental cost against which this gain can be set. In fact, in many cases, there is typically a saving
compared to LA provision due to the efficiencies achieved from holistic delivery of services by a single
organisation.

| 46
6.6 It should be noted that this report only includes the benefits evaluated from the NMIS schools described
in this study, and therefore if all the areas of gain were evaluated the total impact would be likely to
increase.
Other outcomes not evaluated
6.7 During the course of our meetings with the Action Research group, it has become clear that certain key
outcomes achieved by NMIS schools could not be reliably evaluated in financial terms. The key areas of
benefit that have not been included are as follows:
Positive impacts upon parenting skills of students, which may have value for their children (particularly where their children have SEND themselves);
Positive impact upon students more than twenty years after they leave the school. Whilst the Action Research group agreed that their work may have long-lasting effects, they believe that other factors and agencies may take effect in the longer term that could influence (whether for good or bad) the longevity of changes achieved. The group felt it to be prudent to avoid over-claiming by using a life course period of twenty years post-education;
Effects on wider involvement in the workplace including improved diversity and the effects on other employees; and
Effects on grandparents and the wider family of students.
6.8 Where specific evidence exists, we have sought to evaluate these benefits as noted in the report (e.g. the
premium assumed to the gain associated with increasing employment rates among groups at risk of
unemployment). However, it is difficult to evaluate reliably in financial terms the value of increased well-
being of certain beneficiary groups.
6.9 As this evaluation does not seek to measure the value of the further benefits listed at §6.7, the value of
these outcomes would be incremental to the value shown above. Hence the evaluations shown above are
expected to be lower than the full value of the outcomes potentially generated by the participating NMIS
schools.
Sensitivity Analysis
6.10 Various assumptions have been made in the course of preparing this analysis and the detailed tables of
calculations in Appendix B. To the greatest extent possible, assumptions have been validated through
interviews carried out with employees specifically intended to understand whether and to what extent a
change in certain outcomes has been achieved by the participating NMIS schools. However, some
assumptions relate to estimates made by the Action Research group in coming to the views of outcomes,
and some relate to the interpretation of information arising from other research work and statistical
analysis referenced in this work.
6.11 In order to assess the extent to which these assumptions are material, potentially key assumptions have
been identified. Each has been subject to variation within what appears to be a reasonable range, and
the effect on the total valued outcomes under the study has been recast. The resulting analysis is shown
at Appendix D.
6.12 The sensitivities include adjustments to the success rate for interventions. Rather than adjusting
numerous individual assumptions within the profiles, the sensitivity analysis considers the impact of
moving students from higher outcome value models to lower outcome value models. It therefore captures
the impact of reducing the success of NMIS School interventions across multiple outcome measures
(notably employment rates and accommodation destinations for students).
6.13 It is notable that, due to the effects of discounting future cash flows (see Appendix G), the sensitised
variations in the length of post-education life course do not have a material effect on the conclusions from

| 47
this study. Some life course studies use a 40 year period for evaluations involving young people. As is
discussed in this report (see 4.45), the Action Research group felt that there was sufficient uncertainty
over the likelihood that other factors would influence the life course of students beyond 20 years post-
education to present a risk of over-claiming gains achieved. The sensitivity analysis shown in Appendix D
demonstrates that a change in this assumption to 40 years adds c£2.9m to the evaluated gain shown at
6.1 (i.e. an increase of 11.8%), but does not materially alter the conclusion of this study.
6.14 The conclusion from this analysis is that even if certain key assumptions are subjected to a material
change, the overall conclusion from this study (i.e. that the social return generated by NMIS schools is
significantly greater than their cost) would not be subject to change.

| 48
Appendices

| 49
A. Notes on Action Research
Action Research, or Action Science as some, including GummersonR prefer to call it, is a recognised and respected
research approach originating in the social sciences arena, which involves the researcher and the researched
jointly learning in and investigating the research area. Whilst primarily a qualitative methodology, it can be
constructed in such a way as to gather and test data with levels of validity that would constitute scientific research
(as opposed to casual enquiry) whilst retaining the proximity to that data that best comes from working with those
who are involved with it.
The researcher works with the researched jointly to investigate an issue of common interest. Together they gather
data, test and validate it, and draw interpretations and conclusions from it.
Action research is hence an iterative research methodology that is intended to bridge the gap between theoretical
research and the practical realities of the real world. As Gustavsen puts it:
“The point is to understand the world as it is by confronting it directly; by trying to grasp the phenomena as they
really are.S”
Reason and Bradbury (2001) define Action Research as “a participatory, democratic process concerned with
developing practical knowing in the pursuit of worthwhile human purposes, grounded in a participatory worldview...
It seeks to bring together action and reflection, theory and practice, in participation with others, in the pursuit of
practical solutions to issues of pressing concern to people, and more generally the flourishing of individual persons
and their communities.” (2001, p.1).
In simplistic terms, Action Research is collectively learning from experience by sharing that experience with others
and taking action to bring about change by building on that experience.
In our work with NASS, it has been vital that an understanding was gained, not just of how its members’ activities
could theoretically be benefiting the local area, but of how they create benefit in practice. Theoretical research on
SROI methodologies gives us a view on where the benefits may lie, but only through an iterative process of
discussing, developing and refining our understanding can a true picture be obtained of where the benefits of NMIS
schools’ activities actually lie.
The process of conducting Action Research may be summarised using the diagram shown below:
R Gummerson, E. 2000, Qualitative Methods in Management Research. 2nd Ed. Thousand Oaks, Ca. Sage Publications S ‘New Forms of Knowledge Production and the Role of Action Research’, Bjorn Gustavsen, Action Research 2003; volume 1 at p.153

| 50
The diagram shows an iterative five stage approach to Action Research. The way in which our approach fits with
this model is described as follows:
1. Observation: from our initial discussions with NASS, it is clear that a lack of understanding of the
Social Impact of NMIS schools may weaken their position when negotiating with funders or partners,
potentially damaging its ability to continue its work;
2. Reflection: by using Social Impact measurement tools such as SROI, it is believed that it is possible
to begin to increase the understanding of the benefits NMIS schools generate among key
stakeholders;
3. Data gathering: the work done by NMIS schools was discussed with a team of representatives from
eight participating NMIS schools. The outcomes they achieve were then identified, along with the key
beneficiaries. A range of possible methods of evaluating these services were discussed using the
three models described at §3.7 of this report to cover the concept of value from the perspective of all
key stakeholders;
4. Test claims and conclude: many of the assumptions used in the evaluation models (Appendix B)
are based on data gathered from the participating schools’ management information systems and
from case study evidence. Copies of the supporting records for such data were obtained. Where, an
assumption was required, the Action Research group were encouraged to be prudent in order to
avoid overstating benefits. In some cases, assumptions have been informed by data from external
sources combined with the use of judgement. Copies or records of any research were obtained;
5. Monitor improvements: it is hoped that this work will result in improved awareness of the value of
NMIS schools’ activities among stakeholders (including funders and commissioners), and therefore
address the risks identified at stage 1 of the process.
Having reached a stage where an improvement is expected, the iterative nature of Action Research allows for
further studies to be carried out in future to build on the work presented in this report, including ongoing
measurement of benefits and the use of similar methodologies to assess proposed future projects.
Clearly, wherever data already exist to quantify a benefit, they are to be used. However, the absence of observed
data, Action Research allows us to gain an accurate perspective on the real benefits that are generated. In some
cases it will be impossible to observe the impact, as to do so would require a comparison between a world in which
| 51
NMIS schools exist and one in which they do not, all other factors being equal. Clearly such comparison will never
be possible, and so reliance must be placed on the common-sense and judgment of the Action Research group,
based on their real-world experience.
Where data may be, but is not currently, observed, our work allows us to refine the list of useful data that may be
gathered in future as a basis for refining the measurement of the economic benefit that is generated. This project
may therefore act as a platform for identifying further Action Research projects that will develop detailed
measurement tools.
Any outline of a research methodology would be incomplete without looking at broader criticisms of it in
management science circles. Criticisms of action research are several, but most emanate from proponents of
statistical sampling and questionnaire-based research methodologies. In brief, these tend to surround the following
areas, each of which is shown with a brief response related both to theory and to this research in particular.
How can you assert validity when all the data is of internal origin?
Bypassing the theoretical debates about the validity of different data sources and the extent to which all are, to
some degree, partly objective and partly partisan, the key point here is that the data is not all of internal origin.
Many of the measurement criteria within the financial proxies are:
from publicly available data sources, often validated Government data;
from appropriately structured pilot studies;
from research appropriately undertaken by the subjects’ own research team; or
separately sense-checked or reviewed by the research team.
It is not true research because the researcher influences, and is involved in the outcome....?
It is true that the researcher is involved in the sense that “the action researcher... may help clients make more
sense of their practical knowledge and experience...”T.
This is consistent with the second of the seven principles of SROI: Measurement with people.
If the researcher facilitates the better collection and interpretation of data from the researched and leaves them with
an understanding and knowledge to enable them to embed that in future action, then this active involvement must
be seen as a virtue and not a weakness. It improves the understanding of data gathered and at the same time,
seeks to embed the results in the organisations (the final stage of the SROI process).
BergU summarises the strengths of action research in these fields as follows:
“a highly rigorous, yet reflective or interpretative, approach to empirical research;
the active engagement of individuals...in the research enterprise;
the integration of some practical outcomes related to the actual lives of participants in this research project;
a spiralling of steps...”.
T Gill, J. And Johnson, P. 2002. Research Methods for Managers. 3rd Ed. London, Sage. p.92. U Berg, B. 2009. Qualitative Research Methods for the Social Sciences. 7th Ed. Upper Saddle River, NJ. Pearson. .248.

| 52
It has been found, in this study and other similar ones, that Action Research provides an ideal foundation approach
for developing a Social Impact Evaluation and embedding it in the organisation.

| 53
B. Student Life Course profiles
A series of ‘base’ profiles have been created by the Action Research group to reflect the value or cost of life course
outcomes for students in four categories (see 5.3 for descriptions of student characteristics within each profile).
These ‘base’ models reflect the expected outcomes for students in the absence of intervention by NMIS schools.
The profiles have been prepared by the Action Research group based on findings of external research studies and
their knowledge of case study evidence from their own schools.
This appendix includes:
A detailed outline of the workings of the profile model. A common model has been used (with adjustments to key assumptions) for all base profiles as well as the adjusted models to show the impact of intervention by NMIS schools. The adjustments made to each profile are set out in Appendix C.
An overview of the sources of data and evidence used for each outcome; and
Detail on the variations made to each profile.
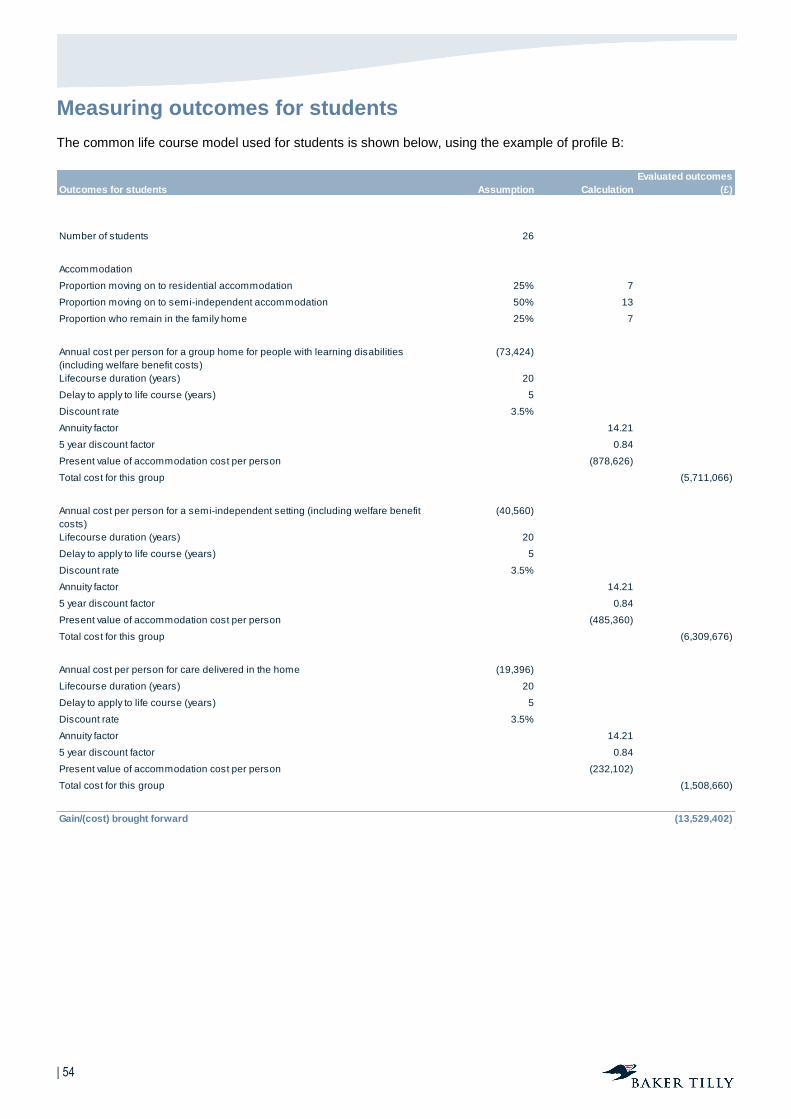
| 54
Measuring outcomes for students
The common life course model used for students is shown below, using the example of profile B:
Outcomes for students Assumption Calculation
Evaluated outcomes
(£)
Number of students 26
Accommodation
Proportion moving on to residential accommodation 25% 7
Proportion moving on to semi-independent accommodation 50% 13
Proportion who remain in the family home 25% 7
Annual cost per person for a group home for people with learning disabilities
(including welfare benefit costs)
(73,424)
Lifecourse duration (years) 20
Delay to apply to life course (years) 5
Discount rate 3.5%
Annuity factor 14.21
5 year discount factor 0.84
Present value of accommodation cost per person (878,626)
Total cost for this group (5,711,066)
Annual cost per person for a semi-independent setting (including welfare benefit
costs)
(40,560)
Lifecourse duration (years) 20
Delay to apply to life course (years) 5
Discount rate 3.5%
Annuity factor 14.21
5 year discount factor 0.84
Present value of accommodation cost per person (485,360)
Total cost for this group (6,309,676)
Annual cost per person for care delivered in the home (19,396)
Lifecourse duration (years) 20
Delay to apply to life course (years) 5
Discount rate 3.5%
Annuity factor 14.21
5 year discount factor 0.84
Present value of accommodation cost per person (232,102)
Total cost for this group (1,508,660)
Gain/(cost) brought forward (13,529,402)

| 55
Outcomes for students Assumption Calculation
Evaluated outcomes
(£)
Gain/(cost) brought forward (13,529,402)
Healthcare
UK population aged 18 to 65 39,481,800
Proportion of the population with a learning disability 2%
Therefore number of people aged 18 to 65 with a recorded learning disability 789,636
Proportion experiencing an emergency admission each year 0.2%
Proportion attending outpatient appointments each year 7.0%
Proportion experiencing an inpatient admission each year 1.4%
Cost per emergency event leading to inpatient admission (1,086)
Weighted average cost per inpatient admission (686)
Weighted average cost per outpatient event (171)
Therefore average cost per person (24)
Adjustment factor for this group 2.0 (47)
Expected number of GP contacts per annum 18.0
Cost per GP appointment (96)
Therefore GP cost per person (1,723)
Healthcare cost per annum (46,012)
Lifecourse duration (years) 20
Delay to apply to life course (years) 5
Discount rate 3.5%
Annuity factor 14.21
5 year discount factor 0.84
Present value of healthcare costs (550,601)
Mental health
Proportion of siblings experiencing mental health issues including neurotic
symptoms
50%
Annual cost of mental health issues in the UK for 18 to 65 year olds (£) (105,200,000,000)
UK population aged 18 to 65 39,481,800
Proportion of the wider population expriencing mental health issues 25%
Average impact per case per annum (10,658)
Reduction to apply to national average -25%
Annual cost of mental health issues per person affected (7,994)
Total annual cost of mental health issues among this group (103,916)
20 year discount factor 14.21
Total present value of mental health costs (1,476,899)
Employment
Estimated employment rate among this group 5.0%
Average UK per capita GVA (£) 20,476
Annual productivity of students post-education 26,619
Duration to measure (years) 20
Delay to apply to life course (years) 5
Discount rate 3.5%
Annuity factor 14.21
5 year discount factor 0.84
Total present value of productivity 318,533
Risk of criminal behaviours
Estimated offending rate among 18 to 21 year olds 2.5%
Adjustment factor for this group 10.0 25%
Average annual cost per crime for this group (4,056)
Annual cost of crime for this group (26,364)
20 year annuity factor 14.21
5 year discount factor 0.84
Total present value of costs of crime for this group (315,484)
Total impact on students (15,553,853)

| 56
Key non-variable assumptions and sources of information
Accommodation type post-education: representatives of the eight participating schools have discussed likely
destinations of students for each profile, based on the features of students in that profile. Their assumptions are
based upon case study evidence and their own experience of student destinations at their schools. It is assumed,
for the purposes of this study, that students will be placed in the most appropriate care setting based on their needs.
Costs of accommodation: cost data has been derived from the Personal Social Services Research Unit report on
Unit Costs of Health and Social Care 2011V, based on the costs of LA care provision.
Number of healthcare interventions: Emerson and Hatton (2008) found that 0.2% of the population with learning
disabilities experienced an emergency admission each year, with 7% attending outpatient appointments and 1.4%
experiencing an inpatient admission each year (i.e. 8.6% of the population access hospital interventions). The
Action Research group has reviewed and adjusted each profile to reflect the expected positioning of students in
each profile relative to this broad average, with it in mind that students in NMIS schools would tend to have above
average multiplicity and complexity of needs. This is reflected in an adjustment factor within each profile model.
In addition to hospital interventions, the Action Research group has assumed the level of General Practitioner
(“GP”) intervention, based on the number of appointments that might be expected per annum for a student in each
profile.
Annual cost of healthcare interventions: cost data has been derived from the Personal Social Services Research
Unit report on Unit Costs of Health and Social Care 2011W
, based on the costs of hospital admissions and GP
appointments (including prescription costs).
Rate of mental health issues: given the complexity of physical and mental health issues experienced by students
with SEND, the Action Research group believes it is difficult to distinguish a specific mental health condition from
other conditions. However, the group felt that many students would experience some form of mental health issue
as a consequence of their learning and/or physical disabilities. Research carried out by the Foundation for People
with Learning Disabilities indicates a rate of mental ill-health among this group of up to 40%. The Action Research
group has used a rate of 40% to 60% on the basis that profiles A and B represent those students with the very
highest complexity of need, which is assumed to equate to an above average risk of mental ill-health.
Costs of mental health issues: Research published by the Centre for Mental Health indicates a total cost to the UK
of c£105.2bn per annum from costs of treatment and lost productivity due to mental health issues among the
population aged 18 to 65X. The UK population in this age group is 39.5 million
Y. NHS statistics indicate that 25% of
the population may be expected to experience some form of mental ill-health at any timeZ. From this an average
cost per individual can be estimated at £10,658 per annum (i.e. £105.2bn ÷ 39.5m x 25% = £10,658). The action
research group has used this average for profile A, given that this cohort may be expected to experience issues of
at least average severity. Profiles B, C and D have adjusted this downwards by 25% to 50% for prudence to reflect
the likelihood that conditions for the majority of the groups in question may be of below average severity.
Employment: Emerson and Hatton (2008) found an unemployment rate among people with learning disabilities of
83%. The Action Research group has used this as a starting point for adjustments to reflect the expected life
courses for students within each profile. For example:
A student in profile A was expected to be very unlikely to be able to access employment due to the complexity of their particular needs; whereas
V Curtis, L. (2012) ‘Unit Costs of Health and Social Care 2011, Canterbury, University of Kent W Curtis, L. (2012) ‘Unit Costs of Health and Social Care 2011, Canterbury, University of Kent X http://www.centreformentalhealth.org.uk/pdfs/Economic_and_social_costs_2010.pdf Y Source: ONS Z Source: http://www.mentalhealth.org.uk/help-information/mental-health-statistics/

| 57
Many students in profile D may have access to employment broadly consistent with that expected for the wider population of people with SEND.
In order to account for this variation, employment rates of 0% to 38% have been used.
Value of productivity: Productivity has been measured using national average Gross Value Added (“GVA”) of
£20,476AA
.
Risk of criminal behaviours: Research by the Prison Reform TrustBB
highlights that 3% of the population with a
physical or learning disability are currently in prison compared to 0.2% of the wider population. This implies a 15
times greater risk that a person with SEND will become involved in harmful or criminal activity. Research by the
Prince’s TrustCC
highlights that 205,591 convictions for 18 to 21 year olds were recorded in the UK during 2010.
Given that the population of this age group is 3,281,400DD
, an offending rate of 6.3% may be calculated. The Action
Research group has used a crime rate for the wider population of 2.5%, for prudence, given that the 15 times risk
adjustment factor discussed above is then applied to give a 38% risk of criminal activity. This measure takes into
account the likelihood that criminal activity would be concentrated among a small number of regular offenders, and
is not intended to reflect a widespread issue among the population.
Cost per crime: this is derived from research published by the Prince’s Trust (McNally and Telhaj, 2010), which
indicates an average cost of £4,056 per crime.
Duration of measurement: A life course duration of 25 years has been used in this study, commencing at the point
when the student joins an NMIS school, and assuming a stay at the school of five years followed by a 20 year
period post-education. The Action Research group believes that this assumption reasonably reflects the duration
over which a school might influence outcomes without risking over-claiming by considering a longer timescale
during which other factors may erode those outcomes.
Discount rate: A discount rate of 3.5% has been used, which equates to:
The average rate of inflation in the UK measured over the past twenty years, per the Bank of England;
The discount rate typically used by the UK Government for project appraisal (for projects lasting for between 0 and 30 years); and
Current UK Government Stock (GILT) rates, which are typically viewed as a measure of ‘risk free’ return.
Further detail on discounted cash flow methodology is included at Appendix G. Where an outcome is delayed until
after education, the present value of outcomes achieved over the 20 years post-education is discounted by a
further five years to the point at which the student joined the school.
Detail of variable assumptions used in the ‘base’ profile models is included later in this appendix.
AA Source: ONS data BB Talbot, J. (2010) ‘Seen and Heard: supporting vulnerable children in the youth justice system, Prison Reform Trust, London CC McNally, S. and Talhaj, S. (2010) ‘The cost of exclusion: counting the cost of youth disadvantage in the UK, Prince’s Trust, London DD Source: ONS data

| 58
Measuring outcomes for students’ parents
The common life course model used for students’ parents is shown below, using the example of profile B:
Outcomes for parents Assumption Calculation
Evaluated outcomes
(£)
Number of students 26
Employment (during education)
Proportion of primary care givers accessing part-time employment 13%
Proportion of primary care givers accessing full-time employment 3%
Average UK per capita GVA (£) 20,476
Annual productivity of primary care givers (£) 50,576
Duration to measure (years) 5
Discount rate 3.5%
Annuity factor 4.52
Total present value of productivity 228,352
Welfare benefits (during education)
Proportion of primary care givers working less than 16 hours per week 84%
Level of income support per annum (£) (3,692)
Housing benefit per annum (£) (15,080)
Annual welfare benefits cost (409,980)
5 year annuity factor 4.52
Total present value of welfare benefit costs (1,851,083)
Employment (post education)
Proportion of primary care givers accessing part-time employment 13%
Proportion of primary care givers accessing full-time employment 3%
Average UK per capita GVA (£) 20,476
Annual productivity of primary care givers (£) 50,576
Duration to measure (years) 20
Delay prior to measurement 5
Discount rate 3.5%
Annuity factor 14.21
5 year discount factor 0.84
Total present value of productivity 605,212
Gain/(cost) brought forward (1,017,519)

| 59
Key non-variable assumptions and sources of information
Employment rates: research by NPC (Copps and Heady, 2007) highlights that, on average, 13% of mothers of
children with SEND are in part-time employment, with 3% in full-time employment. This has been used as a starting
point from which adjustments have been made to each profile.
Productivity: Productivity has been measured using national average Gross Value Added (“GVA”) of £20,476EE
.
Post-education: a distinction is made in the model between employment for primary care givers during and after the
student’s education. There is an implicit logical connection between the proportion of students cared for in the
family home and the proportion of primary care givers who are able to access paid employment, which has been
taken into account by the Action Research group when making adjustments to the models. Variations in ‘base’
profile model assumptions are discussed later in this appendix.
Welfare benefits: For those primary care givers who do not access paid employment, the model includes a benefit
cost based on current income support and housing benefit ratesFF
of £71 per week and £290 per week respectively.
EE Source: ONS data
Outcomes for parents Assumption Calculation
Evaluated outcomes
(£)
Gain/(cost) brought forward (1,017,519)
Welfare benefits (post education)
Proportion of primary care givers working less than 16 hours per week 84%
Level of income support per annum (£) (3,692)
Housing benefit per annum (£) (15,080)
Annual welfare benefits cost (409,980)
20 year annuity factor 14.21
5 year discount factor 0.84
Total present value of welfare benefit costs (4,906,016)
Physical health
Proportion of primary care givers experiencing physical health problems
attributable to the impact of caring for a disabled child
50%
Number of additional GP visits created per annum 6
Cost per additional GP visit (96)
Annual cost of physical health issues (7,465)
20 year discount factor 14.21
Total present value of physical health costs (106,090)
Mental health
Proportion of primary care givers experiencing mental health issues including
neurotic symptoms
50%
Annual cost of mental health issues in the UK for 18 to 65 year olds (£) (105,200,000,000)
UK population aged 18 to 65 39,481,800
Proportion of the wider population expriencing mental health issues 25%
Average impact per case per annum (10,658)
Reduction to apply to national average -60%
Annual cost of mental health issues per primary care giver affected (4,263)
Total annual cost of mental health issues among primary care givers (55,422)
20 year discount factor 14.21
Total present value of mental health costs (787,680)
Total lifecourse cost for parents/primary care givers (6,817,304)

| 60
Physical health: the proportion of primary care givers experiencing physical health issues as a result of their caring
role is subject to variation for each student profile (see later). It is assumed that a physical health issue would
equate to at least six additional GP visits per annum. GP costs are derived from unit costs data (Curtis, 2012) for
GP appointment and prescription costs. The Action Research group believe this measure to be prudent, given that
physical issues associated with caring may require substantially higher levels of intervention, for example back
injury or escalation of other conditions such as diabetes.
Mental health: Research published by the Centre for Mental Health indicates a total cost to the UK of c£105.2bn
per annum from costs of treatment and lost productivity due to mental health issues among the population aged 18
to 65GG
. NHS statistics indicate that 25% of the population may be expected to experience some form of mental ill-
health at any timeHH
. The UK population in this age group is 39.5 millionII. From this an average cost per individual
can be estimated at £10,658 per annum (i.e. £105.2bn ÷ 39.5m x 25% = £10,658). For prudence, the Action
research group has reduced this average by 60% to reflect their expectation that parents would be more likely to
suffer conditions that may have below average severity such as anxiety and depression. This is consistent with
reductions applied in other similar SROI studies, notably that relating to carers undertaken by Princess Royal Trust
for CarersJJ
.
FF Source: Department for Work and Pensions GG http://www.centreformentalhealth.org.uk/pdfs/Economic_and_social_costs_2010.pdf HH Source: http://www.mentalhealth.org.uk/help-information/mental-health-statistics/ II Source: ONS JJ Clifford, J., Mason, S. and Theobald, C. (2011) The Princess Royal Trust for Carers: Social Impact Evaluation using Social Return on
Investment, PRTC/Baker Tilly, London/Watford

| 61
Measuring outcomes for students’ siblings
The common life course model used for students’ parents is shown below, using the example of profile B:
Outcomes for siblings Assumption Calculation
Evaluated outcomes
(£)
Number of students 26
Number of siblings per student 1
Risk of disengagement
Unemployment rate (16 to 24 year olds) 39%
Adjustment factor for siblings of disabled children 2.0
Adjusted unemployment rate among this group 78%
Therefore number of siblings at risk of disengagement 20
Value of lost productivity per annum (average) (13,624)
Annual cost of Job Seekers' Allowance (2,925)
Total annual cost per person affected (16,549)
Duration of unemployment (years) 5
Discount rate 3.5%
Annuity factor 4.52
Present value of impact during unemployed phase (1,519,111)
Present value of long-term wage penalty per person affected (45,000)
Total impact of long-term wage penalty (914,887)
Risk of criminal behaviour
Estimated offending rate among 18 to 21 year olds 2.5%
Adjustment factor for siblings of disabled children 2.5
Adjusted unemployment rate among this group 6.3%
Therefore number of siblings at risk of recurring criminal behaviour 2
Average cost per crime (4,056)
Duration of criminal behaviour (years) 20
Delay before criminal behaviour commences (years) 5
Discount rate 3.5%
Annuity factor 14.21
5 year discount factor 0.84
Present value of costs of criminal behaviour per person affected (48,536)
Total value of costs of criminal behaviour (78,871)
Gain/(cost) brought forward (2,512,869)
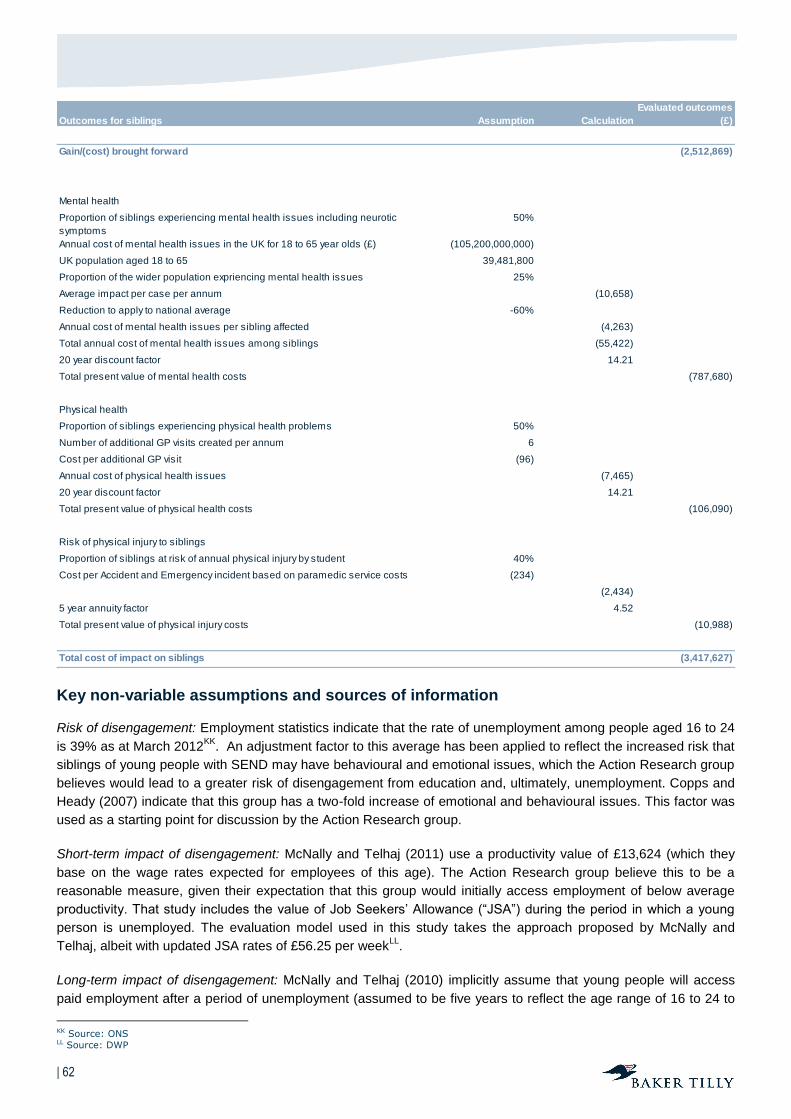
| 62
Key non-variable assumptions and sources of information
Risk of disengagement: Employment statistics indicate that the rate of unemployment among people aged 16 to 24
is 39% as at March 2012KK
. An adjustment factor to this average has been applied to reflect the increased risk that
siblings of young people with SEND may have behavioural and emotional issues, which the Action Research group
believes would lead to a greater risk of disengagement from education and, ultimately, unemployment. Copps and
Heady (2007) indicate that this group has a two-fold increase of emotional and behavioural issues. This factor was
used as a starting point for discussion by the Action Research group.
Short-term impact of disengagement: McNally and Telhaj (2011) use a productivity value of £13,624 (which they
base on the wage rates expected for employees of this age). The Action Research group believe this to be a
reasonable measure, given their expectation that this group would initially access employment of below average
productivity. That study includes the value of Job Seekers’ Allowance (“JSA”) during the period in which a young
person is unemployed. The evaluation model used in this study takes the approach proposed by McNally and
Telhaj, albeit with updated JSA rates of £56.25 per weekLL
.
Long-term impact of disengagement: McNally and Telhaj (2010) implicitly assume that young people will access
paid employment after a period of unemployment (assumed to be five years to reflect the age range of 16 to 24 to
KK Source: ONS LL Source: DWP
Outcomes for siblings Assumption Calculation
Evaluated outcomes
(£)
Gain/(cost) brought forward (2,512,869)
Mental health
Proportion of siblings experiencing mental health issues including neurotic
symptoms
50%
Annual cost of mental health issues in the UK for 18 to 65 year olds (£) (105,200,000,000)
UK population aged 18 to 65 39,481,800
Proportion of the wider population expriencing mental health issues 25%
Average impact per case per annum (10,658)
Reduction to apply to national average -60%
Annual cost of mental health issues per sibling affected (4,263)
Total annual cost of mental health issues among siblings (55,422)
20 year discount factor 14.21
Total present value of mental health costs (787,680)
Physical health
Proportion of siblings experiencing physical health problems 50%
Number of additional GP visits created per annum 6
Cost per additional GP visit (96)
Annual cost of physical health issues (7,465)
20 year discount factor 14.21
Total present value of physical health costs (106,090)
Risk of physical injury to siblings
Proportion of siblings at risk of annual physical injury by student 40%
Cost per Accident and Emergency incident based on paramedic service costs (234)
(2,434)
5 year annuity factor 4.52
Total present value of physical injury costs (10,988)
Total cost of impact on siblings (3,417,627)

| 63
which the unemployment data obtained refers). Their approach then applies a long-term wage penalty of £45,000
to reflect their finding that young people who are unemployed at a critical early stage in their working life
experience a wage penalty of at least 10% compared to peers who entered employment or training at age 16.
Risk of criminal behaviour: Research by the Prince’s Trust (McNally and Telhaj, 2010) highlights that 205,591
convictions for 18 to 21 year olds were recorded in the UK during 2010. Given that the population of this age group
is 3,281,400MM
, an offending rate of 6.3% may be calculated. The Action Research group has used a crime rate for
the wider population of 2.5%, for prudence and for consistency with the average used in the model for students
(see page 43). This risk is adjusted to reflect the risk believed by the Action Research group to be associated with
each profile, using as a starting point for discussion the finding by Copps and Heady (2007) that siblings have at
least a two-fold increased risk of emotional and behavioural issues. The Action Research group believes that
increased behavioural issues may, logically, lead to an increased risk of involvement in criminal activity.
Cost per crime: This is derived from research published by the Prince’s Trust (McNally and Telhaj, 2010), which
indicates an average cost of £4,056 per crime.
Mental health: Research published by the Centre for Mental Health indicates a total cost to the UK of c£105.2bn
per annum from costs of treatment and lost productivity due to mental health issues among the population aged 18
to 65NN
. NHS statistics indicate that 25% of the population may be expected to experience some form of mental ill-
health at any timeOO
. The UK population in this age group is 39.5 millionPP
. From this an average cost per individual
can be estimated at £10,658 per annum (i.e. £105.2bn ÷ 39.5m x 25% = £10,658). For prudence, the Action
research group has reduced this average by 60% to reflect their expectation that siblings would be more likely to
suffer conditions that may have below average severity such as anxiety and depression. This is consistent with
reductions applied in other similar SROI studies, notably that relating to carers undertaken by Princess Royal Trust
for CarersQQ
.
Physical health: the proportion of siblings experiencing physical health issues is subject to variation for each
student profile (see later). Siblings may be at risk of physical health impacts as a result of supporting parents in
caring for their sibling with SEND. It is assumed that a physical health issue would equate to at least six additional
GP visits per annum. GP costs are derived from unit costs data (Curtis, 2012) for GP appointment and prescription
costs.
Comparison of key profile assumptions
The table below shows an analysis of key variable assumptions used to build the life course profiles for young
people with SEND in the absence of intervention by NMIS schools, and highlights the variations in ‘base’ models
for each of the profiles;
MM Source: ONS data NN http://www.centreformentalhealth.org.uk/pdfs/Economic_and_social_costs_2010.pdf OO Source: http://www.mentalhealth.org.uk/help-information/mental-health-statistics/ PP Source: ONS QQ Clifford, J., Mason, S. and Theobald, C. (2011) The Princess Royal Trust for Carers: Social Impact Evaluation using Social Return on
Investment, PRTC/Baker Tilly, London/Watford

| 64
Variable/assumption Profile A Profile B Profile C Profile D
Proportion of parents
accessing full-time
employment (during their
child’s education)
3% 3% 3% 3%
Proportion of parents
accessing part-time
employment (during their
child’s education)
10% 13% 13% 13%
Proportion of parents
accessing full-time
employment (after their
child’s education)
1% 3% 3% 3%
Proportion of parents
accessing part-time
employment (after their
child’s education)
6% 13% 13% 13%
Proportion of primary care
givers experiencing health
problems
60% 50% 40% 25%
Proportion of primary care
givers experiencing mental
health problems
60% 50% 50% 25%
Unemployment rate among
siblings
78% (2 times national
average for 16 to 24
year olds)
78% (2 times national
average for 16 to 24
year olds)
78% (2 times national
average for 16 to 24
year olds)
39% (consistent with
national average)
Risk of criminal behaviour
among siblings
7.5% 6.3% 5% 2.5%
Proportion of siblings
experiencing mental health
problems
60% 50% 40% 25%
Proportion of siblings
experiencing physical health
problems
50% 50% 50% 0%
Risk of physical injury to
siblings
50% 40% 20% 0%
Post-education
accommodation
Residential: 75%
Semi-independent: 15%
Family home: 10%
Residential: 25%
Semi-independent: 50%
Family home: 25%
Residential: 0%
Semi-independent: 50%
Family home: 50%
Residential: 0%
Semi-independent: 50%
Family home: 0%
Proportion of students
requiring annual medical
interventions
30% 17.2% 8.6% 8.6%
Proportion of students
experiencing mental health
issues
60% 50% 40% 30%
Employment rate among
students
0% 5% 10% 34%
Risk of harmful/criminal
behaviours among students
38% 25% 13% 2.5%

| 65
Profile A
Profile A reflects young people with the very greatest multiplicity and complexity of learning and/or physical
disabilities and who are likely to have low cognitive ability. The Action Research group have assumed that this
results in:
Lower employment rates among parents after students complete their education, due to on-going care needs of greater intensity than other groups. 6% are assumed to access part-time employment (compared to the average identified by NPC’s research of 13%) and 1% are assumed to access full-time employment (compared to the average identified by NPC’s research of 1%)
RR;
Increased intensity of care needs is assumed to result in high risks of physical and mental illness for parents. 60% of primary care givers are assumed to experience mental and physical health issues. For mental health, this is above the average of 50% derived from NPC’s finding that there was a two times greater incidence of neurotic symptoms among parents of children with SEND, and taking into account that NHS’ statistical evidence that 25% of the population report mental ill-health at any time
SS (i.e. 2 x 25% = 50%). For physical
health, a rate of 60% was felt by the Action Research group to be reasonable in light of the findings by Carers Scotland that 70% of carers reported back or shoulder pain and 42% reported a decline in their physical health
TT.
Unemployment rates among siblings are assumed to be consistent with the average calculated on page 46.
It is assumed that siblings of a profile A student have the highest risk of experiencing mental ill-health, resulting from disruption in the home and, potentially, as a result of their role in supporting parents with caring for their sibling with SEND.
Physical health issues are assumed to be equally likely across all profiles. These arise from the potential for siblings to lose focus on their own wellbeing and the likelihood that the home environment may not be conducive to good health (40% of families were found by NPC to be living in poverty). The Action Research group believes these assumptions to be reasonable, given their experience of case studies at their schools.
The risk of criminal behaviour among siblings is based on an adjustment factor of 2.5 times the wider average assumed (2.5%). The resulting rate of 7.5% is modestly greater than the crime rate for 18 to 21 year olds derived from research by the Prince’s Trust of 6.3%
UU. This reflects the Action Research group’s view that
siblings of profile A students would experience extreme levels of disruption in the family home, and would therefore be at above average risk of becoming involved in criminal activity.
Risk of physical injury to siblings is assumed to be highest for siblings of profile A students. Many students in this group are likely to have conditions such as BESD that may lead to violent outbursts in the family home. The Action Research group highlighted examples of students whose violence had resulted in physical injury to their siblings, particularly for students that would be expected to fall into this category.
Post-education accommodation for profile A is assumed to be primarily residential due to the nature of the SEND issues in question. The Action Research group noted that the costs of meeting the care and support needs of this group may be expected to exceed the LA unit cost data identified, given that some would require secure residential accommodation. Relatively few students in this profile would be expected to return to the family home due to the level of provision and number/qualifications of care staff required to meet their needs.
Medical interventions are assumed to be required annually for 30% of students in profile A. An adjustment has been made for the likelihood (based on case study evidence) that these interventions would tend to follow emergency events resulting in paramedic attendance and hospital admission rather than outpatient or routine inpatient services.
The proportion of students experiencing a mental health problem is assumed to be 60%, which is 20% in excess of the range suggested by the broader study carried out by the Foundation for People with Learning Disabilities. The Action Research group believes that this premium is justified, given that profile A students would tend to have more complex SEND issues that would tend to be associated with a mental health problem. This assumption is consistent with the experience of members of the Action Research group who specialise in students that fit the description of profile A.
Employment rates among students in profile A are assumed to be 0%, given that most would have multiple and complex needs that would prevent them from accessing paid employment. The Action Research group believes that students in Profile A would struggle to fit into a structured workplace environment.
RR Copps, J. and Heady, L. (2007) ‘What price an ordinary life? The financial costs and benefits of supporting disabled children and their families,
New Philanthropy Capital, London SS Source: http://www.mentalhealth.org.uk/help-information/mental-health-statistics/ TT Carers Scotland (2011) ‘Sick, tired and caring: the impact of unpaid caring on health and long term conditions’, Carers Scotland, Glasgow UU McNally, S. and Talhaj, S. (2010) ‘The cost of exclusion: counting the cost of youth disadvantage in the UK, Prince’s Trust, London

| 66
A factor of 15 times, consistent with the findings of the Prison Reform Trust study on rates of learning disability within the prison population
VV, has been used for profile A. The Action Research group believes this to be
prudent: in light of the examples of crimes that students in profile A might commit discussed by the group, the average cost of crime used of £4k was felt by the group to be relatively low.
Profile B
Profile B reflects young people with the high multiplicity and complexity of learning and/or physical disabilities and
who are likely to have low cognitive ability, albeit at a less severe level than profile A. The Action Research group
have assumed that this results in:
Employment rates for parents during and after education that are consistent with NPC’s researchWW
.
50% of primary care givers are assumed to experience mental and physical health issues. This reflects a step down from the assumed incidence of physical and mental ill-health among parents of profile A students.
Unemployment rates among siblings are assumed to be consistent with the average calculated on page 46.
Rates of mental ill-health among siblings are assumed to be 50%, which is consistent with the two-fold increase in neurotic symptoms among family members compared to the average for the wider population, as observed by NPC(Copps and Heady, 2007). This increase has been applied to the average incidence of mental ill-health of all kinds of 25%, derived from NHS statistics
XX. The Action Research group believes it to be
prudent to assume that siblings of profile B students would be consistent with this average.
The risk of criminal behaviour among siblings is based on an adjustment factor of 2.5 times the wider average assumed (2.5%). The resulting rate of 6.3% is consistent with the crime rate for 18 to 21 year olds derived from research by the Prince’s Trust
YY. The Action Research group believes this to be a prudent reflection of
the risk that siblings of profile B students would be drawn in to criminal activity.
Physical health issues are assumed to be equally likely across all profiles. These arise from the potential for siblings to lose focus on their own wellbeing and the likelihood that the home environment may not be conducive to good health (40% of families were found by NPC to be living in poverty). The Action Research group believes these assumptions to be reasonable, given their experience of case studies at their schools.
Risk of physical injury to siblings is assumed to be 40%, a lower rate than for siblings of profile A students due to the view of the Action Research group that profile B students would be less likely to be at risk of violent outbursts. Students in this group remain likely to have conditions such as BESD that may lead to such violent outbursts in the family home, albeit the risk for this group is assumed to be lower.
Post-education accommodation for profile B is assumed to be primarily semi-independent accommodation, given that students in this profile may have higher cognitive ability and, therefore, increased ability to learn skills that allow them to live more independently. 25% of students would be expected to move on to residential accommodation, albeit less likely to require higher cost secure settings than those in profile A. 25% would be expected to be able to return to the family home, provided adequate care and support packages are put in place. These assumptions are consistent with case studies discussed by the Action Research group.
Profile B students are assumed to require twice the average number of medical interventions, based on the profile of access to hospital services for people with learning disability discussed on page 42 (Emerson and Hatton, 2007). The Action Research group believe this to be a reasonable assumption, given the likelihood (based on their knowledge of case studies) that students that fit the description of profile B would require either emergency treatment or routine hospital treatment.
The proportion of students experiencing a mental health problem is assumed to be 50%, which is 10% in excess of the range suggested by the broader study carried out for the Foundation for People with Learning Disabilities
ZZ. The Action Research group believes that this premium is justified, given that profile B students
would tend to have more complex SEND issues (albeit at a lower severity than profile A) that would tend to be associated with a mental health problem. This assumption is consistent with the experience of members of the Action Research group who specialise in students that fit the description of profile B.
Employment rates among students in profile A are assumed to be 5%, given that most would have multiple and complex needs that would prevent them from accessing paid employment, the Action Research group believes it to be reasonable to assume that few students would be able to access pain employment.
VV Talbot, J. (2010) ‘ Seen and Heard: supporting vulnerable children in the youth justice system’, Prison Reform Trust, London WW Copps, J. and Heady, L. (2007) ‘What price an ordinary life? The financial costs and benefits of supporting disabled children and their
families, New Philanthropy Capital, London XX Source: http://www.mentalhealth.org.uk/help-information/mental-health-statistics/ YY McNally, S. and Talhaj, S. (2010) ‘The cost of exclusion: counting the cost of youth disadvantage in the UK, Prince’s Trust, London ZZ Emerson, E. and Hatton, C. (2007) The Mental Health of Children and Adolescents with Learning Disabilities in Britain, Institute for Health
Research, University of Lancaster

| 67
A factor of 10 times, which is below the findings of the Prison Reform Trust study on rates of learning disability within the prison population
AAA, has been used for profile B. As was found for profile A, the Action Research
group believes this to be prudent: in light of the examples of crimes that students in profile B might commit discussed by the group, the average cost of crime used of £4k was felt by the group to be relatively low.
Profile C
Profile B reflects young people with the high multiplicity and complexity of learning and/or physical disabilities and
who are likely to have low cognitive ability, albeit at a less severe level than profile A. The Action Research group
have assumed that this results in:
Employment rate for parents during and after education that are consistent with NPC’s researchBBB
.
40% of primary care givers are assumed to experience physical health issues. This reflects a step down from the assumed incidence of physical ill-health among parents of profile B students, and reflects the likelihood that students in this profile may be better able to self-care without assistance.
50% of primary care givers are assumed to experience mental health issues%, which is consistent with the two-fold increase in neurotic symptoms among family members compared to the average for the wider population, as observed by NPC (Copps and Heady, 2007). This increase has been applied to the average incidence of mental ill-health of all kinds of 25%, derived from NHS statistics
CCC.
Unemployment rates among siblings are assumed to be consistent with the average calculated on page 46.
Rates of mental ill-health among siblings are assumed to be 40%, which represents an adjustment below the two-fold increase in neurotic symptoms among family members compared to the average for the wider population, as observed by NPC (Copps and Heady, 2007). This increase has been applied to the average incidence of mental ill-health of all kinds of 25%, derived from NHS statistics. The Action Research group believes it to be prudent to assume that siblings of profile C students would be consistent with this average.
The risk of criminal behaviour among siblings is based on an adjustment factor of two times the wider average assumed (2.5%). The resulting rate of 5% is below the crime rate for 18 to 21 year olds derived from research by the Prince’s Trust
DDD. The Action Research group therefore believes this to be a prudent reflection of the
risk that siblings of profile C students would be drawn in to criminal activity.
Physical health issues are assumed to be equally likely across all profiles. These arise from the potential for siblings to lose focus on their own wellbeing and the likelihood that the home environment may not be conducive to good health (40% of families were found by NPC to be living in poverty). The Action Research group believes these assumptions to be reasonable, given their experience of case studies at their schools.
Risk of physical injury to siblings is assumed to be 20%, a lower rate than for siblings of profile B students due to the view of the Action Research group that profile C students would be substantially less likely to be at risk of violent outbursts. Students in this group are less likely to have conditions such as BESD that may lead to such violent outbursts in the family home.
Post-education accommodation for profile C is assumed to be equally split between a return to the family home and a move to semi-independent accommodation. The Action Research group believes that students in profile C would be likely to have higher cognitive ability than profile A or B, such that they would be able to live more independently with less care support needed. These assumptions are consistent with case studies discussed by the Action Research group.
Profile C students are assumed to require the average number of medical interventions, based on the profile of access to hospital services for people with learning disability discussed on page 42 (Emerson and Hatton, 2007). The Action Research group believe this to be a reasonable assumption, given the likelihood (based on their knowledge of case studies) that students that fit the description of profile C would require either emergency treatment or routine hospital treatment.
The proportion of students experiencing a mental health problem is assumed to be 40%, which consistent with the range suggested by the broader study carried out by the Foundation for People with Learning Disabilities
EEE. The Action Research group believes that this assumption is prudent, given that profile C
students would be expected to have SEND issues of above average complexity.
AAA Talbot, J. (2010) ‘ Seen and Heard: supporting vulnerable children in the youth justice system’, Prison Reform Trust, London BBB Copps, J. and Heady, L. (2007) ‘What price an ordinary life? The financial costs and benefits of supporting disabled children and their
families, New Philanthropy Capital, London CCC Source: http://www.mentalhealth.org.uk/help-information/mental-health-statistics/ DDD McNally, S. and Talhaj, S. (2010) ‘The cost of exclusion: counting the cost of youth disadvantage in the UK, Prince’s Trust, London EEE Emerson, E. and Hatton, C. (2007) The Mental Health of Children and Adolescents with Learning Disabilities in Britain, Institute for Health
Research, University of Lancaster
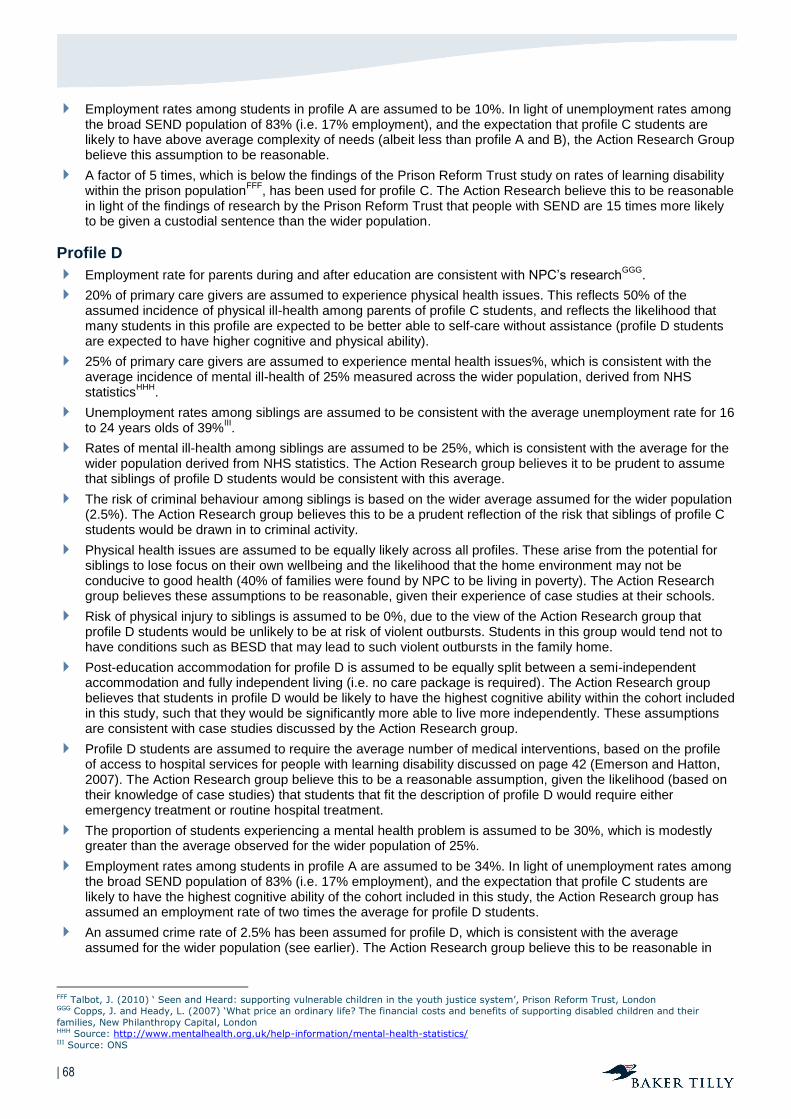
| 68
Employment rates among students in profile A are assumed to be 10%. In light of unemployment rates among the broad SEND population of 83% (i.e. 17% employment), and the expectation that profile C students are likely to have above average complexity of needs (albeit less than profile A and B), the Action Research Group believe this assumption to be reasonable.
A factor of 5 times, which is below the findings of the Prison Reform Trust study on rates of learning disability within the prison population
FFF, has been used for profile C. The Action Research believe this to be reasonable
in light of the findings of research by the Prison Reform Trust that people with SEND are 15 times more likely to be given a custodial sentence than the wider population.
Profile D
Employment rate for parents during and after education are consistent with NPC’s researchGGG
.
20% of primary care givers are assumed to experience physical health issues. This reflects 50% of the assumed incidence of physical ill-health among parents of profile C students, and reflects the likelihood that many students in this profile are expected to be better able to self-care without assistance (profile D students are expected to have higher cognitive and physical ability).
25% of primary care givers are assumed to experience mental health issues%, which is consistent with the average incidence of mental ill-health of 25% measured across the wider population, derived from NHS statistics
HHH.
Unemployment rates among siblings are assumed to be consistent with the average unemployment rate for 16 to 24 years olds of 39%
III.
Rates of mental ill-health among siblings are assumed to be 25%, which is consistent with the average for the wider population derived from NHS statistics. The Action Research group believes it to be prudent to assume that siblings of profile D students would be consistent with this average.
The risk of criminal behaviour among siblings is based on the wider average assumed for the wider population (2.5%). The Action Research group believes this to be a prudent reflection of the risk that siblings of profile C students would be drawn in to criminal activity.
Physical health issues are assumed to be equally likely across all profiles. These arise from the potential for siblings to lose focus on their own wellbeing and the likelihood that the home environment may not be conducive to good health (40% of families were found by NPC to be living in poverty). The Action Research group believes these assumptions to be reasonable, given their experience of case studies at their schools.
Risk of physical injury to siblings is assumed to be 0%, due to the view of the Action Research group that profile D students would be unlikely to be at risk of violent outbursts. Students in this group would tend not to have conditions such as BESD that may lead to such violent outbursts in the family home.
Post-education accommodation for profile D is assumed to be equally split between a semi-independent accommodation and fully independent living (i.e. no care package is required). The Action Research group believes that students in profile D would be likely to have the highest cognitive ability within the cohort included in this study, such that they would be significantly more able to live more independently. These assumptions are consistent with case studies discussed by the Action Research group.
Profile D students are assumed to require the average number of medical interventions, based on the profile of access to hospital services for people with learning disability discussed on page 42 (Emerson and Hatton, 2007). The Action Research group believe this to be a reasonable assumption, given the likelihood (based on their knowledge of case studies) that students that fit the description of profile D would require either emergency treatment or routine hospital treatment.
The proportion of students experiencing a mental health problem is assumed to be 30%, which is modestly greater than the average observed for the wider population of 25%.
Employment rates among students in profile A are assumed to be 34%. In light of unemployment rates among the broad SEND population of 83% (i.e. 17% employment), and the expectation that profile C students are likely to have the highest cognitive ability of the cohort included in this study, the Action Research group has assumed an employment rate of two times the average for profile D students.
An assumed crime rate of 2.5% has been assumed for profile D, which is consistent with the average assumed for the wider population (see earlier). The Action Research group believe this to be reasonable in
FFF Talbot, J. (2010) ‘ Seen and Heard: supporting vulnerable children in the youth justice system’, Prison Reform Trust, London GGG Copps, J. and Heady, L. (2007) ‘What price an ordinary life? The financial costs and benefits of supporting disabled children and their
families, New Philanthropy Capital, London HHH Source: http://www.mentalhealth.org.uk/help-information/mental-health-statistics/ III Source: ONS

| 69
light of the findings of research by the Prison Reform TrustJJJ
that people with SEND are 15 times more likely to be given a custodial sentence than the wider population.
Results of the ‘base’ profile life course models
The table below shows a summary of the results of the ‘base’ profile life course models for the latest year’s intake
of 91 students across the eight participating schools. These results are used as a benchmark against which the
adjusted models showing the impact of NMIS schools can be compared to identify incremental gains/costs
achieved:
The table above highlights that the expected life course evaluation for students with SEND included in this study
results in a net cost of £83.7m over a 25 year period.
The adjustments used to evaluate the impact of NMIS schools are shown in Appendix C.
JJJ Talbot, J. (2010) ‘ Seen and Heard: supporting vulnerable children in the youth justice system’, Prison Reform Trust, London
Evaluated base life
course
gain/(cost) £'000
17 Profile A (23,002)
26 Profile B (25,789)
91 Students
40 Profile C (30,823)
8 Profile D (4,097)
Life course totals (83,711)
Lifecourse analysis summary
| 70
C. Adjusted life course profiles
Using the ‘base’ life course profiles discussed in detail in appendix B as a starting point, the Action Research
Group have prepared a series of adjusted profiles to reflect the impact of their intervention if it has:
Substantial impact on life outcomes (i.e. all development plan objectives are met, with many exceeded);
Moderate impact on life outcomes (i.e. all development plan objectives are met); or
Minimum expected improvement in life outcomes (i.e. key development plan objectives are met, albeit some may not be achieved).
For each profile, three alternatives have been produced to reflect the impact on a student’s life course. The
adjusted life course analysis for the NMIS students included in this study is therefore built up of 12 individual life
course models. For simplicity, this appendix summarises key variables for each profile in a similar format to that
used in Appendix B (page 48).
Profile A
The table below shows an analysis of the ‘base’ assumptions used for profile A, together with the adjustments
made to reflect the impact of NMIS school provision:

| 71
Profile A
Variable/assumption Base
Significant
improvement Moderate improvement Meets expectation
Proportion of parents
accessing full-time
employment (during their
child’s education)
3% 15% 10% 5%
Proportion of parents
accessing part-time
employment (during their
child’s education)
10% 45% 40% 30%
Proportion of parents
accessing full-time
employment (after their
child’s education)
1% 15% 10% 3%
Proportion of parents
accessing part-time
employment (after their
child’s education)
6% 45% 40% 13%
Proportion of primary care
givers experiencing health
problems
60% 20% 30% 30%
Proportion of primary care
givers experiencing mental
health problems
60% 30% 40% 40%
Unemployment rate among
siblings
78% (2 times national
average for 16 to 24
year olds)
39% (consistent with the
average for this age
group)
39% (consistent with the
average for this age
group)
59% (1.5 times the
average for this age
group)
Risk of criminal behaviour
among siblings
7.5% 2.5% 3.8% 3.8%
Proportion of siblings
experiencing mental health
problems
60% 40% 50% 55%
Proportion of siblings
experiencing physical health
problems
50% 50% 50% 50%
Risk of physical injury to
siblings
50% 50% 50% 50%
Post-education
accommodation
Residential: 75%
Semi-independent: 15%
Family home: 10%
Residential: 30%
Semi-independent: 50%
Family home: 20%
Residential: 40%
Semi-independent: 45%
Family home: 15%
Residential: 75%
Semi-independent: 25%
Family home: 0%
Proportion of students
requiring annual medical
interventions
30% 30% 30% 30%
Proportion of students
experiencing mental health
issues
60% 50% 50% 50%
Employment rate among
students
0% 10% 5% 0%
Risk of harmful/criminal
behaviours among students
38% 38% 38% 38%

| 72

| 73
Key adjustments to profile A
Employment for parents: It is assumed that parents of profile A students would be more able to access paid
employment during the period when the student is in school, particularly where the NMIS school provision is
residential. Post-education, as students are expected to have improved their ability to self-care or manage their
conditions more effectively, more parents are assumed to be able to access long-term paid employment. Under the
‘minimum expected’ models, it is assumed that parental employment rates conform to the averages highlighted by
NPC’s research. Parental ability to access paid employment may, to some extent, be a secondary outcome of the
assumed improvements in physical and mental health (see below).
Physical and mental health: NMIS Schools (particularly those offering residential placements, as would be
expected for a profile A student) are assumed to take on much of the day-to-day care responsibility for students.
This holistic approach is believe by the Action Research group to alleviate much of the physical and mental stress
of care placed upon parents, resulting in reduced rates of ill-health. In the long term, a curriculum targeted at
supporting students to increase the independence is expected to increase their ability to self-care, resulting in a
reduction in the input required from parents and, therefore, reducing the on-going strain placed upon them.
Disruption to siblings: for profile A, it is expected that most students would be in residential placements within NMIS
schools and that the student would be better able to manage their condition in the longer term and to self-care (or
would be able to access a residential or semi-independent living scheme). It is therefore assumed that the level of
disruption experienced by siblings would be substantially reduced in most cases such that their risk of being
unemployed at age 16 to 24 is reduced to be consistent with the wider average (significant and moderate
improvement) or 1.5 times the average (minimum expectation). This reduced disruption is also expected to reduce
the prevalence of behavioural issues among siblings such that the rates of offending are reduced to be consistent
with the wider average (significant and moderate improvement) or 1.5 times the average (minimum expectation).
This reduction in disruption to siblings is further expected to reduce the risk or severity of mental health issues such
as depression or anxiety.
Post-education accommodation: the Action Research group has assumed that with appropriate educational
provision that focuses on independence and life-skills as well as teaching students how to develop strategies to
manage their condition, an improvement in independence can be achieved. As a result of this, some students will
be able to live more independently, either in semi-independent settings or in the family home, as opposed to more
expensive residential provision. This assumption is based on case study evidence on student destinations
reviewed by the group, brought by representatives of schools who specialise in provision for students that fit profile
A.
Students’ mental health: the Action Research group believes that teaching strategies to help students to manage
their conditions will lead to an improvement in their mental wellbeing. It is assumed that the incidence of mental
health under profile A can be reduced from 60% to 50%.
Employment for students: the Action Research group believes that by teaching coping strategies and
independence skills, as well as providing a curriculum that targets equipping students with skills relevant to the
workplace, some students in profile A may be able to access employment. The assumed improvement of up to
10% for cases where significant improvement is achieved is believed by the Action Research group to be
reasonable in light of average employment rates for the SEND population of 17%KKK
.
Profile B
The table below shows an analysis of the ‘base’ assumptions used for profile B, together with the adjustments
made to reflect the impact of NMIS school provision:
KKK Emerson, E. and Hatton, C. (2008) ‘People with learning disabilities in England’, Centre for Disability Research, Lancaster University

| 74
Profile B
Variable/assumption Base
Significant
improvement Moderate improvement Meets expectation
Proportion of parents
accessing full-time
employment (during their
child’s education)
3% 25% 15% 15%
Proportion of parents
accessing part-time
employment (during their
child’s education)
13% 50% 45% 45%
Proportion of parents
accessing full-time
employment (after their
child’s education)
3% 30% 30% 3%
Proportion of parents
accessing part-time
employment (after their
child’s education)
13% 30% 30% 13%
Proportion of primary care
givers experiencing health
problems
50% 20% 30% 30%
Proportion of primary care
givers experiencing mental
health problems
50% 30% 40% 40%
Unemployment rate among
siblings
78% (2 times national
average for 16 to 24
year olds)
39% (consistent with the
average for this age
group)
39% (consistent with the
average for this age
group)
59% (1.5 times the
average for this age
group)
Risk of criminal behaviour
among siblings
6.3% 2.5% 2.5% 3.8%
Proportion of siblings
experiencing mental health
problems
50% 35% 40% 45%
Proportion of siblings
experiencing physical health
problems
50% 50% 50% 50%
Risk of physical injury to
siblings
40% 40% 40% 40%
Post-education
accommodation
Residential: 25%
Semi-independent: 50%
Family home: 25%
Residential: 10%
Semi-independent: 50%
Family home: 40%
Residential: 20%
Semi-independent: 50%
Family home: 30%
Residential: 25%
Semi-independent: 50%
Family home: 25%
Proportion of students
requiring annual medical
interventions
17.2% 8.6% 12.9% 12.9%
Proportion of students
experiencing mental health
issues
50% 40% 40% 40%
Employment rate among
students
5% 15% 15% 5%
Risk of harmful/criminal
behaviours among students
25% 25% 25% 25%

| 75
Key adjustments to profile B
Employment for parents: It is assumed that parents of profile B students would be more able to access paid
employment during the period when the student is in school, particularly where the NMIS school provision is
residential. Post-education, as students are expected to have improved their ability to self-care or manage their
conditions more effectively, more parents are assumed to be able to access long-term paid employment. Under the
‘minimum expected’ models, it is assumed that parental employment rates conform to the averages highlighted by
NPC’s research. Parental ability to access paid employment may, to some extent, be a secondary outcome of the
assumed improvements in physical and mental health (see below).
Physical and mental health: NMIS Schools (particularly those offering residential placements, as would be
expected for some profile B students) are assumed to take on much of the day-to-day care responsibility for
students, including co-ordination of therapeutic interventions. This holistic approach is believe by the Action
Research group to alleviate much of the physical and mental stress of care placed upon parents, resulting in
reduced rates of ill-health. In the long term, a curriculum targeted at supporting students to increase the
independence is expected to increase their ability to self-care, resulting in a reduction in the input required from
parents and, therefore, reducing the on-going strain placed upon them.
Disruption to siblings: for profile B, it is expected that some students would be in residential placements within
NMIS schools, but that the majority of student would be better taught skills that enable them to manage their
condition in the longer term and to self-care to a greater extent. It is therefore assumed that the level of disruption
experienced by siblings would be substantially reduced in most cases such that their risk of being unemployed at
age 16 to 24 is reduced to be consistent with the wider average (significant and moderate improvement) or 1.5
times the average (minimum expectation). This reduced disruption is also expected to reduce the prevalence of
behavioural issues among siblings such that the rates of offending are reduced to be consistent with the wider
average (significant and moderate improvement) or 1.5 times the average (minimum expectation). This reduction in
disruption to siblings is further expected to reduce the risk or severity of mental health issues such as depression or
anxiety.
Post-education accommodation: the Action Research group has assumed that with appropriate educational
provision that focuses on independence and life-skills as well as teaching students how to develop strategies to
manage their condition, an improvement in independence can be achieved. As a result of this, some students will
be able to live more independently, either in semi-independent settings or in the family home, as opposed to more
expensive residential provision. This assumption is based on case study evidence on student destinations
reviewed by the group, brought by representatives of schools who specialise in provision for students that fit profile
B.
Students’ mental health: the Action Research group believes that teaching strategies to help students to manage
their conditions will lead to an improvement in their mental wellbeing. It is assumed that the incidence of mental
health under profile A can be reduced from 50% to 35% to 45%, depending on the level of outcome achieved.
Employment for students: the Action Research group believes that by teaching coping strategies and
independence skills, as well as providing a curriculum that targets equipping students with skills relevant to the
workplace, some students in profile B may be able to access employment. The assumed improvement of 10% for
cases where significant or moderate improvement is achieved is believed by the Action Research group to be
reasonable in light of average employment rates for the SEND population of 17%LLL
.
Profile C
The table below shows an analysis of the ‘base’ assumptions used for profile C, together with the adjustments
made to reflect the impact of NMIS school provision:
LLL Emerson, E. and Hatton, C. (2008) ‘People with learning disabilities in England’, Centre for Disability Research, Lancaster University
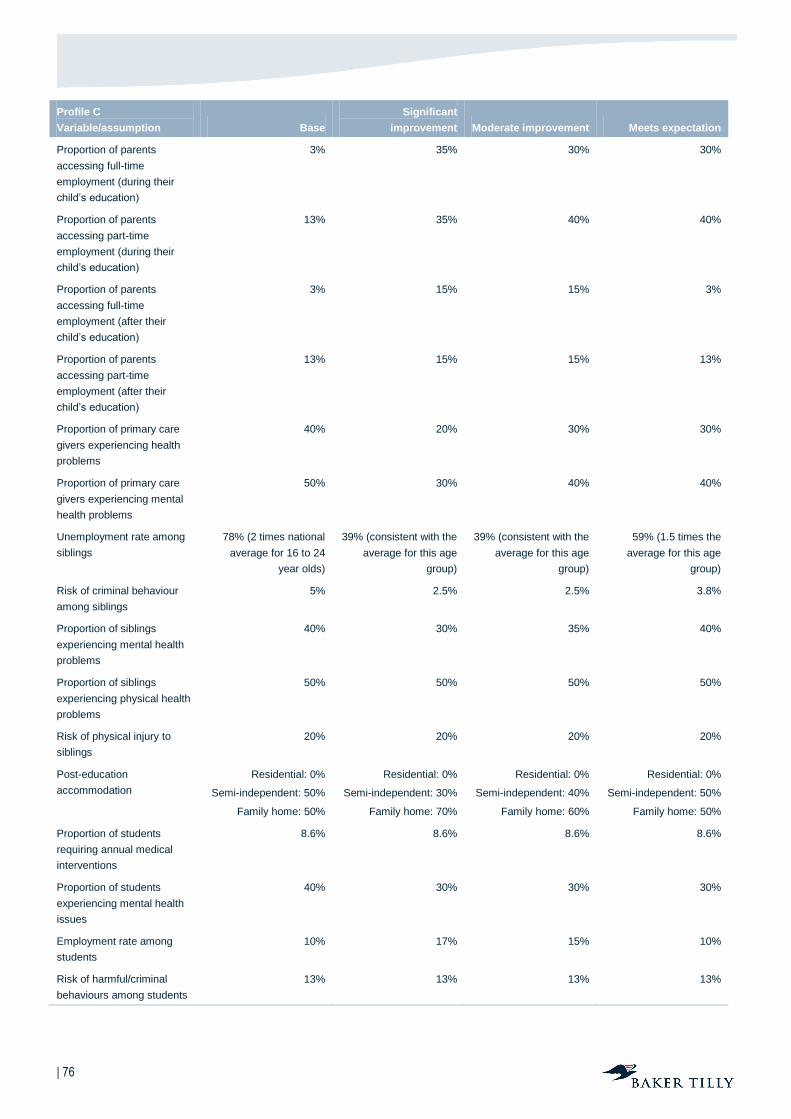
| 76
Profile C
Variable/assumption Base
Significant
improvement Moderate improvement Meets expectation
Proportion of parents
accessing full-time
employment (during their
child’s education)
3% 35% 30% 30%
Proportion of parents
accessing part-time
employment (during their
child’s education)
13% 35% 40% 40%
Proportion of parents
accessing full-time
employment (after their
child’s education)
3% 15% 15% 3%
Proportion of parents
accessing part-time
employment (after their
child’s education)
13% 15% 15% 13%
Proportion of primary care
givers experiencing health
problems
40% 20% 30% 30%
Proportion of primary care
givers experiencing mental
health problems
50% 30% 40% 40%
Unemployment rate among
siblings
78% (2 times national
average for 16 to 24
year olds)
39% (consistent with the
average for this age
group)
39% (consistent with the
average for this age
group)
59% (1.5 times the
average for this age
group)
Risk of criminal behaviour
among siblings
5% 2.5% 2.5% 3.8%
Proportion of siblings
experiencing mental health
problems
40% 30% 35% 40%
Proportion of siblings
experiencing physical health
problems
50% 50% 50% 50%
Risk of physical injury to
siblings
20% 20% 20% 20%
Post-education
accommodation
Residential: 0%
Semi-independent: 50%
Family home: 50%
Residential: 0%
Semi-independent: 30%
Family home: 70%
Residential: 0%
Semi-independent: 40%
Family home: 60%
Residential: 0%
Semi-independent: 50%
Family home: 50%
Proportion of students
requiring annual medical
interventions
8.6% 8.6% 8.6% 8.6%
Proportion of students
experiencing mental health
issues
40% 30% 30% 30%
Employment rate among
students
10% 17% 15% 10%
Risk of harmful/criminal
behaviours among students
13% 13% 13% 13%

| 77
Key adjustments to profile C
Employment for parents: It is assumed that parents of profile C students would be more able to access paid
employment during the period when the student is in school, particularly where the NMIS school provision is
residential. Post-education, a significant number of profile C students are expected to return to the family home,
albeit with improved ability to self-care or manage their conditions more effectively. Despite the improvements
achieved, some parents will be required to return to the role as carer post-education. Under the ‘minimum expected’
models, it is assumed that post-education parental employment rates conform to the averages highlighted by
NPC’s research. Parental ability to access paid employment (at least in the short term) may, to some extent, be a
secondary outcome of the assumed improvements in physical and mental health (see below).
Physical and mental health: NMIS Schools are assumed to take on much of the day-to-day care responsibility for
students, including co-ordination of therapeutic interventions. This holistic approach is believed by the Action
Research group to alleviate much of the physical and mental stress of care placed upon parents, resulting in
reduced rates of ill-health. In the long term, a curriculum targeted at supporting students to increase their
independence is expected to increase their ability to self-care, resulting in a reduction in the input required from
parents and, therefore, reducing the on-going strain placed upon them.
Disruption to siblings: for profile C, it is expected that students may be either day-only or part-time residential
placements within NMIS schools. The focus on teaching skills that enable students to manage their conditions in
the longer term and to self-care to a greater extent is assumed to reduce the level of disruption experienced by
siblings when their sibling with SEND is at home. This, in turn, is assumed to reduce their risk of being unemployed
at age 16 to 24 to be consistent with the wider average (significant and moderate improvement) or 1.5 times the
average (minimum expectation). This reduced disruption is also expected to reduce the prevalence of behavioural
issues among siblings such that the rates of offending are reduced to be consistent with the wider average
(significant and moderate improvement) or 1.5 times the average (minimum expectation). This reduction in
disruption to siblings is further expected to reduce the risk or severity of mental health issues such as depression or
anxiety.
Post-education accommodation: the Action Research group has assumed that with appropriate educational
provision that focuses on independence and life-skills as well as teaching students how to develop strategies to
manage their condition, an improvement in independence can be achieved. As a result of this, many students will
be able to return to the family home with significantly reduced care package requirements. This assumption is
based on case study evidence on student destinations reviewed by the group, brought by representatives of
schools who specialise in provision for students that fit profile C.
Students’ mental health: the Action Research group believes that teaching strategies to help students to manage
their conditions will lead to an improvement in their mental wellbeing. It is assumed that the incidence of mental
health under profile A can be reduced from 40% to 30% to 35%, depending on the level of outcome achieved.
Employment for students: the Action Research group believes that by teaching coping strategies and
independence skills, as well as providing a curriculum that targets equipping students with skills relevant to the
workplace, some students in profile C may be able to access employment. The assumed improvement of 7% for
cases where significant or moderate improvement is achieved is believed by the Action Research group to be
reasonable in light of average employment rates for the SEND population of 17%MMM
.
Profile D
The table below shows an analysis of the ‘base’ assumptions used for profile D, together with the adjustments
made to reflect the impact of NMIS school provision:
MMM [Emerson, E. and Hatton, C. (2008) ‘People with learning disabilities in England’, Centre for Disability Research, Lancaster University

| 78
Profile D
Variable/assumption Base
Significant
improvement Moderate improvement Meets expectation
Proportion of parents
accessing full-time
employment (during their
child’s education)
3% 35% 35% 35%
Proportion of parents
accessing part-time
employment (during their
child’s education)
13% 35% 35% 35%
Proportion of parents
accessing full-time
employment (after their
child’s education)
3% 35% 35% 35%
Proportion of parents
accessing part-time
employment (after their
child’s education)
13% 35% 35% 35%
Proportion of primary care
givers experiencing health
problems
25% 0% 0% 0%
Proportion of primary care
givers experiencing mental
health problems
25% 25% 25% 25%
Unemployment rate among
siblings
39% (consistent with
national average)
39% (consistent with the
average for this age
group)
39% (consistent with the
average for this age
group)
39% (consistent with the
average for this age
group)
Risk of criminal behaviour
among siblings
2.5% 2.5% 2.5% 2.5%
Proportion of siblings
experiencing mental health
problems
25% 25% 25% 25%
Proportion of siblings
experiencing physical health
problems
0% 0% 0% 0%
Risk of physical injury to
siblings
0% 0% 0% 0%
Post-education
accommodation
Residential: 0%
Semi-independent: 50%
Family home: 0%
Residential: 0%
Semi-independent: 0%
Family home: 50%
Residential: 0%
Semi-independent: 0%
Family home: 50%
Residential: 0%
Semi-independent: 50%
Family home: 0%
Proportion of students
requiring annual medical
interventions
8.6% 8.6% 8.6% 8.6%
Proportion of students
experiencing mental health
issues
30% 25% 25% 25%
Employment rate among
students
34% 60% 45% 34%
Risk of harmful/criminal
behaviours among students
2.5% 2.5% 2.5% 2.5%

| 79
Key adjustments to profile D
Employment for parents: It is assumed that parents of profile D students would be more able to access paid
employment during the period when the student is in school, particularly where the NMIS school provision is
residential. Post-education, as a significant number of profile D students are expected to be able to live fully
independently, with others going on to semi-independent settings, allowing the majority of primary care givers to
access at least part-time employment.
Physical and mental health: Profile D students are those less likely to require substantial physical care input,
although a physical health risk will remain for some parents. NMIS Schools are assumed to take on much of the
day-to-day care responsibility for students, including co-ordination of therapeutic interventions. This holistic
approach is believed by the Action Research group to alleviate much of the physical and mental stress of care
placed upon parents, resulting in reduced rates of ill-health. In the long term, a curriculum targeted at supporting
students to increase their independence is expected to increase their ability to self-care, resulting in a reduction in
the input required from parents and, therefore, reducing the on-going strain placed upon them. For a group that are
likely to be more able to live independently, it is assumed that the risk of parents failing to care adequately for
themselves due to their focus on their child can be fully mitigated.
Disruption to siblings: profile D students would tend to have higher cognitive ability, more effective communication
skills and higher levels of physical mobility. Some, for example those with sensory impairment, may present few, if
any, issues that would disrupt their families to any great extent. It is, therefore, assumed that siblings of a profile D
student will conform to the averages observed for the wider population in terms of disengagement, the risk of
harmful/criminal behaviour and mental ill-health. The risk of physical ill-health and injury are assumed to be nil, in
line with the ‘base’ profile.
Post-education accommodation: the Action Research group has assumed that with appropriate educational
provision that focuses on independence and life-skills as well as teaching students how to develop strategies to
manage their condition, an improvement in independence can be achieved. As a result of this, many profile D
students will be able to live fully independently. For prudence, it has been assumed that 50% of the group will
remain either in the family home or in semi-independent accommodation (for which a care package cost has been
included). This assumption is based on case study evidence on student destinations reviewed by the group,
brought by representatives of schools who specialise in provision for students that fit profile D.
Students’ mental health: the Action Research group believes that the risk of mental ill-health among profile D
students is likely to be broadly consistent with the average for the wider population in all models.
Employment for students: the Action Research group believes that the majority of profile D students are likely to
have single issues rather than the multiple and complex needs of a profile A student. NMIS schools specialise in
helping students to develop strategies to manage their condition such that they are able to live as independently as
possible and seek to access paid employment. For this group, it is assumed that effective coping strategies may
allow up to 60% of profile D students to access paid employment, reducing to 34% (consistent with the average
employment rate identified by Emerson and Hatton (2007).

| 80
Results of the adjusted life course models
The table above highlights a total gain of £32.1m relating to the work of the eight participating NMIS schools’ latest
intake of students.
Of particular note is the value demonstrated in profile D. This group of students are those who require some
specialist support in order to manage their own conditions on a day-to-day basis such that they are able to access
the school curriculum (which is delivered in a way that supports the development of coping strategies). The majority
of this group have the potential to live independently and, in many cases, to progress to Further Education and
Higher Education and then into the workplace. The key to delivering the gain for this group is to unlock that
potential: without effective support at the appropriate stage, the needs of this group might preclude them from
accessing the school curriculum, thereby preventing the release of such potential.
Evaluated base life
course Evaluated lifecourse
Total life course
gain achieved
gain/(cost) £'000 gain/(cost) £'000 £'000
24% Substantial impact on life outcomes (3,004) 2,517
17 Profile A (23,002) 41% Moderate impact on life outcomes (6,279) 3,152
35% Meets expected improvement (7,187) 864
Life course total (16,469) 6,533
35% Substantial impact on life outcomes (4,436) 4,590
26 Profile B (25,789) 50% Moderate impact on life outcomes (7,717) 5,178
15% Meets expected improvement (3,381) 487
91 Students Life course total (15,534) 10,255
70% Substantial impact on life outcomes (13,542) 8,034
40 Profile C (30,823) 30% Moderate impact on life outcomes (6,322) 2,925
0% Meets expected improvement - -
Life course total (19,864) 10,959
100% Substantial impact on life outcomes 277 4,374
8 Profile D (4,097) 0% Moderate impact on life outcomes - -
0% Meets expected improvement - -
Life course total 277 4,374
Life course totals (83,711) (51,590) 32,121
Lifecourse analysis summary

| 81
D. Sensitivity Analysis
Various assumptions have been made in the course of preparing this analysis and the detailed tables of
calculations in Appendices B and C. To the greatest extent possible, assumptions have been validated through
case study evidence gathered by participating NMIS schools. However, some assumptions relate to estimates
made by the Action Research group in coming to the views of outcomes, and some relate to the interpretation of
information arising from other research work and statistical analysis referenced in this work.
In order to assess the extent to which these assumptions are material, potentially key assumptions have been
identified. Each has been subject to variation within what appears to be a reasonable range, and the effect on the
total valued outcomes under the study has been recast. The resulting analysis is shown below:
Sensitivity
Gain attributable to
NMIS Schools (£’000)
Variance to base
case (£’000)
Base case per 6.1 24,490
Sens 1 – reduce post-education life course to 15 years 23,376 (1,114)
Sens 2 – increase post-education life course to 40 years 27,442 2,952
Sens 3 – 50% of substantial improvement reduced to minimum expectation
19,958 (4,532)
Sens 4 – 50% of moderate improvement reduced to minimum expectation
21,552 (2,938)
Sens 5 – double deadweight deduction 22,555 (1,935)
Sens 6 – increase alternative attribution by 10% (absolute)
21,278 (3,212)
The table above highlights that the key assumptions shown above may be subject to material change without
substantially altering the conclusion of this study that the social impact of NMIS schools exceeds the incremental
cost (if any) of funding them.
The sensitivities above include adjustments to the success rate for interventions. Rather than adjusting numerous
individual assumptions within the profiles, this analysis considers the impact of moving students from higher
success models to lower outcome models. The above analysis (sensitivity 3 and 4) therefore captures the impact of
reducing the success of NMIS School interventions across multiple measures (notably employment rates and
accommodation destinations for students).
It is notable that, due to the effects of discounting future cash flows (see Appendix G), variations in the length of
post-education life course do not appear to have a material effect on the conclusions from this study. Some life
course studies use a 40 year period for evaluations involving young people. As is discussed in this report (see
4.45), the Action Research group felt that there was sufficient uncertainty over the likelihood that other factors
would influence the life course of students beyond 20 years post-education to present a risk of over-claiming gains
achieved. The analysis above demonstrates that a change in this assumption to 40 years adds c£2.9m to the
evaluated gain shown at 6.1 (i.e. an increase of 11.8%), but does not materially alter the conclusion of this study.

| 82
E. Case Studies
The following case studies have been provided by the participating schools. These have been anonymised to
protect the identities of the families involved.
‘J’
J joined us in April 2008 at the age of 17 having been diagnosed with A.S only two years previous; he was also
diagnosed with ADHD. He came to us after being out of education and becoming embroiled in anti-social behaviour
with people he considered as friends; due to his lack of understanding in social situations and vulnerability in the
community, he became known to the police and was taken advantage of by his peers and ended up in court on
several occasions. This put immense strain on the family and Mum was admitted into hospital for severe
depression.
When he joined us, J was reluctant to stay at weekends choosing to go back to his home town and ‘party’ with his
peers; this led to several encounters with police and issues regarding drug use. Care staff worked closely with the
Therapy team in building relations with J and his family in order to establish levels of trust; he received anger
management and drug awareness via the therapy team and, after a time, J was able to utilize the support of the
care team when on house to further enhance his strategies coping with his anger. Prior to this, he would abscond
back to his home town on a regular basis. J was supported to work on his domestic independence and was able to
budget, shop and cook for himself independently on leaving. In his first year, his education was approached in
‘small steps’ and he achieved C+G Adult Literacy level 1. With his confidence growing and support in place; he
continued in his second year by completing and passing C+G level 1 courses in Basic construction skills and a
course in Personal Development, Team work and Leadership skills. In his last year J completed a C+G Level 1
Cert in Sport & Leisure which and undertook volunteer work in a local school supporting the Sports instructor in
lessons.
Over the three years he was with us, J went from being a confused teenager on the brink of a prison sentence to a
young man with a sound understanding of his diagnosis and how it impacted on him, his family and others around
him. He had matured into a respectful, calm individual with a brighter future. J moved into supported living near his
parents where he continued to achieve; with support, he found a part time job, has passed his driving test and is
considering his next moves in life.
‘E’
E joined us in 2008 at the age of sixteen. When he joined us, E would not communicate with people he did not
know and would respond to those he did know with minimal words. Musically he was a very bright young man with
an ability to play 6 or 7 instruments but academically he needed support in classroom expectations, understanding
of requests and putting thoughts down on paper.
Socially, E tried very hard to make friends both at and outside of school; this often ended in him being left confused
and sometimes alienated from peers. Consequently he would ‘shut down’ for days and occasionally weeks at a
time. E later described these shutdowns as padlocks on a chain; each little problem encountered was another
padlock on the chain and the more padlocks on the chain, the more he felt locked down and unable to verbalise the
problems. Therapy and care staff worked with him to unlock the chain bit by bit offering two positive outcomes for E
this taught him problem solving and also built his trust with staff.
E undertook seven GSCEs in his first year achieving c+ grades in all but two and after putting together a support
plan E went to external college to further his musical interests. Support put in place included support at college
which was gradually removed over time, debrief of his day, visual prompts to allow E to communicate to staff that
not all was well and he needed time to think and then talk to staff and supporting him with independent travel skills

| 83
allowing him to access evening interests with his peers from college. He also had several prompts to remind him
about keys, lunch money, bus pass etc.
Prior to leaving us E had passed a diploma in music, worked as a security guard at Wimbledon and played several
gigs with his college band. He was able to make ‘English pleasantries’ with most staff and communicate his issues
with a wide variety of people prior to encountering the padlock scenario. He has moved on to University to further
his education and is living with peer group.
‘N’
N comes from a military family who moved round a lot. He was born in 1981 and had a statement by 1989
N initially went to a primary school where he was labelled as disruptive and not achieving in line with his peer group.
His parent then moved him to a fee paying provision but he dropped further behind his peers. The family moved to
Germany where he was in an open plan school environment and displaying ‘challenging behaviour’. Then with his
statement and in order to provide continuity, he was sent to boarding school which lasted for 3 years. He
transferred to another school which he says was a disaster as they continually wrote to his parents to inform them
of his poor behaviour. His diagnosis was then confirmed as Asperger Syndrome and he met MR who offered him a
place at her school which specialised in AS. He says he came to us as an angry and frustrated young man and
stayed there for his secondary and post 16 education. He says he left with improved life chances.
Now 31 he is employed part time and in receipt of Disability Living Allowance and Working Tax Credit so he can
support himself. His family continue to guide him. He lives independently and has some help from his Social
Worker and the Wessex Autistic Society. He drives his own car. He says he was difficult and challenging but has
learnt to understand himself. He was thought to be ‘rubbish at everything’, but now has a job and a life. He was
previously excluded from school but learnt to adjust and channel his energy through strategies taught to him like
going running.
He said like running he gets there in the end, sometimes he falls and needs help to get up but he finishes the run!
‘T’
I remember my first week in Year Seven, I was nervous about the whole concept of meeting new people and being
away from the safety of home and family for the first time in my life. My first evening was perfect for any settling
newcomer. As soon as I said bye to my parents, I was invited out onto the field to play football and settled right in
as everyone else was in exactly the same position; nervous, curious and excited by this strange new environment
that seemed like one big adventure right from the start.
By adventure I mean seeing boarding school as one big ultimate sleepover, which it was! My mum stayed nearby
for the first few days and when it came to the weekend, I chose to stay, only because I was having the best time of
my life (and because it was a trip to Drayton Manor!).
My House was amazing, activities on a constant basis, a film every night complete with tea and toast and of course
the loving staff who were always there for me whenever I was feeling homesick.Every house I’ve lived in since has
been just as good; the care staff are all amazing people who are always there if there is a problem or just for a chat
about anything.
What I love about this place is that every single member of staff, whether it be the care staff, or teachers, or form
tutors, or anyone else is that they all seemed to genuinely care about me, I felt and still feel like part of one big
family. This is not a school to me, it is my community.
Prior to coming to this school I had few friends, my confidence was at its lowest and I was bullied quite badly. I
have now got more friends than I have ever had in my life, the social side of my life is still beyond anything I would

| 84
expect, or even ask for. This is because everyone here is equal, being bullied about deafness is rather hypocritical
here, so it doesn’t happen! From that first week in year 7, it feels like I’ve had friendships by the tap, it is so easy
here to simply talk or sign to anyone and befriend them.
Academically, I have managed to achieve beyond my wildest dreams.
This school has really helped me to realise my maximum potential. I believe this is down to not only the amazing
teachers and teaching, but because I don’t have nearly as much stress or worry about my life beyond the education
side, I can relax and truly concentrate with my work when I need to.
Had I have not come here, it is unlikely that any of this would have happened, this school has enabled my dreams
and aspirations. I will sincerely be forever indebted to this school for all it has provided me with; an education that
will allow me to do well in the future, a social environment that has bolstered my confidence and provided me with
so many friends, and finally it has prepared me for the world beyond.
‘R’
R joined us when he was 5. He had been excluded from nursery school because of challenging behaviour and
was described as being “wild” by his parents. He had a diagnosis of an autism spectrum condition and during his
early months at school this was refined by our visiting consultant psychiatrist to being pathological demand
avoidance syndrome.
Specific approaches to understanding and managing behaviour for children with PDA were implemented. Initially R
had great difficulty being with other children, his behaviour was bizarre, he seemed to live in a fantasy world often
adopting a persona from fiction, film or history.
R had some additional specific learning difficulties- dyslexia and dyscalculia and also had some continence issues.
He was conscious of these differences and this affected his self-esteem. He was always reluctant to do any
academic study but did follow some accredited courses e.g. ASDAN and did two blocks of work experience.
R’s language skills were a relative strength and as a teenager he was helped to understand his diagnosis. He
accepted that he had Asperger’s syndrome (change of diagnosis over time) and started to attend some out of
school activities with similar young people.
R still presented with challenging behaviour but was never excluded from school. Staff worked very closely with his
parents a true mutually supportive relationship.
When R was 16 he went to a resourced provision within a mainstream college where he stayed for two years.
During the end of the time there he did voluntary work, work experience and some time with a social enterprise
project – paid at minimum wage. He is now being considered for a Routes to Work programme.
R’s father died whist he was at [our school]. Because R’s placement was stable his mother was able to return to
study at University, she is now employed full time. Although she has concerns about his future employment
opportunities she is very positive about his time at school saying “he would never have turned out the way he has if
he hadn’t come to you”
What helped R?
Reassurance for his family that we would not exclude him however challenging his behaviour
Constant work on developing social understanding and social skills
Persistence in changing his behaviour
Our Multi-disciplinary team
| 85
‘K’
K started at [our school] when she was 5. She was and remains classically autistic. She had very limited
understanding of language and initially expressed her emotions and frustrations through physically challenging
behaviour, screaming, crying and some self-harm.
K was heavily dependent on routines and responded well to structured approaches in school.
In spite of this K was a sociable girl with a mischievous sense of humour. She learned to communicate using
symbols and occasional single words. She became more flexible about accessing different activities especially in
the community. She loved any craft activities and this has remained an interest, she now makes cards and gifts for
family and friends.
K built close relationships with a small number of staff and peers. At the end of Key stage 4 she moved to the
school’s post 16 provision where she remained for three years. During her last year her parents decided that K
would move into a two bed flat with a full time support team, which she did when she was 19. Her parents had
been in the forefront of person centre planning in the local authority and K was the first young person to be funded
in this way through a scheme with a local housing association. K is now 21 and is likely to remain in supported
housing for the foreseeable future; she has one to one and occasionally two to one support. She sees her parents
regularly for meals, overnight stays and holidays. They manage her personalised budget and are responsible for
appointing staff to work with her.
K’s mother has worked supporting families of children with autism throughout K’s life, running play schemes;
delivering parent support programmes and is now a full time family liaison worker.
What helped K?
Autism specific approaches especially to reduce rigidity
High levels of speech and language therapy
Small class groups and personalised programmes
Close relationships with family so that they could trust that we were all working in Karen’s best interests
Support for transition between different stages of her life within and outside school and links with respite care and outreach
Opportunities to develop skills in the community
‘D’
D lives with his mother and brother in a socially disadvantaged area. He had difficulties in primary school and
stopped attending secondary school after just one term. He had not spent a full week in school since he was 8. His
physical health was poor due to a limited diet, smoking cigarettes and cannabis, and occasionally drinking alcohol.
His emotional state was very fragile and he engaged in self-harming behaviour and committed crimes due to his
substance use.
D was not diagnosed with an autism spectrum condition until he was 13. Although many agencies engaged with
him, he did not manage to attend school. He was referred to us in April 2009 and after a period of transition, was
offered a full time place. In Key Stage 4 he studied GCSE Maths, English, Science, ECDL and the ASDAN youth
award scheme. D still experiences difficulties, but is receiving help from appropriate services to enable him to make
better choices and manage the risks in his life. He left school in July 2011 having passed three GCSEs and is now
at college training to become a hairdresser.

| 86
During our involvement with D we were also able to help his older brother indirectly; he also had a diagnosis of
autism but had never received specialist help and was NEET (not in education, employment of training). We
referred him to Connexions and they were able to arrange for him to start a bricklaying course.
There was a very positive improvement in the mental and physical health of D’s mother when he started to attend
school full time.
What helped D?
Addressing the needs that arose from his autism and taking positive steps based on this to address substance abuse with wider multi agency group
Encouraging increased attendance in school – from 38% in first half term to 98% in third half term. We welcomed him even if he was very late
Including preferred activities in day
Being positive and valuing him
Empowering him to see that choices about his future were his to make
Helping him to understand his autism
Using key workers
Parental feedback
The following are excerpts from letters written by parents to schools:
“[Your school] made him into a young man able to fit in with everybody else. He has not looked back since. If we
never achieve anything else in our lives getting him into [your school] made our lives worth while.”
“…he gradually gained confidence to cope in social situations and began to communicate with people other than
immediate family. The small classes enabled him to fulfil his academic potential.”
“Since leaving, he has gone from strength to strength! [You] totally transformed him and enabled him to cope with
life, he enrolled at [College] to do his A level and has coped incredibly well finding his way around and interacting
with the other students. He is waiting for his results. He is also working on Sundays at [a restaurant], he has made
good friendships with the other members of staff…You are all very special people and we will be eternally grateful
to you all.”
“I have always believed he will get on in life, but have met with the opinion that maybe I am just another over
optimistic mother. Now I have met others who believe the same as me, that he can do it. Staff at [your school] are
doing a job that not everyone would, or could, do…Seeing him on stage playing the drums was the best thing ever
for myself and my mum.”
“I think that what [your school] was able to teach him was a great deal of confidence in dealing with the wider world
(beyond home) and independence.”

| 87
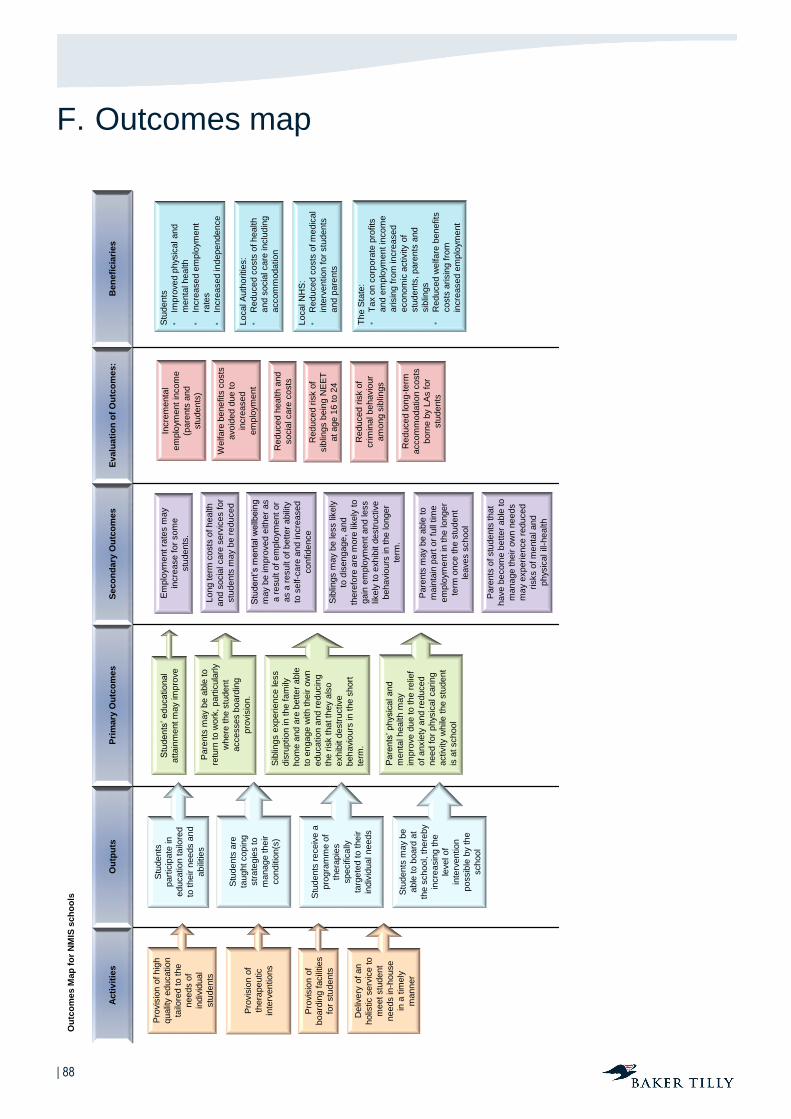
| 88
F. Outcomes map
Ac
tiv
itie
sO
utp
uts
Pri
ma
ry O
utc
om
es
Se
co
nd
ary
Ou
tco
me
sE
va
lua
tio
n o
f O
utc
om
es:
Be
ne
fic
iari
es
Stu
de
nts
’ e
du
ca
tio
na
l
atta
inm
ent m
ay
imp
rove
Pro
vis
ion o
f h
igh
qua
lity e
du
ca
tio
n
tailo
red
to
th
e
nee
ds o
f
indiv
idua
l
stu
de
nts
Pro
vis
ion o
f
board
ing f
acili
ties
for
stu
de
nts
Stu
de
nts
part
icip
ate
in
edu
ca
tio
n ta
ilore
d
to th
eir n
ee
ds a
nd
abili
tie
sP
are
nts
ma
y b
e a
ble
to
retu
rn to
wo
rk,
pa
rtic
ula
rly
wh
ere
th
e s
tude
nt
acce
sse
s b
oa
rdin
g
pro
vis
ion.
Incre
menta
l
em
plo
yme
nt
inco
me
(pare
nts
and
stu
de
nts
)
Welfare
benefits
costs
avo
ided
du
e t
o
incre
ase
d
em
plo
yme
nt
Stu
de
nts
•Im
pro
ve
d p
hysic
al a
nd
me
nta
l h
ea
lth
•In
cre
ase
d e
mp
loym
ent
rate
s
•In
cre
ased in
dependence
Em
plo
yme
nt
rate
s m
ay
incre
ase
fo
r so
me
stu
de
nts
.
Ou
tco
me
s M
ap
fo
r N
MIS
sch
oo
ls
Pro
vis
ion o
f
thera
pe
utic
inte
rve
ntio
ns
Stu
de
nts
are
taug
ht co
pin
g
str
ate
gie
s to
ma
na
ge
th
eir
co
nd
itio
n(s
)
Stu
de
nts
re
ce
ive
a
pro
gra
mm
e o
f
thera
pie
s
sp
ecific
ally
targ
ete
d to
th
eir
indiv
idua
l n
ee
ds
De
live
ry o
f a
n
holis
tic s
erv
ice
to
me
et stu
de
nt
nee
ds in
-hou
se
in a
tim
ely
ma
nn
er
Stu
de
nts
ma
y b
e
able
to
bo
ard
at
the s
ch
oo
l, t
he
reb
y
incre
asin
g the
leve
l o
f
inte
rve
ntio
n
possib
le b
y t
he
sch
oo
l
Sib
lings e
xp
erie
nce
le
ss
dis
ruptio
n in
th
e fa
mily
hom
e a
nd
are
bett
er
able
to e
ngage w
ith t
heir o
wn
edu
ca
tio
n a
nd
re
ducin
g
the r
isk t
ha
t th
ey a
lso
exh
ibit d
estr
uctive
beh
avio
urs
in
th
e s
hort
term
.
Pa
ren
ts’ p
hysic
al a
nd
me
nta
l h
ea
lth
ma
y
imp
rove
du
e to
th
e r
elie
f
of a
nxie
ty a
nd
re
du
ce
d
nee
d fo
r p
hysic
al ca
ring
activity w
hile
th
e s
tude
nt
is a
t sch
oo
l
Lon
g te
rm c
osts
of h
ea
lth
and
so
cia
l ca
re s
erv
ice
s f
or
stu
de
nts
ma
y b
e r
edu
ce
d
Stu
de
nt’s m
enta
l w
ellb
ein
g
ma
y b
e im
pro
ve
d e
ith
er
as
a r
esu
lt o
f e
mp
loym
ent
or
as a
re
su
lt o
f b
ett
er
abili
ty
to s
elf-c
are
and
in
cre
ase
d
confidence
Sib
lings m
ay
be le
ss lik
ely
to d
ise
ng
ag
e, a
nd
there
fore
are
mo
re lik
ely
to
gain
em
plo
yme
nt
an
d le
ss
like
ly t
o e
xh
ibit d
estr
uctive
beh
avio
urs
in
th
e lo
ng
er
term
.
Pa
ren
ts m
ay
be a
ble
to
ma
inta
in p
art
or
full
tim
e
em
plo
yme
nt
in th
e lo
ng
er
term
once
th
e s
tude
nt
leave
s s
ch
oo
l
Re
duce
d h
ea
lth
and
so
cia
l ca
re c
osts
Reduced r
isk o
f
sib
lings b
ein
g N
EE
T
at a
ge
16 t
o 2
4
Loca
l N
HS
:
•R
ed
uce
d c
osts
of m
edic
al
inte
rve
ntio
n f
or
stu
de
nts
and
pare
nts
Re
duce
d r
isk o
f
crim
inal b
eh
avio
ur
am
ong
sib
lings
Th
e S
tate
:
•T
ax o
n c
orp
ora
te p
rofits
and
em
plo
yme
nt
inco
me
arisin
g f
rom
incre
ase
d
econom
ic a
ctivity
of
stu
de
nts
, p
are
nts
and
sib
lings
•R
ed
uce
d w
elfa
re b
en
efits
co
sts
arisin
g f
rom
incre
ase
d e
mp
loym
ent
Loca
l A
uth
oritie
s:
•R
ed
uce
d c
osts
of h
ea
lth
and
so
cia
l ca
re in
clu
din
g
acco
mm
od
atio
n
Pa
ren
ts o
f stu
de
nts
th
at
have
be
co
me
bett
er
able
to
ma
na
ge
th
eir o
wn
nee
ds
ma
y e
xp
erie
nce
re
du
ce
d
risks o
f m
enta
l a
nd
physic
al ill
-hea
lth
Re
duce
d lo
ng
-te
rm
acco
mm
od
atio
n c
osts
born
e b
y L
As fo
r
stu
de
nts

| 89
G. Discounted Cash Flow methodology
Our analysis takes into account, where necessary, the premise that the value of money changes over time. The
value of future cash flows is subject to the risk that those cash flows will not in fact occur for any number of reasons.
For the purposes of this report, assumptions provided by participating NMIS schools have been taken to be
reflective of any risks associated with the likelihood of benefits actually flowing to the stakeholder concerned. This
leaves the risk that the value of the benefit will fluctuate due to economic factors that are beyond the control of the
school or stakeholder. This can be measured using a long term average rate of inflation. Where necessary a
discount rate of 3.5% has been used, which equates to the average rate of inflation in the UK measured over the
past twenty years, per the Bank of England. It is also consistent with the discount rate typically used by the UK
Government for project appraisal (for projects lasting for between 0 and 30 years)NNN
For benefits only during the year in which they are funded no discounting is used as both the funding and the
benefit are released during the year and the timings are therefore already matched.
Where a benefit occurs in a future year, the value of the benefit is multiplied by a discount factor to allow
comparison with the cost of funding. The discount factor is calculated using the formula below:
(
)
Where:
‘DF’ is the discount factor by which a future benefit is multiplied to restate it in current terms;
‘r’ is the discount rate used; and
‘t’ is the time, stated in years, between the date at which value is measured and the date at which the benefit is achieved.
To measure benefits that occur at a fixed value over a period of time, participating NMIS schools were asked to
assume that any future benefits occur in the form of a constant annuity over a fixed period. The expected annual
cash flow is then multiplied by an annuity factor to give the value in present day terms of the benefit. The annuity
factor is calculated using a modified discount formula, as shown below:
(
) [ (
)
]
Where:
‘AF’ is the factor by which a constant annuity is multiplied in order to obtain the present value of that annuity over a given period of time;
‘r’ is the discount rate used; and
‘t’ is the number of years the annuity is expected to occur over.
Where an annuity is to be deferred for a number of years (e.g. a project is being developed now but the savings will not be realised for several years), an annuity factor is used to calculate the present value of the incremental benefits in the future which is then multiplied by a discount factor to restate it in present day terms.
NNN Lowe, J., 2008, Intergenerational wealth transfers and social discounting: Supplementary Green Book guidance, London, HM Treasury