national air toxics program - us epa air toxics program the integrated urban strategy report to...
TRANSCRIPT
NationalAirToxicsProgram:TheSecondIntegratedUrbanAirToxicsReporttoCongress
8/21/2014

NationalAirToxicsProgramTheIntegratedUrbanStrategyReporttoCongress
ii
PageLeftBlankIntentionally
NationalAirToxicsProgramTheIntegratedUrbanStrategyReporttoCongress
iii
EPA-456/R-14-001 August 21, 2014
NationalAirToxicsProgram:TheSecondIntegratedUrbanAirToxics
ReporttoCongress
U.S. Environmental Protection Agency Office of Air Quality Planning and Standards
Outreach and Information Division Research Triangle Park, North Carolina

NationalAirToxicsProgramTheIntegratedUrbanStrategyReporttoCongress
iv
Acknowledgements
Lead Authors
OfficeofAirandRadiation
YvonneW.Johnson,projectlead
ReginaChappell,projectlead
RichCook
JenevaCraig
BarbaraDriscoll
MarcHouyoux
TedPalma
KellyRimer
NateTopham
MargaretZawacki
OfficeofResearchandDevelopment
JanetBurke
SarahMazur
Contributing Authors
OfficeofAirandRadiation
MikeJones
LauraMcKelvey
SharonNizich
ChrisStoneman
OfficeofEnforcementandCompliance
ScottThrowe
OfficeofPolicy
WilliamNickerson
OfficeofResearchandDevelopment
RichardBaldauf
PhilipBushnell
MichaelHays
DanielleLobdell
YolandaSanchez

NationalAirToxicsProgramTheIntegratedUrbanStrategyReporttoCongress
v
JohnStanek
TimWatkins
LarkeWilliams
Additional Contributions to the Report
TheU.S.EPAOfficeofChildren’sHealth
TheU.S.EPAOfficeofEnvironmentalJustice
NationalAirToxicsProgramTheIntegratedUrbanStrategyReporttoCongress
vi
TableofContentsNationalAirToxicsProgram: ............................................................................................................. iii U.S. Environmental Protection Agency ................................................................................................. iii Acronyms and Abbreviations ................................................................................................................ ix Executive Summary .............................................................................................................................. xii Chapter 1: Introduction and Background ........................................................................................... 1‐1 1.1. What are Air Toxics? ............................................................................................................ 1‐1 1.2. Relevant CAA Air Toxics Requirements ............................................................................... 1‐1 1.3. The Integrated Urban Air Toxics Strategy ........................................................................... 1‐2 1.3.1. List of 30 Urban Hazardous Air Pollutants ................................................................... 1‐3 1.3.2. Area Source Categories ................................................................................................ 1‐4
1.4. First Report to Congress ...................................................................................................... 1‐5 1.5. Second Report to Congress Overview ................................................................................. 1‐6
Chapter 2: Standard‐Setting Activities ................................................................................................ 2‐1 2.1. Introduction ......................................................................................................................... 2‐1 2.2. Air Toxics Standard Setting for Area and major Sources .................................................... 2‐2 2.2.1. Emission Standards for Area Sources .......................................................................... 2‐3 2.2.2. Emission Standards for Major Sources ........................................................................ 2‐4
2.3. Air Toxic Standard Setting for Mobile Sources .................................................................... 2‐6 2.3.1. Urban HAPs Emitted from Mobile Sources .................................................................. 2‐6 2.3.2. Mobile Source Emission Control Programs .................................................................. 2‐6 2.3.3. Recent and Upcoming Mobile Source Rulemaking Activities ...................................... 2‐7 2.3.4. Near‐Roadway Pollution .............................................................................................. 2‐8
2.4. Continued Efforts ................................................................................................................ 2‐9 Chapter 3: Identifying Air Toxics Risks in Urban Areas ....................................................................... 3‐1 3.1. Introduction ......................................................................................................................... 3‐1 3.1.1. Data Gaps and Limitations ........................................................................................... 3‐2
3.2. National Emissions Reduced Significantly Since 1990 ........................................................ 3‐3 3.3. National Air Toxics Monitoring: Key Pollutants Declining ................................................... 3‐5 3.4. Pollutant‐Specific Emissions and Monitoring Trends .......................................................... 3‐8 3.4.1. Benzene Levels Decline by 66 Percent from 1994 to 2009 .......................................... 3‐8 3.4.2. U.S. Mercury Emissions ................................................................................................ 3‐9 3.4.3. Dioxin Levels Are Down .............................................................................................. 3‐11 3.4.4. Lead Emissions and Blood Lead Levels Have Been Significantly Reduced ................. 3‐12 3.4.5. Diesel Emissions Have Been Significantly Reduced ................................................... 3‐14
3.5. Evaluating Air Toxics Risks ................................................................................................. 3‐15 3.5.1. Summary of 2005 NATA Risk Results ......................................................................... 3‐17 3.5.2. Urban Areas with the Highest Cancer Risk ................................................................ 3‐19
3.6. Overall Findings In This Chapter and Continued Efforts ................................................... 3‐24 Chapter 4: National, Regional and Community‐Based Initiatives ....................................................... 4‐1 4.1. Introduction ......................................................................................................................... 4‐1 4.2. Area‐wide Activities ............................................................................................................. 4‐2 4.3. State, Tribal and Local Government Initiatives and Programs ............................................ 4‐2 4.4. Community‐Based Initiatives .............................................................................................. 4‐4
NationalAirToxicsProgramTheIntegratedUrbanStrategyReporttoCongress
vii
4.4.1. Community Air Risk Reduction Initiative (CARRI) ........................................................ 4‐4 4.4.2. Community Action for a Renewed Environment (CARE) ............................................. 4‐4
4.5. Sustainable Skylines Initiative (SSI) ..................................................................................... 4‐6 4.6. Community‐Scale Air Toxics Ambient Monitoring Grants .................................................. 4‐7 4.7. National Initiatives .............................................................................................................. 4‐7 4.7.1. Wood Smoke Reduction Initiative ............................................................................... 4‐7 4.7.2. Collision Repair Campaign ............................................................................................ 4‐9 4.7.3. School Air Toxics Monitoring Project Study ............................................................... 4‐10
4.8. Mobile Source Initiatives ................................................................................................... 4‐11 4.8.1. National Clean Diesel Campaign ................................................................................ 4‐11 4.8.2. SmartWay ................................................................................................................... 4‐12 4.8.3. Clean School Bus USA ................................................................................................. 4‐12
4.9. National Enforcement‐Based Initiatives ............................................................................ 4‐13 4.10. Continued Efforts .............................................................................................................. 4‐13
Chapter 5: Education and Outreach ................................................................................................... 5‐1 5.1. Introduction ......................................................................................................................... 5‐1 5.2. State, Tribal and Local Partnerships .................................................................................... 5‐1 5.3. Training and Outreach ......................................................................................................... 5‐2 5.4. Implementation Assistance Tools ....................................................................................... 5‐3 5.5. Information Management and Public Awareness............................................................... 5‐3 5.6. Continued Efforts ................................................................................................................ 5‐5
Chapter 6: Research to Address Knowledge Gaps .............................................................................. 6‐1 6.1. Introduction ......................................................................................................................... 6‐1 6.2. Exposure Assessment .......................................................................................................... 6‐3 6.2.1. Characterization of Need ............................................................................................. 6‐3 6.2.2. Progress Thus Far ......................................................................................................... 6‐4
6.3. Health Effects – Hazard Identification and Dose‐Response Assessment .......................... 6‐10 6.3.1. Characterization of Need ........................................................................................... 6‐10 6.3.2. Progress Thus Far ....................................................................................................... 6‐10
6.4. Risk Assessment And Risk Characterization ...................................................................... 6‐14 6.4.1. Characterization of Need ........................................................................................... 6‐14 6.4.2. Progress Thus Far ....................................................................................................... 6‐14
6.5. Risk Management .............................................................................................................. 6‐16 6.5.1. Characterization of Need ........................................................................................... 6‐16 6.5.2. Progress Thus Far ....................................................................................................... 6‐16
6.6. Research For The 21ST Century .......................................................................................... 6‐17 Chapter 7: Conclusions and Looking Ahead ........................................................................................ 7‐1 Appendix A. Standard‐Setting Activities ................................................................................................ 1 A.1. Source Categories Subject to Standards under Sections 112 and 129 ....................................... 1 A.2. Risk and Technology Review (RTR) Program .............................................................................. 6
Appendix B. Air Toxics Assessments ...................................................................................................... 1 B.1. National Air Toxics Trends Station (NATTS) Network Sites ......................................................... 1 B.2. Urban HAP Trend Analysis .......................................................................................................... 2
Appendix C. Urban Air Toxics Studies .................................................................................................... 1 C.1. Overview ..................................................................................................................................... 1 C.2. Summaries of Studies .................................................................................................................. 2

NationalAirToxicsProgramTheIntegratedUrbanStrategyReporttoCongress
viii
Appendix D. Integrated Risk Information System (IRIS) Status ............................................................. 1 D.1. Status of Progress of Updates to IRIS assessments .................................................................... 1
References Cited .................................................................................................................................... 1

NationalAirToxicsProgramTheIntegratedUrbanStrategyReporttoCongress
ix
AcronymsandAbbreviations
ACE Air, Climate and EnergyAMS Air Management ServicesAPEX Air Pollutant ExposureAPTI Air Pollution Training Institute AQMP Air Quality Management Plan AQS Air Quality System BMDS Benchmark Dose Software CAA Clean Air ActCalEPA California Environmental Protection Agency CARE Community Action for Renewed Environment CARRI Community Air Risk Reduction Initiative CAS Chemical Abstract ServiceCBSA Core Based Statistical Areas CDC Centers for Disease Control and Prevention CFR Code of Federal RegulationsCHAD Consolidated Human Activity DatabaseCISWI Commercial and Industrial Solid Waste Incinerators CMAQ Community Multi‐Scale Air Quality CMAQ‐MP CMAQ Multipollutant Model CNS Central Nervous System CO Carbon Monoxide CRTS Community Risk and Technical Support DEARS Detroit Exposure and Aerosol Research Study DEQ Department of Environmental QualityDERA Diesel Emissions Reduction Provisions of the Energy Policy Act DHHS U.S. Department of Health and Human Services DOE U.S. Department of Energy DOT U.S. Department of Transportation DPM Diesel Particulate Matter EGU Electric Generating UnitEIS Emissions Inventory System EPM Environmental Program Management FACA Federal Advisory Committee ActFDA U.S. Food and Drug Administration FR Federal RegisterFSIS Food Safety and Inspection Service GACT Generally Achievable Control Technology GIS Geographic Information System GPS Global Positioning System HAD Health Assessment Document HAP Hazardous Air PollutantHAPEM Hazardous Air Pollutant Exposure Model HC HydrocarbonHEATS Houston Exposure to Air Toxics Study HEI Health Effects Institute HERO Health and Environmental Research Online HHRA Human Health Risk AssessmentHI Hazard Index

NationalAirToxicsProgramTheIntegratedUrbanStrategyReporttoCongress
x
HMIWI Hospital/Medical/Infectious Waste Incinerators I/M Inspection and MaintenanceIARC International Agency for Research on Cancer IRIS Integrated Risk Information SystemISA Integrated Science Assessments ITEP Institute for Tribal Environmental Professionals LAX Los Angeles International Airport LCA Life‐Cycle Analysis LMS Learning Management System MACT Maximum Achievable Control TechnologyMAP Mercury Action Plan MATES Multiple Air Toxics Exposure StudyMATS Mercury and Air Toxics StandardsMSATs Mobile Source Air Toxics MWC Municipal Waste Combustors MYP Multi‐Year PlanNAAQS National Ambient Air Quality StandardsNACAA National Association of Clean Air Agencies NATA National Air Toxics AssessmentNATTS National Air Toxics Trends StationNEG/ECP New England Governors and Eastern Canadian Premiers NEI National Emissions Inventory NEJAC National Environmental Justice Advisory Council NESCAUM Northeast States for Coordinated Air Use Management NESHAP National Emission Standards for Hazardous Air Pollutants NexGen Advancing the Next Generation of Risk Assessment NEXUS Near‐Road Exposures and Effects from Urban Air Pollutants StudyNHANES National Health and Nutrition Examination Survey NIEHS National Institutes of Environmental Health Sciences NIOSH National Institute for Occupational Safety and Health NRC National Research Council NTAA National Tribal Air AssociationNTEC National Tribal Environmental CouncilNTI National Toxics Inventory OAQPS Office of Air Quality Planning and Standards OAR Office of Air and RadiationOECA Office of Enforcement and Compliance Assurance OIG Office of Inspector GeneralORD Office of Research and Development OSWI Other Solid Waste Incinerators P2 Pollution PreventionPAH Polycyclic Aromatic Hydrocarbons PATA Portland Air Toxics Assessment PBT Persistent Bioaccumulative ToxicsPCBs Polychlorinated BiphenylsPEMS Portable Emission Measurement Systems PM Particulate MatterPOM Polycyclic Organic Matter PPRTV Provisional Peer Reviewed Toxicity Values RARE Regional Applied Research EffortREACH Registration, Evaluation Authorization and Restriction of ChemicalsRfC Reference Concentration
NationalAirToxicsProgramTheIntegratedUrbanStrategyReporttoCongress
xi
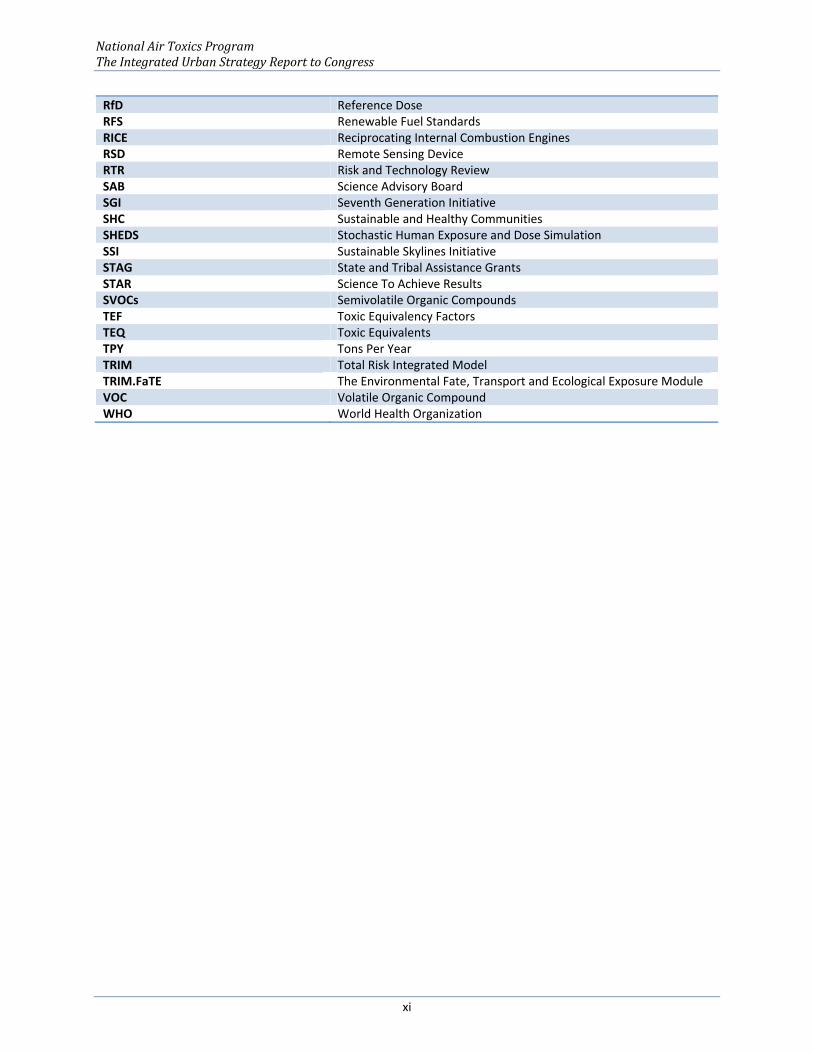
RfD Reference DoseRFS Renewable Fuel Standards RICE Reciprocating Internal Combustion Engines RSD Remote Sensing Device RTR Risk and Technology ReviewSAB Science Advisory Board SGI Seventh Generation Initiative SHC Sustainable and Healthy CommunitiesSHEDS Stochastic Human Exposure and Dose Simulation SSI Sustainable Skylines InitiativeSTAG State and Tribal Assistance Grants STAR Science To Achieve Results SVOCs Semivolatile Organic CompoundsTEF Toxic Equivalency Factors TEQ Toxic Equivalents TPY Tons Per YearTRIM Total Risk Integrated Model TRIM.FaTE The Environmental Fate, Transport and Ecological Exposure ModuleVOC Volatile Organic CompoundWHO World Health Organization
NationalAirToxicsProgramTheIntegratedUrbanStrategyReporttoCongress
xii
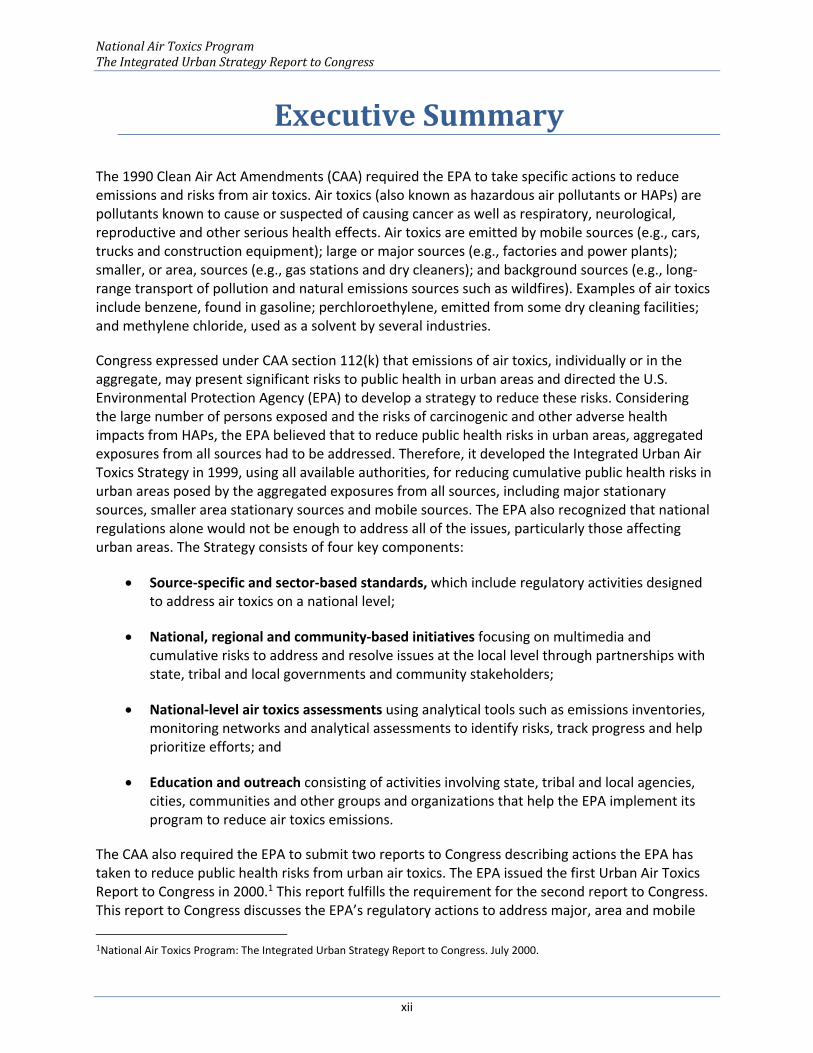
ExecutiveSummary
The 1990 Clean Air Act Amendments (CAA) required the EPA to take specific actions to reduce emissions and risks from air toxics. Air toxics (also known as hazardous air pollutants or HAPs) are pollutants known to cause or suspected of causing cancer as well as respiratory, neurological, reproductive and other serious health effects. Air toxics are emitted by mobile sources (e.g., cars, trucks and construction equipment); large or major sources (e.g., factories and power plants); smaller, or area, sources (e.g., gas stations and dry cleaners); and background sources (e.g., long‐range transport of pollution and natural emissions sources such as wildfires). Examples of air toxics include benzene, found in gasoline; perchloroethylene, emitted from some dry cleaning facilities; and methylene chloride, used as a solvent by several industries.
Congress expressed under CAA section 112(k) that emissions of air toxics, individually or in the aggregate, may present significant risks to public health in urban areas and directed the U.S. Environmental Protection Agency (EPA) to develop a strategy to reduce these risks. Considering the large number of persons exposed and the risks of carcinogenic and other adverse health impacts from HAPs, the EPA believed that to reduce public health risks in urban areas, aggregated exposures from all sources had to be addressed. Therefore, it developed the Integrated Urban Air Toxics Strategy in 1999, using all available authorities, for reducing cumulative public health risks in urban areas posed by the aggregated exposures from all sources, including major stationary sources, smaller area stationary sources and mobile sources. The EPA also recognized that national regulations alone would not be enough to address all of the issues, particularly those affecting urban areas. The Strategy consists of four key components:
Source‐specific and sector‐based standards, which include regulatory activities designed to address air toxics on a national level;
National, regional and community‐based initiatives focusing on multimedia and cumulative risks to address and resolve issues at the local level through partnerships with state, tribal and local governments and community stakeholders;
National‐level air toxics assessments using analytical tools such as emissions inventories, monitoring networks and analytical assessments to identify risks, track progress and help prioritize efforts; and
Education and outreach consisting of activities involving state, tribal and local agencies, cities, communities and other groups and organizations that help the EPA implement its program to reduce air toxics emissions.
The CAA also required the EPA to submit two reports to Congress describing actions the EPA has taken to reduce public health risks from urban air toxics. The EPA issued the first Urban Air Toxics Report to Congress in 2000.1 This report fulfills the requirement for the second report to Congress. This report to Congress discusses the EPA’s regulatory actions to address major, area and mobile
1National Air Toxics Program: The Integrated Urban Strategy Report to Congress. July 2000.

NationalAirToxicsProgramTheIntegratedUrbanStrategyReporttoCongress
xiii
sources of air toxics; provides background information on emissions and monitoring data; discusses areas of the country that continue to experience elevated risks to public health as a result of emissions of air toxics; describes national, regional and community‐based initiatives to address air toxics; provides detail on the EPA’s education and outreach efforts; and identifies the data gaps and limitations that affect our understanding of the air toxics program.
Because mobile sources are being included in this second report, as in the first report to Congress, we address both the pollutants listed in Section 112(b) and pollutants that are mobile source air toxics (that is, compounds that are emitted by mobile sources and have the potential for serious adverse health effects). As a result, this report includes discussion of diesel exhaust (diesel particulate matter and diesel exhaust organic gases). The EPA has identified diesel exhaust as a mobile source air toxic of particular concern in its 2000 and 2007 mobile source air toxics rules and its National Air Toxics Assessments (U. S. EPA, 2000; U. S. EPA, 2007).
Major findings of this report:
Overall air toxics emissions (from major, area and mobile sources) have significantly declined since 1990. For stationary sources, it is estimated that over 1.5 million tons per year of HAPs have been removed from the air due to standards promulgated, or made into law, by the EPA. In addition, the EPA also estimates that about three million tons per year of co‐benefit criteria pollutant reductions have been achieved as a result of these promulgated standards.
Mobile source emissions have been reduced by approximately 50 percent, about 1.5 million tons of HAPs, since 1990. With additional fleet turnover, we expect these reductions to grow to 80 percent by the year 2030.
These reductions have been achieved through the following:
The EPA has issued emission standards for 68 area source categories, representing 90 percent of the emissions of the 30 urban HAPs.2 These include standards for drycleaners, hazardous waste combustors, medical waste incinerators, iron and steel foundries and paint‐stripping operations.
Since 1990, the EPA has issued 97 maximum achievable control technology (MACT) standards covering 174 major source categories. Some of these sources include gasoline distribution facilities, chemical plants, petroleum refineries and steel mills. Most recently, the EPA promulgated the 2012 Mercury and Air Toxics Standards for utilities.
The EPA has issued emissions standards to assure that sources accounting for not less than 90 percent of the aggregate emissions of each of the seven persistent and bioaccumulative pollutants listed in the CAA are addressed. These pollutants are
2On March 21, 2011, EPA completed its requirement under the Clean Air Act to assure that area sources accounting for 90 percent of the aggregate area source emissions of each of the 30 urban HAPs are subject to regulation. Simultaneously, EPA issued a notice that the Agency had completed its requirement under the Clean Air Act to assure that sources accounting for not less than 90 percent of the aggregate emissions of each of the seven HAP enumerated under Section 112(c)(6) are subject to standards. Topham to Docket, Emission Standards for Meeting the 90 Percent Requirement Under Section 112(c)(6) of the Clean Air Act (found in Docket ID EPA–HQ–OAR–2004–0505).

NationalAirToxicsProgramTheIntegratedUrbanStrategyReporttoCongress
xiv
alkylated lead compounds, polycyclic organic matter (POM), mercury, hexachlorobenzene, polychlorinated biphenyls (PCB), 2,3,7,8‐tetrachlorodibenzofurans (TCDF) and 2,3,7,8‐tetrachlorodibenzo‐p‐dioxin (TCDD).
For mobile sources, the EPA issued a rule in 2007 to reduce air toxics from gasoline‐fueled passenger vehicles, gasoline fuel and portable fuel containers. In addition, the EPA has issued many rules to reduce volatile organic compounds, including gaseous air toxics, and diesel particulate matter (PM) from a range of on‐ and off‐road gasoline and diesel vehicles and equipment.3 Exhaust from diesel engines contains many urban air toxics, such as acetaldehyde, acrolein, benzene, 1,3‐butadiene, formaldehyde and polycyclic aromatic hydrocarbons.
The EPA has also issued numerous regulations that either have directly (using PM as a surrogate for toxic metals), or indirectly as a co‐benefit, reduced PM as a result of the control equipment we anticipate will be installed.4 For example, PM emissions from the integrated iron and steel industry estimate to be reduced by 5,800 tons per year5, and PM emissions from power plants to be reduced by 52,000 tons per year.6
Emission reductions have also been achieved through non‐regulatory efforts such as the National Clean Diesel Campaign, administered by the EPA through the Diesel Emissions Reduction provisions of the Energy Policy Act of 2005 (DERA). The EPA has provided funding to national and state programs to support the implementation of diesel emission reduction technologies. Over their lifetime, these projects are estimated to reduce at least 12,500 tons of diesel PM, in addition to large reductions in emissions of other pollutants.
In addition to developing regulatory air toxics programs, many state, tribal and local agencies have moved forward with voluntary programs, which have been effective in achieving air toxics emission reductions. Certain industries have been proactive in participating in these programs.
Monitors show reduced levels of key air toxics in outdoor air. Ambient concentrations of many air toxics (especially those that drive national cancer risk) show notable decreases nationally. Benzene and lead are two air toxics that have been monitored for many years. Since 1994, ambient levels of benzene have declined 66 percent. Across the country, ambient levels of lead decreased 84 percent between 1990 and 2010. For this report, the EPA completed an analysis of HAP emissions trends in urban areas based on recent monitoring data. All pollutants, except for two, show a decrease in average concentrations across selected metropolitan areas between 2003 and 2010. The greatest reductions occurred for arsenic, benzene, 1,3‐butadiene, lead, nickel and tetrachloroethylene. Chloroform and dichloromethane show a slight increase in national trends primarily due to a few sites located near industry using these solvents or roadways. Thus, even though the trend for a given pollutant nationwide could be down, this does not mean that
372 FR 8427. February 26, 2007. 4Particulate matter is not an air toxic, however, it is a surrogate for some air toxics. 568 FR 27646. May 20, 2003. 6Mercury Air Toxics Standard. 77 FR 9304. February 16, 2012.

NationalAirToxicsProgramTheIntegratedUrbanStrategyReporttoCongress
xv
concentrations are necessarily decreasing in every place with a monitor.
Some areas around the country have elevated levels of risks from air toxics. The EPA’s 2005 National Air Toxics Assessment (NATA)7 estimated that based on 2005 conditions, the national average cancer risk was about 50 in a million due to emissions of air toxics from all outdoor sources (i.e., all stationary sources and mobile sources as well as background and secondary formation). NATA also estimated that based on 2005 conditions, more than 13.8 million people mainly in urban locations were exposed to cancer risks greater than 100 in a million due to these emissions of air toxics. While emissions from three pollutants, namely formaldehyde, benzene and acetaldehyde, contributed to about two‐thirds of the total risks at a national level; each urban area had a unique set of sources and pollutants that drive the risk.
The EPA is partnering with state, tribal and local governments and communities to reduce risks from air toxics. Since 2001, the EPA has provided just under $20 million in grant funding to communities to assess air toxics impacts and find local solutions to reduce releases of HAPs, first under the Community Air Risk Reduction Initiative (CARRI) and then the Community Action for a Renewed Environment (CARE) program. Most of the recipients of these grants are from low income, minority or tribal communities. Since 2008, the EPA has also provided over $500 million in funding to reduce emissions from diesel engines, many of which are located in urban areas, under the National Clean Diesel Campaign.
The EPA focused compliance and enforcement efforts on communities that are known to be affected by significant air toxic emissions and has identified previously unknown emissions of air toxics. Since 2004, federal enforcement cases have resulted in approximately 5,000 tons of HAP reductions. In addition, the Federal Air Toxics Enforcement Initiative has resulted in facilities installing an estimated $42 million in pollution controls.
The EPA continues to address air toxics research needs. The EPA is conducting research to make further progress in understanding and reducing potential for human health and environmental effects related to air toxics. The quality and quantity of data supporting EPA’s air toxics program have improved since 1990, with better emissions information, health benchmark data, models and monitoring data. The EPA also has more effective analytical tools, including models that account more fully for exposure and transformation of pollutants over time; however, there remain areas where additional information is needed. This report includes a summary of research needs and knowledge gaps identified in the first report to Congress. For example, to improve the EPA’s exposure assessments and our ability to track progress, this report identified the need for measurement data and human activity patterns to better model exposure microenvironments, such as urban areas or indoor environments. This report also highlights current or recent air toxics research
7The 2005 National Air Toxic Assessment technical report and results can be found on the EPA website at: http://www.epa.gov/ttn/atw/nata2005/index.html. It should be noted that the 2005 NATA represents a snap‐shot of conditions in 2005 and, as such, does not reflect current conditions. Since 2005, the EPA, states, and communities have implemented a number of programs to reduce air toxics emissions. The EPA is in the process of updating its NATA using more recent data.
NationalAirToxicsProgramTheIntegratedUrbanStrategyReporttoCongress
xvi
activities and describes ways to improve or bolster existing efforts, with the goal of reducing the public health impacts of air toxics emissions in the future.
Conclusion:
Through the EPA’s efforts and those of our partners, emissions and concentrations of toxic air pollution in the outdoor air are decreasing in both urban and rural communities across the United States. However, despite the significant strides in the air toxics program, many areas around the country remain with elevated risks from air toxics compared to areas of the country with very few or no sources of air toxics emissions. These risks occur mostly in urban areas where emission sources can be more concentrated, in communities near facilities emitting toxic air pollution and near roadways. One of the ways the EPA will continue to address urban air toxics on numerous fronts, including joint efforts with state, tribal and local governments, is through regulations called for under the CAA. In addition, the EPA will continue to address data gaps and other research needs, improve emissions data reporting systems and better integrate pollution prevention and voluntary programs in regulatory and non‐regulatory efforts to ensure protection of public health and to better manage air quality.

NationalAirToxicsProgramTheIntegratedUrbanStrategyReporttoCongress
1‐1
Chapter1: IntroductionandBackground
1.1. WHATAREAIRTOXICS?
Air toxics are pollutants known to cause or suspected of causing cancer or other serious health effects (e.g., birth defects, reproductive effects).8 Most air toxics originate from on‐road mobile sources (e.g., cars, trucks); off‐road mobile sources (e.g., construction equipment and lawn mowers); major stationary sources (e.g., factories, refineries, power plants); smaller area sources (e.g., hospital sterilizers and small publicly owned treatment works); and indoor sources (e.g., some building materials and cleaning solvents). The long‐range transport of pollution and natural emissions sources such as wildfires and volcanoes can also contribute to the “background” levels of toxics in the air. Examples of toxic air pollutants include benzene, found in gasoline; tetrachloroethylene (i.e., perchloroethylene), emitted from some dry cleaning facilities; and dichloromethane (i.e., methylene chloride), used as a solvent by several industries. Exhaust from diesel engines contains many urban air toxics, such as acetaldehyde, acrolein, benzene, 1,3‐butadiene, formaldehyde and polycyclic aromatic hydrocarbons, and diesel exhaust itself is a likely human carcinogen and may cause other serious effects (U.S. EPA, 2002a).
More than half of the 187 HAPs listed by Congress in the CAA are known or suspected to cause cancer. In addition, many HAPs can cause noncancer health effects, such as damage to the immune, respiratory, neurological, reproductive and developmental systems. Health concerns can result from both short‐term and long‐term exposure. HAPs can disperse locally, regionally, nationally or globally and after deposition can persist in the environment for long periods of time, bioaccumulate in the food chain, or both.
The health risks from exposure to air toxics are greater in urban areas due to the concentration of air pollution sources, including mobile and stationary sources, and population density. Health effects from exposure to HAPs might be more severe to more susceptible or sensitive populations such as children or individuals with compromised health status, or members of disproportionately impacted communities.
1.2. RELEVANTCAAAIRTOXICSREQUIREMENTS
The air toxics provisions of the CAA were substantially amended in 1990. Section 112(d) requires the EPA to issue emissions standards for certain stationary sources of HAPs. Section 112(k) focuses on HAP emissions from smaller stationary sources or area sources in urban areas that could individually, or in the aggregate, present significant risks to public health.9 Section 112(k)(3) directs the EPA to develop a comprehensive national strategy to control emissions of air toxics from area
8The use of the terms “air toxics” or “toxic air pollutants” in this report refers specifically to those pollutants that are listed under section 112(b) of the CAA as “hazardous air pollutants” or HAPs. 9Area sources are those stationary sources that emit, or have the potential to emit, less than 10 tons per year of any one HAP and less than 25 tons per year of a combination of HAPs.

NationalAirToxicsProgramTheIntegratedUrbanStrategyReporttoCongress
1‐2
sources in urban areas. This section also requires the EPA to identify at least 30 HAPs emitted from area sources that present the greatest threat to public health in the largest number of urban areas and the source categories emitting such pollutants. After identifying the source categories, section 112(k) requires the EPA to ensure that 90 percent or more of the aggregate emissions of each of the 30 identified air toxics are subject to standards. Section 112(k)(5) requires the EPA to submit two reports to Congress on actions taken under section 112(k) to reduce the risk to public health posed by the release of HAPs from area sources.
In addition to section 112, section 202(l) requires the EPA to issue a study of the need for, and feasibility of, controlling emissions of toxic air pollutants which are unregulated under the Act and associated with motor vehicles and motor vehicle fuels, and the need for and feasibility of, controlling such emissions and the means and measures for such controls. The Act required the EPA, based on the study, to issue regulations containing reasonable requirements to control air toxics from motor vehicles and motor vehicle fuels. This study was completed in 1993 (U.S. EPA, 1993) and EPA issued regulations addressing mobile source air toxics in 2000 and 2007 (U.S. EPA, 2000, 2007).
1.3. THEINTEGRATEDURBANAIRTOXICSSTRATEGY
As noted above, section 112(k)(3) instructs the EPA to develop a comprehensive strategy to control emissions of HAPs from area sources in urban areas. Considering the large number of persons exposed and the risks of carcinogenic and other adverse health effects from HAPs, the EPA believed that to reduce public health risks in urban areas, aggregated exposures from all sources had to be addressed. The EPA also recognized that national regulations alone would not be enough to address all of the issues, particularly those affecting urban areas. Therefore, the Integrated Urban Air Toxics Strategy10 (Strategy) was developed in 1999, using all available authorities, for reducing cumulative public health risks in urban areas posed by the aggregated exposures from all sources, including major stationary sources, smaller area stationary sources and mobile sources. The Strategy, relying on the requirements of sections 112(c), 112(k) and 202(l), consists of four key components:
Source‐specific and sector‐based standards which include regulatory activities designed to address air toxics on a national level;
National, regional and community‐based initiatives focusing on multimedia and cumulative risks to address and resolve issues at the local level through partnerships with state, tribal and local governments and community stakeholders;
National‐level air toxics assessments using analytical tools such as emissions inventories, monitoring networks and analytical assessments to identify risks, track progress and help prioritize efforts; and
Education and outreach consisting of activities involving state, tribal and local agencies, cities, communities and other groups and organizations that help the EPA implement its
10The National Air Toxics Program: The Integrated Urban Strategy. July 19, 1999. 64 FR 38706.

NationalAirToxicsProgramTheIntegratedUrbanStrategyReporttoCongress
1‐3
program to reduce air toxics emissions.
In addition, the Strategy includes three goals, two mandated by section 112(k) and the third being an overall programmatic goal to address populations and areas disproportionately impacted by air toxics. The goals of the Strategy are as follows:
Attain a 75 percent reduction in incidence of cancer attributable to exposure to HAPs emitted by stationary sources;
Attain a substantial reduction in public health risks (such as birth defects and reproduction effects) posed by HAP emissions from area sources; and
Address disproportionate impacts of air toxics hazards across urban areas.
1.3.1. Listof30UrbanHazardousAirPollutants
The Strategy also addresses the requirements of CAA section 112(c)(3) and (k)(3)(B). First, consistent with sections 112(c)(3) and 112(k)(3)(B), the agency must identify at least 30 HAPs, “which, as the result of emissions from area sources, present the greatest threat to public health in the largest number of urban areas.” The EPA met this requirement in 1999 in the Integrated Urban Air Toxics Strategy. Specifically, in the Strategy, the EPA identified 30 HAPs that pose the greatest potential health threat in urban areas, and these HAPs are referred to as the “30 urban HAPs.” In the Strategy, the EPA also identified an additional three HAPs, but these HAPs were not generally emitted by area sources and as such were not included as part of the 30 urban HAPs. The three additional HAPs are coke oven emissions, 1,2‐dibromoethane and carbon tetrachloride. Exhibit 1‐1 includes the list of the 30 urban HAPs.
Exhibit 1‐1. List of the 30 Urban HAPs
Acetaldehyde Dioxin Mercury compounds
Acrolein Propylene dichloride Methylene chloride (dichloromethane)
Acrylonitrile 1,3‐dichloropropene Nickel compounds
Arsenic compounds Ethylene dichloride (1,2‐dichloroethane)
Polychlorinated biphenyls (PCBs)
Benzene Ethylene oxide Polycyclic organic matter (POM)
Beryllium compounds Formaldehyde Quinoline
1,3‐butadiene Hexachlorobenzene 1,1,2,2‐tetrachloroethane
Cadmium compounds Hydrazine Tetrachloroethylene (perchloroethylene)
Chloroform Lead compounds Trichloroethylene
Chromium compounds Manganese compounds Vinyl chloride
NationalAirToxicsProgramTheIntegratedUrbanStrategyReporttoCongress
1‐4
1.3.2. AreaSourceCategories
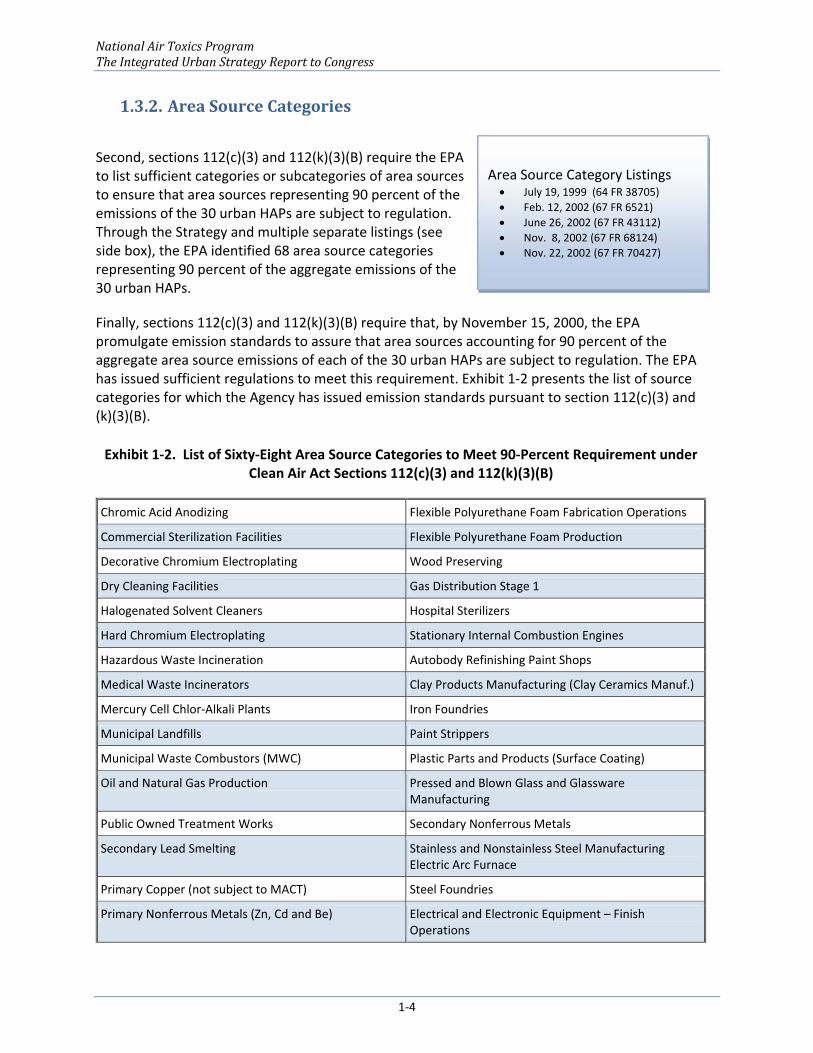
Second, sections 112(c)(3) and 112(k)(3)(B) require the EPA to list sufficient categories or subcategories of area sources to ensure that area sources representing 90 percent of the emissions of the 30 urban HAPs are subject to regulation. Through the Strategy and multiple separate listings (see side box), the EPA identified 68 area source categories representing 90 percent of the aggregate emissions of the 30 urban HAPs.
Finally, sections 112(c)(3) and 112(k)(3)(B) require that, by November 15, 2000, the EPA promulgate emission standards to assure that area sources accounting for 90 percent of the aggregate area source emissions of each of the 30 urban HAPs are subject to regulation. The EPA has issued sufficient regulations to meet this requirement. Exhibit 1‐2 presents the list of source categories for which the Agency has issued emission standards pursuant to section 112(c)(3) and (k)(3)(B).
Exhibit 1‐2. List of Sixty‐Eight Area Source Categories to Meet 90‐Percent Requirement under Clean Air Act Sections 112(c)(3) and 112(k)(3)(B)
Chromic Acid Anodizing Flexible Polyurethane Foam Fabrication Operations
Commercial Sterilization Facilities Flexible Polyurethane Foam Production
Decorative Chromium Electroplating Wood Preserving
Dry Cleaning Facilities Gas Distribution Stage 1
Halogenated Solvent Cleaners Hospital Sterilizers
Hard Chromium Electroplating Stationary Internal Combustion Engines
Hazardous Waste Incineration Autobody Refinishing Paint Shops
Medical Waste Incinerators Clay Products Manufacturing (Clay Ceramics Manuf.)
Mercury Cell Chlor‐Alkali Plants Iron Foundries
Municipal Landfills Paint Strippers
Municipal Waste Combustors (MWC) Plastic Parts and Products (Surface Coating)
Oil and Natural Gas Production Pressed and Blown Glass and Glassware Manufacturing
Public Owned Treatment Works Secondary Nonferrous Metals
Secondary Lead Smelting Stainless and Nonstainless Steel Manufacturing Electric Arc Furnace
Primary Copper (not subject to MACT) Steel Foundries
Primary Nonferrous Metals (Zn, Cd and Be) Electrical and Electronic Equipment – Finish Operations
Area Source Category Listings July 19, 1999 (64 FR 38705)
Feb. 12, 2002 (67 FR 6521)
June 26, 2002 (67 FR 43112)
Nov. 8, 2002 (67 FR 68124)
Nov. 22, 2002 (67 FR 70427)

NationalAirToxicsProgramTheIntegratedUrbanStrategyReporttoCongress
1‐5
Exhibit 1‐2. List of Sixty‐Eight Area Source Categories to Meet 90‐Percent Requirement under Clean Air Act Sections 112(c)(3) and 112(k)(3)(B)
Polyvinyl Chloride and Copolymers Production Heating Equipment, Except Electric
Secondary Copper Smelting Industrial Machinery and Equipment – Finish Operations
Acrylic Fibers/Modacrylic Fibers Production Iron and Steel Forging
Carbon Black Production Fabricated Metal Products
Chemical Manufacturing: Chromium Compounds Fabricated Plate Work
Lead Acid Battery Manufacturing Fabricated Structural Metal Manufacturing
Pharmaceutical Production Plastic Materials and Resins Manufacturing
Synthetic Rubber Manufacturing Copper Foundries
Nonferrous Foundries Aluminum Foundries
Asphalt Processing and Asphalt Roofing Manufacturing Paints and Allied Products Manufacturing
Chemical Preparations Prepared Feeds Materials
Portland Cement Sewage Sludge Incineration
Industrial Boilers Fired by Coal, Wood and Oil Institutional/Commercial Boilers Fired by Coal, Wood and Oil
Plating and Polishing Primary Metal Products Manufacturing
Valves and Pipe Fittings Ferroalloys Production: Ferromanganese & Silicomanganese
Agricultural Chemicals and Pesticides Manufacturing Cyclic Crude and Intermediate Production
Industrial Inorganic Chemical Manufacturing Industrial Organic Chemical Manufacturing
Inorganic Pigments Manufacturing Miscellaneous Organic NESHAP
1.4. FIRSTREPORTTOCONGRESS
Under section 112(k)(5), the CAA required that the EPA report to Congress on progress toward meeting the goals of section 112(k) and to identify specific metropolitan areas that continue to experience high risks to public health as the result of emissions from area sources. The first report to Congress (Report), originally due in 1998, was published in July 2000.11 The first Report expanded on much of the information provided in the Strategy, such as the methodology for developing the emissions inventory used to identify the 30 urban HAPs. The Report also summarized information on risk assessments that the EPA and several states conducted in various urban areas over the past several years. The first Report also provided a detailed discussion of specific research needs to address in achieving the goals of the Strategy and the EPA activities
11http://www.epa.gov/ttn/atw/urban/natprpt.pdf.

NationalAirToxicsProgramTheIntegratedUrbanStrategyReporttoCongress
1‐6
aimed at addressing those needs.
1.5. SECONDREPORTTOCONGRESSOVERVIEW
This second report to Congress, as required by section 112(k)(5), discusses the EPA’s actions to date to address urban air toxics; provides background information on emissions, monitoring data and risks; and discusses areas of the country experiencing elevated risks from air toxics. This report is written so that:
Chapter Two is devoted to a discussion of the EPA’s standard‐setting activities for stationary and mobile sources, the first component of the Strategy. The chapter presents the list of area source categories that were identified. The chapter also describes: 1) the statutory and regulatory requirements governing standard setting under section 112; 2) the regulation of major sources, which are larger emitters of HAPs, and area sources, which include those stationary sources that are not major sources, through Maximum Achievable Control Technology (MACT) standards; 3) HAP emissions from mobile sources and the EPA regulatory activities for addressing those sources; 4) regulatory actions taken to reduce emissions from combustion sources; and 5) activities underway in the residual risk program.
Chapter Three describes the range of assessment activities that the agency has undertaken to measure progress toward meeting the requirements of section 112(k), the third component of the Strategy. The chapter: 1) presents results regarding changes in emissions and monitoring data; 2) describes the results from the 2005 NATA and discusses the urban areas that continue to pose the highest lifetime cancer risks from air toxics; and 3) presents an analysis of trends in ambient concentrations of benzene for one particular metropolitan area with the highest risk.
Chapter Four focuses on the second component of the Strategy and provides: 1) an overview of national, regional and community‐based initiatives, including state, tribal and local programs to reduce air toxics; and 2) approaches taken to develop partnerships between the EPA and state, tribal and local governments and voluntary efforts to address area‐wide and community level issues.
Chapter Five provides an update on the EPA’s education and outreach efforts, which is the fourth component of the Strategy. The chapter discusses a variety of on‐going EPA activities involving state, tribal and local agencies, cities, communities and other groups and organizations that help the agency implement its programs to reduce air toxics emissions.
Chapter Six summarizes the research needs identified in the first report to Congress and describes a sampling of research projects that highlight the EPA’s progress toward addressing those needs. The chapter concludes by discussing the EPA’s focus on sustainability and systems approaches and how these concepts are influencing our research related to air toxics.

NationalAirToxicsProgramTheIntegratedUrbanStrategyReporttoCongress
1‐7
Chapter Seven provides a summary of the findings of this report and identifies areas where continued effort is needed to achieve additional air toxics emissions reductions.
Appendix A provides details on the EPA’s standard‐setting activities for stationary and mobile sources.
Appendix B provides supplemental details on HAPs trend analysis conducted for this report and the National Air Toxics Trends Station (NATTS) network sites.
Appendix C provides summaries of several air toxics studies. By no means a full compendium, this appendix includes sample studies that have been conducted to examine the impacts of air toxics in specific urban areas and provides more detailed information for several EPA studies cited in Chapter Six.
Appendix D provides a summary of the current status of Integrated Risk Information System (IRIS) assessments for the 33 urban HAPs.
All data in this report were developed in accordance with the EPA's data quality guidelines (U.S. EPA, 2002b). For example, the emissions, monitoring and NATA data, which have been previously released publicly, have been independently peer reviewed and/or follow Quality Assurance Project Plans. Since no significant new information or technical analyses are presented, the EPA has determined that no further independent review of this document is necessary.

NationalAirToxicsProgramTheIntegratedUrbanStrategyReporttoCongress
2‐1
Chapter2: Standard‐SettingActivities
2.1. INTRODUCTION
The regulatory structure of the CAA provides for key regulatory activities designed to address air toxics: 1) MACT standards that require stationary sources covered by these rules to achieve emissions reductions at the levels of the best performing sources; 2) Generally Achievable Control Technology (GACT) standards that put requirements in place by considering the control technologies and management practices that are generally available to stationary sources of air toxics; and 3) combustion standards to control emissions of certain types of solid waste facilities. Within 8 years of issuance of a MACT standard, the EPA is required to conduct a residual risk review and determine whether the promulgation of additional standards is required to provide an ample margin of safety to protect public health and to prevent adverse environmental effects. The EPA also has an obligation every 8 years to review and revise standards, ‘‘as necessary” taking into account developments in practices, processes and control technologies. As for mobile sources, the EPA has developed requirements for onroad and offroad vehicles (such as cars, trucks and other mobile sources) and fuel standards. See Exhibit 2‐1 for summary.
As part of its regulatory activities, the EPA also looks to analyze the impact of rules on low income, minority and indigenous communities under Executive Order 12898, Environmental Justice for Low Income and Minority Populations. In the past few years, the agency has developed a range of approaches for better understanding the populations most affected by our rules. The analyses largely look at the demographics of the communities near the sources being regulated; however, this is an area that is evolving, and the EPA is continuously improving its methods of conducting analyses.
This chapter describes what the EPA has accomplished with respect to the standards issued to reduce air toxics emissions from stationary and mobile sources. The standards are a significant accomplishment because, collectively, they have produced (or will produce) substantial reductions in air toxics emissions that are further described in Chapter Three. Some of the standards will also achieve co‐benefit criteria pollutant emission reductions.
Exhibit 2‐1. Summary of EPA Standard‐Setting Activities Since 1990 for Air Toxics
Emission Source Type Standards Set Standard Types
Major Stationary Sources
97 standards for 174 major source categories developed under section 112(c)(2).
Technology‐based standards based on MACT
Area Stationary Sources
56 standards for 68 area source categories required to fulfill the requirements of sections 112(c)(3) and 112(k)(3)(B).
Technology‐based standards (MACT or GACT)

NationalAirToxicsProgramTheIntegratedUrbanStrategyReporttoCongress
2‐2
Mobile Sources Mobile source (on‐road and off‐road) standards that put requirements in place for cars, trucks and other mobile sources and fuel requirements.
Tailpipe standards; engine and engine exhaust standards; and fuels standards
112(c)(6) Categories
46 subparts issued under section 112(c)(6) ensures that seven specific persistent and bioaccumulative pollutants are subject to MACT standards.
Technology‐based standards based on MACT
Technology Review Rules
Rules developed under 112(d)(6) which calls for the EPA to review standards every 8 years and revise them ‘‘as necessary (taking into account developments in practices, processes and technologies).’’
Technology‐based standards
Residual Risk Rules
Rules developed under section 112(f) which requires the EPA to determine whether MACT standards provide an ample margin of safety to protect public health and prevent against adverse environmental effects.
Health‐based standards
Combustion Sources
Solid waste combustion source rules developed under section 129, which sets emission limits for new solid waste combustion facilities and provide emissions guidelines for existing sources.
Technology‐based standards
The area source program was designed to control emissions of HAPs from smaller‐emitting sources. Area sources include facilities that have air toxics emissions below the major source threshold as defined in CAA section 112 and thus emit less than 10 tons per year of any single toxic air pollutant and less than 25 tons per year of multiple toxic air pollutants in any one year. Major sources are defined as sources that emit 10 tons per year or more of any of the listed toxic air pollutants or 25 tons per year or more of a combination of air toxics. For example, these major sources could release air toxics from equipment leaks when materials are transferred from one location to another or during discharge through emission stacks or vents. Area sources include smaller facilities such as dry cleaners, gasoline stations and autobody repair shops.
2.2. AIRTOXICSSTANDARDSETTINGFORAREAANDMAJORSOURCES
For major sources, the EPA must establish emission standards that ‘‘require the maximum degree of reduction in emissions of the hazardous air pollutants subject to this section’’ that the EPA determines is achievable taking into account certain statutory factors. See CAA section 112(d)(2). These standards are referred to as ‘‘maximum achievable control technology’’ or ‘‘MACT’’ standards. The MACT standards for existing sources must be at least as stringent as the average emission limitation achieved by the best performing 12 percent of existing sources in the category (for which the Administrator has emissions information) or the best performing 5 sources for source categories with less than 30 sources. See CAA section 112(d)(3)(A) and (B), respectively. This level of minimum stringency is referred to as the ‘‘MACT floor,’’ and the EPA cannot consider cost in setting the floor. For new sources, MACT standards must be at least as stringent as the control level achieved in practice by the best‐controlled similar source. See CAA section 112(d)(3).
For area sources, the EPA may issue standards or requirements that provide for the use of

NationalAirToxicsProgramTheIntegratedUrbanStrategyReporttoCongress
2‐3
generally available control technologies or management practices (GACT standards) in lieu of promulgating MACT or health‐based standards. See CAA section 112(d)(5).
To determine GACT, the EPA considers control technologies and management practices that are generally available to the area sources in the source category. We also consider the standards applicable to major sources in the same industrial sector to determine whether the control technologies and management practices are transferable and generally available to area sources. In appropriate circumstances, we may also consider technologies and practices at area and major sources in similar categories to determine whether such technologies and practices could be considered generally available for the area source category at issue. Finally, in determining GACT for a particular area source category, we consider the costs and economic impacts of available control technologies and management practices on that category.
Both MACT and GACT have yielded standards that are effective in reducing toxic emissions. Emissions and risk reductions are discussed in more detail in Chapter Three.
2.2.1. EmissionStandardsforAreaSources
The EPA has completed the emission standards required by section 112(c)(3) of the CAA. Section 112(c)(3) requires that the EPA promulgate emission standards to ensure that area sources representing 90 percent of the area source emissions of the 30 HAPs that present the greatest threat to public health in the largest number of urban areas are subject to regulation. For the 68 area source categories, the EPA has promulgated 56 area source rules.12 Compliance under all standards is anticipated to be no later than 2014,13 which is 2 years later than originally predicted in the 1999 Strategy.
Appendix A presents a comprehensive list of the 56 area source standards, including targeted pollutants.14 The following are examples of area source categories for which the EPA has issued National Emission Standards for Hazardous Air Pollutants (NESHAP) that have or will result in emission/risk reductions:
NESHAP for Paint Stripping and Miscellaneous Surface Coating Operations at Area Sources: On December 14, 2007, the EPA issued final air toxics standards for area sources in the following three industry sectors: 1) paint stripping operations that use methylene chloride (MeCl)‐containing paint stripping formulations; 2) surface coating operations that involve spray‐applied coatings that contain metal air toxic compounds to miscellaneous parts and products made of metal, plastic or a combination of metal and plastic; and 3) spray‐applied finishing or refinishing of motor vehicles and mobile equipment. The EPA estimated that about 1,000 facilities would take action to comply with the final rule. The standards for paint stripping achieve an estimated annual reduction of 1,200 tons of methylene chloride emissions, which are an inhalation irritant
12Some rules address more than one area source category; thus, the number of rules is less than the number of source categories. 13Under the CAA, compliance with these standards is required within 3 years of promulgation. 14http://www.epa.gov/ttn/atw/area/arearules.html.
NationalAirToxicsProgramTheIntegratedUrbanStrategyReporttoCongress
2‐4
and potential carcinogen. The surface coating standards achieve an estimated annual reduction of about 6,900 tons of HAPs, including 11 tons of metal HAPs. The rules also result in estimated annual reductions of 2,900 tons and 20,900 tons of particulate matter and volatile organic compounds, respectively.
NESHAP for Source Categories: Gasoline Distribution Bulk Terminals, Bulk Plants and Pipeline Facilities, and Gasoline Dispensing Facilities: On December 20, 2007, the EPA issued air toxics standards for area sources that distribute and store gasoline. The final rules limited air toxics emissions from two types of area sources: bulk gasoline distribution facilities (such as bulk terminals and plants, pipeline facilities) and storage tanks at gasoline dispensing facilities. We estimated the rules to result in 5,000 tons per year of HAP reductions, including 175 tons per year of benzene. The final rules were designed to achieve estimated annual VOC reductions of about 100,000 tons.15
NESHAP for Secondary Lead Smelting: Secondary lead smelters produce lead from scrap and provide the primary means for recycling lead‐acid automotive batteries (approximately 95 percent of all lead‐acid batteries). The EPA originally promulgated the rule in 1995 and it established numerical emission limits for lead. The agency estimates that the rule reduced emissions of HAPs by about 1,400 tons annually, representing a 67 percent reduction from levels prior to enactment of the standards. This rule also covers secondary lead smelters that are major sources of HAPs.
2.2.2. EmissionStandardsforMajorSources
MaximumAchievableControlTechnologyStandards
Since 1990, the EPA has issued 97 MACT standards covering all of the 174 major source categories originally listed by the EPA in 1992, as required by the CAA. This report also covers the recently issued Mercury and Air Toxics Standards (MATS) for utilities. Appendix A contains a list of the standards and the relevant Federal Register citations. Chapter Three describes emissions reductions from these rules collectively, which are substantial and will help reduce the health risk from air toxics in urban and other areas.
As required under section 112(c)(6), the EPA promulgated emission standards (total of 46 subparts under 40 CFR parts 60, 61, 62 and 63) to assure that sources accounting for not less than 90 percent of the aggregate emissions of each of the seven persistent and bioaccumulative pollutants which includes alkylated lead compounds, polycyclic organic matter (POM), mercury, hexachlorobenzene, polychlorinated biphenyls (PCB), 2,3,7,8‐tetrachlorodibenzofurans (TCDF) and 2,3,7,8‐tetrachlorodibenzo‐p‐dioxin (TCDD).
1573 FR 1916. January 10, 2008.

NationalAirToxicsProgramTheIntegratedUrbanStrategyReporttoCongress
2‐5
SolidWasteCombustionSources
Solid waste combustion source rules, required under section 129 of the CAA, set emission limits for new solid waste combustion facilities and provided emissions guidelines for existing solid waste combustion facilities. Pursuant to section 129, the EPA has issued standards for large and small municipal waste combustors (MWC), hospital/medical/infectious waste incinerators (HMIWI), sewage sludge incinerators (SSI), commercial and industrial solid waste incinerators (CISWI), and "other" solid waste incinerators (OSWI). These standards set emission standards for 9 pollutants: cadmium, carbon monoxide, dioxins/furans, hydrogen chloride, lead, mercury, oxides of nitrogen, particulate matter and sulfur dioxide.
By the time these rules are fully implemented, we expect them to reduce mercury emissions from these sources by about 90 percent from current levels and reduce dioxin/furan emissions by more than 95 percent from current levels. The rules affect MWC and HMIWI, which account for 30 percent16 of the national mercury emissions to the air.
ResidualRiskProgram
The residual risk program, required under section 112(f), is designed to assess the risk from source categories after MACT standards are implemented. If we find a remaining ‐ or residual ‐ risk, we are required, within 8 years of the promulgation of the MACT standard, to set additional standards if the MACT standard does not provide an “ample margin of safety to protect public health” or “to prevent, taking into consideration costs, energy, safety and other relevant factors, an adverse environmental effect.”17 The Residual Risk Report to Congress, released March 3, 1999, describes our approach to risk assessment for the residual risk program.18 The EPA has conducted demographic analyses as part of the rulemakings issued to date to help us better understand the potential impacts of the rule on low income, minority or indigenous communities.
TechnologyReviewProgram
In addition to the residual risk review, the CAA requires a technology review every 8 years under section 112(d)(6). The EPA looks at a host of different items during the technology review, including whether certain technologies available at the time of the initial MACT have changed to more efficient, cost‐effective methods.
The Risk and Technology Review (RTR) is a combined effort to evaluate both risk and technology as required by the CAA after the application of MACT standards (U.S. EPA, 2009). Current information regarding proposals and final actions can be found on the EPA’s RTR website.19
16As cited in the Urban Air Toxics Strategy. 64 FR 38709. 17Clean Air Act section 112(f). 18Residual Risk Report to Congress. March 3, 1999. EPA‐453‐/R‐99‐001.19See http://www.epa.gov/ttn/atw/rrisk/rtrpg.html for more information on the status of ongoing RTR rulemakings.
NationalAirToxicsProgramTheIntegratedUrbanStrategyReporttoCongress
2‐6
2.3. AIRTOXICSTANDARDSETTINGFORMOBILESOURCES
This section presents an overview of the EPA’s mobile source program aimed at reducing air toxics and other pollutants. Mobile source air toxics (MSATs) are compounds, known or suspected to cause cancer or other serious health and environmental effects, which are emitted from highway vehicles and nonroad equipment. Mobile sources consist of onroad and nonroad vehicles, engines, and equipment, such as aircraft, locomotives and marine vessels. This section highlights mobile source emission control programs and outlines recent and upcoming mobile source rulemaking activities.
2.3.1. UrbanHAPsEmittedfromMobileSourcesNumerous pollutants are known to be emitted from onroad trucks and passenger cars and from various types of nonroad equipment, several of which could have serious effects on human health and welfare (U.S. EPA, 2000b). Many of the compounds emitted by mobile sources have been evaluated and published in the IRIS database.20 Appendix D contains a list of compounds that have been assessed in the IRIS program, including those emitted by mobile sources and those on the list of 33 priority urban HAPs. Exhaust from diesel engines contains many urban air toxics, such as acetaldehyde, acrolein, benzene, 1,3‐butadiene, formaldehyde and polycyclic aromatic hydrocarbons. A subset of the urban HAPs compounds that are emitted by mobile sources, with the addition of diesel particulate matter, is of particular concern. They are found in the exhaust or evaporative emissions from passenger cars, onroad trucks and various types of nonroad equipment, were designated as national or regional risk drivers in the 2005 NATA and are produced in significant quantities by mobile sources (U.S. EPA, 2010c). These compounds include:
• Acrolein
• Acetaldehyde
• Benzene
• 1,3‐butadiene
• Diesel Particulate Matter
• Formaldehyde
• Naphthalene
• POM
2.3.2. MobileSourceEmissionControlProgramsThe EPA regulates mobile source emissions through a wide range of programs under the authority of the CAA. Programs include motor vehicle provisions contained in section 202(a); the fuel requirements in section 211; the nonroad engine and vehicle provisions in section 213; the urban
20The EPA's Integrated Risk Information System (IRIS) is a program that evaluates risk information on effects that may result from exposure to environmental contaminants. Through IRIS, the EPA provides the highest quality science‐based human health assessments to support regulatory activities. The database contains data for more than 550 chemicals regarding human health effects that may result from exposure to various substances in the environment. http://www.epa.gov/IRIS/.
NationalAirToxicsProgramTheIntegratedUrbanStrategyReporttoCongress
2‐7
bus standards in section 219; and the aircraft provisions in section 231. In addition to the general emission control provisions, the EPA has specific authority related to air toxics listed in section 202(l) of the Act. The EPA regulates toxic air pollutants from motor vehicles through vehicle emissions and fuel quality standards.
2.3.3. RecentandUpcomingMobileSourceRulemakingActivitiesThe EPA’s most recent rule specifically targeted at MSATs, “Control of Hazardous Air Pollutants from Mobile Sources,” or “MSAT2,” was published in 2007.21 The rule has three components:
1. A standard that lowers the benzene content of gasoline (beginning in 2011).
2. A standard that reduces exhaust emissions from passenger vehicles operating at cold temperatures, less than 75°F (beginning in 2010).
3. A standard that reduces emissions that can evaporate from, and permeate through, portable fuel containers (beginning in 2009).
The new fuel benzene standard and hydrocarbon standards for vehicles and gas cans are expected to reduce total emissions of MSATs by 330,000 tons in 2030, including 61,000 tons of benzene. As a result of this rule, new passenger vehicles will emit 45 percent less benzene, gas cans will emit 78 percent less benzene and gasoline will have 38 percent less benzene overall.22
The EPA’s general authorities have been used primarily to control criteria pollutants from mobile sources. These rules, however, have also achieved important reductions in HAPs. For example, vehicle‐ and engine‐based control programs reduce hydrocarbons that are produced during the combustion process as a result of incomplete combustion. Similarly, the EPA has several programs aimed at reducing diesel exhaust emissions from diesel engines and equipment. The EPA’s evaporative control programs are designed to reduce further emissions of volatile air toxics due to engine design or faulty components that allow fuel vapors to escape into the atmosphere. Mobile source fuel control programs also have resulted in significant reductions in the emissions of toxic substances from motor vehicles. Both vehicle‐ and engine‐based control programs and fuel control programs have helped to address disproportionate impacts to those populations living in close proximity to roadways, rail yards and ports. Examples of criteria pollutant‐focused engine and fuel control programs are listed below.
In 2001, the EPA finalized a rule to make heavy‐duty trucks and buses run more cleanly. The sulfur content allowed in diesel fuel was lowered to enable modern pollution‐control technology to be installed on new trucks and buses starting with the 2007 model year. Once this action is fully implemented, the EPA estimates that diesel particulate matter will be reduced by 110,000 tons per year.23
In May 2004, as part of the Clean Air Nonroad Diesel Rule, the EPA finalized stringent emission standards for new non‐road diesel engines beginning with model year 2008.
2172 FR 8427. February 26, 2007. 2272 FR 8427. February 26, 2007. 2366 FR 5001. January 18, 2001.

NationalAirToxicsProgramTheIntegratedUrbanStrategyReporttoCongress
2‐8
The EPA also introduced requirements for nonroad diesel fuel that decrease the allowable levels of sulfur in fuel by 99 percent. The rule will have significant environmental and public health benefits by reducing diesel particulate matter from new and existing engines.24
In March 2008, the EPA finalized a three‐part program that will dramatically reduce emissions from locomotives and marine diesel engines with displacement of less than 30 liters per cylinder. The rule will reduce diesel PM emissions from these engines by as much as 90 percent when fully implemented.25
In 2008, the EPA adopted new exhaust emission standards for marine spark‐ignition engines and small land‐based nonroad engines.26 The EPA also adopted evaporative emission standards for equipment and vessels using these engines. The EPA estimates that, by 2030, the standards will result in significant annual reductions of pollutant emissions from regulated engine and equipment sources nationwide, including approximately 600,000 tons of volatile organic compound (VOC) emissions.
In 2009, the EPA adopted more stringent exhaust emission standards for large marine diesel engines as part of a coordinated strategy to address emissions from all ships that affect U.S. air quality. By 2030, this coordinated strategy is expected to reduce annual diesel particulate matter emissions by about 143,000 tons.27
The EPA continues to make progress in controlling HAP emissions from mobile sources. Ongoing mobile source rulemaking activities can achieve additional reductions of health risks from air toxics beyond those just discussed. In May 2010, the President directed the EPA to review the adequacy of current non‐greenhouse gas emissions regulations for new motor vehicles, new motor vehicle engines and motor vehicle fuels, including tailpipe emissions standards for air toxics (The White House, 2010). As a result of the President’s direction, the EPA recently finalized vehicle and fuel standards that would further reduce MSATs and other pollutants (http://www.epa.gov/otaq/tier3.htm).
2.3.4. Near‐RoadwayPollution
Locations in close proximity to major roadways generally have elevated concentrations of air pollutants emitted from motor vehicles (Karner et al. 2010; HEI 2010). Many studies have been published in peer‐reviewed journals, concluding that concentrations of benzene, aldehydes, PM and many other compounds are elevated in ambient air within approximately 300‐600 meters (about 1,000‐2,000 feet) of major roadways. Highest concentrations of most pollutants emitted directly by motor vehicles are found at locations within 50 meters (about 165 feet) of the edge of a roadway’s traffic lanes.28 Over twenty million U.S. homes are near large roads, railroads and airports (with the
2469 FR 38957. June 29, 2004. 2573 FR 37095. June 30, 2008. 2673 FR 59034. October 8, 2008.2775 FR 22895. April 30, 2010.2875 FR 6474. February 9, 2010.

NationalAirToxicsProgramTheIntegratedUrbanStrategyReporttoCongress
2‐9
majority of these homes near large roads).29 30 Populations in close proximity to major roads are higher in minority and low‐income composition.31 In some locations, other sources of air pollution can also contribute significantly to the pollution found near major roads (e.g., industrial sources, freight terminals).
2.4. CONTINUEDEFFORTSAreas where continued source‐specific and sector‐based strategies will achieve additional air toxics emissions reductions include:
Setting risk and technology standards for industrial sources that pose the highest risks, focusing especially where emissions can be controlled cost‐effectively.
Looking for cost‐effective opportunities for multipollutant reductions across sectors.
Expanding efforts to integrate pollution prevention and less‐polluting substitutes into regulatory and non‐regulatory efforts.
Considering environmental justice (EJ) as we issue rules and permitting guidance.
Establishing additional vehicle and fuel standards to achieve further reductions in emissions from mobile sources.
Evaluating the impacts of renewable and alternative fuels and determining whether additional fuel standards are needed (as directed by the Energy Independence and Security Act (EISA)).
Focusing efforts on communication and assessment of near‐roadway exposures, including mitigation options for local communities.
Developing compliance tools to help industries meet standards and focus enforcement efforts, as necessary, to reduce air toxics in communities.
29U.S. Census Bureau. American Housing Survey for 2009. Table 1‐6. 30About 300 feet to a highway with four or more lanes, a railroad or an airport.3172 FR 8434. February 26, 2007.

NationalAirToxicsProgramTheIntegratedUrbanStrategyReporttoCongress
3‐1
Chapter3: IdentifyingAirToxicsRisksinUrbanAreas
3.1. INTRODUCTION
The EPA, along with state, tribal and local governments and industry partners, has made substantial progress on air toxics,32 reducing millions of tons of these pollutants over the last 2 decades. Despite these significant strides in the air toxics program, there remain many areas around the country with elevated levels of risks from air toxics. These risks are often found in urban areas where emission sources can be more concentrated and in communities near industrial facilities or near large roadways or transportation facilities. This chapter also discusses the urban areas that continue to experience elevated risks to public health from air toxic emissions.
The health risks from exposure to air toxics are greater in urban areas due to the concentration of air pollution sources, including mobile and stationary sources, and population density. Health effects from exposure to HAPs might be more severe to more susceptible or sensitive populations such as children or individuals with compromised health status and disproportionately impacted communities.
In the last few years, the EPA has made significant strides in conducting environmental justice (EJ) analyses so we can better understand if there are disproportionately impacted communities.33 For instance, from 1995 to 2010, the EPA conducted EJ analysis on 20 rules, as contrasted with the 53 rules for which it has conducted such analysis between 2010 and early 2012. The Office of Air and Radiation has been responsible for most of those analyses. The agency‐wide analyses included qualitative assessments, proximity analysis, ambient concentration impacts and risk‐based assessments. Through these efforts, the agency continues to learn and improve our ability to conduct these analyses and identify areas where consistency in analytical approaches is needed. As a result, the agency is improving analytical tools to help in these efforts. Two tools in particular include EJSCREEN, a web application‐screening tool that provides the EPA with a nationally consistent approach to screening for potential areas of concern, and the Community‐Focused Exposure and Risk Screening Tool (C‐FERST) which provides environmental exposure and health‐related information.
To estimate risks in urban areas, the EPA considers both the nature of the problem and the tools and data available. Air toxics emissions, ambient air concentrations and risk can be widespread or localized. The 187 HAPs in the CAA pose, individually and in combination, a variety of health and environmental impacts, including cancer and respiratory, cardiovascular, neurological and
32The use of the terms “air toxics” or “toxic air pollutants” in this report refers specifically to those pollutants that are listed under section 112(b) of the CAA as “hazardous air pollutants” or HAPs.33EPA defines “environmental justice” as the fair treatment and meaningful involvement of all people regardless of race, color, national origin, or income with respect to the development, implementation, and enforcement of environmental laws, regulations, and policies. U.S.EnvironmentalProtectionAgency,InterimGuidanceonConsideringEnvironmentalJusticeDuringtheDevelopmentofanAction.http://www.epa.gov/compliance/ej/resources/policy/considering‐ej‐in‐rulemaking‐guide‐07‐2010.pdf..

NationalAirToxicsProgramTheIntegratedUrbanStrategyReporttoCongress
3‐2
developmental effects. For this report, the EPA used a variety of methods to analyze different aspects of the air toxics program and describes the following findings in this chapter:
Emissions reductions have occurred for all HAPs, including the priority urban air toxics in urban areas, since 1990 due to promulgated standards;
Monitored levels of several key pollutants in the urban ambient air have gone down over time;
Emissions inventories and exposure markers for key air toxics pollutants, including mercury, dioxin, lead and diesel particulate matter, show progress in lower emissions and exposure levels; and
Modeling tools, such as the 2005 NATA, identify certain areas of the country that may experience elevated levels of air toxics risks.
3.1.1. Data Gaps and Limitations
While the EPA has multiple analytical tools to describe the air toxics program, there remain significant data gaps and limitations in our understanding of air toxics, including:
Incomplete emissions data. Only some regulated industrial sources are required to submit air toxics inventory information, and states are not required to submit data to the agency on their air toxics emissions, making the quality and completeness of those data vary significantly by region and source.
Limited monitoring data. Implementation of the 27 National Air Toxics Trends Station monitoring network, which began in 2003, is only now allowing us to make comparable analysis of ambient toxic trends over time.
Uncertainty in toxicity data for many toxics. Characterizing the health effects of air toxics at ambient levels can be subject to a high level of uncertainty. For example, a large majority of air toxics have toxicity information from the EPA’s Integrated Risk Information System (IRIS) and other sources based on animal studies, with substantial uncertainty in how to interpret those data for human exposure. A relatively smaller number of air toxics have epidemiological data based on relatively high occupational exposures (e.g., for benzene), with some uncertainty for how to interpret that information at lower ambient levels.
Limitations in modeling air toxics exposures and risks. NATA estimates ambient concentrations of air toxics and then estimates inhalation exposures at the census block level, taking into account ambient exposures in various microenvironments. NATA uses these exposure modeling results to estimate lifetime inhalation risks for both cancer and non‐cancer effects from outdoor exposure to air toxics. Although results are reported at the census‐tract level, average risk estimates are far more uncertain at this level of spatial resolution than at the county or state level and are not appropriate for identifying suspected “hotspots” of air toxics. In addition to inherent limitations in modeling, NATA only estimates risks associated with inhalation of an air toxic, it does not estimate risks

NationalAirToxicsProgramTheIntegratedUrbanStrategyReporttoCongress
3‐3
from other pathways such as air toxics being deposited in the soil and water bodies. Information about these pathways is important for predicting risks from certain air toxics that are prevalent in the food chain (like eating fish contaminated with mercury). Further NATA does not include the emissions from indoor sources, accidental releases, natural disasters or transport of some pollution from countries outside the United States.
Given the varied nature of air toxics and these and other limitations and uncertainties, this chapter provides our best understanding of the impacts of the air toxics program using national, urban‐specific and pollutant‐specific analyses. Chapter Six provides more detail on the gaps in our knowledge about air toxics and the EPA’s research plans to address those issues.
3.2. NATIONALEMISSIONSREDUCEDSIGNIFICANTLYSINCE1990
The EPA estimates that, since 1990, CAA programs have reduced millions of tons of air toxics emissions from stationary (major and area) and mobile sources. For stationary sources, it is estimated that over 1.5 million tons of HAPs have been removed from the air on an annual basis due to standards promulgated under sections 112 and 129. In addition, the EPA also estimates about 3 million tons per year of non‐HAP co‐benefit reductions have been achieved because of these promulgated standards. These reductions were projected by looking at the estimated emissions before and after implementation of the section 112 and 129 standards promulgated for major and area source categories. See Appendix A for a listing of these standards. Exhibit 3‐1 shows a graphical representation of the cumulative HAPs reductions achieved from stationary source standards promulgated since 1990.
Exhibit 3‐1. Cumulative HAPs Reductions for Stationary Sources
You will notice that there are significant reductions beginning around 1999. This is primarily due to

NationalAirToxicsProgramTheIntegratedUrbanStrategyReporttoCongress
3‐4
compliance with several very significant standards:
NESHAP for Aerospace Manufacturing and Rework Facilities: Promulgated in 1995, the final rule projected emission reductions of over 123,000 tons per year of HAPs after full implementation of the standards. The projected decrease in HAP emissions amounts to a reduction of nearly 60 percent from pre‐MACT levels. Most of the control requirements outlined in the final rule were based on pollution prevention options instead of end of pipe controls.
NESHAP for Synthetic Organic Chemical Manufacturing, also known as the Hazardous Organic NESHAP (HON): Promulgated in 1994, the HON regulated a number of processes at chemical manufacturing facilities, including storage vessels, process vents, process wastewater, transfer operations and equipment leaks. The HON projected emission reductions of over 500,000 tons per year of HAPs after full implementation of the standards and about one million tons per year of VOC reductions as a co‐benefit of HAPs controls. These projected emission reductions amount to a decrease in HAP and VOC emissions of 88 percent and 79 percent, respectively.
NESHAP for the Pulp and Paper Industry: Promulgated in 1998, these rules were developed as a "cluster rule" that combined requirements for air and water. The final rule projected air emission reductions of HAPs by over 160,000 tons per year after full implementation of the standards, a decrease of nearly 60 percent from pre‐MACT levels. The final rule also projected 450,000 tons per year of VOC reductions as a co‐benefit achieved through control of HAP emissions.
Mobile source reductions are realized over time as the vehicle fleet turns over. As depicted in Exhibit 3‐2 in 1990, mobile source emissions were estimated at about 3 million tons; however by 2008, mobile source emissions were estimated to have decreased by 1.5 million tons due to regulations already in place.34 It is expected that mobile source emissions will continue to decrease due to fleet turnover and by 2030 will be approximately 80 percent lower than 1990 levels.
34Reductions in diesel PM are not included in these totals.

NationalAirToxicsProgramTheIntegratedUrbanStrategyReporttoCongress
3‐5
Exhibit 3‐2. Mobile Source Air Toxics Emission Reductions
3.3. NATIONALAIRTOXICSMONITORING:KEYPOLLUTANTSDECLINING
Starting in 2003, the EPA worked with state and local partners to develop the NATTS program to monitor several air toxics.35 The principal objective of the NATTS network is to provide long‐term monitoring data across representative areas of the country for priority pollutants, including benzene, formaldehyde, 1,3‐butadiene, hexavalent chromium and polycyclic aromatic hydrocarbons (PAHs) such as naphthalene, in order to establish overall trends. Currently, data are collected at 27 NATTS sites consisting of 20 urban and 7 rural sites. A listing of these sites can be found in Appendix B.
The EPA regularly analyzes nationwide trends in air quality indicators, including trends from ambient air monitoring, as part of the National Air Quality Trends Reports.36 The trends analyses for these reports indicate that most of the NATTS monitoring sites in the United States show decreases in ambient air concentrations of many monitored air toxics. While these trends show that the air around the monitors has lower levels of air toxics, the results do not necessarily represent trends beyond the particular locations monitored.
Specifically for this report, the EPA completed an analysis of air toxics in urban areas based on available monitoring data for 2003 to 2010. The data, from sites located in areas with populations greater than 250,000, represent pollutants measured at a minimum of 30 different monitoring sites with at least 35 percent of the data measured at levels above monitor detection limits. As shown in Exhibit 3‐3, all pollutants except for two show a decrease in concentrations from 2003 to 2010, as measured by the median percent change per year. Ambient monitoring data show that
35http://www.epa.gov/ttn/amtic/natts.html. 36http://www.epa.gov/airtrends.

NationalAirToxicsProgramTheIntegratedUrbanStrategyReporttoCongress
3‐6
some of the air toxics of greatest concern to public health (such as benzene, 1,3‐butadiene, formaldehyde and several metals) are declining at most sites. Of the metals, nickel and arsenic both have the largest declining trends with manganese levels tending to be decreasing but also showing some increases depending on monitoring location. Lead continues to decline at most sites with the exception of some sites concentrated in industrial areas. There are two chlorinated VOCs that appear to have increased slightly: dichloromethane (methylene chloride) and chloroform.
It is important to note that, while nationally on average we are seeing a downward trend in ambient concentrations for the majority of measured air toxics, some pollutants at some sites may be higher due to local conditions, as well as the number and types of local sources. Thus, even though the trend for a given pollutant is down, locally values may be higher due to sources in the area.
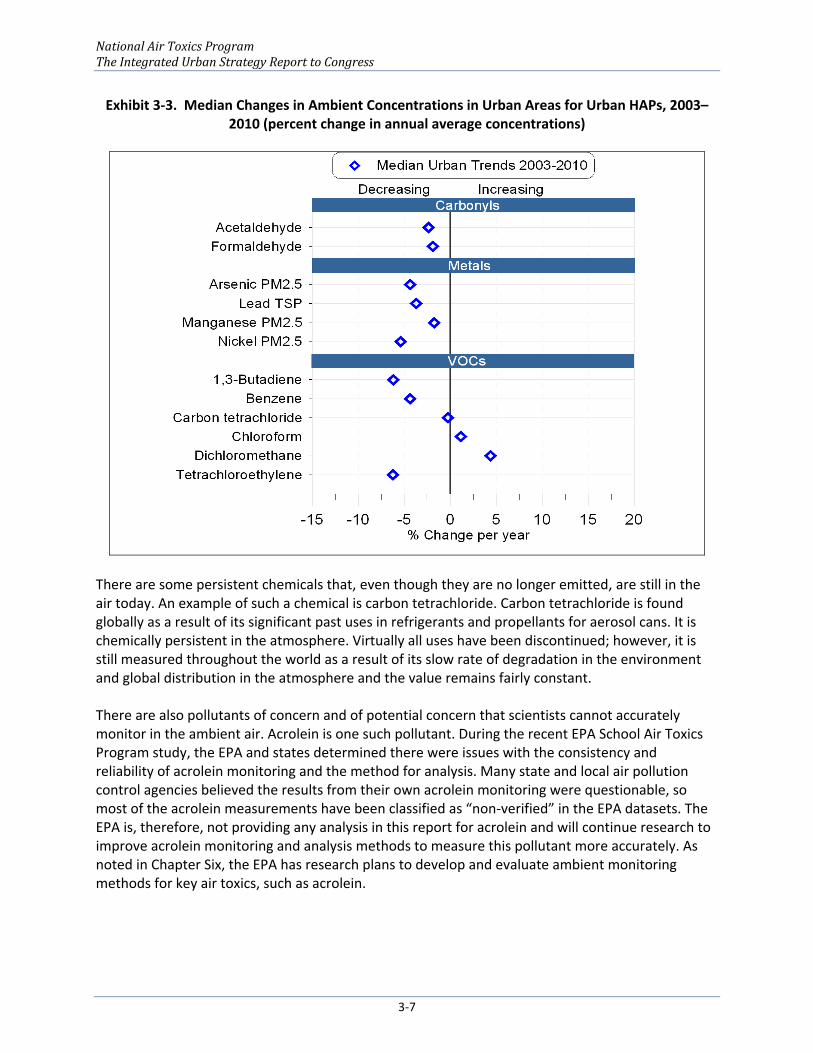
NationalAirToxicsProgramTheIntegratedUrbanStrategyReporttoCongress
3‐7
Exhibit 3‐3. Median Changes in Ambient Concentrations in Urban Areas for Urban HAPs, 2003–2010 (percent change in annual average concentrations)
There are some persistent chemicals that, even though they are no longer emitted, are still in the air today. An example of such a chemical is carbon tetrachloride. Carbon tetrachloride is found globally as a result of its significant past uses in refrigerants and propellants for aerosol cans. It is chemically persistent in the atmosphere. Virtually all uses have been discontinued; however, it is still measured throughout the world as a result of its slow rate of degradation in the environment and global distribution in the atmosphere and the value remains fairly constant. There are also pollutants of concern and of potential concern that scientists cannot accurately monitor in the ambient air. Acrolein is one such pollutant. During the recent EPA School Air Toxics Program study, the EPA and states determined there were issues with the consistency and reliability of acrolein monitoring and the method for analysis. Many state and local air pollution control agencies believed the results from their own acrolein monitoring were questionable, so most of the acrolein measurements have been classified as “non‐verified” in the EPA datasets. The EPA is, therefore, not providing any analysis in this report for acrolein and will continue research to improve acrolein monitoring and analysis methods to measure this pollutant more accurately. As noted in Chapter Six, the EPA has research plans to develop and evaluate ambient monitoring methods for key air toxics, such as acrolein.
NationalAirToxicsProgramTheIntegratedUrbanStrategyReporttoCongress
3‐8
3.4. POLLUTANT‐SPECIFICEMISSIONSANDMONITORINGTRENDS
This section provides more in‐depth information, including emission and monitoring trends, for several key pollutants.
3.4.1. BenzeneLevelsDeclineby66percentfrom1994to2009
For several years, the EPA has been reporting on the ambient concentrations of benzene as part of the EPA’s Report on the Environment. Benzene is one of the most widely monitored air toxics and is emitted from mobile sources (on‐road and off‐road), major stationary sources (e.g., petroleum refineries) and area sources (e.g., gasoline stations). Urban areas generally have higher ambient air concentrations of benzene than other areas. Exhibit 3‐4 depicts the most recent benzene trend analysis from the 2009 Report on the Environment.37 The trend is averaged over 22 urban monitoring sites that have a complete data record from 1994 to 2009. The exhibit shows that the average benzene concentration across these monitoring sites has declined 66 percent from 1994 to 2009. Also shown are the 90th and 10th percentiles based on the distributions of annual average concentrations at the 22 monitoring sites. The shaded area in the exhibit displays the concentration range where 80 percent of measured values occurred for each year.38
37http://www.epa.gov/roe/. 38http://cfpub.epa.gov/eroe/index.cfm?fuseaction=detail.viewInd&ch=46&subtop=341&lv=list.listByChapter&r=188186.

NationalAirToxicsProgramTheIntegratedUrbanStrategyReporttoCongress
3‐9
Exhibit 3‐4. Ambient Benzene Concentrations in the U.S., 1994–2009 (Source: U.S. EPA (2010d))
3.4.2. U.S.MercuryEmissions
As shown in Exhibit 3‐5, emissions of mercury to the air from anthropogenic (human‐caused) sources have fallen by more than 58 percent to date since passage of the CAA. In 1990, more than two‐thirds of U.S. anthropogenic mercury emissions came from three source categories: coal‐fired power plants, municipal waste combustors (MWC) and medical waste incinerators. The EPA issued regulations in the 1990s that required more than a 90 percent reduction in mercury emissions from MWC and medical waste incinerators. In addition, actions to limit the use of mercury, most notably Congressional action to limit the use of mercury in batteries and the EPA regulatory limits on the use of mercury in paint, contributed to the reduction of mercury emissions from waste combustion during the 1990s by reducing the mercury content of waste.
The EPA has developed a regulation, the Mercury and Air Toxics Standards or MATS Rule, to limit mercury emissions from coal‐ and oil‐fired power plants (also known as electric‐generating units, or EGUs) that will further reduce emissions of mercury over the next several years. As a result of the December 2011 MATS, the first national standard to control power plant emissions of mercury (as well as other toxics such as arsenic, acid gas, nickel, selenium and cyanide), mercury emissions from these sources are expected to be reduced from 27 tons to 7 tons in 2016 (approximately a 74 percent reduction). Overall, the MATS rule will improve public health by lowering mercury exposure, especially for children and the elderly living with low income and minority populations that rely on subsistence fishing from inland waterways downwind from power plants.

NationalAirToxicsProgramTheIntegratedUrbanStrategyReporttoCongress
3‐10
Exhibit 3‐5. Trends in U.S. Mercury Emissions by Source (tons/year)
Individual states have also taken action to reduce mercury emissions. In a 2011 report, the Northeast States for Coordinated Air Use Management (NESCAUM) estimated the total mercury air emissions from sources in Massachusetts in 2008 have been reduced by more than 90 percent since 1996 (NESCAUM, 2011).
In addition, according to a 2011 report on the Great Lakes, mercury levels in the environment of the Great Lakes region have declined over the last 4 decades, concurrent with decreased air emissions from regional and U.S. sources. After initial declines, however, concentrations of mercury in some fishes and birds from certain locations have increased in recent years—revealing how trajectories of mercury recovery can be complex (Evers et al., 2011). While the timing and magnitude of the response will vary, further controls on mercury emission sources are expected to lower mercury concentrations in the food web yielding multiple benefits to fish, wildlife and people in the Great Lakes region. It is anticipated that improvements will be greatest for inland lakes and will be roughly proportional to declines in mercury deposition, which most closely track trends in regional and U.S. air emissions. See Chapter Six for a discussion of mercury research.
NationalAirToxicsProgramTheIntegratedUrbanStrategyReporttoCongress
3‐11
3.4.3. DioxinLevelsAreDown
The term "dioxin" is commonly used to refer to a family of toxic chemicals that share a similar chemical structure and induce harm through a similar mechanism. There are a total of 29 of these “dioxin‐like” toxic compounds, including seven dioxins, ten furans and 12 dioxin‐like polychlorinated biphenyls (PCBs).39 The EPA uses the Toxicity Equivalency Factor (TEF) approach to evaluate the human health risks from exposures to environmental media containing dioxin‐like compounds (DLCs).40 The total toxicity of these compounds in a mixture (in air, in an emission stream, etc.) can be calculated as the sum of the products of the concentrations of individual compounds (often termed “congeners”) and their TEFs. This total concentration from this calculation is referred to as the Toxic Equivalent, or TEQ, concentration (Van den Berg et al., 2006). Dioxins have been characterized by the EPA as likely human carcinogens and are anticipated to increase the risk of cancer at background levels of exposure. In the Strategy, the EPA included dioxins as one of the priority pollutants that pose the greatest threat to public health in the largest number of urban areas. Toxics such as 2,3,7,8‐tetrachlorodibenzo‐p‐dioxin (TCDD), PCBs and POM are all emitted as unintentional by‐products of incomplete combustion from, for example, industrial processes, wildfires and backyard burning of waste.
Dioxin levels in the United States environment have been declining for the last 30 years due to reductions in man‐made sources. An Inventory of Sources and Environmental Releases of Dioxin‐Like Compounds in the United States for the Years 1987, 1995, and 2000 is a peer‐reviewed report representing the EPA’s assessment of dioxin sources and their emissions to the environment.41 The report presented an evaluation of sources and emissions of dioxins (CDDs), dibenzofurans (CDFs) and coplanar PCBs to the air, land and water of the U.S. The inventory suggested that there has been a significant reduction in environmental releases of dioxin‐like compounds from regulated industrial sources between the years 1987 and 2000, and that the open burning of residential refuse in backyard burn barrels is the largest source in 2000 that could be reliably quantified.
In 1987 and 1995, the leading source of dioxin emissions was MWC. MWCs are estimated to have emitted collectively nearly 8.9 kg of dioxin toxic equivalents (TEQs) in 1987, but under the EPA regulations, they are now estimated to emit less than 0.01 kg TEQs per year. Similarly, medical waste incinerators emitted about 2.6 kg of dioxin TEQs in 1987, but under the EPA regulations, they now will be limited to about 0.007 kg annual emissions of TEQs. The EPA has implemented similarly strict standards for other dioxin sources. As a result of the efforts of the EPA, state governments and industry, known and quantifiable industrial emissions of dioxin in the United States have been reduced by more than 95 percent from 1987 levels, from 12.8 kg TEQs in 1987 to 0.07 kg TEQs in 2000 (U.S. EPA, 2006). However, dioxins break down so slowly that some of the dioxins from past releases will still be in the environment many years from now. Dioxins that remain in the environment from past releases are sometimes called "reservoir sources" of dioxins. In addition, natural processes, primarily forest fires, generate dioxins (U.S. EPA, 2006a). For these reasons, dioxin levels will never go to zero.
39http://www.epa.gov/wastes/hazard/tsd/pcbs/about.htm. 40For more information on the TEF Approach, visit www.epa.gov/raf/hhtefguidance. 41EPA/600/P‐03/002F. November 2006.

NationalAirToxicsProgramTheIntegratedUrbanStrategyReporttoCongress
3‐12
3.4.4. LeadEmissionsandBloodLeadLevelsHaveBeenSignificantlyReduced
Most ambient concentrations of lead once came from the tailpipes of cars. The EPA phased out lead in gasoline from 1973 through 1995, and almost all lead emissions now originate from major stationary sources (e.g., lead smelters) and aircraft with piston engines that operate on leaded gasoline, which are generally used for personal transportation, instructional flying and business. Lead is a criteria pollutant and lead compounds are listed HAPs. Therefore, lead has a national ambient air quality standard and a separate monitoring network.42 As shown in Exhibit 3‐6, between 1980 and 2010, maximum annual 3‐month average concentrations of lead were reduced by 89 percent.43
Exhibit 3‐6. Lead Air Quality, 1980–201044
Lead exposure can result in a variety of health effects, including lowering the IQ of children. To assess changes in total lead exposure of children, the EPA reviews data on lead levels in blood for children 5 years old and younger. From 1980 to 2005, national average lead concentrations in children were down 96 percent. See Exhibit 3‐7. The median concentration of lead in the blood of children 5 years old and under dropped from 15 micrograms per deciliter (µg/dL) in 1976–1980 to 1.4 µg/dL in 2007–2008, a decline of 91 percent. The concentration of lead in blood at the 90th percentile in children 5 years old and under dropped from 25 µg/dL in 1976–1980 to 3.2 µg/dL in
42National Ambient Air Quality Standards. http://www.epa.gov/ttn/naaqs/. 432010 Trends Report, http://www.epa.gov/airtrends/lead.html. 44Source: National Trends Report.
NationalAirToxicsProgramTheIntegratedUrbanStrategyReporttoCongress
3‐13
2007–2008. In 1978, about 88 percent of children ages 1 to 5 (about 13.5 million children) had blood lead levels at or greater than 10 µg/dL (a level emphasized in the past for purposes of identifying children with lead poisoning). By 2008, this number had declined to about one percent (about 250,000 children). It should be noted that in Exhibit 3‐7, the period before CDC’s elevated blood lead (EBL) threshold for children was 10 μg/dL. However, the childhood blood lead level CDC has defined as elevated, for which intervention is recommended, has declined from 30 μg/dL in 1975, to 25 in 1985, 10 in 1991 and 5 in 2012.45 46 47 This decline in blood lead levels is generally attributed to the significant reductions that have been made in children’s lead exposures including those associated with the phasing out of lead in gasoline used in automobiles and the reduction in the number of homes with lead‐based paint from 64 million in 1990 to 37 million in 2006.48 It is also a result of the EPA regulations reducing lead levels in drinking water, as well as legislation restricting the content of lead in solder, faucets, pipes, and plumbing. Lead also has been eliminated or reduced in food and beverage containers and ceramic ware and in consumer products such as toys, mini‐blinds and playground equipment.
45CDC 1985. Preventing Lead Poisoning in Young Children. www.cdc.gov/nceh/lead/publications/plpyc1985.pdf. 46CDC 1991. Preventing Lead Poisoning in Young Children. www.cdc.gov/nceh/lead/Publications/books/plpyc/. 47CDC 2012. Response to Advisory Committee on Childhood Lead Poisoning Prevention Recommendations in “Low Level Lead Exposure Harms Children: A Renewed Call of Primary Prevention.” www.cdc.gov/nceh/lead/ACCLPP/CDC_Response_Lead_Exposure_Recs.pdf. 48Department of Housing and Urban Development. American Healthy Homes Survey. Lead and Arsenic Findings. 2012. http://www.hud.gov/offices/lead/.

NationalAirToxicsProgramTheIntegratedUrbanStrategyReporttoCongress
3‐14
Exhibit 3‐7. Measure B1: Concentrations of Lead in Blood of Children 5 and Under
3.4.5. DieselEmissionsHaveBeenSignificantlyReduced
Exhaust from diesel engines contains many urban air toxics, such as acetaldehyde, acrolein, benzene, 1,3‐butadiene, formaldehyde and polycyclic aromatic hydrocarbons. Diesel exhaust is emitted from a broad range of engines: the onroad engines of trucks, buses and cars and the nonroad engines that include locomotives, marine vessels and heavy‐duty equipment. Diesel exhaust causes health effects from both short‐term or acute exposures and also long‐term chronic exposures. The type and severity of health effects depends upon several factors including the intensity of exposure (e.g., concentration) and the duration of exposure. Individuals also react differently to different levels of exposure. Acute exposure to diesel exhaust may cause irritation to
NationalAirToxicsProgramTheIntegratedUrbanStrategyReporttoCongress
3‐15
the eyes, nose, throat and lungs, and some neurological effects such as lightheadedness. Acute exposure may also elicit a cough or nausea as well as exacerbate asthma. Chronic exposures in experimental animal inhalation studies have shown a range of dose dependent lung inflammation and immunological cell changes in the lung. Based upon human and laboratory studies included in the 2002 Diesel Health Assessment Document (HAD), long‐term (i.e., chronic) inhalation exposure to diesel engine exhaust is likely to pose a lung cancer hazard to humans, as well as damage the lung in other ways depending on exposure. Short‐term (i.e., acute) exposures can cause irritation and inflammatory symptoms of a transient nature, these being highly variable across the population.49
The EPA concluded in the Diesel HAD that it was not possible to calculate a cancer unit risk for diesel exhaust due to limitations in the lung cancer epidemiology studies available at the time, such as limited quantitative exposure histories in occupational groups investigated. Although the 2005 NATA did not quantify the cancer risk from exposure to diesel exhaust, the EPA has concluded that diesel exhaust ranks with the other emissions that the 2005 NATA suggests pose the greatest relative risk (U.S. EPA, 2007). Since the publication of the Diesel HAD, there have been a number of large epidemiology and toxicology studies published about diesel exhaust’s health effects. In June 2012, based on the studies available, the World Health Organization’s International Agency for Research on Cancer (IARC) designated diesel engine exhaust as “carcinogenic to humans.” The panel concluded that there was “sufficient evidence” of lung cancer in humans and animals and "limited evidence” of bladder cancer in humans. EPA is evaluating the new studies and IARC’s conclusions in considering future assessments of diesel exhaust. Diesel PM emissions from both onroad (e.g., diesel trucks) engines, nonroad engines (e.g., construction and agricultural equipment), locomotives and commercial marine diesels have been reduced and will continue to decline in the future. Specifically, mobile source diesel onroad and nonroad PM decreased by about 27 percent from 1990 to 2005 and significant additional reductions (roughly 90 percent) are projected from 2005 to 2030 as many of the recent mobile source rules targeting diesel engines go into effect. For additional information on mobile source diesel particulate matter regulations and voluntary programs such as the National Clean Diesel Campaign, see Chapter Two and Chapter Four, respectively.
3.5. EVALUATINGAIRTOXICSRISKS
All air toxics do not pose the same risks at the same concentrations. The magnitude of the risk is a function of both the level of exposure as well as the toxic potency of the pollutant. Some toxics, like dioxins, can be harmful in relatively small amounts, whereas other toxics with large emissions might pose smaller relative risks. For the purposes of this report to Congress, this section describes two analyses that give a better sense of the risks posed by air toxics:
49http://cfpub.epa.gov/ncea/cfm/recordisplay.cfm?deid=29060#Download.

NationalAirToxicsProgramTheIntegratedUrbanStrategyReporttoCongress
3‐16
A snapshot of inhalation cancer and noncancer risks in 2005 (the most recent year for which we have modeling data); and
A description of urban areas that have the highest inhalation cancer risks.
The EPA’s NATA is a comprehensive evaluation of air toxics (177 HAPs and diesel particulate matter) in the U.S. NATA provides estimates of the risk of cancer and other serious health effects from breathing air toxics. The EPA, state, tribal and local air agencies and others use NATA to identify and prioritize air toxics, emission source types and locations that are of greatest potential concern in terms of contributing to population risk. Assessments include estimates of cancer and noncancer health effects based on chronic exposure from outdoor sources, including assessments of noncancer health effects for diesel PM. Assessments provide a snapshot of the outdoor air quality and the risks to human health that would result if air toxics emissions levels remained unchanged (U.S. EPA, 2011c).
As with any modeling analysis, there are uncertainties and limitations associated with NATA. The EPA suggests that the results of this assessment be used cautiously, as the overall quality and uncertainties of the assessment will vary from location to location as well as from pollutant to pollutant. It is necessary to recognize that the specific limitations of NATA are critical to proper interpretation and utility of the results shown in this report. Specifically, these risk estimates:
• Apply to broader geographic areas (such as nationwide, states, core‐based statistical area (CBSA) or counties), not specific locations.
• Do not reflect exposures and risk from all pollutants. Only inhalation exposures are included (and therefore do not include risks from mercury, dioxin and other pollutants with ingestion or other pathways of exposure).
• Reflect only compounds released into the outdoor air and their chemical transformations.
• Do not fully capture variation in background ambient air concentrations.
• Might systematically underestimate or overestimate ambient air concentrations for some compounds.
• Are based on default, or simplifying, assumptions where data are missing or of poor quality.
• Might not accurately capture sources that have episodic emissions.
Most importantly, the 2005 NATA represents a snap‐shot of conditions in 2005 and, as such, does not reflect current conditions. Since 2005, the EPA, states and communities have implemented a number of programs to reduce air toxics emissions. The EPA is in the process of updating its NATA using more recent data.
Further details on the NATA analysis can be found in the 2005 NATA Technical Methods Document (U.S. EPA, 2011c).
The 2005 NATA estimates that in 2005: All 285 million people in the
U.S. had an increased cancer risk of at least 10 in a million due to the inhalation of HAPs from outdoor sources.
Urban locations generally average cancer risks of 54 in a million compared to 31 in a million for rural areas.

NationalAirToxicsProgramTheIntegratedUrbanStrategyReporttoCongress
3‐17
3.5.1. Summaryof2005NATARiskResults
NATA is best used at a broad geographic level, such as the county or national level. Historical data show that approximately 1 out of every 3 Americans (or 336,000 in a million) will contract cancer during their lifetime when all causes are taken into account. The 2005 NATA estimated that all 285 million50 people in the U.S. at the time of the assessment had an increased cancer risk of at least 10 in a million due to the inhalation of HAPs from outdoor sources. The analysis showed that background emissions alone (background includes natural emission sources, environmentally persistent historical emissions and long‐range transport of current emissions) were responsible for risks of more than 10 in a million risk. Examining these background risks closer, NATA also showed that persistent historical concentrations of carbon tetrachloride alone were responsible for a nationwide risk level of about 3 in a million. Secondary formed pollutants such as aldehydes contributed over 20 in a million risks nationwide.
Additionally, the 2005 NATA showed that about 13.8 million people—about 5 percent of the total U.S. population based on the 2000 census—were exposed to air toxics levels that result in a person’s increased cancer risk of 100 in a million or greater. These higher risk populations occur mainly in urban locations where a combination of sources results in elevated risks levels. NATA 2005 estimated the national average lifetime cancer risks due to breathing air toxics from outdoor sources to be 50 in a million. Emissions from three pollutants, namely formaldehyde, benzene and acetaldehyde, contribute to about two‐thirds of the total risks at a national level. Urban locations (as defined in the Strategy)51 generally average higher cancer risks than rural locations, and the 2005 NATA reflects this: urban areas had average risks of 54 in a million and rural areas of 31 in a million. NATA also estimated that most individuals living in the larger urban areas have average cancer risks that are between 80 and 100 in a million for the emissions year 2005. The next section discusses these elevated risks in some urban areas in further detail. Additional detail on the 2005 NATA analysis can be found in the NATA Technical Methods Document52 (U.S. EPA, 2011c).
SectorContributiontoNATACancerRiskResults The 2005 NATA results include 80 air toxics that are considered possible, probable or known carcinogens and have quantitative dose‐response values available for calculating cancer risks. The group of priority urban air toxics includes 26 carcinogenic pollutants that are responsible for roughly 90 percent of the national average cancer risk estimated by the 2005 NATA. Based on the 2005 NATA, the EPA estimates that stationary source emissions are responsible for about 49 percent of the national average cancer risk (major sources 15 percent and area sources 34 percent), while mobile source emissions are responsible for about 45 percent (29 percent onroad mobile and 16 percent nonroad mobile). Remaining background emissions (e.g., from natural sources and pollutants that remain in the atmosphere for an extended period of time) comprise the remaining 6 percent of the national average cancer risk. See footnote 54 for explanation on
50The 2005 NATA used the 2000 census, which estimated the U.S. population to be 285 million. 51See the Integrated Urban Air Toxics Strategy, 64 FR 38724, which defines the use of consolidated metropolitan statistical areas (C/MSA) boundaries as a starting point to defining urban areas. 52http://www.epa.gov/ttn/atw/nata2005/05pdf/nata_tmd.pdf.

NationalAirToxicsProgramTheIntegratedUrbanStrategyReporttoCongress
3‐18
background. Exhibit 3‐8 shows the 2005 NATA distribution of risks.
Exhibit 3‐8. 2005 NATA Nationwide Cancer Risks – Sector Contributions (with background and
secondary allocated)
Summaryof2005NATANoncancerRiskResults The 2005 NATA also provides an evaluation of chronic noncancer risks. NATA uses a target organ‐specific hazard index (HI)53 approach (U.S. EPA, 2011c), which is the typical approach for assessing
53The Hazard Index (HI) is the sum of hazard quotients (HQs) for substances that affect the same target organ or organ system. The HQ is the ratio of the potential exposure to the substance and the level at which no adverse effects are expected. Because different pollutants can cause similar adverse health effects, it is often appropriate to combine HQs associated with different substances. The hazard index (HI) is only an approximation of the aggregate effect on the target organ, (i.e., lungs) because some of the substances might cause irritation by different (i.e., non‐additive) mechanisms. Exposures that result in a HI value equal to or below 1 derived using target organ specific hazard quotients likely will not result in adverse noncancer health effects over a lifetime of exposure and would ordinarily be considered acceptable. However, an HI greater than 1 does not necessarily suggest a likelihood of adverse effects. Because of the inherent conservatism of the reference concentration (RfC) methodology, the acceptability of exceedances must be evaluated on a case‐by‐case basis, considering such factors as the confidence level of the assessment, the uncertainties, the slope of the dose‐response curve (if known), the magnitude of the

NationalAirToxicsProgramTheIntegratedUrbanStrategyReporttoCongress
3‐19
the potential for adverse health effects from breathing noncarcinogenic pollutants. While there are local areas identified by the 2005 NATA that exceeded an HI of 1 for target organs other than the respiratory system, the respiratory system was the only target organ in the analysis with HI values exceeding 1 across widespread portions of the country. As a result, we have focused our evaluation of progress related to noncancer risks on risks to the respiratory system. The 2005 NATA estimated that the national respiratory HI was more than 2, with nearly three‐fourths of the nation exposed at an HI greater than 1, and more than 2.8 million people exposed at an HI of greater than 10. The priority urban air toxics, which include 9 noncancer respiratory pollutants, contributed roughly 90 percent of the nationwide average respiratory HI that is estimated by the 2005 NATA. Using NATA and apportioning background concentrations to stationary and mobile sources, the EPA estimates that stationary sources are responsible for about 49 percent of the national average respiratory HI, and mobile sources are responsible for about 51 percent of those risks.54
3.5.2. UrbanAreaswiththeHighestCancerRiskThis section responds to the requirements in CAA section 112(k)(5) that this report identify specific metropolitan areas that continue to experience high risks to public health as the result of emissions from area sources. The first Urban Air Toxics Report to Congress issued in 2000 did not identify specific metropolitan areas, because the EPA had only recently begun to implement its Integrated Urban Air Toxics Strategy. For this second Urban Air Toxics Report to Congress, the EPA is drawing on information from its last national‐scale assessment (i.e., the 2005 NATA, which was based on a 2005 inventory of air toxics emissions), as well as other available information. The 2005 NATA estimated that more than 13.8 million people in many urban areas were exposed to cancer risks greater than 100 in a million due to emissions of air toxics from all outdoor sources (i.e., area sources, as well as all other stationary sources, mobile sources, background and secondary formation). A summary of results from the 2005 NATA, including a map of urban areas with cancer risks greater than 100 in a million, is available on the EPA’s website at www.epa.gov/nata2005. It is important to note that these data represent a snapshot of the estimated risks in 2005, and the data will be updated as part of the EPA’s new (2011) NATA, which is expected to be released in 2015. As noted elsewhere in this report (see, for example, Section 3.2), because of additional emissions reductions due in large part to federal stationary and mobile source rules and programs since 2005, the EPA expects the risk results for the 2011 NATA to be different for some urban areas when compared with the 2005 NATA and in many areas may be lower.
Another important finding from the 2005 NATA, as well as several other air toxics studies in particular urban areas (as summarized in Appendix C) is that while some general similarities are
exceedance, and the numbers or types of people exposed at various levels above the RfC. Furthermore, the HI cannot be translated to a probability that adverse effects will occur and is not likely to be proportional to risk. 54To better understand the actual distribution of cancer and noncancer risks, the background and secondary formation risk, as presented in the 2005 NATA, have been allocated to their appropriate source categories. The EPA allocated background risks on a pollutant‐by‐pollutant basis to stationary and mobiles source categories by allocating the background risks by their respective national emission ratios for each source group. Carbon Tetrachloride, which is no longer emitted, was not allocated. Secondary risks were allocated in a similar fashion by allocating the risks by their respective total (rather than pollutant) national emission ratios.

NationalAirToxicsProgramTheIntegratedUrbanStrategyReporttoCongress
3‐20
evident in urban air toxics exposures and risks, the identity and concentration of air toxics vary significantly from area to area depending on the particular sources present (or dominant), the substances emitted, the local meteorology and other factors. The 2005 NATA results showed that the highest risks generally occurred in the largest metropolitan statistical areas (MSAs). An MSA is defined as having “at least one urbanized area of 50,000 or more population, plus adjacent territory that has a high degree of social and economic integration with the core as measured by communities.”55 It is important to note that MSAs identified in the 2005 NATA may have as few as one census tract that is actually characterized by high risk. Indeed, this is generally the case for many of the MSAs identified on the NATA website as having elevated risks. Since the results of the 2005 NATA are also available at the lower census tract level, the public is encouraged to view the full results of the 2005 NATA, and any future update to the NATA, at the census tract level in order to accurately understand the estimate of localized risk.56 In addition, the 2005 NATA results showed that the risks in largest MSAs resulted from a combination of multiple source emissions. As shown in Exhibit 3‐9, stationary sources in one large CBSA (similar to MSA), New York City, contributed about half of the total risk.
55 There are currently 381 MSAs in the United States. See, OMB Bulletin NO. 13‐01, February 28, 2013, Revised Delineations of Metropolitan Statistical Areas, and Guidance on Uses of the Delineations of These Areas, available at: http://www.whitehouse.gov/sites/default/files/omb/bulletins/2013/b‐13‐01.pdf. 56 In contrast to the 381 MSAs currently delineated in the United States, there were 74,134 census tracts in the United States, Puerto Rico, and the Island Areas for the 2010 Census, See, http://blogs.census.gov/2013/10/25/74134‐census‐tracts‐and‐more‐geographic‐area‐tallies‐information/

NationalAirToxicsProgramTheIntegratedUrbanStrategyReporttoCongress
3‐21
Exhibit 3‐9. 2005 NATA – Sector Contributions to Risks (New York CBSA)
The 2005 NATA also showed that formaldehyde and benzene contribute to more than half of the estimated cancer risk in this large CBSA. This is illustrated in Exhibit 3‐10.

NationalAirToxicsProgramTheIntegratedUrbanStrategyReporttoCongress
3‐22
Exhibit 3‐10. 2005 NATA – Pollutant Contribution to Risk (New York CBSA)
BenzeneandFormaldehyde–DriverPollutantsBenzene is among the pollutants that contributes a significant portion of the risk in large urban areas. Examining trends in benzene concentrations in these large areas can serve as an indicator of longer‐term exposures to benzene for high risk individuals. For example, if the monitored trends for a particular large CBSA show a decrease in benzene concentrations over time, it can be inferred that decreases should be lower in other large metropolitan areas as well.
Available data in New York from several monitoring locations from 1990 to 2010 (Exhibit 3‐11) show a sharp decrease at one monitoring location in the 1990s, likely related to control efforts related to reducing ozone levels. The data also show a continuing downward trend at three other monitoring locations in New York from 2002–2010, most likely a result of further reductions in benzene due to reformulation of gasoline and other mobile source programs. For reference, in the graph we have plotted the NATA 2005 predicted ambient benzene concentrations for the census tract in which the monitor is located.

NationalAirToxicsProgramTheIntegratedUrbanStrategyReporttoCongress
3‐23
Exhibit 3‐11. Benzene Trends in New York
Like benzene, formaldehyde is an urban HAP that contributes significantly to risk in large metropolitan areas. The EPA estimates that man‐made formaldehyde emissions have decreased in a large metropolitan area such as New York by 63 percent. However, it is difficult to understand how much the emission reductions impact the ambient concentrations of formaldehyde. This is because formaldehyde is created from biogenic sources and other pollutants or precursors in the air via sunlight and chemical reactions called secondary formation, in addition to being emitted directly into the air from industrial and mobile sources. We cannot see an ambient monitoring trend in some cities (e.g., New York) due to the impact of secondary formation on the measured formaldehyde concentrations. The formation of formaldehyde is complex and a function of many factors including the intensity of sunlight, the mixing and concentration of precursor pollutants in the air and the rate of the chemical reactions. It is also a function of geographic location, season and time of day. While federal, state, local and tribal governments and industry have taken actions to reduce emissions of formaldehyde, the fact that much of the formaldehyde concentrations in the air are generated in the atmosphere from other pollutants makes it difficult to assess progress.
Since 2005, the EPA rules have continued to reduce risks in these areas through further reductions in HAP emissions. For example in New York, the NESHAP for Miscellaneous Metal Parts and Products (surface coating) and the NESHAP for the Reciprocating Internal Combustion Engines for major sources have reduced emissions of HAPs organic compounds such as toluene, methylene chloride and formaldehyde. Other rules promulgated more recently will achieve further reductions, including the NESHAP for Reciprocating Internal Combustion Engines affecting existing

NationalAirToxicsProgramTheIntegratedUrbanStrategyReporttoCongress
3‐24
spark ignition engines and the NESHAP for Gasoline Distribution, Gasoline Dispensing Facilities.
3.6. OVERALLFINDINGSINTHISCHAPTERANDCONTINUEDEFFORTS
Overall, air toxics emissions (from major, area and mobile sources) have significantly declined since 1990. Reductions of air toxics emissions have been achieved through the EPA’s standards and other national, regional and community‐based initiatives to address the most important sources of air toxics risks in urban areas. We have shown that due to stationary source regulations promulgated since 1990, that over 1.5 million tons of HAPs have been removed from the air on an annual basis. In addition, mobile source emissions have been reduced by 50 percent since 1990 and will continue to decrease as the fleet turns over. By 2030, mobile source emissions will be approximately 80 percent lower than 1990 levels, reflecting both absolute reductions in emissions relative to 1990 levels and offsetting of emissions increases due to economic and population growth since 1990.
These estimates are based on the tools and data available at this time. In this chapter, we have identified several data gaps and limitations (see section 3.1.1.) that affect our understanding of air toxics and our ability to measure actual progress achieved. Having a clear understanding of the air toxics program is essential for the EPA and others to prioritize actions and make progress to reduce risks. Some important steps to that end include:
Continuing research efforts related to cumulative impacts to understand and address more fully the implications of the public’s exposure to multiple pollutants at once. Other important, related research includes improving our understanding of health effects of air toxics (e.g., dose‐response values), exposure assessment and risk assessment methods.
Improving emissions inventories. Under the current program, sources and states are not required to submit air toxics emissions data, so the consistency and quality of these emissions varies significantly.
Promoting ambient monitoring through national programs as well as community‐scale grants. Improved monitoring data will make it easier to identify local air toxics problems and develop strategies that improve public health.
With the Office of Research and Development and other partners, developing new monitoring technologies that are less costly and can provide information that is more transparent and accessible to communities and businesses.
Updating NATA with more recent data to track progress and trends in risks.
Applying Value of Information principles to ensure the highest value returns from investments in programs and research.

NationalAirToxicsProgramTheIntegratedUrbanStrategyReporttoCongress
4‐1
Chapter4: National,RegionalandCommunity‐BasedInitiatives
4.1. INTRODUCTION
The CAA stated under section 112(k)(4) that the EPA shall encourage and support area‐wide strategies developed by state and local air pollution control agencies that are intended to reduce risks from emissions by area sources within a particular urban area. Because of the variability of air toxics at the urban level, the Strategy acknowledged that a partnership with state, tribal and local governments could be very beneficial at resolving issues at the local level. These governments have the most experience with local air pollution issues and can lend their expertise and knowledge to address and resolve concerns unique to their specific areas. As the federal partner, the EPA can contribute national standards and requirements using CAA authorities to develop and implement a national regulatory program. We also have the resources and expertise to evaluate, or to help other agencies evaluate toxic pollution problems. By integrating our strengths, partnerships can provide a stronger, more efficient and effective program to address air pollution in urban areas. This chapter focuses on initiatives at the national, regional and community‐based level to help reduce air toxics emissions at the localized area.
The agency has also learned that communities can be drivers for local solutions; however, far too many communities lack the capacity to truly affect environmental conditions. As a result, many low‐income, minority and indigenous communities continue to live in the most polluted air and face some of the most severe health impacts, both in urban and rural areas. The EPA has implemented numerous programs to support community empowerment and provide benefits that range from basic educational and leadership development to comprehensive approaches. These include financial assistance programs such as Environmental Justice, CARE, Brownfields Area‐Wide Planning, Lead, and Tribal grants and community‐based programs such as the EPA’s Local Climate and Energy, Childhood Asthma, Sustainable Communities and Smart Growth, Urban Waters, Superfund and Brownfields programs.57 The EPA’s ten regional offices play a leading role in implementing these programs.
Plan EJ 2014, the EPA’s roadmap for integrating environmental justice into its programs and policies, is designed to improve the effectiveness of the EPA’s community‐based programs through better information access and coordination. The EPA will build upon and leverage agency efforts to promote greater coordination in the use of programs and tools that support community empowerment. Through these efforts, the EPA will make the agency’s resources more accessible to underserved communities, while achieving greater internal efficiency through feedback and better understanding of how to implement community‐based programs. This approach will result in environmental, health and economic improvements in such communities.
57Plan EJ 2014. http://www.epa.gov/compliance/ej/plan‐ej/.
NationalAirToxicsProgramTheIntegratedUrbanStrategyReporttoCongress
4‐2
All of the efforts described in this chapter are directly tied to implementing Goal 3 in the Strategy (refer to Chapter One), which is to “address disproportionate impacts from air toxics across urban areas, such as geographic ‘hot spots,’ highly exposed population groups and predominately minority and low‐income communities.”
4.2. AREA‐WIDEACTIVITIES
Section 112(k)(4) mandated that the Administrator shall encourage and support area‐wide strategies developed by state or local air pollution control agencies that are intended to reduce risks from emissions by area sources within a particular urban area. From the funds available for grants under section 112, the EPA shall set aside not less than 10 percent to support area‐wide strategies addressing HAPs emitted by area sources and shall award such funds on a demonstration basis to those states with innovative effective strategies.
Funds for urban air toxics area‐wide strategies have never been appropriated to the agency. Congress has appropriated funds to the agency under section 103 (typically for specialized air studies) and section 105 (to implement programs to prevent and control air pollution and address primary and secondary ambient air quality standards) of the CAA. The EPA has issued annual program guidance for numerous years encouraging the use of a portion of these funds by recipients to support air toxics reduction strategies, although there is no requirement that states or tribes do so. Actual use of funds can vary based on individual recipient negotiations, program emphasis from year‐to‐year and performance partnership grant flexibility. Between 1990 and 2011, the EPA awarded about 15 to 20 percent of the allotment of funds to air toxics programs through the State and Tribal Assistance Grants (STAG) program. In addition to the STAG funding, the EPA has used other avenues, such as the use of the EPA’s allocated Environmental Program Management (EPM) funding, to award grants to state, tribal and local agencies for community assessment and risk reduction activities, which are discussed in more detail within this chapter.
4.3. STATE,TRIBALANDLOCALGOVERNMENTINITIATIVESANDPROGRAMS
The 1999 Integrated Urban Air Toxics Strategy noted that local and community‐based initiatives should involve partnerships between the EPA and state, tribal and local governments. To obtain advice on how to structure a program encompassing federal, state, tribal and local governments to address air toxics risks collectively, the EPA developed the Integrated Air Toxics State/Local/Tribal Program Structure Workgroup in January 2000. The workgroup was created under the CAA Advisory Committee, which was chartered in 1990 through the Federal Advisory Committee Act (FACA). In September 2000, the FACA workgroup finalized its report titled, “Recommended Framework for the State/Local/Tribal Air Toxics Risk Reduction Program.”58 The FACA workgroup recommended development of a flexible framework that accommodated existing, mature state and local air toxics programs, and state, tribal and local agencies that needed to develop entire programs. The FACA workgroup also acknowledged that it was essential for state, tribal and local
58http://www.epa.gov/ttn/atw/urban/facawg.pdf.

NationalAirToxicsProgramTheIntegratedUrbanStrategyReporttoCongress
4‐3
governments to form partnerships with the EPA.
In September 2001, the EPA developed the “Workplan for the National Air Toxics Program and Integrated Air Toxics State/Local/Tribal Program Structure,” and its purpose was two‐fold.59 First, it was to provide an overview of the activities the EPA had accomplished or was planning to address during the technology‐ and risk‐based phases of the national air toxics program under the CAA. Second, the workplan described the EPA’s approach for exploring development of a program encompassing federal, state, tribal and local governments to address coherent air toxics risk during the risk‐based phase of the national program as recommended in the FACA report.
The EPA worked closely with the EPA regional offices, state, tribal and local agencies to determine what was needed to establish a risk‐based air toxics program as recommended by the FACA workgroup. The EPA subsequently determined that there would be significant complexities associated with developing the recommended type of program because air toxics issues can vary significantly from state‐to‐state and community‐to‐community. In addition, there were issues regarding the EPA’s legal authorities to implement a program as recommended by the FACA. As a result, it is the EPA’s intention to implement the program as required under section 112, including section 112(f). In addition, as we issue regulations pursuant to the residual risk program, we intend to work with state, tribal and local agencies, communities and industry to ensure any new requirements are implemented.
Since 1990, the EPA has helped state, tribal and local agencies by encouraging and supporting their area‐wide air toxics strategies. The EPA has developed technical support materials to provide guidance and recommendations for conducting risk assessments that can inform development of such strategies. For example, the EPA developed the Air Toxics Risk Assessment Reference Library,60 a three‐volume compendium of techniques for conducting all types of risk assessment for sources of HAPs. In addition, a hands‐on train‐the‐trainer course was developed and delivered to each of the ten EPA regional offices during 2004 and 2005. The purpose of this training was for the EPA regions to train the states and the states to train local communities on how to identify and assess issues of concern for their specific areas. The premise behind this type of training was to involve personnel who were knowledgeable about the issues in their regional and local areas. As a result of these technical support and outreach activities, state, tribal and local air pollution agencies are better equipped to use state‐of‐the‐art risk assessment methodologies and to develop their own risk‐based air pollution control strategies.
For example, the state of Oregon developed a statewide air toxics programs that required more stringent requirements in areas of concern. Louisville, Kentucky, developed local air toxics requirements designed to address the impacts of air toxics that pose elevated risks to human health in their area. In addition, the Gila River Indian Community, Salt River Indian Community and Fort McDowell Indian Community, in partnership with the state of Arizona, Maricopa County and the city of Phoenix, joined forces to conduct the Joint Air Toxics Assessment Program to identify risks from toxics in the Phoenix area.
59http://www.epa.gov/ttn/atw/urban/workplan.pdf. 60http://www.epa.gov/ttn/fera/risk_atra_main.html.

NationalAirToxicsProgramTheIntegratedUrbanStrategyReporttoCongress
4‐4
4.4. COMMUNITY‐BASEDINITIATIVES
The EPA has initiated and supported numerous state, tribal, local and community programs to reduce risks from air toxics. The EPA became involved in community assessment and risk reduction projects to learn more about risks from air toxics at local levels; to promote information sharing among the EPA and state, tribal and local agencies; and to use localized risk information in the development of the residual risk and urban air toxics programs. Beginning in fiscal year 2001, the EPA provided supplemental funding through grants to several community risk assessment and risk reduction projects to add value to regionally led, community projects and to learn more about issues at the local level. One of the important benefits of these community‐based efforts (beyond addressing local health risks) is capacity building and empowerment of communities, particularly minority, low income, tribal and indigenous populations or communities that often do not have access to resources to address their concerns. Studying local community projects enables EPA to find solutions that take into account the uniqueness of the problems faced by local communities (e.g., by avoiding implementing a one‐size‐fits‐all approach when running programs).
4.4.1. CommunityAirRiskReductionInitiative(CARRI)
From fiscal year 2001 to 2005, the EPA awarded more than $2 million in grant funding with a goal towards enabling communities to understand local air toxics issues better. CARRI funds supported community air toxics risk screening and assessment tool development; air toxics source identification and characterization through broad stakeholder participation; building of local air toxics inventory and characterization capacity; and support of on‐the‐ground projects aimed at reducing air toxics exposures and emissions. Using CARRI and other funding, the EPA regional offices were able to initiate many air toxics community projects while developing expertise in working with local communities and stakeholders. As a result of these regionally led local initiatives, tools, guidance, and an information database, known as the Air Toxics Community Assessment/Reduction Projects Database,61 were developed. By gathering and continuing to evaluate information collected from these community‐based projects, the EPA was able to learn more about air toxics problems at the local level and to refine models used in projecting risk in these communities. This information was also of value to other communities interested in addressing similar issues in their areas. This database is no longer updated but remains available as a reference.
4.4.2. CommunityActionforaRenewedEnvironment(CARE)
Building on the CARRI and other EPA community‐based programs, the agency currently fosters community action through the CARE program that has provided 100 cooperative agreements for creating broad‐based partnerships to identify and prioritize multimedia environmental problems, implement local solutions to reduce toxics risks and minimize public health concerns. As outlined in the 2009 National Academy of Public Administration report titled, “Putting Community First: A
61http://yosemite.epa.gov/oar/CommunityAssessment.nsf/Welcome?OpenForm.
NationalAirToxicsProgramTheIntegratedUrbanStrategyReporttoCongress
4‐5
Promising Approach to Federal Collaboration for Environmental Improvement,”62 many of these grants have gone to low income, minority communities in urban areas that have identified air toxics issues, such as diesel emissions, as high priorities. From fiscal year 2005 to 2011, the program received $16.1 million in funding.
Through CARE, local partnerships, including non‐profits, community residents, businesses, schools and tribal/local governments, identify, prioritize and implement local solutions to reduce environmental risks. The CARE program educates by helping them conduct community‐wide assessments of the environmental concerns they face and provides access to the EPA’s partnership programs.
The goals of the CARE program are to:
Reduce exposures to toxic pollutants through collaborative action at the local level.
Help communities understand all potential sources of exposure to toxic pollutants.
Work with communities to set priorities for risk‐reduction activities.
Create self‐sustaining, community‐based partnerships that will continue to improve the local environment.
Communities consider CARE grants for several reasons, including:
If a community wants to reduce levels of toxic pollution, the CARE program can help. CARE assists communities by providing information about the pollution risks they face and the funding to address these risks.
CARE promotes local consensus‐based solutions that address risk comprehensively.
Through CARE, the EPA also provides technical assistance and resources, thereby helping communities to identify and access ways to reduce toxic exposures, especially through a broad range of voluntary programs.
As communities create local stakeholder groups that successfully reduce risks, CARE helps them build the capacity to understand and address toxics in their environment.
CARE has offered two different types of cooperative agreements: Level 1 and Level 2. These can be thought of as assistance grants and approximately $90,000 and $275,000 respectively. Level 1 Cooperative Agreements helped communities:
Join together to form a broad‐based partnership dedicated to reducing toxic pollutants and environmental risks in their local environment. Partners can be non‐profit groups, community organizations, businesses, schools, state, tribal and local government agencies, the EPA and other federal agencies.
Identify problems and solutions. Working together, this stakeholder group assesses toxics problems in their community and considers options for reducing environmental risks. Many
62 http://www/napawash.org/pc_management_studies/CARE/5‐21‐09_Final_Evaluation_Report.pdf.
NationalAirToxicsProgramTheIntegratedUrbanStrategyReporttoCongress
4‐6
of the emission and exposure reductions will result from the application of the EPA partnership programs. The EPA technical assistance is available to support this process.
Level 2 Cooperative Agreements are for communities that already have established broad‐based collaborative partnerships and have completed environmental assessments. Level 2 Cooperative Agreements have helped communities:
Implement solutions and reduce risks: The partnership identifies the combination of programs that best meet the community's needs.
Become self‐sustaining: The community develops local solutions and ways to continue their environmental work long‐term (e.g., increased partnerships and sustainable practices). CARE funds pay to implement the local actions and solutions that are identified. These solutions will reduce risks within their community. The result: communities will build self‐sustaining, community‐based partnerships that will continue to improve human health and local environments into the future.
Not only has the CARE program helped many communities directly, but also the lessons learned from the CARE program have been invaluable to the agency. Currently, the CARE principles are being applied to an approach under development as part of the EPA Plan EJ 2014, which will focus on the agency being a conduit by bringing together underserved communities with federal agencies, private industry, businesses, foundations, universities and other institutions.
4.5. SUSTAINABLESKYLINESINITIATIVE(SSI)
The SSI was initiated in 2007 and continued through 2010 to help areas reduce their emissions and promote sustainability, with the goal of cleaner and healthier air. This effort encouraged governmental, public and private sectors in a community to work together to integrate transportation, energy, land use and air quality. The first pilot project began in Dallas, Texas, with a grant of $250,000.63 Within 3 years, the program had grown to include more than 26 partners and had leveraged more than $4 million from public, private and national governmental organizations. Between 2007 and 2010, an additional $625,000 in grant funding was provided to other areas, including Kansas City, Kansas and Missouri, Philadelphia, Boston, Indianapolis, and Upstate Forever South Carolina consisting of a multi‐county regional area in South Carolina. The program also initiated the Seventh Generation Initiative (SGI), which focused on Native American Indian tribes, livability and cultural preservation. Grants totaling $150,000 were split between the Leech Lake Band of Ojibwe Tribe, Mille Lacs Band of Ojibwe Tribe and Grand Traverse Band of Ottawa and Chippewa Tribe.
The SSI and SGI initiatives were successful in helping communities and tribes initiate community‐driven projects with a small amount of federal grant funding. These initiatives helped communities and tribes initiate a multimedia approach to achieve environmental benefits and improve air quality by recruiting public and private partners from within their community.
63http://www.sustainableskylines.org/Dallas/.

NationalAirToxicsProgramTheIntegratedUrbanStrategyReporttoCongress
4‐7
4.6. COMMUNITY‐SCALEAIRTOXICSAMBIENTMONITORINGGRANTS
Beginning in 2003, the EPA’s Office of Air Quality Planning and Standards, in conjunction with the Office of Transportation and Air Quality, the Office of Research and Development’s National Exposure Research Laboratory and the ten EPA regional offices, have conducted periodic Community‐Scale Air Toxics Ambient Monitoring grant competitions. The grants support projects of one and a half to three years duration that are designed to assist state, tribal and local communities in identifying and profiling air toxics sources, characterizing the degree and extent of local air toxics problems, and tracking progress of air toxics reduction activities. Expected outcomes of these projects are increased state, tribal and local agency ability to: 1) characterize the sources and local‐scale distribution of HAPs; and 2) assess human exposure and risk at a local scale. These increased capabilities are expected to facilitate increased public and industry awareness and action to adopt control measures that will reduce HAP emissions and public exposure. From fiscal year 2003 to 2011, the program received $22.6 million in funding.
In July 2009, the EPA issued a report that presents results from the Community‐Scale Air Toxics Ambient Monitoring projects that were completed at that time.64 Since 2004, grants have been awarded from this program to 52 unique projects to benefit local‐scale monitoring efforts, of which 35 have sufficiently progressed to be described in this report. Geographically, grants have been awarded across the entire United States in large, medium and small communities. Additional points were given to those applicants who demonstrated partnerships with community members, particularly those in EJ areas. Awarded grants fall into one of three category bins: community‐scale monitoring; method development/evaluation; and analysis of existing data. Each awarded grant generally ran from 18 to 36 months, but might have been extended due to project initiation difficulties. Each awardee has or will submit a final report to the EPA at the end of the project period. Targeted pollutants generally reflected the National Air Toxics Trends System core compounds, criteria pollutants or pollutants related to diesel particulate matter. It is important to highlight that in the grant solicitation in 2011, one of the criteria was to ensure that communities, particularly low income, minority and indigenous communities, are involved in the development and implementation of the projects.
4.7. NATIONALINITIATIVES
4.7.1. WoodSmokeReductionInitiative
Many areas across the country experience higher levels of residential wood smoke, which contains toxic constituents that are harmful to human health. To reduce wood smoke emissions, the EPA developed the woodstove changeout program and Burn Wise, programs that emphasizes the importance of burning the right wood, the right way, in the right wood‐burning appliance to protect your home, health and the air we breathe. The EPA has emphasized assisting urban and rural communities with replacing thousands of old, dirty wood stoves and fireplaces with cleaner
64http://www.epa.gov/ttn/amtic/files/ambient/airtox/CSATAMSummaryReport2009.pdf.

NationalAirToxicsProgramTheIntegratedUrbanStrategyReporttoCongress
4‐8
burning appliances and with making informed decisions about what it means to “burn wise.”
The wood stove changeout program is a voluntary, education and incentive‐based (e.g., rebates or discounts) effort to encourage owners of old, inefficient woodstoves to replace or “changeout” their stove with a cleaner burning appliance like gas stoves, wood pellet or corn stoves, or the EPA‐certified wood stoves.
Additionally, we have also negotiated with industry to design and market new wood burning devices that can meet tighter emissions levels on a voluntary basis. The devices consist of hydronic heaters (i.e., wood boilers) and fireplaces that are currently not covered by the EPA’s regulation for new residential wood heaters. The EPA initiated the hydronic heater partnership program in January 2007 to reduce emissions from new outdoor wood‐fired hydronic heaters. The EPA has worked with the hydronic heater industry to reach agreement on voluntary emissions levels for new heaters. The approach has brought thousands of cleaner heaters to market faster than under a traditional, regulatory approach. The goal of the program is to support those areas that choose to allow hydronic heaters by encouraging manufacturers to design and offer new, cleaner models for sale on the market as soon as possible. The program is structured in two phases: under Phase 1, qualified new units are at least 70 percent cleaner than existing units; and under Phase 2, new units are at least 90 percent cleaner than existing units.
Residential wood smoke contains harmful fine particle pollution, as well as hazardous air pollutants. The HAPs produced from burning wood and other organic matter in residential wood stoves, fireplaces and other wood‐burning devices in urban homes across the country include benzene, formaldhyde, acrolein, dioxins and furans, 1,3‐butadiene, PAHs, acetaldehyde, methane, and napthalene. The Wood Smoke Reduction Initiative encourages old appliance removal or appliance replacement with cleaner burning appliances (e.g. EPA‐certified wood stoves, pellet stoves, gas stoves) to reduce harmful air pollution indoors and out. The program also promotes best burning tips, which are practices known to help reduce wood smoke pollution. Over the past years, EPA has provided funding, technical support, training, education and outreach to more than 40 wood smoke reduction programs across the country. EPA’s Wood Smoke Reduction Initiative has supported many urban areas across the U.S. to reduce fine particle and other hazardous air pollution from wood smoke. These areas include Fairbanks, Alaska; Sacramento, California; Tacoma, Washington; Madison, Wisconsin; and Pittsburgh, Pennsylvania. All of these urban areas have households that burn wood as a primary source of heat. The urban programs have assisted these households, many of them low‐income, to replace high polluting wood‐burning devices with cleaner burning appliances (e.g., EPA‐certified wood stoves). The EPA estimates program HAP reductions using an EPA‐developed emissions calculator. The calculator estimates the amount of emissions avoided if EPA‐certified wood stoves replace a number of conventional wood stoves or if fireplaces are replaced by gas logs. The calculator contains assumptions from EPA’s National Emissions Inventory and, since 2008, provides HAP reduction estimates. As an example, Fairbanks, Alaska, has replaced 1,000 wood stoves with cleaner burning EPA‐certified stoves over the past few years. Removing the old stoves has reduced
NationalAirToxicsProgramTheIntegratedUrbanStrategyReporttoCongress
4‐9
approximately 3 tons of benzene, 1.7 tons of formaldhyde, and .15 tons of acrolein per year. Co‐benefits include 330 tons of CO, 88 tons of VOCs and 46 tons of particle pollution per year.65
4.7.2. CollisionRepairCampaign
In 2007, the EPA initiated a Collision Repair Campaign to help collision repair/autobody shops and communities reduce harmful HAPs from this industry. The program is voluntary, with participation from EPA headquarters and regional offices, state and local agencies and industry. The program provides free training, technical assistance and community outreach to local collision repair shops about established best management and pollution prevention practices. The program’s goal is to help shop owners reduce paint, solvent and related hazardous waste disposal costs. It also aims to achieve enhanced compliance with the EPA’s rule on Paint Stripping and Miscellaneous Surface Coating Operations at Area Sources by reducing pollutants early and to levels beyond those required by the rule.
This program has helped reduce the negative environmental and health impacts on employees and surrounding communities by reducing air toxics, VOC and PM emissions.
The collision repair industry was identified for a campaign for several reasons:
Many communities have identified these shops as an environmental and health concern, and hence the number of efforts across the United States to address this issue.
These shops are widespread in nature and tend to be clustered in minority, immigrant and low‐income neighborhoods.
Many of these shops are not in compliance with existing occupational and environmental health regulations.
Many of these shops are small businesses and do not often use standard methods for auto body repair and painting, and they do not comply with accepted industry practices or current control technologies.
To provide information to owners and operators about the federal area source rule designed to reduce auto body emissions.
Benefits of the campaign included:
Significantly less exposures to toxics, estimated to be reduced by 90 percent through implementation of best practices, which included installing and maintaining control equipment and using safer paints and solvents.
Lower HAP and VOC emissions by 3.5 million fewer pounds annually when best practices are utilized in 1,000 shops.
Reduced paint and solvent costs and related hazardous waste disposal costs.
65Assumes 4 cords of wood are burned per wood stove.

NationalAirToxicsProgramTheIntegratedUrbanStrategyReporttoCongress
4‐10
Better environmental stewards, happier and healthier community neighbors and improved worker safety and health.
Earlier and greater compliance for sources subject to the National Emission Standards for HAPs: Paint Stripping and Miscellaneous Surface Coating Operations at Area Sources rule.
4.7.3. SchoolAirToxicsMonitoringProjectStudy
In March 2009, the EPA released a list of schools that would be part of an initiative to understand whether outdoor toxic air pollution posed health concerns to schoolchildren. Air quality monitoring took place at 65 schools, many in low‐income, minority communities in 22 states and 2 tribal areas (the tribal monitoring has continued to include activities for four other tribes). The EPA selected the schools using results from computer modeling analyses, the 2002 NATA, results presented in a newspaper series on air toxics at schools and in consultation with state and local air agencies. The EPA focused on schools near large industries and schools in urban areas, where emissions of air toxics come from a mix of large and small industries, cars, trucks, buses and other sources.
Monitors were placed at each school for 60 days or long enough to collect 10 valid samples of each pollutant of interest. The pollutants monitored varied by school based on the best available information about the pollution sources, potential air concentrations and risk in each area. See Exhibit 4‐1 for a listing of the pollutants measured. The EPA and states also used equipment to measure wind speed and direction at each school during the monitoring.
Exhibit 4‐1. Pollutants Measured as Part of School Air Toxics Monitoring Study
Pollutant Groups Key Pollutants of Particular Interest
Carbonyls Acetaldehyde
Diisocyanates Methylenediphenyl diisocyanate; 2,4‐toluene diisocyanate; 1,6‐hexamethylene diisocyanate
Metals Arsenic; cobalt; lead; manganese; nickel
PAHs Benzo (a) pyrene and other PAHs; naphthalene
VOCs Acrolein; benzene; 1,3‐butadiene
Individual pollutants 4,4’‐methylenedianiline and Chromium VI (Hexavalent Chromium)
At schools where the EPA was interested in levels of lead and other metals, the agency collected both coarse particles (particulate matter or PM10) and total suspended particulate (TSP) samples.
Initial monitoring was completed for all schools in May 2010 and is posted on the EPA’s school

NationalAirToxicsProgramTheIntegratedUrbanStrategyReporttoCongress
4‐11
monitoring website.66 For most of the schools, monitored concentrations were lower than levels predicted by the EPA’s models. Overall, the levels monitored for most pollutants were within acceptable limits, but higher levels of certain pollutants were found in several communities. Additional monitoring was conducted for a few schools for various reasons. All additional monitoring was completed in early 2012, and the analysis was completed in early 2013. As a follow on to the schools program, the EPA issued a request in 2011 for grant proposals for community‐scale air toxics ambient monitoring projects as described in section 4‐6 above.
The EPA had limited information on tribal schools and limited emissions information, and therefore, was only able to include two tribal schools. The term “tribal school” refers to any school located within a reservation boundary or any school operated by a tribe, Bureau of Indian Affairs or tribal agency (regardless of location). The EPA was concerned that lack of information/data did not mean there was not a problem in Indian country and wanted to investigate further. As a result, the EPA has worked closely with the Tribal Air Monitoring Support Center to provide additional resources and monitoring equipment that can be loaned to tribes to conduct additional monitoring.67
4.8. MOBILESOURCEINITIATIVES
4.8.1. NationalCleanDieselCampaign
In 2000, the EPA initiated the National Clean Diesel Campaign, which promotes clean air strategies in urban areas and elsewhere by working with manufacturers, fleet operators, air quality professionals, environmental and community organizations, and state and local officials to reduce diesel emissions for existing engines that the EPA does not regulate. In addition to diesel PM, exhaust from diesel engines contains many urban air toxics, such as acetaldehyde, acrolein, benzene, 1,3‐butadiene, formaldehyde and polycyclic aromatic hydrocarbons. Because diesel engines can operate for 20 to 30 years, millions of older, dirtier diesel engines are still in use. The EPA offers many strategies and programs to help make these engines operate more cleanly and has funded diesel emission reduction programs that improve air quality and protect public health. The National Clean Diesel Campaign advances strategies, such as retrofits and reduced idling, to reduce diesel emissions from school buses, truck fleets, ports and construction sites. In addition, the EPA provides resources for state and local transportation through links to federal funding sources for projects relating to transportation and air quality (U.S. EPA, 2011d).
Congress appropriated dedicated funding to the National Clean Diesel Campaign through the Diesel Emissions Reduction provisions of the Energy Policy Act of 2005 (DERA). The EPA has administered approximately $50 million in fiscal year 2008, $120 million through the 2009 and 2010 appropriations. The American Recovery and Reinvestment Act of 2009 provided $300 million in additional DERA funding for national and state programs to support the implementation of verified and certified diesel emission reduction technologies. Over their lifetime, these projects are estimated to reduce at least 203,900 tons of nitrogen oxides (NOX) and 12,500 tons of PM. These
66http://www.epa.gov/schoolair/. 67http://www4.nau.edu/tams/services/tsatmproj.asp.

NationalAirToxicsProgramTheIntegratedUrbanStrategyReporttoCongress
4‐12
clean diesel projects also are estimated to create lifetime reductions of carbon monoxide (CO) by 48,000 tons, hydrocarbon (HC) by 18,000 tons and carbon dioxide (CO2) by 2.3 million tons and fuel savings of more than 200 million gallons. In addition, DERA projects funded in fiscal year 2011 are using technologies and strategies that can reduce PM emissions up to 95 percent.
4.8.2. SmartWay
The SmartWay Transport Partnership is a collaborative program between the EPA and the goods movement sector to increase the energy efficiency and energy security of our country while significantly reducing air pollution and greenhouse gases. The Partnership creates strong market‐based incentives that challenge companies shipping products and the truck and rail companies delivering these products to improve the environmental performance of their freight operations.
The EPA advanced the use of cleaner, more efficient technical and operational strategies by designating clean and efficient vehicles and products, recognizing top performing partners, and doing technical outreach and education. SmartWay partners save fuel, which contributes to our nation’s economic sustainability and energy security, while improving air quality and reducing the risk of global climate change by reducing CO2, NOx, PM and other harmful diesel emissions throughout the freight supply chain. SmartWay partners assess and track fuel savings and emission reductions using the EPA‐designed tools.
In 2011, SmartWay launched a new initiative aimed at upgrading the “drayage” trucks that service our nation’s ports. Diesel emissions from port drayage trucks, which are frequently older and dirtier than other freight trucks used in goods movement, can be a significant contributor to air quality problems for communities located near ports. These communities often face multiple economic and environmental challenges, including air quality concerns. The SmartWay Port Drayage Truck Initiative provides incentives for shippers, ports and truck operators to reduce diesel emissions, including PM emissions, and provides EPA‐designed tools to track these benefits.68
4.8.3. CleanSchoolBusUSA
Clean School Bus USA is a national partnership to minimize pollution from school buses. Leaders from corporate America and children's health, environmental and governmental organizations design plans to reduce children's exposure to diesel exhaust by eliminating unnecessary school bus idling, installing effective emission control systems on newer buses and replacing the oldest buses in the fleet with newer ones. Currently funded under the DERA program, clean school bus retrofit, replacement and reduced idling projects constitute about 22 percent of vehicles targeted in DERA grants.69
68http://www.epa.gov/smartway. 69http://www.epa.gov/cleanschoolbus.

NationalAirToxicsProgramTheIntegratedUrbanStrategyReporttoCongress
4‐13
4.9. NATIONALENFORCEMENT‐BASEDINITIATIVES
The EPA is utilizing the NEI, NATA, and innovative source monitoring and compliance evaluation techniques to assist in enforcement of air toxics regulations. The EPA is using these tools to identify communities that are in areas suspected to be affected by significant HAP emissions or to identify previously unknown HAP emissions. In recent years, the EPA's Air Toxics Enforcement Initiative has focused on equipment leaks and industrial flares at chemical manufacturing facilities and petroleum refineries.70 The EPA asserts that improperly operated flares and leaking equipment are some of the largest sources of HAP emissions at these facilities. As a result, in some cases, a facility's actual air toxics emissions may be significantly higher than previously reported.
Air toxics have been an EPA federal enforcement initiative since 2004. Since that time, federal enforcement cases have resulted in approximately 10 million pounds of HAP reductions and the installing of an estimated $43 million in pollution controls. Two recent settlements can be found at http://www.epa.gov/compliance/resources/cases/civil/caa/marathonrefining.html and http://www.epa/compliance/resources/cases/civil/bp‐whitingt.html.
4.10. CONTINUEDEFFORTS
Because air toxics tend to pose greater risks in urban areas, it is critical that the EPA continue to work in partnership with states, tribes, local governments and communities to make on‐going progress in reducing these risks. Some important ways to make these connections include building partnerships with state, tribal and local governments and communities to integrate our strengths, resources and expertise to resolve issues at the local level.
70http://www.epa.gov/oecaerth/data/planning/initiatives/2011airtoxics.html.

NationalAirToxicsProgramTheIntegratedUrbanStrategyReporttoCongress
5‐1
Chapter5: EducationandOutreach
5.1. INTRODUCTION
Given the scientific complexity inherent in air toxics issues and the need to communicate effectively about these risks to the public, the EPA has made education and outreach a key component in the Strategy. Because of the scope of the Strategy and the unique perspectives of key stakeholders like tribal leaders, small business owners and environmental justice communities, public participation is a necessity to the implementation of the Strategy and to meeting our risk reductions goals. Communication not only includes providing information to stakeholders and the public, but it also consists of an opportunity for them to play an active role in the development of regulations, policies and guidance that might affect them. This chapter presents the EPA’s education and outreach efforts with state, tribal and local governments as well as training, implementation tools and information dissemination programs.
5.2. STATE,TRIBALANDLOCALPARTNERSHIPS
The EPA's headquarters and regional offices, and state, tribal and local agencies recognize the importance of teamwork to ensure a successful program to protect public health and the environment. As part of these coordination efforts, the EPA has developed partnerships to share information on community capacity building, tools for understanding local air toxics and improving air quality and obtaining stakeholder advice and input. Examples of several partnerships are provided below.
The National Association of Clean Air Agencies (NACAA) represents air pollution control agencies in 53 states and territories and more than 165 major metropolitan areas across the United States. The primary role of the association is to encourage the exchange of information among air pollution control officials, to enhance communication and cooperation among federal, state and local regulatory agencies and to promote good management of our air resources.
The National Tribal Air Association (NTAA), founded in 2002 with a grant from the EPA, is managed by the National Tribal Environmental Council (NTEC) to advance air quality management policies and programs, consistent with the needs, interests and unique legal status of American Indian Tribes and Alaska Natives. All federally recognized tribes are eligible to become members.
The National Environmental Justice Advisory Council (NEJAC), established by the EPA in 1993, includes representatives of community, academia, industry, environmental, indigenous and state/tribal/local government groups in an effort to create a dialogue that can define and "reinvent" solutions to environmental justice problems.

NationalAirToxicsProgramTheIntegratedUrbanStrategyReporttoCongress
5‐2
5.3. TRAININGANDOUTREACH
The EPA’s training and outreach programs provide an important mechanism to delivering critical information on our rules and programs to state, tribal and local partners that implement air toxics programs, the public and others. These trainings and outreach efforts are delivered in many formats, including websites, videos, webinars, workshops and conferences. In recent years, we have worked closely with the NACAA Training Committee to develop an annual National Training Strategy for state and local air pollution agency staff. This effort includes implementation of a Learning Management System (LMS), completed in November 2012, to coordinate delivery and management of training nationwide and to promote efficient use of resources. The EPA is also assisting in development of a curriculum to facilitate the training of state and local air pollution agency staff on both introductory and more advanced levels. Classroom courses continue to be an important part of training for state, tribal and local air program staff. With more and more travel constraints, distance‐learning using pre‐recorded training video modules and webinars help the agency provide “just‐in‐time” training on regulations and policies.
Specific and technical air pollution training can be found at the Air Pollution Training Institute (APTI), which primarily provides technical air pollution training to state, tribal and local air pollution professionals, although others could benefit from this training. APTI's goal is to facilitate professional development by enhancing the skills necessary to understand and implement environmental programs and policies.71
Educational training toolkits are available for educators, students and the general public. Numerous on‐line training opportunities and supplementary materials have been developed on subjects such as the components of an air quality management system, a guide to air quality and your health, the importance of burning the right wood in the right way and common air pollutants. Much of this information is available online under the AIRNow “Learning Center.”72
Tribal Training: The agency also provides on‐going support for the Institute for Tribal Environmental Professionals (ITEP). ITEP was created in 1992 to act as a catalyst among tribal governments, and research and technical resources at Northern Arizona University (NAU), in support of environmental protection of Native American natural resources. Their mission is to serve tribes through culturally relevant education and training that increases environmental capacity and strengthens sovereignty. ITEP accomplishes its mission through several programs, including technical support for air and waste programs; program development support; and web‐based training. ITEP is a national organization and to date has served more than 500 federally recognized tribes with environmental education, training courses, technical assistance and other resources. In addition, the agency supports an annual conference, the National Tribal Forum, and provides other mechanisms for capacity building, including webinars for tribes to inform them of upcoming rules, conference calls and a tribal air newsletter to help keep the tribes involved in our programs and rules.
71http://www.epa.gov/apti/index.html. 72http://airnow.gov/ or http://epa.gov/aircompare/.

NationalAirToxicsProgramTheIntegratedUrbanStrategyReporttoCongress
5‐3
Environmental Justice (EJ) Community Training: The agency also provides capacity‐building activities for communities as well. In 2007, the EPA held its first Air and EJ Conference to help share best practices on community‐based activities. This conference grew in 2010 and 2011 to include multimedia issues and activities. In addition, the agency holds regular conference calls with communities and conducts webinars on upcoming rules and programs to keep the communities informed. In 2012, the EPA intends to expand its capacity building to include EJ and permitting, the use of publicly available technical tools and resources and other issues specific to addressing community needs and concerns.73
5.4. IMPLEMENTATIONASSISTANCETOOLS
To ensure affected sources, particularly small businesses, understand how to comply with air toxics regulatory standards and policies, the EPA develops implementation assistance tools, such as fact sheets, notification forms, compliance checklists, timelines, guidance manuals and trainings. These tools help to ensure that the rules are implemented successfully, and therefore, realize the expected emission reductions. Better compliance in turn, will help protect the public health of citizens living and working around the regulated emission sources. All of this information is posted on the EPA’s Air Toxics website.74
To coordinate better with the Office of Enforcement and Compliance Assurance, the Office of Air and Radiation assisted in the development of guidance for implementation of area sources that:
1. Prioritizes the area source rules to help delegated agencies and the EPA regions focus their limited resources on the most significant standards to achieve emission reductions to the greatest extent possible;
2. Identifies recommended approaches to ensuring compliance with individual rules; and
3. Provides delegated agencies flexibility to address regionally significant issues. In addition, the guidance addresses other implementation issues such as data reporting.75
5.5. INFORMATIONMANAGEMENTANDPUBLICAWARENESS
The EPA’s information management systems rely on electronic reporting to collect vast amounts of data provided by the EPA, state, tribal and local agencies. These systems take advantage of the latest technology to ensure the data are provided in an efficient and timely manner. However, it is not enough to simply collect data. The agency and the nation’s top research scientists rely upon the information stored in these systems to develop regulatory analyses and perform health
73http://www.epa.gov/air/ej/index.html. 74http://www.epa.gov/ttn/atw/index.html. 75Area Source Rule Implementation Guidance. June 4, 2010. http://www.epa.gov/compliance/resources/policies/monitoring/CAA/areasource.pdf.

NationalAirToxicsProgramTheIntegratedUrbanStrategyReporttoCongress
5‐4
studies.
Information systems also fill a critical role in fostering transparency with the public. Using websites, social media, Smartphone apps and other tools, the EPA information systems provide the public with access to important agency data that, taken together, provide a complete picture of the national air quality. For example, sources of air toxics emissions are available at http://www.epa.gov/ttn/chief/eiinformation.html while air quality information is available free to subscribers through the AIRNow iPhone app, AIRNow Facebook page and www.airnow.gov. This allows the public to see where in their community the sources of air toxics are located and then to see the resulting quality of the air they breathe.
The following is a list of critical information management data systems:
The Air Quality System (AQS) employs the latest in electronic reporting to house ambient air pollution data collected by the EPA, state, tribal and local air pollution control agencies from thousands of monitoring stations. AQS also contains meteorological data, descriptive information about each monitoring station (including its geographic location and its operator, and data quality assurance/quality control information. The EPA’s Office of Air Quality Planning and Standards and other AQS users rely upon the data to assess air quality, assist in attainment/non‐attainment designations, evaluate State Implementation Plans for non‐attainment areas, perform modeling for permit review analysis and other air quality management functions.76
The AQS Data Mart is a publicly accessible database containing all of the most requested information from AQS. The Data Mart was built as a storehouse of air quality information that allows users to request unlimited quantities of data. It also contains ozone data from AIRNow (the real time air quality reporting system) that participating agencies allow to be shared with the public. Currently, the AQS Data Mart has more than 2 billion sample values, including every measured value and the associated daily and annual aggregate values collected and calculated by the EPA since January 1, 1980. The Data Mart serves as the back‐end database for a number of agency interactive tools.77
The Emissions Inventory System (EIS) is the agency’s information system for storing all current and historical air emissions inventory data reported electronically from the EPA, state, tribal and local agencies. The EPA uses the EIS to receive and store emissions data and to generate a comprehensive, multipollutant, national emission inventory that supports regulatory and other clean air decisions. EIS provides the emissions inventory data that are made available to the public.78
AIRNow lets the public know the quality of the air they breathe and better understand links among local and regional control programs, personal behavior (e.g., driving, electricity use and fuel consumption), air pollution and health effects. The EPA, the National Oceanic and Atmospheric Administration, the National Park Service, tribal,
76http://www.epa.gov/ttn/airs/airsaqs/. 77http://www.epa.gov/ttn/airs/aqsdatamart/. 78http://www.epa.gov/ttn/chief/eiinformation.html.

NationalAirToxicsProgramTheIntegratedUrbanStrategyReporttoCongress
5‐5
state and local agencies developed the AIRNow website to provide daily Air Quality Index (AQI) forecasts and real‐time AQI conditions for more than 300 cities across the United States and links to more detailed state and local air quality websites.79
EnviroFlash is sponsored by the EPA with support from state and local air quality agencies and provides air quality information such as forecasts and action day notifications via email for a particular area of interest. EnviroFlash provides instant information that can be customized for the reader’s own needs, allowing individuals to adjust their lifestyle when necessary on unhealthy air quality days. Up‐to‐date air quality information is especially helpful for those with sensitivities, such as the young, people with asthma and the elderly.80
The Tribal Air website is designed to strengthen the EPA and tribal air quality programs in Indian country by providing timely and user‐friendly access to key information; promoting the exchange of ideas; and making available relevant documents to all environmental professionals who live and work in Indian country.81
5.6. CONTINUEDEFFORTS
TheEPAwillcontinue to work in partnership with our stakeholders to inform them about the air toxics program, including background on risks, regulatory actions, and opportunities for voluntary reductions. Some areas for continued development include:
Partnerships with state, tribal and local agencies to share information on capacity building, tools for understanding local air toxics and improving air quality and obtaining stakeholder advice and input, particularly on issues affecting them.
Updating the EPA’s website with the latest information on air toxics and developing videos, webinars and workshops on particular issues.
Expanding electronic reporting of environmental data and developing applications and technologies to provide more information to state, tribal and local agencies about risks in local areas.
79http://airnow.gov/. 80http://www.enviroflash.info/about.cfm. 81http://www.epa.gov/air/tribal/.

NationalAirToxicsProgramTheIntegratedUrbanStrategyReporttoCongress
6‐1
Chapter6: ResearchtoAddressKnowledgeGaps
6.1. INTRODUCTION
The purpose of this chapter is to provide an update on the EPA’s progress toward meeting the research needs of the Integrated Urban Air Toxics Strategy that were identified in the first report to Congress and to discuss the evolving landscape of air toxics research.
HistoryofAirToxicsResearchatEPA(2000–2011)
After the first report to Congress was published in 2000, the EPA developed a draft Air Toxics Research Strategy (U.S. EPA, 2002c) and an Air Toxics Research Multi‐Year Plan (MYP; U.S. EPA, 2003a), both of which were reviewed by the EPA Science Advisory Board (SAB) in 2004 (U.S. EPA, 2004). One of the critiques of the SAB was that neither the Air Toxics Research Strategy nor the Air Toxics Research MYP was effectively integrated with other research programs. In 2007, the EPA’s budget request included a reduction in resources for air research, including a substantial reduction in air toxics research, as the EPA began transitioning from research focused on individual pollutants toward a multiple air pollutant research program. Consistent with this transition and recognizing the need to better integrate and leverage air research resources, in 2008, the EPA’s Office of Research and Development integrated research programs on particulate matter, ozone and air toxics into one Clean Air Research MYP (U.S. EPA, 2008a). In 2008, the Office of Research and Development also created a Human Health Risk Assessment (HHRA) research program, which addresses toxicity assessment of air toxics.
OrganizationofthisChapter
Similar to the previous report, this chapter is organized around the risk assessment paradigm (Exhibit 6‐1), which links the elements of risk assessment (i.e., the description of a health problem, including whether one exists) with risk management (i.e., actions to address the risk). Consistent with this approach, the next four sections of this chapter focus on exposure assessment, health effects assessment (i.e., hazard identification and dose‐response assessment), risk assessment/ characterization and risk management, respectively. Within each of these four sections, the “Characterization of Needs” subsection summarizes the research needs identified in the previous report to Congress and summarized in Exhibit 6‐2 below. The “Progress thus Far” subsection discusses research that has been done over the last 12 years to address the needs identified in the 2000 Report to Congress. This chapter is not comprehensive of all air toxics research done over this period. Some studies are summarized in more detail in Appendix C, and the status of IRIS assessments for urban HAPs is summarized in Appendix D. The last section in this chapter, section 6.6 “Research for the 21st Century,” discusses new directions in EPA research, specifically as they relate to air toxics.

NationalAirToxicsProgramTheIntegratedUrbanStrategyReporttoCongress
6‐2
Exhibit 6‐1. The Risk Assessment Paradigm
Source: Adapted from National Academies’ Risk Assessment and Risk Management Model (NRC 1983) used by EPA
Exhibit 6‐2. Research Needs Identified in the 1999 Report to Congress
Research Need
Research Need Name
Exposure Assessment Needs
1 Improved ambient monitoring methods, characterization and network design to support a national ambient air toxics monitoring network
2 Improved area source emissions estimation methodologies and spatial allocation methods
3 Methodologies that allow for identification and speciation of important HAPs and their combustion and transformation products
4 A more accurate nonroad mobile source emissions characterization
5 Improved characterization of air toxics from trucks and improvement of modal emissions modeling capabilities for all vehicle classes
6 Development of source‐based urban‐scale air quality models for the urban HAPs
7 An understanding of the distribution of human exposures (including susceptible subpopulations) and the pathways by which HAPs reach humans
Health Effects – Hazard Identification and Dose‐response Assessment Needs
8 Use alternative sources of human health effects data (chronic and acute) for urban HAPs to develop and update dose‐response assessments
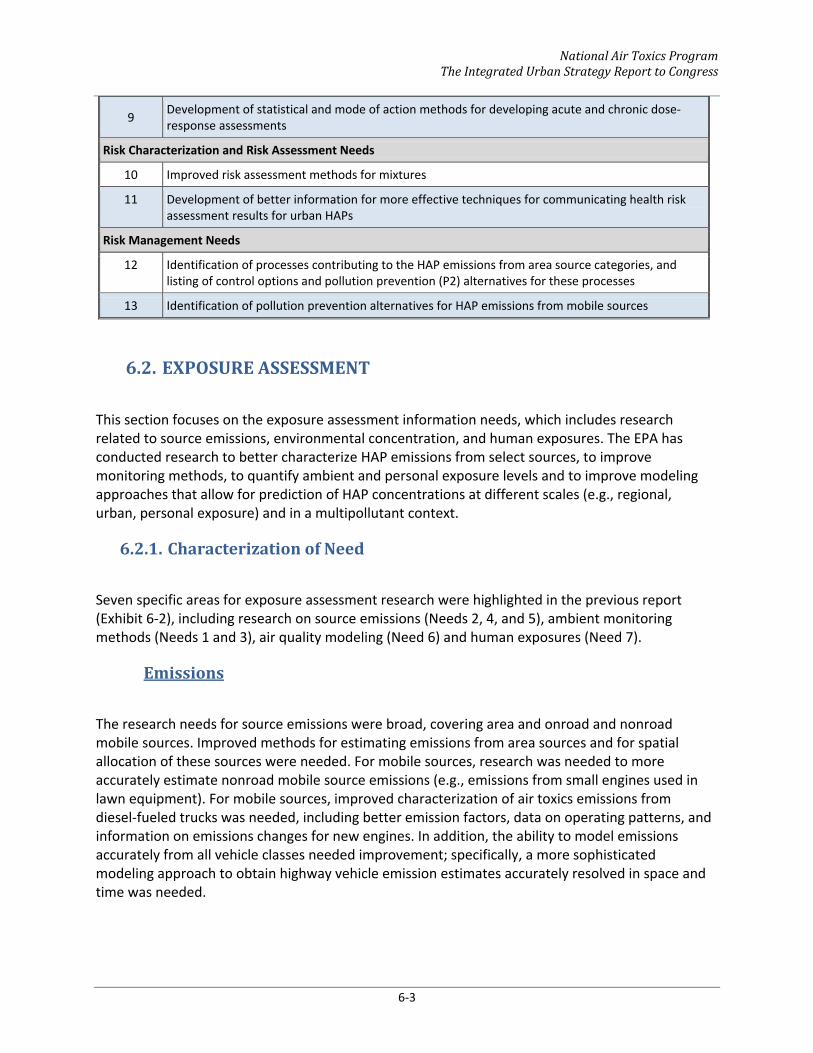
NationalAirToxicsProgramTheIntegratedUrbanStrategyReporttoCongress
6‐3
9 Development of statistical and mode of action methods for developing acute and chronic dose‐response assessments
Risk Characterization and Risk Assessment Needs
10 Improved risk assessment methods for mixtures
11 Development of better information for more effective techniques for communicating health risk assessment results for urban HAPs
Risk Management Needs
12 Identification of processes contributing to the HAP emissions from area source categories, and listing of control options and pollution prevention (P2) alternatives for these processes
13 Identification of pollution prevention alternatives for HAP emissions from mobile sources
6.2. EXPOSUREASSESSMENT
This section focuses on the exposure assessment information needs, which includes research related to source emissions, environmental concentration, and human exposures. The EPA has conducted research to better characterize HAP emissions from select sources, to improve monitoring methods, to quantify ambient and personal exposure levels and to improve modeling approaches that allow for prediction of HAP concentrations at different scales (e.g., regional, urban, personal exposure) and in a multipollutant context.
6.2.1. CharacterizationofNeed
Seven specific areas for exposure assessment research were highlighted in the previous report (Exhibit 6‐2), including research on source emissions (Needs 2, 4, and 5), ambient monitoring methods (Needs 1 and 3), air quality modeling (Need 6) and human exposures (Need 7).
Emissions
The research needs for source emissions were broad, covering area and onroad and nonroad mobile sources. Improved methods for estimating emissions from area sources and for spatial allocation of these sources were needed. For mobile sources, research was needed to more accurately estimate nonroad mobile source emissions (e.g., emissions from small engines used in lawn equipment). For mobile sources, improved characterization of air toxics emissions from diesel‐fueled trucks was needed, including better emission factors, data on operating patterns, and information on emissions changes for new engines. In addition, the ability to model emissions accurately from all vehicle classes needed improvement; specifically, a more sophisticated modeling approach to obtain highway vehicle emission estimates accurately resolved in space and time was needed.

NationalAirToxicsProgramTheIntegratedUrbanStrategyReporttoCongress
6‐4
AmbientMonitoringMethods
Improved monitoring methods for characterizing environmental concentrations were also identified as an area for further research. Improvements to current ambient monitoring methods were needed to lower detection limits, for example, and to develop new methods for certain HAPs and evaluate and refine new methods for use in a national monitoring network. The need for methods of characterizing individual HAP species (e.g., VOCs, mercury), particularly at the source category emissions level, was also identified.
AirQualityModeling
Improved source‐based air quality models were needed to predict better the relationship between source emissions and ambient air concentrations for air toxics. Information on the chemical and physical properties of HAPs under typical atmospheric conditions was needed to improve model predictions of the fate and transport of urban HAPs. In addition, air dispersion modeling tailored specifically to the local urban environment was needed.
HumanExposure
Several research needs related to human exposure to HAPs were identified, specifically for modeling of human exposures and the measurement data needed to improve and evaluate the models. For human exposure modeling, research needs included refinement in the spatial scale to estimate population distributions of exposures in an urban environment, development of models capable of providing probabilistic estimates of the number of persons exposed to different concentrations of HAPs, and development of models and data that consider key human exposure microenvironments. Regarding human exposure measurement data, research needs included studies of exposure concentrations and activity patterns to support model evaluations for urban HAPs. For example, studies of indoor air exposures to better understand indoor/outdoor ratios of urban HAPs and movement of HAPs between indoors and outdoors. Personal monitoring and development of biological markers of exposure to characterize personal exposure were also identified as research needs.
6.2.2. ProgressThusFar
Substantial progress has been made to address these exposure assessment research needs. The following provides an overview of the major research activities that have contributed to improving the understanding of source emissions, environmental concentrations, and human exposures for urban HAPs. Further details for specific studies are provided in Appendix C as noted.
Emissions
The EPA has made progress towards improving methods for estimating area source emissions,
NationalAirToxicsProgramTheIntegratedUrbanStrategyReporttoCongress
6‐5
including spatial allocation methods. The EPA has also made progress towards improving the NEI and the 2008 inventory that was released in April 2012 (U.S. EPA, 2008b).
Mobile sources account for a significant proportion of HAP emissions in the NEI, and include both onroad and nonroad sources. In the 1999 NEI, the nonroad small engine source sector was the second largest contributor to mobile source gaseous HAP and VOC emissions behind light duty vehicles. The EPA researchers investigated the relative contribution of small nonroad engines in the NEI. The EPA conducted limited testing to better characterize air toxic emissions from small nonroad spark ignition engines from equipment such as lawn mowers, chain saws, leaf blowers and string trimmers to better understand the relative contribution of small nonroad engines (Baldauf et al., 2006; Volckens et al., 2007, 2008). This research provided the highest quality data the EPA had on HAP emissions from small spark ignition engines.
Recently, the EPA released the MOVES model, a state‐of‐the‐art tool for estimating emissions from highway vehicles.82 The model is based on analysis of millions of emission test results and considerable advances in the agency’s understanding of vehicle emissions. The more detailed approach to modeling allows the EPA to incorporate large amounts of in‐use data from a wide variety of sources, such as data from vehicle inspection and maintenance (I/M) programs, remote sensing device (RSD) testing, certification testing, and portable emission measurement systems (PEMS). This approach also allows users to incorporate a variety of activity data to better estimate emission differences such as those resulting from changes to vehicle speed and acceleration patterns. Also in support of MOVES development, the agency conducted a landmark study of PM emissions, testing nearly 500 in‐use gasoline‐fueled light‐duty cars and trucks in Kansas City, Missouri. The Kansas City Light‐Duty Vehicle Emissions Study—a collaborative effort, including the EPA, the U.S. Department of Transportation (DOT), the U.S. Department of Energy (DOE) and the automotive and petroleum industries—confirmed that PM emissions from light‐duty gasoline‐fueled vehicles are higher than earlier predicted and clearly showed that cold ambient temperatures can dramatically increase PM emissions at engine start‐up (Fulper et al., 2010; Nam et al., 2010). The EPA has also tested vehicles with new technologies to investigate how different factors such as fuel type, temperature and operating activities affect emissions (e.g., Baldauf et al., 2005). The EPA’s understanding of emissions from heavy‐duty vehicles has also continued to improve. The EPA has been able to analyze data on more than 400 in‐use trucks, some in the laboratory and some with onroad measurement equipment. This allowed the agency to understand how real trucks pollute at a range of speeds and driving conditions. The EPA also has been able to better incorporate emissions from heavy‐duty diesel crankcase ventilation and from extended idling, two emission processes that were relatively unstudied previously.
AmbientMonitoringMethods
The EPA has made progress in advancing monitoring methods for air toxics. As part of a research program on fugitive emissions, the EPA has investigated different fence‐line monitoring approaches that included both time‐resolved and time‐integrated measurement methods. Deployment of time‐integrated passive diffusive samplers with subsequent laboratory analysis
82http://www.epa.gov/otaq/models/moves/index.htm.

NationalAirToxicsProgramTheIntegratedUrbanStrategyReporttoCongress
6‐6
might be a promising and cost‐effective fence‐line monitoring approach for long‐term assessments or screening applications. For example, the EPA conducted a year‐long field study to quantify fence‐line benzene concentrations at a refinery in Corpus Christi, Texas, that demonstrated the utility of using passive diffusive samplers (Thoma et al., 2011). The EPA has also conducted a number of studies investigating air toxic emissions and concentrations near large roadways that have utilized an innovative combination of monitoring techniques, including stationary passive, continuous and integrated monitoring together along with mobile monitoring. The EPA developed mobile monitoring capabilities to characterize the spatial variability of air pollutants using a zero‐emissions electric vehicle equipped with air monitoring instruments and high‐resolution global positioning system (GPS).83 Mobile monitoring is a powerful and cost‐effective method to study the impact of sources on concentrations in the surrounding area. Using fast‐response air monitoring instruments while driving, the vehicle can rapidly collect location‐resolved air pollutant measurements and produce high‐resolution maps of concentrations. This type of measurement strategy can be used to quantify spatial variability of air toxics near an emission source, assess potential mitigation opportunities and identify uncontrolled emission points.
New methodologies for identification and speciation of important HAPs and their combustion and transformation products have also been a focus of EPA research. The EPA has conducted research on methods for characterizing individual VOC and mercury species for both ambient concentrations and source emissions. The EPA has developed novel methods for measuring trace levels of semivolatile organic compounds (SVOCs) in particulate matter (e.g., PAH and POM). These methods have been used to improve our understanding about changes in the composition of particulate matter emitted from biomass burning and anthropogenic combustion sources, including aircraft, light‐ and heavy‐duty vehicles and stationary energy sources such as residential and large‐scale commercial and industrial boiler systems (Hays et al., 2003, 2008, 2011; Kinsey et al., 2010, 2011). These methods have also been used to determine PAH SVOC concentrations in airborne particulate matter. Further, the FAA and the EPA have collaboratively developed best practices for quantifying speciated organic gas emissions from certain aircraft engines (U.S. FAA and U.S. EPA, 2009).
The EPA is also completing a study in Cleveland, Ohio, to investigate the relative contributions of local and regional mercury sources using advanced monitoring methods that measure mercury species in air, precipitation chemistry and direct dry deposition across multiple sites. This study is evaluating passive air sampling and surrogate surface methods for their ability to help understand the spatial distribution of mercury. This comprehensive approach to characterizing mercury deposition in northeast Ohio, using novel measurement methods, will be used to quantify wet and dry deposition of mercury.84
AirQualityModeling
The EPA has conducted research on source‐based air quality models that has led to an improved understanding of the relationship between source emissions and ambient concentrations for HAPs. In 2004, the EPA released an updated version of the Community Multi‐Scale Air Quality (CMAQ) model, which was the first fully‐integrated air quality model to account for the wide range of
83http://www.epa.gov/nrmrl/appcd/nearroadway/pdfs/GMAPv3_2.pdf. 84http://www.epa.gov/research/ca/pdf/ca‐factsheet‐cmaps.pdf.
NationalAirToxicsProgramTheIntegratedUrbanStrategyReporttoCongress
6‐7
complex chemical and physical processes that affect concentrations of air toxics across the entire United States.85 The model predicts concentrations of several gas and particulate toxic compounds emitted into the atmosphere such as VOCs and toxic metals, including predictions for the fate and transport of atmospheric mercury (Bash, 2010). CMAQ also simulates the formation of air toxics from atmospheric chemistry and their effects on ozone production in addition to the photochemical decay, atmospheric transport and removal of air toxics (Hutzell and Luecken, 2008, Luecken et al., 2006). The EPA now uses CMAQ as its multipollutant modeling platform to evaluate the integrated benefits and effectiveness of numerous proposed and final control programs (e.g., Renewable Fuel Standards (RFS) rules, see Cook et al., 2011).
A focus of recent EPA research has also been on the combined use of regional‐scale air quality models such as CMAQ with local‐scale dispersion models such as the American Meteorological Society (AMS) and U.S. EPA Regulatory Model (AERMOD; Cimorelli et al., 2005) to improve the prediction of spatial and temporal concentration gradients associated with large urban point sources and near roadways (e.g., Isakov et al., 2009; Wesson et al., 2010). Appendix C includes more information on two studies that incorporated this approach, the Detroit Multipollutant Pilot Project and the New Haven Air Accountability Feasibility Study. These studies also advanced the use of roadway link data in the mobile source emissions modeling to improve air quality models predictions at the urban scale.
HumanExposure
Through research efforts on modeling human exposure to air pollutants and the measurement data needed to improve and evaluate the models, the EPA has advanced the understanding of human exposures to selected HAPs.
HumanExposureModeling
The EPA has developed probabilistic human exposure models for predicting the population distribution of air pollutant inhalation exposures.86 The Hazardous Air Pollutant Exposure Model (HAPEM) has been developed specifically for the national‐scale screening level assessments conducted as part of NATA, while the Air Pollutant Exposure (APEX) model was developed for population exposure and risk characterization for NAAQS pollutants at the urban‐scale, and has the flexibility to be applied for multiple air pollutants, including HAPs. In addition, the EPA has developed the Stochastic Human Exposure and Dose Simulation (SHEDS) model as part of its human exposure research program. These models simulate the movement of individuals through time and space and estimate their exposure in various microenvironments (e.g., outdoors, indoors at home, in a vehicle) based on the ambient air concentration data used as input to the model. Data on indoor/outdoor concentration relationships, population demographics and human activity patterns are also used as input. The models estimate an expected range of inhalation exposure concentrations for the simulated individuals. Recent exposure modeling research has led to improved spatial resolution within urban areas to better characterize impacts of local sources on
85http://www.epa.gov/AMD/CMAQ/release45.html. 86www.epa.gov/ttn/fera.

NationalAirToxicsProgramTheIntegratedUrbanStrategyReporttoCongress
6‐8
exposures to multiple air pollutants, such as for the Air Accountability Study in New Haven, Connecticut, described in Appendix C. In addition, researchers are evaluating socioeconomic and racial differences in exposure to traffic‐related air pollution across the U.S. using a geographic information system (GIS)‐based approach.
The EPA’s human exposure modeling research has also developed databases needed for human exposure modeling, including demographic and commuting databases based on U.S. Census data, distributions of exposure factors such as residential air exchange rates that depend on housing characteristics and daily temperature ranges, and a database of human activity patterns called the Consolidated Human Activity Database87 (CHAD; Glen et al., 2008; Graham and McCurdy, 2004; Isaacs et al., 2007; McCurdy and Graham, 2003). These databases are used by all of the EPA’s probabilistic human exposure models, whether for screening level assessments such as in NATA or for urban‐scale multipollutant assessments using APEX or SHEDS, and need to be continually updated as new information becomes available.
HumanExposureMeasurements
Human exposure measurement studies have also been conducted to provide a better understanding of relationships between outdoor concentrations, indoor concentrations and personal exposures for urban HAPs and human activity patterns to support exposure model evaluations. Appendix C includes more information on these studies. One study conducted by the EPA was the Detroit Exposure and Aerosol Research Study (DEARS).88 DEARS was designed to determine the spatial and temporal variability of air pollutants across the urban area and the ability of central site (ambient) monitors to act as an appropriate surrogate for human health risk assessments. The 3‐year field monitoring campaign (2004‐2007) included personal, residential indoor, residential outdoor and ambient‐based exposure monitoring for a variety of air toxics, including select VOCs, SVOCs and carbonyls (Williams et al., 2009). The exposure data collected during the DEARS and other human exposure studies conducted by the EPA have provided many benefits to air toxics exposure research as summarized in Appendix C. A few highlights include that passive VOC monitors were proven to be an effective means of exposure data collection, community‐based VOC concentrations often had pronounced day‐to‐day variability and were primary drivers of exposures outdoors in residential neighborhoods, and personal exposures for many VOCs were often higher than concentrations measured outdoors indicating the residential indoor environment can be a major source of human exposures to these air toxics (George et al., 2011; Johnson et al., 2010; McClenny et al., 2005).
In January 2003, the Health Effects Institute (HEI)89 issued a Request for Applications (RFA 03‐1) titled, “Assessing Exposure to Air Toxics” that sought studies aimed at identifying and characterizing exposure to elevated ambient concentrations of air toxics from a variety of sources. Five studies, which represent a diversity of possible hot‐spot locations and air toxics, were funded under this RFA and are described in more detail in Appendix C. As an example, the study by Lioy et
87www.epa.gov/chadnet1/. 88www.epa.gov/dears. 89HEI is an independent, nonprofit corporation supported jointly by the EPA and industry. The focus of their research is on the health effects of pollutants from motor vehicles and other sources in the environment.
NationalAirToxicsProgramTheIntegratedUrbanStrategyReporttoCongress
6‐9
al., (2011) compared two low‐income neighborhoods within Camden, New Jersey, hypothesizing that one was a pollution “hot spot.” They examined the impact of local industrial and mobile source pollution on personal exposures and ambient concentrations. For most pollutants, measured personal concentrations were higher than ambient concentrations at fixed monitoring sites, and the two did not generally vary together. As the independent study by the HEI Health Review Committee concluded, this finding highlights the difficulty of relating personal exposure and ambient concentrations measured at a central monitoring site.
The EPA has also focused research efforts on understanding near‐road exposures and health effects, and the role of MSATs was investigated as part of the EPA’s near‐road studies described in further detail in Appendix C. In 2006, the EPA conducted a field study in Raleigh, North Carolina, to assess the impacts of traffic emissions on air quality and particle toxicity near a heavily traveled highway. This study integrated several novel‐monitoring techniques to provide new insights on the impacts of motor vehicle emissions on near‐road air quality and adverse health effects, including real‐time traffic and meteorological monitoring, multipollutant and highly time‐resolved measurements, and multi‐location measurements to identify the spatial zone of influence of motor vehicle‐emitted pollutants. Data from this study revealed a complex mixture of mobile source pollutants elevated near the road that generally increased with increasing traffic activity (Baldauf et al., 2008; Olson et al., 2009; Venkatram et al., 2009). The Raleigh study provided a foundation for subsequent field studies to characterize mobile source air pollutants adjacent to roadways and impacts on neighboring communities. The EPA has collaborated with the U.S. Department of Transportation’s Federal Highway Administration on the National Near‐Roadway MSATs study to understand better the relationship between traffic emissions and air pollution at various distances from roadways.90 Monitoring studies were conducted along a major highway in Las Vegas, Nevada, from 2008–2009 and in Detroit, Michigan, from 2010–2011, and analyses of the data from these studies are currently ongoing.
The EPA has also studied how roadway design and roadside features (e.g., noise barriers, vegetation) affect air pollutant concentrations and human exposures (Baldauf et al., 2008). Also in 2010, the EPA began a study to characterize air quality and exposures for children with persistent asthma who live near major roadways in Detroit, Michigan. The NearRoad Exposures and Effects from Urban Air Pollutants Study (NEXUS) is a collaborative effort between the EPA’s Office of Research and Development and the University of Michigan through an EPA cooperative agreement.91 The NEXUS will utilize an exposure assessment approach that combines observational data of key exposure determinants from the field study with predictive modeling tools to estimate near‐road air quality and exposures. The air quality and exposure modeling results will be used in assessments of respiratory effects by the University of Michigan to investigate the relationships between traffic‐related exposures and observed health effects in the cohort of asthmatic children. Ultimately, results from the EPA’s near‐road studies will provide the scientific knowledge and understanding needed to identify the most effective strategies and tools to reduce exposure to air pollution from major roads and protect people who live, work or go to school nearby.
90http://www.fhwa.dot.gov/environment/air_quality/air_toxics/research_and_analysis/near_road_study/. 91http://www.epa.gov/nerl/documents/NearRoadwayTechnical_external_fact_sheet_071910.pdf.

NationalAirToxicsProgramTheIntegratedUrbanStrategyReporttoCongress
6‐10
6.3. HEALTHEFFECTS–HAZARDIDENTIFICATIONANDDOSE‐RESPONSEASSESSMENT
6.3.1. CharacterizationofNeed
Estimates of risk from exposure to urban HAPs hold some degree of uncertainty because, depending on the HAPs at issue, we may have insufficient data on various types of health effects, modes of action, and chemical interactions, among other factors. In the first report to Congress, the EPA identified several hazard identification and dose‐response assessment needs to improve our understanding of health effects (i.e., cancer and acute and chronic noncancer hazard identification and dose‐response assessment) and to develop risk assessment approaches for combining data, producing statistical likelihoods of risk from HAPs exposure and reducing uncertainty through better extrapolation models (e.g., animal to human, acute to chronic, high dose to low dose).
6.3.2. ProgressThusFar
Significant work has been done to further our understanding of cancer and noncancer health effects and to develop new analytical approaches to reduce the overall level of uncertainty in risk assessments/characterization. In addition to the research and assessments described below, EPA has developed or updated several guidance documents to improve the assessment of hazard identification and dose‐response relationships. For example, Guidelines for Carcinogen Risk Assessment (U.S. EPA, 2005a), Supplemental Guidance for Assessing Susceptibility from Early‐Life Exposure to Carcinogens (U.S. EPA, 2005b), and Policy and Procedures for Conducting IRIS Peer Reviews (U.S. EPA, 2009) have all been released since the previous report.
Since 2000, the EPA has completed or updated hazard identifications and dose‐response assessments for several of the 33 urban HAPs through the IRIS Program.92 As of December 2011, 19 of the 33 urban HAPs have undergone IRIS assessment, with 12 of these assessments completed since 2000. Currently, 12 urban HAPs are undergoing assessment in the IRIS program. Refer to Appendix D for more information.
In addition to IRIS assessments, EPA has conducted many studies over the last several years to improve our understanding of the health effects of various HAPs. The EPA has completed several studies of the acute and chronic toxicity of VOCs, many of which are urban HAPs. For this work, EPA scientists developed methods and models to generate data and to use existing health effects data quantitatively to understand the acute effects, dose‐response relationships, mechanisms and implications of acute VOC exposure in the human population. Experimental studies involved tissue culture models and experimental rodent models to determine cellular targets, effects and dose‐
92The EPA's IRIS is a human health assessment program that evaluates risk information on effects that may result from exposure to environmental contaminants. Through the IRIS program, the EPA provides the highest quality science‐based human health assessments to support the agency’s regulatory activities. The IRIS database contains information for more than 550 chemical substances containing information on human health effects that may result from exposure to various substances in the environment. Accessed at: http://www.epa.gov/IRIS/.

NationalAirToxicsProgramTheIntegratedUrbanStrategyReporttoCongress
6‐11
response relationships of VOCs. Computational pharmacokinetic models were employed to relate inhaled exposures to target tissue doses and to improve cross‐species extrapolation of dose from rodents to humans. Meta‐analytic methods were developed to use existing human data to relate the experimental results from rodent models to human exposures, and to estimate the potential cost of VOC exposure to public health. Effects of both acute and chronic exposures were addressed. Studies of volatile HAPs and a HAPs metal (i.e., manganese) are discussed in more detail below.
StudiesoftheAcuteEffectsofVOCs
Dose‐response relationships in rodents and in humans were investigated for several VOCs, including toluene, trichloroethylene, perchloroethylene and 2,2,4‐trimethylpentane (iso‐octane). Key findings from this work are:
The primary acute effects of VOCs are mediated by the central nervous system (CNS) and are reversible after exposure ceases (Bushnell et al., 2005);
The critical measure of dose for acute effects is the concentration of the VOC in the brain at the time the effect is measured (Boyes et al., 2005; Bushnell et al., 2007b);
The concentration of the VOC in any target tissue can be accurately estimated using physiologically based pharmacokinetic (PBPK) models under a wide variety of exposure scenarios (Benignus et al., 2006; Kenyon et al., 2008);
When dose is based on concentration in the brain, humans and rats do not differ in their sensitivity to VOCs (Benignus, 2001; Benignus et al., 2007);
The test method affects the apparent potency of the VOC (higher concentrations are needed to disrupt highly‐motivated behavior) (Benignus et al., 2009b); and
When dose is based on the estimated number of molecules in the brain, VOCs do not differ in their efficacy (strength of effect) or in their potency (the amount of the VOC necessary to cause the effect) (Benignus et al., 2009b).
Mechanistic studies to identify cellular targets of VOCs in the brain revealed clear dose‐response relationships for interactions with neuronal ion channels (Bale et al., 2002, 2005, 2007; Bushnell et al., 2007a). These results are consistent with published literature with VOCs and with ethanol. In addition to sharing neuronal targets, VOCs and ethanol produce a similar suite of acute effects, including slowing of reaction time (Benignus et al., 2005b). The public health costs of exposure to VOCs could be estimated by comparing the effects to those caused by ethanol intoxication, such as car crashes (Benignus et al., 2005b; Bushnell et al., 2007a). This analysis estimated that the cumulated 30‐year increase in the incidence of fatal single‐car crashes caused by the behavioral impairments from acute inhalation of toluene at concentrations below the EPA’s RfC for toluene were equivalent in magnitude to the cumulative 30‐year increase in mortality from benzene‐induced leukemia (Benignus et al., 2011).
This surprising observation suggests that acute effects of inhaled VOCs should be considered in risk assessments, because their cumulative effect on public health is similar to the well‐established

NationalAirToxicsProgramTheIntegratedUrbanStrategyReporttoCongress
6‐12
long‐term effect of exposure to a carcinogen. Further work in the Office of Research and Development examined the role of tolerance as a factor that could reduce the impact of acute VOC exposure. Tolerance is a process by which the effect of a chemical on an animal or human is reduced with prolonged or repeated exposure. Studies in rats showed that prolonged exposure to airborne toluene (6 to 24 hour) both limited the concentration of toluene reaching the brain and reduced its behavioral effects (Oshiro et al., 2011), but this “acute tolerance” did not appreciably increase the amount of inhaled toluene estimated to elevate the risk of a fatal car crash. On the other hand, repeated exposure to ethanol and VOCs under conditions involving behavioral practice during exposure can greatly reduce the effect of the VOC on behavior (Bushnell and Oshiro, 2000; Oshiro et al., 2001, 2007).
StudiesoftheEffectsofRepeatedExposuretoVOCs
Whereas the acute effects of VOCs are robust and readily replicable, persistent effects of repeated exposure are less consistent and typically of smaller magnitude. Nevertheless, published literature suggests that public health could be impacted by chronic exposure to concentrations in the range of occupational settings, and meta‐analyses of these studies by the EPA scientists confirmed some of these suggestions (Benignus et al., 2005a, 2009a; Boyes et al., 2007; Bushnell et al., 2007a). The EPA scientists therefore conducted animal studies to develop experimental models of the persistent effects of repeated exposure to toluene, a high‐production‐volume VOC that others have shown to affect behavior and sensory function after repeated exposure. These studies included daily exposures to toluene for 13 weeks (subchronic scenario) (Beasley et al., 2010) or 4 weeks (sub‐acute scenario) (Beasley et al., 2011); they yielded no consistent changes in behavior, but some evidence of reduced visual function was present.
ManganeseExposure
Potential neurotoxicity from airborne manganese exposure has been a community concern for more than a decade, specifically in Region 5 (e.g., Ohio, Michigan). Airborne manganese research has been conducted through the Regional Applied Research Effort (RARE) program.93 In 2009, San Francisco State University received an EPA grant to conduct a neurologic epidemiological health study comparing adults living in Marietta, Ohio, where there is an industrial source of manganese emissions, and Mount Vernon, Ohio, which is nearly identical demographically, but without the industrial activity and manganese emissions. This study focused on the effect of long‐term, low‐level manganese exposures on the general population, which was a data gap in the scientific literature. Initial Marietta‐Mount Vernon comparisons generally indicated a lack of major health effect differences between the two towns. However, despite not finding significant differences between Marietta adults versus Mount Vernon adults for manganese in blood, demographics or major health outcomes, the study showed subtle but statistically significant movement and postural sway deficits in Marietta adults (Kim et al., 2011). The study also found an association between environmental manganese exposure and anxiety states (Bowler et al., 2011). Whether
93RARE is a mechanism used by the EPA’s Regional Science Program to respond to high‐priority, near‐term research needs of the EPA’s regional offices and improve collaboration between regions and EPA headquarters. http://www.epa.gov/osp/regions/rare.htm.
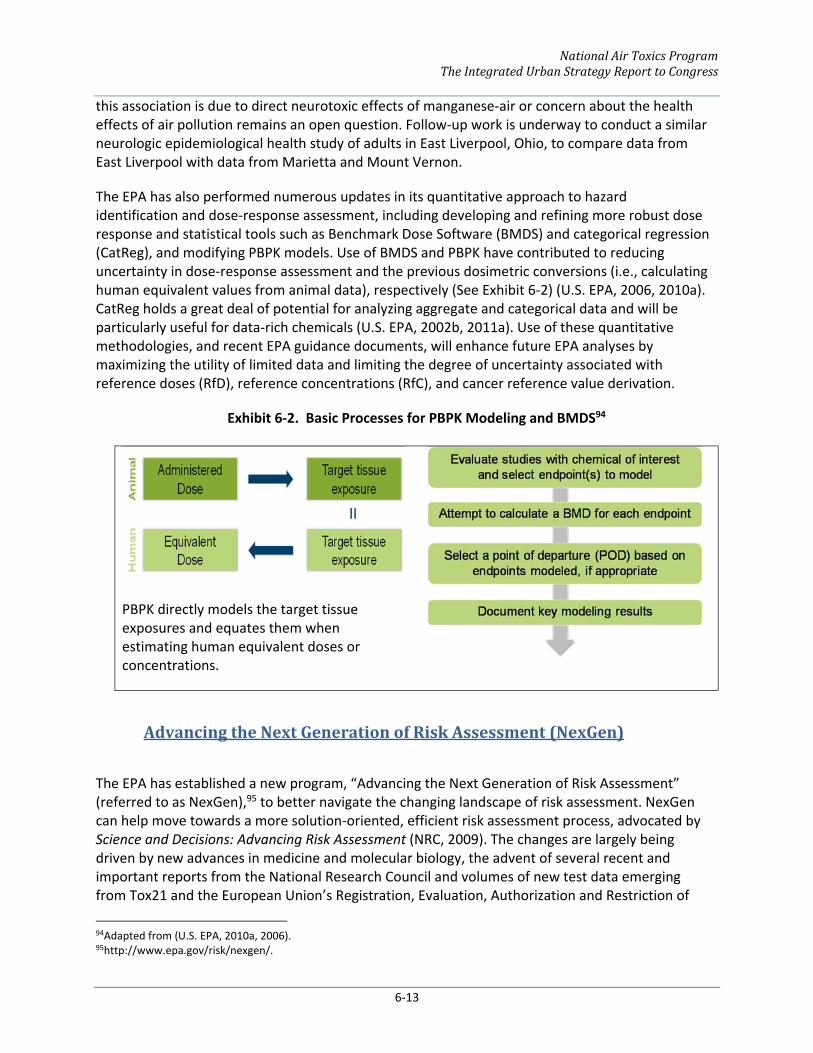
NationalAirToxicsProgramTheIntegratedUrbanStrategyReporttoCongress
6‐13
this association is due to direct neurotoxic effects of manganese‐air or concern about the health effects of air pollution remains an open question. Follow‐up work is underway to conduct a similar neurologic epidemiological health study of adults in East Liverpool, Ohio, to compare data from East Liverpool with data from Marietta and Mount Vernon.
The EPA has also performed numerous updates in its quantitative approach to hazard identification and dose‐response assessment, including developing and refining more robust dose response and statistical tools such as Benchmark Dose Software (BMDS) and categorical regression (CatReg), and modifying PBPK models. Use of BMDS and PBPK have contributed to reducing uncertainty in dose‐response assessment and the previous dosimetric conversions (i.e., calculating human equivalent values from animal data), respectively (See Exhibit 6‐2) (U.S. EPA, 2006, 2010a). CatReg holds a great deal of potential for analyzing aggregate and categorical data and will be particularly useful for data‐rich chemicals (U.S. EPA, 2002b, 2011a). Use of these quantitative methodologies, and recent EPA guidance documents, will enhance future EPA analyses by maximizing the utility of limited data and limiting the degree of uncertainty associated with reference doses (RfD), reference concentrations (RfC), and cancer reference value derivation.
Exhibit 6‐2. Basic Processes for PBPK Modeling and BMDS94
PBPK directly models the target tissue exposures and equates them when estimating human equivalent doses or concentrations.
AdvancingtheNextGenerationofRiskAssessment(NexGen)
The EPA has established a new program, “Advancing the Next Generation of Risk Assessment” (referred to as NexGen),95 to better navigate the changing landscape of risk assessment. NexGen can help move towards a more solution‐oriented, efficient risk assessment process, advocated by Science and Decisions: Advancing Risk Assessment (NRC, 2009). The changes are largely being driven by new advances in medicine and molecular biology, the advent of several recent and important reports from the National Research Council and volumes of new test data emerging from Tox21 and the European Union’s Registration, Evaluation, Authorization and Restriction of
94Adapted from (U.S. EPA, 2010a, 2006). 95http://www.epa.gov/risk/nexgen/.

NationalAirToxicsProgramTheIntegratedUrbanStrategyReporttoCongress
6‐14
Chemicals (REACH) program. NexGen is a collaborative program among: EPA’s Computational Toxicology Program; the National Institute of Environmental Health Sciences’ National Toxicology Program; the Agency for Toxic Substances and Disease Registry; the National Human Genome Research Institute; the U.S. Food and Drug Administration’s National Center for Toxicological Research; and California EPA.
Overall, NexGen aims to create a less expensive, faster and more robust system for health effects research (i.e., hazard identification and dose‐response assessment) by incorporating advances in molecular systems biology. By incorporating emerging molecular systems biology knowledge, the EPA anticipates implementing a new tiered health assessment paradigm aimed at creating hazard identification and dose‐response assessments that are more responsive to the needs of program offices, including the ability to cost effectively and more rapidly assess chemicals.
NexGen is currently using data‐rich case studies to validate new approaches. Two prototype chemicals are HAPs ‐ benzene and PAHs. Through comparison of omic (e.g., genomics, proteomics or metabolomics) and traditional data for these chemicals, the use of omic data in risk assessment is being evaluated. The approaches developed and tested can be applied to chemicals with omic data, but limited or no traditional data. Eventually, this approach could expand and make more robust potential risk analyses for efforts such as the NATA. One aim of the NexGen program is to understand how to utilize the data for 10,000 chemicals currently undergoing high throughput molecular biology‐based testing in the Tox21 program in risk assessment.96
6.4. RISKASSESSMENTANDRISKCHARACTERIZATION
6.4.1. CharacterizationofNeed
The exposure assessment and hazard identification and dose‐response assessments are combined and interpreted in the risk characterization portion of a risk assessment. This section of the first report to Congress focused on the needs to improve risk assessments of chemical mixtures and to communicate risks better. One of the most prominent gaps in the general risk assessment framework for HAPs is the lack of data, models and methods for evaluating risk from chemical mixtures. Multiple HAPs can be emitted from the same sources, and, in real‐world scenarios, humans are exposed to a complex mixture of HAPs. Combined exposures to multiple pollutants might produce synergistic or antagonistic effects. The cumulative impact of multiple emission sources on minority populations and low income populations in urban areas is of particular concern.
6.4.2. ProgressThusFar
The EPA is evaluating mixtures in several cases. Currently, the EPA is in the process of finalizing the development of a Relative Potency Factor (RPF) Approach for Polycyclic Aromatic Hydrocarbon (PAH) Mixtures (External Review Draft) (U.S. EPA, 2010b), which will aid in establishing a scientific basis for the risk assessment of mixtures that could ultimately be applicable to other chemical
96http://www.epa.gov/ncct/Tox21.

NationalAirToxicsProgramTheIntegratedUrbanStrategyReporttoCongress
6‐15
groups, including other HAPs. PAHs are a subset of POM, mentioned above and for which health effects information was identified as a research need in the first report to Congress. The IRIS Program is also developing a human health hazard identification and dose‐response assessment for polychlorinated biphenyls (PCBs) in which quantitative analyses are based on toxicity data from studies of PCB mixtures similar in composition to those found in the environment. This approach is in line with that recommended by the Supplementary Guidance for Conducting Health Risk Assessment of Chemical
Mixtures (U.S. EPA, 2000a). Similarly, the IRIS Program is developing a cumulative health assessment for six phthalates based on the National Research Council (NRC) report “Phthalates and Cumulative Risk: The Tasks Ahead” (NRC, 2008). The approach for this health assessment also could be a model for evaluating other chemical mixtures, including HAPs.
Additionally, in 2003, the EPA developed a Framework for Cumulative Risk Assessment that was the first step in a long‐term effort to develop cumulative risk assessment guidelines, and it fostered consistent approaches to cumulative risk assessment within the EPA (U.S. EPA, 2003b). The report defines cumulative risk as “the combined risks from aggregate exposures to multiple agents or stressors,” which can be chemical or non‐chemical (i.e., physical or biological). Cumulative risk assessment is defined as “an analysis, characterization, and possible quantification of the combined risks to health or the environment from multiple agents or stressors.” Cumulative risk analysis can be applied to environmental justice concerns, where multiple stressors affect highly burdened communities, and help to create risk management strategies. Over the last several years, the EPA has held workshops and supported research related to cumulative risk and environmental justice. For example, in 2007, the EPA held the Workshop on Research Needs for Community‐Based Risk Assessments.97 Since then, the EPA published a request for applications for research on understanding the role of nonchemical stressors and developing analytic methods for cumulative risk assessment98 and organized the Symposium on the Science of Disproportionate Environmental Health Impacts.99 There is still much work needed on cumulative risk assessment.
ScienceandDecisions:AdvancingRiskAssessment
In 2009, the NRC released a final report, requested and sponsored by the EPA, titled, Science and Decisions: Advancing Risk Assessment, also referred to as the “Silver Book” (NRC, 2009). This book complements the widely used 1983 Risk Assessment in the Federal Government: Managing the Process, which illustrated a risk assessment framework widely adopted by numerous agencies and public health institutions (NRC, 1983). Science and Decisions described several challenges in the implementation of the risk assessment framework, most notably, a disconnect between the “products” of the risk assessment and the decisions that need to be made by risk assessors. The report identified scientific and technical recommendations to address these challenges, including an influential recommendation to embed the traditional risk assessment framework within a broader framework for risk‐based decision‐making.
A broader framework for risk‐based decision‐making can be more relevant to the forthcoming risk management decisions. This framework includes a “problem formulation and scoping” phase, at
97http://www.epa.gov/ncer/cbra/workshop.html. 98http://epa.gov/ncer/rfa/2009/2009_star_cumulative_risk.html. 99http://www.epa.gov/compliance/ej/multimedia/albums/epa/disproportionate‐impacts‐symposium.html.
NationalAirToxicsProgramTheIntegratedUrbanStrategyReporttoCongress
6‐16
the beginning, to help risk assessors identify the types of analysis needed and the required level of scientific depth necessary to support decisions and a “confirmation of utility” phase near the end to evaluate whether the risk assessment meets the needs outlined in the planning phase. It also calls for formal stakeholder involvement throughout the process. Ultimately, utilizing a risk‐based decision‐making framework seeks to enhance the value of the risk assessment for the risk manager and improve efficiency in the overall decision‐making process.
The Silver Book also made recommendations related to uncertainty and variability, the selection and use of defaults, developing a unified approach to dose‐response assessment and cumulative risk assessment.
6.5. RISKMANAGEMENT
6.5.1. CharacterizationofNeed
The final stage of the risk assessment paradigm is risk management, or decision‐making based on the risk assessment/characterization. The first report to Congress identified development of risk management tools and information, including engineering information on emissions and emission reductions as needs to support regulatory strategies and compliance programs that are integral to the reduction of HAP emissions and associated reductions in health risk. Specifically, in addition to needs identified in previous sections that are also relevant to risk management, the report identified two primary research needs related to risk management: area source HAP emissions characterization, control options and pollution prevention alternatives and mobile source HAP pollution prevention.
The report acknowledged that many issues are multimedia in nature, or at least that multimedia issues arise with common problems requiring a systems approach. It was recognized that there were opportunities for pollution prevention research to address these crosscutting issues. The report specifically mentioned development of life‐cycle analysis tools, pollution prevention technology, cleaner production design and generic decision‐making tools for reducing risk.
In addition, it focused on transportation system management options as broadly being defined as pollution prevention. Again, this type of risk management might require an interdisciplinary approach and could focus on direct (e.g., use of different fuel formulations for motor vehicles) or indirect (e.g., changes in transportation system infrastructure) emissions reductions.
6.5.2. ProgressThusFar
Of particular interest in risk management under the Strategy is the need to address disproportionate impacts from HAPs in urban areas, or geographic “hot spots.” The EPA has engaged in three important projects in this regard in Cleveland, Ohio; Detroit, Michigan; and Las Vegas, Nevada, all mentioned above in section 6.2. The project in Detroit, for example, was designed to apply and evaluate alternative risk management tools (specifically a multipollutant approach, described in more detail below) for reducing human health and cancer risk associated

NationalAirToxicsProgramTheIntegratedUrbanStrategyReporttoCongress
6‐17
with exposure to PM2.5, ozone and HAPs in a densely populated area (U.S. EPA, 2011b).
Some of the risk assessment research activities mentioned previously in this chapter also support risk management objectives, as do projects the Office of Air and Radiation has implemented. For example, the development of source monitoring measurement methods provides tools for risk management activities—particularly the development of fence‐line monitoring approaches. In addition, the mobile source emissions and multipollutant air quality modeling tools are also valuable tools for informing risk management decisions. As discussed in Chapter Four, the Office of Air and Radiation has implemented several mobile source initiatives that focus on reducing pollution from the transportation sector.
As mentioned in the introduction to this chapter, the Office of Research and Development has focused on a multipollutant framework, which is a useful tool for organizing research to inform integrated and cost‐effective risk management strategies. This approach considers the complex array of contributing sources, atmospheric chemistry and indoor and outdoor exposures, which more adequately characterizes a real‐world scenario for exposure to HAPs. The EPA continues to develop and implement new tools, assessment methodologies and new approaches for assessing progress for specific scenarios.
6.6. RESEARCHFORTHE21STCENTURY
The environmental issues that we face today and will face in the future are more complex and subtle than those we have addressed to date. Therefore, protecting human health and the environment in the 21st century will require research that is innovative, integrated and completed using Transdisciplinary approaches. In addition, identifying the most effective and enduring solutions to these environmental issues will require research that emphasizes and promotes broad systems thinking to ensure sustainability.
The concepts of sustainability and systems thinking are closely related. Sustainability is based on the principle that everything we need for our survival and well‐being depends on our natural environment (Marsh, 1964). Sustainable policies “create and maintain the conditions under which humans and nature can exist in productive harmony and fulfill the social, economic and other requirements of current and future generations” (NEPA, 1969). At the EPA, the concept of sustainability has emerged as a result of significant concerns about the unintended social, environmental and economic consequences of rapid population growth, economic growth and consumption of our natural resources. The EPA is moving from solely controlling pollution to preventing it by considering sustainability and using systems thinking (U.S. EPA, 2011e). “Systems Thinking” is central to the concept of sustainability because it leads to an understanding of how various parts of a whole are related to and influence each other, thereby avoiding unintended environmental, economic or social consequences now and in the future.
The EPA is exploring ways to better incorporate sustainability and related concepts, such as “Systems Thinking,” in its decision‐making process. To support these efforts, the agency requested the NRC to explore the scientific basis for sustainability as a key driver for protection of human health and the environment and to recommend a framework for integrating sustainability into the

NationalAirToxicsProgramTheIntegratedUrbanStrategyReporttoCongress
6‐18
agency’s activities. In the NRC’s report, “Sustainability and the U.S. EPA,” known as the “Green Book,” the NRC developed a sustainability framework and sustainability assessment and management approach to provide guidance to the EPA on incorporating sustainability into decision making. The EPA has discretion in implementing sustainability and is taking steps to incorporate it into the agency’s culture and process of protecting human health and the environment.
Consistent with overall agency efforts, the research programs at the EPA have also been restructured to promote more integrated systems approaches in order to develop sustainable solutions. The remainder of this section summarizes future air toxics research needs in the context of the Office of Research and Development’s new research programs focused on “Systems Thinking” and sustainability.
Air,Climate,andEnergy
Taking action on climate change and improving air quality are agency priorities. To develop innovative and sustainable solutions to improve air quality and address climate change, it is necessary to understand the interplay between air quality, climate change and the changing energy landscape more fully. The EPA’s Air, Climate and Energy (ACE) Research Program100 has been designed to address this challenge by providing research to:
Assess Impacts—Assess human and ecosystem exposures and effects associated with air pollutants and climate change at individual, community, regional and global scales.
Prevent and Reduce Emissions—Provide data and tools to develop and evaluate approaches to prevent and reduce emissions of pollutants to the atmosphere, particularly environmentally sustainable, cost‐effective and innovative multipollutant and sector‐based approaches.
Respond to Changes in Climate and Air Quality—Provide human exposure and environmental modeling, monitoring, metrics and information needed by individuals, communities and governmental agencies to adapt to the impacts of climate change and make public health decisions regarding air quality.
By design, most of the research within the ACE program is not pollutant specific, and thus there are only limited efforts related to specific air toxics. There are, however, several research activities in the ACE program that will include research related air toxics as part of larger integrated efforts. Specific examples of air toxics related research in the ACE program include the following:
Development and evaluation of ambient monitoring methods for key air toxics, such as acrolein.
Development, evaluation and application of measurement methods to characterize emissions of pollutants (including air toxics) from stationary and mobile sources.
100More information on the Air, Climate and Energy Research Program can be found in the Strategic Research Action Plan 2012‐2016 (U.S. EPA, 2012a).

NationalAirToxicsProgramTheIntegratedUrbanStrategyReporttoCongress
6‐19
Studies to characterize emissions, exposures and potential health impacts near sources, such as roadways and ports.
Characterization of emissions, exposures and potential health effects of emerging energy options, including biomass.
Development and evaluation of sensor technologies to enhance the measurement of air toxics in communities and potentially lower the costs of monitoring.
Development, evaluation and application of multipollutant modeling tools, including fine scale modeling tools to characterize air quality concentrations and exposures at local/urban levels.
Development and evaluation of Green Chemistry alternatives for solvents containing air toxics.
SustainableandHealthyCommunities
A top EPA priority is supporting sustainable and healthy communities by protecting human health and well‐being and the ecosystem services or natural benefits upon which they depend, such as clean water and air, including air toxics. Communities are increasingly challenged to find sustainable solutions to urbanization; competition for food, materials and energy; growing waste streams; changing climate; and socioeconomic inequities, among other pressures. The Sustainable and Healthy Communities (SHC) research program was designed after extensive dialogue with community leaders, stakeholders and non‐governmental organizations across the nation to understand better the challenges they face and is consistent with the EPA’s priorities of sustainability and environmental justice. The SHC research program will develop and evaluate methods and tools that can be used to better weigh and integrate human health, socio‐economic and environmental factors into decisions about both built and natural environments.101 Some examples of research activities in the SHC research program related to air toxics include:
Decision Analysis and Support.
Research to Inform and Assess Decisions to Improve Community Public Health, including:
o Identification of prevalent public health conditions and the prioritization of environmental and health‐related factors.
o Development of indicators and indices to identify vulnerable life stages and sub‐populations and their links to community/tribal‐specific environmental and health‐related conditions, to inform decisions, and to assess changes.
o Development of integrated methods, measurements and models and science‐based, user‐friendly, community‐focused decision support tools.
o Community‐based participatory case studies.
101SHC Research factsheet: http://www.epa.gov/ord/priorities/docs/SHC+fact+sheet_+FINAL.pdf.
NationalAirToxicsProgramTheIntegratedUrbanStrategyReporttoCongress
6‐20
Science to Support Environmental Justice.
Integrated approaches to decisions for sustainable outcomes related to:
o Buildings and Infrastructure.
o Land Use Practices.
o Transportation.
o Waste and Materials.
More information on the Sustainable and Healthy Communities Research Program can be found in the Strategic Research Action Plan 2012‐2016 (U.S. EPA, 2012c).
HumanHealthRiskAssessment
Every day, the EPA must make decisions about environmental pollutants that impact human health and the environment. There are currently more than 80,000 chemicals in commerce, and more are introduced each year. Only a small fraction of these chemicals has been adequately assessed for potential risk, often because of limits in existing data, tools and resources. The Human Health Risk Assessment (HHRA) research program helps address this problem by providing state‐of‐the‐science products in support of risk assessment.
The work conducted by the HHRA Research Program responds directly to the needs of the EPA’s program and regional offices and to issues of shared concern among the broader risk assessment and risk management community. The HHRA research program plays a unique role in serving the needs of the EPA’s programs and regions, by identifying, evaluating, synthesizing and integrating scientific information on individual chemicals and chemical mixtures. The state‐of‐the‐science, independently peer‐reviewed hazard identification and dose response assessments prepared by HHRA scientists provide a critical part of the scientific foundation for much of the EPA’s decision‐making (e.g., site specific cleanups, regulations), thereby enabling the EPA to better protect human health and the environment.
The HHRA Research Program is comprised of four complementary and integrated research themes:
IRIS Health Hazard and Dose‐Response Assessments: IRIS assessments and updates and scientific technical support documents are used widely by the EPA’s programs and regions, states, international organizations and the general public as a critical part of their scientific foundation for decision‐making (e.g., site‐specific cleanups, rules, regulations, and health policy).
Integrated Science Assessments (ISAs) of Criteria Air Pollutants: ISAs summarize the state‐of‐the science for the six criteria air pollutants: ozone, particulate matter, sulfur and nitrous oxides, carbon monoxide and lead. Additionally, the Office of Research and Development is working in consultation with other EPA offices to develop a Multipollutant Science Assessment to support the reviews of the primary (health‐based) national ambient air quality standards. This assessment will allow for an evaluation of

NationalAirToxicsProgramTheIntegratedUrbanStrategyReporttoCongress
6‐21
the combined health effects of exposures to mixtures of air pollutants, and a more effective evaluation of health effects of exposures to single pollutants in a multipollutant context, than what is currently provided using single pollutant ISAs.
Community Risk and Technical Support (CRTS) for Exposure and Health Assessments: This support includes quick turn‐around exposure and risk assessments, crisis‐level technical support, the development of Provisional Peer Reviewed Toxicity Values (PPRTVs) and tools and guidance for exposure assessments and methods to conduct cumulative impact assessments, all of which enhance the ability of the EPA regional offices to quickly make sound, risk‐based decisions regarding emerging issues.
Modernizing Risk Assessment Methods: Key elements of work under this theme include designing and implementing tools to make developing hazard identification and dose‐response assessments more efficient; providing support and training for risk assessment through the Health and Environmental Research Online (HERO) database and the Risk Assessment Training and Experience (RATE) program; and developing innovative approaches to link information to users’ needs in a more effective fashion. For example, translation and practical application of the research in molecular biology and computational science developed throughout the Office of Research and Development and from peer‐reviewed sources into practical applications for hazard identification and dose‐response assessments increases the efficiency and effectiveness of the EPA risk assessments.
More information on the HHRA Research Program can be found in the Strategic Research Action Plan 2012‐2016 (U.S. EPA, 2012b).

NationalAirToxicsProgramTheIntegratedUrbanStrategyReporttoCongress
7‐1
Chapter7: ConclusionsandLookingAhead
Overall, air toxic emissions have significantly declined since 1990. Reductions of air toxic emissions have been achieved through the EPA’s standards, state, tribal and local programs, community grants and other initiatives to address the most important sources of air toxic risks in urban areas. We have shown that, since 1990, over 1.5 million tons of air toxics have been removed from the air on an annual basis through air toxic standards for stationary sources. In addition, mobile source emissions have been reduced by 50 percent since 1990, and will continue to decrease as the fleet turns over; by 2030, mobile source emissions will be approximately 80 percent lower than 1990 levels, reflecting both absolute reductions in emissions relative to 1990 levels and offsets in emissions increases due to economic and population growth.
On March 21, 2011, the EPA completed its requirement under the Clean Air Act to assure that area sources accounting for 90 percent of the aggregate area source emissions of each of the 30 urban HAPs are subject to regulation. Simultaneously, the EPA issued a notice that the Agency had completed its requirement under the Clean Air Act to assure that sources accounting for not less than 90 percent of the aggregate emissions of each of the seven HAP enumerated under Section 112(c) (6) are subject to standards.102
While there have been substantial progress and efforts in each of these areas, resulting in lower emissions and less exposure to these chemicals in communities across the country, significant risks from air toxics remain. The EPA understands the importance of promptly addressing air toxics emissions that pose the greatest risk to public health. The EPA recognizes the importance of risk reductions that can be achieved by voluntary initiatives as well as regulatory programs and the value of informing the public about air toxics risks in a more effective and timely manner. We would be remiss in this report if we did not identify these issues so that the public conversation can engage on the future of air toxics efforts. Areas where continued effort is needed include: Cumulative impacts research ‐ more work is needed to determine the impacts of
simultaneous exposure to multiple pollutants.
Improved emissions data ‐ the current systems for reporting emissions of air toxics do not provide a comprehensive picture.
Ambient data in more areas and of more pollutants ‐ air toxics emissions and public
exposure are highly localized. Improved monitoring data would make it easier to identify these areas and develop strategies that improve public health.
102Topham to Docket, Emission Standards for Meeting the 90 Percent Requirement Under Section 112(c)(6) of the Clean Air
Act (found in Docket ID EPA–HQ–OAR–2004–0505).

NationalAirToxicsProgramTheIntegratedUrbanStrategyReporttoCongress
7‐2
New monitoring technologies that are less costly and can provide information that is more
transparent and accessible to communities and businesses ‐ these new technologies can play an important role in identifying air toxic hot spots.
Better integration of air toxics, pollution prevention and voluntary programs in regulatory and non‐regulatory efforts ‐ voluntary programs that target specific air toxic issues unique to a particular area could complement national and state regulatory efforts.
Regulatory tools ‐ our national regulatory efforts should be directed at the source categories where there are emissions that pose significant risk.
A strong integration of national, state, tribal and community resources and efforts is essential if we are to continue to make progress in our efforts to reduce threats to public health from air toxics. The EPA hopes that this report will provide an opportunity for a renewed and expanded discussion of the most effective ways to protect public health through the reduction of air toxic emissions and to encourage the implementation of high priority, cost‐effective efforts.

NationalAirToxicsProgramTheIntegratedUrbanStrategyReporttoCongress
A‐1
AppendixA.Standard‐SettingActivities
A.1.SOURCECATEGORIESSUBJECTTOSTANDARDSUNDERSECTIONS112AND129
The cumulative projected reductions presented in Chapter Three, section 3.2 were calculated summing the estimates of emission reductions developed during each individual rulemaking listed in Exhibit A‐1. This table includes final rule Federal Register citations, through May 2012, where the projected annual emission reductions associated with each final rule can be found. The projected emission reductions are included in the preamble for each rule, usually in the section titled, "Impacts of the Final Rule" or "Summary of Environmental, Energy, Cost, and Economic Impacts." The projected reductions begin in the year during which the rule is fully implemented. Several source categories are marked with an asterisk (*) which denotes that the reductions associated with the rule have not yet been realized because the compliance date has not yet arrived.
Exhibit A‐1. Source Categories Subject to Standards
NESHAP NAME FR CITATION
MAJOR SOURCE STANDARDS
Aerospace Manufacturing and Rework Facilities 60 FR 45948
Asphalt Processing and Asphalt Roofing Manufacturing 68 FR 24561
Surface Coating of Automobiles and Light Duty Trucks 69 FR 22602
Benzene Waste Operations 55 FR 8298
Boat Manufacturing 66 FR 44218
Brick and Structural Clay Products and Clay Ceramics 68 FR 22690
Cellulose Products Manufacturing 67 FR 40044
Chromium Emissions from Hard and Decorative Chromium Electroplating and Chromium Anodizing Tanks (Major and Area) 60 FR 4948
Coal‐ and Oil‐fired Electric Utility Steam Generating Units and Standards of Performance for Fossil‐Fuel‐Fired Electric Utility, Industrial‐Commercial‐Institutional, and Small Industrial‐Commercial‐Institutional Steam Generating Units* 77 FR 9303
Coke Ovens: Pushing, Quenching, and Battery Stacks 68 FR 18008
Coke Ovens: Charging, Top Side, and Door Leaks 58 FR 57898
Chemical Recovery Combustion Sources at Kraft, Soda, Sulfite, and Stand‐Alone Semichemical Pulp Mills 66 FR 3180
Ethylene Oxide Commercial Sterilization and Fumigation Operations 59 FR 62585
Halogenated Solvent Cleaners 59 FR 61801
Dry Cleaning Facilities (Major and Area) 58 FR 49354
Electric Arc Furnace Steelmaking Facilities 72 FR 74088

NationalAirToxicsProgramTheIntegratedUrbanStrategyReporttoCongress
A‐2
NESHAP NAME FR CITATION
Engine Test Cells/Stands 68 FR 28744
Printing, Coating, and Dyeing of Fabrics and Other Textiles 68 FR 32172
Ferroalloys Production: Ferromanganese and Silicomanganese 64 FR 24750
Flexible Polyurethane Foam Fabrication Operations 68 FR 18062
Flexible Polyurethane Foam Production 63 FR 53980
Friction Materials Manufacturing Facilities 67 FR 64498
Gasoline Distribution (Stage 1) 59 FR 64303
Generic MACT 64 FR 64854
Hazardous Waste Combustors 70 FR 59402
Hazardous Organic NESHAP (HON) 59 FR 19402
Hydrochloric Acid Production 68 FR 19076
Industrial Cooling Towers 59 FR 46339
Integrated Iron and Steel 68 FR 27646
Industrial, Commercial & Institutional Boilers & Process Heaters (Major and Area)* 76 FR 28662
Iron and Steel Foundries 69 FR 21905
Surface Coating of Large Appliances 67 FR 48254
Leather Finishing Operations 67 FR 9156
Lime Manufacturing 69 FR 394
Magnetic Tape Manufacturing Operations 59 FR 64596
Manufacturing of Nutritional Yeast 66 FR 27876
Marine Tank Vessel Loading Operations 60 FR 48388
Mercury Emissions from Mercury Cell Chlor‐Alkali Plants 68 FR 70904
Surface Coating of Metal Cans 68 FR 34431
Surface Coating of Metal Coil 67 FR 39794
Surface Coating of Metal Furniture 68 FR 28606
Mineral Wool Production 69 FR 29489
Miscellaneous Coating Manufacturing 68 FR 69164
Surface Coating of Miscellaneous Metal Parts and Products 69 FR 130
Miscellaneous Organic Chemical Manufacturing 68 FR 63852
Municipal Solid Waste Landfills 66 FR 2227
Oil and Natural Gas Production and Natural Gas Transmission and Storage 64 FR 32610
Offsite Waste and Recovery Operations 61 FR 34140
Organic Liquids Distribution (Non‐Gasoline) 69 FR 5038
Paper and Other Web Coating 67 FR 72330
Pesticide Active Ingredient Production 64 FR 33550
Petroleum Refineries 60 FR 43244
Petroleum Refineries ‐ Catalytic Cracking Units, Catalytic Reforming Units, and Sulfur Recovery Units 67 FR 17762
Pharmaceuticals Production 63 FR 50280

NationalAirToxicsProgramTheIntegratedUrbanStrategyReporttoCongress
A‐3
NESHAP NAME FR CITATION
Phosphoric Acid and Phosphate Fertilizers Production 64 FR 31358
Surface Coating of Plastic Parts and Products 69 FR 20968
Plywood and Composite Wood Products 69 FR 45944
Polyether Polyols Production 64 FR 29419
Polymers and Resins 1 61 FR 46906
Polymers and Resins 2 60 FR 12670
Polymers and Resins 3 65 FR 3275
Polymers and Resins 4 61 FR 48208
Polyvinyl Chloride and Copolymers Production (Major and Area) 77 FR 22848
Portland Cement Manufacturing 75 FR 54970
Primary Aluminum Reduction Plants 62 FR 52384
Primary Copper Smelting 67 FR 40478
Primary Lead Smelting 64 FR 30194
Primary Magnesium Refining 68 FR 58615
Printing and Publishing Industry 61 FR 27132
Publicly Owned Treatment Works 64 FR 57572
Pulp and Paper Cluster MACT I & III 63 FR 18504
Reciprocating Internal Combustion Engines (RICE) 69 FR 33474
Reciprocating Internal Combustion Engines (RICE) 75 FR 9648
Reciprocating Internal Combustion Engines (RICE) 75 FR 51570
Refractory Products Manufacturing 68 FR 18730
Reinforced Plastics Composites Production 68 FR 19375
Rubber Tire Manufacturing 67 FR 45588
Secondary Aluminum Production 65 FR 15690
Secondary Lead Smelters 60 FR 32587
Semiconductor Manufacturing 68 FR 27913
Shipbuilding and Ship Repair (Surface Coating) Operations 60 FR 64330
Site Remediation 68 FR 58172
Solvent Extraction for Vegetable Oil Production 66 FR 19006
Stationary Combustion Turbines 69 FR 10512
Steel Pickling ‐ HCl Process Facilities and Hydrochloric Acid Regeneration Plants 64 FR 33202
Taconite Iron Ore Processing 68 FR 61868
Wet‐Formed Fiberglass Mat Production 67 FR 17824
Surface Coating of Wood Building Products 68 FR 31746
Wood Furniture Manufacturing Operations 60 FR 62930
Wool Fiberglass Manufacturing 64 FR 31695
COMBUSTION SOURCE STANDARDS

NationalAirToxicsProgramTheIntegratedUrbanStrategyReporttoCongress
A‐4
NESHAP NAME FR CITATION
Sewage Sludge Incineration (Section 129 Emission Guidelines and New Source Performance Standards) 76 FR 15372
Hospital/Medical/Infectious Waste Incinerators (Section 129 Emission Guidelines and New Source Performance Standards) 62 FR 48348
Large Municipal Waste Combustors (Section 129 Emission Guidelines and New Source Performance Standards) 60 FR 65387
Other Solid Waste Incinerators (Section 129 Emission Guidelines and New Source Performance Standards) 70 FR 74870
Small Municipal Waste Combustors (Section 129 Emission Guidelines and New Source Performance Standards)
65 FR 76349 76 FR 36377
Commercial and Industrial Solid Waste Incinerators* 65 FR 75338
AREA SOURCE STANDARDS
Oil and Natural Gas Production (Area Sources) 72 FR 26
Primary Copper Smelting 72 FR 2930
Secondary Copper Smelting 72 FR 2930
Primary Non‐Ferrous Metals: Zinc, Cadmium, Beryllium 72 FR 2930
Acrylic and Modacrylic Fibers Production 72 FR 38864
Carbon Black Production 72 FR 38864
Chemical Manufacturing: Chromium Compounds 72 FR 38864
Flexible Polyurethane Foam Production and Fabrication 72 FR 38864
Lead Acid Battery Manufacturing 72 FR 38864
Wood Preserving 72 FR 38864
Glass Manufacturing 72 FR 73180
Clay Ceramics Manufacturing 72 FR 73180
Secondary Non‐Ferrous Metals 72 FR 73180
Hospital Ethylene Oxide Sterilizers 72 FR 73611
Iron and Steel Foundries 73 FR 226
Paint Stripping and Miscellaneous Surface Coating Operations at Area Sources 73 FR 1738
Gasoline Distribution Bulk Terminals, Bulk Plants, and Pipeline Facilities; and Gasoline Dispensing Facilities 73 FR 1916
Reciprocating Internal Combustion Engines (Area Sources) 73 FR 3568
Plating and Polishing Operations 73 FR 37728
Ferroalloys Production Facilities (Area Sources) 73 FR 78637
Aluminum, Copper, and Other Non‐Ferrous Foundries 74 FR 30366
Chemical Manufacturing Area Sources 74 FR 56008
Asphalt Processing and Asphalt Roofing Manufacturing (Area Sources) 74 FR 63236
Paints and Allied Products Manufacturing 74 FR 63504
Chemical Preparations Industry 74 FR 69194
Prepared Feeds Manufacturing 75 FR 522

NationalAirToxicsProgramTheIntegratedUrbanStrategyReporttoCongress
A‐5
NESHAP NAME FR CITATION
Gold Mine Ore and Ore Processing and Production 76 FR 9450
Nine Metal Fabrication and Finishing Source Categories 73 FR 42978
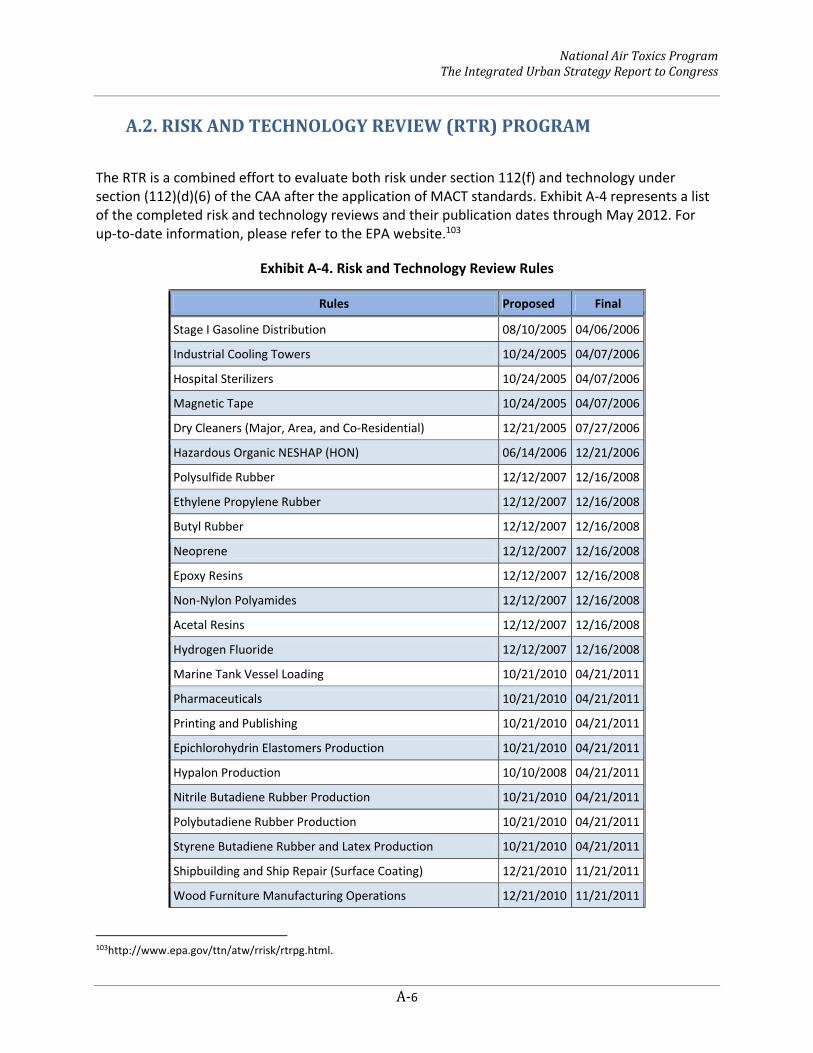
NationalAirToxicsProgramTheIntegratedUrbanStrategyReporttoCongress
A‐6
A.2.RISKANDTECHNOLOGYREVIEW(RTR)PROGRAM
The RTR is a combined effort to evaluate both risk under section 112(f) and technology under section (112)(d)(6) of the CAA after the application of MACT standards. Exhibit A‐4 represents a list of the completed risk and technology reviews and their publication dates through May 2012. For up‐to‐date information, please refer to the EPA website.103
Exhibit A‐4. Risk and Technology Review Rules
Rules Proposed Final
Stage I Gasoline Distribution 08/10/2005 04/06/2006
Industrial Cooling Towers 10/24/2005 04/07/2006
Hospital Sterilizers 10/24/2005 04/07/2006
Magnetic Tape 10/24/2005 04/07/2006
Dry Cleaners (Major, Area, and Co‐Residential) 12/21/2005 07/27/2006
Hazardous Organic NESHAP (HON) 06/14/2006 12/21/2006
Polysulfide Rubber 12/12/2007 12/16/2008
Ethylene Propylene Rubber 12/12/2007 12/16/2008
Butyl Rubber 12/12/2007 12/16/2008
Neoprene 12/12/2007 12/16/2008
Epoxy Resins 12/12/2007 12/16/2008
Non‐Nylon Polyamides 12/12/2007 12/16/2008
Acetal Resins 12/12/2007 12/16/2008
Hydrogen Fluoride 12/12/2007 12/16/2008
Marine Tank Vessel Loading 10/21/2010 04/21/2011
Pharmaceuticals 10/21/2010 04/21/2011
Printing and Publishing 10/21/2010 04/21/2011
Epichlorohydrin Elastomers Production 10/21/2010 04/21/2011
Hypalon Production 10/10/2008 04/21/2011
Nitrile Butadiene Rubber Production 10/21/2010 04/21/2011
Polybutadiene Rubber Production 10/21/2010 04/21/2011
Styrene Butadiene Rubber and Latex Production 10/21/2010 04/21/2011
Shipbuilding and Ship Repair (Surface Coating) 12/21/2010 11/21/2011
Wood Furniture Manufacturing Operations 12/21/2010 11/21/2011
103http://www.epa.gov/ttn/atw/rrisk/rtrpg.html.

NationalAirToxicsProgramTheIntegratedUrbanStrategyReporttoCongress
A‐2
Primary Lead Processing 02/17/2011 11/15/2011
Secondary Lead Smelting 05/09/2011 01/05/2012

NationalAirToxicsProgramTheIntegratedUrbanStrategyReporttoCongress
B‐1
AppendixB.AirToxicsAssessments
B.1.NATIONALAIRTOXICSTRENDSSTATION(NATTS)NETWORKSITES
TheobjectiveoftheNAATSprogram104istoprovidelong‐termmonitoringdataacrossrepresentativeareasofthecountryforprioritypollutants(e.g.,benzene,formaldehyde,1,3‐

NationalAirToxicsProgramTheIntegratedUrbanStrategyReporttoCongress
B‐2
butadiene,hexavalentchromiumandpolycyclicaromatichydrocarbons(PAHs)suchasnaphthalene)inordertoestablishoveralltrends.BelowisalistingoftheNAATSnetwork.
B.2.URBANHAPTRENDANALYSISThe goal of the urban HAP Trend Analysis presented in Chapter Three, section 3.3, Exhibit 3‐3 was to provide a representative overview of urban area trends for air toxics. The national urban analysis focused on trend sites available from 2003 through 2010, which represent a much larger fraction of urban areas over that time period.
For this trends analysis, trend sites were selected if they were within a county located in a Core‐Based Statistical Area (CBSA) with a population greater than 250,000. A map of monitoring sites and the pollutant groups monitored at those sites is shown in Exhibit B‐2.
Exhibit B‐1. Map of monitoring sites used in the trend analysis. Colors indicate pollutant groups that were monitored at each site.
104http://www.epa.gov/ttn/amtic/natts.html.
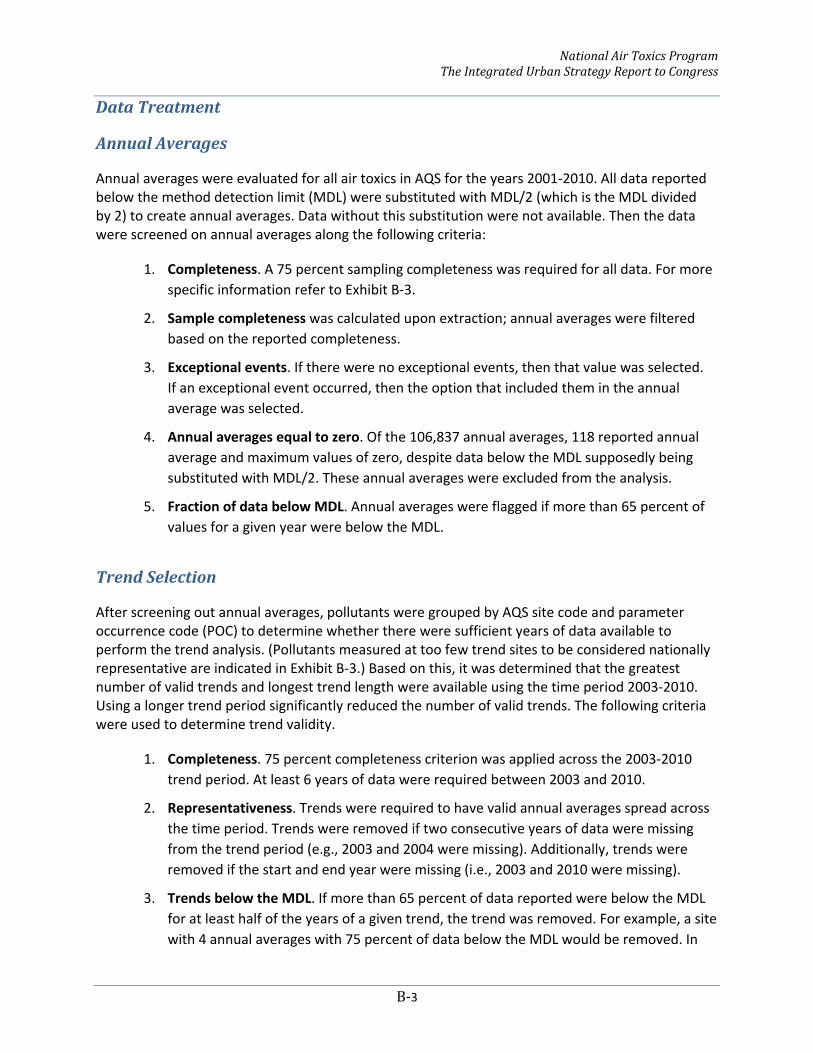
NationalAirToxicsProgramTheIntegratedUrbanStrategyReporttoCongress
B‐3
DataTreatment
AnnualAverages
Annual averages were evaluated for all air toxics in AQS for the years 2001‐2010. All data reported below the method detection limit (MDL) were substituted with MDL/2 (which is the MDL divided by 2) to create annual averages. Data without this substitution were not available. Then the data were screened on annual averages along the following criteria:
1. Completeness. A 75 percent sampling completeness was required for all data. For more
specific information refer to Exhibit B‐3.
2. Sample completeness was calculated upon extraction; annual averages were filtered
based on the reported completeness.
3. Exceptional events. If there were no exceptional events, then that value was selected.
If an exceptional event occurred, then the option that included them in the annual
average was selected.
4. Annual averages equal to zero. Of the 106,837 annual averages, 118 reported annual
average and maximum values of zero, despite data below the MDL supposedly being
substituted with MDL/2. These annual averages were excluded from the analysis.
5. Fraction of data below MDL. Annual averages were flagged if more than 65 percent of
values for a given year were below the MDL.
TrendSelection
After screening out annual averages, pollutants were grouped by AQS site code and parameter occurrence code (POC) to determine whether there were sufficient years of data available to perform the trend analysis. (Pollutants measured at too few trend sites to be considered nationally representative are indicated in Exhibit B‐3.) Based on this, it was determined that the greatest number of valid trends and longest trend length were available using the time period 2003‐2010. Using a longer trend period significantly reduced the number of valid trends. The following criteria were used to determine trend validity.
1. Completeness. 75 percent completeness criterion was applied across the 2003‐2010
trend period. At least 6 years of data were required between 2003 and 2010.
2. Representativeness. Trends were required to have valid annual averages spread across
the time period. Trends were removed if two consecutive years of data were missing
from the trend period (e.g., 2003 and 2004 were missing). Additionally, trends were
removed if the start and end year were missing (i.e., 2003 and 2010 were missing).
3. Trends below the MDL. If more than 65 percent of data reported were below the MDL
for at least half of the years of a given trend, the trend was removed. For example, a site
with 4 annual averages with 75 percent of data below the MDL would be removed. In

NationalAirToxicsProgramTheIntegratedUrbanStrategyReporttoCongress
B‐4
contrast, a site with 2 annual averages with 100 percent of data below MDL would be
included, as long as less than 65 percent of data were below the MDL for the other
years.
4. POC and sites. POCs in the AQS indicate a specific instrument or measurement method
at a site. Collocated measurements of a pollutant at a site may provide multiple annual
averages for a given year. While collocated measurements are excellent for quality
control purposes, they are not needed to represent trends at a site over time. Thus,
when presented with multiple POCs with valid trends at a monitoring site, only a single
POC was chosen, if possible. POCs were selected based on the following criteria:
a. A POC meeting trend completeness criteria 1‐3 above was used, if available.
b. If multiple POCs met criteria 1‐3, then the POC with more samples and higher
data completeness across the trend period was chosen.
c. If no single POC met criteria 1‐3, then the POC code was allowed to float across
the time period. For any given year, the POC with the most samples/highest data
completeness was used.
Exhibit B‐2. List of 33 Urban Air Toxics
Acetaldehyde Acrolein Ethylene dichloride
Arsenic compounds Acrylonitrile Ethylene oxide
Benzene Beryllium compounds Hexachlorobenzene
1, 3‐butadiene Cadmium compounds Hydrazine
Carbon tetrachloride Chromium compounds Mercury compounds
Chloroform Coke oven emissions Polychlorinated biphenyls (PCBs)
Formaldehyde Dioxin Polycyclic organic matter (POM)
Lead compounds Ethylene dibromide Quinoline
Manganese compounds Propylene dichloride 1, 1, 2, 2‐tetrachloroethane
Dichloromethane 1, 3‐dichloropropene Trichloroethylene
Nickel compounds Vinyl chloride
Tetrachloroethylene
Note: Pollutants in the left column were measured at a sufficient number of sites and are included in this analysis. Pollutants in the center and right columns were either not measured at a sufficient number of trend sites or, where monitored, measured below detection limits and, therefore, are not included in the analysis.
TrendGeneration
Trends were calculated by plotting the individual sites’ annual average concentrations and applying an ordinary least squares regression to the time series. An example trend plot is displayed in Exhibit B‐4. The slope of the linear regression is divided by the 1st year’s annual average concentration and multiplied by 100 to calculate the percentage change in concentration by year.

NationalAirToxicsProgramTheIntegratedUrbanStrategyReporttoCongress
B‐5
In the example below, the value is ‐6.3 percent per year.
Exhibit B‐3. Formaldehyde concentration (µg/m3) trend at site 120952002 in the Orlando, Florida, CBSA. Error bars indicate the standard deviation in the annual average concentration.
The value of the percentage change per year were then tabulated across all trend sites for each pollutant of interest. The distribution values of the percentage change per year was then calculated by determining the 10th, 50th, and 90th percentile and average change per year across all urban sites for each pollutant. The distribution of urban trends nationally is displayed for pollutants with at least 30 urban monitoring sites nationwide. For each pollutant, the range and midpoint of trends across the middle 80 percent of urban trend sites are shown. Pollutants with distributions skewed to the left of the zero line are generally decreasing at most sites. Only chloroform and dichloromethane are increasing at more urban sites than they are decreasing.

NationalAirToxicsProgramTheIntegratedUrbanStrategyReporttoCongress
C‐1
AppendixC.UrbanAirToxicsStudies
C.1.OVERVIEW
This appendix contains studies performed by the EPA, the HEI and various states. These assessments illustrate that while some general similarities are evident, the identity and concentration of air toxics vary significantly from area to area depending on the particular sources present (or dominant), the substances emitted, the local meteorology and other factors. The EPA acknowledges that this list is not comprehensive and the EPA does not endorse the methodologies or results of those studies completed outside the EPA. These studies, however, contribute to our understanding of the potential nature and magnitude of exposures and health risks in specific urban areas and to the pollutants and sources contributing to those exposures and risks.
EPAStudies: EPA Office of Research and Development (ORD), Detroit Exposure and Aerosol Research
Study (DEARS); July 2004‐February 2007
EPA ORD and Federal Highway Administration (FHWA), Las Vegas and Detroit Near‐Road Studies; 2008‐present
EPA ORD, Air Accountability Feasibility Study, New Haven, Connecticut; 2009
EPA Office of Air Quality Planning and Standards (OAQPS), Detroit Multipollutant Pilot Project; 2008
EPA and University of Michigan (EPA STAR Grant), Near Roadway Exposures to Urban Air Pollutants Study (NEXUS); September 2008‐February 2012
HEIStudies: Health Effects Institute (HEI), Air Toxics Hot Spots Studies; 2003‐2012
HEI, Measurement and Modeling of Exposure to Selected Air Toxics for Health Effects Studies and Verification by Biomarkers; May 2005‐May 2007
HEI, Concentrations of Air Toxics in Motor‐Vehicle‐Dominated Environments; Summer/Fall 2004
HEI, Air Toxics Exposure from Vehicle Emissions at U.S. Border Crossing: Buffalo Peace Bridge Study; July 2004‐January 2006
HEI, Assessing Personal Exposure to Air Toxics in Camden, New Jersey; June 2004‐July 2006
HEI, Air Toxics Hot Spots in Industrial Parks and Traffic; December 2012
HEI, Traffic‐Related Air Pollution: A Critical Review of the Literature; 2010

NationalAirToxicsProgramTheIntegratedUrbanStrategyReporttoCongress
C‐2
State/LocalStudies: Industrial Economics, Inc., Section 812 Prospective Study of the Benefits and Costs of
the Clean Air Act Air Toxics Case Study: Health Benefits of Benzene Reductions in Houston; 1990‐2020
Oregon Department of Environmental Quality (DEQ), Portland Air Toxics Assessment (PATA); 1999‐2000
South Coast Air Quality Management District, Multiple Air Toxics Exposure Study (MATES) II; 1998‐2000
South Coast Air Quality Management District, MATES III; 2005‐2006
Texas Commission on Environmental Quality, Houston Exposure to Air Toxics Study (HEATS); 2005‐2009
C.2.SUMMARIESOFSTUDIES
EPAORD,DetroitExposureandAerosolResearchStudy(DEARS);July2004‐February2007The Detroit Exposure and Aerosol Research Study (DEARS) was a multi‐season, multipollutant, repeated measure human exposure study that collected data on air pollutant exposures on a personal, residential and community‐wide level. These data were then combined with survey data on personal behaviors, spatial distribution of pollutant point sources and health measures. Wayne County, Michigan, was chosen for the study because of its large metropolitan population and variety of pollution sources. Additionally, Detroit had significant air quality issues and was in non‐attainment status for many NAAQS. Forty people were enrolled in the study each year, resulting in a total of 120 participants. The main objectives of DEARS were to understand: relationships between different sources of exposure and an individual’s personal exposure; how chemical and environmental factors might influence an exposure level; and relationships between different scales of exposure measurements (personal, residential and community‐wide level). DEARS focused on understanding these factors to develop or improve existing models of air pollution exposure. Data were collected on four levels: (1) personal measurements taken from air monitoring vests worn by study participants recorded the actual exposures that an individual encountered as they moved throughout their day, outside, at home, at work and during their commute; (2) stationary residential monitoring systems recorded the exposure attributable to indoor home environments; (3) stationary outdoor monitoring systems recorded the air pollution levels within a neighborhood (and notes were made about which sources of exposure existed in those communities); and (4) an ambient air monitoring system, which is part of a national system of air monitoring stations, recorded air pollutant data for the entire study area.
Although data are still being analyzed, initial conclusions from DEARS support its foundational hypothesis that significant outdoor air pollution mass concentrations can exist across metropolitan areas, and the composition of the pollutants can vary depending on where in that metropolitan

NationalAirToxicsProgramTheIntegratedUrbanStrategyReporttoCongress
C‐3
area it is measured. Personal exposures are poorly associated with daily ambient‐based measurements taken in a single location for the area. Further, season, meteorological factors, human behaviors and environmental exposure factors, as well as the specific pollutant type, were all found to be important factors for understanding pollutant and exposure variability.
DEARS found that neighborhood outdoor pollutant levels for fine and course PM could vary by as much as 15 percent from the central ambient monitoring site, indicating that local sources of PM contributed significantly to day‐to‐day variations in pollution levels. Additionally, personal exposures to calcium, iron, zinc and lead—elemental components of PM—sometimes far exceeded the exposure level measured by ambient monitors. Exposure to VOCs measured on a personal level using the exposure vests was, on average, twice as high as exposure measured by the ambient monitors. These findings illustrate the role of indoor environments and personal activities on pollutant exposure. Results showed that about half of the total fine PM exposure was from non‐ambient sources such as indoor environments and time spent travelling, and that high personal exposures related to increased blood pressure. Ambient monitoring data did not correlate with personal blood pressure data, indicating that ambient air quality monitoring data might not be sufficient for epidemiological studies of the effects of PM on human health. This study resulted in the following conclusions:
Passive VOC monitors were proven to be an effective means of exposure data collection. These low burden devices have sensitivities providing for time‐integrated measurements on the order of one day to several weeks.
Community‐based VOC concentrations are a primary driver of outdoor exposures at residential settings and often experience pronounced day‐to‐day (temporal) variability.
Impacts from VOC concentrations in close proximity to a roadway are best determined using the distance from the road surface to the target as well as the meteorology of the area. ORD developed a new distance to roadway proximity metric, which significantly improved the EPA’s ability to estimate near roadway VOC air toxic impacts in such settings.
Personal exposures to many VOCs are often multifold higher than concentrations measured by ambient monitoring. The residential indoor environment can be a major source of human exposures to these air toxics. Consumer goods, such as carpeting, wall coverings and other household products could be contributing significantly to the total exposure burden.
In comparing NATA risk exposures for benzene to the much higher direct human measures in the DEARS, the EPA determined that the contributions from non‐ambient sources, unaccounted for in NATA, have the potential to result in significant underestimation of total exposure risk for the Detroit metropolitan area.
PAHs were often fairly uniformly distributed over the Detroit metropolitan urban area. High spatial variability in the residential outdoor PAH concentrations was occasionally observed on days of unusually high PAH source emissions in heavily industrialized areas.
Passive carbonyl samplers used in the DEARS were easy to deploy and recover. Subsequently, the EPA performed collocated comparisons in multiple regional field

NationalAirToxicsProgramTheIntegratedUrbanStrategyReporttoCongress
C‐4
studies with standard air toxic measurement methods. DEARS and the regional comparison studies indicated that significant research needed to be performed on all of the methods to improve their performance and degree of acceptable data quality.
http://www.epa.gov/dears/
EPAORDandFederalHighwayAdministration(FHWA),LasVegasandDetroitNear‐RoadStudies;2008‐presentThe National Near‐Roadway Mobile Source Air Toxics (MSAT) Study is a collaborative effort between the EPA and the DOT’s Federal Highway Administration. The study was developed as a result of a lawsuit settlement between the Sierra Club and the DOT regarding improvements to U.S. Highway 95 in Nevada. The main goal of the study is to better understand the relationship between traffic emissions and air pollution at various distances from a roadway. Secondary goals include assessing human exposure levels, investigating potential health effects and investigating how barriers like walls and vegetation can reduce near‐road pollutant levels. Ultimately, study results will provide the scientific knowledge and understanding needed to identify the most effective strategies and tools to control exposure to air pollution from major roads, including natural and man‐made mitigation strategies to protect people who live, work or go to school nearby.
Continuous monitoring and data collection began in a near‐road location along U.S. Highway 95 in Las Vegas, Nevada, in December 2008, and was completed by February 2010. Monitoring instruments were set up 10, 100, and 350 meters from the road to analyze how pollutants disperse from the road. MSAT data collection occurred once every 12 days and criteria pollutant data collection was continuous. Data on traffic counts, vehicle types, roadway characteristics and meteorological conditions (including wind speed and direction, temperature and humidity) were also collected. The EPA is currently completing a report for the Las Vegas portion of the study.
Similar monitoring and data collection began in a second site along Interstate 96 in Detroit, Michigan, in October 2010. Monitoring instruments were placed 10, 100, and 300 meters from the road, MSAT data was collected quarterly and criteria pollutant data was collected continuously. EPA is currently analyzing the data from the Detroit portion of the study. Basicinformation:http://www.epa.gov/nrmrl/appcd/nearroadway/index.htmlorhttp://www.fhwa.dot.gov/environment/air_quality/air_toxics/research_and_analysis/near_road_study/Specificlocation/stagesofstudy:
1.LasVegas:http://www.fhwa.dot.gov/environment/air_quality/air_toxics/research_and_analysis/near_road_study/nrves08.cfm
2.Detroit:http://www.fhwa.dot.gov/environment/air_quality/air_toxics/research_and_analysis/near_road_study/nrvesdet.cfm
EPAORD,AirAccountabilityFeasibilityStudy,NewHaven,Connecticut;2009The purpose of this project was to assess the feasibility of conducting a city‐level assessment of cumulative air pollution reduction activities on the federal, state, tribal and local voluntary levels

NationalAirToxicsProgramTheIntegratedUrbanStrategyReporttoCongress
C‐5
and their impact on public health. Study goals included assessing the availability of human health data, ambient exposure data and studies examining linkages between exposure to air pollution and health effects; determining data collection methods needed to cover gaps in available data; assessing available modeling methodologies; and quantitatively determining the statistical feasibility of carrying out an air accountability study in New Haven, Connecticut. Findings revealed only four ambient monitors in the domain of the study, and no existing human exposure to air pollution data available. Several databases were identified for data concerning health effects; however, no one database containing all necessary information was found. Modeling projected an overall decrease in median pollutant concentrations from local sources between 2001 and 2010, and slight decreases in median pollutant concentrations from 2010 to 2030. Stochastic Human Exposure and Dose Simulation model for Air Toxics (SHEDS‐Air Toxics) and the modified Hazard Air Pollution Exposure Model (HAPEM6) showed differences in both magnitude and spatial patterns of air concentrations of air toxics and exposures. This highlights the importance for exposure modeling in these assessments. The study evaluated 34 specific linkages between pollutants and health outcomes and found 4 potentially feasible linkages that could be used in an accountability study. The information collection activities performed in this study will serve the EPA as a resource for future air accountability research planning. http://ctdatahaven.org/know/images/5/5a/AWMA_April_2009_Combing_Reg_local‐sml.pdfEPAOfficeofAirQualityPlanningandStandards(OAQPS),DetroitMultipollutantPilotProject;2008The Detroit Multipollutant Pilot Project was conducted as part of the OAQPS Air Quality Management Plan (AQMP) Pilot Project, and was designed to help develop test methods, tools and a functional framework for a multipollutant approach to air quality management and control. This project was implemented in response to a 2004 NRC report recommending that the United States transition to a multipollutant air quality management plan. Detroit was chosen as the urban test area for this project because of emission levels of PM2.5 and air toxics of concern. The project used a hybrid CMAQ and AERMOD modeling approach to compare a “status quo” control approach achieving separate ozone and PM2.5 attainment goals with a multipollutant risk‐based approach designed to meet or exceed air quality improvements at monitors and reduce PM2.5, ozone and HAP exposure throughout the region. The two approaches were evaluated based on improved ozone and PM2.5 air quality at monitors; improved regional air quality of PM2.5, ozone and selected air toxics; monetized PM2.5‐ and ozone‐related health benefits; and reductions in cancer and noncancer risk. Results of the Detroit Multipollutant Pilot Project showed that the multipollutant risk‐based control approach met all of the criteria for a successful management plan. Modeling predicted the same or greater reductions for PM2.5 and ozone at all monitors, including projected non‐attainment monitors, and improved regional air quality for ozone, PM2.5, and selected air toxics under the multipollutant management plan. A greater reduction in noncancer risk was shown under the multipollutant management plan than the “status quo” plan, and a benefit‐cost comparison revealed a much higher benefit‐cost ratio under the multipollutant plan. This study was the first to analyze the benefits of a multipollutant air quality management plan and will support future development and implementation of such plans. http://www.epa.gov/ttn/scram/reports/aqmp_presentation_detroit_jan08.pdf

NationalAirToxicsProgramTheIntegratedUrbanStrategyReporttoCongress
C‐6
EPAandUniversityofMichigan(EPASTARGrant),NearRoadwayExposurestoUrbanAirPollutantsStudy(NEXUS);September2008‐February2012An EPA study of traffic‐related air pollution near roadways close to the residences of asthmatic children is currently underway in Detroit, Michigan, to determine which measures of traffic‐related pollution most closely associate with asthmatic aggravation and related respiratory infections. The NEXUS study participants—children 6 to 14 years of age with persistent asthma—live in 3 different proximities to roadways: within 150 meters of high volume, high diesel roads; within 150 meters of high volume but low diesel roads; and more than 300 meters from roads. The study was designed to develop a set of exposure metrics for each health study participant using measured and modeled data of varying spatiotemporal complexity at the ambient, residential and personal levels. Temporal variability in exposures was included in the study design to address the frequency, magnitude and duration of exposures to traffic‐related air pollutants. To achieve these objectives, an integrated measurement and modeling approach was implemented in the NEXUS to quantitatively estimate the contribution of traffic sources to near‐roadway air pollution and evaluate predictive modeling tools for assessing the impact of near‐roadway pollution on the children’s exposures. Through a cooperative agreement with the University of Michigan, the relationships between traffic‐related exposures and respiratory health effects in children with persistent asthma will be investigated. http://cfpub.epa.gov/ncer_abstracts/index.cfm/fuseaction/display.abstractDetail/abstract/8977http://www.epa.gov/nerl/documents/NearRoadwayTechnical_external_fact_sheet_071910.pdfHEI,AirToxicsHotSpotsStudies;2003‐2012Air toxics hot spots are areas that have high concentrations of toxic compounds due to proximity to one or more pollutant sources. Hot spots offer researchers the ability to characterize spatial and temporal characteristics of pollutant exposure and then study potential health effects of exposure to pollutants on a representative sample of the general public. HEI has funded five studies to identify and characterize exposure in hot spots across the United States and United Kingdom. www.healtheffects.org
HEI,MeasurementandModelingofExposuretoSelectedAirToxicsforHealthEffectsStudiesandVerificationbyBiomarkers,May2005‐May2007;ReportreleasedJune2009The goal of this project was to develop personal exposure models that considered microenvironments. This was achieved by collecting and analyzing the biomarkers and behaviors of 100 study participants. The personal sampling consisted of five, 24‐hour exposure measurements from personal samplers, urine samples to test for biomarkers of exposure, and time‐activity diaries to link exposures to activities. Finally, 24‐hour air quality measurements were taken in the homes and workplaces of participants. In addition to having varying daily activities, participants lived in different urban, suburban and rural areas of the United Kingdom and therefore experienced different vehicular traffic environments and exposure to mobile‐source emissions. Results indicated that personal exposures were predominately influenced by residential environments. Higher personal exposures occurred in participants who were exposed to fossil fuel combustion on

NationalAirToxicsProgramTheIntegratedUrbanStrategyReporttoCongress
C‐7
daily commutes, spent time in environments with tobacco smoke or used certain solvents or consumer products. Predictive models were developed to estimate exposures based on the observed microenvironmental factors and lifestyle. The models were useful for predicting exposures to VOCs but were not as predictive for PAHs. In addition, low exposures were better predicted by the model than high exposures. This study illustrated the extent to which personal exposure can vary based on personal activities and spatial variations. It also stressed that not enough is understood about exposure to produce accurate models for personal exposures across varied microenvironments and human behaviors. http://pubs.healtheffects.org/getfile.php?u=515
HEI,ConcentrationsofAirToxicsinMotor‐Vehicle‐DominatedEnvironments;Summer/Fall2004;ReportreleasedFebruary2011Investigators measured the concentration of pollutants (carbon monoxide, nitrogen oxides, and several mobile‐source air toxics) on urban highways and at fixed off‐highway sites in the Los Angeles County area. Onroad measurements were taken by driving a monitoring van for 1 hour during morning rush hour and 1 hour during afternoon rush hour, on 3 different commuter highways and 1 freeway with a higher proportion of diesel trucks. Following the morning onroad measurements, the monitoring van stopped at locations at varying distances off the major highway and took measurements at off‐highway locations. Additionally, 24‐hour stationary monitoring sites were set up in 3 near‐road locations. Main findings were that concentrations of all pollutants measured were higher on‐highway than at fixed off‐highway sites. Gasoline exhaust was the main source of VOCs, accounting for 100 percent of the onroad VOC concentration and about 70 percent of the near‐road concentration. Diesel exhaust accounted for 46 percent to 52 percent of the total particulate carbon in near‐road locations, compared to only 10‐17 percent from gasoline exhaust in the peak summer season. Approximately 40‐50 percent of total particulate carbon was not due to mobile sources. The full results from this study will serve as an important baseline for information on MSATs on and near roads as motor vehicle emissions control standards and fuel types change in coming years. http://pubs.healtheffects.org/getfile.php?u=617
HEI,AirToxicsExposurefromVehicleEmissionsatU.S.BorderCrossing:BuffaloPeaceBridgeStudy;July2004‐January2006;ReportreleasedJuly2011Peace Bridge, in Buffalo, New York, is one of the busiest border‐crossing locations in the United States and suspected to be a hot‐spot for MSATs. Emissions of more than 40 MSATs were measured both upwind and downwind of the bridge plaza to study the relationship of traffic at the bridge and ambient air pollution. Pilot studies in July 2004 and January 2005 established fixed sampling sites directly upwind and downwind of the bridge and in a nearby neighborhood slightly downwind of the bridge, collected traffic data, including number and type of vehicles crossing the bridge, and measured spatial dispersion of pollution originating from bridge by measuring personal exposure along four routes commonly used by pedestrians through the neighborhood next to the bridge. Two‐week sampling campaigns were then carried out in July 2005 and January 2006. The study results showed that the Peace Bridge area was not necessarily a hot‐spot for MSAT pollution compared to other areas in the United States. Concentrations of different pollutants observed in the upwind, downwind and dispersed downwind areas near the bridge were highly dependent on

NationalAirToxicsProgramTheIntegratedUrbanStrategyReporttoCongress
C‐8
wind conditions. On a small spatial scale, hot spots for different pollutants could develop and shift with changing wind speed and direction. http://pubs.healtheffects.org/getfile.php?u=656
HEI,AssessingPersonalExposuretoAirToxicsinCamden,NewJersey;June2004‐July2006;ReportreleasedAugust2011Investigators measured concentrations of 32 compounds, including VOCs, aldehydes, PAHs and PM2.5, in two nearby neighborhoods in Camden, New Jersey. One neighborhood, Waterfront South, was an industrial center close to several highways, and the other, Copewood‐Davis, did not have any industrial pollutant sources. Personal exposure was measured in 107 nonsmoking study participants for 24‐hour periods in the summer and winter, on a weekend and weekday, and ambient pollution levels were measured at 38 fixed sites in the neighborhoods. Study results showed that Waterfront South was a hot‐spot for PAH, toluene, xylene and PM2.5 pollution compared to neighboring Copewood‐Davis; however, concentrations of ambient benzene, methyl tertiary butyl ether, chloroform, carbon tetrachloride, hexane and acetaldehyde in Copewood‐Davis were similar to, or higher than, concentrations in Waterfront South and elevated compared to studies in other regions of the country. Additionally, personal exposure measurements were higher than ambient measurements, indicating a role for non‐outdoor sources. This study showed that hot‐spots can be identified on a small scale of one neighborhood to the next, as well as on a regional or national scale. This illustrates the need to design future air toxics exposure/health effects studies to include multiple pollutant sources, meteorological factors and spatial scales when choosing hot‐spots and reference sites. http://pubs.healtheffects.org/view.php?id=364
HEI,AirToxicsHotSpotsinIndustrialParksandTraffic;December2012This study, added to an ongoing study by the National Cancer Institute, measured air toxics and PM levels upwind, downwind and along the dock perimeters of 15 different truck terminals in the United States to identify the potential impacts of truck terminals on air pollution in the surrounding area. This study is part of the National Cancer Institute’s ongoing initiative to investigate the relationship between diesel exhaust exposure and lung cancer mortality in truck drivers and dockworkers at more than 200 truck terminals in the United States (study was completed in mid‐2012). http://www.pubs.healtheffects.org/view.php?id=393HEI,Traffic‐RelatedAirPollution:ACriticalReviewoftheLiterature;2010Published in 2010, the HEI “Traffic‐Related Air Pollution: A Critical Review of the Literature on Emissions, Exposure, and Health Effects” was the culmination of research efforts funded by an EPA Assistance Award. A panel of experts reviewed, summarized and synthesized data from air pollution emissions, exposure and health studies focused on urban and near‐roadway settings. Several major conclusions were drawn, including the identification of an “exposure zone” up to 300‐500 meters from a major roadway where traffic emissions and exposures are greatest. The Panel noted that epidemiological and toxicological evidence related to health effects of air pollution is incomplete, but a causal relationship between traffic and asthma is supported.
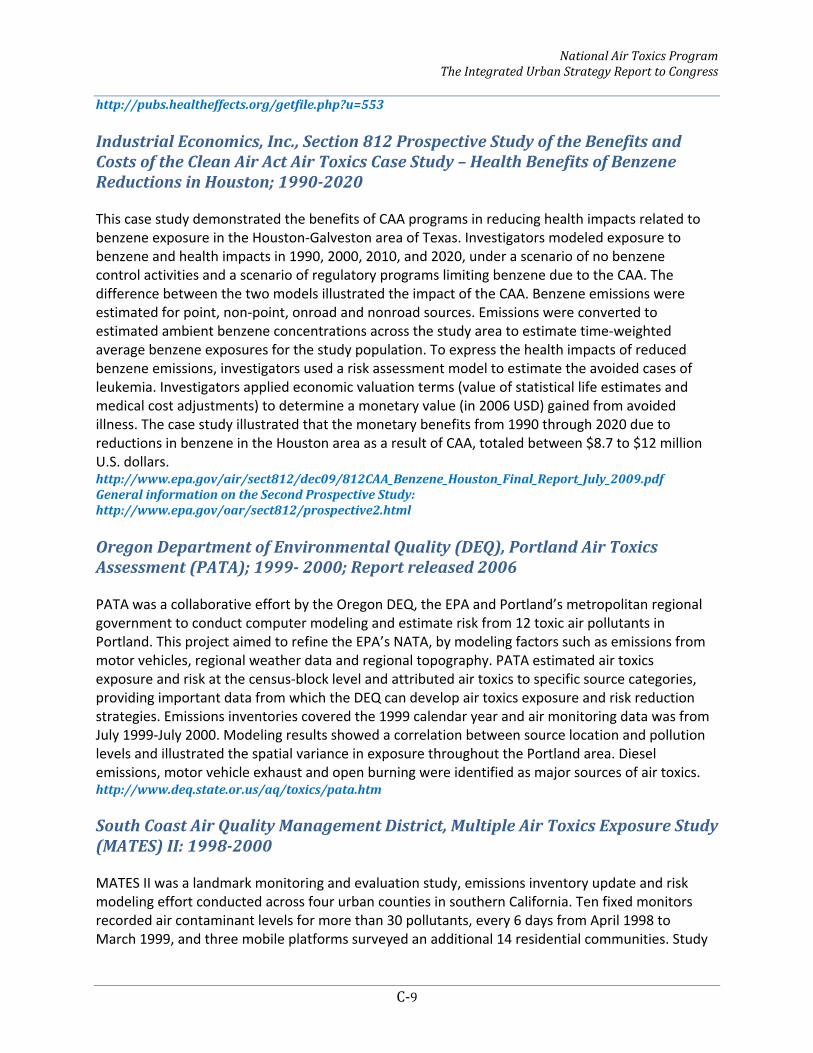
NationalAirToxicsProgramTheIntegratedUrbanStrategyReporttoCongress
C‐9
http://pubs.healtheffects.org/getfile.php?u=553
IndustrialEconomics,Inc.,Section812ProspectiveStudyoftheBenefitsandCostsoftheCleanAirActAirToxicsCaseStudy–HealthBenefitsofBenzeneReductionsinHouston;1990‐2020This case study demonstrated the benefits of CAA programs in reducing health impacts related to benzene exposure in the Houston‐Galveston area of Texas. Investigators modeled exposure to benzene and health impacts in 1990, 2000, 2010, and 2020, under a scenario of no benzene control activities and a scenario of regulatory programs limiting benzene due to the CAA. The difference between the two models illustrated the impact of the CAA. Benzene emissions were estimated for point, non‐point, onroad and nonroad sources. Emissions were converted to estimated ambient benzene concentrations across the study area to estimate time‐weighted average benzene exposures for the study population. To express the health impacts of reduced benzene emissions, investigators used a risk assessment model to estimate the avoided cases of leukemia. Investigators applied economic valuation terms (value of statistical life estimates and medical cost adjustments) to determine a monetary value (in 2006 USD) gained from avoided illness. The case study illustrated that the monetary benefits from 1990 through 2020 due to reductions in benzene in the Houston area as a result of CAA, totaled between $8.7 to $12 million U.S. dollars. http://www.epa.gov/air/sect812/dec09/812CAA_Benzene_Houston_Final_Report_July_2009.pdfGeneralinformationontheSecondProspectiveStudy:http://www.epa.gov/oar/sect812/prospective2.html
OregonDepartmentofEnvironmentalQuality(DEQ),PortlandAirToxicsAssessment(PATA);1999‐2000;Reportreleased2006PATA was a collaborative effort by the Oregon DEQ, the EPA and Portland’s metropolitan regional government to conduct computer modeling and estimate risk from 12 toxic air pollutants in Portland. This project aimed to refine the EPA’s NATA, by modeling factors such as emissions from motor vehicles, regional weather data and regional topography. PATA estimated air toxics exposure and risk at the census‐block level and attributed air toxics to specific source categories, providing important data from which the DEQ can develop air toxics exposure and risk reduction strategies. Emissions inventories covered the 1999 calendar year and air monitoring data was from July 1999‐July 2000. Modeling results showed a correlation between source location and pollution levels and illustrated the spatial variance in exposure throughout the Portland area. Diesel emissions, motor vehicle exhaust and open burning were identified as major sources of air toxics. http://www.deq.state.or.us/aq/toxics/pata.htm SouthCoastAirQualityManagementDistrict,MultipleAirToxicsExposureStudy(MATES)II:1998‐2000MATES II was a landmark monitoring and evaluation study, emissions inventory update and risk modeling effort conducted across four urban counties in southern California. Ten fixed monitors recorded air contaminant levels for more than 30 pollutants, every 6 days from April 1998 to March 1999, and three mobile platforms surveyed an additional 14 residential communities. Study

NationalAirToxicsProgramTheIntegratedUrbanStrategyReporttoCongress
C‐10
results showed that the cancer risk from air pollution in the region was about 1,400 per 1 million people. Seventy percent of that risk was attributed to diesel particulate emissions, 20 percent to other mobile sources and 10 percent to stationary air pollution sources such as industries and businesses. Model results showed higher risk levels in south‐central Los Angeles, the harbor area and near freeways. These findings supported the conclusions of monitoring that mobile sources are the main contributors to cancer risk. Seasonal variations were strong and monitoring showed that benzene, butadiene and elemental carbon peaked in late fall and early winter and was lowest in the spring and summer. http://www.aqmd.gov/matesiidf/matestoc.htm
SouthCoastAirQualityManagementDistrict,MATESIII:2005‐2006This study is a follow up to the previous MATES II study and includes similar monitoring and evaluation, emissions inventory updates, and risk modeling. Ten fixed‐site monitors, placed in the same locations as the fixed‐site monitors used in MATES II, recorded pollution levels every 3 days from April 2004 through March 2006. Additionally, 5 locations were surveyed using mobile platform monitors. Study results showed that the cancer risk from air pollution in the region was about 1,200 per 1 million people. Approximately 94 percent of that risk was linked to mobile sources and only 6 percent to stationary air pollution sources like industries and businesses. Approximately 84 percent of the total risk was attributable to diesel exhaust. The study found an 8 percent decrease in risk for air toxics exposure in the region compared to the MATES II study. Highest risk areas were the same as during MATES II: near the port, central Los Angeles and near transportation corridors. ReportreleasedSeptember2008:http://www.aqmd.gov/prdas/matesIII/matesIII.html
TexasCommissiononEnvironmentalQuality,HoustonExposuretoAirToxicsStudy(HEATS);2005‐2009The primary goal of HEATS was to measure and compare personal exposure to eleven different HAPs for residents who lived in an area of Houston with a high density of point source emissions to residents who lived in an area with only a few point source emissions. A total of 78 adults and 35 children participated in the study. Exposure was measured during two 24‐hour periods each 6 months apart, using personal monitoring devices, stationary indoor and outdoor residential monitoring devices, as well as fixed site ambient monitoring stations. Personal activity logs and questionnaire responses regarding perceived environmental risk and health symptoms were also recorded. The results of HEATS showed that personal exposure as measured through personal exposure monitoring devices was higher than exposure measured by ambient air monitors. Total personal exposure to VOCs was more closely associated with residential indoor measurements than to ambient or stationary outdoor measurements. There were not significant differences in personal exposure or health symptoms between residents living in an area of high point source density compared to low point source density; however, the number of study participants might have been too low to adequately reflect differences. There were differences observed in emissions at the fixed outdoor monitoring; however, these emissions were not considered good predictors of personal exposure due to the amount of time that study participants spent indoors. Overall, personal exposures were similar in the two areas observed, and as such were not dependent on the density of emissions sources or the outdoor pollutant concentrations in each of the study

NationalAirToxicsProgramTheIntegratedUrbanStrategyReporttoCongress
C‐11
areas. http://www.tceq.texas.gov/toxicology/research/heats.html#report
NationalAirToxicsProgramTheIntegratedUrbanStrategyReporttoCongress
D‐1
AppendixD.IntegratedRiskInformationSystem(IRIS)Status
D.1.STATUSOFPROGRESSOFUPDATESTOIRISASSESSMENTS
The EPA's IRIS is a human health assessment program that evaluates risk information on effects that could result from exposure to environmental contaminants. Through the IRIS program, the EPA provides the highest quality science‐based human health assessments to support the agency’s regulatory activities. The IRIS database contains information for more than 550 chemical substances containing information on human health effects that could result from exposure to various substances in the environment.105
Since 2000, the EPA has completed or updated hazard identifications and dose‐response assessments for several of the 33 urban HAPs through the IRIS program. As of October 2012, 32 of the 33 urban HAPs have undergone IRIS assessment, 28 of which have one or more quantitative inhalation values. Twelve of these assessments have been completed since 2000. Currently, 12 urban HAPs are undergoing assessment in the IRIS program.
105http://www.epa.gov/IRIS/.

NationalAirToxicsProgramTheIntegratedUrbanStrategyReporttoCongress
D‐2
Exhibit D‐1. Status of IRIS Risk Assessments for the 33 Urban HAPs
Contaminant Cancer Classificationa Cancer Inhalation Unit
Risk RfC RfD
Status of Assessment
Value Date Value Date Value Date
Acetaldehyde CAS: 75‐07‐0
B2 – Probable human carcinogen Yes 1991 Yesb 1991
Not assessed NA
Reassessment is currently under development. For the most current information see: IRISTrack.
Acrolein CAS: 107‐02‐8 Data are inadequate Noc 2003 Yesb 2003 Yes 2003
Assessment completed in 2003.
Acrylonitrile CAS: 107‐13‐1
B1 – Probable human carcinogen Yes 1991 Yesb 1991
Not assessed NA
Reassessment is currently under development. For the most current information see: IRISTrack.
Arsenic Compounds
Arsine (7784‐42‐1)
Not assessed Not assessed NA Yes 1994
Not assessed
NA
Reassessment is currently under development. For the most current information see: IRISTrack.
Inorganic (7440‐38‐2) A – Human carcinogen Yes 1998
Not assessed NA Yes 1993
Benzene CAS: 71‐43‐2 A – Human carcinogen Yes 2000 Yes 2003 Yes 2003
Noncancer assessment completed in 2003. Cancer assessment completed in 2000.
Beryllium Compounds CAS: 7440‐41‐7
B1 – Probable human carcinogen Yes 1998 Yes 1998 Yes 1998
Reassessment is currently under development. For
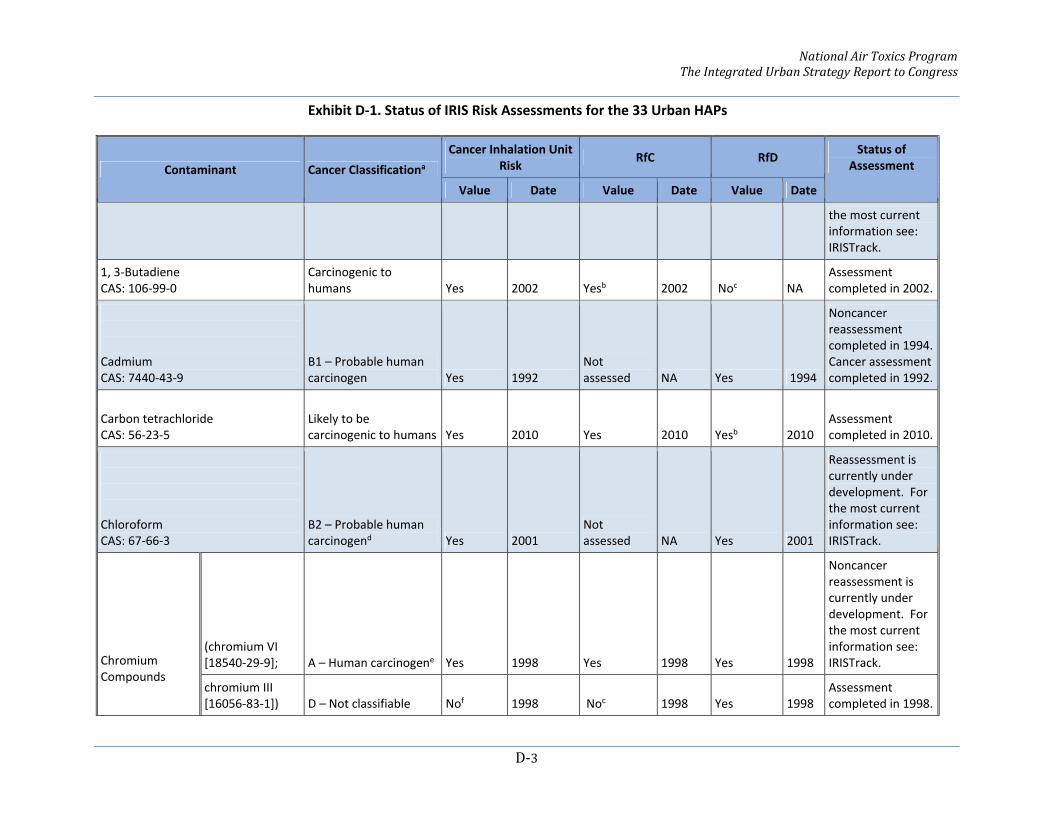
NationalAirToxicsProgramTheIntegratedUrbanStrategyReporttoCongress
D‐3
Exhibit D‐1. Status of IRIS Risk Assessments for the 33 Urban HAPs
Contaminant Cancer Classificationa Cancer Inhalation Unit
Risk RfC RfD
Status of Assessment
Value Date Value Date Value Date
the most current information see: IRISTrack.
1, 3‐Butadiene CAS: 106‐99‐0
Carcinogenic to humans Yes 2002 Yesb 2002 Noc NA
Assessment completed in 2002.
Cadmium
CAS: 7440‐43‐9 B1 – Probable human carcinogen Yes 1992
Not assessed NA Yes 1994
Noncancer reassessment completed in 1994. Cancer assessment completed in 1992.
Carbon tetrachloride CAS: 56‐23‐5
Likely to be carcinogenic to humans Yes 2010 Yes 2010 Yesb 2010
Assessment completed in 2010.
Chloroform CAS: 67‐66‐3
B2 – Probable human carcinogend Yes 2001
Not assessed NA Yes 2001
Reassessment is currently under development. For the most current information see: IRISTrack.
Chromium Compounds
(chromium VI [18540‐29‐9]; A – Human carcinogene
Yes
1998
Yes
1998
Yes
1998
Noncancer reassessment is currently under development. For the most current information see: IRISTrack.
chromium III [16056‐83‐1]) D – Not classifiable Nof 1998 Noc 1998 Yes 1998
Assessment completed in 1998.
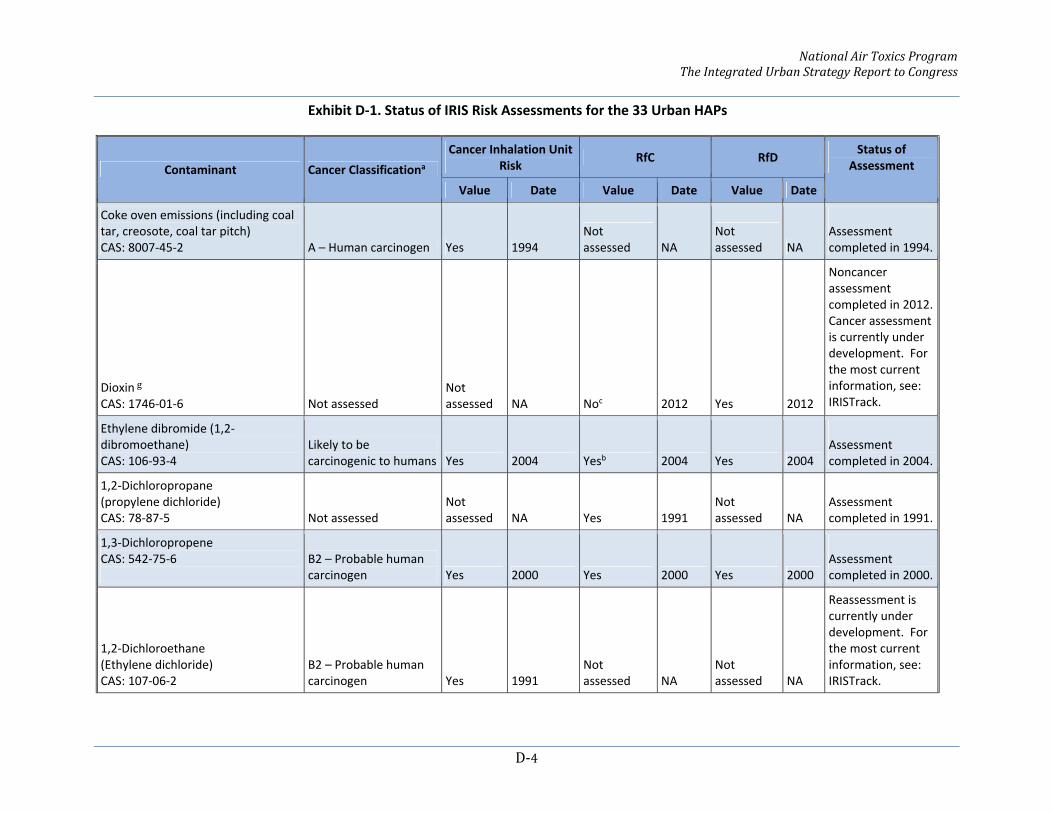
NationalAirToxicsProgramTheIntegratedUrbanStrategyReporttoCongress
D‐4
Exhibit D‐1. Status of IRIS Risk Assessments for the 33 Urban HAPs
Contaminant Cancer Classificationa Cancer Inhalation Unit
Risk RfC RfD
Status of Assessment
Value Date Value Date Value Date
Coke oven emissions (including coal tar, creosote, coal tar pitch) CAS: 8007‐45‐2 A – Human carcinogen Yes 1994
Not assessed NA
Not assessed NA
Assessment completed in 1994.
Dioxing CAS: 1746‐01‐6 Not assessed
Not assessed NA Noc 2012 Yes 2012
Noncancer assessment completed in 2012. Cancer assessment is currently under development. For the most current information, see: IRISTrack.
Ethylene dibromide (1,2‐dibromoethane) CAS: 106‐93‐4
Likely to be carcinogenic to humans Yes 2004 Yesb 2004 Yes 2004
Assessment completed in 2004.
1,2‐Dichloropropane (propylene dichloride) CAS: 78‐87‐5 Not assessed
Not assessed NA Yes 1991
Not assessed NA
Assessment completed in 1991.
1,3‐Dichloropropene CAS: 542‐75‐6
B2 – Probable human carcinogen Yes 2000 Yes 2000 Yes 2000
Assessment completed in 2000.
1,2‐Dichloroethane (Ethylene dichloride) CAS: 107‐06‐2
B2 – Probable human carcinogen Yes 1991
Not assessed NA
Not assessed NA
Reassessment is currently under development. For the most current information, see: IRISTrack.

NationalAirToxicsProgramTheIntegratedUrbanStrategyReporttoCongress
D‐5
Exhibit D‐1. Status of IRIS Risk Assessments for the 33 Urban HAPs
Contaminant Cancer Classificationa Cancer Inhalation Unit
Risk RfC RfD
Status of Assessment
Value Date Value Date Value Date
Ethylene oxideg
CAS: 75‐21‐8
Not assessed
Not assessed
NA
Not assessed
NA
Not assessed
NA
Assessment is currently under development. For the most current information, see: IRISTrack.
Formaldehyde CAS: 50‐00‐0
B1 – Probable human carcinogen Yes 1990
Not assessed NA Yes 1991
Reassessment is currently under development. For the most current information, see: IRISTrack.
Hexachlorobenzene CAS: 118‐74‐1
B2 – Probable human carcinogen Yes 1996 Noc NA Yes 1991
Assessment completed in 1996.
Hydrazine CAS: 302‐01‐2
B2 – Probable human carcinogen Yes 1991 Noc NA
Not assessed NA
Assessment completed in 1991.
Lead Compounds (inorganic) CAS: 7439‐92‐1
B2 – Probable human carcinogen
Not assessed NA
Not assessed NA Noc 2004
Assessment completed in 2004. An updated Integrated Science Assessmenth (ISA) for lead is anticipated in 2012.
Manganese
CAS: 7439‐96‐5 D – Not classifiable Nof NA Yesb 1993 Yes 1996 Assessment completed in 1996.
Mercury Compounds
Elemental Mercury D – Not classifiable Nof NA Yes 1995
Not assessed NA

NationalAirToxicsProgramTheIntegratedUrbanStrategyReporttoCongress
D‐6
Exhibit D‐1. Status of IRIS Risk Assessments for the 33 Urban HAPs
Contaminant Cancer Classificationa Cancer Inhalation Unit
Risk RfC RfD
Status of Assessment
Value Date Value Date Value Date
(7439‐97‐6) Assessment completed in 1995.
Methylmercury (22967‐92‐6)
C – Possible human carcinogen
Not assessed 1995
Not assessed NA Yes 2001
Assessment completed in 2001.
Mercuric chloride (7487‐94‐7)
C – Possible human carcinogen
Not assessed NA
Not assessed 1994 Yesb 1995
Assessment completed in 1995.
Methylene chloride (dichloromethane)
CAS: 75‐09‐2 Likely to be carcinogenic to humans Yes 2011 Yes 2011 Yes 2011
Assessment completed in 2011.
Nickel Compounds
Nickel, soluble salts (various CAS) Data are inadequate
Not assessed 1994
Not assessed NA Yes 1996
Reassessment is currently under development. For the most current information, see: IRISTrack.
Nickel refinery dust (no CAS) A – Human carcinogen Yes 1991
Not assessed NA
Not assessed NA
Assessment completed in 1991.
Nickel carbonyl (13463‐39‐3)
B2 – Probable human carcinogen
Not assessed 1991
Not assessed NA
Not assessed NA
Assessment completed in 1991.
Nickel subsulfide (12035‐72‐2) A – Human carcinogen Yes 1991
Not assessed NA
Not assessed NA
Assessment completed in 1991.

NationalAirToxicsProgramTheIntegratedUrbanStrategyReporttoCongress
D‐7
Exhibit D‐1. Status of IRIS Risk Assessments for the 33 Urban HAPs
Contaminant Cancer Classificationa Cancer Inhalation Unit
Risk RfC RfD
Status of Assessment
Value Date Value Date Value Date
Polychlorinated biphenyls (PCBs) CAS: 1336‐36‐3
Aroclor 1016 (12674‐11‐2)
B2 – Probable human carcinogenl
Yes (“PCBsl”)
1997
Not assessed
NA Yes 1996
Cancer assessment completed in 1997. Reassessment of PCBs is currently under development for noncancer health effects. For the most current information, see: IRISTrack.
Aroclor 1248 (12672‐29‐6)
Not assessed
NA Noc 1996
Aroclor 1254 (11097‐69‐1)
Not assessed
NA Yes 1996
POMi
benzo(a)pyrene (BaP);
B2 – Probable human carcinogen
Not assessed 1994
Not assessed NA
Not assessed NA
Cancer classification completed in 1994. Reassessment is currently under development. For the most current information, see:IRISTrack.
benz[a]anthracene; chrysene; benzo[b]fluoranthene; benzo[k]fluoranthene; dibenz[a,h]anthracene; and
B2 – Probable human carcinogen
Not assessed 1994
Not assessed NA
Not assessed NA
Assessments

NationalAirToxicsProgramTheIntegratedUrbanStrategyReporttoCongress
D‐8
Exhibit D‐1. Status of IRIS Risk Assessments for the 33 Urban HAPs
Contaminant Cancer Classificationa Cancer Inhalation Unit
Risk RfC RfD
Status of Assessment
Value Date Value Date Value Date
indeno[1,2,3‐cd]pyrene
completed in 1994.
Polycyclic aromatic hydrocarbon (PAH) mixtures
Not assessed Not assessed NA
Not assessed NA
Not assessed NA
This assessment is currently under development. For the most current information, see: IRISTrack.
Quinoline CAS: 91‐22‐5
B2 – Probable human carcinogen
No c
2001 Noc 2001 Noc 2001
Assessmentcompleted in 2001.j
1,1,2,2‐Tetrachloroethane CAS: 79‐34‐5
Likely to be carcinogenic to humans Noc 2010 Noc 2010 Yesk 2010
Assessment completed in 2010.
Tetrachloroethylene (Perchloroethylene) CAS: 127‐18‐4
Likely to be carcinogenic to humans Yes 2012 Yesb 2012 Yesb 2012
Assessment completed in 2012.
Trichloroethylene CAS: 79‐01‐6
Carcinogenic to humans Yes 2011 Yes 2011 Yes 2011
Assessment completed in 2011.
Vinyl chloride CAS: 75‐01‐4 A – Human carcinogen Yes 2000 Yes 2000 Yes 2000
Assessment completed in 2000.
a These chemicals may have a cancer hazard classification of: ‐ known, probable, or possible human carcinogens (under the 1986 EPA cancer guidelines (U.S. EPA 1986); or ‐ carcinogenic to humans, likely to be carcinogenic to humans, or suggestive evidence of carcinogenic potential (under the 2005 EPA cancer guidelines (U.S. EPA, 2005a).
b UF=1000 or greater.
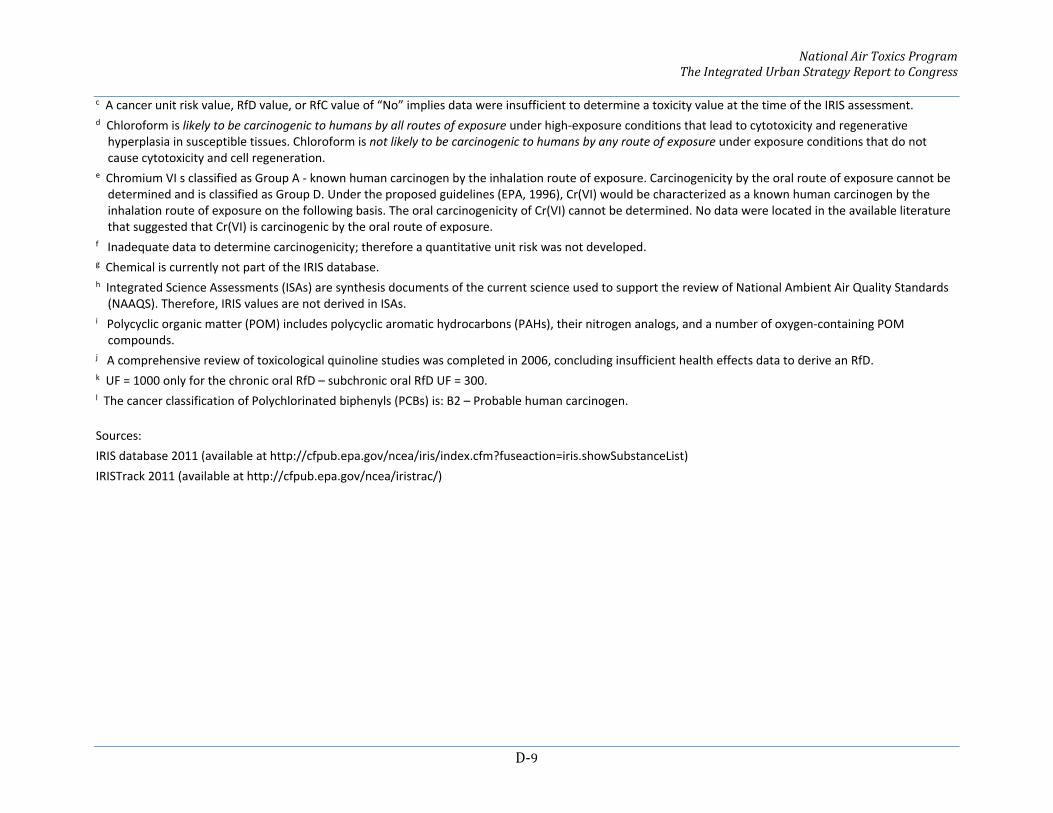
NationalAirToxicsProgramTheIntegratedUrbanStrategyReporttoCongress
D‐9
c A cancer unit risk value, RfD value, or RfC value of “No” implies data were insufficient to determine a toxicity value at the time of the IRIS assessment. d Chloroform is likely to be carcinogenic to humans by all routes of exposure under high‐exposure conditions that lead to cytotoxicity and regenerative hyperplasia in susceptible tissues. Chloroform is not likely to be carcinogenic to humans by any route of exposure under exposure conditions that do not cause cytotoxicity and cell regeneration.
e Chromium VI s classified as Group A ‐ known human carcinogen by the inhalation route of exposure. Carcinogenicity by the oral route of exposure cannot be determined and is classified as Group D. Under the proposed guidelines (EPA, 1996), Cr(VI) would be characterized as a known human carcinogen by the inhalation route of exposure on the following basis. The oral carcinogenicity of Cr(VI) cannot be determined. No data were located in the available literature that suggested that Cr(VI) is carcinogenic by the oral route of exposure.
f Inadequate data to determine carcinogenicity; therefore a quantitative unit risk was not developed. g Chemical is currently not part of the IRIS database. h Integrated Science Assessments (ISAs) are synthesis documents of the current science used to support the review of National Ambient Air Quality Standards (NAAQS). Therefore, IRIS values are not derived in ISAs.
i Polycyclic organic matter (POM) includes polycyclic aromatic hydrocarbons (PAHs), their nitrogen analogs, and a number of oxygen‐containing POM compounds.
j A comprehensive review of toxicological quinoline studies was completed in 2006, concluding insufficient health effects data to derive an RfD. k UF = 1000 only for the chronic oral RfD – subchronic oral RfD UF = 300. l The cancer classification of Polychlorinated biphenyls (PCBs) is: B2 – Probable human carcinogen.
Sources:
IRIS database 2011 (available at http://cfpub.epa.gov/ncea/iris/index.cfm?fuseaction=iris.showSubstanceList)
IRISTrack 2011 (available at http://cfpub.epa.gov/ncea/iristrac/)

NationalAirToxicsProgramTheIntegratedUrbanStrategyReporttoCongress
R‐1
REFERENCESCITEDBaldauf,R;Fortune,C;Weinstein,J;Wheeler,M;Blanchard,F.(2006).Aircontaminant
exposuresduringtheoperationoflawnandgardenequipment[ResearchSupport,U.S.Gov't,Non‐P.H.S.].JExpoSciEnvironEpidemiol16:362‐370.http://www.ncbi.nlm.nih.gov/pubmed/16519412.
Baldauf,R;Thoma,E;Hays,M;Shores,R;Kinsey,J;Gullett,B;Kimbrough,S;Isakov,V;Long,T;Snow,R;Khlystov,A;Weinstein,J;Chen,FL;Seila,R;Olson,D;Gilmour,I;Cho,SH;Watkins,N;Rowley,P;Bang,J.(2008).Trafficandmeteorologicalimpactsonnear‐roadairquality:summaryofmethodsandtrendsfromtheRaleighNear‐RoadStudy[ResearchSupport,U.S.Gov't,Non‐P.H.S.].JAirWasteManagAssoc58:865‐878.http://www.ncbi.nlm.nih.gov/pubmed/18672711.
Baldauf,RW;Gabele,P;Crews,W;Snow,R;Cook,JR.(2005).Criteriaandair‐toxicemissionsfromin‐useautomobilesintheNationalLow‐EmissionVehicleprogram[ComparativeStudyResearchSupport,U.S.Gov't,Non‐P.H.S.].JAirWasteManagAssoc55:1263‐1268.http://www.ncbi.nlm.nih.gov/pubmed/16259421.
Bale,AS;Smothers,CT;Woodward,JJ.(2002).Inhibitionofneuronalnicotinicacetylcholinereceptorsbytheabusedsolvent,toluene.BritishJournalofPharmacology137:375‐383.http://www.ncbi.nlm.nih.gov/entrez/query.fcgi?cmd=Retrieve&db=PubMed&dopt=Citation&list_uids=12237258.
Bale,AS;Meacham,CA;Benignus,VA;Bushnell,PJ;Shafer,TJ.(2005).VolatileorganiccompoundsinhibithumanandratneuronalnicotinicacetylcholinereceptorsexpressedinXenopusoocytes.ToxicologyandAppliedPharmacology205:77‐88.http://www.ncbi.nlm.nih.gov/entrez/query.fcgi?cmd=Retrieve&db=PubMed&dopt=Citation&list_uids=15885267.
Bale,AS;Jackson,MD;Krantz,QT;Benignus,VA;Bushnell,PJ;Shafer,TJ;Boyes,WK.(2007).EvaluatingtheNMDA‐glutamatereceptorasasiteofactionfortoluene,invivo.ToxicolSci98:159‐166.http://www.ncbi.nlm.nih.gov/entrez/query.fcgi?cmd=Retrieve&db=PubMed&dopt=Citation&list_uids=17420219.
Bash,JO.(2010).Descriptionandinitialsimulationofadynamicbidirectionalair‐surfaceexchangemodelformercuryinCommunityMultiscaleAirQuality(CMAQ)model.JournalofGeophysicalResearch115:D06305.http://dx.doi.org/10.1029/2009JD012834.
Beasley,TE;Evansky,PA;Gilbert,ME;Bushnell,PJ.(2010).Behavioraleffectsofsubchronicinhalationoftolueneinadultrats.NeurotoxicolTeratol32:611‐619.http://www.ncbi.nlm.nih.gov/entrez/query.fcgi?cmd=Retrieve&db=PubMed&dopt=Citation&list_uids=20580818.
Beasley,TE;Evansky,PA;Bushnell,PJ.(2011).Behavioraleffectsofsub‐acuteinhalationoftolueneinadultrats.NeurotoxicolTeratol34:83‐89.http://www.ncbi.nlm.nih.gov/entrez/query.fcgi?cmd=Retrieve&db=PubMed&dopt=Citation&list_uids=22138552.
Benignus,VA.(2001).Quantitativecross‐speciesextrapolationinnoncancerriskassessment.RegulToxicolPharmacol34:62‐68.http://www.ncbi.nlm.nih.gov/entrez/query.fcgi?cmd=Retrieve&db=PubMed&dopt=Citation&list_uids=11502157.

NationalAirToxicsProgramTheIntegratedUrbanStrategyReporttoCongress
R‐2
Benignus,VA;Geller,AM;Boyes,WK;Bushnell,PJ.(2005a).Humanneurobehavioraleffectsoflong‐termexposuretostyrene:ameta‐analysis.EnvironmentalhealthperspectivesEnvironmentalHealthPerspectives113:532‐538.http://www.ncbi.nlm.nih.gov/entrez/query.fcgi?cmd=Retrieve&db=PubMed&dopt=Citation&list_uids=15866759.
Benignus,VA;Bushnell,PJ;Boyes,WK.(2005b).Towardcost‐benefitanalysisofacutebehavioraleffectsoftolueneinhumans.RiskAnalysis25:447‐456.http://www.ncbi.nlm.nih.gov/entrez/query.fcgi?cmd=Retrieve&db=PubMed&dopt=Citation&list_uids=15876216.
Benignus,VA;Coleman,T;Eklund,C;Kenyon,EM.(2006).Ageneralphysiologicalandtoxicokinetic(GPAT)modelforsimulatingcomplextolueneexposurescenariosinhumans.ToxicolMechMethods16:27‐33.
http://www.ncbi.nlm.nih.gov/pubmed/20021038.Benignus,VA;Boyes,WK;Kenyon,EM;Bushnell,PJ.(2007).Quantitativecomparisonsofthe
acuteneurotoxicityoftolueneinratsandhumans.ToxicolSci100:146‐155.http://www.ncbi.nlm.nih.gov/entrez/query.fcgi?cmd=Retrieve&db=PubMed&dopt=Citation&list_uids=17698514.
Benignus,VA;Boyes,WK;Geller,AM;Bushnell,PJ.(2009a).Long‐termperchloroethyleneexposure:ameta‐analysisofneurobehavioraldeficitsinoccupationallyandresidentiallyexposedgroups.JToxicolEnvironHealthA.72:824‐831.http://www.ncbi.nlm.nih.gov/entrez/query.fcgi?cmd=Retrieve&db=PubMed&dopt=Citation&list_uids=19557610.
Benignus,VA;Bushnell,PJ;Boyes,WK;Eklund,C;Kenyon,EM.(2009b).Neurobehavioraleffectsofacuteexposuretofoursolvents:meta‐analyses.ToxicolSci109:296‐305.http://www.ncbi.nlm.nih.gov/entrez/query.fcgi?cmd=Retrieve&db=PubMed&dopt=Citation&list_uids=19339666.
Benignus,VA;Bushnell,PJ;Boyes,WK.(2011).Estimatedrateoffatalautomobileaccidentsattributabletoacutesolventexposureatlowinhaledconcentrations.RiskAnalysis31:1935‐1948.http://www.ncbi.nlm.nih.gov/entrez/query.fcgi?cmd=Retrieve&db=PubMed&dopt=Citation&list_uids=21545625.
Bowler,RM;Harris,M;Gocheva,V;Wilson,K;Kim,Y;Davis,SI;Bollweg,G;Lobdell,DT;Ngo,L;Roels,HA.(2011).AnxietyaffectingparkinsonianoutcomeandmotorefficiencyinadultsofanOhiocommunitywithenvironmentalairbornemanganeseexposure.IntJHygEnvironHealth.215:393‐405.http://www.ncbi.nlm.nih.gov/pubmed/22112744.
Boyes,WK;Bercegeay,M;Krantz,T;Evans,M;Benignus,V;Simmons,JE.(2005).Momentarybrainconcentrationoftrichloroethylenepredictstheeffectsonratvisualfunction.ToxicolSci87:187‐196.http://www.ncbi.nlm.nih.gov/entrez/query.fcgi?cmd=Retrieve&db=PubMed&dopt=Citation&list_uids=15976185.
Boyes,WK;Moser,VC;Geller,AM;Benignus,VA;Bushnell,PJ;Kamel,F.(2007).Integratingepidemiologyandtoxicologyinneurotoxicityriskassessment.HumExpToxicol26:283‐293.http://www.ncbi.nlm.nih.gov/entrez/query.fcgi?cmd=Retrieve&db=PubMed&dopt=Citation&list_uids=17615109.
Bushnell,PJ;Oshiro,WM.(2000).Behavioralcomponentsoftolerancetorepeatedinhalationoftrichloroethylene(TCE)inrats.NeurotoxicologyandteratologyNeurotoxicologyandTeratology22:221‐229.

NationalAirToxicsProgramTheIntegratedUrbanStrategyReporttoCongress
R‐3
http://www.ncbi.nlm.nih.gov/entrez/query.fcgi?cmd=Retrieve&db=PubMed&dopt=Citation&list_uids=10758351.
Bushnell,PJ;Shafer,TJ;Bale,AS;Boyes,WK;Simmons,JE;Eklund,C;Jackson,TL.(2005).Developmentofanexposure‐dose‐responsemodelfortheacuteneurotxocityoforganicsolvents:Overviewandprogressoninvitromodelsanddosimetry.EnvironmentalToxicologyandPharmacology19:607‐614.
http://www.sciencedirect.com/science/article/pii/S1382668904002893.Bushnell,PJ;Boyes,WK;Shafer,TJ;Bale,AS;Benignus,VA.(2007a).Approachesto
extrapolatinganimaltoxicitydataonorganicsolventstopublichealth.Neurotoxicology28:221‐226.http://www.ncbi.nlm.nih.gov/entrez/query.fcgi?cmd=Retrieve&db=PubMed&dopt=Citation&list_uids=16684563.
Bushnell,PJ;Oshiro,WM;Samsam,TE;Benignus,VA;Krantz,QT;Kenyon,EM.(2007b).Adosimetricanalysisoftheacutebehavioraleffectsofinhaledtolueneinrats.ToxicolSci99:181‐189.http://www.ncbi.nlm.nih.gov/entrez/query.fcgi?cmd=Retrieve&db=PubMed&dopt=Citation&list_uids=17548890.
Cimorelli,AJ;Perry,SG;Venkatram,A;Weil,JC;Paine,RJ;Wilson,RB;Lee,RF;Peters,WD;Brode,RW.(2005).AERMOD:Adispersionmodelforindustrialsourceapplications.PartI:Generalmodelformulationandboundarylayercharacterization.JournalofAppliedMeteorologyandClimatology44:682‐693.
http://nldr.library.ucar.edu/repository/collections/PUBS‐000‐000‐001‐033.Cook,R;Phillips,S;Houyoux,M;Dolwick,P;Mason,R;Yanca,C;Zawacki,M;Davidson,K;
Michaels,H;Harvey,C;Somers,J;Luecken,D.(2011).AirqualityimpactsofincreaseduseofethanolundertheUnitedStates’EnergyIndependenceandSecurityAct.AtmosphericEnvironment45:7714‐7724.http://www.sciencedirect.com/science/article/pii/S1352231010007375.
Eversetal.(2011).GreatLakesMercuryConnections:TheExtentandEffectsofMercuryPollutionintheGreatLakesRegion.BiodiversityResearchInstitute.Gorham,Maine.ReportBRI2011‐18.44pages.http://www.briloon.org/uploads/hgconnections/glmc/GLMC_FinalReport.pdf.
Fulper,CR;Kishan,S;Baldauf,RW;Sabisch,M;Warila,J;Fujit,EM;Scarbro,C;Crews,WS;Snow,R;Gabele,P;Santos,R;Tierney,E;Cantrell,B.(2010).Methodsofcharacterizingthedistributionofexhaustemissionsfromlight‐duty,gasoline‐poweredmotorvehiclesintheU.S.fleet.JAirWasteManagAssoc60:1376‐1387.http://www.ncbi.nlm.nih.gov/pubmed/21141431.
George,BJ;Schultz,BD;Palma,T;Vette,AF;Whitaker,DA;Williams,RW.(2011).AnevaluationofEPA’sNational‐ScaleAirToxicsAssessment(NATA):ComparisonwithbenzenemeasurementsinDetroit,Michigan.45:3301‐3308.http://www.sciencedirect.com/science/article/pii/S1352231011002809.
Glen,G;Smith,L;Isaacs,K;McCurdy,T;Langstaff,J.(2008).Anewmethodoflongitudinaldiaryassemblyforhumanexposuremodeling[ResearchSupport,U.S.Gov't,Non‐P.H.S.].JExpoSciEnvironEpidemiol18:299‐311.http://www.ncbi.nlm.nih.gov/pubmed/17805233.
Graham,SE;McCurdy,T.(2004).Developingmeaningfulcohortsforhumanexposuremodels[ResearchSupport,U.S.Gov't,Non‐P.H.S.].JExpoAnalEnvironEpidemiol14:23‐43.http://www.ncbi.nlm.nih.gov/pubmed/14726943.

NationalAirToxicsProgramTheIntegratedUrbanStrategyReporttoCongress
R‐4
Hays,MD;Smith,ND;Kinsey,J;Dong,Y;Kariher,P.(2003).Polycyclicaromatichydrocarbonsizedistributionsinaerosolsfromappliancesofresidentialwoodcombustionasdeterminedbydirectthermaldesorption—GC/MS.JournalofAerosolScience34:1061‐1084.http://www.sciencedirect.com/science/article/pii/S0021850203000806.
Hays,MD;Beck,L;Barfield,P;Lavrich,RJ;Dong,Y;VanderWal,RL.(2008).Physicalandchemicalcharacterizationofresidentialoilboileremissions.EnvironSciTechnol42:2496‐2502.http://www.ncbi.nlm.nih.gov/pubmed/18504987.
Hays,MD;Gullett,B;King,C;Robinson,J;Preston,W;Touati,A.(2011).Characterizationofcarbonaceousaerosolsemittedfromoutdoorwoodboilers.EnergyFuels25:5632‐5638.http://dx.doi.org/10.1021/ef2012694.
HEI(2010).HealthEffectsInstitutePanelontheHealthEffectsofTraffic‐RelatedAirPollution.Traffic‐relatedairpollution:acriticalreviewoftheliteratureonemissions,exposure,andhealtheffects.HEISpecialReport.http://www.healtheffects.org.
Hutzell,WT;Luecken,DJ.(2008).FateandtransportofemissionsforseveraltracemetalsovertheUnitedStates.ScienceofTheTotalEnvironment396:164‐179.http://www.sciencedirect.com/science/article/pii/S0048969708001514.
Isaacs,K;Glen,G;McCurdy,T;Smith,L.(2008).Modelingenergyexpenditureandoxygenconsumptioninhumanexposuremodels:accountingforfatigueandEPOC[ResearchSupport,U.S.Gov't,Non‐P.H.S.].JExpoSciEnvironEpidemiol18:289‐298.http://www.ncbi.nlm.nih.gov/pubmed/17805234.
Isakov,V;Touma,JS;Burke,J;Lobdell,DT;Palma,T;Rosenbaum,A;Ozkaynak,H.(2009).Combiningregional‐andlocal‐scaleairqualitymodelswithexposuremodelsforuseinenvironmentalhealthstudies[ResearchSupport,U.S.Gov't,Non‐P.H.S.].JAirWasteManagAssoc59:461‐472.http://www.ncbi.nlm.nih.gov/pubmed/19418820.
Johnson,MM;Williams,R;Fan,Z;Lin,L;Hudgens,E;Gallagher,J;Vette,A;Neas,L;Özkaynak,H.(2010).Participant‐basedmonitoringofindoorandoutdoornitrogendioxide,volatileorganiccompounds,andpolycyclicaromatichydrocarbonsamongMICA‐Airhouseholds.AtmosphericEnvironment44:4927‐4936.http://www.sciencedirect.com/science/article/pii/S1352231010007016.
Karneretal.,(2010).Near‐RoadwayAirQuality:SynthesizingtheFindingsfromRealWorldData.Environ.Sci.Tech.,44(14),pp5334‐5344.http://yosemite.epa.gov/sab/sabproduct.nsf/ACD1BD26412312DC852577E500591B37/$File/EPA‐CASAC‐11‐001‐unsigned.pdf.
Kenyon,EM;Benignus,VA;Eklund,C;Highfill,JW;Oshiro,WM;Samsam,TE;Bushnell,PJ.(2008).Modelingthetoxicokineticsofinhaledtolueneinrats:influenceofphysicalactivityandfeedingstatus.JToxicolEnvironHealthA.71:249‐265.http://www.ncbi.nlm.nih.gov/entrez/query.fcgi?cmd=Retrieve&db=PubMed&dopt=Citation&list_uids=18253891.
Kim,Y;Bowler,RM;Abdelouahab,N;Harris,M;Gocheva,V;Roels,HA.(2011).MotorfunctioninadultsofanOhiocommunitywithenvironmentalmanganeseexposure.Neurotoxicology32:606‐614.http://www.ncbi.nlm.nih.gov/pubmed/21840336.
Kinsey,JS;Dong,Y;Williams,DC;Logan,R.(2010).PhysicalcharacterizationofthefineparticleemissionsfromcommercialaircraftenginesduringtheAircraftParticleEmissionseXperiment(APEX)1–3.AtmosphericEnvironment44:2147‐2156.http://www.sciencedirect.com/science/article/pii/S1352231010001159.
Kinsey,JS;Hays,MD;Dong,Y;Williams,DC;Logan,R.(2011).ChemicalcharacterizationofthefineparticleemissionsfromcommercialaircraftenginesduringtheAircraftParticle
NationalAirToxicsProgramTheIntegratedUrbanStrategyReporttoCongress
R‐5
EmissionseXperiment(APEX)1to3.EnvironSciTechnol45:3415‐3421.http://www.ncbi.nlm.nih.gov/pubmed/21428391.
Knighton,W.B.,etal.(2009).AircraftEngineSpeciatedOrganicGases:SpeciationofUnburnedOrganicGasesinAircraftExhaust,http://www.faa.gov/regulations_policies/policy_guidance/envir_policy/media/FAA‐EPA_TSD_Speciated%20OG_Aircraft_052709.pdf.
LakindJ.(2009),SMHays,LLAylward,DQNaiman.2009.PerspectiveonserumdioxinlevelsintheUnitedStates:anevaluationoftheNHANESdata.JofExpSciandEnvEpi19,435–441.http://www.ncbi.nlm.nih.gov/pubmed/18854873.
Lioy,PJ;Fan,Z;Zhang,J;Georgopoulos,P;Wang,SW;Ohman‐Strickland,P;Wu,X;Zhu,X;Harrington,J;Tang,X;Meng,Q;Jung,KH;Kwon,J;Hernandez,M;Bonnano,L;Held,J;Neal,J.(2011).PersonalandambientexposurestoairtoxicsinCamden,NewJersey[ResearchSupport,Non‐U.S.Gov'tResearchSupport,U.S.Gov't,Non‐P.H.S.].ResRepHealthEffInst3‐127;discussion129‐151.http://www.ncbi.nlm.nih.gov/pubmed/22097188.
Lorber,M.(2002).ApharmacokineticmodelforestimatingexposureofAmericanstodioxin‐likecompoundsinthepast,present,andfuture.ScienceoftheTotalEnvironment288:81‐95.http://www.ncbi.nlm.nih.gov/pubmed/12013550.
Luecken,DJ;Hutzell,WT;Gipson,GL.(2006).Developmentandanalysisofairqualitymodelingsimulationsforhazardousairpollutants.AtmosphericEnvironment40:5087‐5096.http://www.sciencedirect.com/science/article/pii/S1352231006000689.
Luecken,DJ;Cimorelli,AJ.(2008).Codependenciesofreactiveairtoxicandcriteriapollutantsonemissionreductions[ResearchSupport,U.S.Gov't,Non‐P.H.S.].JAirWasteManagAssoc58:693‐701.http://www.ncbi.nlm.nih.gov/pubmed/18512446.
Marsh,G.(1964).ManandNature;or,PhysicalGeographyasModifiedbyHumanAction.Cambridge,MA:BelknapPressofHarvardandUniversityPress.
McClenny,WA;Oliver,KD;Jacumin,HH,Jr.;Daughtrey,EH,Jr.;Whitaker,DA.(2005).24hdiffusivesamplingoftoxicVOCsinairontoCarbopackXsolidadsorbentfollowedbythermaldesorption/GC/MSanalysis‐laboratorystudies[ResearchSupport,U.S.Gov't,Non‐P.H.S.].JEnvironMonit7:248‐256.http://www.ncbi.nlm.nih.gov/pubmed/15735783.
McCurdy,T;Graham,SE.(2003).Usinghumanactivitydatainexposuremodels:analysisofdiscriminatingfactors.JExpoAnalEnvironEpidemiol13:294‐317.http://www.ncbi.nlm.nih.gov/pubmed/12923556.
Nam,E;Kishan,S;Baldauf,RW;Fulper,CR;Sabisch,M;Warila,J.(2010).Temperatureeffectsonparticulatematteremissionsfromlight‐duty,gasoline‐poweredmotorvehicles.EnvironSciTechnol44:4672‐4677.http://www.ncbi.nlm.nih.gov/pubmed/20465208.
NCEA.(2009).NCEApolicyandproceduresforconductingIRISpeerreviews.21.http://www.epa.gov/iris/pdfs/Policy_IRIS_Peer_Reviews.pdf.
NEPA(1969).NationalEnvironmentalPolicyActof1969;42U.S.C.§4321.http://ceq.hss.doe.gov/nepa/regs/nepa/nepaeqia.htm.
NESCAUM(2011).MassachusettsStateAnthropogenicMercuryEmissionsInventoryUpdate,NortheastStatesforCoordinatedAirUseManagement(NESCAUM),December2011.http://www.mass.gov/dep/toxics/stypes/08hginv.pdf.
NRC.(1983).RiskAssessmentintheFederalGovernment:ManagingtheProcess.Washington,DC.http://www.nap.edu/openbook.php?isbn=0309033497.

NationalAirToxicsProgramTheIntegratedUrbanStrategyReporttoCongress
R‐6
NRC.(2008).PhthalatesandCumulativeRiskAssessment:TheTaskAhead.Washington,DC:NationalAcademiesPress.http://www.nap.edu/openbook.php?record_id=12528&page=R1.
NRC.(2009).ScienceandDecisions:AdvancingRiskAssessment.Washington,DC:NationalAcademiesPress.http://www.nap.edu/openbook.php?record_id=12209&page=R1.
OhioEPA.(1999).ClevelandAirToxicsStudy.http://www.epa.state.oh.us/LinkClick.aspx?fileticket=ZfLjY5wX22Y%3D&tabid=2818.
Olson,DA;Hammond,DM;Seila,RL;Burke,JM;Norris,GA.(2009).Spatialgradientsandsourceapportionmentofvolatileorganiccompoundsnearroadways.AtmosphericEnvironment43:5647‐5653.http://www.sciencedirect.com/science/article/pii/S1352231009006499.
Oshiro,WM;Krantz,QT;Bushnell,PJ.(2001).Characterizingtolerancetotrichloroethylene(TCE):effectsofrepeatedinhalationofTCEonperformanceofasignaldetectiontaskinrats.NeurotoxicologyandTeratology23:617‐628.http://www.ncbi.nlm.nih.gov/entrez/query.fcgi?cmd=Retrieve&db=PubMed&dopt=Citation&list_uids=11792530
Oshiro,WM;Krantz,QT;Bushnell,PJ.(2007).Repeatedinhalationoftoluenebyratsperformingasignaldetectiontaskleadstobehavioraltoleranceonsomeperformancemeasures.NeurotoxicolTeratol29:247‐254.http://www.ncbi.nlm.nih.gov/entrez/query.fcgi?cmd=Retrieve&db=PubMed&dopt=Citation&list_uids=17175136.
Oshiro,WM;Kenyon,EM;Gordon,CJ;Bishop,B;Krantz,QT;Ford,J;Bushnell,PJ.(2011).Extrapolatingtheacutebehavioraleffectsoftoluenefrom1‐to24‐hexposuresinrats:rolesofdosemetricandmetabolicandbehavioraltolerance.ToxicolSci123:180‐192.http://www.ncbi.nlm.nih.gov/entrez/query.fcgi?cmd=Retrieve&db=PubMed&dopt=Citation&list_uids=21705712.
Rao,S,Pollack,A.,Lindhjem,C.(2004).Expandingandupdatingthemasterlistofcompoundsemittedbymobilesources‐PhaseIIIFinalReport.(EPA420/R‐06/005).EnvironInternationalCorporation.http://www.epa.gov/oms/regs/toxics/420r06005.pdf.
TheWhiteHouse.(2010).PresidentialMemorandumRegardingFuelEfficiencyStandards.Washington,D.C.:WhiteHouseBriefingRoom.http://www.whitehouse.gov/the‐press‐office/presidential‐memorandum‐regarding‐fuel‐efficiency‐standards.
Thoma,ED;Miller,MC;Chung,KC;Parsons,NL;Shine,BC.(2011).Facilityfence‐linemonitoringusingpassivesamplers.JAirWasteManagAssoc61:834‐842.http://www.ncbi.nlm.nih.gov/pubmed/21874954.
U.S.Census(2009).U.S.CensusBureau,CurrentHousingReports,SeriesH150/09,AmericanHousingSurveyfortheUnitedStates:2009,U.S.GovernmentPrintingOffice,Washington,DC,20401.Printedin2011.http://www.census.gov/housing/ahs/data/ahs2009.html.
U.S.EPA.(1986).Guidelinesforcarcinogenriskassessment(pp.38).(EPA/630/R‐00/004).Washington,D.C.:U.S.EnvironmentalProtectionAgency,RiskAssessmentForum.http://epa.gov/raf/publications/pdfs/CA%20GUIDELINES_1986.PDF.
U.S.EPA.(1993)MotorVehicle‐RelatedAirToxicsStudy.EmissionPlanningandStrategiesDivision,OfficeofMobileSources.(EPA/420/R‐93/005)http://www.epa.gov/otaq/regs/toxics/tox‐archive.htm.
U.S.EPA.(2000a).SupplementaryGuidanceforConductingHealthRiskAssessmentofChemicalMixtures(pp.1‐209).(EPA/630/R‐00/002).Washington,DC.http://www.epa.gov/ncea/pdfs/chem_mix/chem_mix_08_2001.pdf.
NationalAirToxicsProgramTheIntegratedUrbanStrategyReporttoCongress
R‐7
U.S.EPA.(2000b).TechnicalSupportDocument:ControlofEmissionsofHazardousAirPollutantsfromMotorVehiclesandMotorVehicleFuels.AssessmentandStandardsDivision,OfficeofTransportationandAirQuality.(EPA/420/R‐00/023).http://www.epa.gov/oms/regs/toxics/r00023.pdf.
U.S.EPA(2002a).HealthAssessmentDocumentforDieselEngineExhaust.(EPA/600/8‐90/057F).OfficeofResearchandDevelopment,WashingtonD.C.http://cfpub.epa.gov/ncea/cfm/recordisplay.cfm?deid=29060.
U.S.EPA(2002b),GuidelinesforEnsuringandMaximizingtheQuality,Objectivity,Utility,andIntegrityofInformationDisseminatedbytheEnvironmentalProtectionAgency,http://www.epa.gov/quality/informationguideloines/documents/EPA_InfoQualityGuidelines.pdf.
U.S.EPA.(2002c).Airtoxicsresearchstrategyexternalreviewdraft.(EPA/600/R‐00/056).Washington,D.C.http://www.epa.gov/ord/htm/documents/Air_Toxics.pdf.
U.S.EPA.(2002d).Areviewofthereferencedoseandreferenceconcentrationprocesses(pp.1‐192).(EPA/630/P‐02/002F).Washington,D.C.http://www.epa.gov/raf/publications/pdfs/rfd‐final.pdf.
U.S.EPA.(2003a).EPA'sAirToxicsResearchStrategyandAirToxicsMulti‐YearPlan.http://yosemite.epa.gov/sab/sabproduct.nsf/37032F555FC22E4F85256F2C006B6C00/$File/SAB‐05‐002_unsigned.pdf.
U.S.EPA.(2003b).FrameworkforCumulativeRiskAssessment.(EPA/630/P‐02/001F).Washington,D.C.http://www.epa.gov/raf/publications/pdfs/frmwrk_cum_risk_assmnt.pdf.
U.S.EPA.(2003c).ExposureandHumanHealthReassessmentof2,3,7,8‐Tetrachlorodibenzo‐p‐Dioxin(TCDD)andRelatedCompounds.UnitedStatesEnvironmentalProtectionAgency,OfficeofResearchandDevelopment,NationalCenterforEnvironmentalAssessment.NASReviewDraft.December,2003.EPA/600/P‐00/001C(a‐f).http://www.epa.gov/ncea/dioxin.htm.
U.S.EPA.(2004).EPA'sairtoxicsresearchstrategyandairtoxicsmulti‐yearplan:Areviewbytheairtoxicsresearchstrategyandmulti‐yearplanpanelofEPAScienceAdvisoryBoard.(EPA‐SAB‐05‐002).http://yosemite.epa.gov/sab/sabproduct.nsf/57D04C0AD870479285257038004FA638/$File/science_and_res_budgets_fy‐2006_sab‐adv‐05‐002.pdf.
U.S.EPA.(2005a).Guidelinesforcarcinogenriskassessment(pp.292).(EPA/630/P‐03/001F).Washington,D.C.:U.S.EnvironmentalProtectionAgency,RiskAssessmentForum.http://www.epa.gov/cancerguidelines/.
U.S.EPA.(2005b).Supplementalguidanceforassessingsusceptibilityfromearly‐lifeexposuretocarcinogens.(EPA/630/R‐03/003F).Washington,DC:U.S.EnvironmentalProtectionAgency,RiskAssessmentForum.http://www.epa.gov/cancerguidelines/guidelines‐carcinogen‐supplement.htm.
U.S.EPA.(2006a).ApproachesfortheApplicationofPhysiologicallyBasedPharmacokinetic(PBPK)ModelsandSupportingDatainRiskAssessment(pp.1‐123).(EPA/600/R‐05/043F).Washington,D.C.http://cfpub.epa.gov/si/si_public_record_report.cfm?dirEntryId=157668.
U.S.EPA(2006b).AnInventoryofSourcesandEnvironmentalReleasesofDioxin‐LikeCompoundsintheUnitedStatesfortheYears1987,1995,and2000.OfficeofResearchandDevelopmentEPA/600/P‐03/002F.November,2006.http://cfpub.epa.gov/ncea/CFM/recordisplay.cfm?deid=159286.

NationalAirToxicsProgramTheIntegratedUrbanStrategyReporttoCongress
R‐8
U.S.EPA(2007).ControlofHazardousAirPollutantsfromMobileSources;FinalRule.February26,2007.FederalRegister723(37):8428‐8570.
U.S.EPA.(2008a).CleanAirResearchMulti‐YearPlan2008‐2012(pp.1‐52).(EPA620/R‐08/001).ResearchTrianglePark,NC.http://www.epa.gov/ord/npd/pdfs/Air‐MYP‐narrative‐final.pdf.
U.S.EPA.(2008b).NationalEmissionsInventory,EmissionInventorySystemImplementationPlan.http://www.epa.gov/ttn/chief/net/neip/index.html.
U.S.EPA(2009).RiskandTechnologyReview(RTR)RiskAssessmentMethodologies:ForReviewbyEPA’sScienceAdvisoryBoardwithCaseStudies–MACTIPetroleumRefiningSourcesandPortlandCementManufacturing(EPA‐452/R‐09‐006).http://cfpub.epa.gov/si/si_public_record_report.cfm?dirEntryID=238928.
U.S.EPA.(2010a).AboutBenchmarkDoseApproach(BMDS).http://www.epa.gov/ncea/bmds/about.html(accessed7/19/2011).
U.S.EPA.(2010b).DevelopmentofaRelativePotencyFactor(RPF)ApproachforPolycyclicAromaticHydrocarbon(PAH)Mixtures(externalReviewDraft.(EPA/635/R‐08/012A).Washington,DC.http://cfpub.epa.gov/ncea/iris_drafts/recordisplay.cfm?deid=194584.
U.S.EPA.(2010c).MDHDPreamble.USEPAandtheUSDepartmentofTransportation.http://www.epa.gov/oms/climate/regulations/hd‐preamble‐regs.pdf.
U.S.EPA.(2010d,December7,2009).ReportontheEnvironment,AirToxicsEmissionsIndicators.http://cfpub.epa.gov/eroe/index.cfm?fuseaction=detail.viewInd&lv=list.listbyalpha&r=216616&subtop=341(accessedSeptember30,2011).
U.S.EPA.(2011a).CatRegSoftwareforCategoricalRegressionAnalysis.http://cfpub.epa.gov/ncea/cfm/recordisplay.cfm?deid=18162(accessed7/27/2011).
U.S.EPA.(2011b).DetroitMulti‐PollutantPilotProject:SummaryResults.InCleanAirResearchCenters(CLARCs)Kick‐Off.Durham,NC.
U.S.EPA.(2011c).AnOverviewofMethodsforEPA’sNational‐scaleAirToxicsAssessment.http://www.epa.gov/ttn/atw/nata2005/05pdf/nata_tmd.pdf(accessedMarch23,2011).
U.S.EPA.(2011d).Overview:PollutantsandPrograms.MobileSourceAirToxics.http://www.epa.gov/oms/toxics.htm#regs(accessed7/20/2011).
U.S.EPA.(2011e).Sustainability:Basicinformation.http://www.epa.gov/sustainability/basicinfo.htm#sustainability(accessed8/23/11).
U.S.EPA.(2012a).Air,climate,andenergy:Strategicresearchactionplan2012‐2016.Finaldraft.(EPA/601/R‐12/003).Washington,DC.http://yosemite.epa.gov/sab/sabproduct.nsf/a84bfee16cc358ad85256ccd006b0b4b/ad9f4d64737919c285257966004b53e1!OpenDocument&Date=2012‐03‐01.
U.S.EPA.(2012b).Humanhealthriskassessment:Strategicresearchactionplan2012‐2016.Finaldraft.(EPA/601/R‐12/007).Washington,DC.http://yosemite.epa.gov/sab/sabproduct.nsf/a84bfee16cc358ad85256ccd006b0b4b/ad9f4d64737919c285257966004b53e1!OpenDocument&Date=2012‐03‐01.
U.S.EPA.(2012c).Sustainableandhealthycommunities:Strategicresearchactionplan2012‐2016.Finaldraft.(EPA/601/R‐12/005).Washington,DC.http://yosemite.epa.gov/sab/sabproduct.nsf/a84bfee16cc358ad85256ccd006b0b4b/ad9f4d64737919c285257966004b53e1!OpenDocument&Date=2012‐03‐01.
U.S.FAA,U.S.EPA,(2009).RecommendedBestPracticeForQuantifyingSpeciatedOrganicGasEmissionsfromAircraftEquippedwithTurbofan,Turbojet,andTurbopropEngines,version1.0,

NationalAirToxicsProgramTheIntegratedUrbanStrategyReporttoCongress
R‐9
http://www.faa.gov/regulations_policies/policy_guidance/envir_policy/media/FAA‐EPA_RBP_Speciated%20OG_Aircraft_052709.pdf.
U.S.FAA,(2009).GuidanceforQuantifyingSpeciatedOrganicGasEmissionsfromAirportSources,version1.0,http://www.faa.gov/regulations_policies/policy_guidance/envir_policy/media/Guidance%20for%20Quantifying%20Speciated%20Organic%20Gas%20Emissions%20from%20Airport%20Sources.pdf.
Venkatram,A;Isakov,V;Seila,R;Baldauf,R.(2009).Modelingtheimpactsoftrafficemissionsonairtoxicsconcentrationsnearroadways.AtmosphericEnvironment43:3191‐3199.http://www.sciencedirect.com/science/article/pii/S1352231009002805.
Volckens,J;Braddock,J;Snow,RF;Crews,W.(2007).Emissionsprofilefromnewandin‐usehandheld,2‐strokeengines.AtmosphericEnvironment41:640‐649.http://www.sciencedirect.com/science/article/pii/S1352231006008673.
Volckens,J;Olson,DA;Hays,MD.(2008).Carbonaceousspeciesemittedfromhandheldtwo‐strokeengines.AtmosphericEnvironment42:1239‐1248.http://www.sciencedirect.com/science/article/pii/S1352231007009430.
Wesson,K;Fann,N;Morris,M;Fox,T;Hubbell,B.(2010).Amulti‐pollutant,risk‐basedapproachtoairqualitymanagement.AtmosphericPollutantResearch1:296‐304.http://www.atmospolres.com/articles/Volume1/issue4/APR‐10‐037.pdf.
Williams,R;Rea,A;Vette,A;Croghan,C;Whitaker,D;Stevens,C;McDow,S;Fortmann,R;Sheldon,L;Wilson,H;Thornburg,J;Phillips,M;Lawless,P;Rodes,C;Daughtrey,H.(2009).ThedesignandfieldimplementationoftheDetroitExposureandAerosolResearchStudy[ResearchSupport,U.S.Gov't,Non‐P.H.S.].JExpoSciEnvironEpidemiol19:643‐659.http://www.ncbi.nlm.nih.gov/pubmed/18941480.
ENDOFREPORT

NationalAirToxicsProgramTheIntegratedUrbanStrategyReporttoCongress
R‐1
UnitedStatesEnvironmentalProtectionAgency
OfficeofAirQualityPlanningandStandardsOutreachandInformationDivision
ResearchTrianglePark,NC
PublicationNo.EPA‐456/R‐14‐001August2014