national aeronautics and 1994 - nasa
TRANSCRIPT

National Aeronautics and
1994
= ::


ENSCO
Attributes and Acknowledgments:
NASA/KSC POC:
Dr. Frank Merceret, Chief, Applied Meteorology UnitTM-LLP-2A
Applied Meteorology Unit (AMU)
Mark M. Wheeler, Primary AuthorMichael K. AtchisonRobin S. Schumann
Greg E. TaylorJohn D. WarburtonAnn M. Yersavich
ii

ENSCO
Table Of Contents
Attributes and Acknowledgments: ..................................................................................................... ii
List of Figures .................................................................................................................................... v
List of Tables ................................................................................................................................... vii*oo
....................................... VIIIExecutive Summary .................................................................................
1.0 Introduction ................................................................................................................ 1
2.0 Data Preparation and Case Selection .......................................................................... 2
3.0 Data Analysis Procedures ........................................................................................... 4
64.0 Fog Climatology .........................................................................................................
4.1 General Fog Characteristics ....................................................................................... 6
4.2 Analysis of Fog Events (1986 - 1990) ...................................................................... 11
114.2.1 Analysis of the Fog Onset Times at TI'S .................................................................
4.2.2 Analysis of the Fog Dissipation Times .................................................................... 13
4.2.3 Analysis of the Wind Direction at Time of Fog Development ................................ 15
4.2.4 Analysis of the Advection Fog Events from the 36 Fog Cases ................................ 17
4.2.5 Analysis of Pre-Frontal Fog Events from the 36 Fog Cases .................................... 20
4.2.6 Analysis of Radiation Fog Events from the 36 Fog Cases ....................................... 22
4.3 Fog Forecast Indices ................................................................................................. 23
5.0 Forecasting Tools ..................................................................................................... 26
5.1 Meteorological Interactive Data Display System (MIDDS) McBasi Program ........ 26
5.2 Fog Forecasting Decision Trees ............................................................................... 30
6.0 Fog Precursors .......................................................................................................... 36
366.1 Fog Precursor Elements ............................................................................................
6.2 Fog Precursors Skill Scores ...................................................................................... 37
7.0 Summary and Recommendations ............................................................................. 39
7.1 Summary of Results ................................................................................................. 39
oo°
111

ENSCO
7.2
7.3
7.4
8.0
Conclusion ................................................................................................................ 41
Transition Utilities to Operational Use .................................................................... 41
Upgrade MESONET Wind Towers ......................................................................... 41
References ................................................................................................................ 43
APPENDIX A: Case Studies ........................................................................................................... 1
A. 1 Advection Case ........................................................................................................... 1
A.2 Pre-Frontal Case ........................................................................................................ 7
iv

ENSCO
Figure 3.1.
Figure 3.2.
Figure 4.1.
Figure 4.2.
Figure 4.3.
Figure 4.4.
Figure 4.5.
Figure 4.6.
Figure 4.7.
Figure 4.8.
Figure 4.9.
Figure 4.10.
Figure 4.11.
Figure 4.12.
Figure 4.13.
Figure 4.14.
Figure 4.15.
Figure 4.16.
Figure 4.17.
Figure 4.18.
Figure 4.19.
Figure 4.20.
List of Figures
Map of Central Florida ................................................................................................... 4
Location of the Kennedy Space Center/Cape Canaveral AFS Wind Towers ................ 5
Time of Fog Onset at Trs for the 36 Fog Events (Visibility less than 7 miles) .......... 11
Time of Fog Onset at TI'S for the 36 Fog Events (Visibility less than 5 miles) .......... 12
Fog Onset for the period 1986 - 1990 (Visibility less than 7 miles, 335 events) ......... 13
Fog Onset at Trs for the period 1986 - 1990 (Visibility less than 5 miles, 26713events) ..........................................................................................................................
Time of Fog Dissipation at T'I'S for the 36 Fog Events (Visibility less than 714
miles) ............................................................................................................................
Time of Fog Dissipation at TI'S for the 36 Fog Events (Visibility less than 5miles) ............................................................................................................................ 14
Time of Fog Dissipation at TI'S for the period, 1986 - 1990, (Visibility less than 7miles), 335 Fog Events ................................................................................................. 15
Time of Fog Dissipation at Trs for the period, 1986 - 1990, (Visibility less than 5miles) 267 Fog Events .................................................................................................. 15
Surface Wind Direction at Time of Fog Onset at Trs (Visibility less than 7 miles,
36 Fog Events) .............................................................................................................. 16
Surface Wind Speed at Time of Fog Onset at T'I'S ..................................................... 16
Wind Speed at the 492 foot Level at Tower 313 at Time of Fog Onset ...................... 17
Time of Fog Onset at Trs for the Advection Events ................................................... 18
Time of Fog Dissipation at TI'S for the Advection Events .......................................... 18
Surface Wind Direction at Time of Fog Onset at 'ITS for the Advection Events ....... 19
Surface Wind Speed at Time of Fog Onset at Trs for the Advection Events ............. 19
Time of Fog Onset at TI'S for the Pre-Frontal Events ................................................. 20
Time of Fog Dissipation at T'I'S for the Pre-Frontal Events ........................................ 21
Surface Wind Direction at Time of Fog Onset at Trs for the Pre-Frontal Events ...... 21
Surface Wind Speed at Time of Fog Onset at T'I'S for the Pre-Frontal Events ........... 22
Fog Stability Index (FSI) for All Events ...................................................................... 24
V

ENSCO
Figure 4.21.
Figure 4.22.
Figure 4.23.
Figure 5.1.
Figure 5.2.
Figure 5.3.
Figure 5.4.
Figure 5.5.
Figure 5.6.
Figure 5.7.
Figure 5.8.
Figure 5.9.
Calculated Values for FSI and FSI313 for 27 Events .................................................. 24
Fog Stability Index for Advection Events .................................................................... 25
Fog Stability Index for Pre-Frontal Events ................................................................. 25
Example of the McBasi Fog Precursor Graphic Display ............................................. 27
Example of McBasi Program FSI output ..................................................................... 28
Example of McBasi Program FSI313 output ............................................................... 28
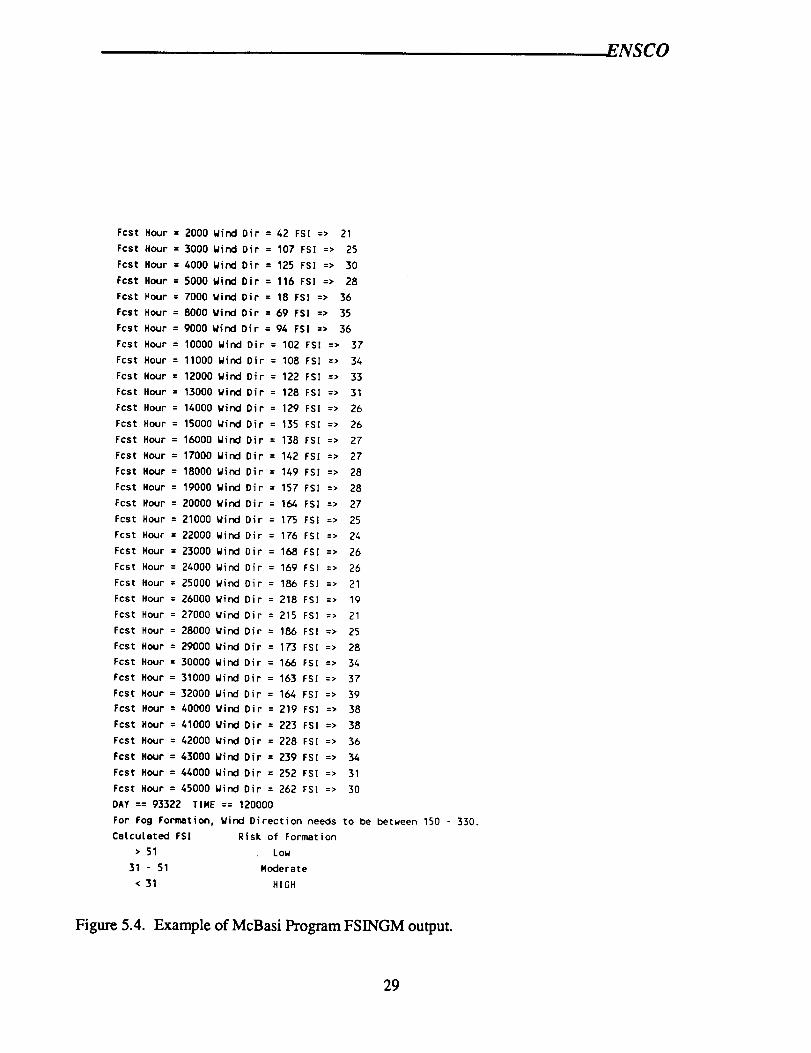
Example of McBasi Program FSINGM output ............................................................ 29
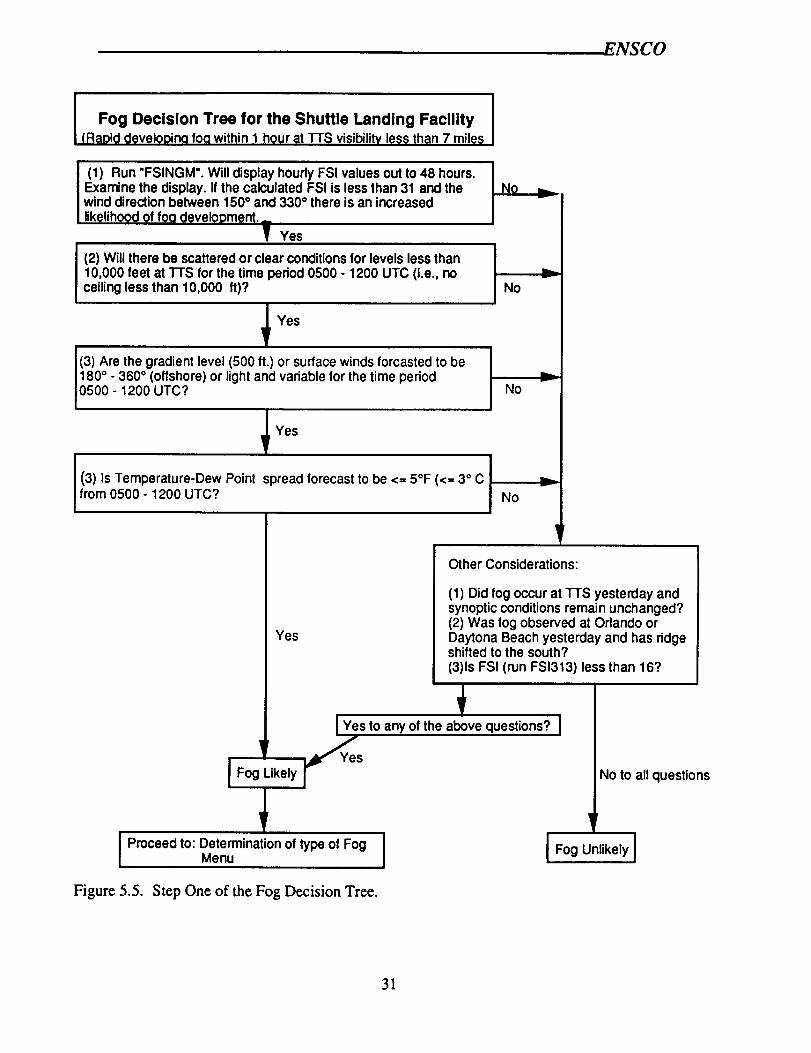
Step One of the Fog Decision Tree .............................................................................. 31
Step Two of the Fog Decision Tree (Type of Event) ................................................... 32
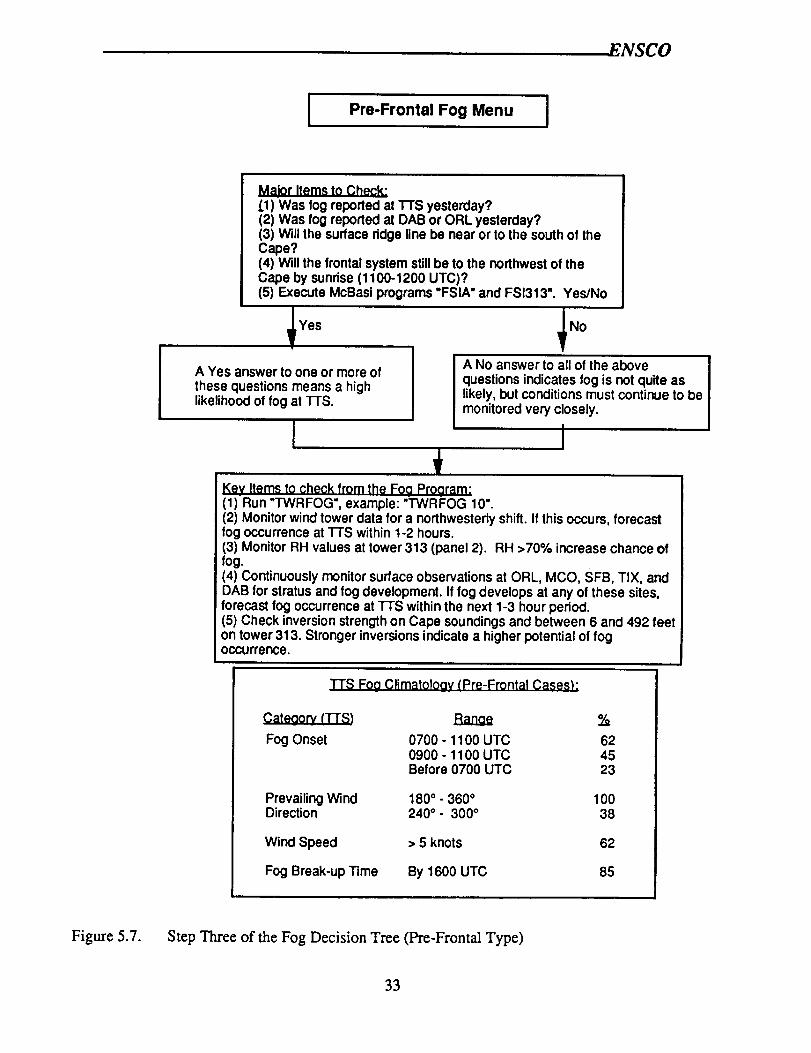
Step Three of the Fog Decision Tree (Pre-Frontal Type) ............................................ 33
Step Three of the Fog Decision Tree (Advection Type) .............................................. 34
Step Three of the Fog Decision Tree (Radiation Type) ............................................... 35
vi

F,NSCO
Table 4.1.
Table 4.2.
Table 4.3.
Table 6.1.
List of Tables
8Individual Fog Case Data ...............................................................................................
Fog Classification ........................................................................................................... 9
Fog Type Characteristics (Precursors) ......................................................................... 10
Precursor Contingency Table ......................................................................................... 38
vii

ENSCO
Executive Summary
The visibility rule in effect for all End of Mission (EOM) Space Transportation System(STS) landings at Kennedy Space Center (KSC) states: "The weather element limits contained inthis rule must be satisfied with observations at the GO/NO-GO decision time and with theforecast for landing time .... Restrictions to surface visibility include smoke, haze, fog, dust andclouds.. The 7 SM limit..." This rule was designed to protect against a visibility problemdeveloping unexpectedly within 90 minutes (i.e., after the de-orbit burn decision and before
landing). In order to enhance the weather community's understanding of the precursorsresponsible for fog development at the Shuttle Landing Facility ('I'q'S) and to develop tools toimprove fog forecasting skill in support of the Space Shuttle Program, the Applied MeteorologyUnit (AMU) developed a database of hourly surface observations from T'I'S and upper-airobservations from Cape Canaveral Air Force Station (CCAFS) for a five-year (1986-1990)period.
Once this database was completed, a comprehensive analysis was performed. All fog eventswithin the period were identified, and the onset and dissipation times were determined for eachfog event. In addition, a detailed analysis was performed on 36 'ITS fog events characterized byrapid deterioration of visibility, As part of that analysis the fog events were categorized as eitheradvection, pre-frontal or radiation. As a result of these analyses, the AMU developed a fogclimatological database, identified fog precursors and developed forecaster tools and decisiontrees.
The fog climatological analysis indicates that during the fog season there is higher risk for avisibility violation at KSC during the early morning hours (0700 to 1200 UTC), while 95% of allfog events have dissipated by 1600 UTC. A high number of fog events are characterized by awesterly component to the surface wind at KSC (92%) and 83% of the fog events had fogdevelop west of KSC first (up to 2 hours) as reported at Orlando and Daytona Beach.
A major goal of the study was to identify fog precursors that could be used up to 12 hours inadvance. To address this the AMU developed fog decision trees and forecaster tools andutilities. Using the decision trees as process tools ensures the important meteorological data arenot overlooked in the forecast process. Using the tools and utilities, key fog precursors can bemonitored and evaluated out to 48 hours. Then by monitoring the low level precursors using theutilities developed by the AMU, the forecaster can monitor and observe the trends in the 54 footlocal tower wind flow (westerly flow increase chance for fog formation), the low level inversionfrom 6 to 492 feet (the stronger the inversion the better the chance for fog formation), and therelative humidity values at tower 313 from 54 to 492 feet (relative humidity reading at or above70% are needed for fog formation at KSC).
Key results from the analyses performed in this study are:
Many precursors associated with fog development such as low level inversion, localtower wind flow at the 54 foot level (westerly flow), and low level moisture (up to300 feet) can be monitored using existing sensor networks.
Using decision trees and utilities for monitoring key elements of the local data sets,the forecaster can monitor environmental conditions and forecast the likelihood of
visibility restrictions due to fog or stratus.
,°°
Vlll
ENSCO
A high number (92%) of the fog events analyzed show a westerly component to thesurface wind. In many events, a westerly shift in the winds is apparent in the wind
tower data prior to the fog development.
• For the advection and pre-frontal events, 83% of the events had fog develop in theOrlando to Daytona Beach area up to 2 hours prior to development at "ITS.
The primary onset time for fog development at "ITS is between 0700 to 1200 UTC.Almost 95% of all fog events had dissipated (visibility improved to 5 miles or
greater) by 1600 UTC and 75% of the cases improved by 1400 UTC.
• A low level inversion at or below 500 feet is generally present.
• Fog can develop even in the presence of strong winds at 492 feet above the surface.In these cases, the top of the inversion would be below 500 feet.
The vast majority of the rapid visibility deterioration events occurring between 1986and 1990 were either pre-frontal or advection fog events. Only two of the eventswere associated with radiational cooling.
With these tools and a better understanding of fog formation in the local KSC area, the
Shuttle weather support forecasters should be able to give the Launch and Flight Directors a
better KSC fog forecast with more confidence.
Briefly, the recommendations from the rapidly developing fog evaluation are:
• Transition the fog decision trees and fog forecasting utilities to operational use.
• Upgrade the MESONET wind towers by installing up to 4 visibility sensors ontowers west of the Banana River.
ix

ENSCO
1.0 Introduction
The work described in this report was performed under the National Aeronautics and SpaceAdministration (NASA) Applied Meteorology Unit (AMU) Task 003. The purpose of this taskis to develop data bases, analyses, and techniques leading to the improvement of the 90-minuteforecasts made for Space Shuttle Program (SSP) landing facilities in the continental UnitedStates and at the Trans-Atlantic (TAL) sites. The sub task addressed in this report concerns fogdevelopment that would affect the less than 7-statute mile visibility rule for End-Of-Mission(EOM) Shuttle landings at Kennedy Space Center (KSC) (Rule 4-64(A)). The rule states thefollowing:
"The weather element limits contained in this rule must be satisfied withobservations at the GO/NO-GO decision time and with the forecast for landing time ....Restrictions to surface visibility include smoke, haze, fog, dust and clouds. The 7 SM
limit is the horizontal distance component from the runway threshold that correlates tothe l Ok feet altitude point on the outer glide slope." (Johnson Space Center, 1991).
The AMU's work under this sub task is to:
1. Develop a data base for study of fog associated weather conditions relating toviolations of this landing constraint;
2. Develop forecast techniques or rules-of-thumb to determine whether or not currentconditions are likely to result in an acceptable condition at landing;
3. Validate the forecast techniques; and
4. Transition techniques to operational use.
The results of the Shuttle Flight Rule Workshop on Fog, held on 20 January 1988 (NASAJohnson Space Flight Center, 1988) were reviewed for this report. One of the main questionsasked at the workshop was "Can a statement 95% or better confidence be made if a seven plusmile visibility forecast is made for landing prior to de-orbit?". The workshop participantsunanimously agreed, "that a reliable 1 1/2 hour forecast of no fog violation of visibilityconstraints in rule 4-64(A) at the landing site area could be made with current forecastingtechnology and measurements / observational systems being employed for support of the SpaceTransportation System operations regardless of seasonal or daily variations."
However, the requirement to issue a 95% confidence no fog forecast causes a high falsealarm rate in positive fog forecasts. It is anticipated the enhanced understanding of fogdevelopment in the Cape Canaveral vicinity along with the forecasting aids resulting from thisinvestigation will reduce the false alarm rate for positive fog forecasts at the Shuttle LandingFacility.
This report is organized as follows: Section 2.0 describes the data base used to organize thesurface and rawinsonde data and the procedures employed to prepare the data for analysis.Section 3.0 describes the analysis procedures applied to each of the selected 36 events. Section4.0 discusses the results of the overall fog climatology analysis. Section 5.0 describes thedevelopment of the fog forecasting utility tools. Section 6.0 presents the preliminary fogforecast rules and skill scores for the fog precursors. Section 7.0 contains the summary and therecommendations from this study. Finally, Appendix A presents two case studies for two of thethree types of fog events.

ENSCO
2.0 Data Preparation and Case Selection
For this investigation, the fog season for Cape Canaveral was defined as beginning October 1and ending April 30. Though fog occurs during other parts of the ye___, t_s p.eriod, has .thehighest number of fog occurrences at TTS (Shuttle Landing Facility or _t.a_). tJunng, m.ls pc.noothe sunrise varies by 67 minutes from 1209 UTC to 1102 UTC. Since the sunrise vanauon is nottoo large, the compositing of key elements from each fog event is based on UTC time instead ofsunrise time.
This study made extensive use of the surface data base developed for the AMU Two TenthsCloud Cover Study (Atchison, 1993). This data base includes hourly surface observations (nospecial observations) from TFS and upper-air observations from the Cape Canaveral Air ForceStation (CCAFS) rawinsonde site (74794) for the five year period, 1986 to 1990. dBase IV wasselected to store and process the data.
The TTS surface data were obtained from the Marshall Space Flight Center (MSFC). Upper-air observations were obtained from the Computer Sciences Raytheon (CSR) MeteorologySection and from the USAF Environmental Technical Applications Center (ETAC). Other dataobtained to augment the cloud cover data base included local wind tower observations fromKSC/CCAFS; surface data for Daytona Beach (DAB), Orlando (MCO and ORL), Patrick AFB(COF), Melbourne (MLB), Vero Beach (VRB) and Avon Park (AGR); and upper air data for thesoutheastern United States. The local wind tower data were obtained from KSC/CCAFS and thesurface and upper air observations were obtained from the National Climatic Data Center.
In addition to the data on electronic media, hard copies of surface observations on Forms 10aand 10b, and the Daily Weather Map weekly series were also used in this analysis. These formswere obtained from the 45th Weather Squadron, National Climatic Data Center, and ENSCO,Inc.
Key weather elements available for analysis from the surface observations include:
• Ceiling Height • Wind Speed• Present Weather • Wind Direction• Sea-level Pressure • Temperature• Visibility • Total Cloud Cover
• Cloud Amounts• Dew Point Temperature• Cloud Heights
This study focused on rapidly developing fog and/or stratus that developed between decisionmatime and landing that would result " violation of the SSP Flight Rule 4-64(A). This was
defined as fog and/or stratus that developed within one hour at Trs, reducing the visibility to 7statute miles or less and/or a ceiling developed below 2500 feet within the hour. A two stepprocess was used to identify the rapidly developing fog events which met the above criteria
First, all events which satisfied the following criteria were identified:
• Fog and/or stratus having a ceiling less than 2500 feet and/or visibility less than 7statute miles due to fog at Trs, between the hours of 0500 and 1600 UTC.
This query identified 172 cases within the five year data period. The 172 events weremanually reviewed by using the Trs Form 10's and reduced to 36 cases that are representativeof the challenging EOM fog forecast at KSC (i.e., onset of fog is coincident with the rapiddeterioration of visibility). These 36 fog event cases were analyzed in detail from the surface upto 500 mb and the knowledge gleaned from these cases was used to develop the fog precursor
2

ENSCO
criteria, analyze the Air Force developed Fog Stability Index (FSI) and develop the fog forecastdecision trees.
Space Shuttle Program Flight Rule (4-64) also states that 5 statue miles can be used as theGo/No-Go decision visibility constraint when the Precision Approach Path Indicators (PAPI's)are visible and forecast to remain visible and if a weather reconnaissance aircraft is available(which is generally the case). Consequently, the complete 5 year data base was also analyzed todetermine the onset and dissipation times for all fog events using both 5 and 7 miles as theselection criteria. The results of these queries are presented in Section 4, Fog Climatology, andwill allow the forecaster to compare differences in the fog onset and dissipation times for the twovisibility criteria.
3


ENSCO
3.0 Data Analysis Procedures
The goal of the analysis was to determine local synoptic and mesoscale conditions favoringdevelopment of fog at "ITS. This was accomplished by analyzing the conditions over thesoutheastern United States with emphasis on central Florida from the surface to 500 rob.
Analyses were performed for the event day as well as plus and minus one day. Case filesconsisted of the upper air analyses for 500, 700, and 850 mb for each 12-hour period, surfaceanalysis maps from the Daily Weather Map series and the surface weather observations fromDaytona Beach, Orlando, Titusville, Patrick AFB, Melbourne, Vero Beach, and Avon Park.
Figure 3.1 illustrates the location of these stations throughout central Florida.
)
DAB= Daytona Beach, MCO= Orlando, 'ITS= Shuttle Landing Facility, COF= Patrick AFBMLB= Melbourne, VRB= Vero Beach, AGR= Avon Park
Figure 3.1. Map of Central Florida
The first step in the analysis was to develop a complete synoptic summary of each case.This included analyses of both surface and upper air data. The upper air analyses focused onidentification of all relevant pressure, thermal, wind, and moisture features from 500, 700, and850 mb over the southeastern United States. The surface analyses highlighted the placement and
movement of fronts and temperature and moisture patterns across Florida. In addition, timeseries of cloud cover, surface visibility, temperature, dew point, and wind were generated foreach central Florida surface observation site. These time series identified the onset time when
each station's visibility decreased to less than 7 miles with fog.
4


ENSCO
The next step was to develop a surface analysis trend package for each case. By using thesurface Form 10a's from each of the 9 surface stations, a detailed surface analysis of centralFlorida was created and analyzed at least for every three hours and, where necessary, for eachhour. These surface analyses were developed for the day preceding each analyzed fog eventthrough the event. A total of over 600 surface weather charts were plotted and analyzed. Adetailed surface analysis summary for each fog case was also generated. The summaries
consisted of a synoptic and mesoscale analysis along with a description of the precursors or keyinformation for each case.
In addition to the synoptic surface data, local rawinsonde and tower data (See Figure 3.2 forlocation of towers) were analyzed for each case. The local rawinsonde analysis focused on thestrength of the low level inversion and the moisture distribution. The local wind tower data
analysis focused on the low level wind flow and its change with time.
In addition to the detailed analysis of the 36 case studies, the complete 5 year data base wasqueried to identify every fog event day using two different selection criteria. The first queryidentified all days characterized by visibility less than 7 miles due to fog. The fog onset anddissipation times as well as predominant wind flow were determined for the 352 fog eventsidentified by the fLrst selection criteria. The second query identified all fog days at 'ITS with
visibility less than 5 miles. As with the data from the first query, the fog onset and dissipationtimes as well as predominant wind flow were determined for the 280 fog events identified by thesecond selection criteria. The results of these two analyses are presented in Section 4, FogClimatology.
2016
• 1612
e12.
• 1609
• 22O2
Figure 3.2. Location of the Kennedy Space Center/Cape Canaveral AFS Wind Towers

4.0 Fog Climatology
The topography of the Cape Canaveral vicinity is an important factor in the development offog at Trs. The numerous large water bodies play an important role in the development of localthermally-driven circulations and also serve as sources of low-level moisture, both important to
fog development. Consequently, knowledge of the Cape Canaveral topography is required tofully understand the fog climatology of the local area.
KSC and CCAFS are almost totally surrounded by large bodies of water with the AtlanticOcean on the east, the Banana River in-between and the Indian River to the west (See Figure
3.2). The land consists of sandy soil covered with heavy growths of low palmetto andbrushwood vegetation in undeveloped areas. The land rises from sea level to 10 to 20 feet in
undulating sand dunes falling away to mangrove swamp at the Banana River. The surroundingsare primarily typical fiat Florida table land. It is composed of large areas of lakes (Poinsett tothe north, Winder in the middle and Washington to the southwest) and rivers (St. Johns about 12miles to the west), marshes, orchards, and timber land. Between the CCAFS and the St. JohnsRiver lie the Banana and Indian rivers which are not rivers in the traditional sense but are
saltwater lagoons with no discernible flow other than tidal variations. Depths range from lessthan a foot in the marshy shallows to approximately 30 feet in the main channels.
The relatively flat terrain and the numerous land and water interfaces have significant effects
upon local weather conditions. The numerous water bodies provide additional sources of lowlevel moisture. If the surface pressure gradient is weak, the early morning surface temperaturedifferences between the land and the Atlantic Ocean drive a land breeze circulation. During the
winter and early spring months, the direction of the land breeze ranges from southwest to
northwest with speeds of 5 to 7 knots.
4.1 General Fog Characteristics
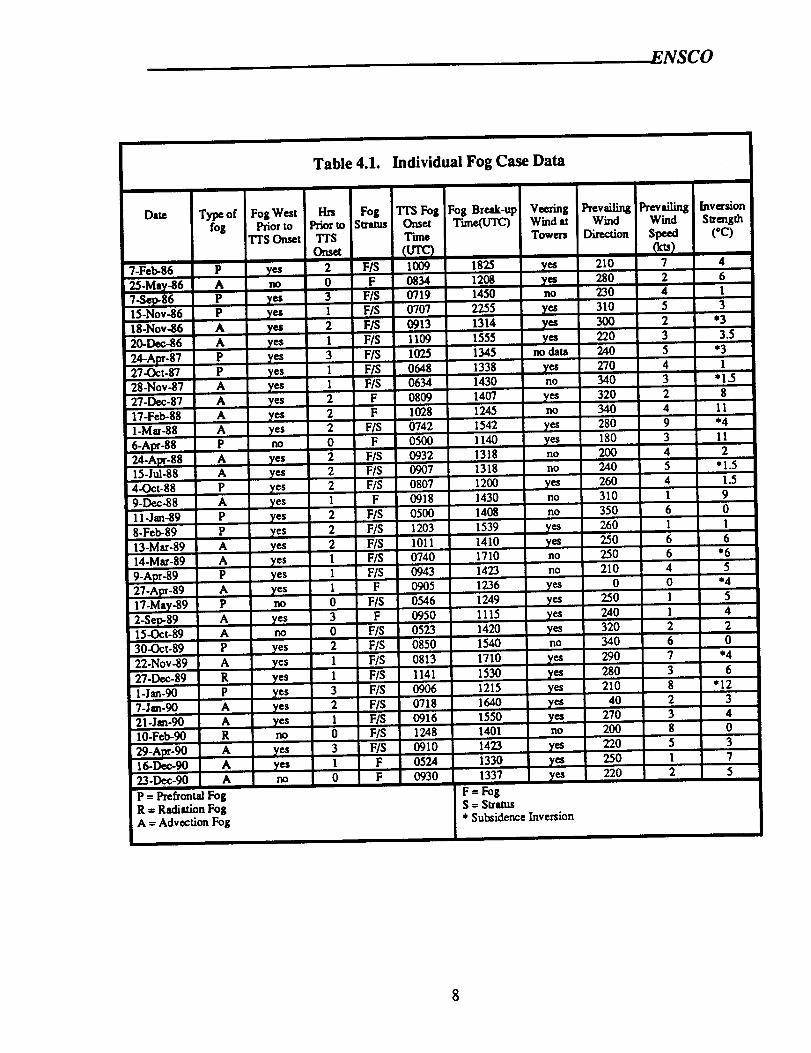
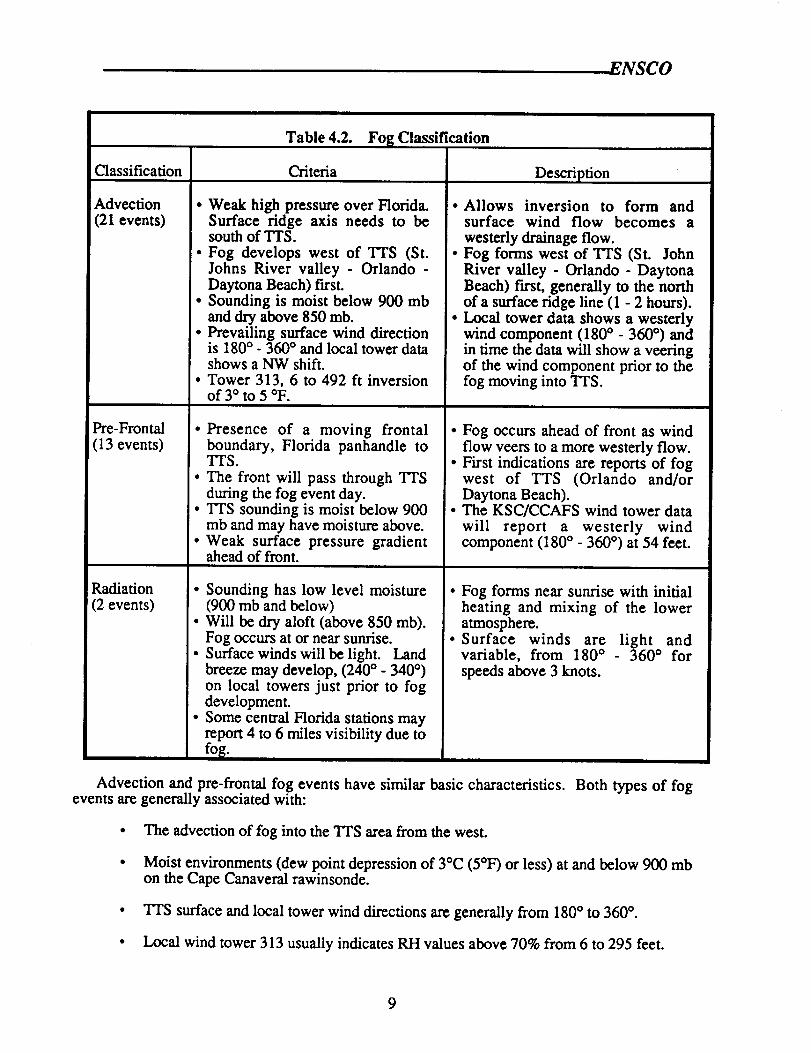
Although only 36 events over a 5-year period were analyzed (Table 4.1), some importanttrends in fog formation were noted. The fog events fell into three categories: advection, pre-frontal, and radiation. Category definitions are listed in Table 4.2.
The typical advection fog event is characterized by fog developing west of TI'S, sometimesover to Orlando or north toward the Daytona Beach area, generally to the north of a surface ridgeline. The low level relative humidity as indicated by tower 313 is greater than 70% from surface
up to 295 feet. The surface wind directions reported by the tower network are generallywesterly, 180-360 ° and, in time, gradually veer to a more northwesterly direction prior to the fog
moving into TTS. This report includes 21 of these cases.
Pre-frontal fog events are very similar to the advection fog events. A pro-frontal event is
characterized by a slight veering in the surface winds from southwest to west-northwest as thefront moves closer to TI'S. In many of the events, a weak surface ridge moves south of the CapeCanaveral area several hours before the fog moves into "ITS. This report includes 13 of these
cases.
Some general statements can be made about radiation fog based on climatology (CapeCanaveral Forecast Facility, Terminal Forecast Reference Notebook) (45th Weather Squadron,1988), and this study. Radiation fog generally forms near sunrise (the time of occurrence of thetwo radiational fog events in the study are 1141 UTC and 1248 UTC). Surface winds are
typically light (3 to 5 knots) and variable. If fog develops when the speed is at or above 3 knots,the direction is generally from 180 ° to 360 °. The Cape Canaveral or Tampa rawinsonde data
_NSCO
typically indicate low level moisture (at or below 900 mb) and dry air aloft. This report includes2 of these cases.
Some general characteristics of fog formation (i.e., moisture distribution, low level mixing,etc.) are also given. All local fog precursors and key points are stated in Section 8.0 Summaryand Recommendations.
7
ENSCO
Table 4.1. Individual Fog Case Data
Da_ Type of Fog West Hrsfog Prior to Prior to Stratus Onset
7-Feb-86 P
25-May-86 A
7-Sep-86 P15-Nov-86 P
18-Nov-86 A
20-Dec-86 A
24-Apt-87 P27-Oct-87 P
28-Nov-87 A27-Dec-87 A
17-Feb-88 A
L-Mar-88 A
6-Apt-88 P
24-Apt-88 A15-Jul-88 A4-Oct-88 P
9-Dec-88 A
11-Jan-89 P
8-Feb-89 P
13-Mar-89 A
14-Mar-89 A
9-Apt-89 P
27-Apt-89 A17-May-89 P
2-Sep-89 A15-Oct-89 A
30-0ct-89 P
22-Nov-89 A
27-Dec-89 R
l-Jan-90 P7-J_t-90 A
21-Jm-90 A10-Feb-90 R
29-Apt-90 A16-Dec-90 A
23-Dec-90 A
p = Pre_omal Fog
R = Radiation FogA = Advecfion Fog
Trs Onset 'ITS Time
Itrr9yes 2 FIS 1009no 0 F 0834
yes 3 FIS 0719
yes 1 FIS 0707
yes 2 FIS 0913
yes 1 FIS 1109
yes 3 F/S 1025yes 1 FIS 0648
yes 1 F/S 0634
yes 2 F 0809
yes 2 F 1028
yes 2 F/S 0742no 0 F 0500
yes 2 F/S 0932
yes 2 F/S 0907
yes 2 FIS 0807
yes 1 F 0918
yes 2 F/S 0500
yes 2 F/S 1203
yes 2 F/S 1011
yes 1 FIS 0740
yes 1 F/S 0943
yes 1 F 0905no 0 F/S 0546
yes 3 F 0950no 0 FIS 0523
yes 2 F/S 0850
yes 1 F/S 0813
yes 1 F/S 1141
yes 3 F/S 0906
yes 2 FIS 0718
yes 1 F/S 0916no 0 FIS 1248
yes 3 F/S 0910
yes 1 F 0524
, no I 0 F 0930
Fog TrS Fog Fog Break-up Veering Prevailing Prevailing InvezsionTime(UTC) Wind at Wind Wind Strength
Tow=s Direction Speed (*C)
7 4
2 64 1
5 3
2 *3
3 3.5
240 5 *3
270 4 1
340 3 "1.5
320 2 8
1825 yes 210
1208 yes 2801450 no 230
2255 yes 310
1314 yes 300
1555 yes 2201345 no data
1338 yes1430 no
1407 yes1245 no 340
1542 yes 2801140 yes 180 3 111318 no 200 4 2
1318 no 240 5 "1.5
1200 yes 260 4 1.5
1430 no 310 1 9
1408 no 350 6 0
1539 yes 260 1 1
1410 yes 250 6 61710 no 250 6 *6
1423 no 210 4 5
1236 yes 0 0 *4
1249 yes 250 1 5
1115 yes 240 1 4
1420 yes 320 2 2
1540 no 340 6 0
1710 yes 290 7 *4
1530 yes 280 3 6
1215 yes 210 8 "121640 yes 40 2 3
1550 yes 270 3 41401 no 200 8 0
1423 yes 220
1330 yes 250
1337 _es 220
F=FogS = Stratus
* SubsidenceInversion
4 11
9 *4
5 3
1 7
2 5
ENSCO
Table 4.2. Fog Classification
Classification
Advection
(21 events)
Pre-Frontal
(13 events)
Radiation
(2 events)
Criteria
• Weak high pressure over Florida.Surface ridge axis needs to besouth of Trs.
• Fog develops west of TTS (St.
Johns River valley - Orlando -Daytona Beach) first.
• Sounding is moist below 900 mb
and dry above 850 mb.• Prevailing surface wind direction
is 180 ° - 360 ° and local tower datashows a NW shift.
• Tower 313, 6 to 492 ft inversionof 3 ° to 5 °F.
• Presence of a moving frontalboundary, Florida panhandle to"lq'S.
• The front will pass through Trsduring the fog event day.
• "I'I'S sounding is moist below 900mb and may have moisture above.
• Weak surface pressure gradientahead of front.
• Sounding has low level moisture(900 mb and below)
• Will be dry aloft (above 850 mb).Fog occurs at or near sunrise.
• Surface winds will be light. Landbreeze may develop, (240 ° - 340 °)
on local towers just prior to fogdevelopment.
• Some central Florida stations mayreport 4 to 6 miles visibility due to
fo_:.
Description
• Allows inversion to form andsurface wind flow becomes a
westerly drainage flow.• Fog forms west of TI'S (St. John
River valley - Orlando - DaytonaBeach) first, generally to the northof a surface ridge line (1 - 2 hours).
• Local tower data shows a westerlywind component (180 ° - 360 °) and
in time the data will show a veeringof the wind component prior to thefog moving into TI'S.
• Fog occurs ahead of front as wind
flow veers to a more westerly flow.• First indications are reports of fog
west of TTS (Orlando and/orDaytona Beach).
• The KSC/CCAFS wind tower data
will report a westerly windcomponent (180 ° - 360 °) at 54 feet.
• Fog forms near sunrise with initialheating and mixing of the loweratmosphere.
• Surface winds are light andvariable, from 180 ° 360 ° for
speeds above 3 knots.
Advection and pre-frontal fog events have similar basic characteristics. Both types of fogevents are generally associated with:
• The advection of fog into the Trs area from the west.
• Moist environments (dew point depression of 3°C (5°1=) or less) at and below 900 mbon the Cape Canaveral rawinsonde.
• 'VI'S surface and local tower wind directions are generally from 180 ° to 360 °.
• Local wind tower 313 usually indicates RH values above 70% from 6 to 295 feet.
9

ENSCO
The main differences between advection and pre-frontal fog events are:
Moisture above 850
• . Prefrontal may be moist (temperature - dew point spread of 3°C (5°F) or less)above the low levels due to the advection of clouds ahead of the front.
• . Advection generally associated with dry conditions (temperature - dew point
spread of 5°C or more) above 850 rob.
Fog development area
• . The fog development area for advection fog is generally just west of TrS (theSt. Johns River basin). However, the fog development area is related to thelocation of the surface ridge axis and can be further west or north of TI'S (e.g.
towards Orlando or Daytona Beach).
• . The fog development area for prefrontal fog depends upon the location of thefront at fog formation time. The fog development area is generally to thenorthwest of "ITS, but can be near Orlando or Daytona Beach.
Key similarities and differences between the fog types are illustrated in Table 4.3.
Table 4.3.
Fog CharacteristicMoist (Dew point
depression <= 3 ° C (5°I:))below 900 mb On
$oundin_
Moist (Relative Humidity> 70% ) from surface to295 feet on tower 313
Dry (Dew pointdepression > 5 ° C (9°F))above 850 mb
Frontal system in areaSurface dew point
depression of 0-5°F
(0-3°C)Local wind towersindicate direction between
180-360 ° (tower data)
Fog advects over TTSfrom the west
Fo_ T_'pe Characteristics (Precursors)Advection Pre-Frontal
q q
q
q
,/
q q
q
q
q
q
Radiation
q
,/
q
,/
10

ENSCO
4.2 Analysis of Fog Events (1986 - 1990)
The followingsections(4.2.1through 4.2.6)presentthe resultsof the detailedanalysesof the
36 fog cases.Also includedin thesesectionsare theresultsof the fog onset and dissipationtimeanalysis for allfog cases during the 5 year period. Throughout thissection the following
symbols willrepresentthedefineddatasets:
• 5-mile36-Visibilitylessthan 5 miles forthe 36 case study events.
• 7-mile36. Visibilitylessthan7 miles forthe 36 case fog events.
• 5-mile_u- Visibilitylessthan5 miles forallfog cases.
• 7-mile_- Visibilitylessthan7 miles for allfog cases.
4.2.1 Analysis of the Fog Onset Times at TTS
Figures 4.1 and 4.2 present the initial time when the Trs visibility dropped below 7 and 5statute milcs, respectively, for the 36 fog events. Part of the similarity in the distribution of fogonset times can be attributed to criteria used to select the 36 fog events (rapidly developing fog,see Section 2). The visibility at TTS for a majority of these events was less than 5 miles on thefirst report of fog development. Thercfore, the fog onsct time for the two different criteria wasthe same. In 30 of the 36 cases fog developed between 0800 and 1300 UTC. In addition, thedata indicate fog onset times for prcfrontal fog were fairly evenly distributed throughout the timeperiod. However, the frequency of fog onset for advection fog peaks at 0900 to 0959 UTC.
12
10
8
!64
.
2
0
URadI OAdv
_ _ _ [ g] Prefm N0500- 0600- 0700- 0800- 0900- 1000- 1100- 1200-
0559 0659 0759 0859 0959 1059 1159 1259
Time (UTC)
Figure 4.1. Time of Fog Onset at 'ITS for the 36 Fog Events (Visibility less than 7 miles).
11

ENSCO
12
10
8
40
2
Figure 4.2.
0
• Rad
[] Adv
[] Pref
0500- 0600- 0700- 0800- 0900- 1000- 1100- 1200- 1300- 1400-
0559 0659 0759 0859 0959 1059 1159 1259 1359 1459
Time (UTC)
Time of Fog Onset at TTS for the 36 Fog Events (Visibility less than 5 miles).
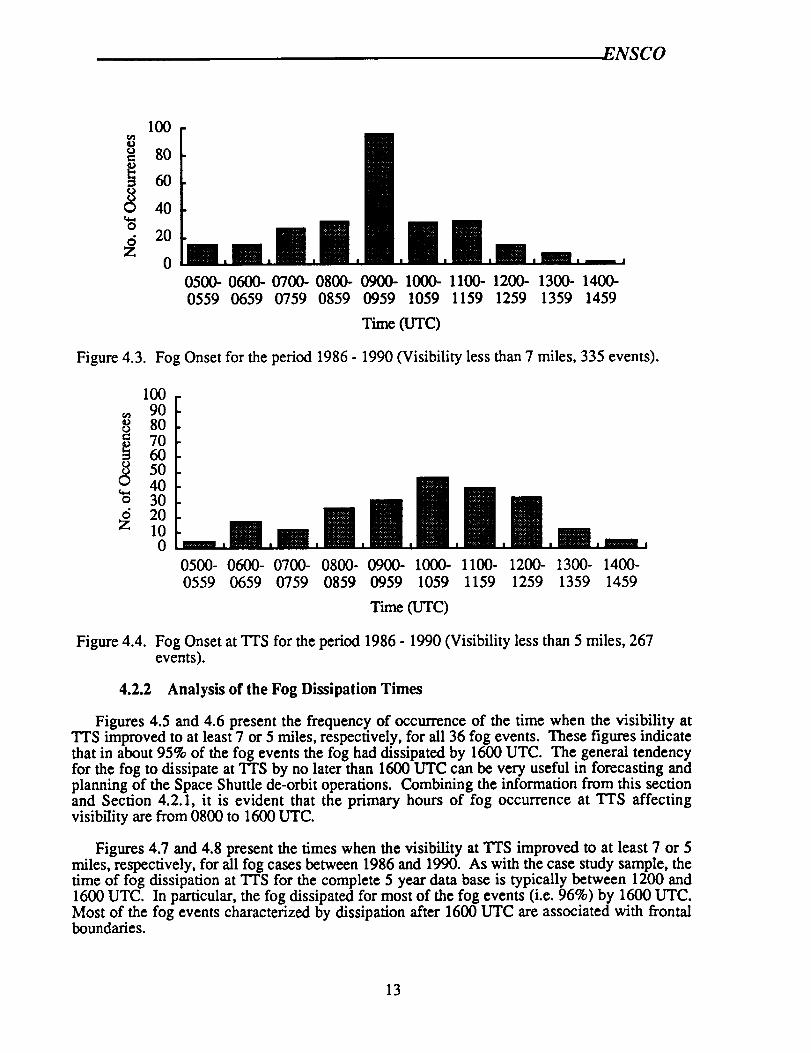
The fog onset times for all fog cases are shown in Figures 4.3 and 4.4. The fog onset timesfor the 7-mileLu data set (Figure 4.3) have a similar distribution to the onset times from the 7-mile36 events (Figure 4.1). In particular, the time period with the highest frequency ofoccurrence of fog onset (i.e., 0900 to 0959 UTC) is the same for both data sets (i.e., all fogevents and the 36 case study events). However, the distribution of fog onset times for the 5-
miledl fog cases (Figure 4.4) is different from both the distribution of fog onset times to the 7-mile_ fog cases (Figure 4.3) and the distribution of fog onset times to the 5-mile36 case studyevents (Figure 4.2). Specifically, the time period with the highest frequency of occurrence offog onset for the 5-mile,]l fog cases is one hour later (e.g., 1000 to 1059 UTC) than thecorresponding time periods for the 7-roiled1 fog cases and to the 5-mile_ case study events. Inaddition, the frequency of fog onset times for the 5-miledl fog cases is more uniformlydistributed among a number of time periods (e.g., 0900 to 1259) whereas the frequency of fogonset times to the 7-miled] fog cases and to the 5-mile36 case study events peaks at 0900 to 0959UTC.
The explanation for the differences in the fog onset time distributions is based on thedifferences between the composition of the data sets. The 36 case study events are allcharacterized by rapid deterioration of visibility due to fog. Consequently, the distributions of
fog onset times for the 7-mile36 case study events and to the 5-mile36 case study events aresimilar. However, the all fog events samples contain fog events which axe characterized by
rapid deterioration of visibility due to fog as well as fog events characterized by gradualdeterioration in visibility. The fog onset times for the 5-mile_ fog cases will be later than the
fog onset times to the 7-mile_l fog cases for the events characterized by gradual deterioration invisibility. Consequently, the distribution of the fog onset times for the 5-miletu fog cases will bedifferent than the distribution of the fog onset times of the 7-miledl fog cases and different than
the distribution of the fog onset times to the 5-mile36 case study events.
Another factor which may account for some component of the differences in the fog onsettime distributions is not all of the fog events included in the distribution of onset times for the 7-
roiled fog cases axe included in the distribution of onset times to the 5-miledl. This is becausethe visibility did not drop below 5 miles in some of the fog events included within the visibilityless than 7 mile sample.
12
ENSCO
1000
o 80e.
40
200
0500- 0600- 0700- 0800- 0900- 1000- 1100- 1200- 1300- 1400-
0559 0659 0759 0859 0959 1059 1159 1259 1359 1459
Time (UTC)
Figure 4.3. Fog Onset for the period 1986 - 1990 (Visibility less than 7 miles, 335 events).
100
90o 80O
c3 5040
o 30
20100
0500- 0600- 0700- 0800- 0900- 1000- 1100- 1200- 1300- 1400-
0559 0659 0759 0859 0959 1059 1159 1259 1359 1459
Time (UTC)
Figure 4.4. Fog Onset at 'ITS for the period 1986 - 1990 (Visibility less than 5 miles, 267events).
4.2.2 Analysis of the Fog Dissipation Times
Figures 4.5 and 4.6 present the frequency of occurrence of the time when the visibility atTrs improved to at least 7 or 5 miles, respectively, for all 36 fog events. These figures indicatethat in about 95% of the fog events the fog had dissipated by 1600 UTC. The general tendencyfor the fog to dissipate at 'ITS by no later than 1600 UTC can be very useful in forecasting andplanning of the Space Shuttle de-orbit operations. Combining the information from this sectionand Section 4.2.1, it is evident that the primary hours of fog occurrence at TTS affectingvisibility are from 0800 to 1600 UTC.
Figures 4.7 and 4.8 present the times when the visibility at "ITS improved to at least 7 or 5miles, respectively, for all fog cases between 1986 and 1990. As with the case study sample, thetime of fog dissipation at 'I'rS for the complete 5 year data base is typically between 1200 and1600 UTC. In particular, the fog dissipated for most of the fog events (i.e. 96%) by 1600 UTC.Most of the fog events characterized by dissipation after 1600 UTC are associated with frontalboundaries.
13

ENSCO
12
o 10
i 8
6
0
0
Figure 4.5.
•Rad
• Adv
• Pref
1000 1100 1200 1300 1400 1500 1600 1700 1800 1900 >
-1059 -1159 -1259 -1359 -1459 -1559 -1659 -1759 -1859 -1959 2000
Time COTC)
Time of Fog Dissipation at TI'S for the 36 Fog Events (Visibility less than 7 miles).
O
O
dZ
Figure 4.6.
12
10
8
6
4
2
0
t, , ,ii1000- 1100- 1200- 1300- 1400-
1059 1159 1259 1359 1459
• Rad
[] Pref
[] Adv
,_:'_, , , ,_27AI,
1500- 1600- 1700- 1800- 1900- >
1559 1659 1759 1859 1959 2000
Time (UTC)
Time of Fog Dissipation at Trs for the 36 Fog Events (Visibility less than 5 miles).
14

ENSCO
80
70
i 6050
• 20
lO0
1000-1100- 1200-1300- 1400- 1500-1600- 1700-1800- 1900- >
1059 1159 1259 1359 1459 1559 1659 1759 1859 1959 2000
Time (UTC)
Figure 4.7. Time of Fog Dissipation at Trs for the period, 1986 - 1990, (Visibility less than 7miles), 335 Fog Events.
80
70t.1
i 6050
40
30o 20
lO0
1000- 1100- 1200- 1300- 1400- 1500- 1600- 1700- 1800- 1900- >
1059 1159 1259 1359 1459 1559 1659 1759 1859 1959 2000
Time (UTC)
Figure 4.8. Time of Fog Dissipation at 'I'TS for the period, 1986 - 1990, (Visibility less than 5miles) 267 Fog Events.
4.2.3 Analysis of the Wind Direction at Time of Fog Development
Figure 4.9 illustrates the TTS's reported wind direction at fog onset (i.e., when the visibilityat 'rrs decreased to less than 7 miles). The data indicate the prevailing wind direction at 'I'rSfor most fog events included a westerly wind component (180 ° - 360°). Of the 36 events, 34reported a westerly surface wind component and nearly half of the events had a surface winddirection from 240" to 299 °. Only two events reported a wind direction outside of the 180° -360 ° sector. Calm winds were reported at "ITS at the time of fog onset in one of the events (27
April 1989). However, northwest winds of 3 to 5 knots were reported up to two hours before thefog formation. In the second event, the wind direction at 'ITS was northeast (7 January 1990).This event has been categorized as an advection type event because the surface winds fromseveral towers around TI'S were northwest.
15

ENSCO
16
14O
10
O
dZ
864
20
000-059
060- 120- 180- 240- 300-119 179 239 299 359
V(md Direction o
nRad
made
mF_ef
Figure 4.9. Surface Wind Direction at Time of Fog Onset at "ITS (Visibility less than 7 miles,36 Fog Events).
As shown in Figure 4.10, almost all the fog events were characterized by light winds. Of the36 fog events, only 1 event (an advection event on 1 March 1988) had a wind speed above 8knots. All the other fog events had wind speeds less than or equal to 8 knots when the fogdeveloped at Trs. Furthermore, the data indicate the observed wind speed at "ITS at the time offog onset was generally 5 knots or less. Very low wind speeds at TI'S (i.e. calm to 2 knots)were reported in 12 of the 36 events.
16
14Ou 12
1o_ 8c3_ 60
d 4Z 2
0
• Rad
[] Adv
[] Pref
i
00-02 03-05 06-08 09-11 12-13
Wind Speed (Knots)
Figure 4.10. Surface Wind Speed at Time of Fog Onset at TI'S.
Figure 4.11 shows the wind speeds measured at tower 313 at the 492 foot level at fog onsettime at TI'S. Wind speeds at the 492 foot level are much higher than surface winds. In 13 out ofthe 36 fog events, wind speeds at 492 feet were greater than or equal to 15 knots. This indicatesthat fog can occur at TI'S even when there is a strong gradient flow aloft.
16

ENSCO
7
o6
_4
c33
1:'o
• Rad
[]Mv
[]_ef
00-02 03-05 06-08 09-II 12-14 15-17 18-20 > 20
Wind Speed (Knots)
Figure 4.11. Wind Speed at the 492 foot Level at Tower 313 at Time of Fog Onset.
Lack of cloud cover is also a factor in fog formation. In the majority of the fog events, noceilings were in the TTS surface observation in the evening or early morning prior to fog
development. The lack of clouds facilitates the radiational cooling needed for fog development.Of the events with a mid to high level ceiling reported on the 'ITS observations prior to fogdevelopment, one was categorized as radiation, three as advection, and three as pre-frontal. Formost of these events, the ceilings were not in the area for the entire nighttime period and thus didnot significantly hinder radiational cooling. It is important to note that some of the ceilingreports may be in error due to the lack of light for viewing the celestial dome during thenighttime.
4.2.4 Analysis of the Advection Fog Events from the 36 Fog Cases
This section discusses the advection fog events. Of the 36 fog events, over half (21 events)were categorized as advection fog. As stated in Table 3.2, fog events were classified asadvection if they met the following criteria:
* Fog developed in the Orlando and/or Daytona Beach area first.
• Local tower data indicated a veering westerly wind between 0500 and 1300 UTCprior to fog formation.
Figure 4.12 indicates that 17 of the 21 events reported fog development at "VI'S between thehours of 0700 to 1100 UTC and that in 11 of the 21 events fog developed between 0900 and1100 UTC.
17
ENSCO
12
lO
86
0 ! I
0301- 0501- 0701- 0901- 1101- 1301-0500 0700 0900 1100 1300 1500
Time (UTC)
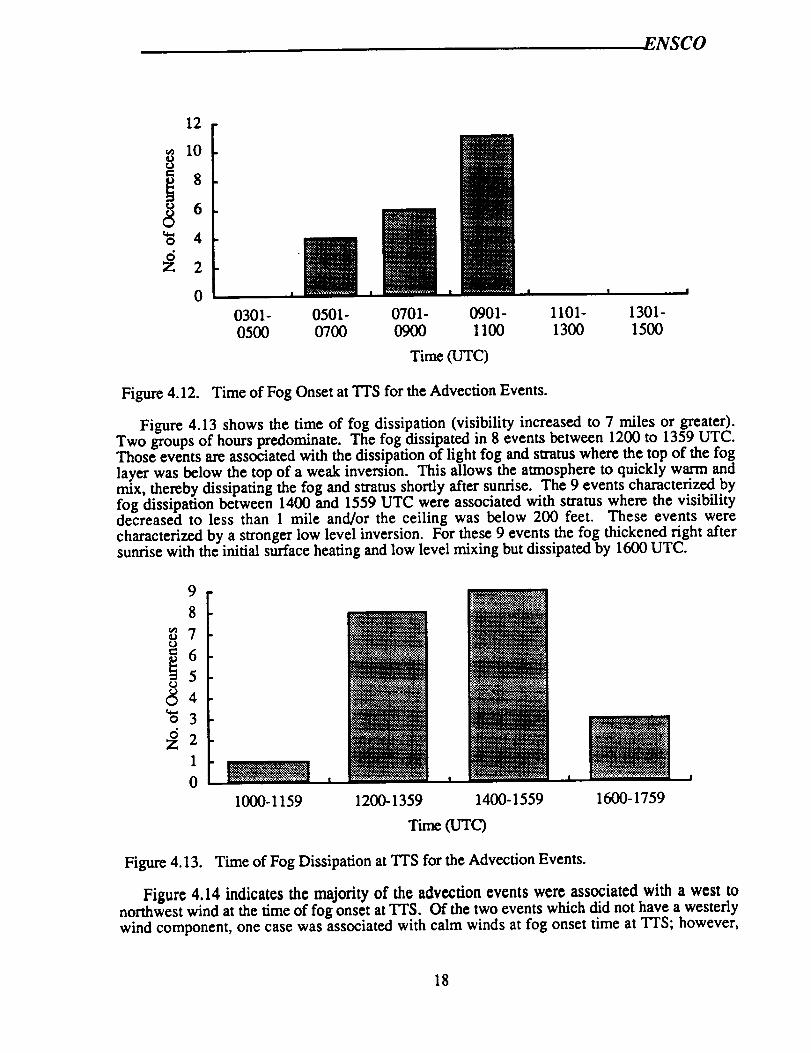
Figure 4.12. Time of Fog Onset at TTS for the Advection Events.
Figure 4.13 shows the time of fog dissipation (visibility increased to 7 miles or greater).Two groups of hours predominate. The fog dissipated in 8 events between 1200 to 1359 UTC.Those events are associated with the dissipation of light fog and stratus where the top of the foglayer was below the top of a weak inversion. This allows the atmosphere to quickly warm andmix, thereby dissipating the fog and stratus shortly after sunrise. The 9 events characterized byfog dissipation between 1400 and 1559 UTC were associated with stratus where the visibilitydecreased to less than 1 mile and/or the ceiling was below 200 feet. These events werecharacterized by a stronger low level inversion. For these 9 events the fog thickened right aftersunrise with the initial surface heating and low level mixing but dissipated by 1600 UTC.
9
8
_7
= 6
o 3
2
0
1000-1159 1200-1359
!
1400-1559
Time (UTC)
1600-1759
Figure 4.13. Time of Fog Dissipation at TTS for the Advection Events.
Figure 4.14 indicates the majority of the advection events were associated with a west tonorthwest wind at the time of fog onset at TI'S. Of the two events which did not have a westerlywind component, one case was associated with calm winds at fog onset time at TFS; however,
18

ENSCO
one hour prior, the surface winds were out of the northwest. In the other case, the fog formed atTTS at 0718 UTC with a northeast wind (040°). However, tower data to the west and northreported a northwest wind at fog onset time.
9
8I
7-
0m00-59 060-119
I_ggSgg_8898_
I I _ I
mmmm
m/
120-179 180-239 240-299 300-359
Direction o
Figure 4.14. Surface Wind Direction at Time of Fog Onset at TTS for the Advection Events.
Figure 4.15 presents the surface wind speeds for the advection events at the time of fog onsetat TI'S. For all of the events, wind speeds were less than or equal to 9 knots. Of the 21 events,
17 reported surface wind speeds of 5 knots or less and a high number of the advection fog eventshad surface winds of 2 knots or less (10 of 21). It is important to note these light wind speedswere measured at the time of fog onset at Trs and may not be representative of the overall winddirection and speed prior to the fog development. When the speeds were averaged over severalhours prior to fog formation the wind speeds would be in the range of 3 - 5 knots. This mayindicate that at the exact time of fog development, the winds weakened slightly (a weakening ofthe land breeze) facilitating fog formation.
10
o, 8a)
_3
4O
0
Figure 4.15.
00-02 03-05 06-08 09-11
Wind Speed (Knots)
Surface Wind Speed at Time of Fog Onset at Trs for the Advection Events.
19

ENSCO
No ceilings were reported between the hours of 0500 and 1200 UTC in 18 of the 21advection events. This is expected since clear skies or mostly clear skies are needed forsignificant radiational cooling and subsequent fog formation. Of the three events where a mid tohigh-level ceiling existed, only one case had a generally solid broken to overcast high-levelcloud deck. The 18 November 1986 case had 8110 of high cirrus clouds most of the night.Although 8/10 cloud cover is significant, some radiational cooling can occur with a high cirruscloud deck.
4.2.5 Analysis of Pre-Frontal Fog Events from the 36 Fog Cases
As stated in Table 4.2, a pre-frontal fog event is characterized by:
• Presence of a moving frontal boundary, at least within the Florida panhandle, movingsoutheast, with frontal passage at TI'S during the fog event day after fog formation.
Thirteen of the 36 fog events were classified as pre-frontal events. Even though the pre-frontal fog events are similar to the advection events, there are distinct differences between thetwo classifications. A frontal boundary can facilitate fog formation by either veering the surfacewinds as the boundary gets closer to the Cape or by weakening the pressure gradient over the
Cape and allowing the land breeze to develop.
The pre-frontal events generally do not have a dry atmosphere above 850 mb. Some of thepre-frontal events are associated with mid to high-level broken cloud decks; and fog dissipationtypically occurs later than in the advection events due to pre-frontal clouds inhibiting burn-off orpost-frontal temperature inversion.
Figure 4.16 shows the time of fog formation at Trs for the pre-frontal events. There is adistinct difference between fog onset times for the pre-frontal and advection events (Figure4.12). The time of fog formation for pre-frontal events is spread across an 11 hour periodwhereas the initial development of advection fog occurred between 0501 to 1100 UTC, only a 6hour period. Also, the onset times for advection events peaked just before sunrise (0901 to 1000UTC), whereas the pre-frontal events had a more uniform distribution of onset times between0301 to 1300 UTC.
4
3
2
O
6 1Z
0
Figure 4.16.
ill m0301- 0501- II01-0500 0700 1300
0701-09OO
Jl
0901-1100
Time (UTC)
Time of Fog Onset at TFS for the Pre-Frontal Events.
1301-1500
2O

ENSCO
Figure 4.17 displays the distribution of fog dissipation times for the pre-frontal fog events.Most events (ll of 13) had fog dissipation times earlier than 1600 UTC which is similar to theadvection events. The two events where reduced visibility extended past 1600 UTC wereassociated with fronts that moved through the area during the late morning hours resulting inpersistent stratus.
6
o 5
i4',-, 2O
0
mm
1000- 1200- 1800-1159 1359 1959
m/
1400- 1600-1559 1759
Time (UTC)
>2000
Figure 4.17. Time of Fog Dissipation at Trs for the Pre-Frontal Events.
As with the advection events, the prevailing surface wind directions fFigure 4.18) for thepre-frontal fog events indicate a westerly component (180 ° - 360°). This is expected since theprevailing wind flow ahead of the front normally contains a westerly component from thesouthwest to west or northwest as the cold front approaches 'ITS. Also, as a cold frontapproaches central Florida it generally slows and weakens. This can result in a weakening of thepressure gradient, allowing a land breeze (westerly wind flow) to develop. This scenario canoften be observed in the local wind tower data.
5
*_ 4
f3
O
0 ! !
00-059 060-119 120-179 180-239
Direction o
!
240-299 300-359
Figure 4.18. Surface Wind Direction at Time of Fog Onset at 'ITS for the Pre-Frontal Events.
The pre-frontal events were generally characterized by slightly stronger surface winds (3 to 8knots) than the advection events (1 to 5 knots). A frontal system moving into the central Floridaarea and the induced southwest wind flow ahead of the front enhances the land breeze flow,
21

ENSCO
thereby increasing the wind speeds slightly. Most pre-frontal events had wind speeds greaterthan 3 knots (12 of 14, see Figure 4.19) compared to the advection events in which only 11 out
of 21 were characterized by wind speeds greater than 3 knots.
o 4
0
00-02 03-05 06-08
Wind Speed (Knots)
09-11
Figure 4.19. Surface Wind Speed at Time of Fog Onset at TI'S for the Pre-Frontal Events.
Of the 3 classifications of fog analyzed in this report, only the pre-frontal events had a
significant number of occurrences of mid to high-level ceilings -- 4 out of 13 events had ceilingsfrom 0000 to 1200 UTC. These ceilings were associated with clouds developing ahead of the
frontal system approaching the Trs area.
4.2.6 Analysis of Radiation Fog Events from the 36 Fog Cases
As stated in Table 3.2, a radiation event is characterized by:
• Light fog (4-6 miles visibility) in the central Florida area prior to developmentof fog at the Shuttle Landing Facility and development of fog at or near sunrise.
Only two of the 36 events were characterized as radiation fog events. For the event on 27December 1989, Tl'S's visibility decreased to 1/2 mile with fog and a northwest wind at 3 knots
just after sunrise (1202 UTC). By 1410 UTC, the fog thickened resulting in a 200 foot brokencondition and 1/8 mile visibility. Daytona Beach was the only other station in central Florida
with visibility less than 4 miles. Daytona Beach's visibility decreased to 1/8 mile with fog at1333 UTC. Patrick AFB, just south of the Cape, had 5 miles visibility clue to fog between 1255
and 1555 UTC.
The other radiation fog event occurred on 10 February 1990. On this day, TI'S and thesurface stations west and north of the Cape area reported fog near sunrise (sunrise was at 1240
UTC). Daytona Beach reported fog at 1133 UTC. TTS reported a scattered stratus layer at 1145UTC and a ceiling at 1248 UTC. Orlando reported fog development at 1230 UTC.
Based on information from the Range Weather Operations (RWO) Terminal ForecastReference Notebook (TFRN), local meteorological experience, and the two radiational fog
events, some statements can be made about the radiation fog events.
22
ENSCO
First, the winds for both events were westerly indicating either the surface ridge line wassouth of the Cape Canaveral area or the surface pressure gradient was weak assisting the landbreeze development. Both events were characterized by a gradual shift in the local tower wind
flow to a more westerly flow during the early morning hours (0500 to 1000 UTC). Soundingsfrom the previous evening (2200 to 2300 UTC) on both days indicated a drying of theatmosphere above 900 mb which facilitated subsequent radiational cooling. Both events werecharacterized by patchy ground fog and westerly surface winds the previous day. The fog andstratus dissipated by 1600 UTC for the two radiation fog events.
4.3 Fog Forecast Indices
This section of the report presents a description and analysis of a Fog Stability Index (FSI)developed by the Air Weather Service. The FSI as described in Air Weather Service Forecaster
Memo 90/001 (Air Weather Service, 1990), uses several parameters to assess the likelihood ofradiation fog development. The FSI formula is:
FSI = 4 * Ts - 2 * (T850 + Tds) + W850
• Ts = surface temperature in °C
• T850 = temperature at 850 mb in °C
• Tds = surface dew point in °C
• W850 - 850 mb wind speed in knots
The memorandum lists the following guidelines for radiation fog forecasting:
Calculated FSI Value Risk of Fog Formation> 55 Low
31 - 55 Moderate
< 31 High
The limitation with the FSI formula is it can only be updated with a new rawinsonde
sounding. Generally, there are three soundings per day during the week and only one or two perday during the weekends at Cape Canaveral. This means a FSI estimate could be computedaround 1100, 1600 and 2300 UTC on a typical day. KSC/CCAFS has additional highertemporal resolution information on the stability and moisture distribution of the lower
atmosphere (e.g. Tower 313 has sensors from 54 to 492 feet). The results from this investigationindicate that the atmospheric conditions in the lower 500 feet of the atmosphere are closelyrelated to fog formation potential. Consequently, a new Fog Susceptibility Index (FSI313) usingdata from tower 313 was developed by the AMU. This index developed by the AMU can be
computed or updated at least hourly giving the forecaster additional insight into the fog potentialand the change in fog potential.
The new FSI (FSI313) formula is based on replacing the 850 mb data with the temperatureand wind speed from the 492 foot sensor at tower 313. This allows the forecaster to update the
FSI313 with every new "I'I'S observation or every hour. The forecaster could also compute anew FSI313 every 5 minutes based on new tower data and the hourly 'ITS observation. TheFSI313 formula is:
FSI313 = 4 * Ts - 2 * (T313 + Tds) + W313
• Ts = "ITS surface temperature in °C
• T313 - temperature from tower 313 at 492 feet in °C
• Tds = "ITS surface dew point in °C
• W313 = wind speed in knots from tower 313 at 492 feet
23

ENSCO
The following paragraphs present the results of the analyses of the FSI and the FSI313 forthe 36 case study fog events. Since the rawinson_de data from the evening.prior to the fog eventwere not always available, the FSI was computed using the 1200 UTC rawmsonae data from the
morning of the fog event along with the surface observation from "I'FS at the time of fog onset.The FSI313 was computed using data from tower 313 and the "Frs surface observation at the
time of fog onset.
The FSI estimates (Figure 4.20) for all events were in the moderate to high risk range.
Furthermore, 26 of the 36 events were in the high risk category.
30
o 15
_" 100
6Z 5
>55 55-31
FSI Calculated Value
<31
Figure 4.20. Fog Stability Index (FSI) for All Events.
The relationship between the FSI and the FSI313 for 27 of the 36 fog events is presented in
Figure 4.21. Nine of the fog events were not included in this analysis because not all the datanecessary to compute the FSI and the corresponding FSI313 were available. Although certainlynot a perfect linear relationship, the graph does indicate some correlation between the twoindices. Consequently, regression analysis was employed to test the significance of thecorrelation between the two fog indices.
30
25
20
15
u., 10
Low Moderate
• •limb"l g•5
• _,• i
- 10 0 10 20 30 40
FSI
High
! !
50 60
Figure 4.21. Calculated Values for FSI and FSI313 for 27 Events.
The regression analysis indicated a coefficient of determination (r 2, the ratio of explainedvariance to total variance) of 0.35 between the two indices which, based on the degrees of
freedom (25), is a statistically significant correlation for _t = 0.01. The degree of correlation
increased (r 2 = 0.50, statistically significant) if one outlier is removed from the analysis. The
24

ENSCO
one outlier removed was from July 15, 1988 and was elevated because of wind speeds of 37 kts
reported at 850 robs. Based on this correlation, the FSI313 may prove to be a valuable forecasttool and further investigation is warranted. The two events with high FSI estimates wereexamined to determine the reason for the large FSI estimates. In both instances, strong winds at
850 nab level were responsible for the large FSI estimates. As stated earlier, one importantoutcome from this investigation is that significant fog can develop at TFS in the presence ofstrong winds at the 850 mb level. This is permitted by a decoupling of the surface and theplanetary boundary layer winds as a strong temperature inversion develops.
Figure 4.22 shows the FSI estimates for the advection fog events. All estimates fell withinthe moderate to high probability categories and more than half the events had estimates in thehigh risk category. No events fell within the low probability area (i.e., greater than 55).
Figure 4.23 displays the FSI estimates for the pre-frontal events. These estimates also fallwithin the moderate to high risk category with 9 of the 12 events having a FSI less than 31 (i.e.,high probability category). None of the pre-frontal fog events had FSI estimates greater than 55(low risk).
Information on the fog precursors skill scores (false alarm) based on the 5 year TTSobservations and Cape Canaveral AFS Rawinsondes is included in Section 6.2.
16
12
_ 8
o 4
0
Figure 4.22.
> 55 55-31 < 31
FSI Calculated Value
Fog Stability Index forAdvection Events.
16
t_
_12
_ 8c3o 4
0
Figure 4.23.
>55 55-31 <31
FSI Calculated Value
Fog Stability Index for Pre-Frontal Events.
25

F,NSCO
5.0 Forecasting Tools
5.1 Meteorological Interactive Data Display System (MIDDS) McBasi Program
To facilitate the analysis of fog precursor information, a Man-computer Interactive Data
Access System Basic (McBasi) language interface utility was developed on MIDDS. McBasi isa line oriented editor and on-fine BASIC language interpreter within the mainframe McIDASenvironment and in McIDAS-OS2 (PC level). This utility produces a 4-panel graphic screen
(see Figure 5.1) that displays data from the local wind tower network, observations from DAB,MCO, COF, MLB, and TI'S, and the FSI313.
Two of the panels present a time series of the wind direction from tower 1108 and from SLFtower 512. These panels give the forecaster a west-to-east view of the local tower data tomonitor wind speed and direction. Panel 3 is a time series graph of relative humidity valuesfrom the 6, 54, 204 and 492 foot levels of tower 313. This graph allows the forecaster tomonitor the depth of the moisture layer from the surface to 492 feet. Panel 4 is a time series
graph of the temperature reported at tower 313 at the 6 and 492 foot levels. This graph allowsthe forecaster to monitor the strength of the low level inversion. On the top right of the screen isa tabular list of data from tower 313. It displays the current temperature, relative humidity, wind
direction and wind speed from the 54, 204 and 492 foot levels. Centered on the bottom of thegraphic screen is the FSI313, and in the center of the display are data from six surfaceobservation stations in central Florida. The data from the surface stations include the lowest
ceiling reported at the site, the lowest cloud deck that is not a ceiling, weather conditions,temperature, dewpoint, wind direction, and speed. On the top left of the display is thetemperature difference between the surface and 1000 mb from the most recent CCAFSrawinsonde.
26

ENSCO
t-I r -
U _
t r-
t_:rb-,
H CO
El
bJ C,bD
I_ Ll_
,=- T
OTLI-I
ITI t I I _ '.--I
Ill
F_
F _1 -] ';
I" t
r2-] r-
iT I "
q
-I_0 _ _2
--J-xF
lr J
,:, ,,_ r- [_-_ , , , _ ,--
u-_ ,-, ,_5 r- :"U; ,TI I--__1
_1 ll''- _ r-- fl-1 h-1 7- i-,-i "-_ l-I
LI-_ b-'_
17,-i
i.-__i
t-'b
¢ i
TCt
T,IT ,_--_1
co '_
b?
_,l,__
• 4
r ¸-
=
r
CO
I
II IJ-_
IILT',
I--.__l '"_
I lJ ,.,r.
I-at; ._,hJ
LI5 [-- -
..... -'.r_
%
r
! ,£,?.'-
CJ ,-_,
.'-4
L&J i--i
-"- bD
H 17'-t_ U-!,
t
>It
]
_[11:-
r-- r--
,T-4
nt-'_
I_1 ,-a
U
8 "-:
OQQQ
T"4 T"_ t--1
m_ .:"J F- _ _' --_ ,)L,
0-, r
r-, O--, O 0",ri • • • •
(0 __n.r'lI_ .m
a_ 0000,_, ,00 ,r"..II"-U _."J _ _'.1
p r-'-o (Df.£1r-. t_ _"
l i. 71-
fC'
/
III
£0
...{I--
i . , l .... .L • • J.....
b_, , '-_ , 4
,:.o r-"- ,-,-_ ,T:
I.-- ,000 0 Lf-.,,_,r_ r-- r--
'-,4
L00 O4 II-_O
,> r i,-: ,:'it-:
1"(.9000HOOO(J I_9_I-(J:)
--_ O
L', 0N O3
7
. ....... . o .
,.l, r :, ,,, ,, , i ,:, L,-., u., r ,,,
r,-, 0 r,-, L,,.(_ (Z, L,.. 0r',_ O0 (J
0"J -_-r
4 tJj
"f4 b3
I--i
r4
t
'. 4
r,-,
l
,T1 LLJ
.T-,F---I
,?-._ F--
i,.I
.-
0%
L'X-'-, --" ,x,
"-'1
' ':_ LI .' f ,r .... , L}_, I '3' -
-.l .4 C-_ , r, ,0 C,-? [ ,1-3 U- _ _ :T
Figure 5.1. Example of the McBasi Fog Precursor Graphic Display.
I"1"_
i',-_
, I
r--
[
IT1
_J
e
r F-H
rl_
iI"_
2?

ENSCO
Three MIDDS McBasi utilities were developed to calculate fog forecast indices. One
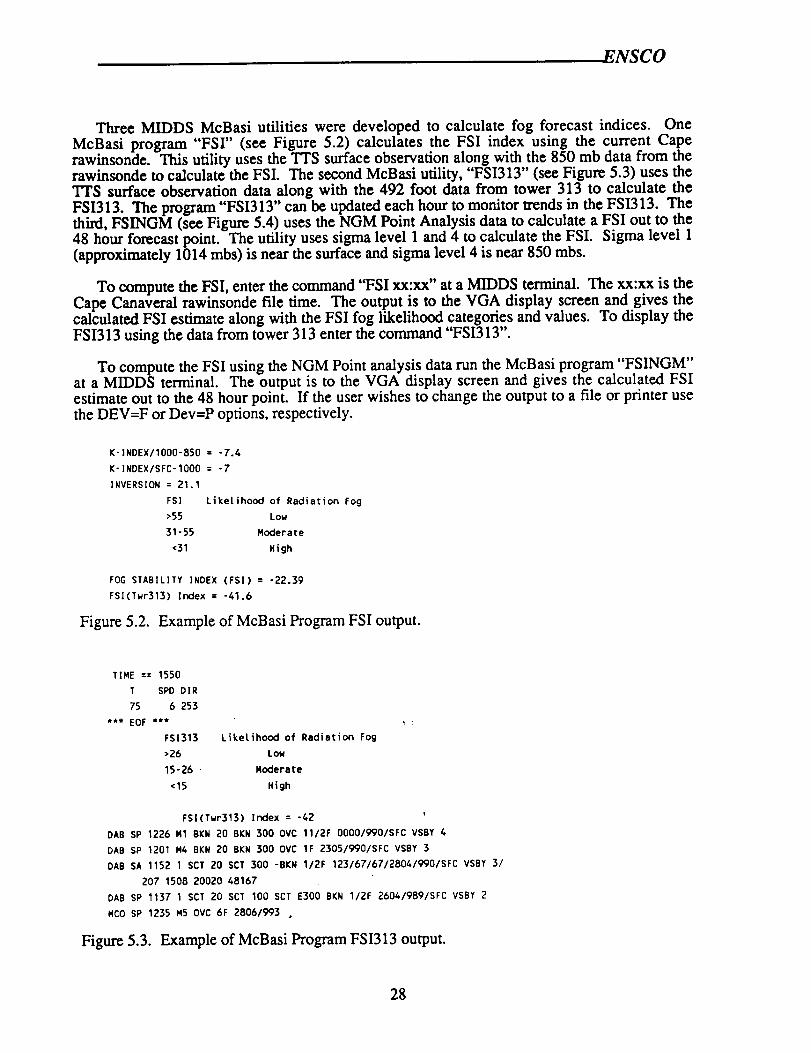
McBasi program "FSr' (see Figure 5.2) calculates the FSI index using the current Caperawinsonde. This utility uses the "I"FS surface observation along with the 850 mb data from therawinsond¢ to calculate the FSI. The second McBasi utility, "FSI313" (see Figure 5.3) uses the
'ITS surface observation data along with the 492 foot data from tower 313 to calculate the
FSI313. The program "FSI313" can be updated each hour to monitor trends in the FSI313. Thethird, FSINGM (see Figure 5.4) uses the NGM Point Analysis data to calculate a FSI out to the48 hour forecast point. The utility uses sigma level 1 and 4 to calculate the FSI. Sigma level 1
(approximately 1014 mbs) is near the surface and sigma level 4 is near 850 mbs.
To compute the FSI, enter the command "FSI xx:xx" at a MIDDS terminal. The xx:xx is the
Cape Canaveral rawinsonde file time. The output is to the VGA display screen and gives thecalculated FSI estimate along with the FSI fog likelihood categories and values. To display the
FSI313 using the data from tower 313 enter the command "FSI313".
To compute the FSI using the NGM Point analysis data run the McBasi program "FSINGM"at a MIDDS terminal. The output is to the VGA display screen and gives the calculated FSIestimate out to the 48 hour point. If the user wishes to change the output to a file or printer usethe DEV=F or Dev=P options, respectively.
K-INDEX/1000-850 = -7.4
K-INDEX/SFC-1000 = -7
INVERSION : 21.1
FSI Liketihood of Radiation Fog
>55 Low
31-55 Moderate
<31 High
FOG STABILITY INDEX (FSI) = -22.39
FSl(Twr313) Index = -41.6
Figure 5.2. Example of McBasi Program FSI output.
TIME == 1550
T SPD DIR
75 6 253
*** EOF ***
FS1313
>26
15-26
<15
Likelihood of Radiation Fog
Low
Moderate
High
FSl(Twr313) Index = -42
DAB SP 1226 N1BKN 20 BKN 300 OVC 11/2F 0000/990/SFC VSBY 4
DAB SP 1201 M4 BKN 20 BKN 300 OVC 1F 2305/990/SFC VSBY 3
DAB SA 1152 1 SCT 20 SCT 300 -BKN 1/2F 123/67/67/2804/990/SFC VSBY 3/
207 1508 20020 48167
DAB SP 1137 1SCT 20 SCT 100 SCT E300 BKN 1/2F 2604/989/SFC VSBY 2
MCO SP 1235 M50VC 6F 2806/993 .
Figure 5.3. Example of McBasi Program FSI313 output.
28

ENSCO
Fcst Hour = 2000 Wind Oir = 42 FSI => 21
Fcst Hour = 3000 Wind Dir = 107 FSI => 25
Fcst Hour = 4000 Wind Dir = 125 FSI => 30
Fcst Hour = 5000 Wind Dir = 116 FSI => 28
Fcst Hour = 7000 Wind Oir = 18 FSI => 36
Fcst Hour = 8000 Wind Dir = 69 FSI => 35
Fcst Hour = 9000 Wind Dir = 94 FSI => 36
Fcst Hour = 10000 Wind Dir = 102 FS[ => 37
Fcst Hour = 11000 Wind Oir = 108 FSI =• 34
Fcst Hour = 12000 Wind Dir = 122 FSI =• 33
Fcst Hour = 13000 Wind Dir = 128 FSI =• 31
Fcst Hour = 14000 Wind Oir = 129 FS] => 26
Fcst Hour = 15000 Wind Dir = 135 FSI =• 26
Fcst Hour = 16000 Wind Dir = 138 FSI =• 27
Fcst Hour = 17000 Wind Dir = 142 FSI =• 27
Fcst Hour = 18000 Wind Dir = 149 FSI => 28
Fcst Hour = 19000 Wind Dir = 157 FSI => 28
Fcst Hour = 20000 Wind Dir = 164 FSI =• 27
Fcst Hour = 21000 Wind Oir = 175 FS] =• 25
Fcst Hour = 22000 Wind Dir = 176 FSI => 24
Fcst Hour = 23000 Wind Dir = 168 FSI =• 26
Fcst Hour = 24000 Wind Oir = 169 FSI => 26
Fcst Hour = 25000 Wind Dir = 186 FSI =• 21
Fcst Hour = 26000 Wind Dir = 218 FSI =• 19
Fcst Hour = 27000 Wind Dir = 215 FSl => 21
Fcst Hour = 28000 Wind Dir = 186 FSI =• 25
Fcst Hour = 29000 Wind Oir = 173 FSI =• 28
Fcst Hour = 30000 Wind Dir = 166 FSI => 34
Fcst Hour = 31000 Wind Dir = 163 FSI => 37
Fcst Hour = 32000 Wind Dir = 164 FSI => 39
Fcst Hour = 40000 Wind Dir = 219 FSI =• 38
Fcst Hour : 41000 Wind Dir = 223 FSI => 38
Fcst Hour = 42000 Wind Dir = 228 FSI => 36
Fcst Hour = 43000 Wind Dir = 239 FSI => 34
Fcst Hour = 44000 Wind Dir = 252 FSI => 31
Fcst Hour = 45000 Wind Dir = 262 FS[ => 30
DAY == 93322 TIME == 120000
For Fog Formation, Wind Direction needs to be between 150 - 330.
Ca(culated FSI Risk of Formation
• 51 Low
31 - 51 Moderate
• 31 HIGH
Figure 5.4. Example of McBasi Program FSINGM output.
29
F_NSCO
5.2 Fog Forecasting Decision Trees
A seriesof decisiontreeswere developed to help summarize a methodology for forecasting
fog formation at TTS. These decision trees,which were included in the preliminary report
(Wheeler, 1993),were used duringseveralfog eventsduringthe pastfog season and proved very
helpfulin determining the potentialfor fog development. After using the preliminarydecisiontreesduring thispastfog season some minor modificationto thedecisiontreeswere made. Oneof the modifications to the decisiontreeswas to include an analysisof the relativehumidity
sensorsattower 313. Analyses have indicatedthe depth of the moisturelayerisimportantto fog
development at"ITS.
In addition,a review of the outputfrom the McBasi program 'TSINGM" has been added to
the decisiontrees.This program (discussedin Section 5) provides an estimateof the potential
forfog development fora 48 hour forecastperiod.
Some of the individualparameters on the workshccts can be analyzed up to 48 hours in
advance (FSINGM), but the majoritywillneed to be examined in the earlymorning hours using
the 2200-2300 UTC Cape Canaveral rawinsonde and currentlocalobservations. Key sensors
(e.g.localtower wind data)willnccd tobe monitored up to2 hours beforefog formation.
Step one of the decision trccprocess (Figure31) willdefine the gcncral conditionsin the
Cape Canaveral area and produce a fog likelyor unlikelyresultwhich can be used by the
forecasteraspartof his/herdecisionmaking process. The decisiontreeprocess isa step-by-step
process which the forecastercan use to help analyze the data to dctcnmnc the potentialfor fog
development atTrs, seeFigures 5.2through 5.6.
Key factorsinforecastingfog atCape Canavcrah
• Persistence-iffog occurred on the currentday and the synopticconditionshave not
changed significantlyand arc not expected to change, then fog willprobably occur
the next day.
• Moisture - for a fog event to occur,theremust be significantlow levelmoisture (at
and below 900 rob).
• Atmospheric stability-thelow levelsof the atmosphere must bc stable.
• Dry airaloft(exceptfor prc-frontalfog events) - generally,there must bc drierairalofttoallow forradiationalcooling(above 850 rob).
• Westerly wind component - generally,the surfacewind flow willbe from 150° to
330°(monitor tower outputdisplay).In addition,thelocationof the surfaceridgeline
is important. Ifthe ridge is to the south of the Cape there isa betterchance for
westerlyflow and fog formation.
All or most of thesefeaturesmust be presentforrapiddeteriorationof visibilityduc tofog or
stratusat"Vl'S.Trend analysisand continuityof thesefeaturesare important in understanding
how fog develops and effectsthe ITS area. The worksheets are designed to help the forecastermonitor thesefcaturcsand trendspriortopossiblefog development inthe 'VI'Sarea.
3O
ENSCO
IFog Decision Tree for the Shuttle Landing Facility J
(RaDid develoDinq foq within I hg_Jr_t TTS visibility less than 7 mile_ I
(1) Run "FSINGM". Will display hourly FSI values out to 48 hours.
Examine the display. If the calculated FSI is less than 31 and the .JN-.Q---II=-wind direction between 150° and 330 ° there is an increased
likelihood of foo developm(_n(.It! Yes
(2) Will there be scattered or clear conditions for levels less than10,000 feet at TTS for the time period 0500 - 1200 UTC (i.e., noceiling less than 10,000 fl)? No
Yes
(3) Are the gradient level (500 It.) or surface winds forcasted to be180° - 360 ° (offshore) or light and variable for the time period
0500 - 1200 UTC?No
(3) Is Temperature-Dew Pointfrom 0500 - 1200 UTC?
Yes
spread forecast to be <= 5°F (<= 3° CNo
Yes
I Fog Ukely
I Proceed to: Determination of type of FogMenu
Other Considerations:
(1) Did fog occur at "1-1"Syesterday andsynoptic conditions remain unchanged?(2) Was fog observed at Orlando orDaytona Beach yesterday and has ridgeshifted to the south?(3)Is FSI (run FSI313) less than 16?
IYes to any of the above questions? J
No to all questions
J Fog UnlikelyJ
Figure 5.5. Step One of the Fog Decision Tree.
31

ENSCO
Determination of Type of Fog
Is frontal system in central ornorth Flodda('ITS to PNS)?
NoIII1=,,._
Yes
I
I o,oP e' r°n'a' enuCheck for Advectionor Radiation fog
No
Figure 5.6.
I towers, ORL, DAB, or MLB?
Is the prevailing flow observed or torecast to be180° - 360 ° from 0500 - 1200 UTC for Cape wind
i
Go to the Advection IFog menu !
Go to the RadiationFog Menu
Step Two of the Fog Decision Tree (Type of Event).
32
ENSCO
Pre-Frontal Fog Menu
Maior Items to Check:/,1)Was fog reported at "l-rS yesterday?(2) Was fog reported at DAB or ORL yesterday?(3) Will the surface ridge line be near or to the south of theCape?(4) Will the frontal system still be to the northwest of theCape by sunrise (1100-1200 UTC)?(5) Execute McBasi programs "FSIA" and FSl313". Yes/No
_Yes _ No
A Yes answer to one or more ofthese questions means a highlikelihood of fog at TTS.
I
A No answer to all of the abovequestions indicates fog is not quite aslikely, but conditions must continue to bemonitored very closely.
I
Key Items to check from the Fog Program:(1) Run "TWRFOG", example: "TWRFOG 10".(2) Monitor wind tower data for a northwesterly shift. If this occurs, forecastfog occurrence at TTS within 1-2 hours.(3) Monitor RH values at tower 313 (panel 2). RH >70% increase chance offog.(4) Continuously monitor surface observations at ORL, MCO, SFB, TIX, andDAB for stratus and fog development. If fog develops at any of these sites,forecast fog occurrence at TTS within the next 1-3 hour period.(5) Check inversion strength on Cape soundings and between 6 and 492 feeton tower 313. Stronger inversions indicate a higher potential of fogoccurrence.
TTS Foe Climatology !Pre-Frontal Cases};
Fog Onset 0700 - 1100 UTC 620900 - 1100 UTC 45Before 0700 UTC 23
Prevailing Wind 180° - 360 ° 100Direction 240 °- 300 ° 38
Wind Speed • 5 knots 62
Fog Break-up Time By 1600 UTC 85
Figure 5.7. Step Three of the Fog Decision Tree (Pre-Frontal Type)
33
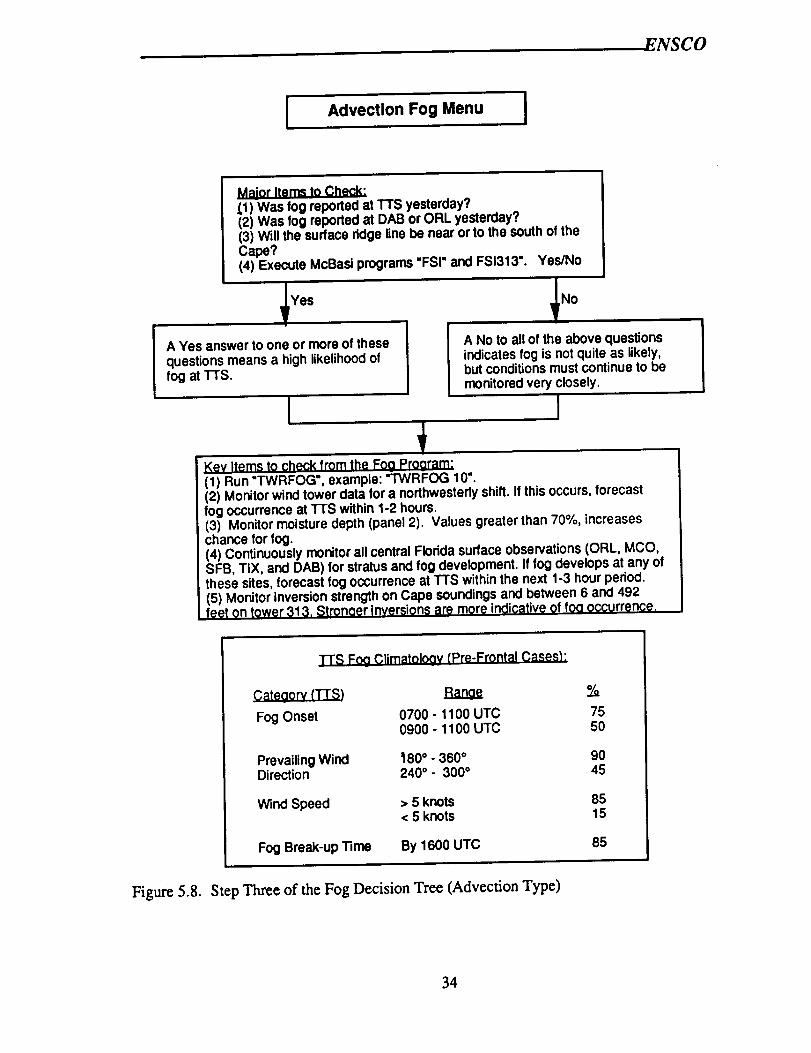
F.NSCO
Advection Fog Menu ]
Maior Items to Check:_.1) Was log reported at TTS yesterday?(2) Was fog reported at DAB or ORL yesterday?(3) Will the surface ridge line be near or to the south of theCape?(4) Execute McBasi programs "FSI" and FSI313". Yes/No
_Yes _No
A Yes answer to one or more of thesequestions means a high likelihood offog at 1-l'S.
A No to all of the above questionsindicates fog is not quite as likely,but conditions must continue to bemonitored very closely.
I
Key Items to check from the Fop Program:(1) Run "TWRFOG', example: "TWRFOG 10".(2) Monitor wind tower data for a northwestedy shift. If this occurs, forecastfog occurrence at TTS within 1-2 hours.(3) Monitor moisture depth (panel 2). Values greater than 70%, increaseschance for fog.(4) Continuously monitor all central Florida surface observations (ORL, MCO,SFB, TIX, and DAB) for stratus and fog development. If fog develops at any ofthese sites, forecast fog occurrence at TTS within the next 1-3 hour period.(5) Monitor inversion strength on Cape soundings and between 6 and 492feet on tower 313. Stronaer inversions are more indicative of foo occurrence.
Figure 5.8.
1-1"SFoa Climatoloav (Pre-Frontal Cases_:
BalI_ %
0700 - 1100 UTC 750900 - 1100 UTC 50
Prevailing WindDirection
1180"- 360* 90240"- 300 ° 45
Wind Speed > 5 knots 85< 5 knots 15
Fog Break-up Time By 1600 UTC
Step Three of the Fog Decision Tree (Advection Type)
85
34
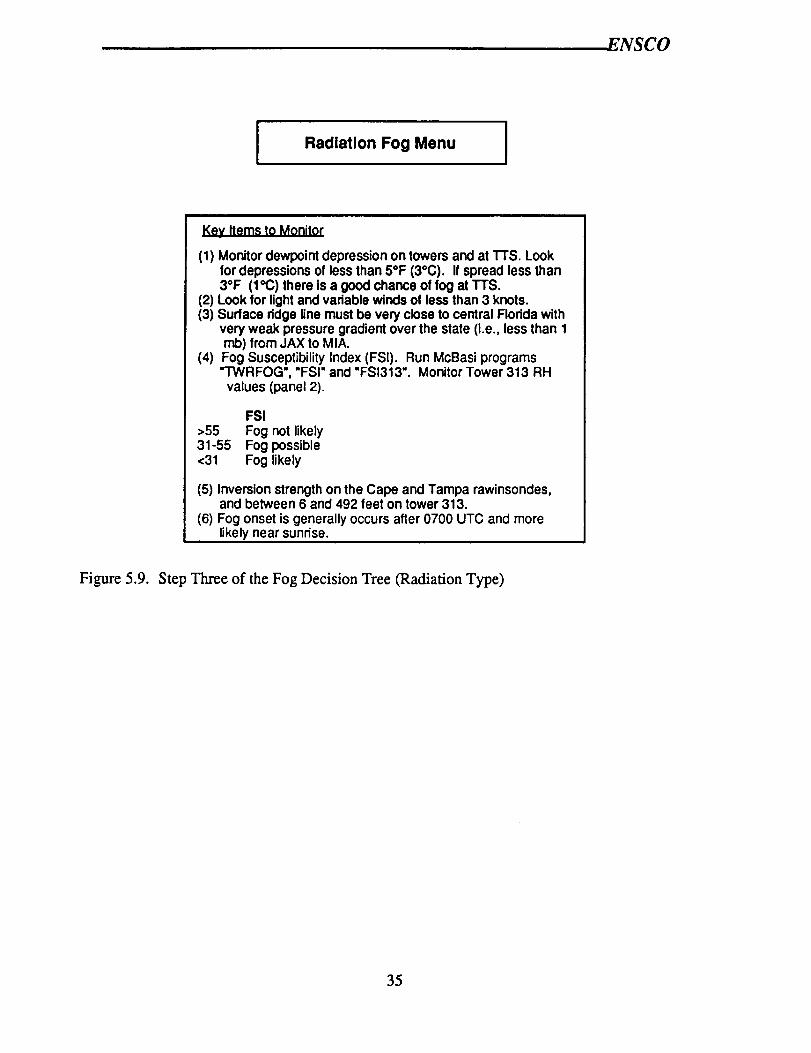
ENSCO
Radiation Fog Menu
Key Items to Monitor
(1) Monitor dewpoint depression on towers and at 1-rs. Lookfor depressions of less than 5°F (3°C). If spread less than3OF (1*(3) there is a good chance of fog at TTS.
(2) Look for lightand variable winds of less than 3 knots.(3) Surface ridge line must be very close to central Florida with
very weak pressure gradient over the state (i.e., less than 1mb) from JAX to MIA.
(4) Fog Susceptibility Index (FSI). Run McBasi programs"TWRFOG', "FSI" and "FSI313". Monitor Tower 313 RHvalues (panel 2).
FSI>55 Fog not likely31-55 Fog possible<31 Fog likely
(5) Inversion strength on the Cape and Tampa rawinsondes,and between 6 and 492 feet on tower 313.
(6) Fog onset is generally occurs after 0700 UTC and morelikely near sunrise.
Figure 5.9. Step Three of the Fog Decision Tree (Radiation Type)
35

ENSCO
6.0 Fog Precursors
6.1 Fog Precursor Elements
Development of fog in central Florida is associated with several precursors. Theseprecursors can be identified and used to help forecast fog occurrence. The following is a list of
precursors associated with the three basic fog types. These precursors are also listed on theprefrontal, advection, and radiation fog decision trees.
• Persistence is an excellent forecasting tool. If fog occurred at 'ITS the previous
morning and no significant change is seen in the synoptic features, then fog is likely
for the next day.
Advection fog development:
• Small surface dew point depression (0 ° - 5 ° F, (0 ° - 3° C)) is important.
Fog forms west of the TTS area first (up to two hours prior to development at theTI_S). The surface observations from Daytona Beach and Orlando from 0000 UTCthrough the morning hours can be monitored for fog development.
Location of the surface ridge axis is crucial in determining the surface wind flow. Ifthe ridge axis is south of Cape Canaveral, this increases the chances for fogdevelopment. If the ridge is north and forecasted to stay north, fog development is
unlikely although there may be patchy ground fog.
Time series analysis of tower reports is necessary to determine land breeze flowconditions. The McBasi program "TWRFOG" can be used to monitor the wind flow.
A westerly wind component increases the chance for fog formation. The wind towerdata may show a double shift to a more westerly component (see Figure 5.1). Fogformation often occurs within 30 minutes after the second shift.
Low-level moisture combined with dry air aloft is important for fog formation. If the
lower atmosphere is moist but dries rapidly above 850 rob, fog can occur. If thesounding is moist up to 700 rob, fog is unlikely since this limits the radiationalcooling. The McBasi program "TWRFOG" can be used to monitor the low levelmoisture content.
The strength of the low level inversion is directly proportional to the likelihood offog development. The McBasi program "TWRFOG" can be used to monitor the 6 to492 foot temperature inversion at tower 313.
Pre-Frontal fog development:
• If a frontal boundary exists from the Florida panhandle to the Cape and is forecast to
pass the TrS area in the next 24 hours, then pre-frontal fog development is possible.
• Small surface dew point depression (0 ° - 5 ° F, (0 ° to 3 ° C)) is important for fog
development.
• If fog forms from Daytona Beach to Orlando, the probability of fog at TI_S isincreased.
36

ENSCO
A shift in the wind direction to a more west or northwest direction increases the
probability of fog formation at TTS. The McBasi program "TWRFOG" can be usedto monitor the local wind flow.
A low level temperature inversion is required for fog formation. The McBasiprogram "TWRFOG" allows the forecaster to monitor the inversion from 6 - 492 feetat tower 313.
Radiation fog development:
• Generally, fog development occurs near sunrise.
Low level moisture (dew point depression of 3°C (5°F) or less) up to 900 mb anddrier air (dew point depression of 5°C (9°F) or more) above 850 mb is necessary forfog formation. The McBasi program "TWRFOG" can be used to monitor the lowlevel moisture content.
• Surface winds are generally calm or have a weak southwest to northwest component(3 knots or less).
A westerly shift in the low level wind flow increases moisture advection and
increases the probability of fog. The McBasi program "TWRFOG" can be used tomonitor the wind flow.
6.2 Fog Precursors Skill Scores
The 5 year Trs observation and Cape rawinsonde data bases were used to determine the
Probability of Detection (POD) and the False Alarm Rate (FAR) for key fog precursors. Thismulti-step process was used to determine a yes or no condition based on certain criteria.
The data used in this analysis contain the 36 case study fog events and 222 no fog eventsextracted from the 5 year SLF data base. The no fog event days satisfy the surface based fogprecursor criteria listed below.
• TTS reported offshore surface wind flow (i.e. wind reported 150 ° to 330°).• Trs reported surface dew point depression less than 5 ° F (3 ° C).
The no fog event days were examined to determine if one or more of the criteria listed belowwere satisfied. These criteria are the inverses of the upper air precursor criteria identified in the
previous section. Satisfying of one or more of these criteria reduces the likelihood of fogdevelopment.
1) Lack of 1000 mb moisture (i.e. 1000 mb T-Td spread greater than 3 ° C, (5 ° F)).
2) 1000 mb wind onshore (i.e. 1000 mb wind direction between 330 ° and 150°).3) 1000 mb Wind Speed > 20 kt.4) FSI > 31.
If one or more of the four criteria were satisfied, then the forecast was for no fog. If none ofthe four criteria were satisfied, then the forecast was for fog to develop.
37

ENSCO
The following skill scores were computed from the data in Table 6.1. The following scoreswere based on a forecast for fog.
• Probability of Detection (POD) 78%• False Alarm Ratio (FAR) 45%• Failure to Detect 23%
Table 6.1. Precursor Contin[ency Table
No Fog Occurred Fog Occurred(No) (Yes)
Conditions 1, 2, 3, or 4 Occurred
(NO Fog Forecast)
Conditions 1, 2, 3, and 4 Did NotOccur (YI¢.S Fog Forecast)
199
23 28
These false alarm ratios are good considering that the no fog event days satisfied thesurfaced based fog precursor criteria (i.e., potential for fog development existed). In addition,not all fog precursors were included in the POD and FAR analysis because time constraintsprohibited a detailed analysis of each of the 222 no fog events (e.g., determination of where fogfirst formed and location of the surface ridge). Furthermore, the high probability of detectionindicates the upper air precursor criteria are effective in indicating days with a high likelihood offog development.
38

ENSCO
7.0 Summary and Recommendations
The purpose of the study was to enhance the weather community's understanding of the
precursors responsible for the fog development at the SLF and to develop tools to improve fogforecasting skill in support of the Space Shuttle Program, primarily for the de-orbit _ccision.which must be made up to 90 minutes prior to langling. For this investigation, the fog seasonwas defined as beginning October 1 and ending April 30. The study focused on fog events atTI'S which were characterized by rapid deterioration of visibility within a one hour period.
Following are a summary of key results, a brief description of the tools produced to assist theforecasters, in evaluating the potential for fog development, and recommendations for additional
sensors to tmprovc detection of conditions indicative of subsequent fog development.
7.1 Summary of Results
The data analyzed cover a five year period from 1986 to 1990. All fog events within theperiod were identified, and the onset and dissipation times were determined for each fog event.In addition, a detailed analysis was performed on 36 Trs fog events characterized bydeterioration of visibility, As pan of that analysis the fog events were categorized as eitheradvection, pre-frontal or radiation.
The following identifies precursors categorization for each fog type.
Advection fog development:
• Small surface dew point depression (0 ° - 5 ° F, (0 ° - 3°C)) is important.
• Fog forms west of the Trs area first (up to two hours prior to development at the"r'I'S).
Location of the surface ridge axis is crucial in determining the surface wind flow. Ifthe ridge axis is south of Cape Canaveral, chances for fog development increases.
Time series analysis of tower reports is necessary to determine land breeze flow
conditions. A westerly wind component increases the chance for fog formation.
Low-level moisture combined with dry air aloft is important for fog formation. If thelower atmosphere is moist but dries rapidly above 850 mb, fog can occur. If thesounding is moist up to 700 mb, fog is unlikely since this limits the radiationalcooling.
• The strength of the low level inversion is directly proportional to the likelihood offog development. Monitor the 6 to 492 foot temperature inversion at tower 313.
Pre-Frontal fog development:
If a frontal boundary exists from the Florida panhandle to the Cape and is forecast topass the T'I'S area in the next 24 hours, then pre-frontal fog development is possible.
Small surface dew point depression (0 ° - 5°F, (0 ° - 3°C)) is important for fogdevelopment.
39

,,ENSCO
• If fog forms from Daytona Beach to Orlando, the probability of fog at TI'S isincreased.
• A shift in the wind direction to a more west or northwest direction increases the
probability of fog formation at TTS.
• A low level temperature inversion is required for fog formation. Monitor theinversion from 6 - 492 feet at tower 313.
Radiation fog development:
• Generally, fog develops near sunrise.
• Low level moisture (dew point depression of 5°F (3°C) or less) up to 900 mb and
drier air (dew point depression of 5°F (3°C) or more) above 850 mb is necessary for
fog formation. Monitor the 6 - 492 foot relative humidity values from tower 313.
• Surface winds are generally calm or have a weak westerly component (3 knots or
less).
• A westerly shift in the low level wind flow increases moisture advection and
increases the probability of fog.
Key results from the analyses performed in this study are:
• Many precursors associated with fog development such as low level inversion, localtower wind flow at the 54 foot level (westerly flow), and low level moisture (up to
300 feet) can be monitored using existing sensor networks.
• Using decision trees and utilities for monitoring key elements of the local data sets,the forecaster can monitor environmental conditions and forecast the likelihood of
visibility restrictions due to fog or stratus.
• A high number (92%) of the fog events analyzed show a westerly component to thesurface wind. In many events, a westerly shift in the winds is apparent in the wind
tower data prior to the fog development.
• For the advection and pre-frontal events, 83% of the events had fog develop in the
Orlando to Daytona Beach area up to 2 hours prior to development at TI'S.
• The primary onset time for fog development at Trs is between 0700 to 1200 UTC.Almost 95% of all fog events had dissipated (visibility improved to 5 miles or
greater) by 1600 UTC and 75% of the cases improved by 1400 UTC.
• A low level inversion at or below 500 feet is generally present.
• Fog can develop even in the presence of strong winds at 492 feet above the surface.In these cases, the top of the inversion would be below 500 feet.
• The vast majority of the rapid visibility deterioration events occurring between 1986and 1990 were either pre-frontal or advection fog events. Only two of the eventswere associated with radiational cooling.
4O

ENSCO
7.2 Conclusion
The purpose of this task was to develop data bases, analyses, and techniques leading to theimprovement of the 90-minute forecasts made for Space Shuttle Program (SSP) landing facilitiesin the continental United States. The sub task addressed in this report concerns fog developmentthat would affect the less than 7-statute mile visibility rule for End-Of-Mission (EOM) Shuttlelandings at Kennedy Space Center (KSC). This rule was designed to protect against a visibilityrestriction of less than 7 miles developing unexpectedly within the next 90 minutes (i.e., after thede-orbit burn decision and before landing). In order to define the precursors and tools used in
forecasting for fog at KSC, the Applied Meteorology Unit (AMU) developed an extensivedatabase of surface and upper air weather parameters at the Shuttle Landing Facility ('ITS) andthroughout central Florida. As a result of these analyses, the AMU developed an extensive fogclimatology database, forecaster fog decision trees, a fog stability index, and defined the key fogprecursors needed for fog development, fog forecasting and advection into KSC.
The fog climatological analysis indicates that during the fog season there is higher risk for avisibility violation at KSC during the early morning hours (0700 to 1200 UTC), while 95% of allfog events have dissipated by 1600 UTC. A high number of fog events are characterized by awesterly component to the surface wind at KSC (92%) and that 83% of the fog events had fogdevelop west of KSC first (up to 2 hours) as reported at Orlando and Daytona Beach.
A major goal of the study was to identify fog precursors that could be used up to 12 hours inadvance. To address this the AMU developed fog decision trees and forecaster tools andutilities. Using the decision trees as process tools ensures the important meteorological data arenot overlooked in the forecast process. Using the tools and utilities, key fog precursors can bemonitored and evaluated. Using the FSI313 utility a trend can be noted in the fog susceptibilityindex. By monitoring the FSINGM output a fog forecast can be made out to 48 hours. Then bymonitoring the low level precursors using the TWRFOG utility developed by the AMU, theforecaster can monitor and observe the trends in the 54 foot local tower wind flow (westerlyflow increase chance for fog formation), the low level inversion from 6 to 492 feet (the strongerthe inversion the better the chance for fog formation), the relative humidity values at tower 313from 54 to 492 feet (relative humidity reading at or above 70% are needed for fog formation atKSC), and f'mally the local observations can be monitored for fog formation west of KSC.
With these tools and a better understanding of fog formation in the local KSC area, theShuttle weather support forecasters should be able to give the Launch and Flight Directors abetter KSC fog forecast with more confidence.
7.3 Transition Utilities to Operational Use
The MIDDS utilities along with the Fog Forecasting Decision Trees require transition to
operational use. For the RWO, these commands will be incorporated in their existing MIDDS F-Key menu systems. An example of these add on menus will be forwarded to SMG and theMelbourne NWS office for their use. The AMU will help in implementing the menus if
necessary. Also, the AMU briefed the SMG forecasters on the content of this report and hopesto brief the RWO forecasters by May 1994.
7.4 Upgrade MESONET Wind Towers
The majority of the fog events analyzed indicate fog or stratus is advected in from thesouthwest, west or northwest. That area, the St. Johns River basin, is an excellent breeding
ground for fog due to its marshy inland location. As of December 1993, the instrumentationwest of the Banana River to the St. Johns River basin was limited to 15 wind towers (Figure 3.2)
41
ENSCO
with wind direction and speed sensors located at the 54 foot level. Currently, the wind system is
being upgraded and instrumentation to measure temperature, dew point, and relative humidityhas been added to most of the towers.
In addition to the ongoing tower system upgrade, installing visibility sensors at several siteswest of the Banana River from the southwest to northwest would be beneficial. Possiblelocations of these sensors could be towers 0819, 2016, 2202, and 1000. A site survey would be
needed before exact sites are chosen for the visibility sensors. These sensors would provide theSMG and RWO forecasters real-time information on visibility conditions west of the SLF. This
information would allow the forecaster to detect fog development over the St. Johns River valley
and improve fog forecasting skill in support of Shuttle operations. Another option would be toinstaU at least one and possibly two Automatic Surface Observing Sites (ASOS) in the St. JohnsRiver basin area. This option would provide the forecaster all the above data plus clouddefinition information.
42
ENSCO
8.0 References
Johnson Space Flight Center, 1992: Johnson Space Center Flight Rules, paragraph 4-64(A),
pages 4-46, 4-47.
NASA Johnson Space Flight Center and Marshall Space Flight Center, 1988: Shuttle Flight Rule
Workshop on Fog.
Atchison M.K., M.M. Wheeler, G.E. Taylor, J.D. Warburton, and R.S. Schumann, 1993: Shuttle
Landing Facility Cloud Cover Study: Climatological Analysis and Two-Tenths Cloud CoverRule Evaluation, Prepared for NASA Kennedy Space Center Under Contract NAS 10-11844,
57 pp.
45th Weather Squadron, 1988: Terminal Forecast Reference Notebook.
Air Weather Service, 1990: Air Weather Service Forecaster Memo, AWS/FM-90/001, pg 3.
Wheeler M.M., M.K. Atchison, G.E. Taylor, J.D. Warburton, R.S. Schumann, and A.M.Yersavich, 1993: Analysis of Rapidly Developing Fog at the Kennedy Space Center;:
Preliminary Report; Prepared for NASA Kennedy Space Center Under Contract NAS 10-
11844, 49 pp.
43


ENSCO
APPENDIX A: Case Studies
This Appendix contains information on two case studies of two fog events, one categorizedas advection and one as pre-frontal are presented. The advection fog event occurred on 21January 1990. The pro-frontal fog event occurred on 8 February 1989. Both events had severalprecursors indicating the likelihood of fog development at TI'S.
A.1 Advection Case
January 20-22 1990 Case Study
Synoptic Analysis
At 1200 UTC on 20 January 1990, the major synoptic features over the eastern United Statesincluded a low pressure system over northeast Nebraska with a trailing cold front south acrossMissouri, Western Tennessee, Mississippi, extending southward into the Gulf of Mexico (seeFigure A-l). A warm front extended from this low across Kentucky to South Carolina and intothe Atlantic Ocean. A weak high pressure ridge was located over northern Florida. This ridgewas providing central and south Florida with a moist low-level southeasterly flow. At 500 and700 mbs the ridge was to the south of the Cape Canaveral area which provided southwest flow atthose levels. Over the northern sections of Florida, the flow was from the south and southwest
from the surface up to 500 mb. During the early morning hours of 20 January,weather conditions varied considerably over the central sections of Florida. To the west andnorth of Cape Canaveral, winds were weaker thus limiting low-level mixing and resulting inmore significant fog formation. Both Daytona Beach and Orlando reported dense fog for severalhours prior to and near sunrise. Winds at both of these sites were 2 to 3 knots with temperaturesin the 60-65°F range. Between 0600 and 0900 UTC fog was forming from Orlando to DaytonaBeach. By 1200 UTC, some fog was reported at Titusville with visibility reduced to 4 miles. AtTTS patchy ground fog was reported from 0700 to 1300 UTC, but the visibility never droppedbelow 9 miles. In addition, areas to the south of KSC (i.e., Melbourne, Veto Beach, PatrickAFB) remained basically clear with no fog or low level stratus. During the afternoon of 20January, winds continued to be from the southeast at 8-15 kts with some gusts to 20 knots alongthe coast. Temperatures were near 80°F along the coast to the mid-80s in the Orlando area withdew points remaining in the 60s.
During the afternoon of 20 January and early on 21 January the low-level surface pressureridge shifted to south Florida. As shown in Figure A-2, at 1200 UTC on 21 January the surfaceridge was located over south Florida with a cold front moving into the western panhandle of thestate. Most areas of north and central Florida ahead of the cold front experienced southwesterlylow-level wind flow with widespread low stratus and fog conditions. Temperatures and dew
points at this time were in the mid 60s.
A-1


o
o
z
I--
ENSCO
\
\\
\\
L
Figure A- 1.
A-2


ENSCO
Mesoscale Analysis
The low-level wind structure prevented fog formation at TrS on 20 January. As shown bythe CCAFS sounding at 1115 UTC (Figure A-3), the low-level winds (1000 mb) were from thesoutheast at 15 knots. This southeast flow kept the lower boundary layer warmer with enoughmixing to prevent fog formation near the coast from KSC southward. Sunrise temperatures atseveral of the coastal towers were in the upper 60s (°F) with wind speeds of 5-7 knots.
Weather conditions were quite different at TI'S on 21 January compared to 20 January. Asthe low-level surface ridge shifted southward the winds turned more to the south and eventuallysouthwest and west. This change in wind flow is quite evident from the 21 January 1115 UTCCCAFS sounding (Figure A-4). In addition, the low-level inversion on 21 January wasapproximately twice as strong as the 20 January inversion. On 20 January the inversion was 20mb deep with a +3°C increase in temperature from bottom to top, while on 21 January theinversion was 10 mb deep with a +5°C increase in temperature to the top of the inversion. On21 January fog formed at Orlando at 0800 UTC, at Daytona Beach at 0830 UTC, and at "ITS at0916 UTC. The low-level winds shifted from a south-southwest component to more westerlyaround 0900 UTC (see Figure A-5). Simultaneously, temperatures dropped and the temperature-dew point spread decreased. This shift to a westerly wind advected cooler and more saturatedair from the mainland resulting in fog formation at TTS. The westerly wind also may have beenassociated with the advection of thicker fog and stratus from the St. Johns River valley.
A-3


ENSCO
%
\
/
Figure A-2. Surface Analysis for 21 January 1990 at 1200 UTC
A-4


ENSCO
19900120 1115 Z700 mb
800 mb
900 mb
1000 mb
Figure A-3.
Figure A-4.
010 0(3 20 o(3 30 0(3
CCAFS Sounding at 1115 UTC on 20 January 1990
19900121 1115 Z700 mb
800mb
900 mb
1000 mb
10 o(3 20 °13 30"°(3
CCAFS Sounding at 1115 UTC on 21 January 1990
J
A-5
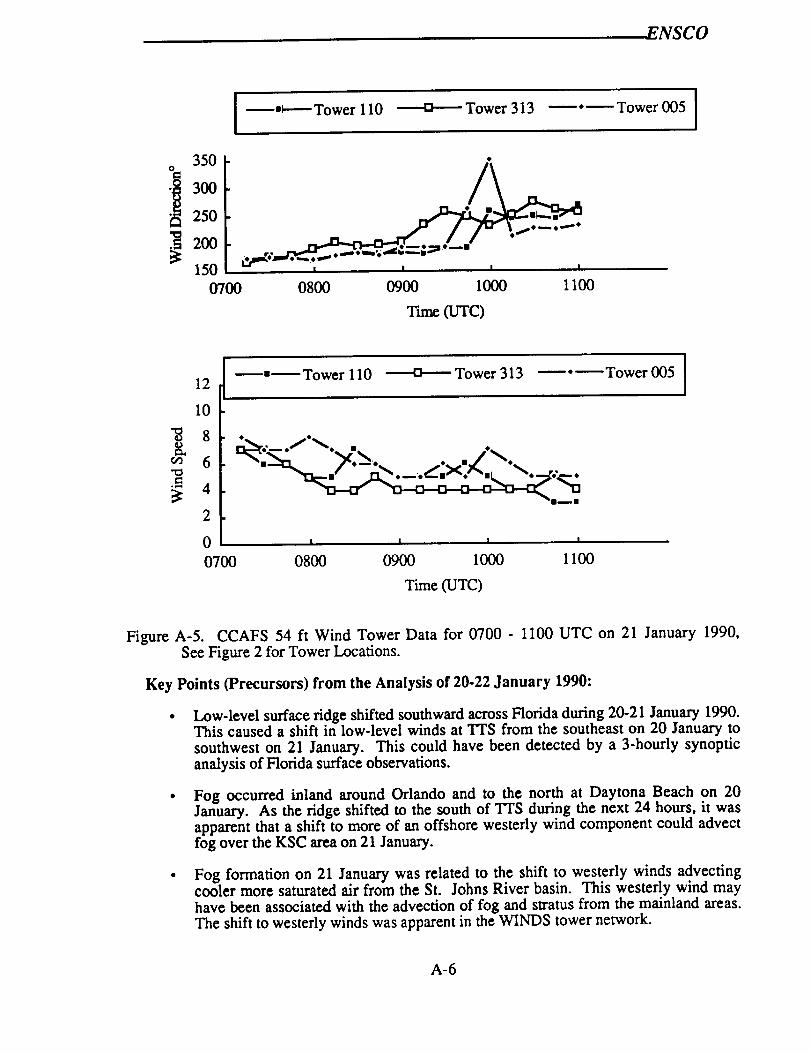
ENSCO
I --=_----Tower 110 ----'O----Tower 313 --.--Tower005 [
350
300
250
• 200
150
0700 0800 0900 1000 1100
T'm_ (UTC)
-#
12
10
8
6
4
2
0
0700
--=--Tower 110 ---=--o---- Tower 313 --•--Tower 005
I I I I
0800 0900 1000 1100
Time (UTC)
Figure A-5. CCAFS 54 ft Wind Tower Data for 0700 - 1100 UTC on 21 January 1990,
See Figure 2 for Tower Locations.
Key Points (Precursors) from the Analysis of 20-22 January 1990:
Low-level surface ridge shifted southward across Florida during 20-21 January 1990.This caused a shift in low-level winds at "ll'S from the southeast on 20 January to
southwest on 21 January. This could have been detected by a 3-hourly synoptic
analysis of Florida surface observations.
Fog occurred inland around Orlando and to the north at Daytona Beach on 20January. As the ridge shifted to the south of "ITS during the next 24 hours, it was
apparent that a shift to more of an offshore westerly wind component could advectfog over the KSC area on 21 January.
Fog formation on 21 January was related to the shift to westerly winds advectingcooler more saturated air from the St. Johns River basin. This westerly wind may
have been associated with the advection of fog and stratus from the mainland areas.
The shift to westerly winds was apparent in the WINDS tower network.
A-6

ENSCO
A.2 Pre-Frontal Case
February 7-9 1989 Case Study
Synoptic Analysis
At 1200 UTC on 7 February 1989 (Figure A-6), the major synoptic features over the easternUnited States included a low pressure system over the Tennessee/North Carolina border with a
cold front trailing across central Georgia into the Florida Panhandle near Panama City then intothe central Gulf of Mexico. A high pressure cell was centered over Texas. A high pressure
ridge was located over Florida up through 500 mb. As shown by the 1030 UTC CCAFSsounding on 7 February (Figure A-7), this ridge was providing the Cape region with a west tosouthwesterly surface flow pattern at 10-20 knots. Significant moisture was present up to 850mb with drier air aloft. During the early morning hours on 7 February, temperature and dew
points over central Florida were generally.in the low to mid 60s (°F) with patchy fog over inlandareas. Surface winds in the early morning were southwesterly at 1-3 knots. By afternoon,
temperatures had risen into the low to mid 80s (°F) with dew points in the mid 60s (°F). Windswere southwesterly at 5-10 knots, but by late afternoon a weak sea breeze developed alongcoastal sections.
By early on 8 February (Figure A-8), the cold front continued to move to the southeast andwas located from the North Carolina/South Carolina shoreline to just south of Jacksonville to
Cross City, Florida and into the Gulf of Mexico. With the approach of the frontal system, thelow-level winds over central Florida became more westerly at speeds of 5 knots. Winds aloftcontinued to be west to southwest at 10-20 knots. Fog was widespread over the state north of a
Tampa Bay-Vero Beach line. Visibility in many sections of central Florida was reduced to 1/4mile or less with low stratus ceilings and even drizzle reported at several stations. Temperatures
and dew points were generally in the low to mid 60s (°F). The fog and stratus lifted around1700 UTC with temperatures rising into the upper 70s to near 80°F. The cold front continued tomove slowly southward during the afternoon passing the Cape Canaveral region atapproximately 2000 UTC. Winds prior to frontal passage were generally westerly at 5 knots, butthen became northerly at 10 knots after frontal passage.
A-7


ENSCO
/
Figure A-6 Surface Analysis on 7 February 1989 at 1200 UTC.
A-8

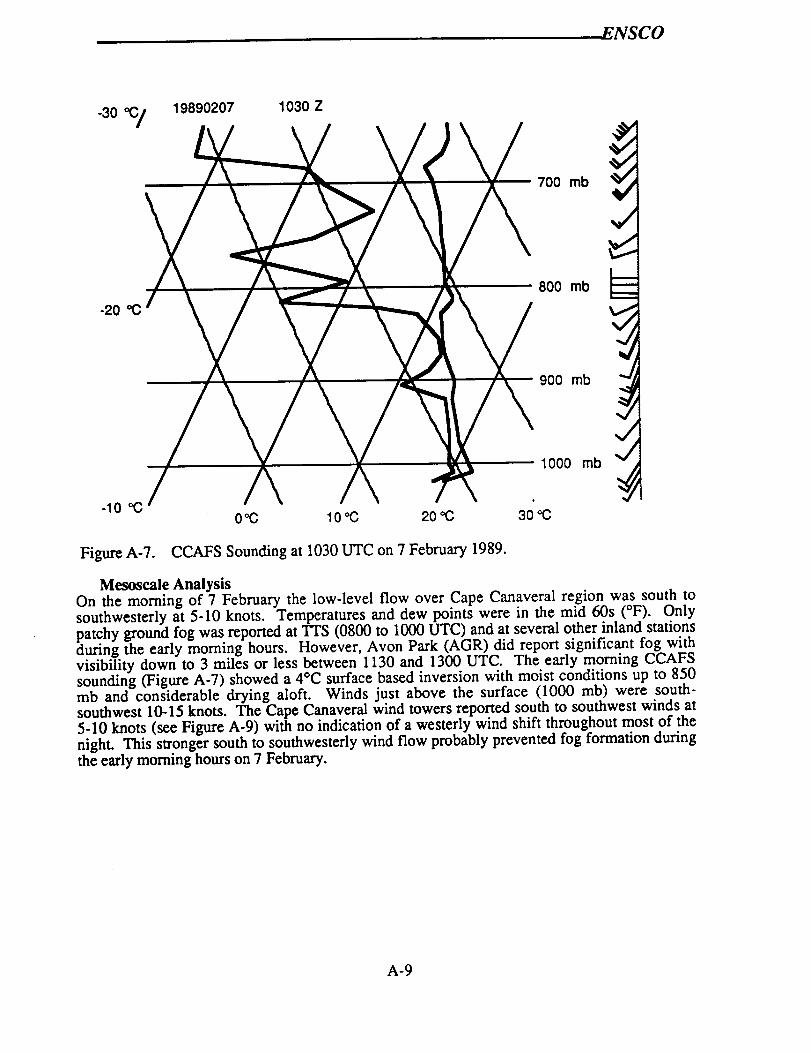
ENSCO
-20 0(3
-10 *(3
19890207 1030 Z
OOC 10oC 200(3 30 ':'C
700 mb
800 mb
900 mb
1000 mb
V
,,j
Figure A-7. CCAFS Sounding at 1030 UTC on 7 February 1989.
Mesoseale AnalysisOn the morning of 7 February the low-level flow over Cape Canaveral region was south tosouthwesterly at 5-10 knots. Temperatures and dew points were in the mid 60s (°F). Only
patchy ground fog was reported at TTS (0800 to 1000 UTC) and at several other inland stationsduring the early morning hours. However, Avon Park (AGR) did report significant fog withvisibility down to 3 miles or less between 1130 and 1300 UTC. The early morning CCAFSsounding (Figure A-7) showed a 4°C surface based inversion with moist conditions up to 850mb and considerable drying aloft. Winds just above the surface (1000 mb) were south-southwest 10-15 knots. The Cape Canaveral wind towers reported south to southwest winds at5-10 knots (see Figure A-9) with no indication of a westerly wind shift throughout most of the
night. This stronger south to southwesterly wind flow probably prevented fog formation during
the early morning hours on 7 February.
A-9


ENSCO
r
.J
1
Figure A-8. Surface Analysis on 8 February 1989 at 1200 UTC.
A-IO

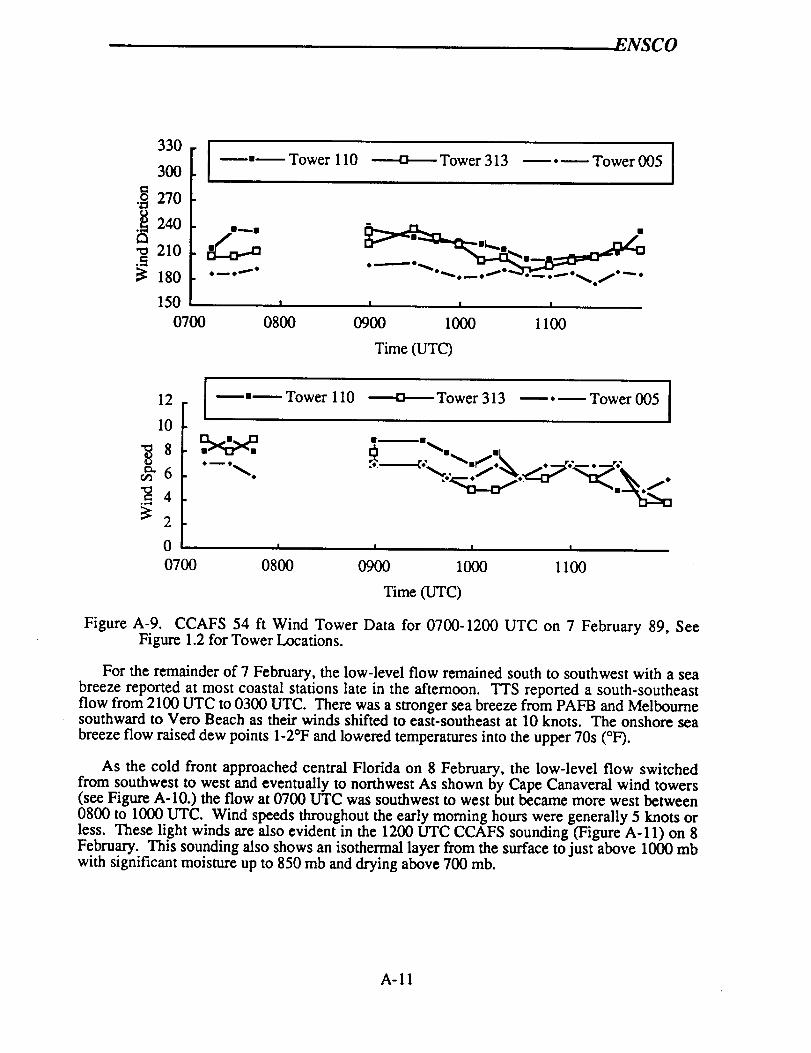
ENSCO
330
300
_> 270"Z:l
._240
._ 210
18o
150
070O
[ _,_Tower 110 ------Q_Tower313 _,_Tower005 [
Omi_ 0
I I I I
0800 0900 1000 1100
Time (UTC)
12
10
_6
= 4
_,_Tower 110 _Tower313 _._ Tower 005 [
r_l_l I I
2
0 I I I I
0700 0800 0900 1000 1100
Time (UTC)
Figure A-9. CCAFS 54 ft Wind Tower Data for 0700-1200 UTC on 7 February 89, SeeFigure 1.2 for Tower Locations.
For the remainder of 7 February, the low-level flow remained south to southwest with a seabreeze reported at most coastal stations late in the afternoon. Trs reported a south-southeastflow from 2100 UTC to 0300 UTC. There was a stronger sea breeze from PAFB and Melbournesouthward to Vero Beach as their winds shifted to east-southeast at 10 knots. The onshore sea
breeze flow raised dew points 1-2°F and lowered temperatures into the upper 70s (°F).
As the cold front approached central Florida on 8 February, the low-level flow switchedfrom southwest to west and eventually to northwest As shown by Cape Canaveral wind towers(see Figure A-10.) the flow at 0700 UTC was southwest to west but became more west between
0800 to 1000 UTC. Wind speeds throughout the early morning hours were generally 5 knots orless. These light winds are also evident in the 1200 UTC CCAFS sounding (Figure A-11) on 8February. This sounding also shows an isothermal layer from the surface to just above 1000 mbwith significant moisture up to 850 mb and drying above 700 mb.
A-11

ENSCO
360
330 I _=_Tower 110 -----u-----Tower313 _*_ Tower 005 ]
._ 300
270240
210
180
0700
! I I
0800 0900 1000
Time Ct.rl'C)
I
1100
r-!
12
10
_6
=4°v.,l
_•_ Tower 110 ----u-----Tower 313 _*_ Tower 005
2
0 I I I I
0700 0800 0900 1000 1100
Time (UTC)
Figure A-10. CCAFS 54 ft Wind Tower Data for 0700-1200 UTC on 8 February 89, See
Figure 2 for Tower Locations.
A-12

ENSCO
19890208
7OO mb
-20 °C800 mb
LI.._.
I.
t.--.
-10 °C
900 rnb
1000 mb
J
O°C 10 °C 20 °C 30 °(3
Figure A-11. CCAFS Sounding at 1200 UTC on 8 February 1989
On 8 February, the first fog report in central Florida was at Daytona Beach at 0650 UTC (6miles visibility) with thicker fog (3/8 mile visibility) developing between 0800 and 0900 UTC.Fog was not reported in the Orlando region until 1100 UTC. Fog was reported at TI'S at 1203UTC approximately 2 hours after the northwest wind shift occurred over Cape Canaveral (seewind tower plots). By 1300 UTC the flow continued to be from the northwest at 5-8 knots at"ITS with thicker fog being advected from the northwest and visibility decreasing to less than 1mile. Fog continued to restrict visibility until 1530 UTC at 'I'TS with lower stratus persistinguntil 1700 UTC. By 1800 UTC the fog and stratus had lifted allowing temperatures to rise tonear 80 °F with only cumulus and higher level cirrus reported. Winds over the area continued tobe from the west at around 5 knots. The cold front passed the Cape region at 2000 UTC with theflow becoming northerly at 10-15 knots. Behind the front lower stratus clouds moved into the
area from the north with temperatures dropping down into the lower 70s (°F) by 2100 UTC.
A-13

ENSCO
Key Points (Precursors) from Analysis of 7.9 February 1989
Approaching cold front over Florida caused the lower level winds to changeconsiderably during 7-8 February 1989. Low-level winds at TI'S shifted from south-southwest on 7 February to west and northwest on 8 February.
As the cold front approached Tr$, the lower level winds weakened from 10 knots on7 February to 5 knots or less on 8 February. This reduced vertical mixing and
facilitated fog formation in the boundary layer.
• Fog first formed to the northwest on 8 February (i.e., Daytona Beach) at least 2-3hours before onset at "ITS.
• Fog occurred at Trs approximately 2 hours after a wind shift from west to northwestover the Cape wind tower network.
A-14

REPORT DOCUMENTATION PAGE Form ApprovedOM B No. 0704-0188
1. AGENCY USE ONLY (Lmve blank) 2. REPORT DATE 3. REPORT TYPE AND DATES COVERED
May 1994 Contractor Report4. TITLE AND SUBTITLE S. FUNDING NUMBERS
Analysis of Rapidly Developing Fog at the Kennedy SpaceCenter, 1986-1990, Final Report• _r.o_s) C-NAS 10-11844Mark M. Wheeler, Michael K. Atchison, Robin Schumann,
Greg E. Taylor, Ann Yvrsavich, John D. Warburton7. PERFORMING ORGANIZATION NAME(S) AND ADDRESS(ES)
ENSCO, Inc.,445 PinedaCourt,Melbourne,FL 329409.SPONSORING/MONITORINGAGENCYNAME(S)ANDADDRESS<ES)
NASA, John F. Kennedy Space Center, Code TM-LLP-2,Kennedy Space Center, FL 32899
e. PERFORMING ORGANIZATIONREPORT NUMBER
94-00210. SPONE_ORING/MONITORING
AGENCY REPORT NUMBER
CR-195888
11. SUPPLEMENTARY NOTES
Subject Cat: #47 (Weather Forccastin$)12A. DISTRIBUTION/AVAILABIUTY STATEMENT
Unclassified -Unlimited12B. DISTRIBUTION CODE
13. ABSTRACT (Maximum 200 Words)
This report docun_nts fog precursors and fog climatology at Kennedy Space Center (KSC) Floridafxom 1986 to1990. The majoremphasisof thisreportfocusedon rapidlydevelopingfogeventsthatwould affectthelessthan7-statutemilevisibilityruleforEnd-Of-Mission(EOM) ShuttlelandingatKSC (Rule4-64(A)).The AMU's work isto:developa databaseforstudyoffogassociatedweatherconditionsrelatingtoviolationsofthislandingconstraint;developforecasttechniquesorrules-of-thumbtodeterminewhetherornotcurrentconditionsarelikelytoresultinanacceptableconditionatlanding;validatetheforecasttechniques;and transitiontechniquestooperationaluse.As partoftheanalysisthefogeventswerecategorizedaseitheradvection,pre-frontalorradiation.As aresultoftheseanalyses,theAMU developedafogclimatologicaldatabase,identifiedfogprec_ anddevelopedforecastertoolsandI
decisiontrees.The fogclimatologicalanalysisindicatesthatduringthefogseason(OctobertoApril)thereisa higherriskfora visibilityviolationatKSC duringtheearlymorninghours(0700to 1200UTC). while95% ofallfogeventshavedissipatedby 1600UTC. A highnumber offogeventsarecharacterizedby awesterlycomponenttothesurfacewindatKSC (92%)and 83% ofthefogeventshadfogdevelopwestofKSC first(upto2 hours).The AMU developedfogdecisiontreesand forecastertoolsthatwouldhelptheforecasteridentifyfogprecursorsup to12hoursinadvance.Usingthedecisiontreesasprocesstoolsensurestheimportantmeteorologicaldataarenotoverlookedintheforecastprocess.
With thesetoolsand a betterunderstandingof fogformationinthelocalKSC area.theShuttleweathersupportforecastershouldbe abletogivetheLaunch and FlightDirectorsa betterKSC fogforecastwithmoreconfidence.
14. SUBJECT TERMS 15. NUMBER OF PAGES 6"7
Space Shuttle, Fog, Climatolo_, Weather Analysis, KSC _e. PRICECODE17. aECURITY CLASSIFICATION 18. SECURITYCLASSFICATION 19. _ECURITY CLASSIFICATION 20, LIMITATION OF ABSTRACT
OF REPORT OF THIS PAGE OF ABSTRACT
UNCLASSIFIED UNCLASSIFIED UNCLASSIFIED NONE
