national-academies.org - advancing climate change technology -- the … · 2015-02-04 · 1 march...
TRANSCRIPT

1
March 14, 2008
The National Academies Summit on America’s Energy Future
Advancing Climate Change Technology --The Key to Multi-Goal Convergence
Dr. Robert C. MarlayDeputy Director, U.S. Climate Change Technology Program
Office of Policy and International AffairsU.S. Department of Energy
13 - 14 March 2008Washington, DC

2
March 14, 2008
U.S. Climate Change Technology Program
U.S. Climate Change Technology ProgramMission – Accelerate RD&D on Adv. CC TechsScope – Ten Federal R&D AgenciesBudget -- $4.4 Billion Requested for FY’09Activities – Coord.RD&D Planning & Budgeting
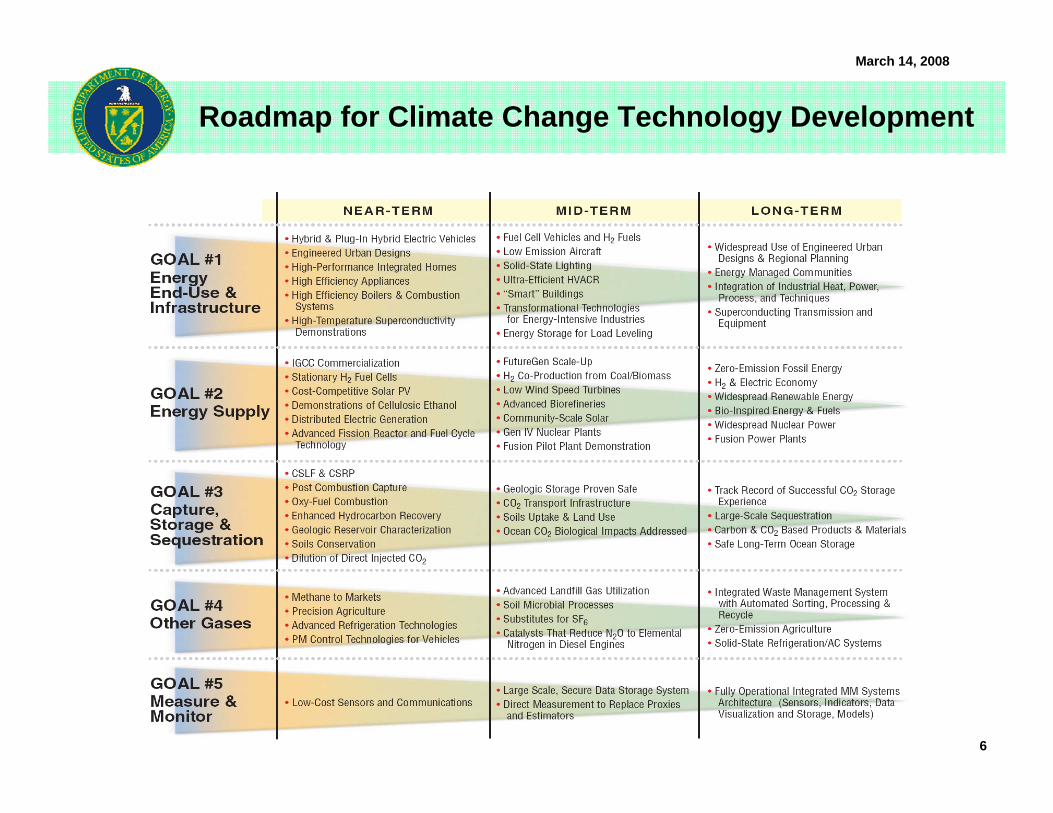
Goals:Four emissions-related strategic goals:
Reduce emissions from energy end use & infrastructure;Reduce emissions from energy supply;capture & sequester CO2; andReduce emissions from non-CO2 gases.
Two cross-cutting, supporting strategic goals:Improve capabilities to measure & monitor GHGs; andBolster basic science and strategic research.
CCTP authorized in EPAct2005. Led by DOE.
www.climatetechnology.gov

3
March 14, 2008
Technical Goals Set Within Context of United Nations Framework Convention on Climate Change
Concentration TrajectoriesEmission Trajectories
750ppm650ppm550ppm450ppm350ppm
750ppm650ppm550ppm450ppm350ppm
Emission and concentration trajectories based on level of effort for technology investments
Potential carbon reductions based on more aggressive technology investments
Relevant planning window to influence longer-term outcomes
Peta
gram
(bill
ions
of m
etric
tons
) of C
arbo
n pe
r yea
r (Pg
C/y
r)
Relevant Planning Window
Relevant Planning Window
Wigley, Richels, Edmonds, Nature, 1996

4
March 14, 2008
The Technical Challenge – Reduce GHGs Toward Near Net-Zero Emissions Future
GtC = Giga-Tonnes Carbon
0
5
10
15
20
25
2000 2010 2020 2030 2040 2050 2060 2070 2080 2090 2100
Year
CO2 E
mis
sion
s (G
tC/y
r)
Cumulative Emissions ~ 900 GtC
Hypothetical Unconstrained Emissions Scenario
Hypothetical Reduced Emissions Scenario
1st GtC Avoided
Cumulative Emissions ~ 900 GtC
1st GtC Avoided
Cumulative Emissions ~ 900 GtC
1st GtC Avoided1st GtC Avoided
~15 GtCAvoided Emissions
~ 600 GtC
Cumulative Emissions ~ 900 GtC
Hypothetical Unconstrained Emissions Scenario
Hypothetical Reduced Emissions Scenario
1st GtC Avoided
Giga-Tonne = Billion (109) Metric-Tonnes (1000 Kilograms)

5
March 14, 2008
Results of An Integrated Assessment
Source: Clarke, L., M. Wise, M. Placet, C. Izaurralde, J. Lurz, S. Kim, S. Smith, and A. Thomson. 2006. Climate Change Mitigation: An Analysis of Advanced Technology Scenarios. Richland, WA: Pacific Northwest National Laboratory.
6
March 14, 2008
Roadmap for Climate Change Technology Development
7
March 14, 2008
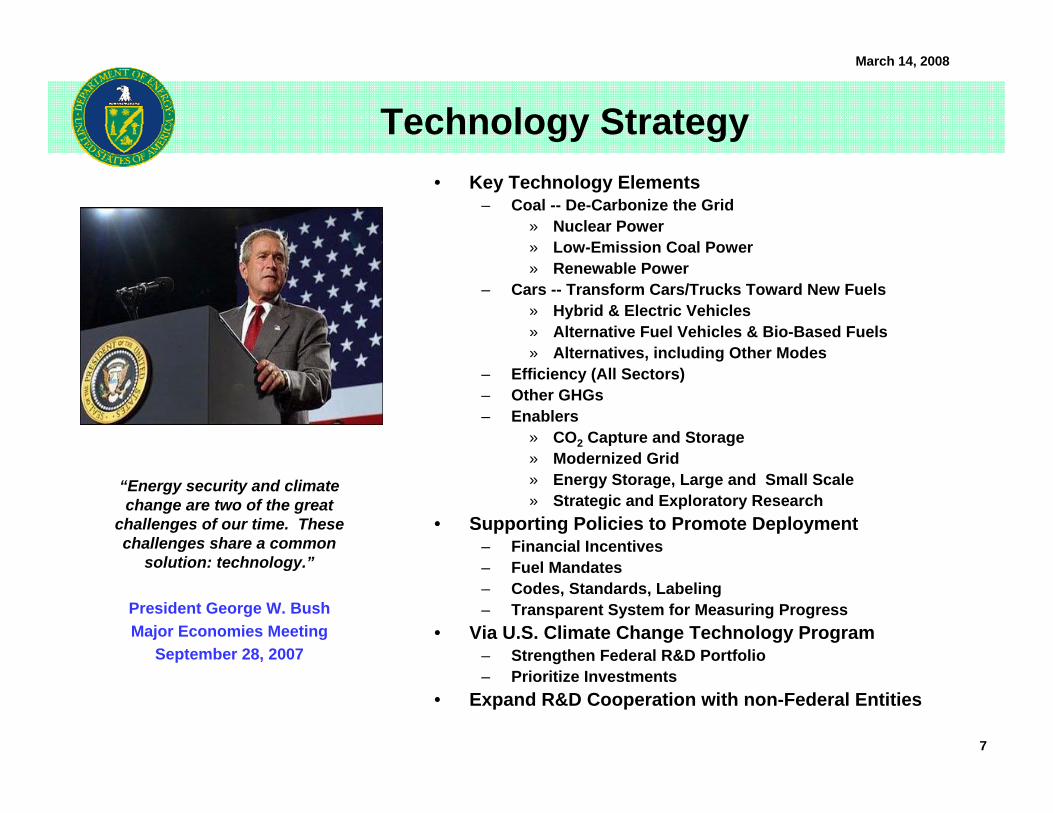
Technology Strategy
“Energy security and climate change are two of the great
challenges of our time. These challenges share a common
solution: technology.”
President George W. BushMajor Economies Meeting
September 28, 2007
Key Technology Elements– Coal -- De-Carbonize the Grid
» Nuclear Power» Low-Emission Coal Power» Renewable Power
– Cars -- Transform Cars/Trucks Toward New Fuels» Hybrid & Electric Vehicles» Alternative Fuel Vehicles & Bio-Based Fuels» Alternatives, including Other Modes
– Efficiency (All Sectors)– Other GHGs– Enablers
» CO2 Capture and Storage» Modernized Grid» Energy Storage, Large and Small Scale» Strategic and Exploratory Research
Supporting Policies to Promote Deployment– Financial Incentives– Fuel Mandates– Codes, Standards, Labeling– Transparent System for Measuring Progress
Via U.S. Climate Change Technology Program– Strengthen Federal R&D Portfolio– Prioritize Investments
Expand R&D Cooperation with non-Federal Entities
8
March 14, 2008
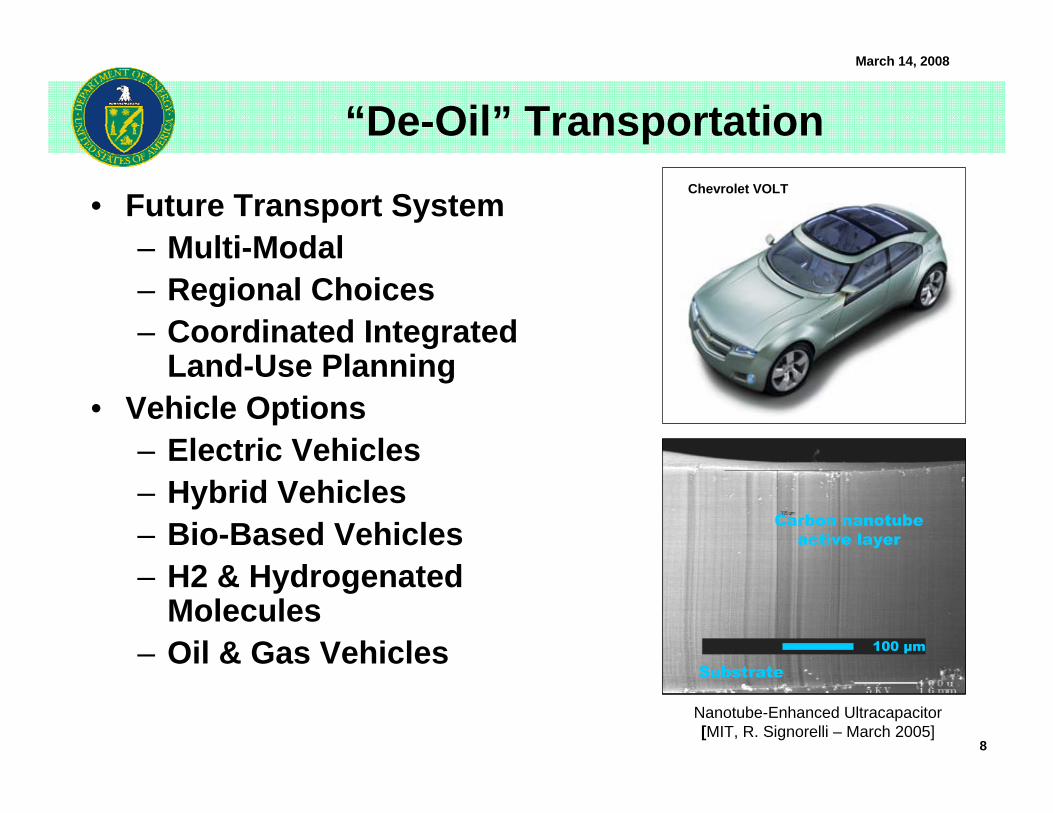
“De-Oil” Transportation
Future Transport System– Multi-Modal– Regional Choices– Coordinated Integrated
Land-Use PlanningVehicle Options– Electric Vehicles– Hybrid Vehicles– Bio-Based Vehicles– H2 & Hydrogenated
Molecules– Oil & Gas Vehicles
Nanotube-Enhanced Ultracapacitor[MIT, R. Signorelli – March 2005]
Chevrolet VOLT
Carbon nanotube active layer
100 μm
Substrate

9
March 14, 2008
“De-Carbonize” the Electric Grid
0
10
20
30
40
50
60
70
80
90
2000 2010 2020 2030 2040 2050 2060 2070 2080 2090 2100
Trill
ion
kWh/
yr
W ind, Solar, Biomass, O therNuclearCoal IGCC w/ CCSCoal w/o CCSGas CC w/CCSGas w/o CCSOil w/CCSOil w/o CCS

10
March 14, 2008
FY 2009 Budget – Good News
0.0
1000.0
2000.0
3000.0
4000.0
5000.0
FY01 FY02 FY03 FY04 FY05 FY06 FY07 FY08 FY09
CCTP Budget History FY 2009 CCTP Total = $4.4 Billion
11
March 14, 2008
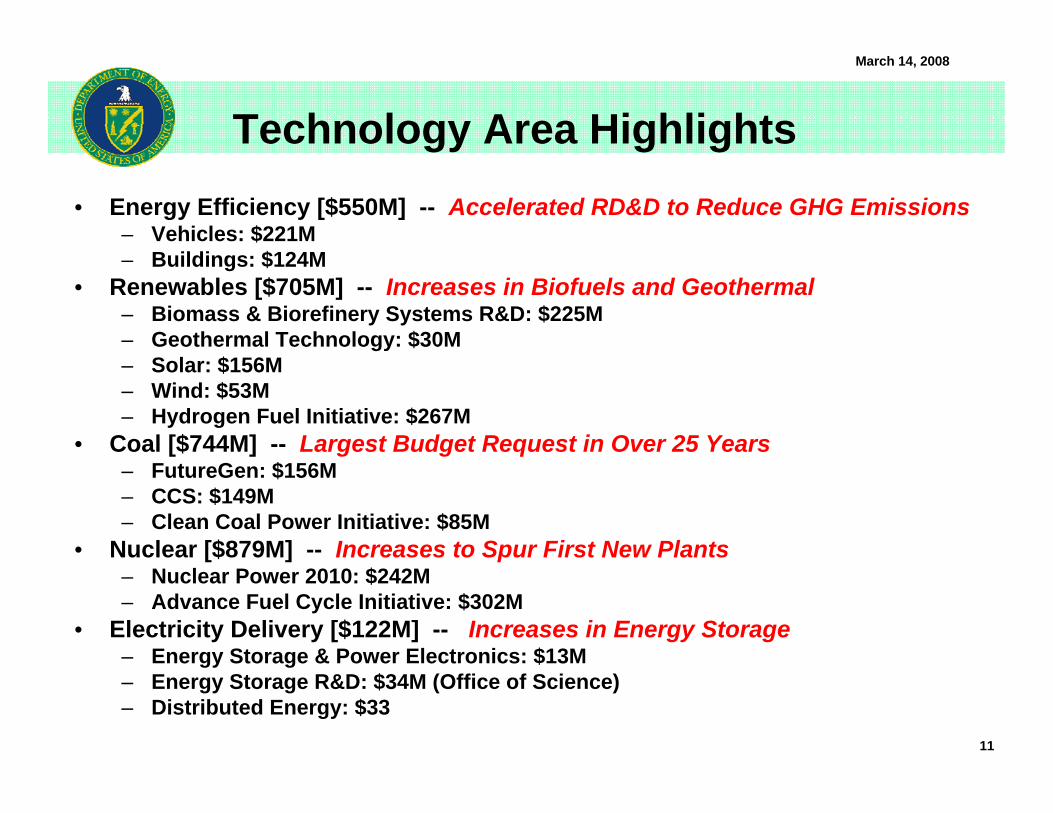
Technology Area HighlightsEnergy Efficiency [$550M] -- Accelerated RD&D to Reduce GHG Emissions
– Vehicles: $221M – Buildings: $124M
Renewables [$705M] -- Increases in Biofuels and Geothermal– Biomass & Biorefinery Systems R&D: $225M– Geothermal Technology: $30M– Solar: $156M– Wind: $53M– Hydrogen Fuel Initiative: $267M
Coal [$744M] -- Largest Budget Request in Over 25 Years– FutureGen: $156M– CCS: $149M– Clean Coal Power Initiative: $85M
Nuclear [$879M] -- Increases to Spur First New Plants– Nuclear Power 2010: $242M– Advance Fuel Cycle Initiative: $302M
Electricity Delivery [$122M] -- Increases in Energy Storage– Energy Storage & Power Electronics: $13M– Energy Storage R&D: $34M (Office of Science) – Distributed Energy: $33

12
March 14, 2008
HypothesisAmerica’s “Energy Future” Aspires to Attain Multiple Goals:– Economic Growth and Prosperity
– Quality of Life, Health and Respect for the Environment
– Clean, Reliable, Affordable Energy Supply
– National Security and Global Stability
– Climate Protection
These Goals Are Inextricably Intertwined – They Can Be, But Are Not Fundamentally, in Conflict
The “Long-Pole” in the Tent is Climate Change
If Society Were to Transform Itself to Meet the UNFCCC’s Goal– It Would Achieve Climate Protection, and
– See “Convergence” in the Attainment of the Other Goals

13
March 14, 2008
America’s Energy Future is Linked to Solutions for Climate Change
Energy SecurityTechnologies
85%Convergence
Exceptions:• Coal to Liquids• Oil Shale• Methane Hydrates• Petroleum Reserves
Exceptions:• Non-CO2 Gases• Forestry/Land Use• Agriculture• Terrestrial Sequestration
Climate ChangeTechnologies

14
March 14, 2008
Energy Security Metric Under Least-Cost Advanced Technology Climate Change Scenarios
Oil Intensity of U.S. Economy
0
1
2
3
4
5
1970
1980
1990
2000
2010
2020
2030
2040
2050
2060
2070
2080
2090
2100
Year
Oil
/ GD
P (m
bo p
er d
ay /
$T)
EIA & BEA* Reference Case CCTP Advanced Technology Case
Historical Data Projections
Japan, 1989
* Sources:1) Energy Information Agency & Bureau of Economic Analysis2) DOE National Energy Strategy, 1991, Figure 23) CCSP, Synthesis and Assessment Product 2.1, Scenarios of Greenhouse Gas Emissions and Atmospheric Concentrations, Oct. 20074) Clark et. all, “Climate Change Mitigation: An Analysis of Advanced Technology Scenarios,” PNNL-16078, September 2006, (Addendum added April 2007
15
March 14, 2008
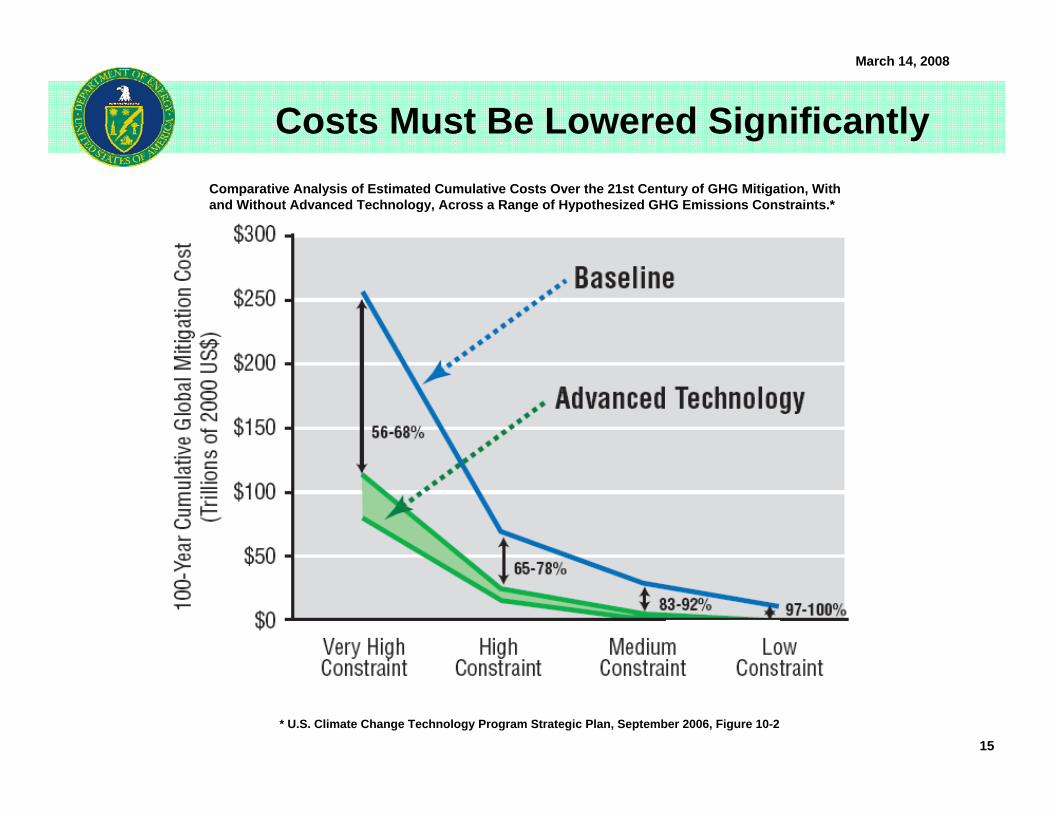
Costs Must Be Lowered SignificantlyComparative Analysis of Estimated Cumulative Costs Over the 21st Century of GHG Mitigation, With and Without Advanced Technology, Across a Range of Hypothesized GHG Emissions Constraints.*
* U.S. Climate Change Technology Program Strategic Plan, September 2006, Figure 10-2
16
March 14, 2008
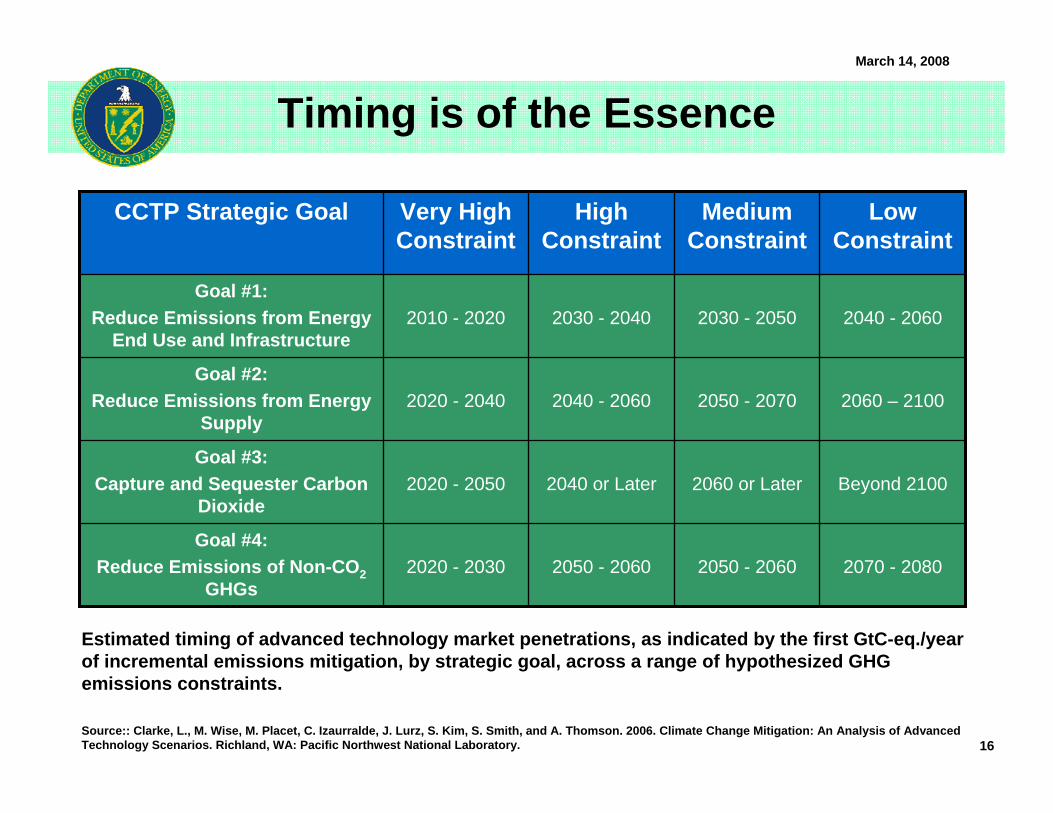
Timing is of the Essence
2070 - 20802050 - 20602050 - 20602020 - 2030Goal #4:
Reduce Emissions of Non-CO2GHGs
Beyond 21002060 or Later2040 or Later2020 - 2050Goal #3:
Capture and Sequester Carbon Dioxide
2060 – 21002050 - 20702040 - 20602020 - 2040Goal #2:
Reduce Emissions from Energy Supply
2040 - 20602030 - 20502030 - 20402010 - 2020Goal #1:
Reduce Emissions from Energy End Use and Infrastructure
Low Constraint
Medium Constraint
High Constraint
Very High Constraint
CCTP Strategic Goal
Estimated timing of advanced technology market penetrations, as indicated by the first GtC-eq./year of incremental emissions mitigation, by strategic goal, across a range of hypothesized GHG emissions constraints.
Source:: Clarke, L., M. Wise, M. Placet, C. Izaurralde, J. Lurz, S. Kim, S. Smith, and A. Thomson. 2006. Climate Change Mitigation: An Analysis of Advanced Technology Scenarios. Richland, WA: Pacific Northwest National Laboratory.

17
March 14, 2008
Key Barriers
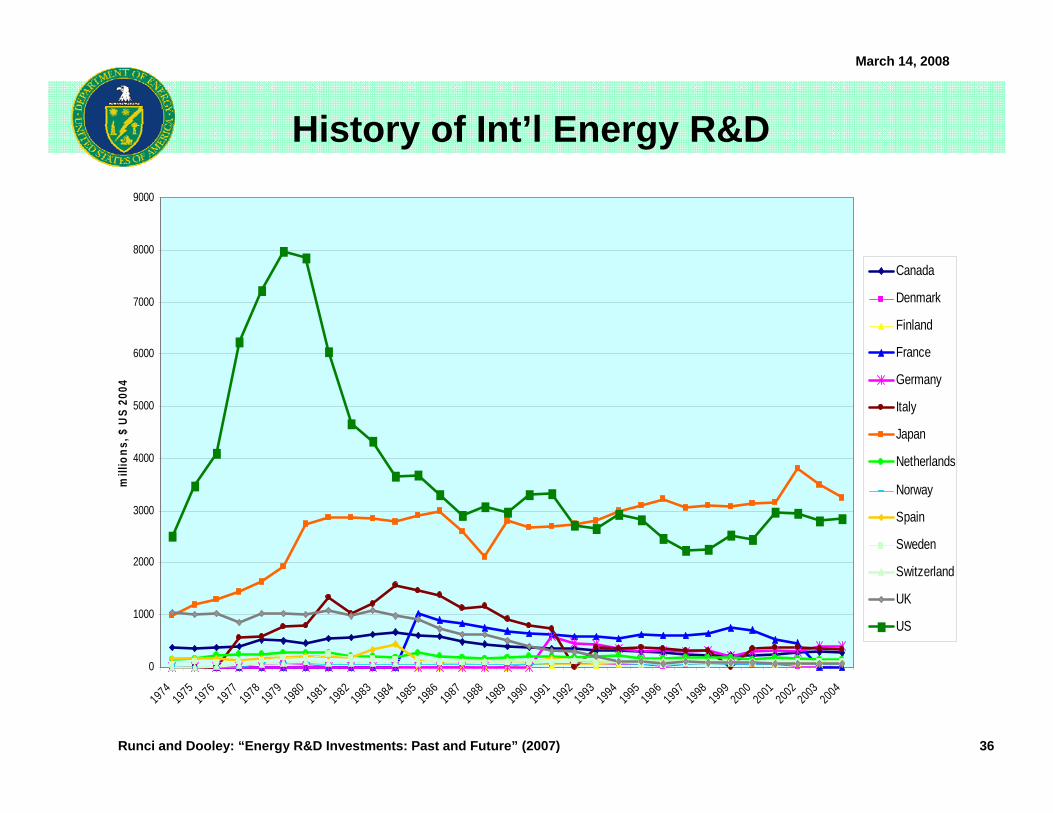
Level of Global RD&D Investment– Pace of Progress Likely Too Slow – U.S. Federal RD&D is Increasing, but Constrained– Only Two Countries (U.S., Japan) Account for 80 Percent– Other Government’s RD&D Decreasing
Market Signals to Motivate Private Innovation & Invest.– Many Near-Term Measures, Incentives, Mandates– But Private Sector Incentives Are Limited w/Out Market Signals– How Best to Internalize CC “Externalities”– Needed Prices May Be Too High w/Out Innovation– Compromise Prices May Be Too Low to Spur Innovation
International Framework for Burden Sharing – The Ultimate Goal is “Net-Zero” Emissions– Global Participation is Essential – Need for Realistic Goals and Commitments– Measurement, Reporting and Verification– Issues of Equity and Leakage – Finance and Trade in Environmental Goods & Services

RD&D
* In view of various hypothetical RD&D portfolios and other factors. Check marks are representational of the process and should not be construed as results of extant situations.Key: Very Likely (90-100%); Likely (60-90%); Maybe (40-60%); Unlikely (10-40%); Very Unlikely (0-10%)

19
March 14, 2008
Historical Perspective on DOE Spending
U.S. DOE Energy RD&D 1978-FY2008 Administration Request
0.0
1000.0
2000.0
3000.0
4000.0
5000.0
6000.0
7000.0
1978
1979
1980
1981
1982
1983
1984
1985
1986
1987
1988
1989
1990
1991
1992
1993
1994
1995
1996
1997
1998
1999
2000
2001
2002
2003
2004
2005
2006
2007 Req
uest
2008 Req
uest
mill
ion
2000
$
Hydrogen (non-fossil)
Electricity T&D
Fossil (including CCT demo)
Renewables
Efficiency
Fusion
Fission
2009
2010
2011
2012
2013
Flat
Times “2”
Times “3”
ScaleIndicators
Est. AnnualSubsidy for
Ethanol in 2006
Gallager, K.S., Energy Technology Innovation Project, Belfer Center for Science & International Affairs, KennedySchool of Government, Harvard University, Cambridge, MA

20
March 14, 2008
0.0
25.0
50.0
75.0
100.0
125.0
150.0
2000
2010
2020
2030
2040
2050
2060
2070
2080
2090
2100
$/M
T C
O2
Incentives for Transformational Innovation
70%19%$27.30Coal (S-Ton)
4.6%1.3%$1.90Gasoline (Gal)
5.1%1.4%$10.74Natural Gas (mcf)
8.2%2.3%$0.076Electricity (kwh)
% Increase at $50/
MT-CO2
% Increase at: $10/
MT-CO22004 Price
Inferred Value on Avoided Emissions
BridgeStrategy
Incremental % Price Increase
$50 /MT CO2
$150 /MT CO2

0
10
20
30Developed Major
Economies Emissionsat “0”
Ener
gy E
mis
sion
s, G
t CO
2/ ye
ar
2050 Reference Emissions
2050Developed
ME ReferenceEmissions(16.7 Gt)
2050Developed ME
Emissions(0 Gt)
1 Equals reduction from the 2050 reference case for that ME group (i.e., Developed or Developing). Developed MEs include: U.S., Europe, Russia, Japan, Canada, South Korea, and Australia. Developing MEs include: China, India, South Africa, Mexico, Brazil, and Indonesia.2 50% of 2005 total Major Economies energy CO2 emissions equals 11.0 Gt.
Developed Major Economies Developing Major Economies
2050Developing
ME ReferenceEmissions
(20.4 Gt)
Developed Major Economies Emissions at
20% 2005 Emissions
Developed Major Economies Emissions at
50% 2005 Emissions
-100%(-16.7 Gt)
-83%(-13.9 Gt)
-58%(-9.7 Gt)
-46%(-9.5 Gt)
-60%(-12.3 Gt)
-81%(-16.5 Gt)
2050Developing ME
Emissions(11.0 Gt)
2050Developed ME
Emissions(2.8 Gt)
2050Developing ME
Emissions(8.2 Gt)
2050Developed ME
Emissions(7.0 Gt)
2050Developing ME
Emissions(4.0 Gt)
Energy CO2 Emissions Reductions Needed in 2050 for Major Economies1
to Achieve a Combined 50% Reduction in Emissions Below 20052 Levels

22
March 14, 2008
Challenges
How to Lift Global RD&D Investment?– More U.S. RD&D?– More International RD&D?– More Private Sector RD&D?– Technology Push vs. Technology Pull?– New Models for Funding and Incentivizing RD&D?
How to Incentivize Private Innovation– Cap-and-Trade?– Carbon Tax or Equivalents?– Other Options (Fee-Based Environmental Security Accounts)?– How Best to Protect the Economy?
How to Form a New International Framework?– Major Economies Process?– Clean Energy Technology Fund for Emerging Economies?– Concessions on Tariffs on Environmental Goods & Services?– Post-Kyoto Framework in December 2009?

23
March 14, 2008
World Oil Prices and Government R&D
0
10
20
30
40
50
60
70
80
1970
1971
1972
1973
1974
1975
1976
1977
1978
1979
1980
1981
1982
1983
1984
1985
1986
1987
1988
1989
1990
1991
1992
1993
1994
1995
1996
1997
1998
1999
2000
2001
2002
2003
2004
2005
$/ba
rrel
0.00
1.00
2.00
3.00
4.00
5.00
6.00
7.00
8.00
9.00
$ bi
llion
s
Saudi LightCrude
RefinerAcquisitionCost ofImportedCrude Oil(IRAC)
GovernmentEnergy R&DInvestment
Runci and Dooley, “Energy R&D Investments: Past and Future (2007)
24
March 14, 2008
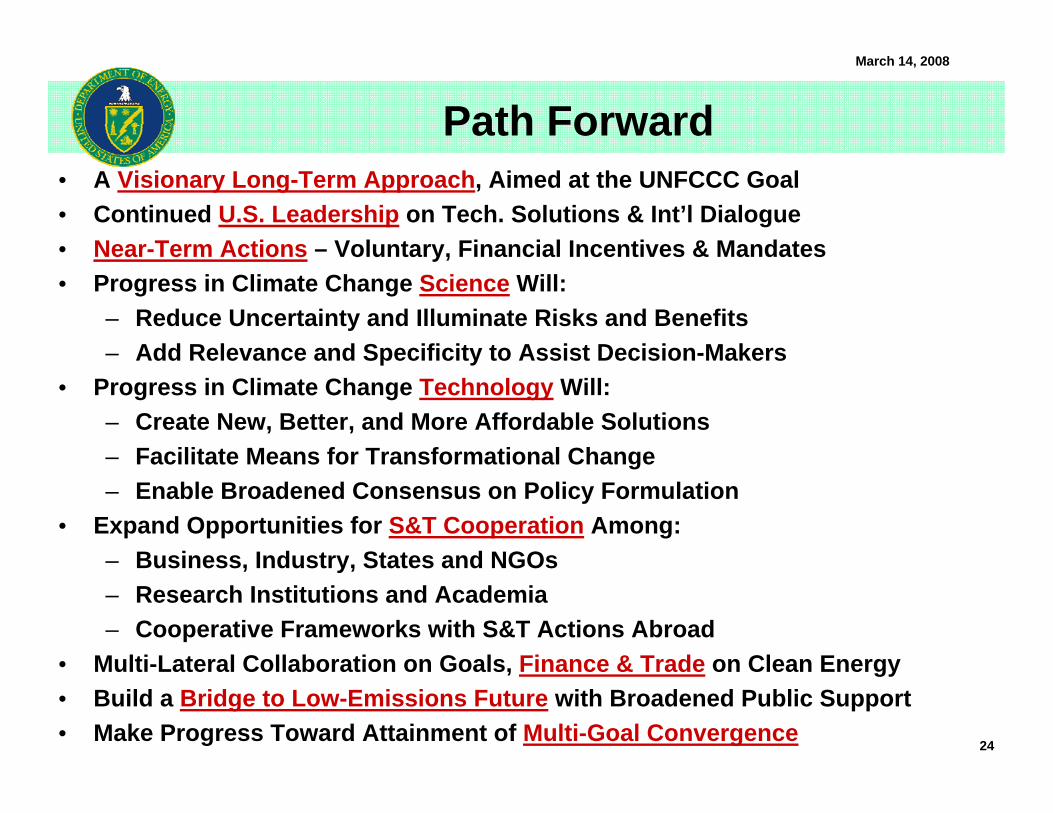
Path ForwardA Visionary Long-Term Approach, Aimed at the UNFCCC GoalContinued U.S. Leadership on Tech. Solutions & Int’l DialogueNear-Term Actions – Voluntary, Financial Incentives & MandatesProgress in Climate Change Science Will:– Reduce Uncertainty and Illuminate Risks and Benefits – Add Relevance and Specificity to Assist Decision-Makers
Progress in Climate Change Technology Will:– Create New, Better, and More Affordable Solutions– Facilitate Means for Transformational Change– Enable Broadened Consensus on Policy Formulation
Expand Opportunities for S&T Cooperation Among:– Business, Industry, States and NGOs– Research Institutions and Academia– Cooperative Frameworks with S&T Actions Abroad
Multi-Lateral Collaboration on Goals, Finance & Trade on Clean EnergyBuild a Bridge to Low-Emissions Future with Broadened Public SupportMake Progress Toward Attainment of Multi-Goal Convergence
25
March 14, 2008
Back-Up

Environmental Sciences, Biotechnology, Genome Sequencing, Health Effects HHS*
International Assistance, Technology Deployment, Land Use, Human ImpactsUSAID*
Carbon Fluxes in Soils, Forests and Other Vegetation, Carbon Sequestration, Nutrient Management, Cropping Systems, Forest and Forest Products Management, Livestock, and Waste Management, Biomass Energy and Bio-based Products Development
USDA
Geosciences, Oceans, Nanoscale Science and Engineering Computational SciencesNSF
Earth Observations, Measuring, Monitoring, Aviation Equipment, Operations and Infrastructure Efficiency NASA
Mitigation of CO2 and Non-CO2 GHG Emissions through Voluntary Partnership Programs, including Energy STAR, Climate Leaders, Green Power, Combined Heat and Power, State and Local Clean Energy, Methane and High-GWP Gases, and Transportation; GHG Emissions Inventory
EPA
Aviation, Highways, Rail, Freight, Maritime, Urban Mass Transit, Transportation Systems, Efficiency and SafetyDOT
International Science and Technology Cooperation, Oceans, EnvironmentDOS*
Land, Forest, and Prairie Management, Mining, Sequestration, Geothermal, Terrestrial Sequestration Technology Development
DOI
Energy Efficiency, Renewable Energy, Nuclear Fission and Fusion, Fossil Fuels and Power, Carbon Sequestration, Basic Energy Sciences, Hydrogen, Bio-Fuels, Electric Grid and Infrastructure
DOE
Aircraft, Engines, Fuels, Trucks, Equipment, Power, Fuel Cells, Lasers, Energy Management, Basic ResearchDoD
Instrumentation, Standards, Ocean Sequestration, Decision Support ToolsDOC
Selected Examples of Climate Change-Related Technology R&D ActivitiesAgency
Federal Agency Participation in CCTP
* CCTP-related funding for the indicated agencies is not included in the totals for CCTP in the budget tables of Appendix A of the Strategic Plan. However, the agencies participate in CCTP R&D planning and coordination as members of CCTP’s Working Groups.

Technology Scenarios Explore the Future
“Closing the Loop on Carbon”Technology Scenario #1:Advanced Coal, Gasification, Carbon Capture, Sequestration, and Hydrogen Technologies Augment the Standard Suite of Technologies
“A New Energy Backbone”Technology Scenario #2:Technological Advances in Renewable Energy and Nuclear Power Give Rise New Competitive Realities, Reducing Dominant Role of Fossil Fuels
“Beyond the Standard Suite”Technology Scenario #3:Novel and Advanced Technologies (e.g., Fusion, Large Scale Solar, and Bio-X) Emerge to Play Major Roles, Complementing the Standard Suite.
Common Characteristics Across Scenarios:Hydrogen and Liquid Biofuels Become Significant Energy CarriersThe Full Potential of Conventional Oil & Gas is RealizedDramatic Gains in Energy Efficiency OccurSuccessful Management of other GHGsEarly Market Penetration of Low-Cost Terrestrial Sequestration
27

28
March 14, 2008
Install 28,000 “typical” landfill gas electricity projects (3 MW projects at non-regulated landfills) that collect landfill methane emissions and use them as fuel for electric generation.
Electricity from Landfill Gas Projects
Install 3,700 sequestration sites like Norway’s Sliepner project (0.27 MtC/year)Geologic Sequestration
Build 1,200 “zero-emission” 500-MW coal-fired power plants (in lieu of coal-fired plants without CO2 capture and storage) (73% CF)
Coal-Fired Power Plants
Convert to biomass crop production a barren area about 20 times the total land area of Iowa (about 700 million acres)
Biomass fuels from plantations
Install 6 million acres of solar photovoltaics to supplant coal-fired power plants without CO2capture and storage (10% cell DC eff’cy; 1700 kWh/m2 solar radiance; 90% DC-AC conv. eff’cy).Solar Photovoltaics
Actions that Provide 1 Gigaton / Year of Mitigation
Today’s Technology
Convert to new forest a barren area about 9 times the total land area of the State of Washington (nearly 400 million acres) (Assumes Douglas Fir on Pacific Coast)
CO2 Storage in New Forest.
Install 650,000 wind turbines (1.5 MW each, operating at 0.45 capacity factor) in lieu of coal-fired power plants without CO2 capture and storage.Wind Energy
Deploy 1 billion new cars at 40 miles per gallon (mpg), instead of new cars at 20 mpg (assume 12,000 miles per year per car)Efficiency
Build 500 new nuclear power plants, each 1 GW in size (in lieu of new coal-fired power plants without CO2 capture and storage) (90% CF)Nuclear
How Big is a Gigaton? Using U.S. Technology,* These Actions Can Cut Emissions by 1 GtC/Year
Giga-Tonne = Billion (109) Metric-Tonnes (1000 Kilograms) * Based on U.S. Data and Current Technology

29
March 14, 2008
Energy Security Metrics
30
March 14, 2008
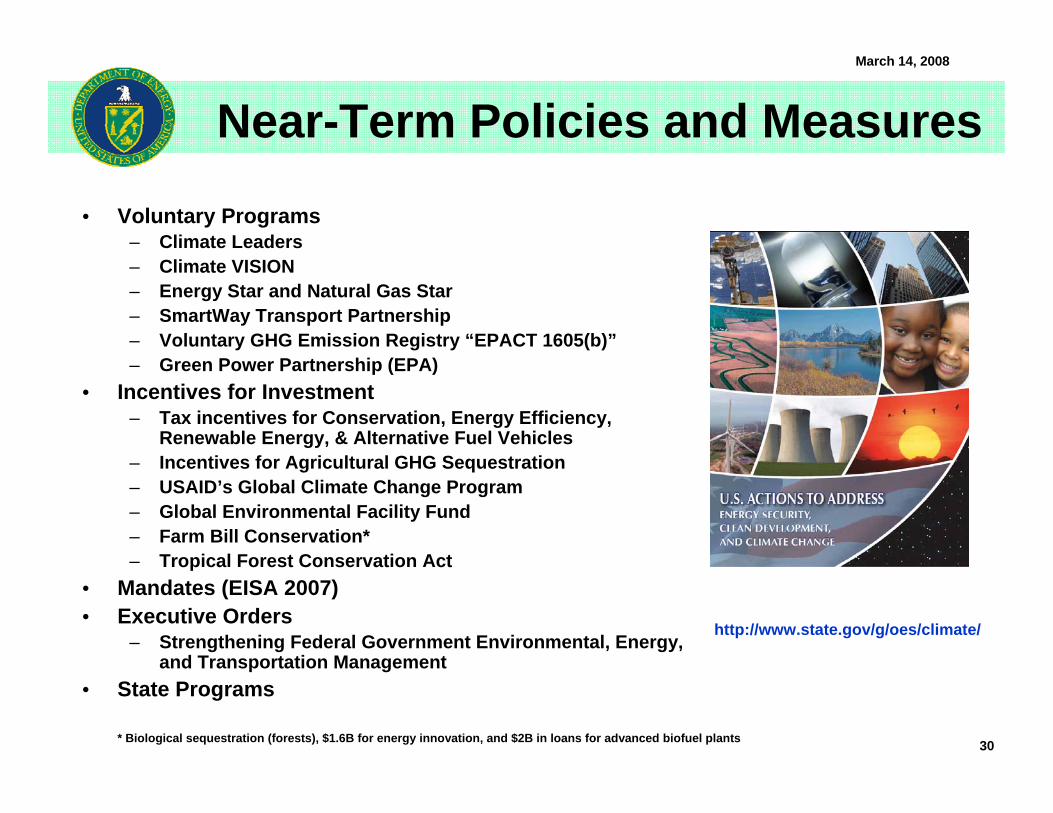
Near-Term Policies and Measures
Voluntary Programs– Climate Leaders – Climate VISION – Energy Star and Natural Gas Star– SmartWay Transport Partnership– Voluntary GHG Emission Registry “EPACT 1605(b)”– Green Power Partnership (EPA)
Incentives for Investment– Tax incentives for Conservation, Energy Efficiency,
Renewable Energy, & Alternative Fuel Vehicles– Incentives for Agricultural GHG Sequestration– USAID’s Global Climate Change Program– Global Environmental Facility Fund– Farm Bill Conservation*– Tropical Forest Conservation Act
Mandates (EISA 2007)Executive Orders
– Strengthening Federal Government Environmental, Energy, and Transportation Management
State Programs
http://www.state.gov/g/oes/climate/
* Biological sequestration (forests), $1.6B for energy innovation, and $2B in loans for advanced biofuel plants

31
March 14, 2008
Financial Incentives
Existing Tax Incentives
Efficiency & Transportation– Hybrid and Fuel Cell Vehicles (Tax Credit)– Clean Fuel Cars, Truck and Refueling Stations– Tax Credits for Energy Efficient Building
Improvements (Residential and Commercial)– Tax Credits for Construction of Energy
Efficient Homes– Exclusion of Utility Conservation Subsidies
Renewable Energy– Renewable Energy Production Credits – Residential Solar Energy (Tax Credits)– Investment Tax Credits for Solar, Geothermal– Hydroelectric, Biomass Elec. (Excl. of Interest
on Bonds)– Biomass Ethanol (Exemption from Excise
Taxes)Low-Carbon Fossil
– Coal Bed Methane (Production Credit)Other and Crosscutting
– Industry Tax Credits for Landfill Gas and Combined Heat and Power
New Tax Incentives*
Efficiency & Transportation– Conservation and Energy Efficiency– Tax Credit for Efficient Vehicles
Renewable Energy– Extend Renewable Electricity Production
Credit (e.g., Home Solar)– Renewable Energy Bonds– Renewable Content in Gasoline (e.g., Ethanol)
Low-Carbon Fossil– Clean Coal Investment Tax Credit
Nuclear – Production Credit for Advanced Nuclear, – Nuclear Decommissioning, – Risk Insurance
Other and Crosscutting– Energy Infrastructure (Transmission)– Loan Guarantees for Power and Fuels
*EPAct05, EISA07, & Omnibus FY08 Appropriation
32
March 14, 2008
Recent Mandates
Mandatory Renewable Fuel Standard (RFS)– Requires fuel producers to use at least 36 billion gallons of biofuel by 2022.
Corporate Average Fuel Economy (CAFE) – Increases the national fuel economy standard to 35 miles per gallon by 2020.
Appliance and Lighting Efficiency Standards– Sets energy efficiency standards for light bulbs (phase-out of incandescent lights)
– Sets standards for residential and commercial appliances (More than 40 appliances).
Energy Savings in Buildings and Industry– Increases energy efficiency of residential, commercial, and Federal buildings
– Increases energy efficiency of industrial equipment and processes
State Renewable Portfolio Standards (24 States)

33
March 14, 2008
Barriers to Technology Deployment
6 Barrier Categories21 Barriers
~50 Detailed Barriers
Barriers are organized into six categories consistent with EPActBarriers are organized into six categories consistent with EPAct 2005 Title XVI.2005 Title XVI.
Cost Effectiveness
Fiscal Barriers
Regulatory Barriers
Statutory Barriers
Intellectual Property Barriers
Other Barriers
High Costs Unfavorable Fiscal
Unfavorable Regulations
Unfavorable Statutes
IP Transaction Costs
Incomplete and Imperfect
Information
Technical Risks
Fiscal Uncertainty
Regulatory Uncertainty
Statutory Uncertainty
Anti-competitive
Patent Practices
Infrastructure limitations
Market Risks
Weak International
Patent Protection
Industry Structure
External Benefits and
Costs
University, Industry,
Government Perceptions
Misplaced Incentives
Lack of Specialized Knowledge
Unfavorabletariffs
Policy Uncertainty

0
20
40
60
80
100
120
140
Tran
spor
tatio
nBu
ildin
gsIn
dust
ry
Grid
& In
frast
ruct
ure
Foss
ilHy
drog
enRe
newa
bles
Nucl
ear F
issi
onCa
rbon
Cap
ture
Geol
ogic
Sto
rage
Terre
stria
l Seq
CH4
-- En
ergy
& W
aste
CH4
& N2
O --
Agric
ultu
reHi
gh G
WP
Gase
sN2
O --
Com
b &
Ind
More Than 400 Policies & Measuresto Address Barriers
Number of Commercialization and Deployment Activities by CCTP Goal
End-Use and Infrastructure
Energy Supply Carbon Capture and Sequestration
Non-CO2 GHGs
35
March 14, 2008
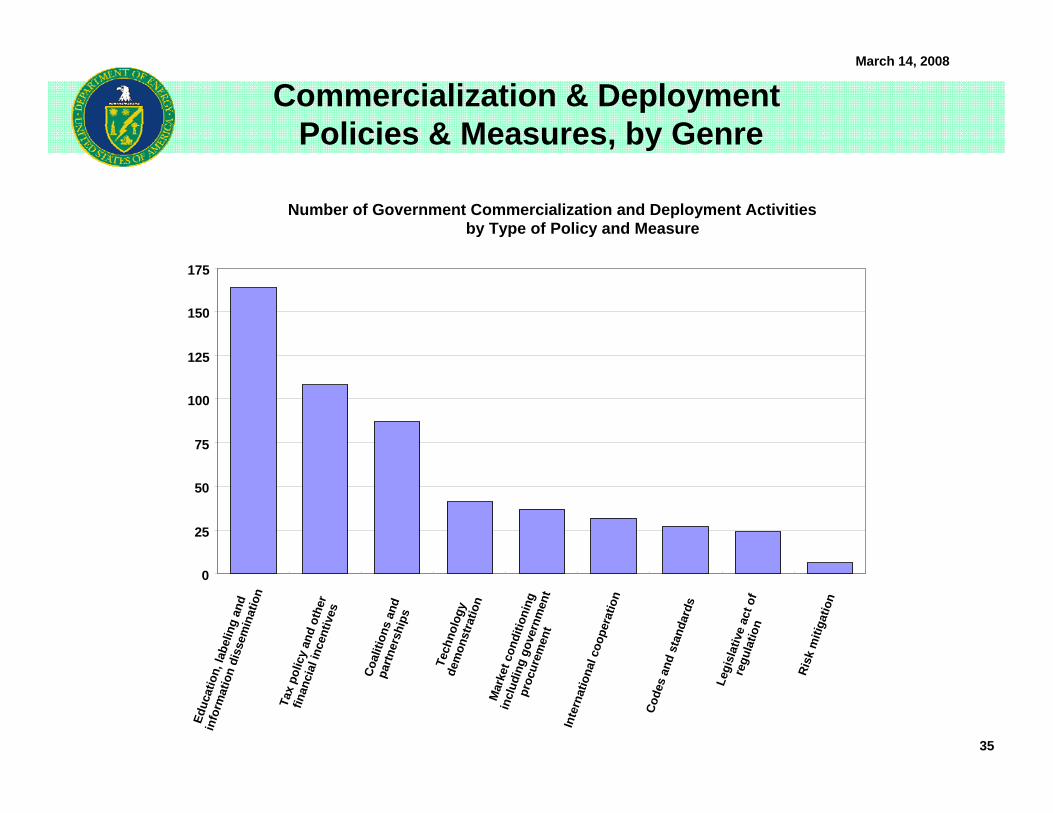
Commercialization & DeploymentPolicies & Measures, by Genre
Number of Government Commercialization and Deployment Activitiesby Type of Policy and Measure
0
25
50
75
100
125
150
175
Educ
atio
n, la
belin
g an
d
info
rmat
ion
diss
emin
atio
n
Tax
polic
y an
d ot
her
finan
cial
ince
ntiv
es
Coal
ition
s an
dpa
rtner
ship
s
Tech
nolo
gyde
mon
stra
tion
Mar
ket c
ondi
tioni
ng
incl
udin
g go
vern
men
t
proc
urem
ent
Inte
rnat
iona
l coo
pera
tion
Code
s an
d st
anda
rds
Risk
miti
gatio
n
Legi
slat
ive
act o
fre
gula
tion
36
March 14, 2008
0
1000
2000
3000
4000
5000
6000
7000
8000
9000
1974197519761977197819791980198119821983198419851986198719881989199019911992199319941995199619971998199920002001200220032004
mill
ions
, $ U
S 20
04
Canada
Denmark
Finland
France
Germany
Italy
Japan
Netherlands
Norway
Spain
Sweden
Switzerland
UK
US
History of Int’l Energy R&D
Runci and Dooley: “Energy R&D Investments: Past and Future” (2007)

37
March 14, 2008
International Framework For Addressing Climate Change
Global Action Programs
Asia-Pacific Partnership (7 Nations)– Accounts for 50% of emissions– Nearly 100 actions
G-8 Dialogue (13-20 Nations)– More than 40 programs
Methane to Markets (20 Nations)– 180+ million tons reduced by 2015
Renewable Energy and Efficiency (17 Nations)12+ Bilateral Agreements on Technology and Lower EmissionsTropical Forest ConservationStopping Illegal LoggingMajor Economies Process (17 Nations, Including EU)
Technology Advancement
Carbon Capture and Storage (22 Nations)Future Gen Coal (5 Nations)Hydrogen (17 Nations)Global Nuclear Energy Partnership (19 Nations)Gen IV Nuclear (10 Nations)Fusion Energy - ITER (7 Nations)Global Earth Observation (71 Nations)
– Recommended by National Academy of Sciences
Clean Energy Technology Fund (US, UK and Japan, World Bank)
38
March 14, 2008
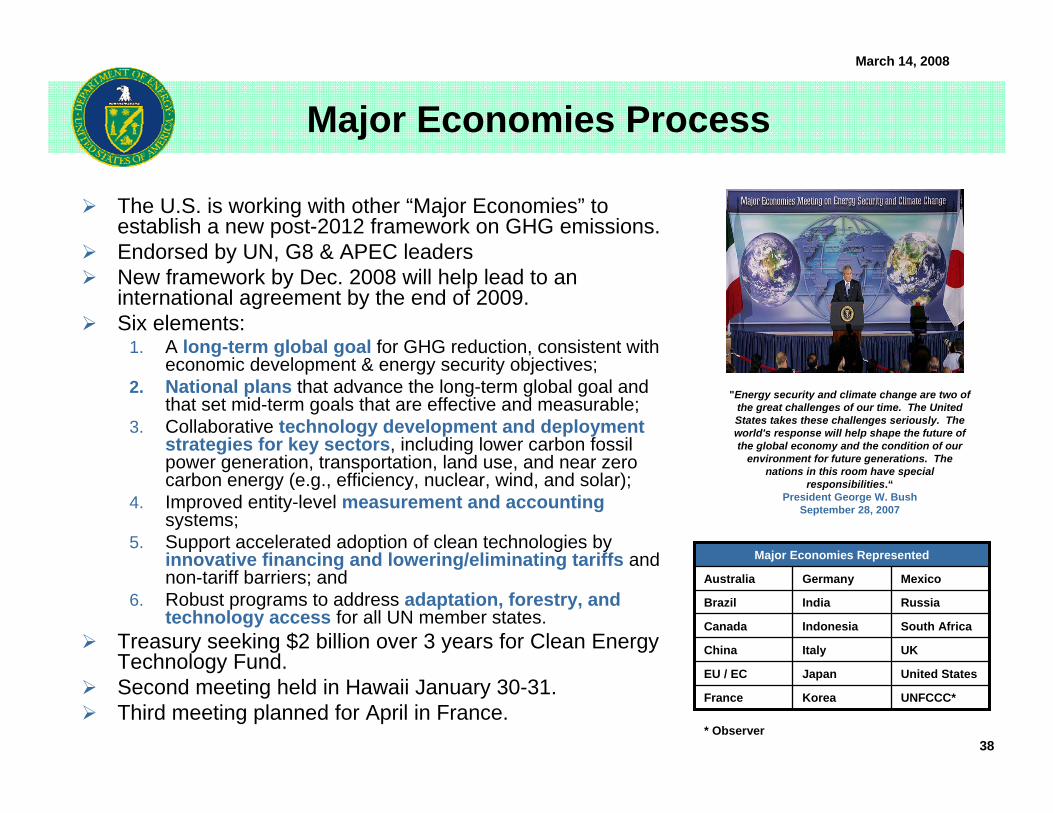
Major Economies Process
The U.S. is working with other “Major Economies” to establish a new post-2012 framework on GHG emissions.Endorsed by UN, G8 & APEC leadersNew framework by Dec. 2008 will help lead to an international agreement by the end of 2009.Six elements:
1. A long-term global goal for GHG reduction, consistent with economic development & energy security objectives;
2. National plans that advance the long-term global goal and that set mid-term goals that are effective and measurable;
3. Collaborative technology development and deployment strategies for key sectors, including lower carbon fossil power generation, transportation, land use, and near zero carbon energy (e.g., efficiency, nuclear, wind, and solar);
4. Improved entity-level measurement and accountingsystems;
5. Support accelerated adoption of clean technologies by innovative financing and lowering/eliminating tariffs and non-tariff barriers; and
6. Robust programs to address adaptation, forestry, and technology access for all UN member states.
Treasury seeking $2 billion over 3 years for Clean Energy Technology Fund.Second meeting held in Hawaii January 30-31.Third meeting planned for April in France.
"Energy security and climate change are two of the great challenges of our time. The United States takes these challenges seriously. The world's response will help shape the future of the global economy and the condition of our
environment for future generations. The nations in this room have special
responsibilities.“President George W. Bush
September 28, 2007
UNFCCC*KoreaFrance
South AfricaIndonesiaCanada
RussiaIndiaBrazil
United StatesJapanEU / EC
UKItalyChina
MexicoGermanyAustralia
Major Economies Represented
* Observer