national 4xdolÛfdwlrqv 2019€¦ · clearly identify the question number you are attempting. use...
TRANSCRIPT

*X8337611*©
NationalQualications2019H
Total marks — 100
SECTION 1 — PHYSICAL ENVIRONMENTS ― 50 marks
Attempt ALL questions.
SECTION 2 — HUMAN ENVIRONMENTS ― 50 marks
Attempt ALL questions.
You will receive credit for appropriately labelled sketch maps and diagrams.
Write your answers clearly in the answer booklet provided. In the answer booklet you must clearly identify the question number you are attempting.
Use blue or black ink.
Before leaving the examination room you must give your answer booklet to the Invigilator; if you do not, you may lose all the marks for this paper.
X833/76/11 GeographyPhysical and Human
EnvironmentsTUESDAY, 28 MAY
9:00 AM – 10:50 AM
A/PB

page 02
MARKSSECTION 1 — PHYSICAL ENVIRONMENTS — 50 marks
Attempt ALL questions
Question 1
Diagram Q1 Corrie with tarn
Look at Diagram Q1.
Explain the formation of a corrie.
You may wish to use an annotated diagram or diagrams in your answer.
8

page 03
MARKSQuestion 2
Diagram Q2 Sand spit
Look at Diagram Q2.
Explain the formation of a sand spit.
You may wish to use an annotated diagram or diagrams in your answer.
[Turn over
8

page 04
MARKSQuestion 3
Diagram Q3 Selected ocean currents
cold current warm current
Equator
Pacific Ocean
Pacific Ocean
Atlantic Ocean
Study Diagram Q3.
(a) Describe the pattern of ocean currents for either the Pacific Ocean or the Atlantic Ocean and
(b) explain how ocean currents redistribute energy around the globe. 8

page 05
MARKSQuestion 4
Diagram Q4 Flood hydrograph for the River Leri, West Wales, 8th and 9th June 2012
rain
fall
(mm
)
disc
harg
e (c
umec
s)
time9 June8 June
rainfall discharge
100
90
80
70
60
50
40
30
20
10
0 0
2
4
6
8
10
12
14
10:0
011
:00
12:0
013
:00
14:0
015
:00
16:0
017
:00
18:0
019
:00
20:0
021
:00
22:0
023
:00
00:0
001
:00
02:0
003
:00
04:0
005
:00
06:0
0
Study Diagram Q4.
For the River Leri on 8th and 9th of June
(a) describe the changes in discharge level and
(b) suggest reasons why these changes may have occurred.
[Turn over
10

page 06
MARKSQuestion 5
Diagram Q5 High Force waterfall in County Durham
Look at Diagram Q5.
Waterfalls are commonly found in the upper course of rivers.
Explain the formation of a waterfall.
You may wish to use an annotated diagram or diagrams in your answer.
8

page 07
MARKSQuestion 6
Diagram Q6 Podzol soil profile
Look at Diagram Q6.
Explain the main conditions and processes involved in the formation of a podzol soil.
[Turn over
8
page 08
MARKSSECTION 2 — HUMAN ENVIRONMENTS — 50 marks
Attempt ALL questions
Question 7
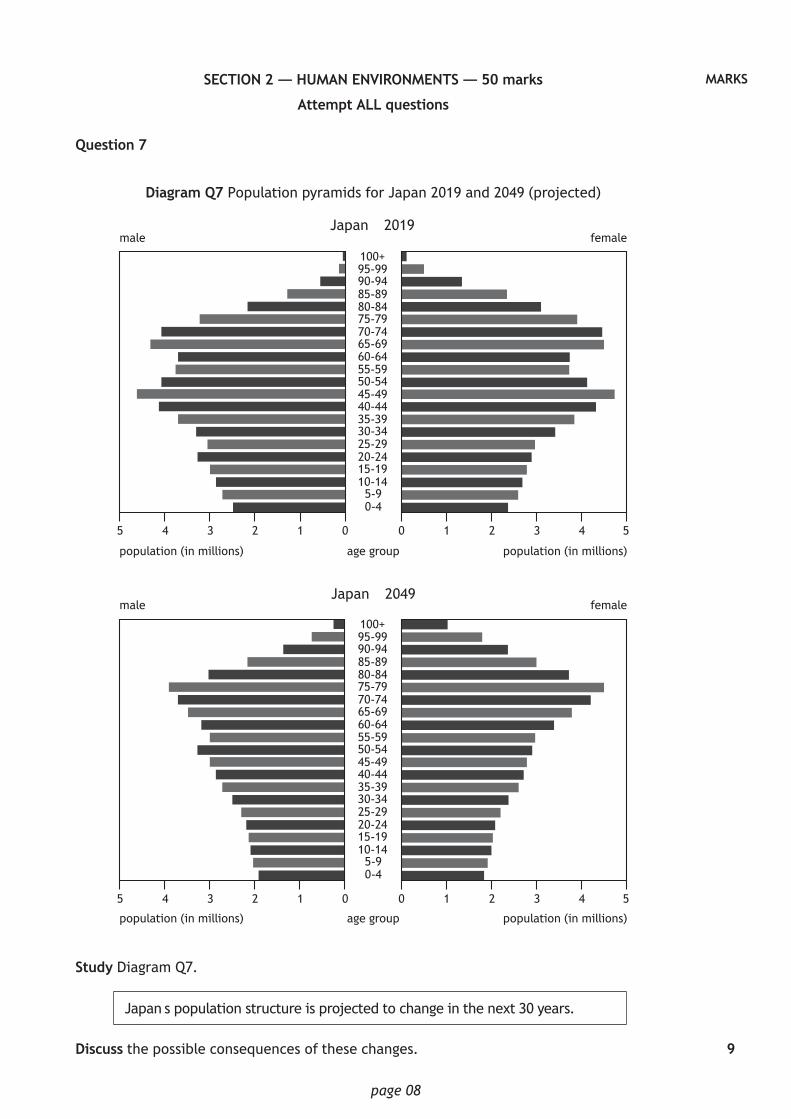
Diagram Q7 Population pyramids for Japan 2019 and 2049 (projected)
Japan – 2019
Japan – 2049
age group
age group
population (in millions)
population (in millions)
population (in millions)
population (in millions)
female
female
male
male
100+
100+
95-99
95-99
90-94
90-94
85-89
85-89
80-84
80-84
75-79
75-79
70-74
70-74
65-69
65-69
60-64
60-64
55-59
55-59
50-54
50-54
45-49
45-49
40-44
40-44
35-39
35-39
30-34
30-34
25-29
25-29
20-24
20-24
15-19
15-19
10-14
10-14
5-9
5-9
0-4
0-4
0
0
0
0
1
1
1
1
2
2
3
3
4
4
5
5
2
2
3
3
4
4
5
5
Study Diagram Q7.
Japan’s population structure is projected to change in the next 30 years.
Discuss the possible consequences of these changes. 9

page 09
MARKSQuestion 8
Discuss different methods used by countries to collect population data.
Question 9
Rural land degradation has many impacts on people and the environment.
Explain the impacts of rural land degradation on a semi-arid or rainforest area you have studied.
Question 10
Rural areas have a number of competing land uses which can create conflict.
Referring to a glaciated or coastal area you have studied, discuss the conflicts caused by the various land uses.
[Turn over
6
8
12

page 10
MARKSQuestion 11
‘Newcastle City Council has announced plans to invest millions of pounds to improve housing in Newcastle by 2021’.
Explain the strategies used to manage housing problems in a developed world city you have studied.
Question 12
Diagram Q12 Traffic in Mumbai
Look at Diagram Q12.
For a developing world city you have studied, discuss the management strategies used to reduce traffic issues.
[END OF QUESTION PAPER]
8
7

page 11
[BLANK PAGE]
DO NOT WRITE ON THIS PAGE

page 12
[BLANK PAGE]
DO NOT WRITE ON THIS PAGE
Acknowledgement of copyright
Diagram Q1
Diagram Q2
Diagram Q5
Diagram Q12
Peter Turner Photography/Shutterstock.com
Image of ‘Spurn Point’ by Ben George is taken from www.bengeorgephotography.co.uk. Reproduced by kind permission of Ben George Aerial Photography.
Carole MacDonald/Shutterstock.com
sladkozaponi/Shutterstock.com

*X8337612*©
NationalQualications2019H
Total marks — 60
SECTION 1 — GLOBAL ISSUES ― 40 marks
Attempt TWO questions.
SECTION 2 — APPLICATION OF GEOGRAPHICAL SKILLS ― 20 marks
Attempt the question.
You will receive credit for appropriately labelled sketch maps and diagrams.
Write your answers clearly in the answer booklet provided. In the answer booklet you must clearly identify the question number you are attempting.
Use blue or black ink.
Before leaving the examination room you must give your answer booklet to the Invigilator; if you do not, you may lose all the marks for this paper.
X833/76/12 GeographyGlobal Issues and
Geographical SkillsTUESDAY, 28 MAY
11:20 AM – 12:30 PM
A/PB

page 02
SECTION 1 — GLOBAL ISSUES — 40 marks
Attempt TWO questions
Question 1 — River basin management
Diagram Q1A Blue Nile Basin and location of the Grand Ethiopian Renaissance Dam
Grand Ethiopian Renaissance Dam
climate station
international border
river
capital cityAddis Ababa
Whi
te N
ile
Blue
Nile
Asosa
Key
scale (km)
Lake Tana
ETHIOPIA
SOUTH SUDAN
SUDAN
ERITREA
(source of Blue Nile)
AsmaraKhartoum
Red Sea
0 50 100
Diagram Q1B Blue Nile average monthly flow, near site of dam
month
Jan Feb Mar Apr May Jun Jul Aug Sep Oct Nov Dec
aver
age
flow
(cum
ecs/
mon
th)
aver
age
flow
(cum
ecs/
mon
th)
6000 6000
5000 5000
4000 4000
3000 3000
2000 2000
1000 1000
0 0

page 03
MARKSDiagram Q1C Climate graph for Asosa, Ethiopia
tem
pera
ture
(°C)
prec
ipit
atio
n (m
m)
temperature (°C)
rainfall (mm)
350
300
250
200
150
100
50
0DNOSAJJMAMFJ
5
10
1515
20
25
30
35
0
Key
Diagram Q1D Population growth in Ethiopia
1980
200
150
100
50
01990 2000 2010
year
popu
lati
on (m
illio
ns)
Key
projected
2020 2030 2040 2050
actual
Diagram Q1E Selected statistics, Ethiopia
Population with access to improved drinking water 57%
Population with access to improved sanitation 28%
Population with access to electricity 24%
Population employed in agriculture 73%
(a) Study Diagram Q1A, Diagram Q1B, Diagram Q1C, Diagram Q1D, and Diagram Q1E.
Explain why there is a need for water management in the Blue Nile Basin,Ethiopia.
(b) Discuss the negative socio-economic and environmental consequences of anamed river management project that you have studied.
10
10
[Turn over
page 04
MARKSQuestion 2 — Development and health
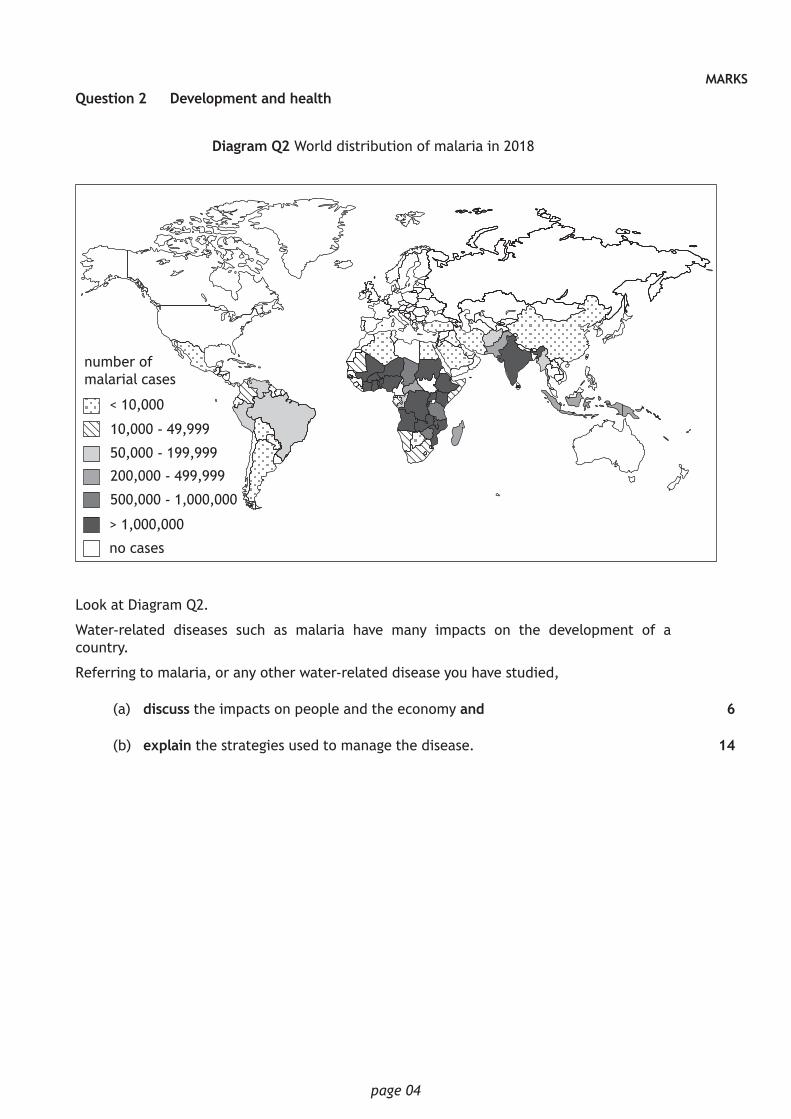
Diagram Q2 World distribution of malaria in 2018
number of malarial cases
< 10,000
> 1,000,000
no cases
10,000 - 49,999
50,000 - 199,999
200,000 - 499,999
500,000 - 1,000,000
Look at Diagram Q2.
Water-related diseases such as malaria have many impacts on the development of a country.
Referring to malaria, or any other water-related disease you have studied,
(a) discuss the impacts on people and the economy and
(b) explain the strategies used to manage the disease.
6
14

page 05
MARKSQuestion 3 — Global climate change
(a) Explain the physical factors that contribute to global climate change.
(b) Explain possible strategies for managing climate change.
[Turn over
8
12

page 06
MARKSQuestion 4 — Energy
Diagram Q4A Energy consumption in developed countries (1980–2030)
British thermal unit: The amount of heat required to raise the temperature of one pound of water by one degree Fahrenheit
*
projected consumption
actual consumption
Key
ener
gy c
onsu
mpt
ion
(qua
drill
ion
Btu*
)
year
1980
0
50
100
150
200
250
300
1990 2000 2010 2020 2030
(a) Study Diagram Q4A.
(i) Describe the changes shown in Diagram Q4A and
(ii) suggest reasons for the trends in energy consumption in developedcountries.
Diagram Q4B Photograph of a wind farm in Cumbria
(b) Look at Diagram Q4B.
Comment on the effectiveness of wind power, or any other renewable source ofenergy you have studied, in meeting the energy demands of a country.
10
10

page 07
[Turn over for next question
DO NOT WRITE ON THIS PAGE

page 08
MARKSSECTION 2 — APPLICATION OF GEOGRAPHICAL SKILLS — 20 marks
Attempt the question
Question 5
Plans to build a third runway at Heathrow Airport (London) have been approved. Whilst the expansion of the airport has been supported by the UK Government and many industries, it has been met with objections from local residents and environmentalists.
Plans for a third runway include
• new passenger terminals and underground passenger transit and baggagesystems
• land set aside for new commercial opportunities such as offices and hotels• increased rail capacity, from 18 to 40 trains per hour, and improvements to
bus and coach services.
Study the Ordnance Survey map extract of the Heathrow area, Diagram Q5A, Diagram Q5B, Diagram Q5C and Diagram Q5D before answering this question.
Referring to map evidence from the OS map extract, and information from the other sources, discuss
(a) the advantages and disadvantages of the proposed site of the airport expansion and
(b) any potential social, economic or environmental impacts this development mayhave on the surrounding area.
Diagram Q5A Location map of current Heathrow Airport and site for expansion
HAYES
WINDSOR
STAINES UPONTHAMES
ASHFORD
FELTHAM
HOUNSLOW
SLOUGH
M25
M4Harlington
Sipson
London Heathrow Airport
New third runway
proposed site of third runway and associated infrastructure
built up areas motorways and primary routes
95
95 16
1685 85
69 69
20

page 09
Diagram Q5B Heathrow passenger numbers
num
ber
of p
asse
nger
s
passenger numbers
1985
100
80
60
40
20
01990 1995 2000 2005 2010 2015 2020 2025 2030
projected passenger numbers
(mill
ions
)
year
Diagram Q5C Heathrow cargo in tonnes
year
19850
0·4
0·8
1·2
1·6
2·0
2·4
1990 1995 2000 2005 2010 2015 2020 2025 2030
cargo projected cargo figures
carg
o in
ton
nes
(mill
ions
)
Diagram Q5D Heathrow protestors
[END OF QUESTION PAPER]

page 10
[BLANK PAGE]
DO NOT WRITE ON THIS PAGE

page 11
[BLANK PAGE]
DO NOT WRITE ON THIS PAGE

page 12
[BLANK PAGE]
DO NOT WRITE ON THIS PAGE
Acknowledgement of copyright
Diagram Q4B
Diagram Q5D
ATGImages/Shutterstock.com
Dinendra Haria/Shutterstock.com

*X8337622*©
NationalQualications2019H
The colours used in the printing of these map extracts are indicated in the four little boxes at the top of the map extract. Each box should contain a colour; if any does not, the map is incomplete and should be returned to the Invigilator.
X833/76/22 GeographyGlobal Issues and
Geographical SkillsOrdnance Survey MapTUESDAY, 28 MAY
11:20 AM – 12:30 PM
A/PB
