nass monthly and marketing year average price … monthly and marketing year average price program...
TRANSCRIPT

NASS Monthly and Marketing
Year Average Price Program
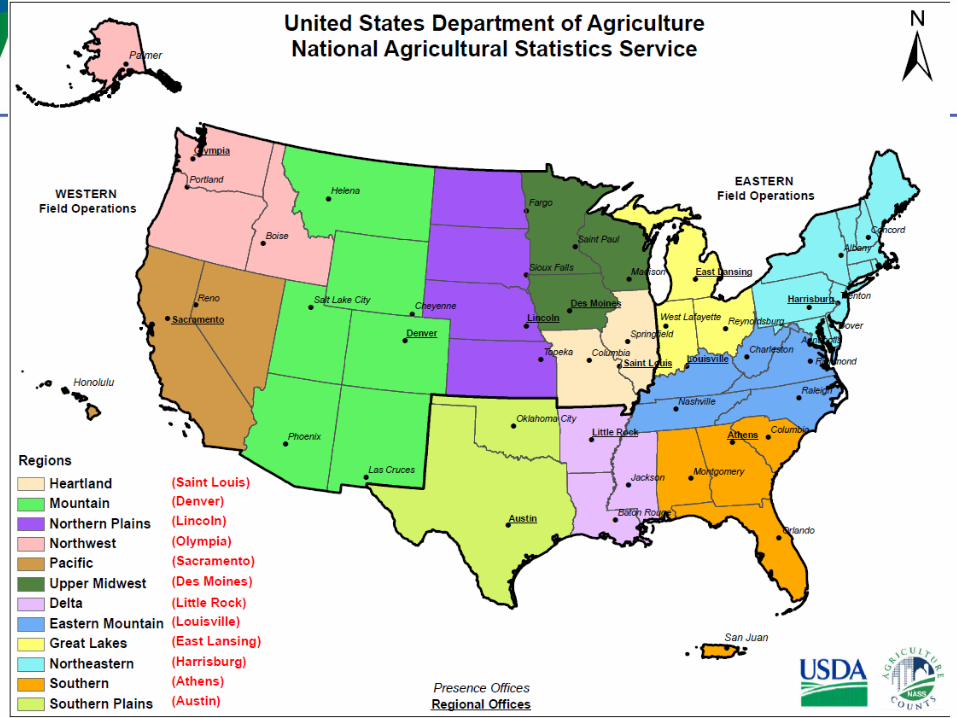
USDA, NASS - Delta Regional Office
Serving Arkansas, Louisiana, Mississippi
Becky Cross Regional Director
Eugene Young Regional Deputy Director
Overview
• Who is NASS and what do we do?
• Monthly Prices Received Program
• Monthly Prices Received Reporting
• Marketing Year Average (MYA) Prices
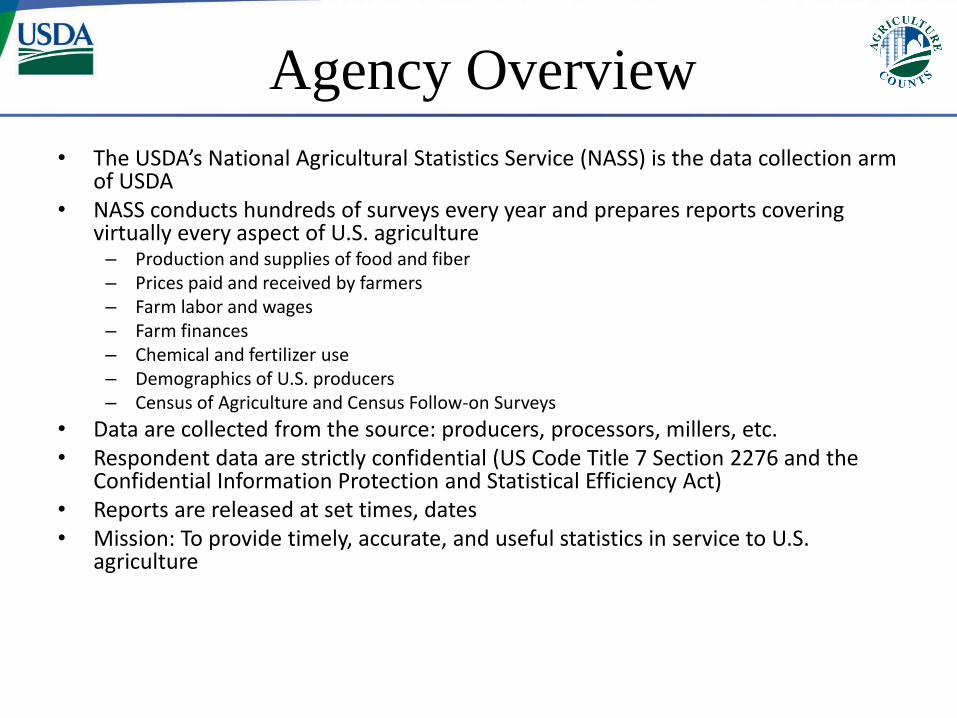
Agency Overview
• The USDA’s National Agricultural Statistics Service (NASS) is the data collection arm of USDA
• NASS conducts hundreds of surveys every year and prepares reports covering virtually every aspect of U.S. agriculture – Production and supplies of food and fiber – Prices paid and received by farmers – Farm labor and wages – Farm finances – Chemical and fertilizer use – Demographics of U.S. producers – Census of Agriculture and Census Follow-on Surveys
• Data are collected from the source: producers, processors, millers, etc. • Respondent data are strictly confidential (US Code Title 7 Section 2276 and the
Confidential Information Protection and Statistical Efficiency Act) • Reports are released at set times, dates • Mission: To provide timely, accurate, and useful statistics in service to U.S.
agriculture

Agency Overview
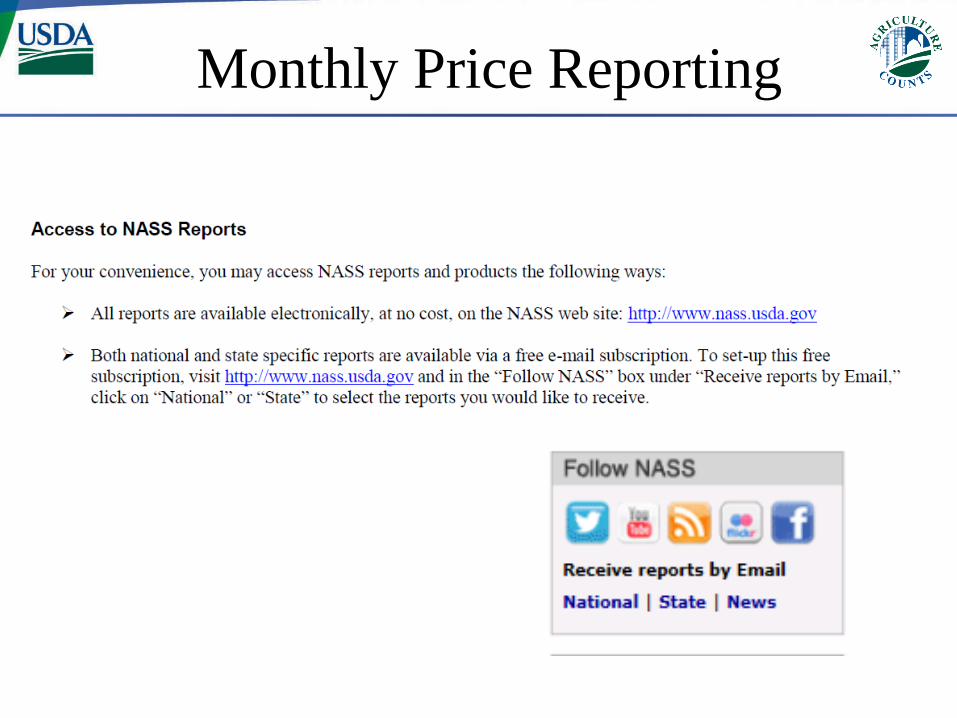
• NASS official estimates are all released to the public at the same time
• A data release calendar can be found on the NASS website at www.nass.usda.gov
• Each year, NASS produces over 400 individual reports
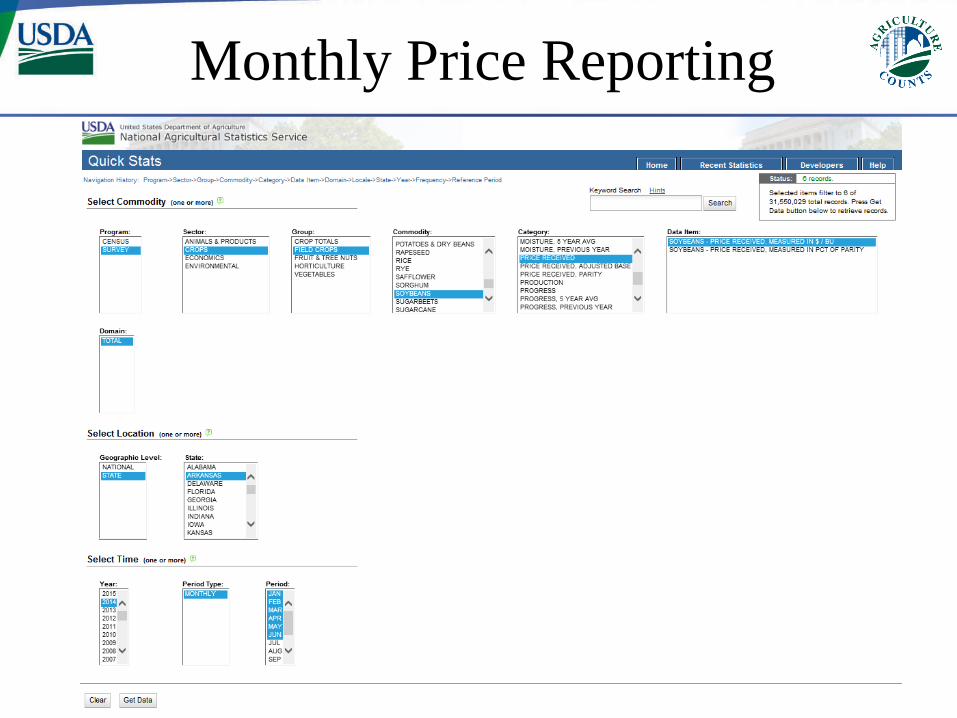
• Data can be queried from our website using the quick stats link at: http://quickstats.nass.usda.gov/

Agency Overview

Agency Overview

Agency Overview
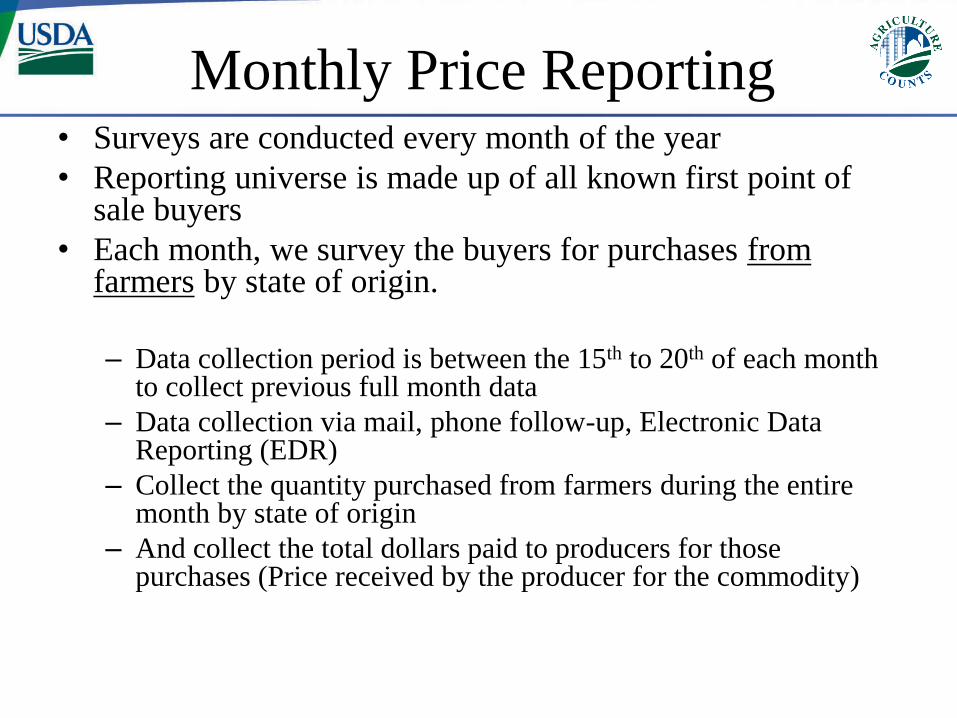
Monthly Price Reporting • Surveys are conducted every month of the year
• Reporting universe is made up of all known first point of sale buyers
• Each month, we survey the buyers for purchases from farmers by state of origin.
– Data collection period is between the 15th to 20th of each month
to collect previous full month data
– Data collection via mail, phone follow-up, Electronic Data Reporting (EDR)
– Collect the quantity purchased from farmers during the entire month by state of origin
– And collect the total dollars paid to producers for those purchases (Price received by the producer for the commodity)

Monthly Price Reporting
For the total dollars paid to producers, we ask the buyers for:
• Total dollars paid to producers before marketing charge deductions are made for
– Drying fees
– Storage fees
– Check-off fees
– Service fees
– Cleaning or grading charge
– Transportation or handling charges from farm to the first point of sale
• Total dollars paid includes any premiums paid or discounts made to the producer
– Subtracting any discounts for moisture content
– Subtracting discounts for quality factors such as grade, test weight, foreign matter, damage, or protein content
– Subtracting discounts for transportation charges from farm to elevator (price should reflect point at which grain changes possession)
– Adding premiums to producer delivering to a mill, processor, or terminal
– Adding premiums for any quality factors

Monthly Price Reporting
For the quantity of purchases (marketings) for the month, we ask the buyers for:
• Total quantity purchased of each commodity at any time from the 1st of the
month until the end of the month. Only report purchases direct from
producers.
• Units of measure in which the quantity is reported in.
– Bushels
– Pounds
– Tons
– Hundredweight (cwt)
• For contract purchases, reporting is done when both the producer is paid and
delivery has been made.

Monthly Price Reporting
• To ensure comparative reporting, each surveyed operation
receives and completes an Operation Profile prior to the
start of the marketing year.
– Detailed Profile questionnaire with questions on the includes and excludes
for the program to ensure accurate reporting
– Ensures the reporting arrangement for operations with multiple locations
– Indicates presence of firms with purchases from multiple states of origin
– For contract purchases, quantity and price are to be reported in the same
month (when price and delivery are both completed)
– Provides NASS office with point of contact and an alternate contact for
reporting

Monthly Price Reporting
• Each month, after data collection, data are processed and run through a data analysis system for a firm level, state level, and regional level review
• If data exists outside of our parameter limits, respondents are recontacted for verification/correction and reprocessed if necessary
• Summed state level estimates for marketings and average monthly prices are submitted to Washington, D.C. for a national level review prior to publication – They are again reviewed through a data analysis system that consists of all states in
the program
– Gives statistician an opportunity to review all states for comparative analysis
– If issues are found, they are sent back to the state office for verification/correction
• After national data review is complete, data are ready for publication to met the calendar publication date

Monthly Price Reporting
Monthly Price Reporting
Monthly Price Reporting
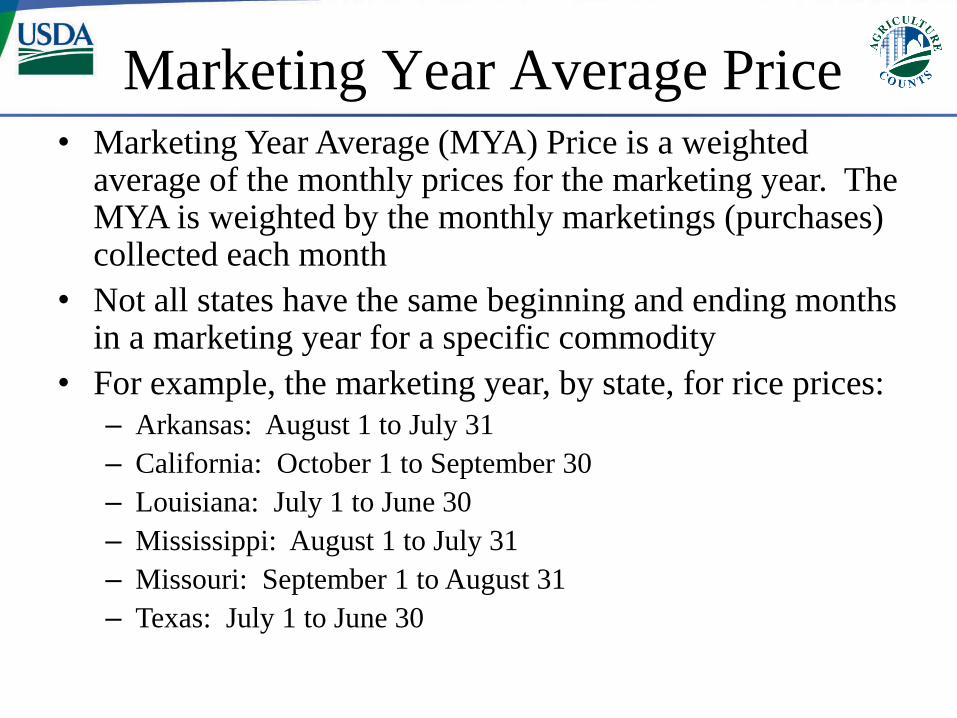
Marketing Year Average Price • Marketing Year Average (MYA) Price is a weighted
average of the monthly prices for the marketing year. The MYA is weighted by the monthly marketings (purchases) collected each month
• Not all states have the same beginning and ending months in a marketing year for a specific commodity
• For example, the marketing year, by state, for rice prices:
– Arkansas: August 1 to July 31
– California: October 1 to September 30
– Louisiana: July 1 to June 30
– Mississippi: August 1 to July 31
– Missouri: September 1 to August 31
– Texas: July 1 to June 30
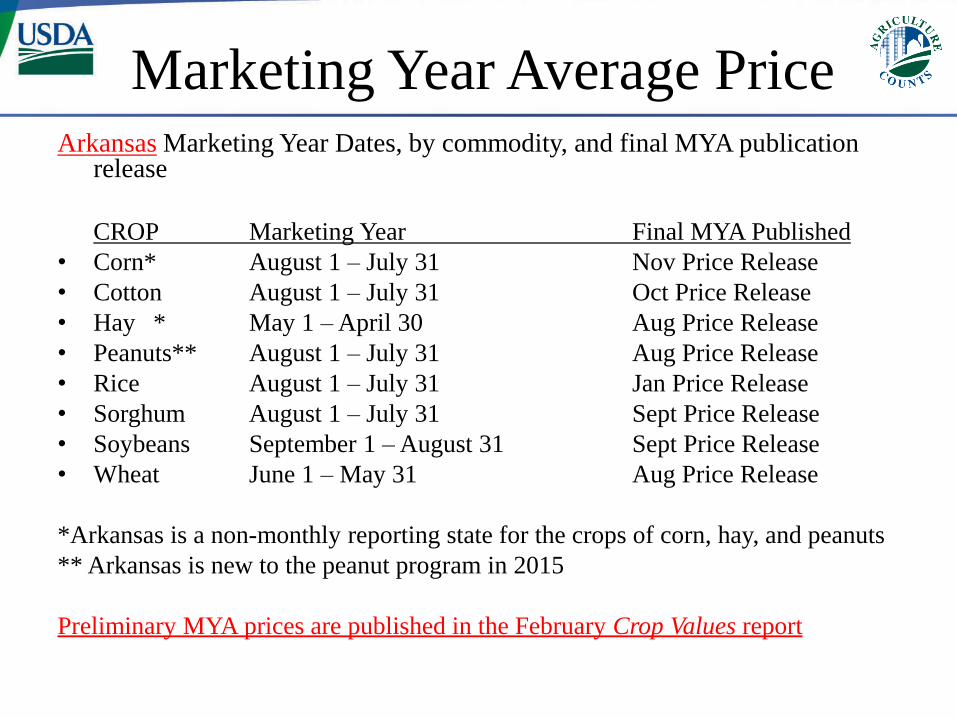
Marketing Year Average Price Arkansas Marketing Year Dates, by commodity, and final MYA publication
release
CROP Marketing Year Final MYA Published
• Corn* August 1 – July 31 Nov Price Release
• Cotton August 1 – July 31 Oct Price Release
• Hay * May 1 – April 30 Aug Price Release
• Peanuts** August 1 – July 31 Aug Price Release
• Rice August 1 – July 31 Jan Price Release
• Sorghum August 1 – July 31 Sept Price Release
• Soybeans September 1 – August 31 Sept Price Release
• Wheat June 1 – May 31 Aug Price Release
*Arkansas is a non-monthly reporting state for the crops of corn, hay, and peanuts
** Arkansas is new to the peanut program in 2015
Preliminary MYA prices are published in the February Crop Values report

Marketing Year Average Prices Example 2013 marketing year and MYA (Not real data in the example)
Month Total Avg
Marketings Price Total Dollars Paid
(1,000 bu) ($/bu) ($1,000)
• Aug, 2013 1,000 13.50 13,500
• Sept, 2013 12,000 13.00 156,000
• Oct, 2013 19,000 12.70 241,300
• Nov, 2013 25,500 12.40 316,200
• Dec, 2013 16,500 12.00 198,000
• Jan, 2014 8,000 12.90 103,200
• Feb, 2014 5,000 13.50 67,500
• Mar, 2014 4,400 14.00 61,600
• Apr, 2014 3,800 14.60 55,480
• May, 2014 2,300 14.30 32,890
• Jun, 2014 1,500 14.50 21,750
• July, 2014 1,000 14.00 14,000
• Totals 100,000 $1,281,420
• Marketing Year Average Price; $1,281,420,000/100,000,000 = $12.81/bu
• Straight unweighted average price; Sum avg. prices/12 = $13.45/bu

Marketing Year Average Price
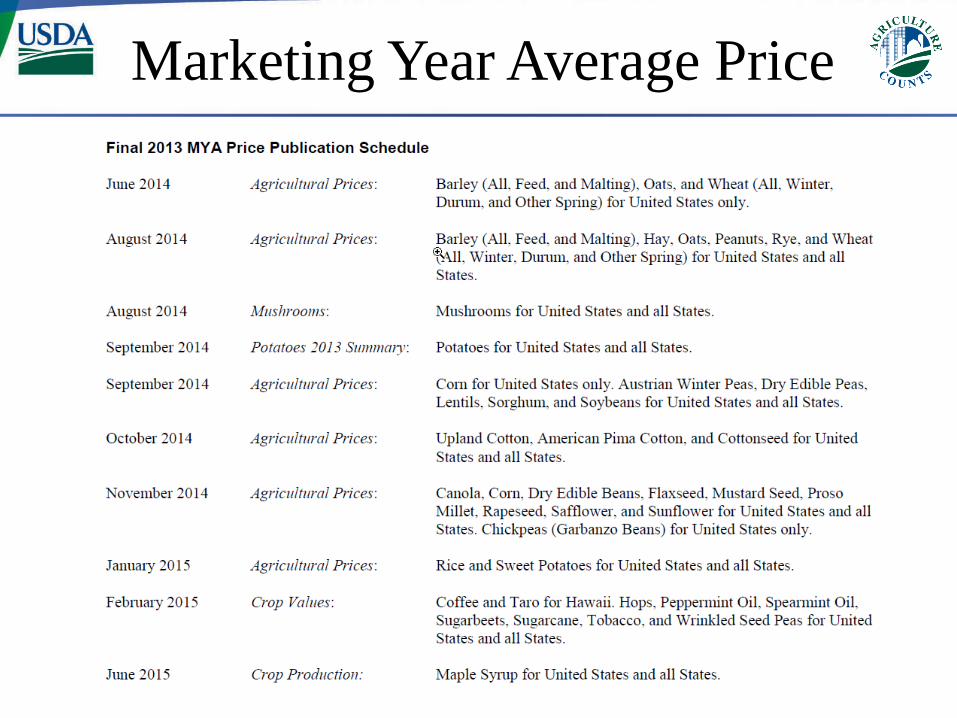
Marketing Year Average Price

Rice Price Publication
• Monthly data are released each month in the Agricultural
Prices report
• Data are released the last week of the month.
• Data published are U.S. level All, Long, Medium and
Short prices and California Medium/Short and Other
States Medium/Short prices.
• Preliminary Rice MYA prices are published in the August
Agricultural Prices report. Final Rice MYA prices are
published in the January Agricultural Prices report.
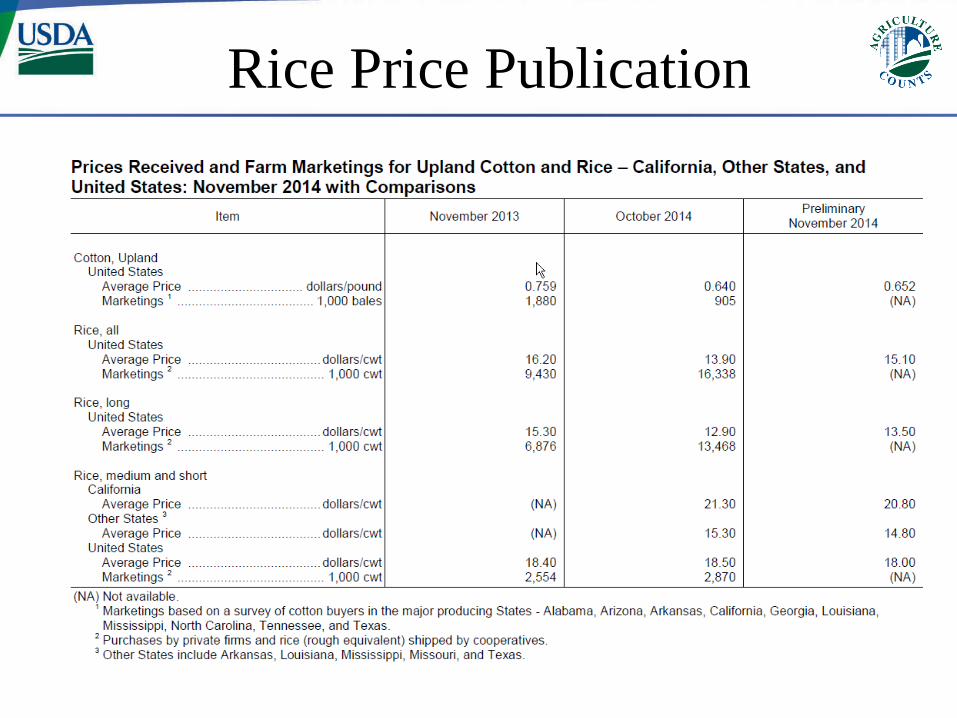
Rice Price Publication
NASS Website
www.nass.usda.gov
Delta Regional Contacts
Becky Cross Regional Director [email protected]
Eugene Young Regional Deputy Director [email protected]
Office phone number 501-228-9926
Nathan Crisp State Statistician – LA [email protected]
Office phone number 225-922-1362
Esmerelda Dickson State Statistician – MS [email protected]
Office phone number 601-359-1259