nasdaq: smed investor presentation
TRANSCRIPT

Investor Presentation
October 2018
NASDAQ: SMED
2
Safe Harbor
These slides contain (and the accompanying oral discussion will contain) “forward-looking statements” within the meaning of the Private Securities Litigation Reform Act of 1995. The words “believe”, “estimate”, “anticipate”, “project” and “expect” and similar expressions are intended to identify forward-looking statements. Such statements involve known and unknown risks, uncertainties and other factors that could cause the actual results of the Company to differ materially from the results expressed or implied by such statements, including general economic and business conditions, conditions affecting the industries served by the Company, conditions affecting the Company’s customers and suppliers, competitor responses to the Company’s products and services, the overall market acceptance of such products and services, the effectiveness of the Company’s strategy and other factors disclosed in the Company’s periodic reports filed with the Securities and Exchange Commission. Consequently, such forward looking statements should be regarded as the Company’s current plans, estimates and beliefs. The Company does not undertake and specifically declines any obligation to publicly release the results of any revisions to these forward-looking statements that may be made to reflect any future events or circumstances after the date of such statements or to reflect the occurrence of anticipated or unanticipated events.

3
Agenda
I. Company Overview
II. Medical Waste Solutions
III. Unused Medications
IV. New Solutions
V. Financial Review

4
Providing Comprehensive Medical Waste Solutions
Medical Waste for Small to Medium Sized Generators: Route-Based & Mailback
Unused Medication
10.8% 4-Year CAGR; With Strong Balance Sheet

Market Market
Size
Market Growth
Rate
Market Position
(U.S.)
Market
Penetration
Small-Medium
Quantity
Medical Waste
>$1B ~5.5% 2nd <4%
Unused
Medication
>$1B ~4.2% 1st <1%
A Leader in Two Attractive Markets
5
*
*Source: Kaiser Family Foundation Analysis of National Health Expenditure from Centers for Medicare & Medicaid Services, Office of the Actuary, National Health
Statistics Group (Accessed on December 13, 2017)

6
Growing End Market Opportunity
Addressable
Market Size:
$1.0B
$2.0B
Founding of
Company ~3 Years Ago Today
Comprehensive
Medical Waste:
Mailback
+
Pick-Up Service
(Company Owned)
+
Unused
Medication
Comprehensive
Medical Waste:
Mailback
+
Pick-Up Service
(Company Owned)
Medical Waste:
Mailback
$0.25B - $0.5B

7
Improving Revenue Mix
% of Total Revenue
1996-2012
Route-Based Unused Medication Mailback
Q1 2019
Route-Based Unused Medication Mailback
1% 6% 21%
16%
2013
Route-Based Unused Medication Mailback

8
Medical Waste SolutionsMedical Waste Solutions

Everything But The Hospital
9
Sharps Serves All Small to Medium Quantity Generator Markets
* Professional includes dentists, veterinarians, clinics, private practice physicians, urgent care facilities, ambulatory surgical centers and other healthcare facilities.
Point of Care Shifting Towards Sharps’ Core Customers
Aging Population
Traditional Healthcare Setting
Professional
Market*
Retail
Pharmacies
Home
Health Care
Assisted Living/
Long-Term Care
Small to Medium Setting
Cost Pressure

10
Market Landscape: Small & Medium Quantity Generators
$0
$200
$400
$600
$800
$1,000
Local/Regional National/Full-Service
Revenues (in millions)
Market Opportunity
200+ Small Private
Local & Regional Providers
+
~ $40M
~ $750M
Well Positioned to Grow Organically and Through Acquisition
No Other
Providers

11
Acquisitions: Significant Part of Growth Strategy
▪ Three strategic acquisitions significantly expanded footprint
▪ Focusing route-based strategy on densely populated areas

12
Evolution of National Footprint
• Initial mailback service
• Route-based service (via network)
• Company owned route-based

13
Evolution of National Footprint
• Initial mailback service
• Route-based service (via network)
• Company owned route-based

14
Evolution of National Footprint
• Initial mailback service
• Route-based service (via network)
• Company owned route-based
Service to 24 States & 55% of U.S. Population
15
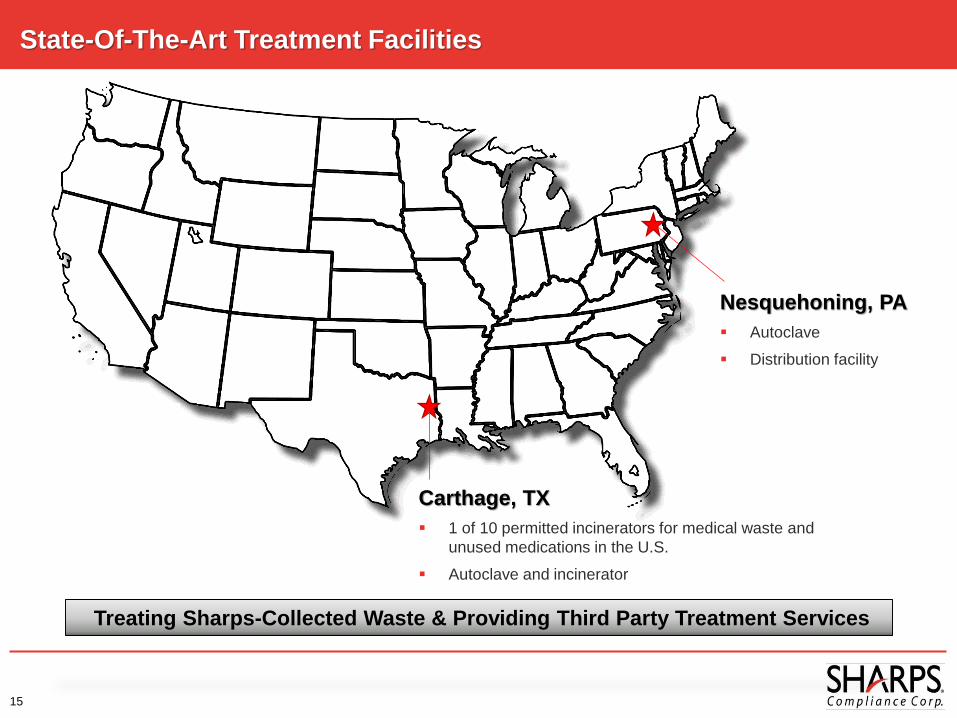
State-Of-The-Art Treatment Facilities
Carthage, TX
1 of 10 permitted incinerators for medical waste and
unused medications in the U.S.
Autoclave and incinerator
Nesquehoning, PA
Autoclave
Distribution facility
Treating Sharps-Collected Waste & Providing Third Party Treatment Services

16
Significant Capacity Available to Support Growth at Treatment Facilities
Both Facilities Have Additional Capacity As Business Scales
Current
Shifts
1
2
3
Shifts
1
2
3
Total Capacity
Currently running one
autoclave with two
shifts
Current
Shifts
1
2
3
Shifts
1
2
3
Current
Capacity
Utilization
Total Capacity
Carthage, TX Nesquehoning, PA
Running one autoclave
and one incinerator
with two shifts
Capacity to run 3 shifts
each

17
Shift to Full-Service
Q1 2019
Route-Based Mailback
27%
2013
Mail-back Route-based
1996-2012
Mail-back
1%
Route-based as Percentage of Medical Waste Revenue

18
Attractive Segments in Small to Medium Quantity Generator Markets
²Assumes about 28% of U.S. flu shots for adults administered in retail pharmacies
¹Average projected growth rates of physician, dental, and veterinary spending
Over the flu seasons from 2011-2018, Sharps saw growth in five years of 10% to 36% and declines in three years of 13% to 17%.
Market Market Size Market Growth Rate Current Penetration
Professional $648M 5%¹ 2%
Assisted Living/
Long-Term Care $84M 6% 2%
Home Health Care $100M 7% 8%
Retail Pharmacy $9.5M² 20-25%³ 58%
(FY 2018)
Excludes revenues associated with unused medications solutions
3
4
4

19
Professional Market
Customers
▪ Dental
▪ Veterinarian
▪ Physicians
▪ Other service-related professionals
▪ Surgery Centers
▪ Funeral Homes
▪ Dialysis, etc.
Market Opportunity
800,000Professional
Offices (U.S.)
$648M
Market
Opportunity

20
Assisted Living/Long-Term Care Market
Customers
*National Institute on Aging
Market Opportunity
$84M
Total
Addressable
Market
1 in 5 Americans
Age 65+
21
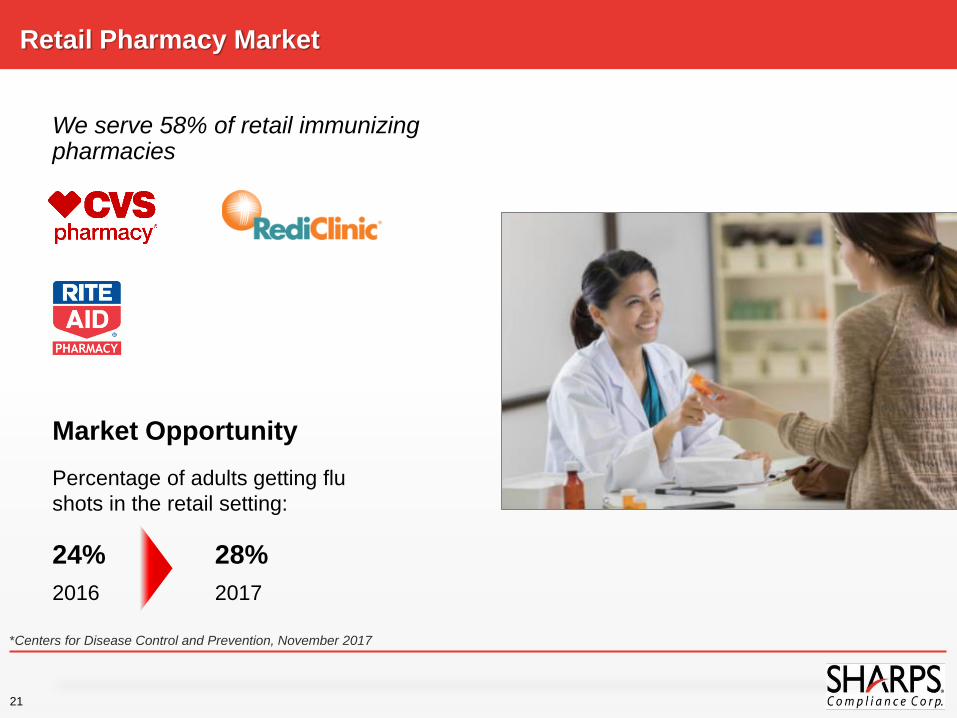
Retail Pharmacy Market
We serve 58% of retail immunizing pharmacies
*Centers for Disease Control and Prevention, November 2017
Market Opportunity
Percentage of adults getting flu
shots in the retail setting:
24%
2016
28%
2017

22
Unused Medications

23
Proper Disposal of Unused Medications is a National Priority
53%Percent of those who misused
prescription painkillers obtained them
from a friend or relative¹
11%Percent of unused medication disposed
of properly²
57%Percent of chronic pain patients who did
not receive information on what to do
with expired medication³
72,000Drug overdose deaths in the U.S. in
2017
¹ National Survey on Drug Use and Health
² Geisinger Center for Health Research
Sharps’ Disposal Solutions for Unused Meds and Controlled Substances
Are a Preventative Measure in the Battle Against Opioid Abuse
³Partnership for Druge-Free Kids
Center for Disease Control and Prevention 4
4

24
Unused Medications Market Opportunity
Growing Concern Given Overdose Epidemic
~250M lbs. Unused Medication
Waste Per Year
$1BMarket
Opportunity
Sharps Has Properly Disposed of More Than
2.7 Million Pounds of Unused Medication

25
Unused Medication & Controlled Substances: MedSafe
Solution Designed to Meet or Exceed DEA Proper Disposal Guidelines:
Helping Address the Opioid Abuse Crisis
Customers
▪ Pharmacies (retail and hospital)
▪ Long-term care facilities
▪ Government & local law enforcement
▪ Narcotic treatment programs

26
Growing Installed Base of MedSafe Creates Recurring Revenue Opportunity
Installs: 876
Returned Liners: 5,583
(3/31/17)
Installs: 1,587
Returned Liners: 11,273
(12/31/17)
Installs: 2,173
Returned Liners: 13,182
(3/31/18)
Installs: 2,539
Returned Liners: 16,134
(6/30/18)
Installs: 2,800
Returned Liners: 20,000+
(9/30/18)

27
Solution Designed to Meet or Exceed DEA Proper Disposal Guidelines:
TakeAway Medication Recovery
System™ envelopes for proper
mailback disposal of unused
medication, including controlled
substances, from ultimate users
Solution Designed to Meet or Exceed DEA Proper Disposal Guidelines:
Unused Medication & Controlled Substances: TakeAway Envelopes
Customers
▪ Retail pharmacies
▪ Long-term care
▪ VA & Military
Note: Envelope image shown above is for marketing purposes only. The actual envelope is not branded as
to meet the requirements of the Disposal Act (nondescript packaging).

28
New Solution Offering: TakeAway Recycle System
Increased Use of Single Use Devices in Healthcare Settings Is Driving the Need For
Compliant Solutions for Recyclable Components
Customers
▪ Surgery Centers
▪ Hospitals
▪ Device Manufacturers
• Opportunity to bundle the original
product with the Sharps TakeAway
Recycle System
Solution Designed for Compliant, Sustainable Disposal/Recycling of
Single Use Devices:
Laryngoscopes
Tubes
Masks
Forceps
Scopes
Airway Management

29
Financial Review
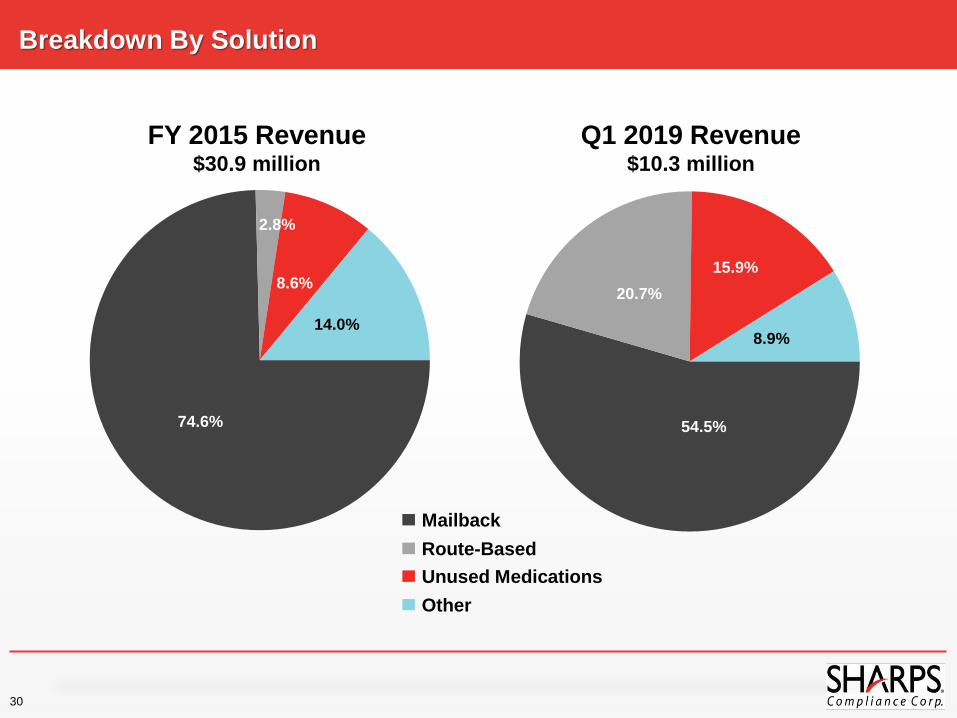
74.6%
2.8%
8.6%
14.0%
54.5%
20.7%
15.9%
8.9%
FY 2015 Revenue $30.9 million
Q1 2019 Revenue $10.3 million
30
Breakdown By Solution
Mailback
Route-Based
Unused Medications
Other
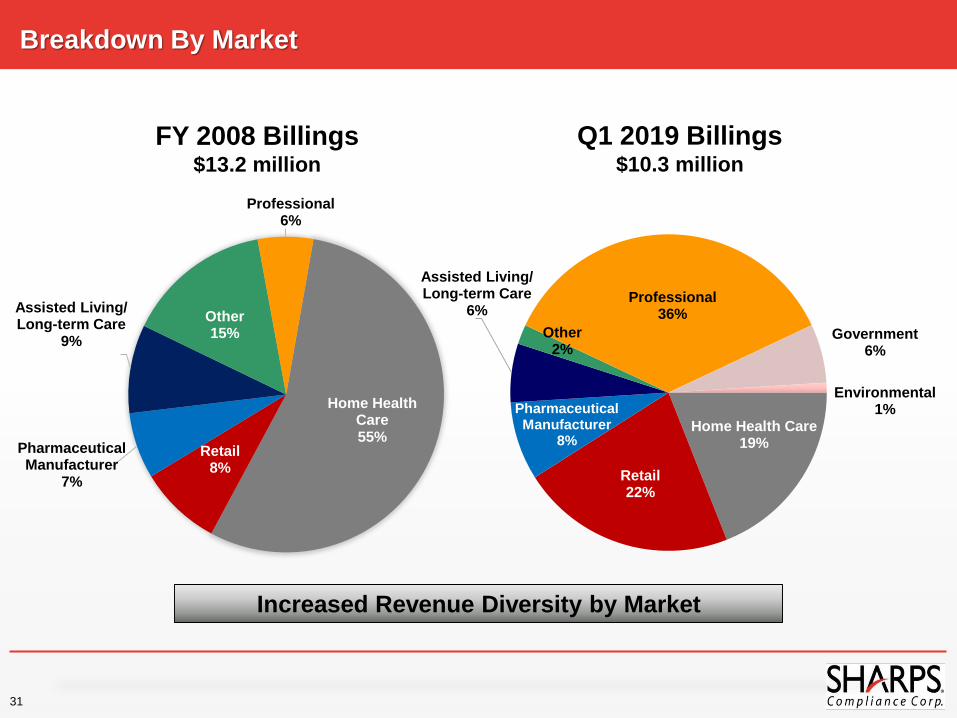
Home Health Care19%
Retail22%
Pharmaceutical Manufacturer
8%
Assisted Living/ Long-term Care
6%
Other2%
Professional36%
Government6%
Environmental1%Home Health
Care55%
Retail8%
Pharmaceutical Manufacturer
7%
Assisted Living/ Long-term Care
9%
Other15%
Professional 6%
FY 2008 Billings $13.2 million
Q1 2019 Billings$10.3 million
31
Breakdown By Market
Increased Revenue Diversity by Market

32
Billings By Market
Three Months Ended September 30,
2018 % Total 2017 $ Change %
BILLINGS BY MARKET:
Professional $ 3,674 35.7% $ 3,101 $ 573 18.5 %
Retail 2,260 21.9% 1,400 860 61.4 %
Home Health Care 1,927 18.7% 2,001 (74) (3.7)%
Pharmaceutical Manufacturer 808 7.8% 1,532 (724) (47.3)%
Assisted Living 645 6.3% 604 41 6.8 %
Government 597 5.8% 554 43 7.8 %
Environmental 103 1.0% 434 (331) (76.3)%
Other 290 2.8% 218 72 33.0 %
Subtotal $ 10,304 100.0% $ 9,844 $ 460 4.7 %
GAAP Adjustment * (11) (161) 150
Revenue Reported $ 10,293 $ 9,683 $ 610 6.3 %
* Represents the net impact of the revenue recognition adjustments to arrive at reported GAAP revenue. Customer billings include all invoiced amounts for products
shipped during the period reported. GAAP revenue includes customer billings as well as numerous adjustments necessary to reflect, (i) the deferral of a portion of
current period sales, (ii) recognition of certain revenue associated with product returned for treatment and destruction and (iii) provisions for certain rebates, product
returns and discounts to customers which are accounted for as reductions in sales in the same period the related sales are recorded. The difference between customer
billings and GAAP revenue is reflected in the Company’s balance sheet as contract liability.

33
Revenue
$21.5
$26.6
$30.9
$33.4
$38.2$40.1
$10.3
$-
$5
$10
$15
$20
$25
$30
$35
$40
$45
FY 2013 FY 2014 FY 2015 FY 2016 FY 2017 FY 2018 Q1 2019
Steady Annual Revenue Growth; 10.8% 4-Year CAGR
($ in millions)
34
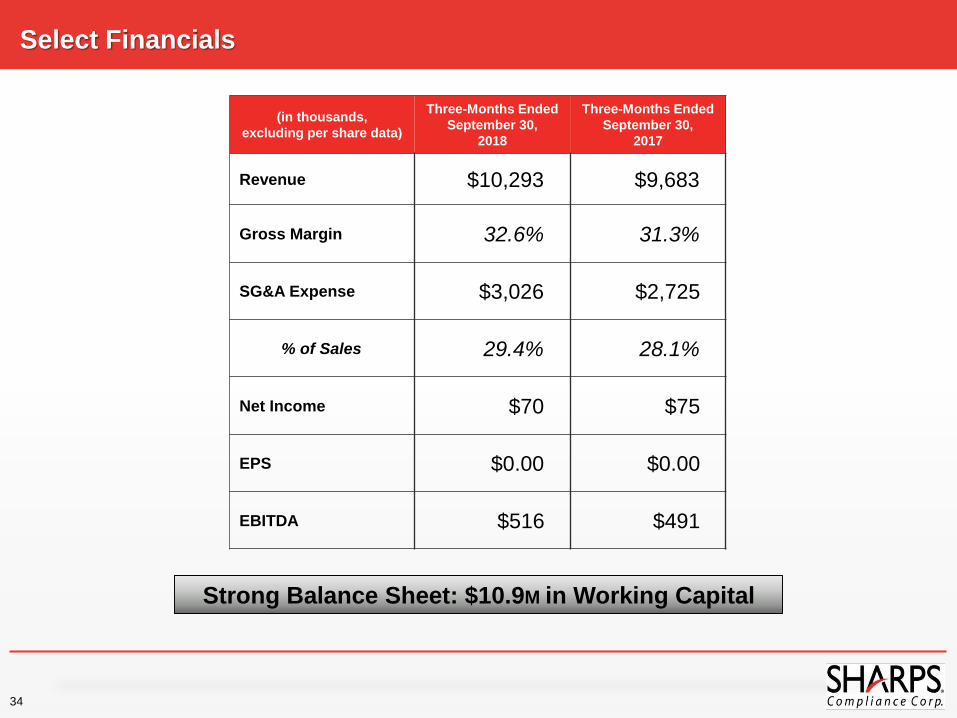
Select Financials
(in thousands,
excluding per share data)
Three-Months Ended
September 30,
2018
Three-Months Ended
September 30,
2017
Revenue $10,293 $9,683
Gross Margin 32.6% 31.3%
SG&A Expense $3,026 $2,725
% of Sales 29.4% 28.1%
Net Income $70 $75
EPS $0.00 $0.00
EBITDA $516 $491
Strong Balance Sheet: $10.9M in Working Capital

35
Attractive Business Model
Significant Operating Leverage
Costs are relatively fixed
• Operating infrastructure in place to grow 2-3X
45% - 50% gross margins on incremental revenues
5-10% SG&A increase on incremental revenues
High Recurring Revenue
Recurring revenue model; high customer retention rates
Attractive Alternative For Marketplace
Competitive contract pricing and terms
Customizable solution
Nationwide coverage