nasdaq-100 index® - nasdaq global index watch · pdf filecompanies are represented as such...
TRANSCRIPT

NASDAQ-100 INDEX® FUNDAMENTALS
Nasdaq-100 Index: History • The Nasdaq-100® (NDX) is comprised of the 100 largest, non-financial
companies listed on The Nasdaq Stock Market®
• Launched on January 31, 1985
• Rebalanced to modified market cap index on December 21, 1998
• Special Rebalance effective May 2, 2011
Nasdaq-100 Index 2

Innovation and Disruption
Apple | Amazon |Cisco |Intel |Qualcomm
Technology continues to evolve and become more efficient each day. Creating products or services which continue to be in demand is essential to surviving in today’s competitive world.
Technology and Social Media platforms have helped improve communication in everyday life. This has made global communication much more efficient. The economic value these products and services add to consumers should not be overlooked.
The technology industrials are the new drivers of the industry. Businesses around the world will continue to demand and use these highly efficient products to keep pace with their competitors.
Nasdaq-100 Index 3

Nasdaq-100 Index: Overview
Technology stocks have evolved from creating new and niche consumer products to a group of companies upon which every industry and sector have become dependent. From day-to-day tasks to social interaction, each has an important influence on everyday life.
• GE, Chicago Gas Company, American Sugar Company, and the other original Dow Industrials helped spur the economic growth of the US economy in 1896.
• Today, Apple, Amazon, Intel, and Microsoft have become global leaders in the technology sector by helping create products which continue to be in high demand from consumers. From computers to cell phones, all of these products will continue to become more advanced in the future.
• From a social perspective, Facebook has become a quick and efficient way of interacting with friends around the globe. Starbucks also continues to improve its efficiency to customers by utilizing advanced technology.
Nasdaq-100 Index 4
Contains the household names leading the new economy forward.

Nasdaq-100 Index: Performance
Nasdaq-100 Index 5
INDEX ANNUAL RETURNS INDEX PERFORMANCE FROM 2003
• NDX has been marked by both the growth and maturation of the companies in the index over the years. Through the financial crisis, in the subsequent market rebound and the following bull market, NDX’s P/E has stabilized. NDX’s 2017 annual P/E of 28.73 is slightly higher than SPX’s 25.03.
• There were substantial increases in market cap along with earnings in NDX from year-end 2012 to 2017 (from $3.1T to $7.1T in market cap and from $137B in earnings to $247B).
• NDX realized volatilities for 2013, 2014, 2015, 2016 and 2017 were 12.5%, 14.0%, 17.9%, 16.1%, and 10.28%, respectively.
• NDX yield increased most years between 2003 and 2016, and finished 2017 with a yield of 1.04%.
The NASDAQ-100 Index’s price return performance versus the S&P 500 on both an annual basis (left) and cumulative basis (above)
-60%
-40%
-20%
0%
20%
40%
60%
2003 2004 2005 2006 2007 2008 2009 2010 2011 2012 2013 2014 2015 2016 20170
1000
2000
3000
4000
5000
6000
7000
NDX SPX
INDEX ANNUAL RETURNS

The Decade of the Nasdaq-100
Nasdaq-100 Index 6
• Central bankers have talked consistently about a strengthening economy while reaffirming plans for interest rate hikes and we’ve seen those rate hikes start to come through.
• The fundamental picture of the Nasdaq-100 has not been changed and the long term performance of the Nasdaq-100 is consistently beating other major, large cap equity market indexes (chart to the right).
• The Nasdaq-100 has had a higher annual return than the S&P 500 eight of the last ten years.
INDEX PERFORMANCE FROM 2008
0
500
1,000
1,500
2,000
2,500
3,000
3,500
NDX SPX
The Decade of the Nasdaq-100
Nasdaq-100 Index 7
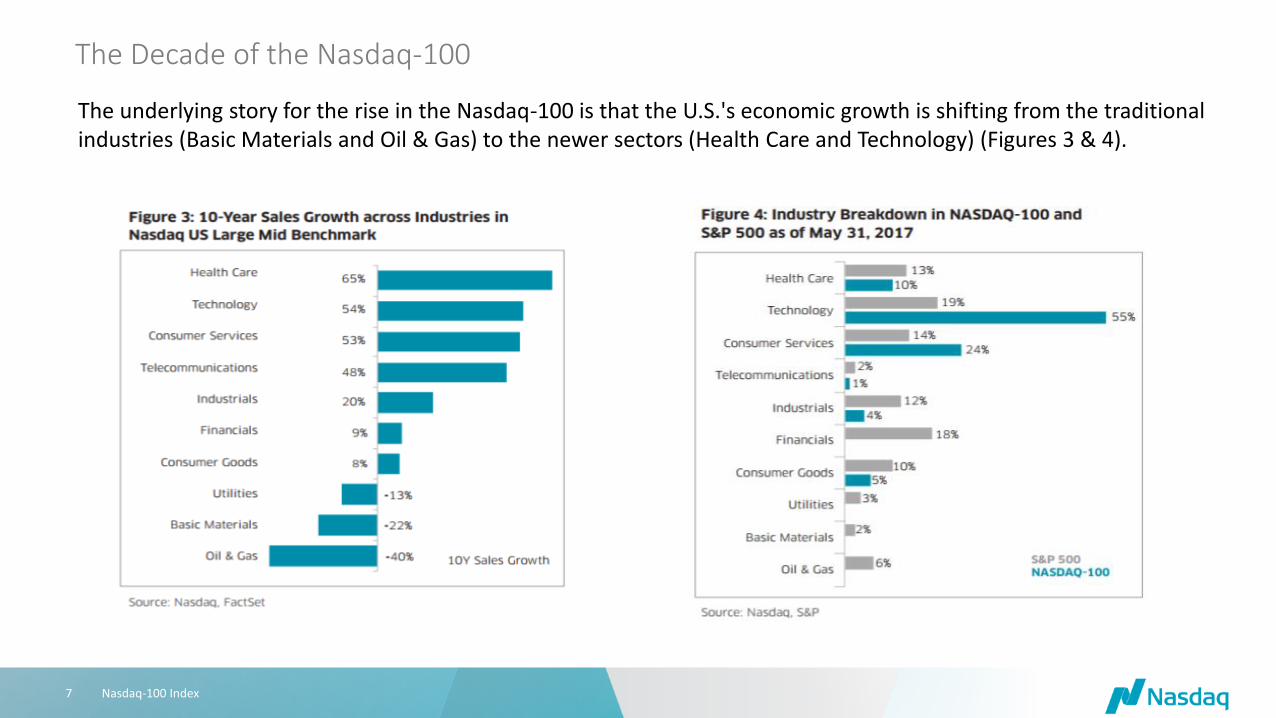
The underlying story for the rise in the Nasdaq-100 is that the U.S.'s economic growth is shifting from the traditional industries (Basic Materials and Oil & Gas) to the newer sectors (Health Care and Technology) (Figures 3 & 4).

THE 100 THAT MAKE THE INDEX

Top 50 vs bottom 50
Nasdaq-100 Index 9
The top positions in market capitalization weighted indexes are often heavily focused on larger holdings while putting less emphasis on smaller holdings. We can visualize it with a sample test. Let’s equally divide the stocks in the Nasdaq-100 into two segments based on market capitalization: the Top 50 and the Bottom 50. The average Price to Book ratio chart shows a consistent bias toward the Top 50 - they are highly valued (Figure 2). This means that great values exist in the bottom 50 of the Nasdaq-100. Our back-tests also verified that the equally weighted bottom 50 portfolio has outperformed the top 50 portfolio since 2001 (Figure 3).

Nasdaq-100 Index: COMPONENTS
Nasdaq-100 Index 10
2017 TOP PERFORMERS
HIGHEST 2017 YOY GROWTH IN EARNINGS
Additional select, high performing components not in the top 10 include:
Microsoft, Apple, Facebook, and Amazon. Ticker Name 2017 Return 12/29/2017 Weight
ALGN ALIGN TECHNOLOGY I 131% 0.24%
TTWO TAKE-TWO INTERACTI 123% 0.17%
VRTX VERTEX PHARMACEUTIC 103% 0.52%
MELI MERCADOLIBRE, INC. 102% 0.19%
WYNN WYNN RESORTS LIMITED 95% 0.24%
MU MICRON TECHNOLOGY 88% 0.65%
PYPL PAYPAL HOLDINGS 87% 1.21%
NVDA NVIDIA CORPORATION 81% 1.60%
ATVI ACTIVISION BLIZZARD 75% 0.65%
LRCX LAM RESEARCH CORP 74% 0.41%
Ticker Name 2017 Earnings
Growth
SHPG SHIRE PLC-ADR 1015%
PCAR PACCAR INC 222%
KHC KRAFT HEINZ CO/T 218%
CSX CSX CORP 215%
STX SEAGATE TECHNOLO 209%
TMUS T-MOBILE US INC 207%
DLTR DOLLAR TREE INC 201%
NFLX NETFLIX INC 193%
NVDA NVIDIA CORP 168%
TSLA TESLA INC 164%

Average, median and minimum market caps of the NASDAQ-100 and the S&P 500
• All figures dropped during the financial crisis and have rebounded since.
• Eight of the last nine years the average market cap has been higher in NDX than SPX including 2017 (NDX: $71.08, SPX: $46.42B).
• The median market cap has been higher for NDX than SPX in each of the last five years — in 2017 the medians were $32.5B for NDX and $21.4B for SPX. Despite any large companies, the market cap of NDX tends to be truer to large cap than SPX.
• The smallest company in NDX (2017: $9.9B) has been larger than the smallest company in SPX (2017: $2.6B) for the last ten years.
CONTINUED Nasdaq-100 Index: COMPONENTS
Nasdaq-100 Index 11
NDX: MARKET CAP SPX: MARKET CAP
0
10
20
30
40
50
60
70
80
Dec-07 Dec-08 Dec-09 Dec-10 Dec-11 Dec-12 Dec-13 Dec-14 Dec-15 Dec-16 Dec-17
Bill
ion
s
Average Median Min
0
10
20
30
40
50
60
70
80
Dec-07 Dec-08 Dec-09 Dec-10 Dec-11 Dec-12 Dec-13 Dec-14 Dec-15 Dec-16 Dec-17
Bill
ion
s
Average Median Min
NDX: MARKET CAP

Nasdaq-100 Index: Changes
Nasdaq-100 Index 12
Performance of the Nasdaq-100 and the CBOE Market Volatility Index (VIX) along with the number of total component changes in the Nasdaq-100 each year. • The NASDAQ-100 index hit a new all-time high the first week of December 2017. More recently, the index has just reached a new all time high in Mid-March 2018.
• Since the early 2000’s there have been significantly fewer component changes in the index on an annual basis.
0
5
10
15
20
25
30
35
0
200
400
600
800
1000
1200
1400
1600
1800
Component Changes NDX VIX

NASDAQ-100 BY THE SECTORS

Sector Breakdown
• While heavy in technology, consumer industries and healthcare make up a comparable weight
• Consumer Services contains companies like Amazon, Starbucks, Netflix, Sirius, Costco and Viacom
Nasdaq-100 Index 14
NASDAQ-100 INDEX: SECTORS
Source: Nasdaq, Bloomberg. Data as of 12/29/17.
Industry Weight Contributed Return Pure Return Benchmark return
Technology 56.78% 7.16% 13.97% 14.20% Consumer Services 23.00% 1.83% 7.15% 7.32%
Health Care 9.93% -3.00% -19.38% -2.30%
Consumer Goods 4.78% 0.30% 5.68% 5.94%
Industrials 4.46% 0.72% 18.84% 19.98%
Telecommunications 0.92% 0.24% 28.28% 23.77%
Basic Materials 0.00% 0.00% 0.00% 25.31%
Oil & Gas 0.00% 0.00% 0.00% 26.08%
Financials 0.00% 0.00% 0.00% 18.84%
Utilities 0.00% 0.00% 0.00% 18.75%
Sector Exposure Matters
Nasdaq-100 Index 15
0
50
100
150
200
250
300
350
400
450
12/31/2008 12/31/2009 12/31/2010 12/31/2011 12/31/2012 12/31/2013 12/31/2014 12/31/2015 12/31/2016
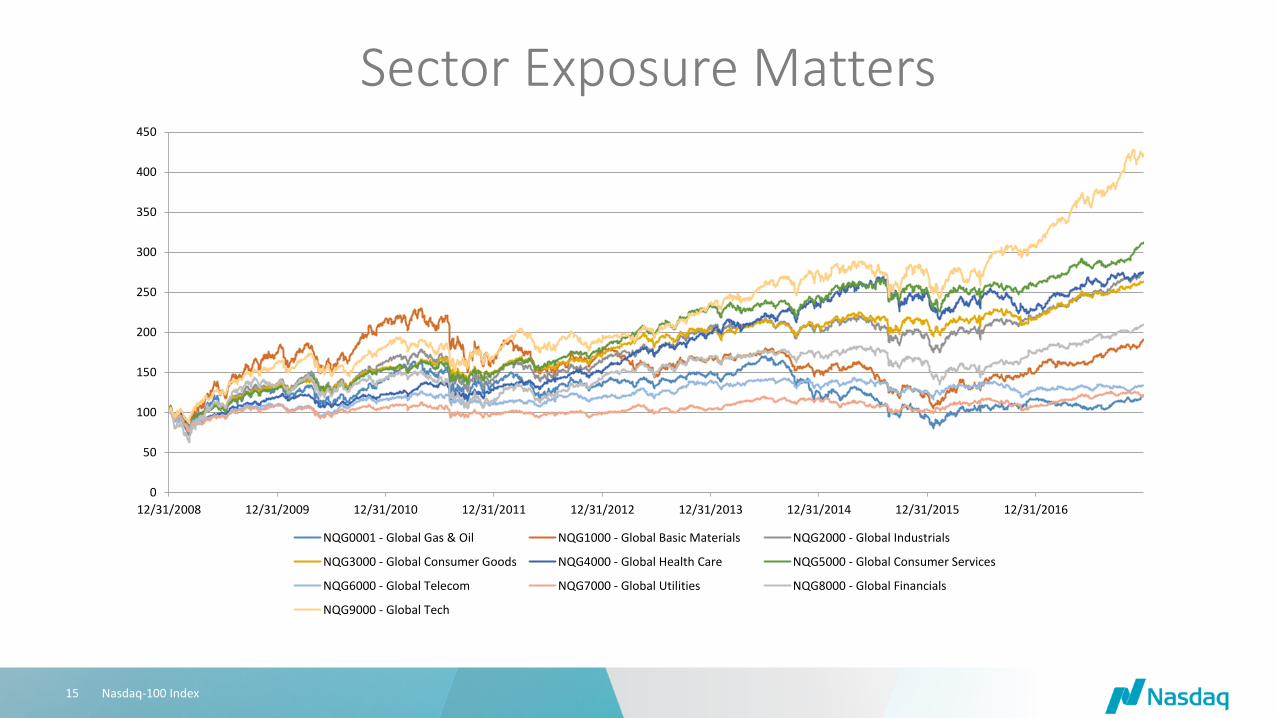
NQG0001 - Global Gas & Oil NQG1000 - Global Basic Materials NQG2000 - Global Industrials
NQG3000 - Global Consumer Goods NQG4000 - Global Health Care NQG5000 - Global Consumer Services
NQG6000 - Global Telecom NQG7000 - Global Utilities NQG8000 - Global Financials
NQG9000 - Global Tech

Technology or Financials
Nasdaq-100 Index 16
0
50
100
150
200
250
300
350
US Financials Global Tech Global Financials US Tech

Industries and Dividends
Cumulative Dividend Growth Since 2008
INDUSTRY RETURN
1 Technology 181.9%
2 Health Care 41.1%
3 Telecommunications 24.9%
4 Utilities 18.3%
5 Industrials 11.1%
6 Oil & Gas 7.5%
7 Financials 6.4%
8 Consumer Services -17.8%
9 Basic Materials -45.0%
10 Consumer Goods -64.4%
Nasdaq-100 Index 17
• Industry exposure, when pursuing dividend growth, is extremely important
• Technology and Health Care, two industries dominated by Nasdaq-100 companies, have had tremendous dividend growth and are poised for continued growth

Nasdaq-100 Index: Dividends Paid By Industry
Nasdaq-100 Index 18
NDX: DIVIDENDS PAID ($B): TECH VS. EX-TECH
NDX: DIVIDENDS PAID ($B): EX-TECH BY INDUSTRY
• Since 2009, Technology dividends have shown tremendous growth — with dividends increasing from $10.6B to $24.2B in 2012 and $47.99B in 2017.
• Ex-Tech dividends have increased every year since 2003 from less than $1B to over $26.17B in 2017.
• Consumer Services was the largest dividend payer outside of Technology in 2017. The largest divided payers from the industry were Comcast, Walgreens, and Starbucks
• The largest five dividend payers in 2017 outside of Technology and Consumer Services were Vodafone, Amgen, Kraft, Gilead, and Automatic Data
Other represents the Basic Materials, Oil & Gas, and Telecommunications industries.
YEAR Technology Ex-Tech
2003 1.64 0.56
2004 3.15 0.95
2005 7.89 1.75
2006 8.37 2.95
2007 8.26 3.05
2008 9.52 3.39
2009 10.64 5.72
2010 12.33 6.05
2011 15.01 8.37
2012 24.21 12.62
2013 32.96 15.26
2014 36.70 14.09
2015 38.89 22.82
2016 43.31 25.77
2017 47.99 26.17
YEAR Consumer Goods Consumer Services Health Care Industrials Other
2003 0.05 0.02 0.09 0.39 0.02
2004 0.10 0.20 0.14 0.48 0.03
2005 0.11 0.54 0.25 0.78 0.08
2006 0.16 1.17 0.32 1.18 0.11
2007 0.16 1.23 0.26 0.90 0.50
2008 0.15 1.02 0.39 1.70 0.13
2009 0.42 1.91 0.45 1.75 1.19
2010 0.59 2.11 0.52 1.66 1.17
2011 0.52 3.31 1.09 2.13 1.32
2012 2.40 4.58 1.17 2.33 2.15
2013 2.79 4.90 1.42 2.15 4.00
2014 2.88 5.73 1.86 2.35 1.28
2015 4.45 7.50 4.24 2.10 4.52
2016 4.94 8.05 5.74 3.01 4.02
2017 3.49 8.53 6.45 3.31 4.37
Nasdaq-100 Index: Alternative method to obtaining exposure – equal weight
INDEX PERFORMANCE NDX MINUS NDXE ROLLING 1-YEAR RETURNS
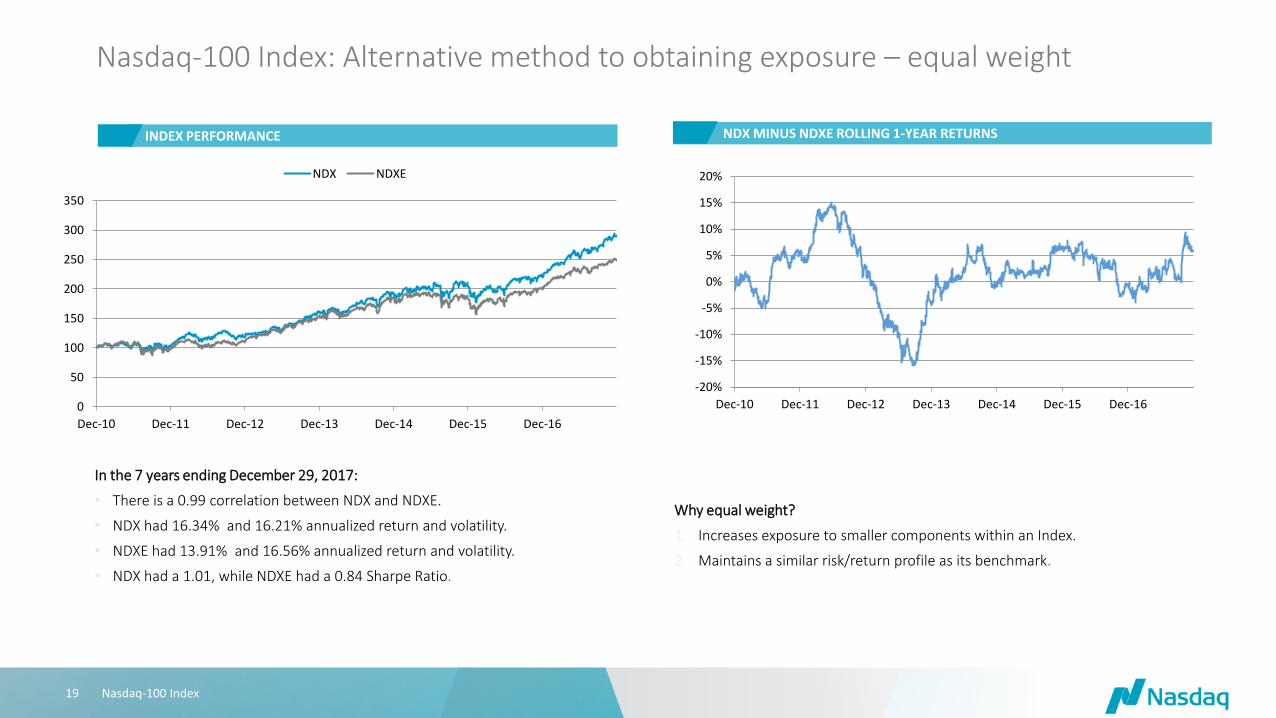
In the 7 years ending December 29, 2017:
• There is a 0.99 correlation between NDX and NDXE.
• NDX had 16.34% and 16.21% annualized return and volatility.
• NDXE had 13.91% and 16.56% annualized return and volatility.
• NDX had a 1.01, while NDXE had a 0.84 Sharpe Ratio.
Why equal weight?
1. Increases exposure to smaller components within an Index.
2. Maintains a similar risk/return profile as its benchmark.
0
50
100
150
200
250
300
350
Dec-10 Dec-11 Dec-12 Dec-13 Dec-14 Dec-15 Dec-16
NDX NDXE
-20%
-15%
-10%
-5%
0%
5%
10%
15%
20%
Dec-10 Dec-11 Dec-12 Dec-13 Dec-14 Dec-15 Dec-16
INDEX PERFORMANCE
Nasdaq-100 Index 19

Nasdaq-100 Index: Alternative method to obtaining exposure – equal weight CONTINUED
Nasdaq-100 Index 20
COMPARISON OF APPLE IN NDX AND NDXE IN DIFFERENT MARKET SCENARIOS.
From September 2012 through February 2013, Apple had a significant loss of market value while other NDX components were up and thus two equal weight strategies (NDXE and NDXT), which mitigate Apple’s weight, outperformed NDX during this period. NDXE mutes the exposure and thus risk of any single company having an outsized impact on index returns. Given NDXE can mute on the downside, it is important to note if the trend was in reverse and a large component had a run up, NDX will outperform NDXE as we saw in the first half of 2012. During the Apple run-up, the company posted positive returns of 55%, resulting in NDX outperforming NDXE by 5.5%. During the Apple run-down, the company posted negative returns of -33%, resulting in NDXE outperforming NDX by 10.2%.
AAPL NDX NDXE NDXT
60
80
100
120
9/19/2012 10/19/2012 11/19/2012 12/19/2012 1/19/2013
100
120
140
160
1/3/2012 1/17/2012 1/31/2012 2/14/2012 2/28/2012 3/13/2012 3/27/2012
Nasdaq-100 Index: Tech vs ex-Tech Exposure
Nasdaq-100 Index 21
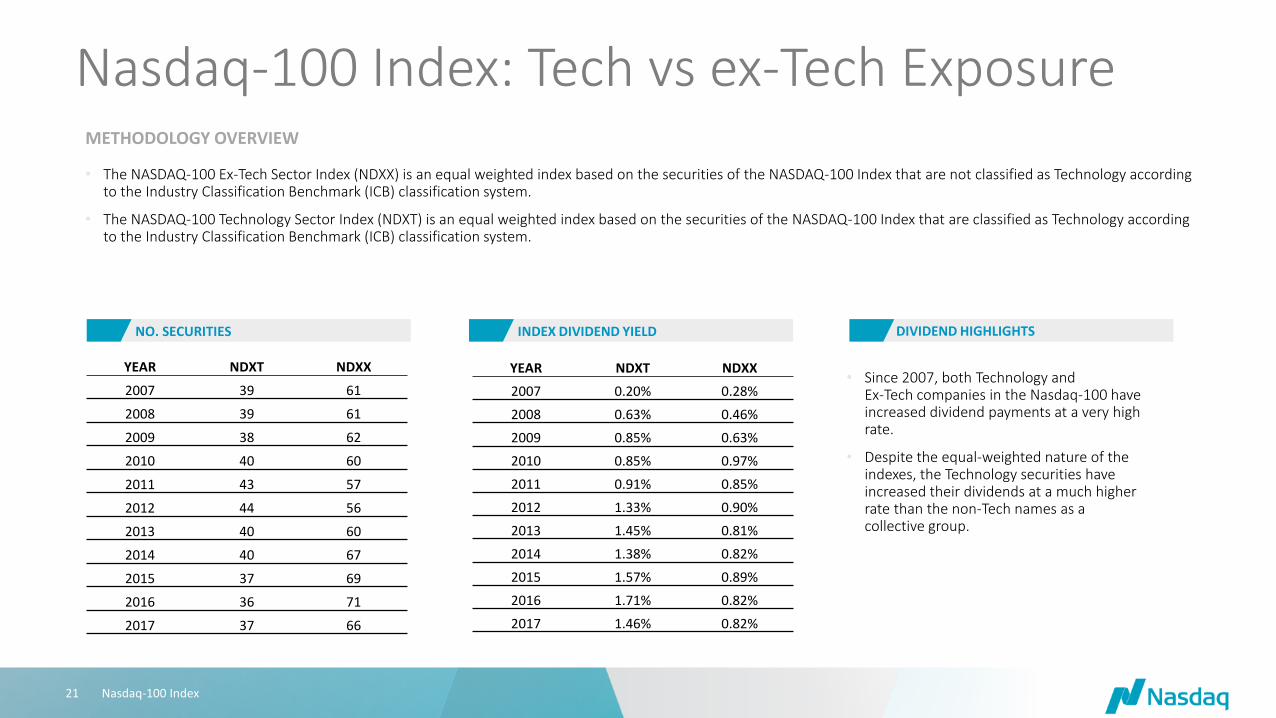
METHODOLOGY OVERVIEW
• The NASDAQ-100 Ex-Tech Sector Index (NDXX) is an equal weighted index based on the securities of the NASDAQ-100 Index that are not classified as Technology according to the Industry Classification Benchmark (ICB) classification system.
• The NASDAQ-100 Technology Sector Index (NDXT) is an equal weighted index based on the securities of the NASDAQ-100 Index that are classified as Technology according to the Industry Classification Benchmark (ICB) classification system.
NO. SECURITIES INDEX DIVIDEND YIELD DIVIDEND HIGHLIGHTS
YEAR NDXT NDXX
2007 0.20% 0.28%
2008 0.63% 0.46%
2009 0.85% 0.63%
2010 0.85% 0.97%
2011 0.91% 0.85%
2012 1.33% 0.90%
2013 1.45% 0.81%
2014 1.38% 0.82%
2015 1.57% 0.89%
2016 1.71% 0.82%
2017 1.46% 0.82%
YEAR NDXT NDXX
2007 39 61
2008 39 61
2009 38 62
2010 40 60
2011 43 57
2012 44 56
2013 40 60
2014 40 67
2015 37 69
2016 36 71
2017 37 66
• Since 2007, both Technology and Ex-Tech companies in the Nasdaq-100 have increased dividend payments at a very high rate.
• Despite the equal-weighted nature of the indexes, the Technology securities have increased their dividends at a much higher rate than the non-Tech names as a collective group.

Nasdaq-100 Index: Tech vs ex-Tech Exposure
Nasdaq-100 Index 22
• Below is a comparison of the full Nasdaq-100 Index with equal weights assigned to each company (NDXE), along with NDXX and NDXT Indexes.
• Naturally, the full equal-weighted basket has returns in between the Technology and Ex-Tech indexes.
• In the last few years, the Technology and Ex-Tech names have buoyed between who is the bigger driver of returns. The tide has shifted more recently with higher performance in the Technology index in the past year.
CONTINUED
INDEX PERFORMANCE NDXX MINUS NDXT ROLLING 1-YEAR RETURNS
0
50
100
150
200
250
300
350
Dec-10 Dec-11 Dec-12 Dec-13 Dec-14 Dec-15 Dec-16
NDXX NDXT NDXE
-50%
-40%
-30%
-20%
-10%
0%
10%
20%
30%
40%
Dec-10 Dec-11 Dec-12 Dec-13 Dec-14 Dec-15 Dec-16

THE FUNDAMENTALS

Nasdaq-100 Index: Fundamental Data • The fundamental data behind the NASDAQ-100 has drastically improved over the
past decade despite a volatile economy and the greatest financial market collapse since the Great Depression.
• Earnings, the most basic number to value a company, have skyrocketed, showing maturation of the companies as they increase revenues but reduce costs. Costs have been controlled, shares were bought back, dividends have increased and P/E has contracted.
• Since 2003, NDX has had a Compound Annual Growth Rate (CAGR) of: - + 24% in earning - + 14% in revenue - + 20% in dividend value - - 11% in P/E
• The shift in fundamentals of the NASDAQ-100 has resulted in significant outperformance over other US large cap indexes.
Nasdaq-100 Index 24
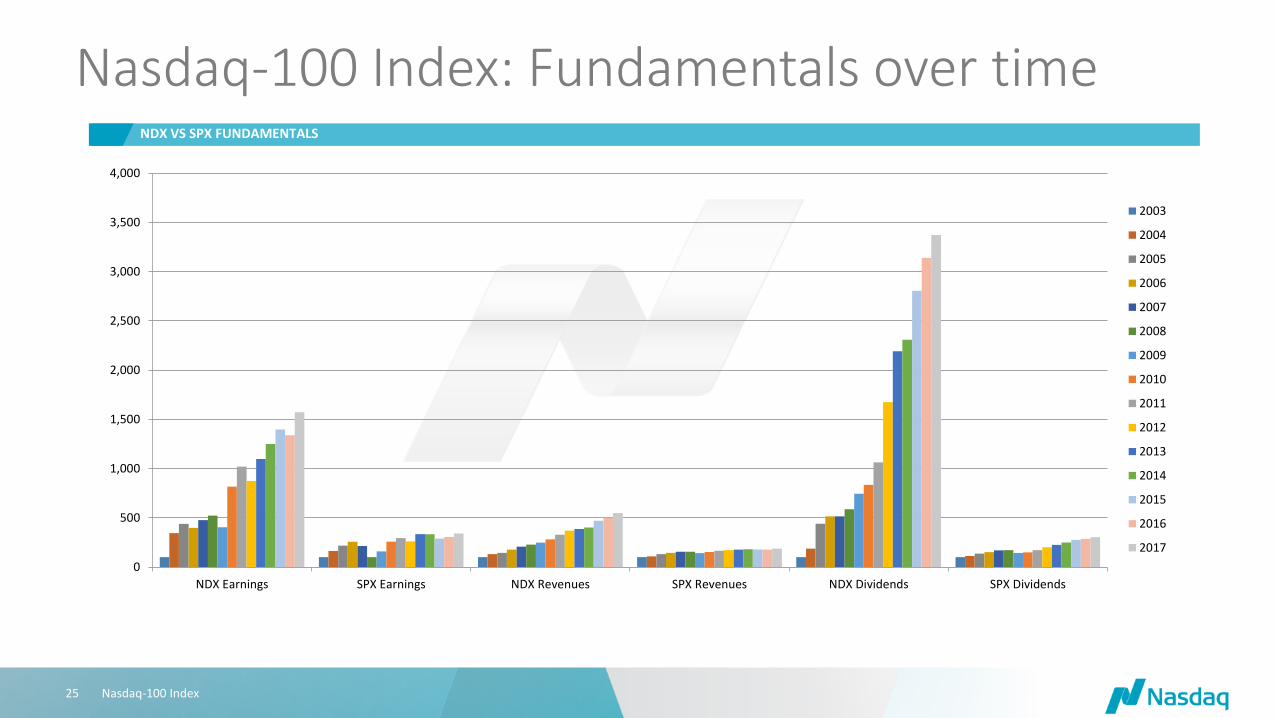
Nasdaq-100 Index: Fundamentals over time
Nasdaq-100 Index 25
NDX VS SPX FUNDAMENTALS
0
500
1,000
1,500
2,000
2,500
3,000
3,500
4,000
NDX Earnings SPX Earnings NDX Revenues SPX Revenues NDX Dividends SPX Dividends
2003
2004
2005
2006
2007
2008
2009
2010
2011
2012
2013
2014
2015
2016
2017

Nasdaq-100 Index: Dividends
Nasdaq-100 Index 26
NDX: DIVIDENDS NDX: CASH / DEBT RATIO
Apple, Cisco, Amgen, Comcast and others have increased dividends in the last couple of years, and the trend looks to continue with more
names.
YEAR DIVIDENDS PAID ($B) DIVIDEND YIELD
2003 2.20 0.10%
2004 4.10 0.18%
2005 9.65 0.43%
2006 11.32 0.55%
2007 11.31 0.48%
2008 12.90 0.89%
2009 16.37 0.74%
2010 18.38 0.74%
2011 23.38 0.93%
2012 36.83 1.20%
2013 48.22 1.19%
2014 50.79 1.11%
2015 61.72 1.22%
2016 69.08 1.27%
2017 74.16 1.04%
YEAR CASH ($B) DEBT ($B)
2003 180.08 94.47
2004 225.38 104.24
2005 212.32 95.06
2006 231.92 151.13
2007 248.20 189.28
2008 248.83 184.34
2009 331.33 253.63
2010 423.93 276.18
2011 522.79 342.45
2012 589.33 309.62
2013 663.08 553.96
2014 683.30 450.56
2015 836.56 810.63
2016 968.22 995.46
2017 1066.61 1075.68
0%
50%
100%
150%
200%
250%

NASDAQ-100 Index: Earnings
Nasdaq-100 Index 27
EARNINGS (Billions USD) • In 2003, the Nasdaq-100 had total earnings of $15.7B. S&P
500, on the other hand, had $275B.
• Along with dividend growth, earnings exploded in the
Nasdaq-100 in the last 14 years.
• In 2017, the earnings of the Nasdaq-100 ended at $247.4B
while the S&P 500 ended up at $936.7B.
• Nasdaq’s proportional growth is nearly five fold that of the
S&P 500.
• Growth in earnings of the S&P 500 is quite high at 340% over
that time, but the Nasdaq-100 growth in earnings was a
staggering 1,546%, cumulatively.
YEAR Nasdaq-100 S&P 500
2003 15.7 275.4
2004 54.2 446.6
2005 68.7 598.0
2006 62.5 706.7
2007 75.0 589.0
2008 82.0 275.8
2009 63.5 437.4
2010 128.6 709.7
2011 160.3 808.5
2012 137.3 718.9
2013 172.7 918.2
2014 196.5 915.1
2015 219.9 796.0
2016 210.7 838.1
2017 247.4 936.7

Nasdaq-100 Index: Revenues
• A similar story to earnings and dividends, the Nasdaq-100 has far outpaced S&P on top-line growth.
• Every year since 2003, the components of the Nasdaq-100 have posted higher annual revenue figures.
• Revenues in the Nasdaq-100 surpassed the $2.19B threshold in 2017, a 447% increase from 2003. With S&P 500’s figures ending at $11.09B, it experienced a 86% increase over that same span.
Nasdaq-100 Index 28
REVENUES (Billions USD)
YEAR Nasdaq-100 S&P 500
2003 400.07 5,950.22
2004 528.08 6,478.16
2005 578.07 7,781.78
2006 705.34 8,605.05
2007 832.62 9,280.21
2008 906.65 9,298.35
2009 994.85 8,353.35
2010 1,119.42 9,085.20
2011 1,309.27 9,868.67
2012 1,481.38 10,236.52
2013 1,542.42 10,532.81
2014 1,606.81 10,699.04
2015 1,881.31 10,648.13
2016 2,002.98 10,474.57
2017 2,191.71 11,090.05

Disclaimer
Nasdaq-100 Index 29
Nasdaq® is a registered trademark of Nasdaq, Inc. The information contained above is provided for informational and educational purposes only, and nothing contained herein should be construed as investment advice, either on behalf of a particular security or an overall investment strategy. Neither Nasdaq, Inc. nor any of its affiliates makes any recommendation to buy or sell any security or any representation about the financial condition of any company. Statements regarding Nasdaq-listed companies or Nasdaq proprietary indexes are not guarantees of future performance. Actual results may differ materially from those expressed or implied. Past performance is not indicative of future results. Investors should undertake their own due diligence and carefully evaluate companies before investing. ADVICE FROM A SECURITIES PROFESSIONAL IS STRONGLY ADVISED. © 2018. Nasdaq, Inc. All Rights Reserved.