nasa technical note nasa d-5010 · c nasa technical note nasa ---. tn d-5010 l -loan copy: deturn...
TRANSCRIPT

. . c
NASA TECHNICAL NOTE NASA TN D-5010---. L -
LOAN COPY: dETURN TO A W L (WLIL-2)
KlRTLAND AFB, N MEX
TENSILE PROPERTIES AND CREEP STRENGTH OF THREE ALUMINUM ALLOYS EXPOSED UP TO 25 000 HOURS AT 2000 TO 4000 F (370° TO 480° K)
by Dick M . Royster
LangZey Research Center LungZey Station, Humpton, Va. a;
N A T I O N A L AERONAUTICS A N D SPACE A D M I N I S T R A T I O N W A S H I N G T O N , D. C. J A N U A R Y 1 9 6 9 i/
i
https://ntrs.nasa.gov/search.jsp?R=19690009865 2018-05-28T21:33:21+00:00Z

TECH LIBRARY KAFB, NM
I1111111111Ill11lllllIll1lllll1llllIll11111 013LBb7
NASA TN D-5010
TENSILE PROPERTIES AND CREEP STRENGTH
OF THREE ALUMINUM ALLOYS EXPOSED UP TO 25 000 HOURS
AT 200' TO 400' F (370' TO 480' K)
By Dick M. Royster
Langley Research Center Langley Station, Hampton, Va.
NATIONAL AERONAUT ICs AND SPACE ADMlN ISTRATION
For sale by the Clearinghouse for Federol Scientific and Technical Information Springfield, Virginia 22151 - CFSTl price $3.00

TENSILE PROPERTIES AND CREEP STRENGTH
OF THREE ALUMINUM ALLOYS EXPOSED U P TO 25000 HOURS
AT 200' TO 400' F (370' TO 480' K)
By Dick M. Royster Langley Research Center
SUMMARY
The tensile properties and creep strength of three aluminum -alloy sheet materials exposed up to 25000 hours at 200° to 400° F (370° to 480° K) were investigated. The materials investigated were clad 2024-T81, X2020-T6, and clad RR- 58 aluminum alloys. These alloys a r e representative of the types considered for a supersonic transport operating in the Mach 2 speed range.
The effect of longtime, elevated- temperature exposures was determined from changes in tensile and notch properties a t room temperature. The short-time, elevated-temperature tensile properties as well as the tensile s t r e s s required to produce 0.1percent creep were determined. Metallurgical studies were made to determine micro-structural changes in the alloys due to exposure. With the exception of the X2020-T6 alloy, the material tensile properties were not severely affected by longtime unstressed exposure. The X2020-T6 alloy also exhibited poor notch toughness. Low creep strength in the aluminum alloys at temperatures above 300° F (420O K) may limit their use for longtime exposures.
INTRODUCTION
Materials research in support of a commercial supersonic transport in the U.S.A. began about 1960 when the speed and other operating characteristics of such a transport were tentatively defined. Since then, materials investigations have been initiated in many diverse problem areas. One aspect of the materials research program at the Langley Research Center has been concerned primarily with the effects of longtime environmental exposure on the mechanical properties of various sheet materials: titanium alloys, stainless steels, glass-reinforced composites, and aluminum alloys. (For example, see ref . 1.)
The present investigation on aluminum alloys was begun in 1963 to provide materials information for the Mach 2 speed range. This report summarizes the results obtained on the stability, strength, and creep of three aluminum-alloy sheet materials exposed up to

25000 hours to temperatures from 200° to 400° F (370° to 480° K). The aluminum alloys investigated were clad 2024-T81, X2020-T6, and clad RR-58. Data were obtained on the tensile properties of the alloys at room temperature and - l l O o F (190° K) and on the effects of longtime, elevated-temperature exposure on unstressed tensile and notched specimens. The short- time, elevated-temperature tensile properties as well as the tensile s t r e s s to produce 0.1-percent creep were determined. The creep data were correlated by a time-temperature parameter. Metallurgical studies were included to determine changes in the microstructure of the alloys due to exposure.
The units used for the physical quantities defined in this paper a r e given both in the U.S. Customary Units and in the International System of Units (SI). Factors relating the two systems a r e given in reference 2, and those used in the present investigation a r e presented in the appendix.
MATERIALS AND SPECIMENS
Materials
The three aluminum-alloy sheet materials utilized in this investigation were selected from considerations involving strength, notch toughness, prospective creep resistance, and stability at room and elevated temperatures. Stability is defined as the ability of the alloys to retain their preexposure tensile properties. Two of the alloys a r e American (clad 2024-T81 and X2020-T6), and the third is British (clad RR-58). A description of the sheet materials and heat treatments is found in table I. The alloy RR-58 o r AU2GN (French designation) is being used in the construction of the British-French supersonic transport, the Concorde (ref. 3). However, the material has been modified somewhat in its manufacturing processes to improve its creep resistance. The modified material is designated as CM.OO1 (CM indicates Concorde material).
The clad 2024-T81 and X2020-T6 alloys contain copper and small percentages of other elements as hardeners. The clad RR-58 alloy contains less copper and more magnesium, nickel, and iron than the two American alloys. The nominal chemical composition of the sheet materials is given in table 11.
Specimens
The specimen configurations a r e shown in figure 1. The tensile and notched specimens were machined from both the longitudinal and transverse rolling directions of the sheets, but the creep specimens were machined from only the longitudinal direction. All specimens from each alloy were made from the same heat but not necessarily the same sheet. The tensile specimen conforms to the specifications prescribed in reference 4. The notched specimen is 1 inch (2.54 cm) wide as recommended in reference 5. The
2

radius at the base of the notch varied from about 500 to 700 microinches (approximately 13 to 18 pm), which corresponds to an elastic stress concentration factor of approximately 20. The last step in finishing the radius was performed by hand drawing a shaping tool through the notch. This operation w a s done repeatedly until the desired radius was obtained. The creep specimen is a modification of the tensile specimen. The increased shoulder length permitted the specimen to be gripped outside the furnace during exposure to elevated temperature.
PROCEDURES
The specimens were thoroughly cleaned before exposure. The cleaning procedure consisted of removing markings, such as crayon or manufacturer's stamp, with acetone and a cloth. The specimens were then vapor degreased with trichlorethylene, after which they were rinsed in water at 125O F (320O K). A room-temperature water rinse followed. The specimens were then dried with absorbent paper towels and packaged in clean containers.
Tensile Tests
Room temperature and - l l O o F (190° K).- After being cleaned, tensile and notched specimens were tested at room temperature and at - l l O o F (190° K). Tensile and notched specimens for elevated-temperature exposure were placed in air-circulating elect r ic ovens operating at 250° and 300° F (390° and 420° K). None of the specimens were stressed during exposure. In order to study the stability of the alloys, specimens were removed at predetermined times for testing at room temperature. The nominal exposure schedule w a s 500, 1000, 2000, 4000, 7000, 10000, 14000, 18000, and 22000 hours; however, there were variations in the schedule due to furnace malfunctions. The tensile specimens were tested in a hydraulic testing machine at a strain rate of 0.005 per minute through the 0.2-percent offset strain, and the rate was then increased to 0.05 per minute until fracture occurred. The notched specimens were tested a t a constant net-section s t r e s s rate corresponding to a strain rate of about 0.00125 per minute in the same hydraulic testing machine as w a s used in the tensile tests. Additional details of test apparatus and procedures a re described in reference 6.
Elevated temperature.- The elevated-temperature tensile stress-strain tests were made at 2000, 2500, 3000, 3500, and 400° F (3700, 3900, 4200, 4500, and 480° K). The specimens were exposed to the test temperature for 1/2 hour and then loaded to failure. The tests were run at a strain rate of 0.005 per minute through the 0.2-percent offset strain, and this rate was then increased to 0.05 per minute until fracture occurred. Specimen temperatures during the test were constant within 3O F (2O K) of the test
3
temperature, and the variation in temperature over the gage length of the specimen did not exceed 3O F (20 K). Additional details of test apparatus and procedures a r e described in reference 7.
Tensile Creep Tests
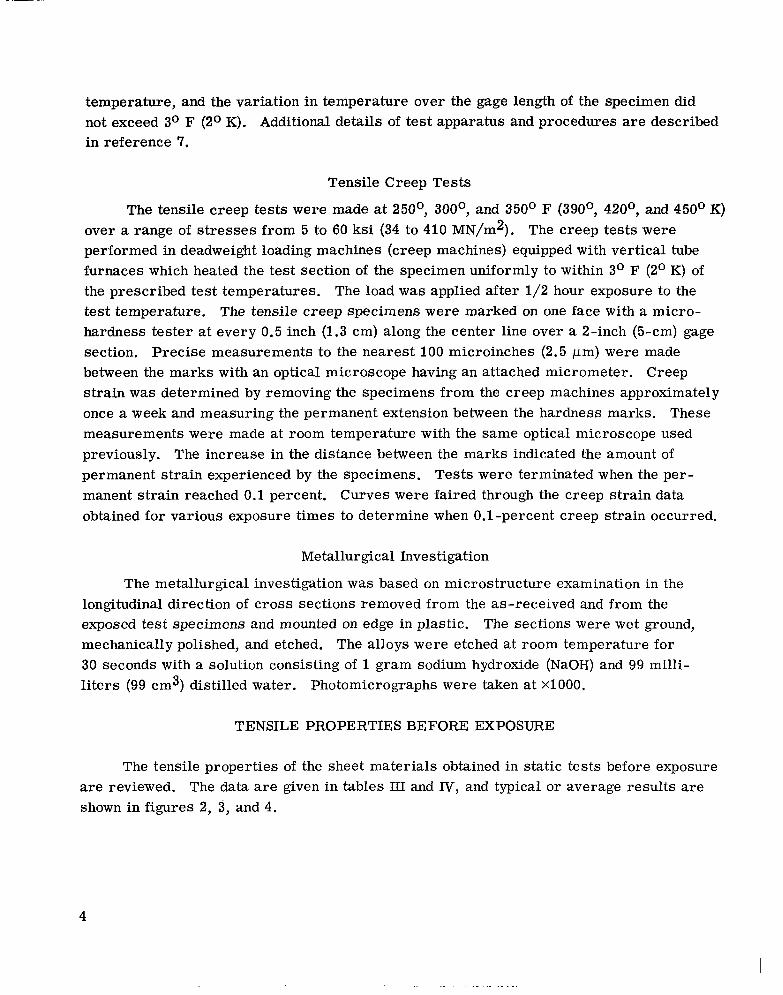
The tensile creep tests were made at 250°, 300°, and 350° F (390°, 420°, and 450° K) over a range of stresses from 5 to 60 ksi (34 to 410 MN/m2). The creep tests were performed in deadweight loading machines (creep machines) equipped with vertical tube furnaces which heated the test section of the specimen uniformly to within 3O F (2O K)of the prescribed test temperatures. The load was applied after 1/2 hour exposure to the test temperature. The tensile creep specimens were marked' on one face with a micro-hardness tester at every 0.5 inch (1.3 cm) along the center line over a 2-inch (5-cm) gage section. Precise measurements to the nearest 100 microinches (2.5 pm) were made between the marks with an optical microscope having an attached micrometer. Creep strain was determined by removing the specimens from the creep machines approximately once a week and measuring the permanent extension between the hardness marks. These measurements were made at room temperature with the same optical microscope used previously. The increase in the distance between the marks indicated the amount of permanent strain experienced by the specimens. Tests were terminated when the permanent strain reached 0.1 percent. Curves were faired through the creep strain data obtained for various exposure times to determine when 0.1 -percent creep strain occurred.
Metallurgical Investigation
The metallurgical investigation w a s based on microstructure examination in the longitudinal direction of cross sections removed from the as-received and from the exposed test specimens and mounted on edge in plastic. The sections were wet ground, mechanically polished, and etched. The alloys were etched at room temperature for 30 seconds with a solution consisting of 1 gram sodium hydroxide (NaOH) and 99 millil i ters (99 cm3) distilled water. Photomicrographs were taken at X1000.
TENSILE PROPERTIES BEFORE EXPOSURE
The tensile properties of the sheet materials obtained in static tests before exposure are reviewed. The data a r e given in tables III and W , and typical or average results a r e shown in figures 2, 3, and 4.
4

Yield Strength Stress-Strain Characteristics
Typical tensile stress-strain curves for the aluminum-alloy sheet materials at room temperature (80° F (300° K)) and at - l l O o F (190° K) are shown in figure 2 for both the longitudinal and transverse directions. The stress-strain characteristics a r e approximately the same in both the longitudinal and transverse directions for each alloy at each temperature. The X2020-T6 alloy has a 0.2-percent yield strength that is 31 percent higher than that of the clad 2024-T81 alloy. The clad RR-58 alloy has a slightly lower yield strength than the clad 2024-T81 alloy.
Ultimate Strength and Elongation
The average ultimate tensile strength and the elongation in 2 inches (5 cm) at room temperature and at - l l O o F (190° K) are summarized in figure 3. The tensile strengths at room temperature varied from about 59 to 84 ksi (410 to 580 MN/m2), and the strengths were about 8 percent higher at - l l O o F (19O0K) for the three alloys. In general, the tensile strength was approximately the same in both directions for each alloy.
At - l l O o F (190° K), the elongation decreased slightly for the clad 2024-T81 and X2020-T6 alloys but increased slightly for the clad RR-58 alloy.
Notch Strength
The average notch strength and notch strength ratios, an indication of notch sensitivity, were obtained at room temperature and at -110' F (190' K) and a re summarized in figure 4. The ratio of the notch strength to the tensile strength (i.e., notch strength ratio) w a s lower at - l l O o F (190° K) than at room temperature for the clad 2024-T81 and X2020-T6 alloys, mainly because of the increase in tensile strength at the low temperature. The notch strength is based upon the average net-section s t ress . The notch strength ratio for the clad RR-58 alloy is above 0.9 at room temperature and at - l l O o F (1900 K). For clad 2024-T81, the notch strength ratio is about 0.9 at room temperature and is slightly less at - 1 1 0 O F (190° K). The notch strength ratio for X2020-T6 is about 0.6 a t room temperature and at - l l O o F (190° K).
Another indication of the notch sensitivity of the material is given by the amount of shear lip occurring at fracture. (See table III.) Shear lip is defined as the percentage of the fracture that failed in shear. Ductile, shear type of fractures with shear-lip values of 100 percent were characteristic of clad 2024-T81 and clad RR-58 at both room and low temperatures. However, the X2020-T6 alloy exhibited brittle and irregular fracture characteristics at low temperatures with the shear-lip value ranging from 0 to 85 percent.
5

Young's Modulus
Values of Young's modulus in tension at room temperature, obtained from Tuckerman optical strain-gage measurements, are listed in table lV. The values presented are the average of two specimens for each alloy.
EFFECT OF PROLONGED EXPOSURE AT 250° AND 300° F
(390° AND 420° K)ON TENSILE PROPERTIES
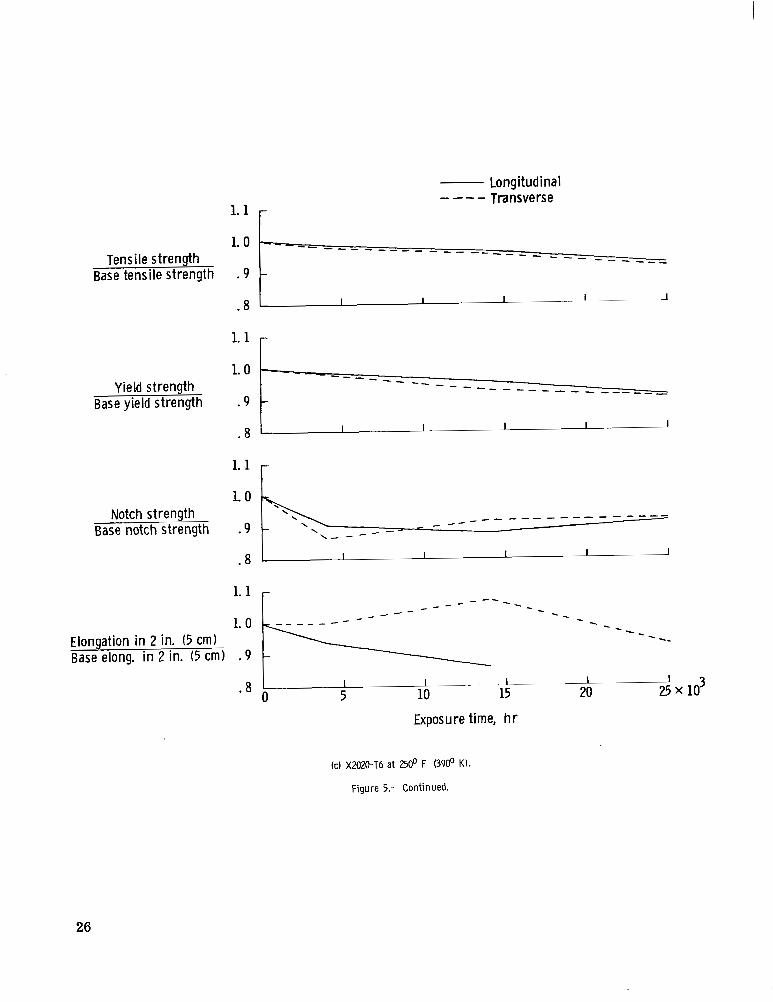
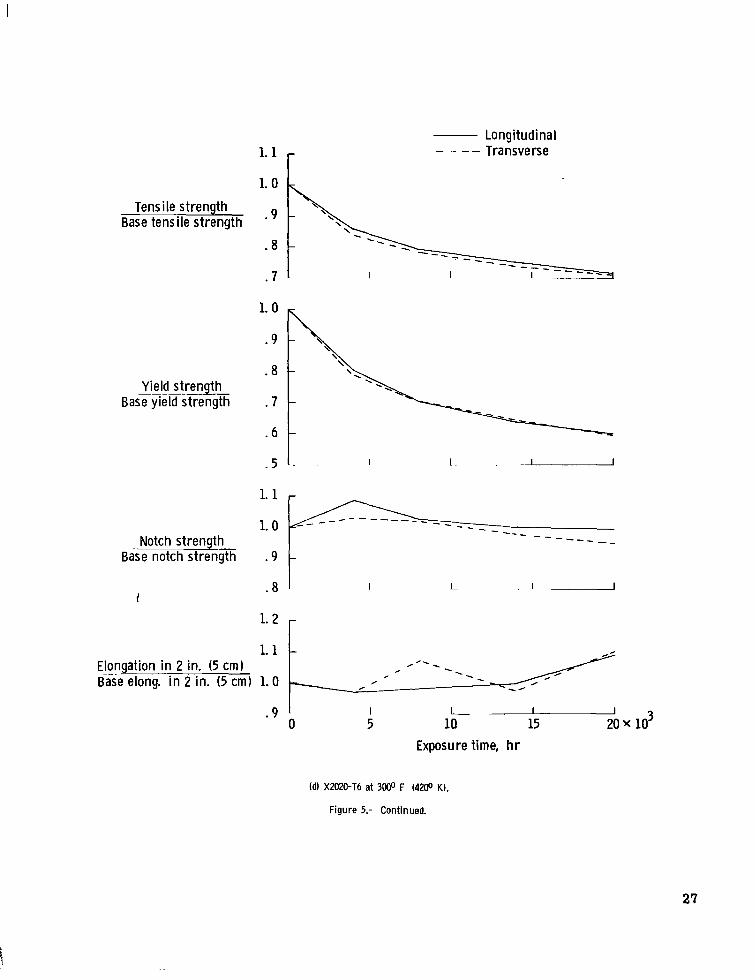
The effects of longtime exposure at 250° and 300° F (390° and 420° K) on the tensile properties a t room temperature a re illustrated in figure 5 for the three alloys. These effects are depicted by changes in the ratio of the property after exposure to the corresponding property before exposure (Le., base property). The ratios a r e based upon averages of the results at each exposure for both the longitudinal and transverse directions. The test data are given in table III.
Clad 2024-T81
The ratios for the tensile, yield, and notch strengths and for elongation in 2 inches (5 cm) remain above 0.9 in the room-temperature tests of clad 2024-T81 for exposures at 2500 F (3900 K) and for times up to 22 000 hours (18 000 hours for the notch strength). (See fig. 5(a).) It should be noted that there is little difference between the data for the longitudinal and transverse directions. At 300° F (420O K)for exposures up to 22 000 hours, the ratios remain above 0.8 with a reduction of 17 percent occurring in the yield strength. (See fig. 5(b).)
X2020-T6
The tensile and yield strength ratios for the X2020-T6 alloy at 250° F (390O K) decrease slightly for exposures up to 25 000 hours (fig. 5(c)). The notch strength decreases up to 4000 hours and then increases slightly for longer exposures. At 3000 F (420° K) (fig. 5(d)), a substantial decrease occurs in tensile and yield strengths for exposures up to 20000 hours. This decrease is indicative of overaging (ref. 8). The increase in elongation is also indicative of overaging. There is little change in the ratio for the notch strength.
Clad RR-58
The strength and elongation ratios of the clad RR-58 alloy a t 250° F (3900 K) for exposures up to 22 000 hours remain relatively unchanged. (See fig. 5(e).) However, at 3000 F (4200 K) (fig. 5(f)) because of overaging, the tensile and yield strengths a r e
6

reduced and elongation is increased after exposures for 10 000 hours. Furnace malfunction forced the termination of the exposure beyond 10 000 hours. The notch strength also shows a slight reduction at 300° F (420O K).
!I Alloy Comparison
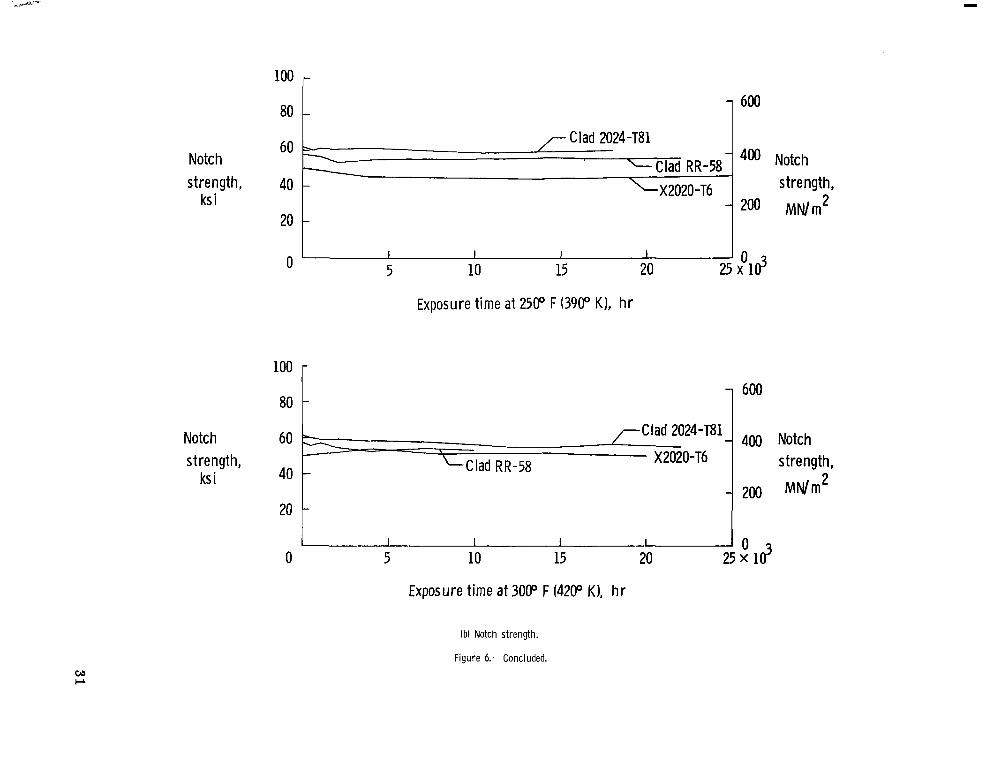
A comparison of the residual tensile and notch strengths of the three alloys at 2500 and 300° F (390° and 420° K) for exposures up to 25000 hours is shown in figure 6. At 250° F (390° K) the tensile strength of the X2020-T6 alloy (fig. 6(a)) is higher than that of the other two alloys. The clad 2024-T81 alloy has slightly higher tensile strength than the clad RR-58 alloy. At 300° F (420° K) the tensile strength of X2020-T6 is higher than that of clad 2024-T81 for exposures up to approximately 10 000 hours, after which the two alloys have nearly the same strength. Clad RR-58 has the lowest tensile strength.
The symbols in figure 6(a) represent data taken from reference 3 for the 2024-T81 and CM.OO1 alloys and show the ultimate tensile strength at room temperature after 20000 hours exposure at 250° and 300° F (390' and 420' K). At 250' F (390' K) the clad 2024-T81 and clad RR-58 data agree very well with the data from reference 3. At 300° F (420O K) the clad 2024-T81 alloy of this investigation had slightly higher strength than that reported in reference 3. The CM.OO1 alloy after 20000 hours exposure had higher strength than the clad RR-58 alloy after 10 000 hours exposure.
A comparison of the notch strength (fig. 6(b)) shows that at both 2500 and 3000 F (3900 and 4200 K) all three alloys appear stable, with clad 2024-T81 having the highest strength. The X2020-T6 alloy exhibits the lowest notch strength of the three alloys at the temperatures tested for exposures beyond 5000 hours.
SHORT-TIME, ELEVATED-TEMPERATURE TENSILE PROPERTIES
The short-time, elevated-temperature tensile properties at 200°, 2500, 300°, 3500, and 4000 F (3700, 3900, 4200, 4500, and 4800 K) of the three alloys a r e tabulated in table V, and the tensile and yield strengths a r e summarized in figure 7. The tensile and yield strengths of the X2020-T6 alloy a r e higher than those of the other alloys at any given test temperature. Up to 4000 F (4800 K), the clad RR-58 alloy exhibits lower strength than the other two alloys.
EFFECT OF STRESS AND TEMPERATURE ON CREEP RESISTANCE
Stress Required to Produce 0.1-Percent Creep Strain
The s t resses to produce creep s t ra in of 0.1 percent for the three alloys at 2500, 3000, and 3500 F (3900, 4200, and 4500 K) a r e presented in figure 8 for times up to
7
.&

18000 hours. The curves of figure 8 are faired through the open-symbol data points. In order to determine differences between intermittent exposure and continuous exposure, one specimen of each alloy was tested at 350° F (450° K) for 2000 hours at a s t r e s s which was estimated to produce 0.1-percent strain. Clad RR-58 required an additional 1000 hours to produce 0.1-percent strain. The results for continuous and intermittent exposure were in good agreement as shown by the solid symbols in figure 8. Therefore, removal of the specimens from the furnaces to determine creep s t ra ins did not appear to influence the magnitude of the creep strain reported in this investigation.
The triangular symbol in figures 8(a) and (c) is obtained from data in reference 3 for 2024-T81 and CM.OO1. The 2024-T81 alloy from the reference has less creep strength than the clad 2024-T81 alloy of this investigation, whereas the CM.OO1 alloy from the reference has improved creep resistance over the clad RR-58 alloy. It was for improved creep resistance that the RR-58 material was modified in i ts manufacturing processes.
Alloy Comparison
The creep strength at a 0.1-percent creep s t ra in for a 10000-hour exposure is shown in figure 9 for the three alloys. The creep curves of figure 8 were extrapolated to 10000 hours to provide the information necessary to produce figure 9. The alloy X2020-T6 has the highest creep strength at 2500 F (3900 K), but i ts strength is reduced rapidly at the higher temperatures, and at 350° F (450O K) it has a creep strength of approximately 4 ks i (28 MN/m2). Clad 2024-T81 has the highest creep strength a t and above 3000 F (4200 K), and at 3500 F (4500 K) i ts strength is about 10 ks i (69 MN/m2). Clad RR-58 exhibits poor creep strength at the lower temperatures, and a t 350° F (450° K) i ts strength is 6 ksi (41 MN/m2). These low values of creep strength for all three alloys might limit their use for longtime exposures a t temperatures above 3000 F (4200 K).
Correlation of Creep Results
A number of time-temperature parameters have been developed to correlate creep data. An analysis of the creep data, by means of the procedures presented in reference 9, showed that the Dorn time-temperature parameter provided a convenient method to correlate the 0.1-percent creep strain for the three alloys. In the Dorn parameter,
-AH8 = F(o) = t exp -RTK
or as used herein in the common logarithmic form
8

I where CJ is stress, t is time in hours, AH is the activation energy, R is the gas constant (2.0 cal/mole-OK or 8.4 J/mole-OK), 2.3 is logarithmic conversion from natural to common, and TK is temperature in degrees Kelvin.
The correlation of the test results with the master stress-time-temperature curve ,-
for each material is shown in figure 10. The close grouping of the data points with the master curve indicates good agreement for all three alloys over the temperatures and stresses investigated. Thus the Dorn time-temperature parameter appears to be appropriate for predicting 0.1-percent creep strain for these alloys at 250° to 350° F (390° to 450' K).
METALLURGICAL INVESTIGATION
The metallurgical investigation consisted of microstructural examination of sections taken from the as-received and exposed test specimens. Representative photomicrographs taken of these sections are shown in figure 11. The changes observed in the microstructure of exposed specimens were consistent with the trends found in the mechanical properties.
After 22000 hours at 300° F (420° K) (fig. ll(a))there is little change in the microstructure of the clad 2024-T81 alloy when compared with the as-received condition. This observation is consistent with the stability of the alloy as shown in figure 5(b). At 350° F (450O K) after 14 521 hours there appears to be a slight increase in visible precipitates.
The microstructure of the X2020-T6 alloy (fig. ll(b)) after 22000 hours a t 300° F (4200 K) when compared with the as-received shows a slight increase in grain size and a more complete precipitation, which is indicative of overaging (ref. 8). The general result of overaging is a decrease in strength and an increase in elongation due to softening which is evidenced in figure 5(d). This trend of overaging is also apparent at 350° F (4500 K) after 12 751 hours as evidenced by the poor creep strength of the X2020-T6 alloy.
The microstructures of the clad RR-58 alloy (fig. 11(c))after exposures of 300° and 3500 F (4200 and 4500 K) for 10000 and 4484 hours, respectively, appear to differ very little from the as-received material except for a possible increase in the number of visible precipitates with increased exposure. The decrease in strength and increase in elongation of the clad RR-58 alloy at 300° F (420O K) (fig. 5(f)) may again be indicative of overaging.
9

CONCLUSIONS
The tensile properties and creep strength of three aluminum alloys exposed up to 25 000 hours at 2000 to 4000 F (3'700 to 480° K) have been investigated. The alloys include clad 2024-T81, X2020-T6, and clad RR-58. The following conclusions a r e based upon the results of this investigation :
1. The X2020-T6 alloy has the highest tensile and yield strengths at room temperature and -1100 F (1900 K). The tensile properties for each alloy in the longitudinal and transverse directions a r e approximately the same. At room temperature, the notch strength ratio is about 0.9 for the clad 2024-T81 and clad RR-58 alloys and is about 0.6 for the X2020-T6 alloy.
2. At 250° F (390° K) all three alloys were stable, with the X2020-T6 alloy having the highest tensile strength. At 300° F (420O K) the tensile strength of X2020-T6 is higher than that of clad 2024-T81 for exposures up to approximately 10000 hours, after which the two alloys have nearly the same strength. The notch strengths of the three alloys appeared stable for exposures at 2500 and 3000 F (3900 and 4200 K) with clad 2024-T81 having the highest strength. The X2020-T6 alloy exhibited the highest strength for short-time exposures up to 400° F (480O K).
3. Low creep strength in all three alloys might limit their use for longtime exposures at temperatures above 3000 F (4200 K). The X2020-T6 alloy showed the highest creep strength at 2500 F (3900 K). Above 3000 F (420O K), the clad 2024-T81 alloy showed the highest creep strength. The Dorn stress-rupture parameter can be used for predicting 0.1-percent creep s t ra in for these alloys a t 250° to 350° F (390O to 450° K). The changes observed in the microstructure of exposed specimens were consistent with the trends found in the mechanical properties.
Langley Research Center, National Aeronautics and Space Administration,
Langley Station, Hampton, Va., October 10, 1968, 720-02-00-06-23.
10

APPENDIX
CONVERSION OF U.S. CUSTOMARY UNITS TO SI UNITS
The International System of Units (SI) was adopted by the Eleventh General Conference on Weights and Measures in 1960. (See ref. 2.) Factors required for converting the U.S. Customary Uni t s used herein to the International System of Units (SI) are given in the following table:
Physical quantity
Force Length Stress Temperature Energy
U.S. CustomaryUnit
lbf
Conversion factor
(*) 4.44822
SI unit (**I
newtons (N) in. 0.0254 meters (m) ksi O F
6.895 X l o6 g(F5 + 459.67)
newtons/meter2 (N/m2) degrees Kelvin (OK)
C a l 4.184 joules (J) ~~
*Multiply value given in U.S. Customary Unit by conversion factor to obtain equivalent value in SI unit.
**Prefixes to indicate multiples of units a r e as follows:
I Prefix 1 Multiple I gigs (G) 109 mega (M) 106 kilo (k) 103 centi (c) 10-2 milli (m) 10-3 micro ( p ) 10-6
11

REFERENCES
1. Pride, Richard A.; Royster, Dick M; Stein, Bland A.; and Gardner, J ames E.: Effects of Longtime Environmental Exposure on Mechanical Properties of Sheet Materials for a Supersonic Transport. NASA TN D-4318, 1968.
2. Comm. on Metric Pract.: ASTM Metric Practice Guide. NBS Handbook 102, U.S. Dep. Com., Mar. 10, 1967.
3. Harpur, N. F.: Concorde Structural Development. AIAA Paper No. 67-402, June 1967.
4. Anon.: Standard Methods of Tension Testing of Metallic Materials. ASTM Designation: E 8-66. Pt. 31 of 1968 Book of ASTM Standards With Related Material. Amer. SOC.Testing Mater., 1968, pp. 202-221.
5. Anon.: Fracture Testing of High-Strength Sheet Materials: A Report of a Special ASTM Committee. ASTM Bull. Ch. 1, no. 243, Jan. 1960, pp. 29-40. Chs. 2 and 3, no. 244, Feb. 1960, pp. 18-28.
6. Heimerl, George J.; Baucom, Robert M.; Manning, Charles R., Jr.; and Braski, David N. : Stability of Four Titanium-Alloy and Four Stainless-Steel Sheet Materials After Exposures up to 22000 Hours at 550° F (561' K). NASA TN D-2607, 1965.
7. Hughes, Philip J.; Inge, John E.; and Prosser, Stanley B.: Tensile and Compressive Stress-Strain Properties of Some High-Strength Sheet Alloys a t Elevated Temperatures. NACA TN 3315, 1954.
8. Van Horn, Kent R., ed.: Aluminum - Vol. I. Properties, Physical Metallurgy and Phase Diagrams. Amer. SOC.Metals, c.1967, p. 116.
9. Goldhoff, R. M.: Comparison of Parameter Methods for Extrapolating High-Temperature Data. Paper no. 58-A-121, Amer. SOC.Mech. Eng., Nov. 30-Dec. 5, 1958.
12

TABLE I.- DESCRIPTION OF ALUMINUM-ALLOY SHEET
MATERIALS AND HEAT TREATMENTS
Thickness Material"
in. mm -. .
Clad 2024-T81 0.064 1.6
X2020 -T6 .048 1.2
Clad RR-58b .064 1.6
Heat treatment
(a)
Solution treatment: 910' to 930' F (760O to 7700 K) water quenched, cold worked, and precipitation heat treated at 375O F (460° K) between 11 and 13 hours
Solution treatment: 950° to 970° F (7800 to 7900 K) water quenched, aged 16 to 20 hours at 3150 to 325' F (430' to 440' K)
Solution treatment: 977O to 995O F (8000 to 8100 K) water quenched, aged 20 hours a t 392O F (470° K)
Cladding thickness
in. mm
0.0022 0.056
-0030 .076
aVendor supplied information. bClad RR-58 was purchased in the United Kingdom and is designated as AU2GN
in France and as 2618 in the United States.
13
I

--------
--- --- --
TABLE II.-NOMINAL CHEMICAL COMPOSITION OF ALUMINUM-ALLOY SHEET MATERIALS~
k e r c e n t given on we igh t basis)
M a t e r i a l L i th ium C o p p e r M a n g a n e s e C a d m i u m M a g n e s i u m Iron Si l icon Zinc T i t a n i u m L e a d T in C h r o m i u n Nickel A luminum
Clad 2024-T81 3.8 t o 4.9 0.30 to 0.90 ----------- 1.2 to 1.8 0.050 0.050 0.25 -__ _ _ _ _ _ _ 0.10 -------_ Balance
C ladd ing -- -- -- -- . lo .05 __--------__------- 6 7 . 7 P ) _ _ _ .IO ------_- B a l a n c e
a V e n d o r supp l i ed i n f o r m a t i o n .
k

Test Tensile strength Yield strength Elongation, percent Notch strength Shear lip, percent
Exposure, temperake Longitudinal Transverse Longitudinal Transverse Longitudinal Transverse Longitudinal Transverse hr
(5 cm)
As received
0 80 300 66.4 460 I 65.4 450 58.8 390 59.5 410 7 7.5 5 7 61.8 430 59.7 410 100 100 I
0 80 300 65.7 450 64.8 450 61.61 420 59.0 410 5 6 4 6.5 61.1 420 58.4 400 100 100 0 -110 190 70.5 490 69.0 480 64.5 450 62.5 430 3 3.5 3 3.5 64.0 440 56.3 390 100 100 0 -110 190 70.8 490 69.5 490 64.0 440 62.8 430 5 7 3.5 4 60.0 410 59.3 410 100 100
OF OK ks i MN/m2 ksi MN/m2 ksi MN/m2 ksi MN/m2 Uniform $:,!$ Uniform In' in' ksi MN/m2 ksi MN/m2 Longitudinal Transverse
II
600 80 300 66.4 460 65.3 450 61.6 5 I 62.0 430 55.0 380 600 66.3 460 65.8 450 62.1 5 1.5 58.4 400 60.0 410
1 000 65.2 450 65.0 450 59.8 5 I 60.9 420 59.0 410 1 0 0 0 66.0 460 65.5 450 60.1 5 6.5 61.3 420 55.5 380
2 000 64.3 440 65.2 450 58.0 4 5.5 60.1 410 53.6 370 2 000 65.8 450 64.8 450 60.5 4 6.5 61.3 420 57.8 400
4 000 62.8 430 64.5 4 50 55.8 5 I 60.3 420 58.7 410 4 000 64.7 450 64.7 450 59.1 410 59.5 410 5 6.5 5 7 62.3 430 56.6 390
10 717 65.0 450 63.8 440 59.8 410 58.7 410 6 7.5 4 7 55.8 390 55.7 380 100 100 10 777 64.5 450 65.0 450 59.2 410 59.7 410 5 6.5 59.5 410 57.4 400 100 100
18 000 64.3 440 57.6 400 5 7 56.4 390 75 75 18 000 64.4 440 58.2 400 5 7 56.9 390 100 100
22 000 64.7 63.9 440 58.3 400 51.1 5 I 100 22 000 65.1 65.5 450 59.2 410 I.5 5 I - ~ - --
Exposure a t 300° 420° K ~ --~--- - ~
1 0 3 0 80 2 62.0 430 63.8 440 54.2 370 57.5 400 4 7.5 3 6 60.6 420 58.8 410 100 100 1 0 3 0 63.4 440 63.8 440 56.3 390 57.6 400 3 6.5 2 5 57.3 400 55.5 380 80 100
2 000 61.6 430 64.2 440 53.7 370 51.5 400 7 8 4 I 59.5 410 57.6 400 100 100 2 000 62.7 430 64.5 440 55.4 380 58.4 400 6.5 8 5 7 60.1 410 57.9 400 100 100
4 000 61.1 420 62.3 430 53.4 370 55.0 380 6 1.5 6 I.5 51.5 400 56.0 390 100 100 4 000 61.0 420 62.9 430 53.9 310 55.9 390 6.5 8 6 8 58.4 400 56.4 390 80 100
7 000 61.3 420 62.4 430 53.1 370 54.8 380 5.5 7 5 6.5 57.9 400 55.5 380 100 100 7 000 61.9 430 62.4 430 54.0 370 55.3 380 6 8 4 5.5 57.5 400 57.2 390 100 100
12 243 61.7 430 52.2 360 53.4 310 5 1.5 5 1.5 54.9 380 53.7 370 100 100 12 243 61.7 430 52.4 360 53.2 310 5.5 7.5 6 7 53.7 370 42.5 360 100 100
15 000 60.5 420 49.0 340 51.7 360 7 8.5 5 6.5 54.1 370 53.3 370 100 100 15 000 50.8 350 51.6 360 6 8.5 5 7 55.4 380 51.7 360 100 100
18 000 50.1 350 52.7 360 8 10.0 8 10.0 56.7 390 53.6 310 100 100 18 000 52.1 360 53.2 370 9 9.5 8 10.0 55.9 100
22 000 61.5 51.6 360 52.9 360 8 10.0 1.5 9 54.3 100 61.4 50.7 350 52.2 360 8 9 7.5 9 53.4 370 100 100
--- - -

100
TABLE IU.-TENSILE PROPERTIES FOR ALUMINUM-ALLOY SHEET - Continued
Tes t Tensile strength
Exposure, tempratureLongitudinal Transverse hr
OF % ksi MN/m2 ks i MN/m2
0 80 300 82.3 570 83.0 510 0 60 300 83.5 580 83.6 580 0 -110 190 87.5 600 86.3 600 0 -110 190 69.9 620 89.4 620
490 69.8 480 490 69.6 480
460 64.5 450 460 65.7 450
14 000 430 61.7 430 14 000 430 61.2 , 20 000 20000 v
1
; \1 I 59.4 ~ 59.3
(b) X2020-T6
Yield strength Elongation, percent Notch strengtb Shear lip, percent
Longitudinal Transverse Longitudinal Transverse Longitudinal Transverse Longitudinal Transverse '
ks i MN/m2 ks i MN/m2 Uniform In2". Uniform In'''*(5 cm) (5 cm)
k s i MN/m2 k s i MN/&?
As received
18.2 540 76.0 520 5 9 2.5 6 79.2 550 77.8 540 6 7.5 6.5 7.5 81.0 560 78.5 540 5 I 5 8 84.5 580 63.3 570 5.5 5.5 6 6
75.4
Exposure at 300° F (420° K)-63.6 440 63.0 440
55.6 380 55.0 380
, 50.4 350 8.5 350 7.5
320 8.5 , 5 1 l .5 320 9 5
58.8 410 51.8 360 90 95 49.8 340 52.2 360 95 90 ,
46.9 320 53.8 370 0 0 54.5 360 54.0 370 85 50
95
,
---
40.9 280 49.2 100 100
100 100 100T'54.4 310 53.3 370
53.8 370 53.5 310
52.6 360 53.1 370 50.3 350 53.2 370
53.1 310 51.2 350 49.5 340 50.6 350
49.7 340 50.1 350 49.7 340 48.6 340 -
100 100
100 100
80 80 75 , 80
I
aBroke outside gage area.

,
TABLE m.-TENSILE PROPERTIES FOR ALUMINUM-ALLOY SHEET - Concluded
(c) Clad RR-58
Test Tensile strength Yield strength Elongation, percent Notch strength Shear lip, percent
Exposure, Longitudinal Transverse Longitudinal Transverse Longitudinal Transverse Longitudinal Transverse hr
1 Longitudinal Transverse
OF '% ksi MN/m2 ksi hlN/m2 ksi MN/m2 ksi MN/m2 Uniform In in.(5 cm) Uniform I In in. ksi I MN/m2 ksi I MN/m2(5 cm)
As received -0 80 300 59.4 410 59.5 410 55.0 ' 380 53.8 370 4.5 7 4 7 57.6 400 56.2 390 100 100 0 80 300 59.5 410 59.3 ' 410 55.2 380 53.8 I 370 4 7 5 7 57.9 400 54.5 380 100 100 0 -110 190 63.7 440 63.5 440 59.3 410 59.0 410 6 7.5 6 8.5 60.0 410 59.1 410 100 100 0 -110 190 63.5 440 63.6 440 59.8 410 57.4 400 5 8 5 8 63.2 440 60.2 410 100 100
18 000 55.5 380 54.1 370 6.5 6.5 55.9 390 100 100 18
500 80 300 59.4 410 59.5 410 54.7 380 54.2 370 5 7 4.5 7.5 57.8 400 56.3 390 100 100 500 59.6 410 59.4 410 55.2 380 54.8 380 5 7 4.0 7 56.6 390 55.1 380 100 100
1 000 60.2 410 59.7 410 55.6 380 54.4 380 5 7 5 7.5 57.2 390 55.3 380 100 100 1000 60.5 420 59.3 410 56.2 390 53.7 370 5 7 5 7 55.9 390 55.5 380 100 100
2 000 59.6 410 59.2 410 54.7 380 53.5 370 6 7.5 4.5 7 52.1 360 55.6 380 100 100 2 000 59.8 410 59.5 410 55.2 380 53.8 370 5 7.5 6 7.5 54.5 380 5 4 2 370 100 100
4 000 59.6 410 58.9 410 55.6 380 54.0 370 5 7 5 7 56.3 390 52.5 360 100 100 4 000 59.7 410 59.0 410 55.9 390 54.0 370 5 7 4 6.5 53.3 370 56.7 390 100 100
7 000 60.9 420 60.2 410 56.2 390 53.6 370 4 7 6 7 54.5 380 55.4 380 100 100 7 000 61.3 420 60.0 410 55.5 380 53.8 370 5 8 4 7 56.8 390 53.5 370 100 100
10 000 60.1 410 59.3 410 55.8 390 53.9 370 7 9 7 10 57.8 400 56.6 390 100 100 10 000 60.1 410 59.6 410 55.8 390 54.5 380 7 10 7 9 56.6 390 55.8 390 100 100
14 000 58.8 410 53.4 370 52.2 360 6 7 6 7.5 58.0 400 55.6 380 100 100 14 000 58.6 400 54.4 380 52.3 360 6 7.5 5 7 54.3 370 56.6 390 100 100
000 59.6 54.9 380 54.1 370 I 4 5 7.5
4 5 I 54.9 380 100 100
22 000 58.4 400 53.5 370 51.8 360 5 1 7 5 6.5 55.3 380 100 100 58.2 400 57.8 53.5 370 51.9 360 5 7 4 7 56.6 390 55.1 100 100- ---
1 1
-1 500 1 80 300 59.3 410 59.3 410 54.5 380 53.8 370 5 7.5 5 7.5 56.2 390 55.8 380 100 100
500 59.3 410 59.4 410 54.7 380 53.8 370 5 1.5 4 7 56.4 390 56.8 390 100 100
1 000 59.1 410 58.9 410 54.1 370 53.4 370 5 7.5 5 7.5 57.3 390 56.6 390 80 85 1000 59.1 410 58.4 400 54.3 370 52.6 360 6 7 4.5 I 56.6 390 55.4 380 80 100
2 000 58.3 400 58.3 400 53.0 370 52.2 360 4 7 4.5 1.5 55.0 380 55.0 380 100 100 2 000 58.4 400 58.3 400 53.4 370 360 5 7.5 5 7 54.3 370 54.2 370 100 100
4 000 57.4 400 57.5 400 350 51.8 360 100 4 000 57.8 400 57.7 , 400 350 53.3 370 100
7 000 57.6 400 350 53.8 370 54.1 100 7 000 57.7 400 50.6 350 55.0 380 100 100
10 000 10000 I 50.7 350
52.0 360 51.4--44.5 46.5
44:6 310 310
52.3 54.3
360 370
100 100
100 100
--

TABLE N.- YOUNG'S MODULUS IN TENSION AT 80° F (300° K)
FOR THE ALUMINUM-ALLOY SHEET MATERIALS
___
Clad 2024-T81 . . . . . . . . . . 10300 71.0
X2020-T6 . . . . . . . . . . . . . 11 000 76.0
Clad RR-58.. . . . . . . . . . . 10500 72.0
18

TABLE V. - SHORT-TIME, ELEVATED-TEMPERATURE TENSILE
PROPERTIES OF ALUMINUM-ALLOY SHEET ~~~
Temperature Tensile strength I Yield strength Elongation, percent
OF OK ksi 1 MN/m2 I ksi I m / m 2 Uniform In 2 in. ~
Clad 2024-T81
200 370 60.7 420 57.4 400 4.5 200 370 60.8 420 57.4 400 4
2 50 390 58.2 400 55.2 380 4 250 390 57.9 400 55.8 390 4.5
300 420 54.5 380 51.6 360 7 300 420 53.5 380 52.3 360 9
350 4 50 49.6 390 47.1 330 7 10.5 350 450 48.5 390 46.4 320 8
400 480 43.2 300 40.9 280 5 10 400 480 43.4 300 41.5 290 5 10
~~
X2020- T6 . .
200 370 73.1 500 72.9 500 8 8 200 370 73.4 510 73.2 510 7 8.5
250 390 69.9 480 69.7 4 80 6 9.5 250 390 70.0 4 80 70.0 480 6 8.5
300 420 64.9 4 50 64.6 4 50 8 10 300 420 65.1 4 50 65.0 4 50 5 8
350 4 50 59.1 410 58.6 400 5 7.5 350 4 50 59.2 410 58.9 410 5 6
400 480 50.3 3 50 49.5 340 2 4 400 480 50.3 350 49.9 340 2 4
~
Clad RR-58 ~
200 370 56.4 390 53.3 370 6 8.5 200 370 56.2 390 53.6 370 5 7.5
2 50 390 53.6 370 50.8 350 6 9 250 390 53.2 370 50.4 350 6 9
300 420 49.5 340 48.3 330 5 11.5 300 420 48.7 340 48.4 330 6 12
350 4 50 44.5 310 43.9 300 6 12 350 4 50 44;8 310 43.8 300 7 14
400 480 38.9 270 36.7 2 50 5 12 400 480 39.1 270 37.8 260 7 12.5
~~~
19

hl 0
(2.54) (2.54)
Rad ius=7~10-~- q\r: 2.00
(5.08)t I\ 8.0
(20.3)
(3.51) t
T e n s i l e N o t c h
Figure 1.- Specimens used in tensile and creep tests. Dimensions in inches (centimeters).

1 Clad 2024-T81 2 X2020-T6 3 Clad RR-58
100
80
60
Stress, ks i
40
20
0
800 F (3000 K)
LongitudinaI Transverse
-1100 F (1900K)
Longitud inaI Transverse
400 Stress,
MMm2
200
0 1.0021
Strain
Figure 2.- Typical tensile stress-strain curves for as-received aluminum-alloy sheet at 80° and -llOo F (3Oo0and 1900 K). Ticks indicate yield stress.

Long. Trans. n w 800 F -1100 F
800 F -1100 F (3000K) 1 )00 K)
800 F -1100 F
0Clad 2024-T81 X2020-T6 Clad RR-58
(a) Ultimate tensile strength.
100
80
60 Tensile strength,
ks i 40
20
0
1 6oo
- 400 Tensile strength,
MN/m2
- 200
0
800 F -1100 F 800 F -1100 F
lo i800 F -1100 F 1
1-1Elongation in 2 in. (5 cm),
percent
0 Clad RR-58 Clad 2024-T81 X2020-T6
(b) Elongation.
Figure 3.- Average tensile properties of as-received aluminum-alloy sheet at 80° and - l l O o F (30O0and 190° K).
22

Long. Trans. 600
80
800 F -1100 F n w(3000K) (1900 K)
8 0 0 F . 60
800 F -1100 F 400
Notch Notch s t rength, 40 s t rength,
ks i M N / ~ ~200
20
Clad 2024-T81 X2020-T6 i
Clad RR-58 00 9
A Notch strength.
1. 0 800 F -1100 F 800 F -1100 F
. 9
Notch . 8 s t r e n g t h .7 800 F -1100 Fra t io
. 6
.5
0 r iX2020-T6 Clad 2024-T81
m m Clad RR-58 i
(b)Notch strength ratio.
Figure 4.- Average notch strengths and notch strength ratios of as-received aluminum-al loy sheet at 80° and - l l O o F (300°and 190° K).
23

---
----- - - - - - - ---
- - - ------
Longitudinal - Transverse
1.0 - - - - - - - _- - - - *_ Tensile strength Base tensile strength .9
.8r r I
Yield strength Base yield strength *9t
I
1.0 -Notch strength
Base notch strength .9t
1. 2r
Elongation in 2 in. (5cm) Base elong. in 2 in. (5 c m ) 1.0 _ _ _ _ _ _ _ _
. . 1 I
0 5 10 15 20 25X Id Exposure time, hr
(a) Clad 2024-T81 at 250' F (390' K).
Figure 5.- Effect of exposure at 250° and 300° F (390°and 4200 K) on ratios of tensile strength, yield strength, notch strength, and elongation in 2 inches (5 cm) for aluminum-al loy sheet materials at room temperature.
24

- -
Longit udinaI - _ _ _ Transverse
Tensile strength - - - _ _ - __ _ _ _ _ _------- -__
Base tensile s t r e n i . 9
1 I
Notch strength Base notch strength
8 I . .... I 1 .- . 1 I I
7 10
I 1 I
10 15 20 d x ld
Exposure time, hr
(b) Clad 2024-T81 at 30O0 F (4M0 K).
Figure 5.- Continued.
25
---- Longitudinal Transverse
la’ r Tensile strength
Base tensile strength
Notch strenath Base notch strength
Elongation in 2 in. (5 C m ) Base elong. in 2 in. (5 C m )
.8 I I I I I I
. 8
1. 1
1. 0
.9
.8
1. 1
1. 0
.9
.8
I I I I I
0 5 10 15 20 25 x lo3
Exposure time, hr
(c) X2020-T6 at 250° F (390° KI.
Figure 5.- Continued.
I I I I J
26
--
--
Tensile strength Base tensile strength
Yield strength Base yield strength
Notch strength Base notch strength
I
Elongation in 2 in. (5 cm)
1. 1
1.0
. 9
. a
. 7
1.0
.9
. a
. 7
. 6
.5
1.1
1. 0
.9
. a 1.2
1. 1
Base elong. i n 2 in. (5cm) 1.0
.9
LongitudinaI - r Transverse
I . I 1
I
I I I0 5 10 15 2ox Id
Exposure time, h r
(d) X2020-T6 at 3OO0 F (4200 K).
Figure 5.- Continued.
27

--- - - ---
- -
1.0 Tensile s t rength
Base tensile strength .9
. 8
1. 0 I_Yield strength
~~~
Base yield strength .9
. 8
. 8
-.d--------6- _ _ - --- -- -
-
I I ~~~ I 1 I
r_ - - - _
-
I 1 1 1 I
LI .- I 1 . I
l O1. 21 c Elongation in 2 in. (5 cm) 1.
\ - - - ..- -- -Base elong. in 2 i n .75 cm)
* 9 t 1 I. 8 ' I ~. 1 --I
0 5 10 15 20 25 X Id Exposure time, hr
(e) Clad RR-58 at 250' F (390° K).
Figure 5.- Continued.
28

h r
Tensile strength Base tensile strength . 9
1. 1
1.0 Yield strength
Base yield strength . 9
. a
1. 1
1.0 Notch strength
Base notch strength .9
. a
1. 1
1. 0 Elongation in 2 in. (5 cm) Base elong. in 2 in. (5 cm) . 9
. a
LongitudinaI ---- Transverse
I I 1 I I
r
--_- ---.
I 0f- ,10 I5 Exposure time, 15 20 2; x 12
(f) Clad RR-58 at 3000 F (4200 K).
Figure 5.- Concluded.
29

o 2024-T81 (ref. 3) 0 CM. 001 (ref. 3)
r X 2 0 2 0 - T 6 7 600 80 1
,-Clad 2;24-T81 v n60 - u - 400
LClad RR-58 Tensile 40
Tensile
strength, - - strength,
ks i 20 - MN/m2
I I I 1 0 0 ' 5 10 15 20 2; 103
Exposure t ime at 2500 F (3900 K), hr
100 r 80 X2020-T6
Clad 2024 -T81 16oo 60
Clad RR-58 1400 TensileTensile 40 strength,strength, ks i 20 i*0°
MN/m2
I I I 1 I o 0 5 10 15 20 25 x lo3
Exposure t ime at 3000 F (4200 K), hr
(a) Tensile strength.
Figure 6.- Strength comparison of the aluminum-alloy sheet materials after exposure.
80 -
Notch strength, 40 ksi
20 -
I
100 r
80 I Notch -strength,
60 q-/
-1 6oo /-Clad 2024-T81-Clad RR-58 - 400 Notch
\X2020-T6 strength, - 2oo MN/m2
I I 1
Exposure time at 2500 F (390" K), hr
-1 6oo /--Clad 2024-T81 4oo Notch
k l a d RR-58 X2020-T6 strength,-ksi 40 1200 MN/m2 -20
Exposure time at 3000 F (4200 K), hr
(b) Notch strength.
Figure 6.- Concluded.

w h3
Temperature, O K Temperature, O K Temperature, O K
250 350 450 250 350 450 250 350 450 I I I ,
100
o Tensile strength o Yield strength
80 16m--Q\ i I
60 Stress, i400 Stress,
ks i MN/m2
40
20 - c
I r-0 200 400 0 200 400 0 200 400
Temperature, O F Temperature, O F Temperature, O F
(a) Clad 2024-T81 (b) X2020-T6 (c) Clad RR-58
Figure 7.- Average short-time, elevated-temperature tensile and yield strengths of the aluminum-alloy sheet materials in longitudinal grain direction. (Symbols are average of two tests.)

60 o o Intermit tent exposure - 400
Continuous exposure A 2500F (3900K) (ref. 3), 2024-T81 alloy
40 - 2500 F (3900 K) Stress, Stress,
ks i '5 - 200
MN/m2
A \
20 '0.
-O\ -03500 F (4500 K) '0-
0 1 10 100 1000 10 000 100 Ooo
Time, h r
(a) Clad 2024-T81.
Figure 8.- Stress to produce 0.1-percent creep strain in aluminum-alloy sheet materials.
W W

60 o o Intermittent + Continuous
40
Stress, \O \ I Stress,
ksi
0

60 -’ 400
o o o Intermittent exposure+ Continuous exposure* 2500F (3900K) (ref. 31,CM. 001 alloy
40 Stress, Stress,
ksi MWm2 To2500 F (3900 K) - 200
A
‘0
20 l- \
.
3500 F (4500 K) \ I I I I I I I 0
Time, hr
(d Clad RR-58.
Figure 8.- Concluded.
wul

50
40
Creep 30 strength,
ks i 20
10
0
Temperature, O K
400 450 ~~ ~
I I
300
\ 200 Creep strength,
MN/m2
100
X2020-T@
0 250 300 350
Temperature, O F I
Figure 9.- Comparison of creep strength for the aluminum-al loy sheet materials after 10 000 hours.
36

300
40
30 200
Stress, Stress, ksi MN/ m2
20
100
10
AH=38 200 cal/mole (160 kJ/mole)
0 I 1 - . 1 I I 0-19 -18 -17 -16 -15 -14 -13
AHlog t -2. ~ R T K
(a) Clad 2024-T81.
Figure 10.- Application of Dorn parameter for predicting 0.1-percent creep strain in aluminum-alloy sheet materials.
37
4

r 0
\ 0 0
Stress, ksi
20
0 : I I I I I ~ L 0 -21 -20 -19 -18 -17 -16 -15 -14
AHlog t - -2.3 RTK
(b) X2020-T6.
Figure 10.- Continued.
i

0 250°F (390°K) /-Master curve 300"F(420"K)
0 35PF (450°K)
20
Stress, Stress, ksi MNIIn2
10
AH= 38 200 caI/mole (160kJ/ mole)
0 I I I I 1 '0 -19 -18 -17 -16 -15 -14 -13
AHlog t - 2. ~ R T K
(c) Clad RR-58.
w CD
Figure 10.- Concluded.

i I& 0
!
As received 22 000 hours at 3000 F (4200 K), no exposure stress
14 521 hours at 3500 F (4500 K), 10-ksi (69-MNI m2) stress
(a) Clad 2024-T81. L-68- 10,007
Figure 11.- Photomicrographs of aluminum-al loy sheet materials before and after exposure at 300° and 350° F (4200 and 4500 K).

As received 22 000 hours at 3000 F (4200 K), no exposure stress
12 751 hours at2500 F (4500 K), 5-ksi (34-MN/m 1 stress
(b) X2020-T6.
Figure 11.- Continued.
L-68-10,008

c.
2. t;LBF w
As received 10 000 hours at 3000 F I 4200 K), no exposure stress
4484 hours at 3500 F ( 4500 K), 9-ksi (62-MN/m2) stress
(DmW
I (c) Clad RR-58. L-68-10,009
-3 Figure 11.- Concluded.

AERONAUTICSNATIONAL AND SPACE ADMINISTRATION POSTAGE A N D FEES PAID WASHINGTON, D. C. 20546 NATIONAL AERONAUTICS A N D
SPACE ADMINISTRATION OFFICIAL BUSINESS FIRST CLASS MAIL
L i , ' ,
, i rl , \- I ! , , . > If Undeliverable (Section 158 Postal Manual) D o Not Return
' T h e aeronautical and space nctivities of the United States shall be condzicted so as t o contribute . . . to the expansion of human knowledge of pheiaoiiiena in. the atmosphere and space. T h e Administration shdl provide for the widest practicrrble and appropriate dissenzinatiou of i n f o r i ~ i ~ t i o nconcerning its actifGties and the r e s z h thereof."
-NATIONAL A N D S P A C E ACT OF 1958AERONAUTICS
NASA SCIENTIFIC AND TECHNICAL PUBLICATIONS
TECHNICAL REPORTS: Scientific and.. technical information considered important, complete, and a lasting contribution to existing knowledge.
TECHNICAL NOTES: Information less broad in scope but nevertheless of importance as a contribution to existing knowledge.
TECHNICAL MEMORANDUMS: Information receiving limited distribution because of preliminary data, security classification, or other reasons.
CONTRACTOR REPORTS: Scientific and technical information generated under a NASA contract or grant and considered an important contribution to existing knowledge.
TECHNICAL TRANSLATIONS: Information published in a foreign language considered to merit NASA distribution in English.
SPECIAL PUBLICATIONS: Information derived from or of value to NASA activities. Publications include conference proceedings, monographs, data compilations, handbooks, sourcebooks, and special bibliographies.
TECHNOLOGY UTILIZATION PUBLICATIONS: Information on technology used by NASA that may be of particular interest in commercial and other non-aerospace applications. Publications include Tech Briefs, Technology Utilization R~~~~~~and N ~ ~ ~ ~ , and Technology Surveys.
Details on the availability of these publications may be obtained from:
SCIENTIFIC AND TECHNICAL INFORMATION DIVISION
NATIONAL AERONAUTICS AND SPACE ADMINISTRATION .Washington, D.C. PO546
. .,