nasa technical note d-3
TRANSCRIPT

- - NASA TECHNICAL NOTE TN D-31252
e
FRACTURE MECHANICS OF THROUGH-CRACKED CYLINDRICAL PRESSURE VESSELS
N A T I O N A L AERONAUTICS AND SPACE A D M I N I S T R A T I O N WASHINGTON, D. C. FEBRUARY 1 9 6 6 48
https://ntrs.nasa.gov/search.jsp?R=19660007263 2020-03-24T04:11:47+00:00ZCORE Metadata, citation and similar papers at core.ac.uk
Provided by NASA Technical Reports Server

TECH LIBRARY KAFB, NM
FRACTURE MECHANICS OF THROUGH-CRACKED
CYLINDRICAL PRESSURE VESSELS
By Robert B. Anderson and Timothy L. Sullivan
Lewis Research Center Cleveland, Ohio
NATIONAL AERONAUT ICs AND SPACE ADMlNISTRATION
For sale by the Clearinghouse for Federal Scientific and Technical Information Springfield, Virginia 22151 - Price $2.00

FRACTURE MECHANICS OF THROUGH-CRACKED CYLINDRICAL PRESSURE VESSELS
by Robert B. Anderson and Timothy L. Su l l i van
Lewis Research Center
SUMMARY
The application of some fracture mechanics concepts to the prediction of the strength of pressure vessels in which cracks have penetrated entirely through the vessel wall is examined. The strength of cylindrical pressure vessels (with longitudinal through-cracks) is related to the geometry of the cylinder, the crack length, the material yield strength, and fracture toughness. An expression for the crack tip s t r e s s intensity factor is derived by considering the influence on the s t r e s s near the crack tip of membrane stressing in the cylinder and of bending caused by bulging of the partially constrained material on either side of the crack. The form of the derived expression is verified and empirical constants evaluated from burst data at -320' and -423' F of aluminum alloy (2014-T6 Al) and extra-low-interstitial (ELI) titanium alloy (5A1-2. 5,911-Ti) tanks.
The analysis, based on the Irwin fracture theory, provides a suitable means for the correlation of the strength of flat-sheet specimens with that of cracked pressurized cylinders. The correlation suggests that the fracture strength of through-cracked cylinders of any radius, crack length, and thickness can be determined from material toughness, yield strength, and a bulge coefficient. Neglect of the effect of pressure bulging in the fracture analysis of pressurized cylinders can cause a significant overestimate of the fracture strength.
INTRODUCTlON
The presence of cracks in the wall of a pressure vessel, such as a cryogenic liquid rocket propellant tank, can severely reduce the strength of the structure and can cause sudden failure at nominal tensile s t resses l e s s than the material yield strength. In such cases, cracks form at inherent flaws in the structure, extend under loading to a critical size, and then propagate rapidly through the material. To ensure the integrity of a structure when a flaw is present requires that the designer understand and adequately consider the mechanics of fracture, particularly the relation between fracture load and the flaw and structural geometry.

G. R. Irwin has developed a useful fracture analysis that relates the stress distribution near the tip of a crack to the Griffith energy cr i ter ia for unstable crack growth (ref. 1). This analysis relates the fracture load to the size of the crack, the geometry of the structure, and a single material fracture toughness parameter. The Irwin analysis has been applied to various structural and crack configurations including tensioned flat plates having through cracks (ref. 2) or surface cracks (ref. 3), edge-cracked beams in bending and tension (ref. 4), and surface-cracked pressurized cylinders (ref. 5). Although a fracture analysis of a pressurized cylinder in which a crack has penetrated entirely through the vessel wall is not available, there is evidence that the strength of through-cracked pressurized cylinders is less than that of a flat sheet having the same crack size. This behavior was discussed by Pe ters and Kuhn in reference 6, which re ports results of burst t es t s of through-cracked aluminum cylinders.
The present work examines this apparent reduction in cylinder burst strength through the application of fracture mechanics concepts. The strength reduction is considered to be due to an increase in the crack tip stress intensity caused by pressure bulging near the crack. The s t r e s s intensity factor associated with bulging is derived by a dimensional analysis, and the Griffith-Irwin fracture criterion is employed to relate circumferential s t r e s s at fracture to crack length, cylinder radius, material fracture toughness, yield strength, and an empirical bulge coefficient. Data from burst tes ts of cylinders of 2014-T6 A1 and ELI 5A1-2. 5Sn-Ti at -320' and -423' F verify the form of the expression for fracture strength.
2a
2 a C
2ag
2a0 C
'i E
2
K
Kb
KC
2
SYMBOLS
crack length, in.
critical crack length, in.
crack length indicated by continuity gage, in.
initial crack length, in.
dimensionless bulge coefficient
set of experimental bulge coefficient values
Young's modulus, psi
fractional e r r o r in fracture toughness value due to material inconsistencies
s t r e s s intensity factor, psi +-s t r e s s intensity factor associated with pressure bulging, psi fi critical stress intensity factor, fracture toughness, psi fl

Kc, nominal fracture toughness (based on initial crack length), psi 6 Kh s t r e s s intensity factor associated with membrane hoop stressing in pressurized
cylinder, psi fi k dimensionless coefficient, eq. (2)
P pressure, psi
R radius of cylinder, in.
r coordinate distance from crack tip in crack plane, in.
rfg distance from crack tip to location of failure in continuity gage, in.
rP length of plastic zone at crack tip, in.
s t r e s s concentration factor for cracked flat sheetsU
su, cy1 s t r e s s concentration factor for cracked cylinder
t W
wi
E fg E Y
U
uC
Oh
Oh c
u l
OYB UY
aYb
uYY
sheet thickness, in.
sheet width, in.
least- squares method weighting factors
dimensionless exponents, eq. (2)
failure strain of continuity gage, in. /in.
strain ahead of crack and normal to crack plane, in. /in.
strain ahead of crack and normal to crack plane at elastic-plastic interface, in. /in.
uniform gross s t r e s s acting normal to plane of crack, psi critical uniform gross s t r e s s acting normal to plane of crack, psi
membrane hoop s t r e s s in cylinder, psi
critical membrane hoop s t ress , psi
membrane longitudinal s t r e s s in cylinder, psi
uniaxial yield strength, psi
yield strength in 2:l biaxial s t r e s s field, psi
s t r e s s ahead of crack and normal to crack plane, psi
surface tensile bending s t r e s s normal to crack plane ahead of crack, psi
s t r e s s ahead of crack and normal to crack plane at elastic-plastic interface, psi
3

ANALYSIS
Fracture Criterion
The stress distribution near a crack in a structure can be described by a linear elastic stress analysis, provided that plastic deformation is confined to a small region near the tip of the crack. G. R. Irwin (ref. 7) and M. L. Williams (ref. 8) have shown that the s t r e s s near the end of a crack in a linear-elastic material is inversely proportional to the square root of the distance from the crack tip. For example, the s t r e s s ahead of the crack and normal to the crack plane, a
Y’ varies with distance r from crack tip by
(-J =- for small r. The constant of proportionality in this relation is the s t r e s s in--u V27rr
tensity factor K, which expresses the magnitude of the s t r e s s field near the crack tip. The s t r e s s intensity factor is a function of the applied load, the crack size and shape, and the geometry of the structure.
Irwin (ref. 1) has related the s t r e s s intensity factor to the rate of release of elastic strain energy with crack extension, which according to the Griffith theory of fracture reaches a critical value at fracture. Consequently, a fracture criterion is formulated in te rms of the s t r e s s intensity factor: Fracture occurs when K attains a critical value Kc, usually termed the fracture toughness of the material. Values of Kc can be obtained from laboratory tes ts of suitable precracked specimens by methods discussed in detail in references 2 and 4. By use of the Irwin fracture criterion the strength of a structure containing a crack can be determined from the fracture toughness of the material and the dimensions of the crack and of the structure.
Application of this criterion to through-cracked cylindrical pressure vessels requires an expression for the s t ress intensity factor which includes the special geometrical and loading conditions pertinent to this kind of structure. If such an expression were known, the strength of a cracked cylinder could be determined from its dimensions, the length of the crack, and the toughness of the material.
Stress Intensity Factor for a Through-Cracked Cylindrical Pressure Vessel
The s t ress intensity near the end of a through crack in a pressurized cylinder is considered to be influenced by two distinct loading mechanisms - membrane stressing in the cylinder wall and bending caused by bulging of the partially constrained material on either side of the crack. The following analysis examines the s t r e s s intensity associated with each of these loading effects for the case of a longitudinal crack of length 2a located in a cylinder as shown in figure 1. The segment of the cylinder wall which contains
4
v

the crack is represented in figure 2(a) as a sheet subjected to uniform lateral pressure p and normal s t resses ah and ul , corresponding to hoop and longitudinal s t resses , respectively. The s t r e s s intensity factor Kh due to hoop stress ah is assumed to be that of a centrally cracked wide sheet subjected to a remote uniform tensile s t ress . According to reference 3, Kh can be expressed by
The contribution of the longitudinal s t r e s s u1 to the s t ress intensity is considered to be negligible as discussed in reference 2.
The influence of lateral pressure on the s t r e s s intensity can be inferred by considering the effects of pressure on the material on either side of the crack. Pressure against the partially constrained portion of the tank wall near the crack would cause deflection and rotation of the crack edge as shown in figure 2(b). Since the rotation is zero at the crack tip, a restraining bending moment occurs ahead of the crack thereby introducing a bending s t r e s s normal to the crack plane. The surface tensile bending stress ahead of the crack, designated uYb' is assumed to be a function of distance from the crack tip r, pressure p, sheet thickness t, Young's modulus E, and crack length 2a. In the absence of an explicit relation between uYb and this set of variables, it is assumed that
OYb close to the crack tip can be expressed in the functional form
(p, E, a, t , r ) = kpaEP r 6 ha t r OYb
where k is a dimensionless coefficient and a, 0,y , 6, and h a r e dimensionless exponents. Correct dimensionality of equation (2) requires that 0= 1 - (Y and y = -(6 + A ) or
The exponents a and X can be evaluated from the following known aspects of the mechanics of the problem. Since the material is linearly elastic, the bending stress is proportional to the pressure, whereby in equation (3), a = 1. In all linear-elastic crack problems the s t r e s s near the crack tip varies inversely with the square root of the distance from the crack tip (refs. 7 and 8). Thus X must equal -1/2. For la ter convenience, let -6 equal a dimensionless number p . Equation (3) can now be written as
5

The s t r e s s uY
near the tip of a crack is related to the s t r e s s intensity factor K in reference 2 by
Consequently, the bending stress uYb
close to the crack tip can be related to a s t r e s s intensity factor associated with pressure bulging Kb by
Then from equations (4) and (6) this bulge s t r e s s intensity factor is related to pressure, crack length, and sheet thickness by
K p p G ( ; ) i i (7)
where C is a dimensionless coefficient equal to k 6. For cases in which both membrane stressing and pressure bulging occur near a
crack, the total s t r e s s intensity is the sum of the s t r e s s intensities for each of the loading conditions, since stress intensity factors can be superimposed for a given crack length. In the special case of a pressurized cylinder having a crack oriented parallel to its axis, the total s t r e s s intensity factor K is the sum of the s t ress intensity factor due to hoop membrane stressing Kh and that due to bulging Kb; that is,
K = K h + %
From equations (l), (7), and (8),
Equation (9) is a s t r e s s intensity factor for a cracked plate element under uniform tensile s t ress ah and lateral pressure p. When this element is considered to be a segment of the cylinder wall, p = oht/R for a cylinder of radius R, and equation (9) becomes
6

At fracture, K equals Kc, 2a equals the critical crack length 2ac, and oh equals the critical hoop s t r e s s ah,, which, from equation (lo), is
It should be noted that as R becomes very large, equation (11) reduces to the expression for the critical s t r e s s on a wide flat sheet, which according to reference 2 is
In this expression the crack length is usually altered to account for the effect of plastic
deformation at the tip of the crack by replacing ac with ac +- K: (ref. 9) where uy22.rruy
is the uniaxial yield strength. If a similar plasticity correction is used in the corresponding square root term in equation (ll),the critical hoop s t r e s s becomes
where ayB is the yield strength in a 2:l biaxial s t r e s s field. This expression relates the critical hoop stress in a cracked pressurized cylinder to crack length, wall thickness, cylinder radius, yield strength, and fracture toughness. In equation (13) the crack length
in the bulge term C was not modified for plastic deformation because the re
sulting expression would indicate a finite bulge effect at zero crack length. The form of equation (13) can be verified and the values of p and C obtained from
experimental data from burst t es t s of precracked cylinders. When equation (13) is
7
L

rewritten as
* 1-1-1 = C p )
where
* = - R I uhc I
a,
uYB 2 the parameters C and 1-1 can be separated by taking the logarithm of each side of equation (14):
"CIn Q = (p - 1)ln --t In C (15)t
This expression predicts a linear relation between $' and ac/t on a log-log plot. Burst tests of pressurized cylinders a r e required to test this relation and to evaluate the parameters 1-1 and C.
APPARATUS AND PROCEDURE
The validity of the form of equation (13) was investigated using data from burst tes ts of cylinders of four different materials having various thicknesses, radii, and crack lengths, at room temperature, -320°, and -423' F. Fracture data for 2014-T6 A1 and ELI 5A1-2. 5%-Ti were obtained at the Lewis Research Center from tests of 6-inchdiameter cylinders such as that shown in figure 3 having longitudinal notches or cracks varying in length from 0 .1 to 2 .0 inches. The 2014-A1 cylinders were cut from extruded tubing, heat treated to the T6 condition, and machined to a wall thickness of 0.060 inch (ref. 10). The roots of the notches in the aluminum cylinders were machined to a radius of about 0.0002 inch. The aluminum nominal fracture toughness values were obtained from tensile specimens that were cut from flattened tube stock that had been heat treated with the cylinders. These specimens, as that shown in figure 4, were 3 inches wide,
8

0.060 inch thick, and had l-inch central notches machined to approximately 0.0002 inch radius at the root.
The titanium cylinders were formed from 0.020-inch sheet material with a single longitudinal butt weld. Each cylinder was stress-relieved by heating to l l O O o F for 2 hours. Cracks were started by extending half-wall-thickness electrical discharge notches through the wall by low-stress pressure cycling. Fatiguing was continued until the cracks reached the desired test length. The 3-inch-wide titanium toughness specimens were made from the same sheet stock as that used for the cylinders and were subjected to the same heat treatment and crack preparation.
Room temperature data for two aluminum alloys (2024-T3 and 7075-T6 Al) were obtained from results of notched cylinder burst t es t s published in reference 6. These data represent cylinder radii of 3.6 and 14.4 inches, wall thicknesses ranging from 0.006 to 0.025 inch, and crack lengths varying from 0.24 to 7.70 inches.
The direction of testing for both the 2014-T6 A1 and ELI 5A1-2. 5%-Ti toughness specimens corresponded to the hoop direction in the cylinders. During loading of the toughness specimens and the cylinders, slow crack extension was monitored by electrical resistance foil element continuity gages (ref. 11) placed at the crack tip. These gages consisted of 20 elements connected in parallel and were mounted normal to the crack as shown in figure 5. As the crack grew individual elements broke causing an abrupt measurable resistance change. In the toughness tests, the initial crack length 2ao, the critical crack length 2ac, and the critical applied stress were measured. Fracture toughness values were calculated from these data by the expression given in reference 2
where W is the sheet width. Because there were cases in which the critical crack length was not known, an alternate correlation was based on the initial crack length, and a nominal fracture toughness Kcn was computed by
Although exact values of Kcn for the 2024-T3 and 7075-T6 A1 sheet used in the tests of
reference 6 are not available, typical toughness values of 90 000 p s i 6 for the 2024-T3
9
.*

and 53 000 psi for the 7075-T6 A1 were used in the computations. These values were estimated from flat sheet strength data included in reference 12.
In the burst t es t s of 2014-T6 A1 and ELI 5A1-2. 5%-Ti cylinders measurements were made of the initial crack, the critical pressure, and the critical crack length as indicated by the continuity gages. The gage-indicated crack length was subsequently corrected to obtain a more accurate critical crack length measurement, as discussed in appendix A. Table I summarizes pertinent cylinder burst test data.
Values of biaxial yield strength ayB of the aluminum were calculated from the Von Mises yield cri terion to be 1. 15 ay for a 2:l s t r e s s field. Because some titanium alloys exhibit significant increase in biaxial yield strength relative to uniaxial yield strength, values of ayB of ELI 5A1-2. 5%-Ti were obtained from pressure tes ts of uncracked cylinders.
Data from the cracked cylinder burst tests were used to verify the expression for fracture strength developed in the ANALYSIS section as given by equation (15). The form of this expression was tested and the empirical parameters ,u and C evaluated by plotting experimental values of * against a/t on a log-log plot. The values of * were computed for each cracked cylinder burst test using R, ah,, and a. or a, for each test and Kcn or Kc from the flat sheet toughness tests.
RESULTS AND DISCUSSION
The expression for the burst strength of through-cracked pressurized cylinders given by equation (15) in the ANALYSIS section indicates a linear relation between the te rms I) and a/t on a log-log graph. The plots of experimental values of I) against a/t in figure 6 verify the predicted linear relation. In addition, for each case shown in figure 6 it appears that 1c/ is insensitive to the ratio a/t. The data indicate that I) is constant over three decades of the ratio a/t, that is, the slope of the line, ,u - 1, is zero. This behavior suggests that in equation (15) the empirical constant C equals rl/ and can be computed from the data using equation (14)
10

for correlation based on the critical crack length o r by
c = -R aO 2
+ -1 -cn 2 2
OYB
for correlation based on the initial crack length. Weighted averages of the experimental values of the empirical bulge coefficient C
were computed by the method discussed in appendix B and a r e shown by solid lines in figures 6 and 7. The value of C obtained from the data of reference 6 is the unweighted mean of the data. The number thus obtained is approximately the same as the coefficient of a/R reported in reference 6 in which the ratio of the s t r e s s concentration factor for a cracked cylinder to that for a cracked flat sheet was found empirically to be
---=1+9.2- asu, cy1 sU R
In that report the coefficient 9 .2 was calculated from a comparison of the strength of cracked flat sheets to the strength of pressurized cylinders having the same crack lengths.
From examination of figure 7 it appears that the bulge coefficient C tends to decrease with decreasing temperature. At the present time it is not clearly understood why C is temperature o r material dependent. Further investigation is required to explain this dependency.
The scatter of the data in figures 6 and 7 can be shown to be caused by an e r r o r in the half crack length a of *O. 02 inch and a total e r ro r in fracture toughness of *4 percent for the aluminum and *6 percent for the titanium. The fractional e r ro r in C due to both of these e r r o r s is derived in appendix C. The dashed curves on either side of the weighted mean values of C in figure 7 represent the computed deviation in C due to the estimated e r r o r s in crack length and fracture toughness. Because these curves bound almost all of the data, the scatter is accounted for by the e r r o r s cited previously.
Figures 8 to 10a r e curves of fracture strength of pressurized cylinders computed as a function of crack length by the following expressions obtained from equations (18) or(19):
11

- KC uhc - I
or
-uhc - I
The curves in figures 8 to 10 were computed from equations (20) or (21)using toughness values obtained from flat sheet tes ts and the weighted mean C values from figure 7. The dashed curves in these figures a r e the upper and lower values of fracture strength prediction due to the experimental e r ro r in C discussed previously. The excellent correlation in these figures suggests that for a given material and temperature the fracture strength of cylinders of any radius, crack length, or wall thickness can be determined from as few cylinder burst tes ts as a r e necessary to obtain a meaningful value of the bulge coefficient C.
Neglect of the effects of pressure bulging will lead to an overestimate of the strength, as can be seen in figures 8 to 10 by comparing the fracture strength curves that include the bulge te rm to those that do not. It is apparent that there can be a large reduction in the strength of cracked cylinders due to pressure bulging, particularly for larger values of c-.a
R
CONCLUSIONS
The fracture mechanics analysis of the effects of pressure bulging near the crack on the stress intensity factor, as described in this report, provides an explanation for the lower strength of cracked cylinders relative to flat sheets as well as a method for correlating the strength of cracked pressurized cylinders with that of flat sheets.
Application of a fracture analysis of through-cracked pressurized cylinders that does not include the effects of pressure bulging could result in an overestimate of the fracture strength.
12

The close agreement between the form of the derived expression for fracture strength and the experimental data suggests that the fracture strength of cylinders of any radius, crack length, and wall thickness can be determined from material toughness, yield strength, and the bulge coefficient obtained from tests of a few cylinders.
Lewis Research Center, National Aeronautics and Space Administration,
Cleveland, Ohio, October 1, 1965.

APPENDIX A
CALCULATION OF CORRECTED CRACK LENGTH FROM CONTINUITY GAGE DATA
In the cylinder burst t es t s and fracture toughness tests, the crack lengths indicated by the foil continuity gages were found to be longer than the actual crack length because the continuity gage elements failed slightly ahead of the actual crack front. Consequently, a more accurate measurement of crack length required a calibration of the continuity gages. The following theoretical calibration relates the gage- indicated crack length to a corrected crack length in t e rms of applied s t ress , material yield strength, yield strain, gage failure strain, and specimen width. It is presumed that the gage elements failed ahead of the crack because the ductility of the gage mounting cement was less than that of the specimen material. How this behavior might affect the gage readings is shown in figure 11, a sketch of s t ra in ahead of a crack. When a gage element breaks at a strain E
fg’it indicates a crack longer than the actual surface crack by an amount 2r
fg’ If the gage
indicates a crack of length 2ag’ the actual crack length is
2a= 2a - 2rfgg
The distance rfg is related to the length of the plastic region rP’ the strain at the elastic-plastic interface E YY’ and the failure strain of the continuity gage E fg by a simplified approximation of the expression for strain ahead of a crack given in equations 2-43 to 2-45 of reference 13. Then
Equation (A2) can be solved for rfg
by noting that r = rfg
at = efg. Thus,
The corrected crack length and the gage-indicated crack length are related from equations (Al) and (A3) by
14
I . ..d

---
a - 1_ -a g
1 + 1 + [ CY(:;: For a plate of width W, rda is given in equation 2-28 of reference 13 as a function of the ratio of gross normal stress (T to the stress at the elastic-plastic interface 0
YY by
For an infinitely wide plate, equation (A5) reduces to
The ratio a/a g can be calculated as a function of a/ayy (or o/ayB when 0YY is taken as the biaxial yield strength) from equations (A3), (A4), and (A6)
For a/W << 1,
The continuity gage failure s t ra in E fg was measured from a tensile test of the gage
mounted on an aluminum tensile specimen. The measured s t ra in at which the continuity gage failed was taken as E
fg' In equations (A7) and (A8), the stress at the elastic-
plastic interface aYY
was taken as the 2:l biaxial yield strength cryB for the reasons discussed on page
2 52 of reference 13. The s t ra in at the elastic-plastic interface E
YY is
.1 - vcomputed as ___
OYY in the same reference.
I E
15
-.- _.LA--

This theoretical ratio is plotted in figure 12 and is compared to experimental measurements of a/a
g for ELI 5Al-2.5Sn-Ti and 2014-T6 A1 flat sheet specimens at
-320' F. The agreement is good enough to permit the use of equations (A7) or (A8) to correct the continuity gage readings.
16

APPENDIX B
CALCULATION OF AVERAGE BULGE COEFFICIENT
A least-square method is selected to compute an average value of C from the set of experimental values Ci. Since the observed Ci do not all have the same precision, the squares of the deviations a r e weighted by factors wi (ref. 14). The sum of the weighted squares is
n 2
s = Wi(Ci - C) i=1
When minimized, equation (Bl) is
n as= 0 = -2 cWi(Ci - C) ac i=1
and at the minimum
n
C = i=1 n
i=1
If the Ci values a r e weighted such that the values of wi a r e inversely proportional to the square of the expected e r ro r AC caused by e r ro r in crack length and toughness (eq. (C9) in appendix C),
and
17
L

f:i=1 ( , 2 , J 2 C =
n
where I AC I is given by equation (C9).
18

K-
APPENDIX C
ERROR IN BULGE COEFFICIENT
Because values of the bulge coefficient computed from equations (18)and (19) are highly dependent upon the crack length and the fracture toughness, an e r ror in C is presumed to be due mainly to e r ro r in these two parameters. The magnitude of the largest difference in C expected from changes in Kc and a is
From equation (18),
1 +ac -
~
CaC- _ - R \
aaC 2 +- 1 -.“.I
and
ac - 2c
aKc Kc 2 + -
ra
Consequently,
bcl+-2c I
2 +- 1 - “ 1 2 +- 1 2
19

An e r ro r in measurement of Kc due to an e r r o r Aac is given by (aKc/aac)Aac. In a flat-sheet toughness test Kc is related to ac by
if the width effect is ignored. Then,
aKc Kc-=aa 2ac
When 2 , the fractional e r r o r in Kc due to material inconsistencies is included, the total e r r o r AKc is
KCAKc = -Aac +%Kc
aC
and
where the subscript T refers to a flat-sheet toughness test. The fractional e r r o r in C as given by equation (C4)is then
+ 21% T
or, when the correlation is based on initial crack length and nominal fracture toughness, the fractional e r ro r in C is
20

+ ““I)r
The e r ro r in C was computed using an estimated A a of 0.02 inch and a toughness test crack length of 1.0 inch. The estimated fractional e r ro r in toughness 1% I was taken as 0.04 for the aluminum and 0.06 for the titanium.
21

REFERENCES
1. Irwin, G. R. : Fracture. Encyclopedia of Physics. Vol. VI. S. Flugge, ed. , Springer-Verlag (Berlin), 1958, pp. 551- 590.
2. ASTM Special Committee on Fracture Toughness Testing of High-Strength Metallic Materials: Fracture Testing of High-Strength Sheet Materials. Bull. No. 243, ASTM, Jan. 1960, pp. 29-40.
3. ASTM Special Committee on Fracture Testing of High Strength Metallic Materials: Progress in Measuring Fracture Toughness and Using Fracture Mechanics. Mater. Res. and Stand., vol. 4, no. 3, Mar. 1964, pp. 107-119.
4. Srawley, John E. ; and Brown, William F., Jr. : Fracture Toughness Testing. NASA TN D-2599, 1965.
5. Tiffany, C. F. ; and Masters, J. N. : Applied Fracture Mechanics. Fracture Toughness Testing and Its Applications. STP No. 381, ASTM, 1964, pp. 249-277.
6. Peters , Roger W. ; and Kuhn, Paul: Bursting Strength of Unstiffened Pressure Cylinde r s with Slits. NACA TN 3993, 1957.
7. Irwin, G. R. : Analysis of Stresses and Strains Near the End of a Crack Traversing a Plate. J. Appl. Mech., vol. 24, no. 3, Sept. 1957, pp. 361-364.
8. Williams, M. L. : On the Stress Distribution at the Base of a Stationary Crack. J. Appl. Mech., vol. 24, no. 1, Mar. 1957, pp. 109-114.
9. Irwin, G. R. : Plastic Zone Near a Crack and Fracture Toughness. Proc. Seventh Sagamore Ord. Materials Conf., Syracuse Univ. Res. Inst . , Aug. 1960.
10. Getz, David F. ; Pierce, William S. ; Calvert, Howard F. : Correlation of Uniaxial Notch Tensile Data with Pressure-Vessel Fracture Characteristics. Paper No. 63-WA-187, ASME, 1963.
11. Kemp, R. H. : Characteristics and Application of Foil Strain Gages at -423' F. Paper Presented at Western Regional Strain Gage Conference, Denver (Colo. ), Sept. 30-Oct. 1, 1963.
t
12. Lacey, G. C. : The Residual Static Strength of Structures Containing Cracks. Rept. No. ARL/SM-288, Aeron. Res. Labs., Melbourne (Australia), Apr. 1962.
1
13. Anderson, R. B. : Plastic Flow at the Tip of a Crack Related to Fracture Mechanics. Ph. D. Thesis, Carnegie Inst. Tech., June 1964.
14. Wilson, E. Bright, Jr. : An Introduction to Scientific Research. McGraw-Hill Book Co., Inc., 1952.
22
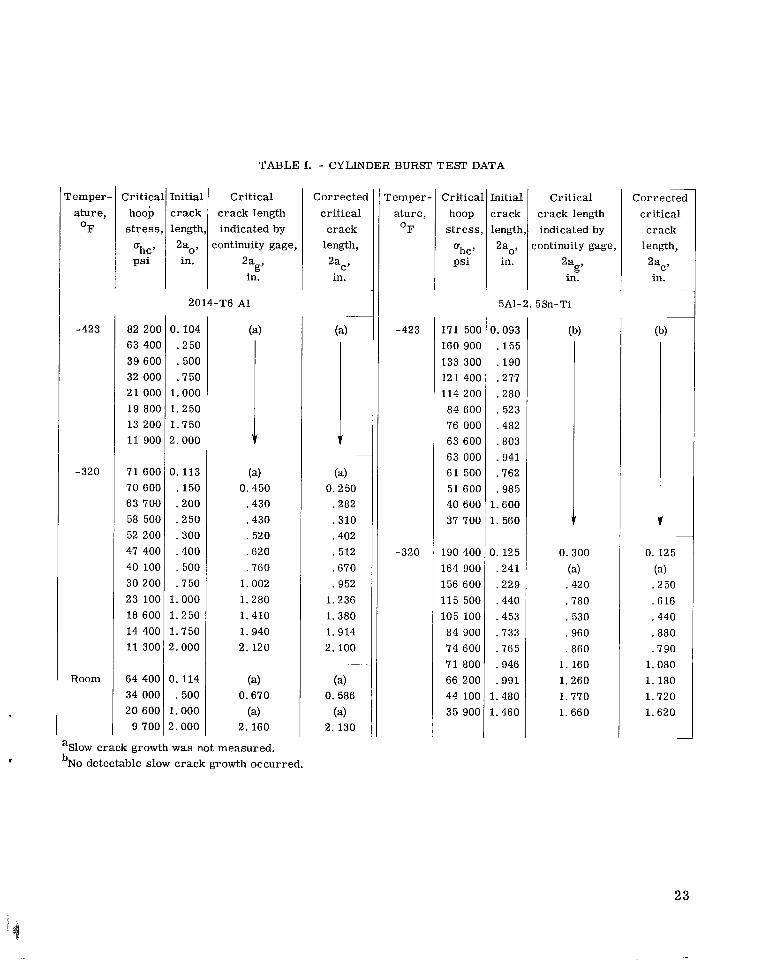
Cemper- Critical ature, hoop OF s t r e s s ,
Ohc9 ps i
-423 82 20C 63 40C 39 60C 32 OOC 21 ooc 19 80C 13 20C 11 900
-320 71 600 70 600 63 700 58 500 52 200 47 400 40 io0 30 200 23 100 18 600 14 400 11 300
Room 64 400 34 000 20 600
9 700
TABLE I. - CYLINDER BURST TEST DATA
initial Crit ical Temper- C r itica: Lnitial :rack c rack length ature, hoop crack length, indicated by OF stress, length, 2a,, continuity gage, Oh,, 2a0, in. 2a ps i in.
in.g’
0.104 -423 171 500 3.053 .250 160 900 .155 . 500 133 300 .190 .750 121 400 .277
1.000 114 200 ,280 1.250 84 600 . 523 1.750 76 000 .482 2.000 63 600 .803
63 000 .941 0.113 6 1 500 .762 . �50 51 600 . 985 .200 40 600 1.600 .250 37 700 1. 560 .300 .400 -320 190 400 1. 125 . 500 164 900 .241 .750 156 600 .229
1.000 115 500 .440 1.250 105 100 .453 1.750 84 900 .733 2.000 74 600 .765
71 800 . 946 D. 114 66 200 .991 . 500 44 100 1.480
1.000 35 900 1.460 2.000
Crit ical c rack length indicated by
continuity gage, 2a in.
g’
f V
aslow crack growth was not measured. V bNo detectable slow c rack growth occurred.
23

Figure 1. - Cracked pressur ized cyl inder.
ah
(a) Bu lg ing near through-crack due to lateral pressure.
Rotation of Ah.. i crack edge-A 'p a
Sheet conf igura t ion after p ressur iz ing -.A
Y
(b) Section ABC showing rotat ion of crack edge and r e s u l t i n g moment ahead of t h e c r a c k
Figure 2. - Distort ion of mater ia l near through-crack in sheet subjected to lateral pressure.
24

C-65176
Figure 3. - Notched cy l indr ica l b u r s t test specimen.
Figure 4. - Notched f lat sheet f rac tu re toughness specimen.
2 5

Figure 5. - Foil element cont inu i ty gage mounted at notch root.
26

Material
V 2014-T6 AI A 2014-T6 AI -320 D M14-T6 AI Room 0 c3 5AI-2.5s n-Ti -423 ~
0 5AI-2.5Sn-Ti -320 0 2024-T6 AI Room (data f rom 0 7075-T6 AI I ref. 6)
Open symbols denote a = a. Sol id symbols denote a = ac
-[eightedaverag[ , , , * I +flb I I I ' .1 1 10 100
710
2 1 10 100
Half crack length to th ickness ratio, alt
Figure 6. - In f l uence of ha l f crack length to th ickness rat io a l t on parameter 1.
27

-10
-5
, , , ., . . . .. ._
0:I-5
15
-5If; 0 I 10
0'H
I a,
Mater ia l
D 2014-T6 A I a 2014-T6 A I D 2014-T6 A I
0 2024-T3 AI 0 7075-T6 AI
0
I l l
Tern-
O F
-423 -320
Room
from
-
~
10
Weighted average
bulge coefficient
-5 . I 1'
Figure 7. - Bulge coefficient and estimated scatter in computed values.
28
100

120x103 I I I I I I I IIm 100 3 ' 0 Experimental data
Eq. (21)
80
60
. 40 s 20
0 (a) Temperature, -423O F; nominal fracture toughness
o y B = 104 OOO psi; bulge coefficient C - 2.86.
/ I I -
In i t ia l c r
Estimated data scatter Uncorrected for bulge effect
Kcn - 43 700 psi yield strength
0I IExperimentalI I Idata I lq Eq. (21)
- Estimated data scatter
(b) Temperature, -320" F; nominal f i ure toughness Kcn = 48 500 psi .linch; yield strength -oys = 94 200 psi; bulge coefficient = 3.49.
120x10' \
100 0 Experimental data Eq. (201
\ Estimated data scatter 80 Uncorrected for bulge effect
60
40
M
0 crack length, 2ac, in.
(c) Temperature, -320° F; crit ical fracture toughness K, 56 600 psi -jinch; yield strength OYB - 94 200 psi; bulge coefficient C = 3. 15.
Figure 8. - Fracture strength of M14-m AI cylinders. Radius of cylinder R = 2 81 inches.
29

s
--
--
L
3 m
100
80
60
40
.-E 20 t p' v
o L -VI
a,-" L
0
30
I I I I I I I I I 0 Experimental data -
Eq. (21) Estimated data scatter
'-. . I ,
.8 1.0 1.2 In i t i a l crack length, 2ao,
(d) Room temperature; nominal f racture toughness Kcn =
oYB = 78 100 psi; bulge coefficient C = 6.37.
0
Uncorrected fo r buloe effect
1.4 1.6 1.8 2.0 2. 2 in.
58 400 psi .Jinch; yield strength
Experimental data * Eq. (20) --Estimated data scatter
Uncorrected fo r bulge effect . \:
~.
. 2 . 4 . 1.0 1. 2 1.4 1.6 1.8 2.0 Cr i t ical crack length, Za,, in.
(e) Room temperature; c r i t i ca l f rac tu re toughness Kc = 64 500 psi m;yield strength oyB = 78 100 psi; bulge coefficient C = 6.51.
Figure 8. -Concluded.
2.2

-- --
m
L
I l l 0I IExperimentalI I IdataI nfj220 I j
-. . 5
#--Estimated Eq: (21)
data scatter
'<
20' (a) Temperature, -423O F; nominal fracture toughness Kcn = 87 500 psi m;yield strength
oyB = 252 000 psi; bulge coefficient C = 1.57.
260
210 ._ CL
2 180 vi
E 5 140 m3 +m .k loa I itial c
60
2c
(b) Temperature, -320' F; nominal fra I r e toughness Kcn = 139 000 psi dinch; yield strength o Y B = 222 000 psi; bulge coefficient = 4.30.
260x ldII 1 1: -Eq.
0 Experimental data (20)
Estimated data scatter Uncorrected for bulge effect
I
1.0 1.2 1.41411
It2.2 .4 .6 .8
Critical crack length, 2a,, in.
(c) Temperature, -320" F; cr i t ical fracture toughness Kc = 160OOO psi m;yield strength OYB = 222 OOO psi; bulge coefficient C = 4.38.
Figure 9. -Fracture strength of 5AI-2.5Sn-Ti cylinders. Radius of cylinder R = 3.00 inches.
31

--
VI
m
60
50
40
30
20
.- 10 P
t p’ 2 0 .5 0) L
T, (a) 7075-T6 AI; m -L 3 ‘G 60 L L z I 5 0
40
30
20
10
0 1
. i
z
1.0 1.5 2.0 2 5
nominal f rac tu re toughness Kcn =
2 3 4 5
~ I i I i I i I I Radius of Sheet cyl inder, thickness,
R, t,in. in.
a 14.4 0.016 n 3.6 .016 U 3.6 .025 A 14.4 .015 0 3.6 .m V 3.6 .012 0 3.6 ,012 0 3.6 .025
Eq. (21) Uncorrected for bulge effect
3.0 3.5 4.0 4.5 5.0 5.5
53 000 p s i 6 h ; y ie ld s t rength uYB= 75 000 psi.
III I1I-
Iit L I
6 7 8 11 In i t ia l crack length, Za, in.
(b) 2024-T3 AI; nominal f rac tu re toughness Kcn = 90OOO psi F h ; y ie ld s t rength uYB= 42 OOO psi.
F igure 10. - Fracture s t rength of a l u m i n u m tanks at room temperature. Bulge coeff icient C = 9.5. (Data taken f rom ref. 6.)
32

1.0
.8
. 6
. 4 0 0.333 0 . 167
. 2 Eq. (A8) where
Efg = 0.0275 and = 0.010 \
\ n I I I I I I I
ala, (a) 5AI-2. 5Sn-Ti.tementsl(a) Foil element c o n t i n u i t y gage.
(b) S t r a i n ahead of crack.
F igure 11. - Fa i lu re of c o n t i n u i t y gage elements ahead of crack front.
. 8
. 6
2alW 0 0.333
- 0 . 167 . 2 - Eq. (A8) where
Efg = 0.0275 - and = 0.007 I I I I I I -..
0 . 2 . 4 .6 .8 1.0 1. 2 O'OY B
(b) 2014-T6 AI.
Figure 12. - Cont inu i ty gage cal ibrat ion. Temperature, -320" F.
N A S A - I m g l e y , 1966 E-2885 33

“The aeronautical and space activities of the United States shall be conducted 50 as to contribute . . . to the expansion of human knowledge of phenomena in the atmosphere and space. The Administration shall provide for the widest practicable and appropride dissemination of information concerning its activities and the results tbereof.”
-NATIONALAERONAUTICSAND SPACE ACT OF 1358
NASA SCIENTIFIC AND TECHNICAL PUBLICATIONS
TECHNICAL REPORTS: Scientificand technical information considered important, complete, and a lasting contribution to existing knowledge.
TECHNICAL NOTES: Information less broad in scope but nevertheless of importance as a contribution to existing knowledge.
TECHNICAL MEMORANDUMS: Information receiving limited distribution because of preliminary data, security classification, or other reasons.
CONTRACTOR REPORTS: Technical information generated in connection with a NASA contract or grant and released under NASA auspices.
TECHNICAL TRANSLATIONS: Information published in a foreign language considered to merit NASA distribution in English.
TECHNICAL REPRINTS: Information derived from NASA activities and initially published in the form of journal articles.
SPECIAL PUBLICATIONS: Information derived from or of value to NASA activities but not necessarily reporting the results .of individual NASA-programmed scientific efforts. Publications include conference proceedings, monographs, data compilations, handbooks, sourcebooks, and special bibliographies.
Details on the availability o f these publications may be obtained from:
SCIENTIFIC AND TECHNICAL INFORMATION DIVISION
NATIONAL AERONAUTICS AND SPACE ADMINISTRATION
Washington, D.C. PO546