nasa aerosol (particulate matter) products pawan gupta nasa arset- aq on-line short course fall 2013...
TRANSCRIPT
NASA Aerosol (Particulate Matter) Products
Pawan GuptaNASA ARSET- AQ On-line Short Course
Fall 2013
ARSET - AQApplied Remote SEnsing Training – Air Quality
A project of NASA Applied Sciences
Week – 4 – September 14, 2013

Outline
• Remote sensing of aerosol - definitions• Ground based remote sensing of aerosols – AERONET• The NASA Satellite aerosol products.• NASA aerosol remote sensing products as a surrogate for
PM2.5

•AOD - Aerosol Optical Depth•AOT - Aerosol Optical Thickness
These optical measurements of light extinctionare used to represent aerosol amount in the entirecolumn of the atmosphere.
Aerosol Optical Depth

AOD or AOT represents the total column loading of aerosols in the atmosphere
PM2.5 is a measure of the mass of particles in a specific size range near surface
Aerosol Optical Depthvs
PM 2.5
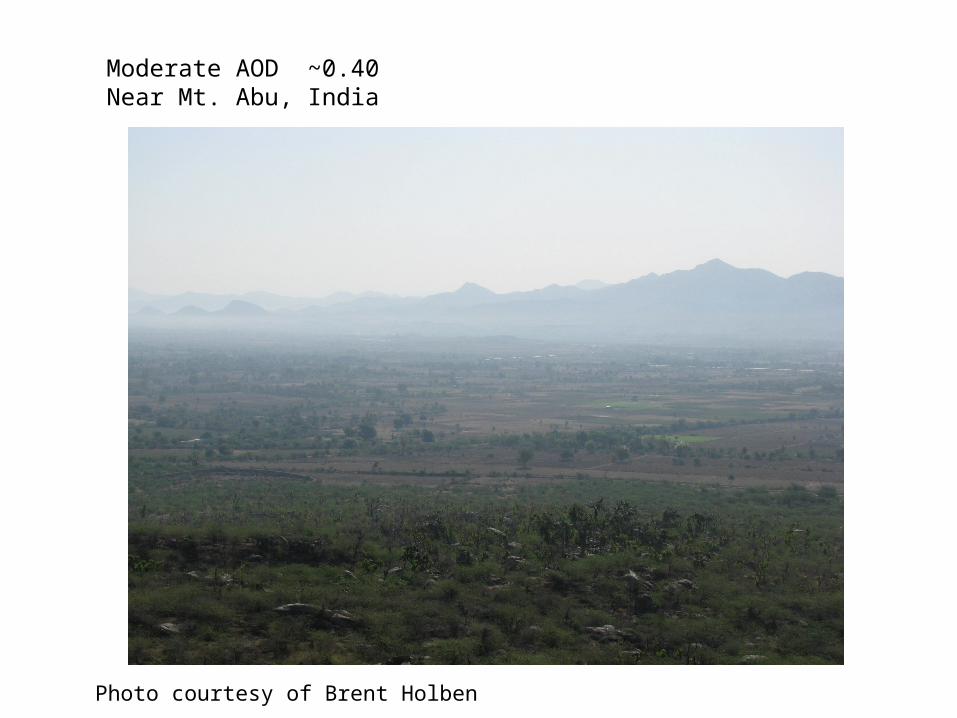
Moderate AOD ~0.40Near Mt. Abu, India
Photo courtesy of Brent Holben
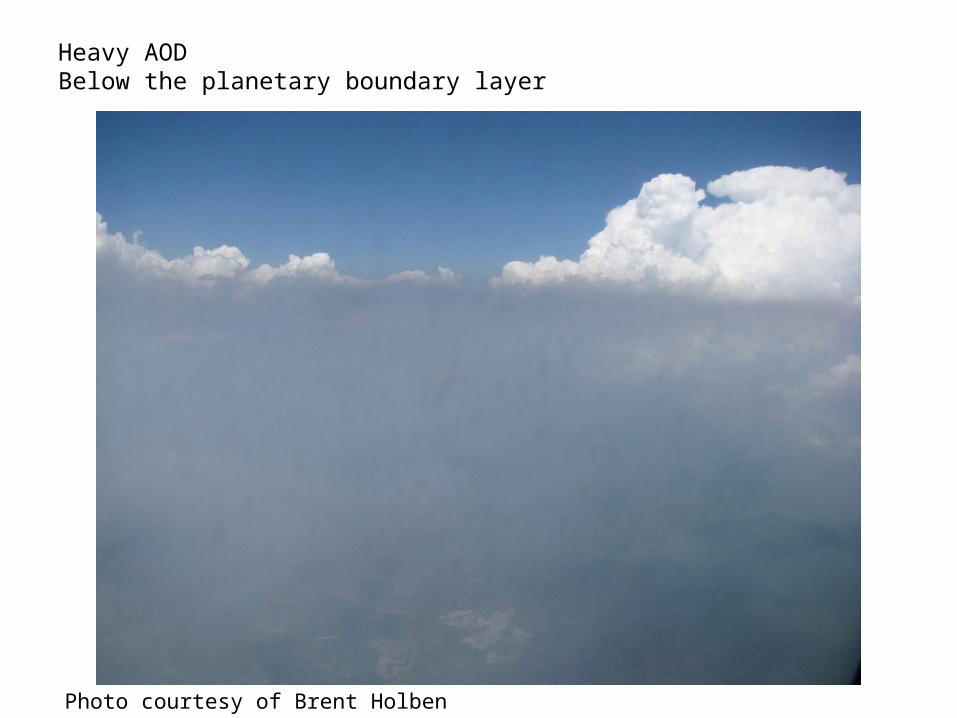
Heavy AODBelow the planetary boundary layer
Photo courtesy of Brent Holben

Visibility and PM2.5

AOD is a unit less quantity
Sample AOD values:
0.02 - very clean isolated areas ~ 1 µgm-3
0.2 – fairly clean urban area ~ 12 µgm-3
0.4 – somewhat polluted urban area ~ 24 µgm-3
0.6 – fairly polluted area ~ 36 µgm-3
1.5 – heavy biomass burning or dust event ~ 90 µgm-3
Aerosol Optical Depth
Equivalent PM2.5 mass concentration – Assuming
60 µgm-3/

Optical Depth
The optical depth expresses the quantity of light removed from a beam by scattering or absorption during its path through a medium.
optical depth τ as
I0
I
Surface
Sun
Atmosphere
gasaerRayl
m
m
eII
0
0
sec

AERONET
Aerosol Robotic Networkhttp://aeronet.gsfc.nas.gov
AERONET is useful in providing aerosol model information for satellite retrievals

AOT to PM

Surface
Aerosol
10km
Satellite
ColumnSatelliteMeasurement
PointMeasurementPM2.5 mass
TEOM
AOD to PM
•Point vs Area Averaged•Surface vs Column
•Mass vs Optical

Hoff and Christopher, 2009
AOD to PM2.5 - Theoretical
•AOD – Aerosol Optical Depth•H – Height of well-mixed boundary layer•f(RH) – ratio of ambient and dry extinction coefficients•p – aerosol mass density•Q – Mie extinction efficiency •r – particle effective radius•PM2.5 – PM2.5 mass concentration

AOD-PM Relationship
Chu et al., 2003
Wang et al., 2003
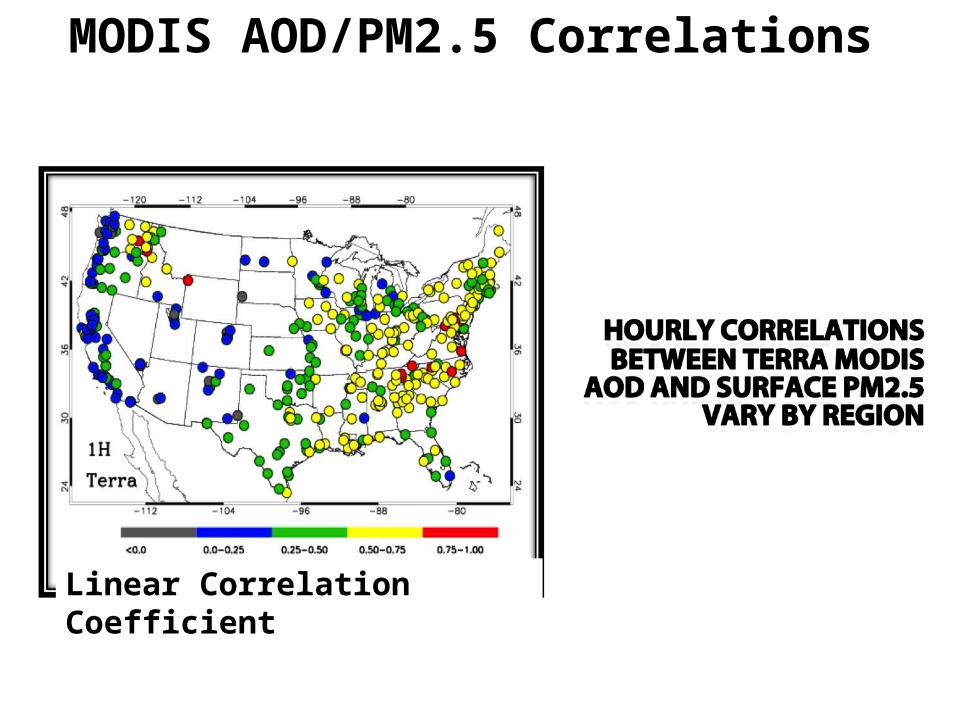
MODIS AOD/PM2.5 Correlations
Linear Correlation Coefficient

Potential Check --- Satellite vs Ground
Satellite aerosol observations are able to
see and follow the measurement trends at surface for air quality
monitoring -
Gupta and Christopher, 2008
MODIS-Terra Collection 5, Level 2, 10 km2 AOTs for
2000-2006, Birmingham, AL
DailyMonthly
Yearly

Artificial Neural Network
MODIS-Terra, July 1, 2007
Gupta et al., 2010
PM2.5 Mass Concentration (µgm-3)

PM2.5 Estimation: Popular Methods
AOT
PM
2.5
Y=mX + c
and Empirical Methods, Data Assimilation etc. are under utilized
Difficulty Level

AOD from Satellite

Radiance -to- Aerosol Products
MODIS-Terra, May 2, 2007
High
Low
NoRetrievals

Aerosol Retrievals from Satellite Observations
Satellite Radiance
(spectral/angular)
Radiative Transfer
Calculations
Aerosol Optical Depth and other
Properties
Aerosol Models – Assumption based
on lab/ground studies

Satellite Aerosol ProductsInInI MODIS MISR OMI PARASOLStrengths Coverage
Resolution
Calibration
Accuracy
Calibration
Accuracy
Particle shapeAerosol height for thick layer or plume
Indication of absorbing or scattering particles
Calibration
Accuracy
Particle shape*
Weaknesses Bright Surfaces*
Ocean glint
Non-spherical particles
Coverage Resolution
Cloud contamination
Cloud contamination
No coarse aerosol over land
Main Products AOD
Ocean – 5 wavelengths
Land – 3wavelengthsFine Fraction* *Ocean only
AOD
4 wavelengths
Spherical/Non-spherical ratioParticle Size(3 Bins)
AOD
AAOD
Aerosol Index
AODover ocean
Fine AODover landNon-spherical fraction over oceanAngstrom exponent
Product Resolution (level 2 and at Nadir)
10 Km
3 Km (Collection 6)
17.6 Km 13 X 24 Km 20 Km
Product Levels 2 2 2 2Global Level 3 Aggregates
Daily
8 Day
30 Day
Monthly
3 Month
Annual
Daily
Monthly
Monthly

Level 1 Products - Raw data with and without applied calibration.
Level 2 Products - Geophysical Products (sometimes gridded)
Level 3 Products - Globally gridded geophysical products
Data Product Hierarchy

Level 1 Products
Level 2 Products
Level 3 Products
MODIS Product Hierarchy
More User Control
Less User Control
Harder to Use
Easier to Use
Radiance - 250m, 500m, 1km
Aerosol – 10km
Aerosol – 1 degDaily/8day/Monthly

MODIS

MODIS: Aerosol Product
May 10th, 2007
• At least two daytime overpasses - Terra and Aqua
• Sensitive to Boundary Layer Industrial, smoke & dust aerosols
• Well validated over land
Smoke over Central America (Source: Giovanni)
MOD04 or MYD04
10 km – instantaneous01 deg – daily, weekly, monthly

MODIS Aerosol Products
Land Ocean
Dark Target (surface) – limited to only over dark vegetate surfaces
Deep Blue – Used over bright land surfaces
Three Separate Algorithms
Detailed presentation on the MODIS ocean algorithm available at http://ARSET.gsfc.nasa.gov/materials

MODIS Aerosol Products
Land Ocean
Dark Target Deep Blue
Three Separate Algorithms

Understanding a MODIS File NameUnderstanding a MODIS File Name
MOD04_L2.A2001079.0255.005.2006289012028.hdf
Product Name Date - year, Julian day
Time Collection
File processing information
Access to MODIS Aerosol Products
• NASA LAADSWEB. Searchable data base, FTP access
http://ladsweb.nascom.nasa.gov/index.html
• MODIS-Atmos Site: Complete RGB archive and Level 3 product imagery.
http://modis-atmos.gsfc.nasa.gov/
• Giovanni – web tool for imagery visualization and analysis
http://gdata1.sci.gsfc.nasa.gov/daac-bin/G3/gui.cgi?instance_id=MODIS_DAILY_L3
30

OMI

Instrument Characteristics-Nadir solar backscatter spectrometer
-Spectral range 270-500 nm (resolution~1nm )
-Spatial resolution: 13X24 km footprint
-Swath width: 2600 km (global daily coverage)
Ozone Monitoring Instrument (OMI)
Retrieval Products
Column Amounts-Ozone (O3)-Nitrogen Dioxide (NO2)-Sulfur Dioxide: (SO2)-Others
Aerosols
One of four sensors on the EOS-Aura platform (OMI,
MLS, TES, HIRDLS)
An international project: Holland, USA, FinlandLaunched on 07-15-04
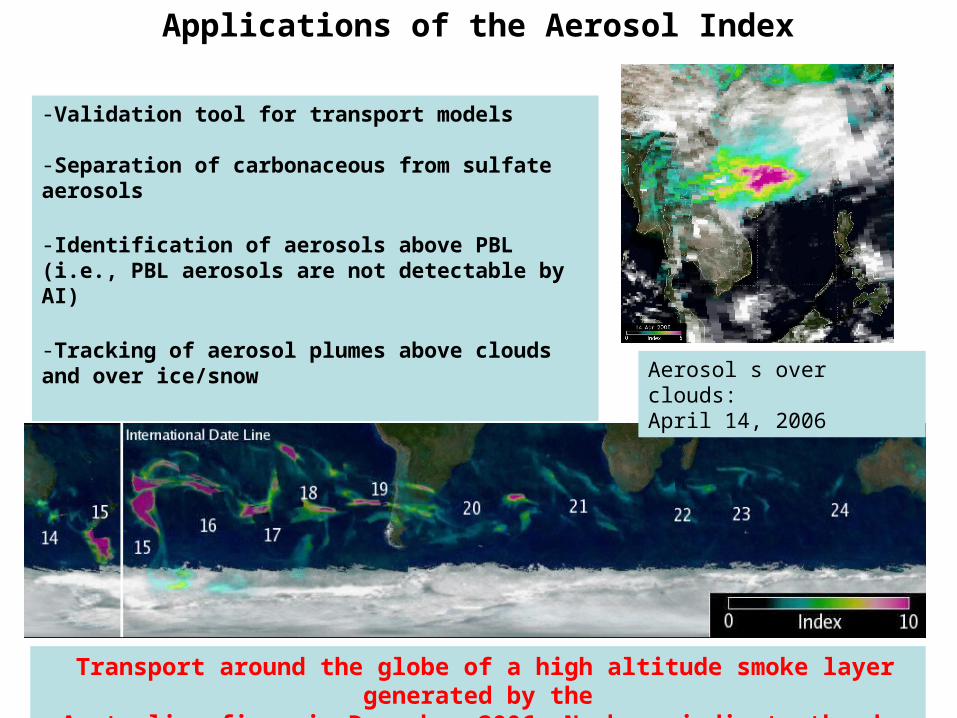
Applications of the Aerosol Index
-Validation tool for transport models
-Separation of carbonaceous from sulfate aerosols
-Identification of aerosols above PBL (i.e., PBL aerosols are not detectable by AI)
-Tracking of aerosol plumes above clouds and over ice/snow
Transport around the globe of a high altitude smoke layer generated by the Australian fires in December 2006. Numbers indicate the day of the month.
Aerosol s over clouds:April 14, 2006

http://disc.sci.gsfc.nasa.gov/Aura/data-holdings/OMI
OMI data site
OMI-Aura_L2-OMAERUV_2011m1024t0521-o38692_v003-2011m1024t115317.he5
Product name
YYYYmMMDDtHHMM

OMAERUV

MISR

Angular observations (which are not available in MODIS) makes MISR capable of providing additional information on particle size,
shape and aerosol height under specific cases

Smoke Signals from the Alaska and Yukon Fires - July 2004
Aerosol Heights from MISR

MISR Level 3 Tool

Level 2 & 3 aerosol
1 file = one orbit - about 98 min Data
17.6x17.6 km2 , 0.5x0.5, and 1x1deg, daily, monthly, seasonal
MISR_AM1_AS_AEROSOL_P028_O002510_F12_0022.hdf
http://eosweb.larc.nasa.gov/PRODOCS/misr/workshop/ppt/2010_lcluc/misr_tutorial.pdf
Data access and handling tutorial
RegBestEstimateSpectralOptDepth (AOD – 4 wavelengths)RegBestEstimateSpectralOptDepthFraction (AOD fraction for small, medium, large, spherical, and non-spherical particles)

Assignment – Week 4
https://docs.google.com/forms/d/1y2HgNJxBCE-N4LQ9UfKvr_SsZgfxca6Fekb8ezTngYQ/viewform

References & links
. ARSET-AQ webpage
http://airquality.gsfc.nasa.gov/index.php?section=11
. MODIS ATMOShttp://modis-atmos.gsfc.nasa.gov/mod04_l2/. MISR DATAhttp://eosweb.larc.nasa.gov/PRODOCS/misr/Quality_Summaries/L2_AS_Products.html. OMI DATAhttp://disc.sci.gsfc.nasa.gov/Aura/data-holdings/OMI. IDEAhttp://www.star.nesdis.noaa.gov/smcd/spb/aq/. SMOG BLOGhttp://alg.umbc.edu/usaq/
For Today’s Material click here
http://airquality.gsfc.nasa.gov/IntroWebinar/